Abstract
This study evaluates the symmetry of data distributions after normalization, focusing on various statistical tests, including a few explored test named Rp. We apply normalization techniques, such as variance stabilizing transformations, to ribonucleic acid sequencing data with varying sample sizes to assess their effectiveness in achieving symmetric data distributions. Our findings reveal that while normalization generally induces symmetry, some samples retain asymmetric distributions, challenging the conventional assumption of post-normalization symmetry. The Rp test, in particular, shows superior performance when there are variations in sample size and data distribution, making it a preferred tool for assessing symmetry when applied to genomic data. This finding underscores the importance of validating symmetry assumptions during data normalization, especially in genomic data, as overlooked asymmetries can lead to potential inaccuracies in downstream analyses. We analyze postmortem lateral temporal lobe samples to explore normal aging and Alzheimer’s disease, highlighting the critical role of symmetry testing in the accurate interpretation of genomic data.
1. Introduction
The analysis of genomic data, particularly through ribonucleic acid sequencing (RNA-seq), has advanced our understanding of the genetic foundations of various diseases and conditions [1,2]. RNA-seq is renowned for its ability to quantify gene expression with high accuracy [3,4], enabling comprehensive transcriptional profiling across a wide range of biological contexts. The role of RNA-seq is critical in differential gene expression analysis, proving invaluable across diverse conditions, from non-small-cell lung cancer [5] to avian influenza in mallards [6]. However, the reliability of RNA-seq data is influenced by numerous technical and biological factors that necessitate careful preprocessing [7]. For this preprocessing, normalization plays a pivotal role in ensuring that gene expression comparisons are accurate and free from systematic biases [8]. Normalization techniques are designed to adjust for technical variability while preserving the true biological signals in the data. Recent advancements in RNA-seq normalization, such as the RUV-III method, have enhanced the accuracy of downstream analyses by effectively mitigating unwanted variations [7]. Moreover, exploring the distributional characteristics of genomic data has become increasingly important, especially as it relates to extending normality assumptions in statistical models [9]. This exploration underscores the evolving landscape of genomic data analysis and the critical need for methods with good statistical properties.
A common assumption in the normalization of genomic data is that they are symmetrically distributed around the median. This assumption underpins many statistical tests and models used in genomics and proteomics [10,11]. However, recent studies have begun to critically assess this assumption, particularly in the context of RNA-seq data, where asymmetric distributions may introduce biases that affect the accuracy of differential gene expression analyses [12,13,14,15]. Asymmetric distributions can lead to erroneous conclusions in differential expression studies by inflating or deflating the observed gene expression differences [16]. Despite the recognized importance of data symmetry, there has been limited exploration of post-normalization symmetry in RNA-seq data, highlighting a gap in the current literature [17,18,19].
To bridge this gap, the primary objective of our research is to evaluate the impact of different normalization techniques on the symmetry of data distributions, with an application to RNA-seq data derived from postmortem lateral temporal lobe samples related to Alzheimer’s disease and aging [20]. By comparing various normalization methods, we aim to determine their effectiveness in producing symmetric data distributions, thereby enhancing the precision and reliability of gene expression analyses.
To achieve this objective, we employ the Rp test: a statistical tool which has been few explored and designed to evaluate symmetry in data distributions. While the Rp test itself is not a novel contribution, having been introduced in [21] and based on earlier work in [22], its application within the context of RNA-seq data analysis along with an evaluation of standardization techniques and simulation studies is a novel methodology in the field. Our methodology integrates insights from single-cell analysis and spatial transcriptomics [23,24,25], incorporating established methods such as DESeq2 and edgeR [26,27] along with innovative techniques like DiffChIPL [28,29]. We use cross-validation to rigorously assess the performance of these normalization techniques, focusing on achieving symmetric RNA-seq data distributions. We validate the effectiveness of these methods using the lawstat package of the R software [30,31,32], ensuring the reliability of the data [33]. Additionally, we conduct Monte Carlo simulations to evaluate the sensitivity and specificity of the Rp test and other tests in detecting asymmetry across various scenarios.
In summary, this study contributes to the field of genomic data processing by evaluating the impact of normalization techniques. Through the application of these techniques to RNA-seq data in the context of Alzheimer’s disease research, we aim to improve the precision of gene expression analyses and critically assess the assumption of data symmetry post-normalization.
The remainder of this article is structured as follows. Section 2 outlines our methodology for assessing symmetry in data distributions. In Section 3, we present the results of our simulation studies evaluating the robustness of the Rp test. In Section 4, the application of symmetry tests to real genomic data is discussed. Section 5 provides a comprehensive discussion and conclusions, highlighting the implications of our findings for future research.
2. Methodology
This section outlines our methodology for assessing symmetry in data distributions.
2.1. Statistical Methods for Symmetry Evaluation
To ensure rigorous analysis, our study employs various statistical methods to evaluate symmetry in data distributions. Among these methods, the Bonferroni correction is applied during symmetry evaluation to adjust for multiple testing. With an initial significance level of 0.05 (5%) and four tests conducted, the adjusted significance threshold for each individual test is 0.0125. This adjustment stabilizes the family-wise type I error rate at the nominal level, thereby controlling the probability of committing at least one type I error across all tests [34,35]. We utilize cross-validation to rigorously evaluate the performance of different normalization techniques, partitioning the data into training and test sets to ensure the generalizability of our findings.
The common hypotheses for testing symmetry about the median of the distribution are stated as
against the alternative given by
Here, represents the cumulative distribution function of the data. The test statistics are detailed as follows:
- •
- Cabilio–Masaro (CM) test: This test employs the sample mean (), median (), and standard deviation (S) [34]. The CM test statistic is computed aswhere n is the sample size. Under the null hypothesis of symmetry, the CM statistic follows a standard normal distribution. The CM test is particularly effective for large sample sizes, where the sample mean and standard deviation are estimators with good statistical properties.
- •
- Mira (M) test for symmetry: The M test evaluates symmetry by comparing the sample mean () with the median () [35]. The M test statistic is defined asThis statistic amplifies any deviation from symmetry. Under the null hypothesis of symmetry, the M statistic follows a standard normal distribution in large samples. For small samples, bootstrapping is employed to estimate accurate p-values, enhancing the test applicability across various sample sizes.
- •
- Miao–Gel–Gastwirth (MGG) test: This test, known for its robustness against outliers, uses a unique approach for its denominator to mitigate the impact of extreme values [36]. The MGG test statistic is defined aswhere the modified denominator J contrasts with traditional methods and is calculated asThe distinctive J feature reduces the influence of outliers, making the MGG test especially suitable for datasets with extreme variations.
Complementing these analytical methods, we present below the Rp test introduced in [21,22]. The Rp test is specifically designed to address the complex distribution patterns often encountered in RNA sequencing data.
2.2. Rp Test in RNA-Sequencing
In our methodology for RNA-seq data analysis, the Rp test is particularly effective for datasets with asymmetric distributions, where “p” denotes the expected proportion of runs under symmetry. This test identifies and quantifies asymmetry, being especially valuable when the probability deviates significantly from 0.5. Here, X represents the normalized expression values for each gene, where normalization is crucial to ensure that the data accurately reflect biological differences without technical biases.
The core of the Rp test is the trimmed test statistic , which measures the symmetry of the data. The statistic of the Rp test is calculated as
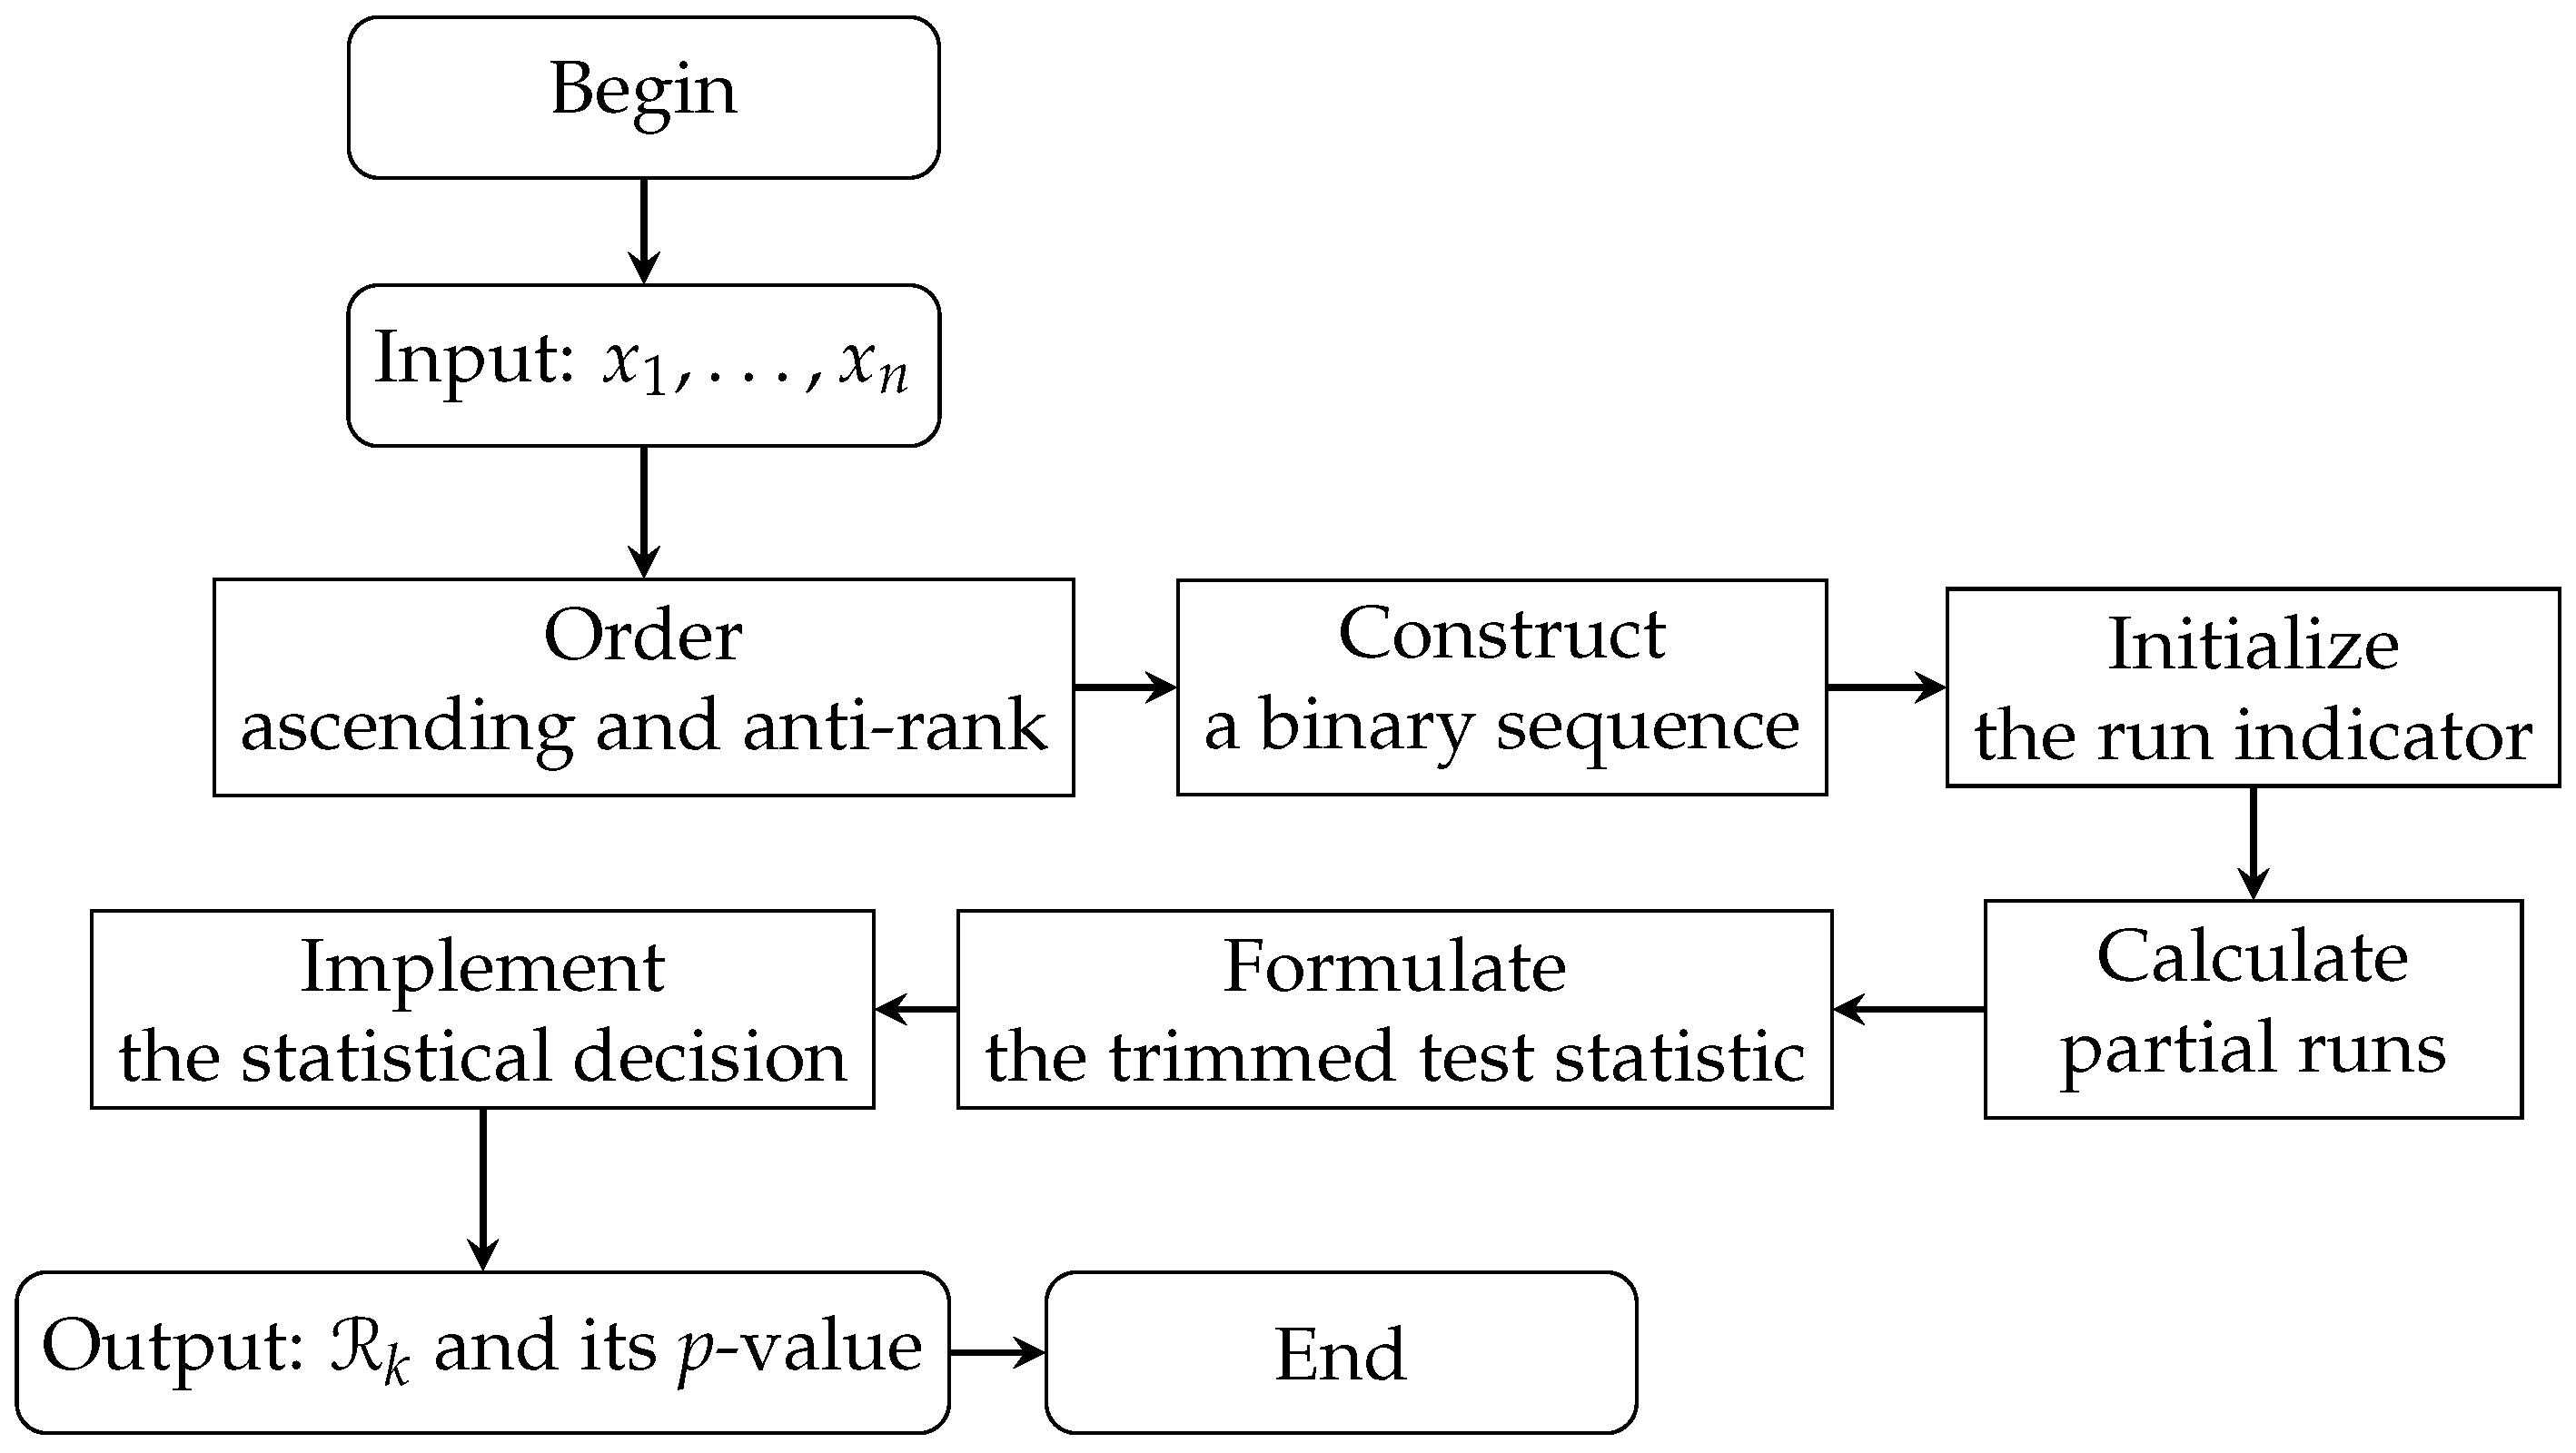
where p is the expected proportion of runs under symmetry, is the number of runs, is the sign function, and is the floor function of a or its integer part. The statistic of the Rp test accounts for both the frequencies and sequences of positive and negative observations, providing a refined measure of symmetry. The statistical significance of is evaluated by calculating its p-value. By comparing the p-value with a predefined significance level (), researchers can decide whether to reject the null hypothesis of symmetry or not. The steps of the Rp test are summarized in Algorithm 1 and illustrated in the flowchart in Figure 1, which outlines the entire process from the initial input of normalized gene expression values to the final output of the test statistic and p-value.
| Algorithm 1 Rp test for assessing symmetry in RNA-seq data. | |
| Input: Normalized gene expression values | |
| Output: Statistic of the Rp test and its p-value | |
| 1. Order ascending the absolute values to obtain a sequence | |
| 2. Compute the anti-rank for each , where represents the index in the original dataset | |
| 3. Construct a binary sequence using the sign of , with 1 indicating non-negative values and 0 indicating negative values | |
| 4. Initialize the run indicator as | |
| for each subsequent j do | |
| if the sign of changes then | |
| Update to mark the start of new runs | |
| end if | |
| end for | |
| 5. Calculate the partial number of runs for each observation, counting the runs up to observation j | |
| 6. Define the trimmed statistic of the Rp test | |
| 7. Evaluate the statistical significance of by calculating its p-value | |
| 8. Compare the p-value with a predefined significance level () to decide whether to reject the null hypothesis of symmetry or not | |
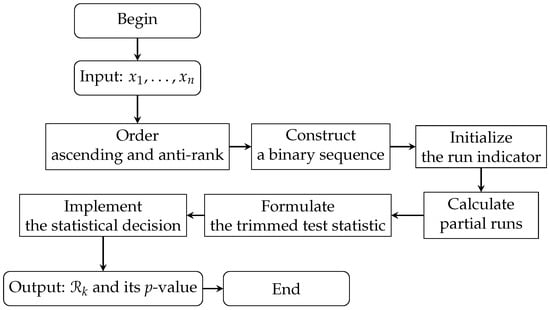
Figure 1.
Flowchart for the Rp test process.
The Rp test evaluates two primary scenarios within the framework of the alternative hypothesis . First, when , suggesting an excess of positive observations in the normalized gene expression data, is expected to yield positive values, leading to rejection of the null hypothesis in favor of positive asymmetry. Conversely, if , indicating a predominance of negative observations, a very low value of would suggest rejecting in favor of negative asymmetry. The practical implications of the Rp test in RNA-seq data analysis are highly relevant. By analyzing the distribution of normalized gene expression data, the Rp test aids in uncovering underlying patterns and potential asymmetries, which are critical in interpreting RNA-seq studies, where data distributions can impact the interpretation of gene expression levels.
2.3. Integration of the Rp Test in the Broader Study Context
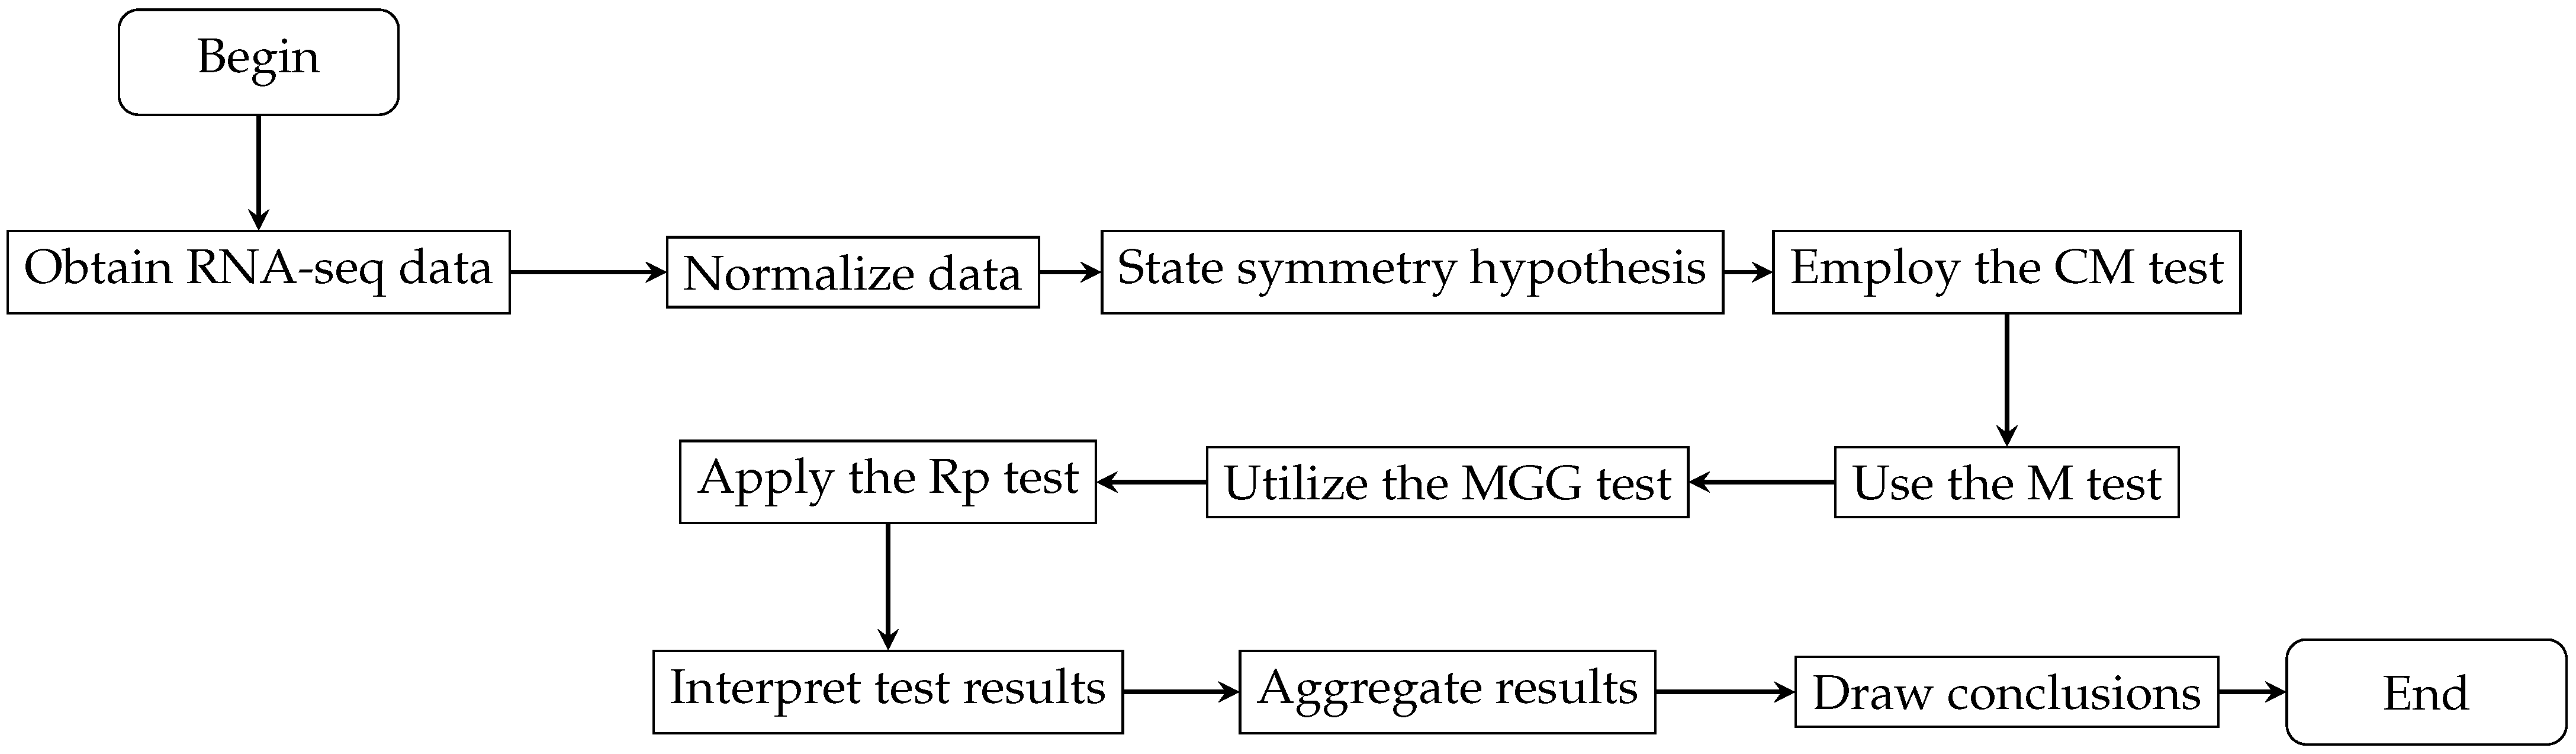
Following the detailed explanation of the statistical tests under consideration, we now contextualize their application within the broader research framework. Figure 2 illustrates the research process from data acquisition and normalization to the application of statistical tests such as CM, M, MGG, and Rp. This ensures methodological precision and rigor throughout the research process, leading to reliable outcomes and facilitating a comprehensive analysis that supports the conclusions of the study.
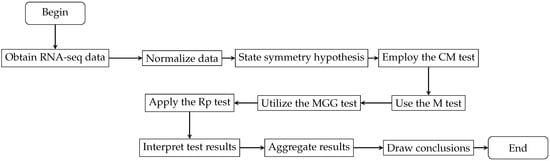
Figure 2.
Flowchart depicting the RNA-seq analysis process within the broader research framework.
3. Simulation Studies for Evaluating the Robustness of the Rp Test
To rigorously assess the robustness of the Rp test in detecting asymmetry in RNA-seq data distributions, we conduct an extensive set of Monte Carlo simulations. The aim of these simulations is twofold: first, to assess the effectiveness of the Rp test in detecting asymmetry for RNA-seq data distributions; and second, to compare its performance against other established symmetry tests, including the CM, M, and MGG tests. These simulations are designed to evaluate the tests performance across a range of symmetric and asymmetric distributions, focusing particularly on the control of the type I error.
3.1. Simulation Setup
The simulations involve generating samples from both symmetric and asymmetric distributions: specifically, normal, lognormal, and generalized lambda (GL) distributions. The normal and lognormal distributions used in our simulations are parameterized by choosing a zero mean and a standard deviation equal to one. This choice is made to standardize the comparison across different distributional forms, ensuring that the scales and locations of the distributions do not introduce confounding effects when evaluating the performance of the Rp test. The normal distribution is used as a benchmark for symmetric distributions, while the lognormal distribution, characterized by its positive skewness, serves as a representative asymmetric distribution. These distributions are commonly encountered in many practical applications, making them relevant for our analysis.
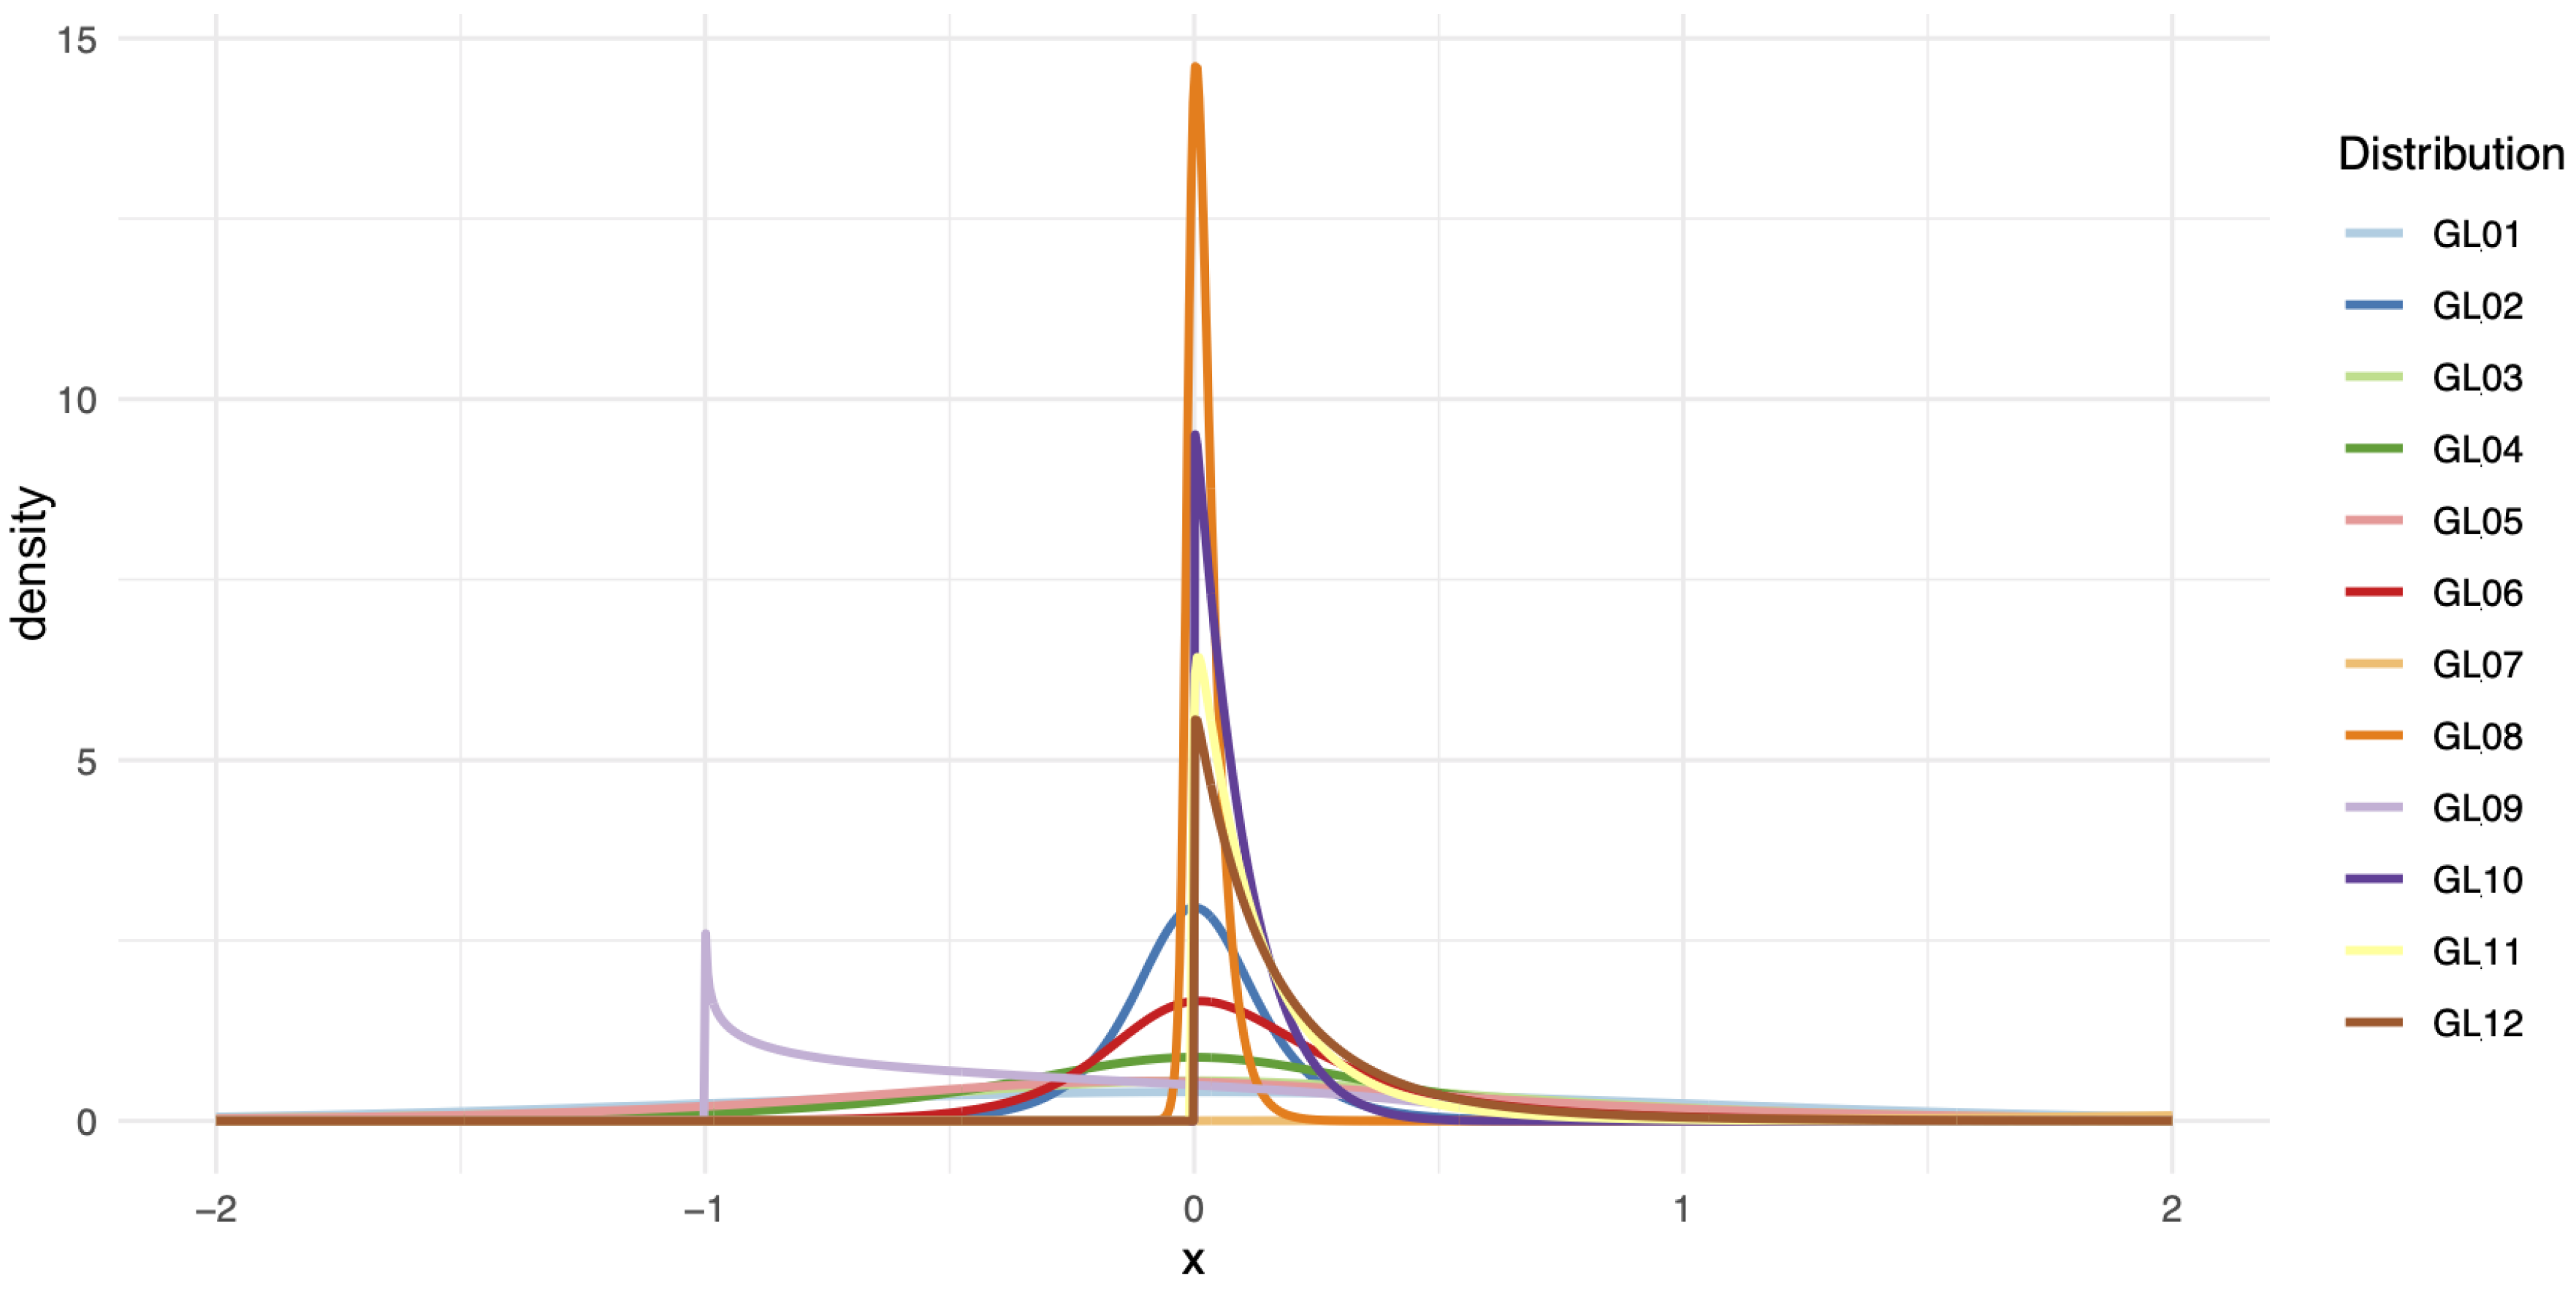
The GL family is particularly helpful for assessing the effectiveness of the Rp test across various symmetric and asymmetric scenarios and shows its flexibility in modeling different shapes of distributions encompassing a wide range of skewness and kurtosis values. A GL distribution is defined by its quantile function, which is given by
where is a location parameter, is a scale parameter, and control the skewness and kurtosis of the distribution, respectively. By varying these parameters, the GL distribution can mimic a wide range of shapes, including those that are symmetric, heavy-tailed, or asymmetric. This diversity of shapes is illustrated in Figure 3, which presents the density plots for GL1 through GL12 distributions, each generated using the parameters specified in Table 1. These plots show the differences in shape, skewness, and kurtosis across the GL family, highlighting the flexibility and diversity of this family of distributions.
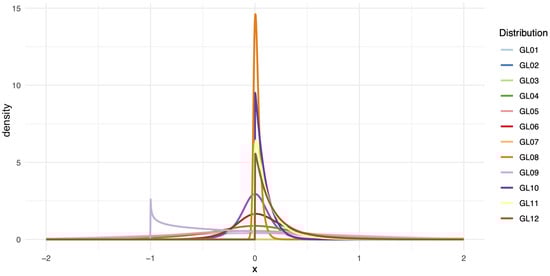
Figure 3.
Density plots for the GL1 through GL12 distributions with the parameters used in the simulations.

Table 1.
The parameters of the indicated GL distributions used in the simulations.
The sample sizes examined are , reflecting typical sample sizes encountered in RNA-seq studies. These sample sizes are chosen to evaluate the test performance across small to moderately large datasets, which are common in genomic research.
3.2. Test Implementation and Metrics
The Rp test was implemented for three different values of the parameter p, specifically , which controls the threshold for detecting asymmetry in the data distribution. These values allow for a comprehensive analysis of the test’s sensitivity to different levels of asymmetry in the data distribution. In addition to the Rp test, three other symmetry tests were included for comparison: the CM, M, and MGG tests. The p-values for the Rp test were calculated using a bootstrap method. This method involves generating a large number of resampled datasets under the null hypothesis of symmetry, calculating the Rp test statistic for each resampled dataset, and then comparing the observed test statistic to the distribution of bootstrapped statistics. Bootstrapping provides a more accurate assessment of the p-value by capturing the sampling variability, particularly in cases where the asymptotic normality assumption may not hold due to small sample sizes or other factors. The simulation involved generating 10,000 samples for each combination of sample size and distribution. For each sample, the Rp test and the three other tests were applied, with the proportion of rejections of the null hypothesis of symmetry (type I error or empirical power) being recorded. The significance level was set at . The ability of each test to control the type I error (under the null hypothesis of symmetry) and empirical power (1 −, under asymmetric alternatives, with being the probability of type 2 error) was evaluated.
3.3. Simulation Results
The simulation results are summarized in Table 2. The Rp test showed strong control of the type I error across all sample sizes and distributions, with rejection rates close to the nominal level of 0.05 when applied to symmetry. The focus on for symmetric distributions ensures that the test is controlling the type I error, avoiding false positives where the data are actually symmetric. The empirical power of the Rp test varied depending on the level of asymmetry in the distribution and the value of p, with higher values of p generally leading to lower power. For asymmetric distributions, measuring is crucial, as it indicates the test’s ability to correctly identify true asymmetries.
Table 2.
Rejection rates for type I error () and empirical power (1 −) for the indicated distributions and sample sizes (n).
The Monte Carlo simulations indicate that the Rp test, particularly, with , effectively controls the type I error across all sample sizes and distributions, with rejection rates close to the nominal level of 0.05 when applied to symmetric distributions such as the normal and GL1-GL4 distributions. For a sample size of , the Rp test at showed no type I error probability practically ( close to zero) across any of the symmetric distributions, and this value was maintained even with larger sample sizes, such as .
The empirical power (1 −) of the Rp test varied depending on the asymmetry level and value of p. In highly asymmetric distributions like GL6, the Rp test with exhibited lower power compared to tests with or . Nevertheless, even with , the Rp test achieved high power with larger sample sizes. For instance, with a sample size of , the empirical power for the GL6 distribution was 0.6107 for , 0.5890 for , and 0.5214 for . In contrast, the other symmetry tests (CM, M, and MGG) also controlled the type I error adequately but generally exhibited lower power to detect asymmetry compared to the Rp test, especially for the GL6 distribution.
The results in Table 2 emphasize the effectiveness of the Rp test in controlling both type I error and empirical power. Although the test with is slightly more conservative, leading to lower power, it remains effective in detecting asymmetries, particularly when using or . These results suggest that the Rp test is a versatile and reliable tool for symmetry testing in RNA-seq data, consistently performing well across a wide range of distributions.
In summary, the Monte Carlo simulations confirm that the Rp test is well-suited for practical applications where detecting subtle asymmetries in genomic data is crucial. This makes the Rp test a valuable tool in the downstream analysis of RNA-seq data, where understanding the distributional properties of gene expression is essential for drawing meaningful biological inferences.
4. Application to Real Genomic Data
This section details the data sources, preprocessing procedures, and characteristics of the dataset used in our application with real genomic data. Additionally, it discusses the usage of symmetry tests to evaluate RNA-seq datasets, with an emphasis on evaluating their significance, sensitivity, and robustness.
4.1. Data Source and Preprocessing Overview
The RNA-seq data utilized in this research were obtained from [37] and encompassed postmortem lateral temporal lobe samples from 15 Alzheimer’s disease patients and 15 age-matched controls. This dataset is particularly valuable due to its public accessibility and the detailed records it provides on genetic expression variations associated with Alzheimer’s disease, allowing for a comprehensive comparison between affected and healthy tissues to uncover underlying gene expression patterns.
Preprocessing step of the data began with normalization to mitigate technical variances while preserving the inherent biological variations and following established RNA-seq practices [7,8]. After this step, our dataset was refined to 18,347 genes across 30 samples by filtering out low-expression genes, specifically, those with counts below 10 in at least 20 samples. Normalization was performed using the variance stabilizing transformation (VST) method as implemented in [26].
The VST method ensures that the variance remains approximately constant across different expression levels, thereby improving comparability across samples and reducing the impact of technical artifacts. Additionally, we used the trimmed mean of M-values (TMM) method in edgeR to correct for compositional biases and normalize the counts, making them comparable across all samples. The TMM method involves calculating the ratio of each gene expression level relative to a reference sample and computing a weighted mean of the remaining ratios to derive a scaling factor. Furthermore, we applied the DiffChIPL method [28,29] to integrate multi-omic data, which further enhanced our analysis.
To validate the symmetry of the RNA-seq distributions post-normalization, we utilized the lawstat package of R [30,31]. This package provides essential tools for assessing the distributional properties of data, which is crucial for ensuring the reliability of the analysis and minimizing biases in downstream analyses.
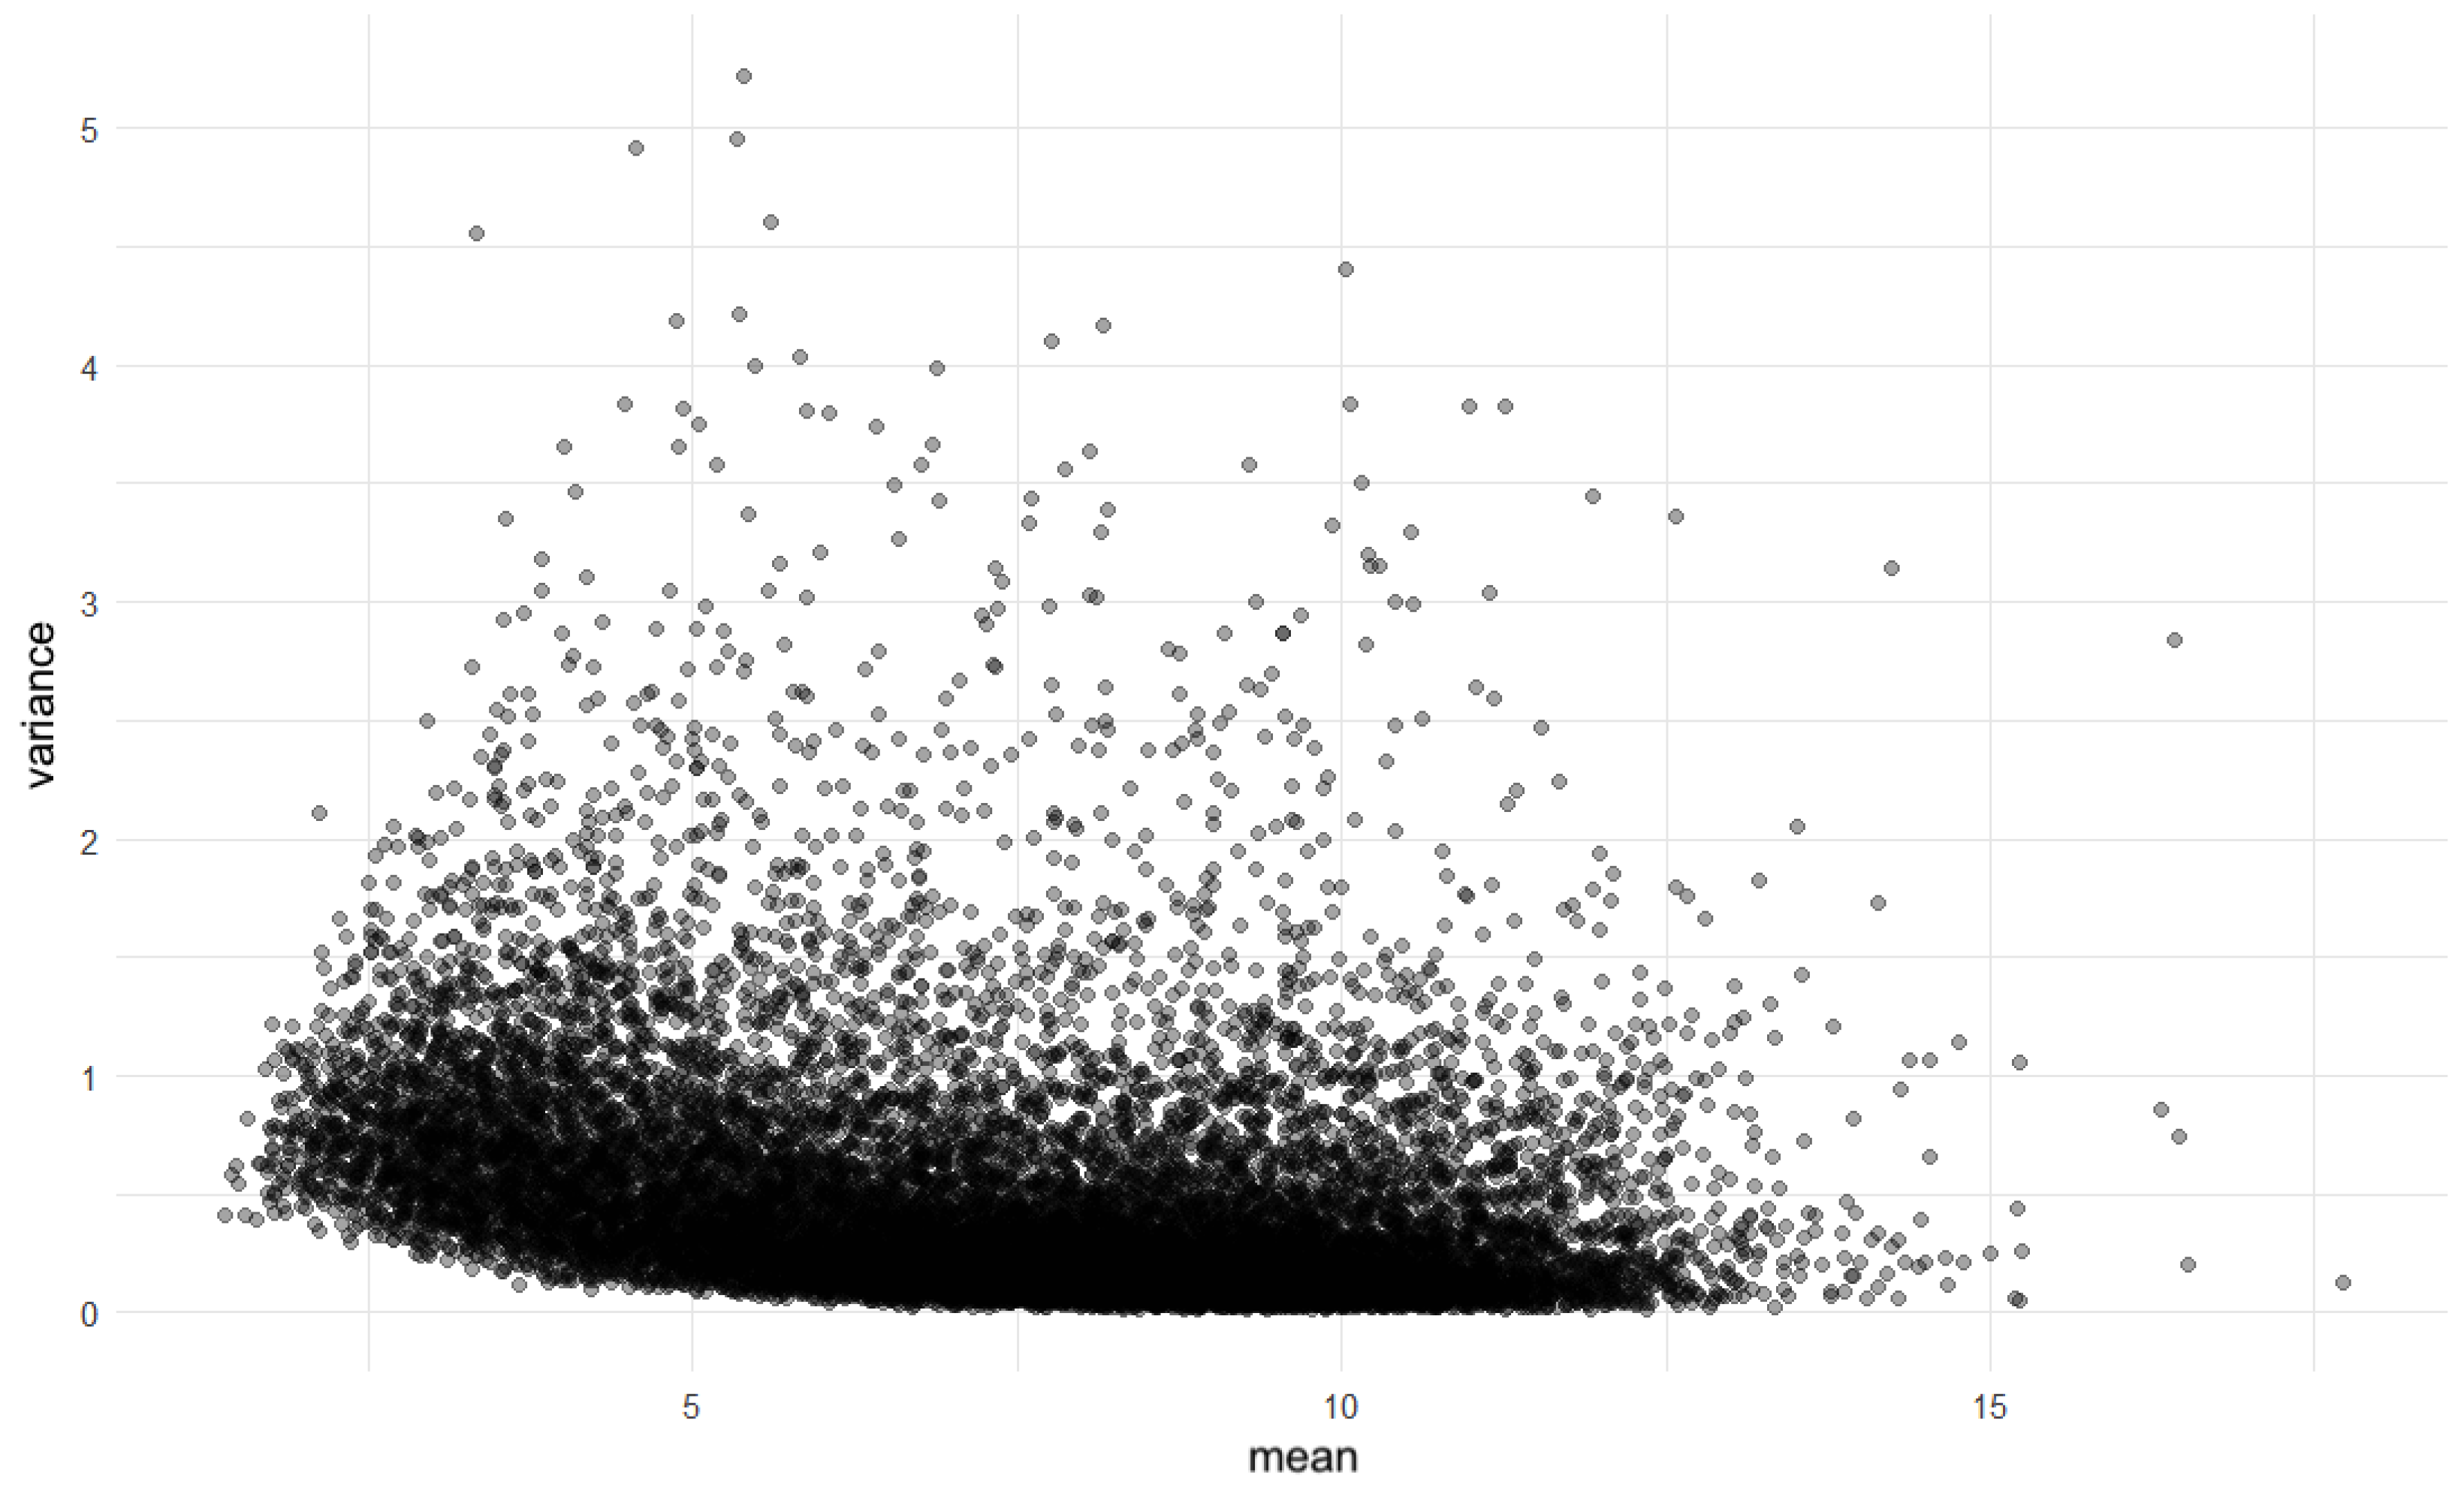
After normalization, we assessed mean–variance independence using a dispersion plot, which displayed the variance of gene expression against the mean expression level for each gene. As shown in Figure 4, the dispersion or scatter plot revealed that the majority of the data points clustered within a range, which suggests homogeneity of variance across different levels of mean expression. The lack of a clear trend in this plot indicates that the data distributions do not show obvious signs of heteroscedasticity, which is an important consideration when evaluating the suitability of data for further statistical analysis [1].

Figure 4.
Scatter plot of variance versus mean expression levels.
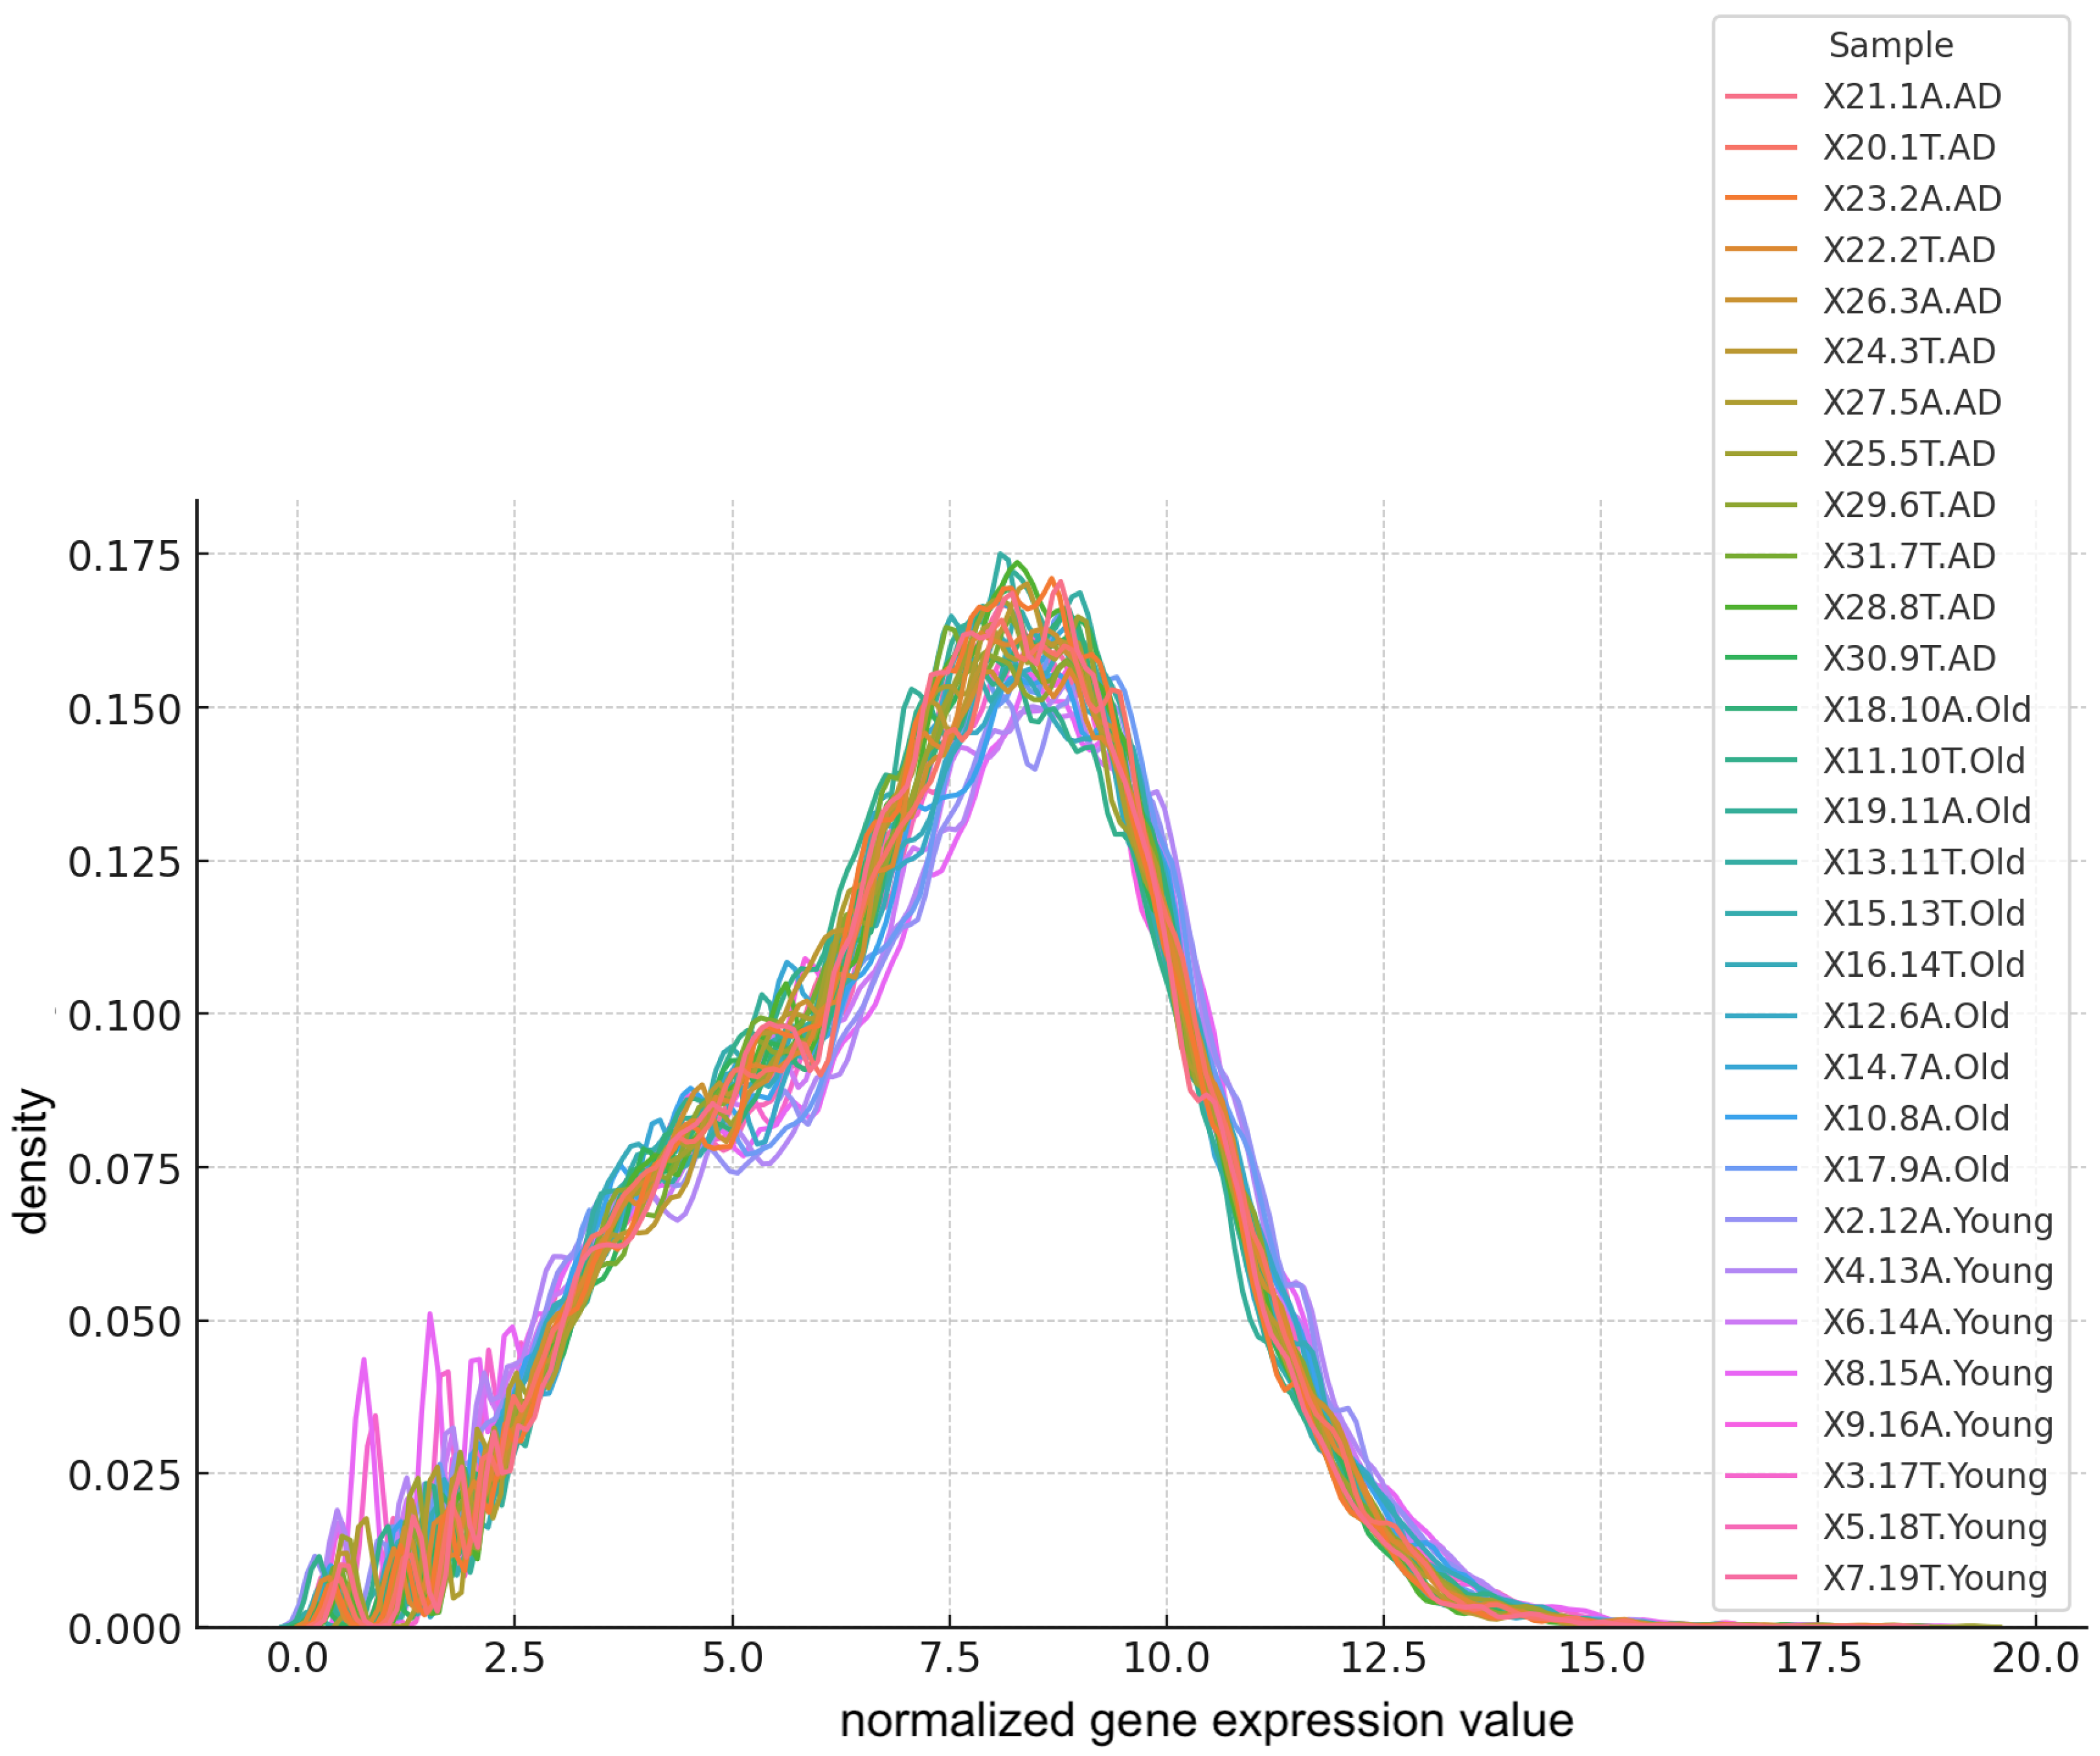
To assess the symmetry in gene expression levels, we performed kernel density estimates on the samples. These estimates, illustrated in Figure 5, provide a smoothed visualization of the distribution of normalized expression values, aiding in the identification of any deviations from symmetry. The x-axis represents the normalized expression levels, while the y-axis indicates their relative frequency.
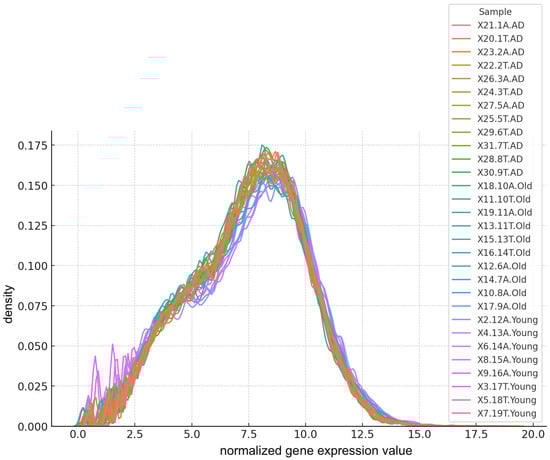
Figure 5.
Kernel density estimate of gene expression levels post-filtering.
The results from both the dispersion plot and the plot of kernel density estimates suggest that the normalization process effectively stabilized the variance and maintained the overall symmetry of the data distributions, supporting the reliability of subsequent genomic analyses.
4.2. Evaluation of Symmetry of the Data Distribution
As described in Section 4.1, RNA-seq datasets were obtained from postmortem lateral temporal lobe samples of Alzheimer’s disease patients and age-matched controls. These datasets underwent normalization using the VST provided by the DESeq2 method.
Additionally, normalization methods from edgeR were employed to reduce technical variances while preserving biological variations [26,27,38]. This normalization was crucial for ensuring that the resulting data accurately reflected underlying biological differences and minimized the influence of technical artifacts.
In the subsequent analysis, we applied several symmetry tests to each dataset, including the CM, M, MGG, and Rp tests, to assess the symmetry of gene expression distributions within individual samples. Identifying notable asymmetries is critical, as such patterns could indicate disproportionate gene expression associated with Alzheimer’s disease or age-related changes. The results of these symmetry tests are summarized in Table 3. The p-values reported in this table were derived directly from real RNA-seq data by evaluating the symmetry after normalization. These reported values provide insight into the true distributional characteristics of the gene expression data within the context of Alzheimer’s disease.
Table 3.
Test statistics and p-values for RNA-seq datasets.
In contrast, Section 3 detailed the effectiveness assessment of the Rp test through extensive Monte Carlo simulations. These simulations were designed to evaluate the performance of the Rp test across various symmetric and asymmetric distributions, focusing on its control of type I error and empirical power under different scenarios. While these simulations do not reflect the specific characteristics of the real RNA-seq data, they serve to validate the general applicability of the Rp test across different scenarios.
Our analysis of the 30 datasets indicated that only four datasets (specifically datasets #11, #15, #17, and #28) exhibited high asymmetry according to the Rp test. This indication suggests that asymmetry is not a predominant characteristic in the majority of the datasets analyzed. The decision to use a significance threshold of 0.10, although less conventional than the standard of 0.05, was intentional and tailored to the context of the present study to detect subtler patterns that might otherwise go unnoticed. In contrast, the CM, M, and MGG tests uniformly indicated symmetry across all datasets, with p-values consistently equal to 1. This raises concerns regarding the sensitivity of these tests and their potential susceptibility to type II error, where the null hypothesis of symmetry is incorrectly accepted. The consistent p-value of 1, particularly after applying the Bonferroni correction, suggests that these tests may be overly stringent or insensitive under the specific conditions of our RNA-seq data. This suggestion might result from the correction increasing the threshold for significance, so reducing the probability of detecting true asymmetries, especially in datasets with subtle deviations. The divergent results between the Rp test and the other tests illustrate the importance of employing several statistical methods when assessing symmetry in RNA-seq data. Relying solely on traditional tests may cause one to fail when detecting deviations from symmetry and potentially overlook important biological signals. The detection of asymmetry by the Rp test in specific datasets shows that factors such as variability in gene expression, technical noise, or inherent biological diversity could influence deviations from expected symmetry. This detection emphasizes the need for a thorough understanding of the specific characteristics of each dataset and the application of reliable statistical tools in the analysis of large-scale sequencing data.
In summary, our results show the importance of careful statistical evaluation in the model assumptions and in interpreting information obtained from RNA-seq data. The results suggest that asymmetries may persist even after data processing and normalization, presenting challenges to traditional analytical methods. Our results reinforce the need for comprehensive and multifaceted statistical testing in genomic data.
4.3. Robustness Assessment through Subsampling
To further evaluate the statistical properties of the symmetry tests, a detailed subsampling strategy was implemented. This strategy involved randomly selecting subsets from each RNA-seq dataset, with each subset comprising 100 data points. The selection of this subset size was carefully considered to strike a balance between computational efficiency and the need for a representative sample of the larger dataset. The primary rationale behind the subsampling strategy was to test the stability and consistency of the hypothesis tests under conditions of reduced data volume, which can resemble the conditions faced in smaller experimental studies.
In this study, as mentioned, a total of 10,000 subsamples were repeatedly processed without replacement from each dataset, simulating different scenarios within the same dataset, similar to a cross-validation. This process ensured a broad and stochastic representation of the original data distributions, thereby enhancing the analysis. Such a sampling method allows for a thorough exploration of the variance within the sample space, providing crucial insights into the reliability of statistical outcomes in the face of data sampling variability. Each subsample was rigorously evaluated with the CM, M, MGG, and Rp tests, and the results were meticulously recorded. The key metric of interest was the rate of rejection of the symmetry hypothesis, as this rate indicated the degree to which each test was able to detect asymmetry under the subsampling conditions. The recorded rejection rates across all subsamples are presented in Table 4. Notably, these rates are not uniform, suggesting that the symmetry of the distribution within the datasets is non-random. The observed variability in rejection rates highlights the impact that different dataset characteristics, such as sample size and inherent variability, can have on the outcomes of the mentioned tests. This variability underscores the importance of understanding the specific context of each RNA-seq dataset when interpreting the results of symmetry tests, as it can provide critical insights into the applicability of the statistical methods used.
Table 4.
Percentage of symmetry hypothesis rejections across indicated RNA-seq subsample and test.
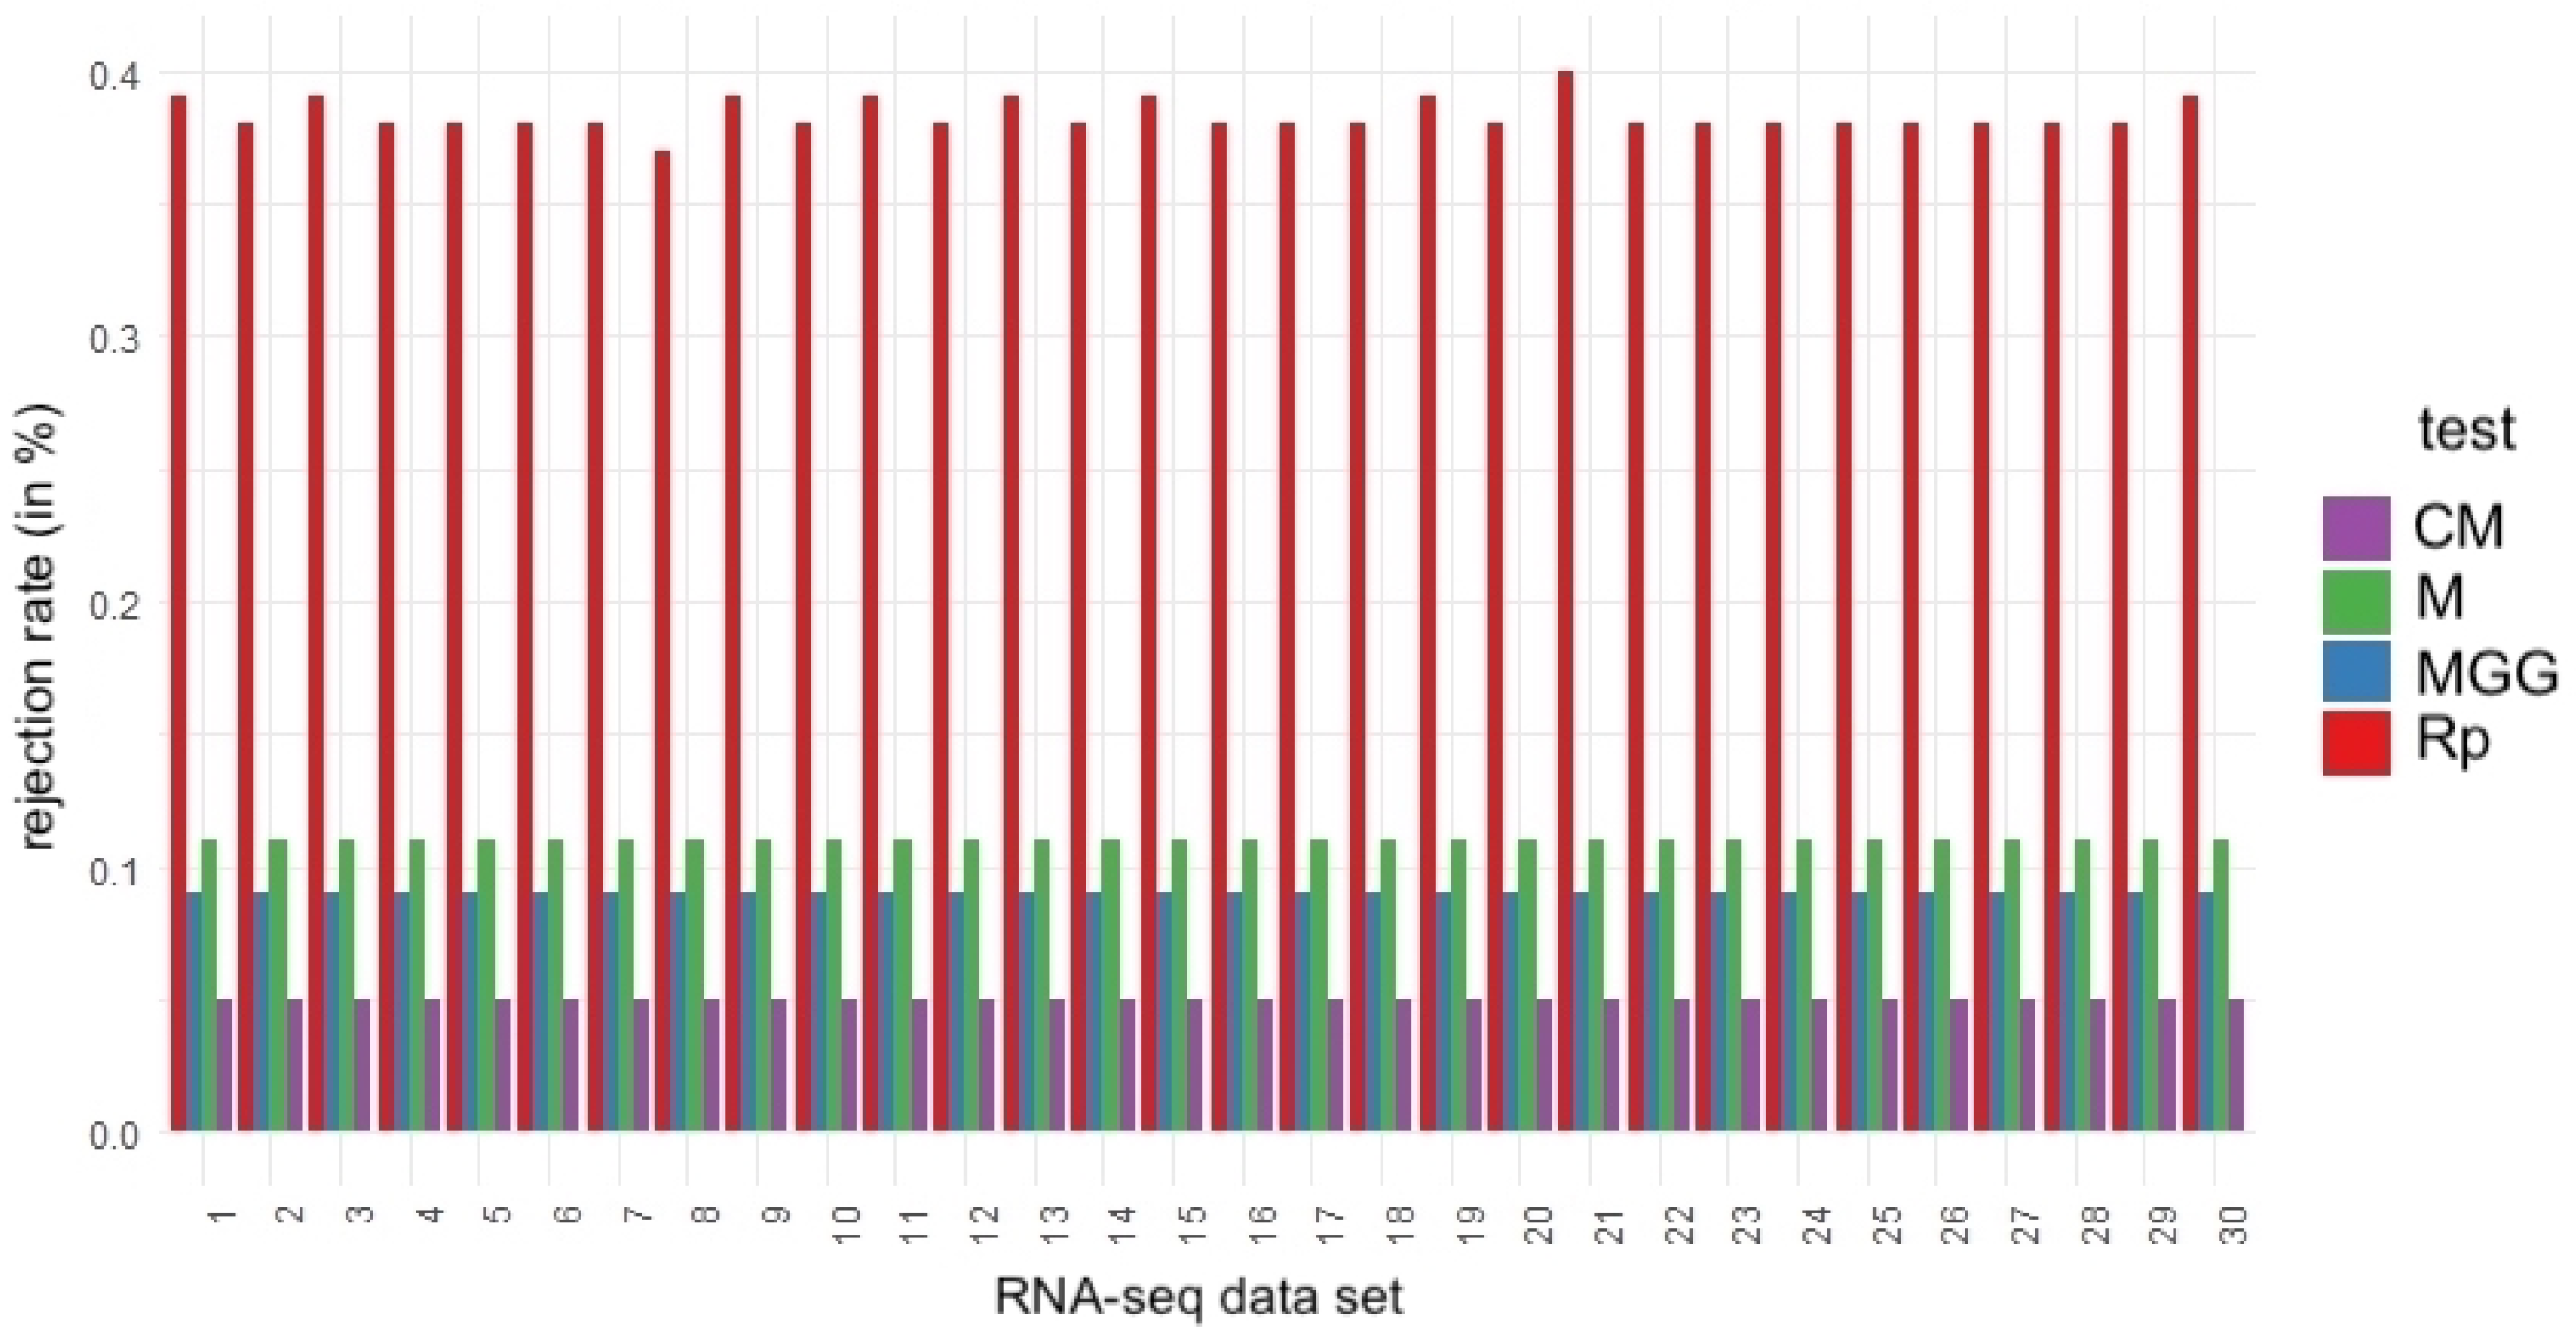
To visualize the heterogeneity of the rejection rates, a bar graph is shown in Figure 6 to compare the rejection percentages for each test applied to the RNA-seq datasets. This figure shows the complex and varying nature of symmetry testing in RNA-seq datasets. A more granular analysis is provided subsequently and offers a deeper understanding of the practical consequences that this nature may have for experimental studies.
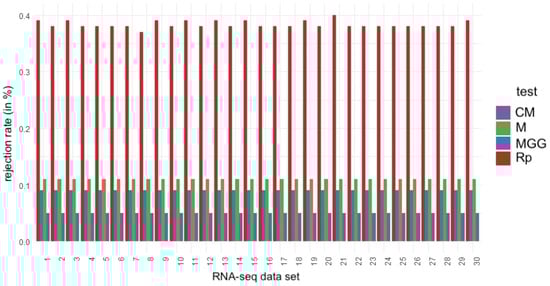
Figure 6.
Bar plots of the percentage of symmetry hypothesis rejection rates for the indicated test and RNA-seq dataset.
4.4. Analysis of Symmetry Rejection across RNA-Seq Datasets
A detailed examination of the RNA-seq datasets reveals that all of the symmetry tests applied challenge the symmetry hypothesis, albeit to varying degrees. The Rp test, in particular, consistently shows a higher tendency to reject this hypothesis. Notably, in dataset #21, the Rp test indicates that 40% of the subsamples deviate from symmetry. Similarly, datasets #1, #3, #9, and #30 also exhibit high rejection rates, each at 39%. In contrast, the CM, M, and MGG tests indicate that the symmetry of dataset #9 may warrant further scrutiny. This indication implies that some data distributions might deviate from symmetry post-normalization. While initial analyses of the full datasets may have suggested symmetry, closer inspection through subsampling can uncover potential asymmetries. This underscores the critical role of sample size in statistical evaluations, particularly for determining the symmetry of distributions after normalization.
The heightened sensitivity of the Rp test for detecting asymmetries across subsamples highlights the need for careful interpretation of this detection. The consistent rejection of symmetry in specific datasets, especially in dataset #21, raises questions about possible biological factors contributing to the observed asymmetry. It also suggests the potential necessity for more advanced normalization techniques. The detailed analysis of RNA-seq data in this study exposes important nuances in interpreting asymmetries and their implications.
As emphasized in [39,40], the choice of the normalization method can importantly affect the data distribution and may potentially introduce asymmetries. Even minor asymmetries may signal critical biological processes or anomalies, as demonstrated in [41], leading to important changes in cellular functions. Additionally, the quality and processing of RNA-seq data, as discussed in [42], can introduce variations that affect symmetry and, consequently, the interpretation of gene expression results. Therefore, as shown in [43,44], it is crucial to consider the effect size and statistical power of the tests when evaluating asymmetry and its implications for gene expression. This shows the complexity and necessity for meticulous approaches in the normalization and analysis of RNA-seq data.
5. Discussion and Conclusions
This study introduced and evaluated the Rp test as a robust tool for assessing symmetry in genomic data, particularly in RNA-seq datasets. Through extensive Monte Carlo simulations and its application to real genomic data, we demonstrated the effectiveness of the Rp test in detecting asymmetry across a variety of distributional scenarios, including those encountered after normalization processes. Our findings highlight the importance of carefully selecting statistical methods that are sensitive to the unique characteristics of genomic data.
The conducted simulations revealed that the Rp test consistently controlled type I error while maintaining high empirical power in detecting asymmetry, even for the small sample sizes typically found in RNA-seq studies. This control across different sample sizes and distributions underscores the suitability of the Rp test in contexts where data may exhibit complex non-normal characteristics. Simulations based on generalized lambda distributions further emphasized the test’s ability to handle a wide range of asymmetry levels, making it a versatile tool in genomic research.
In our application to RNA-seq data from studies of Alzheimer’s disease, the Rp test identified high asymmetries in a subset of data, suggesting that asymmetry is a feature that may persist even after normalization. Choice of the normalization method, as shown in our analysis, can affect the symmetry of gene expression distributions, potentially impacting downstream analyses like differential expression and pathway analysis [26,27]. The detection of asymmetry in specific datasets highlights the need for further exploration of the biological implications of this detection; particularly how the asymmetry might relate to disease mechanisms or technical artifacts introduced during data processing. Methods such as the rank-based inverse normal transform, as implemented in the RNOmni package, could be applied to address asymmetry before further analysis [45].
A subsampling strategy, which involved the generation of 10,000 subsamples of 100 data points from each RNA-seq dataset, further validated the effectiveness of the Rp test. Unlike other tests, which showed variability in detecting asymmetry across different subsamples, the Rp test consistently identified deviations from symmetry, even with reduced data volumes. This identification is crucial for studies involving small samples or subsets of larger samples, as it ensures that key asymmetries are not overlooked.
Our findings have implications for genomic research, extending beyond Alzheimer’s disease to fields such as cancer genomics and environmental genomics, where data heterogeneity and sample size variability are common. The demonstrated sensitivity of the Rp test to asymmetry across different contexts reinforces the need for careful test selection based on the specific characteristics of the data being analyzed. This is particularly relevant in studies where accurate detection of gene expression patterns can influence critical decisions, such as in the development of targeted therapies [43,44].
The methodology presented in this study could be extended to the context of emerging technologies such as single-cell RNA sequencing, which allows for the analysis of gene expression profiles at the level of individual cells. Unlike bulk RNA-seq, which measures gene expression across populations of cells, single-cell RNA sequencing captures the heterogeneity within the context of cell populations, providing a more detailed understanding of cellular processes [46,47]. The application of the Rp test in this context could offer valuable insights into the symmetry or asymmetry of gene expression distributions at the single-cell level, revealing critical biological mechanisms that are obscured in bulk analyses.
While our study lays a solid foundation for utilizing the Rp test in symmetry assessment, certain limitations remain. Although the simulation studies have enhanced our understanding and have offered a more controlled evaluation of the Rp test under various asymmetry conditions, our focus on specific RNA-seq datasets and subsamples that were limited to 100 data points may constrain the broader applicability of our findings. Future research should extend these investigations to a wider range of datasets that vary in size, conditions, and transformation techniques to further validate and refine our conclusions. Additionally, expanding the scope of simulations to encompass more diverse scenarios could deepen insights into how asymmetry impacts downstream analyses. These additional simulations could include differential expression studies [39,40]. For the asymmetries identified in genomic data distributions, methods of quantile regression [48] might be explored. Researchers might also use other types of asymmetric distributions for the studied tests [49]. Moreover, exploration using machine learning techniques [50] in the analysis of genomic data is a promising avenue for research.
In conclusion, our research highlights the critical role of effective statistical tools like the Rp test in gene expression data analysis. Ensuring that these tools are well-aligned with the characteristics of genomic data is crucial for deriving reliable insights in genomic research. Our work contributes to a more nuanced understanding of data normalization and statistical analysis in genomics and serves as a valuable resource for researchers across diverse fields, including agriculture, environmental science, and medical genomics.
Author Contributions
Conceptualization, V.L., J.C., M.E.V., R.O. and C.C.; data curation, J.C., M.E.V., R.O. and C.C.; formal analysis, V.L., J.C., M.E.V., R.O. and C.C.; investigation, V.L., J.C., M.E.V., R.O. and C.C.; methodology, V.L., J.C., M.E.V., R.O. and C.C.; writing—original draft, J.C., M.E.V. and R.O.; writing—review and editing, V.L. and C.C. All authors have read and agreed to the published version of the manuscript.
Funding
This research was partially supported by the Vice-rectorate for Research, Creation, and Innovation (VINCI) of the Pontificia Universidad Católica de Valparaíso (PUCV), Chile, under grants VINCI 039.470/2024 (regular research), VINCI 039.493/2024 (interdisciplinary associative research), VINCI 039.309/2024 (PUCV centenary), and FONDECYT 1200525 (V.L.) from the National Agency for Research and Development (ANID) of the Chilean government under the Ministry of Science, Technology, Knowledge, and Innovation. This work was supported by Conselho Nacional de Desenvolvimento Científico e Tecnológico (CNPq), No. 303192/2022-4 and Fundação de Amparo a Ciência e Tecnologia do Estado da Bahia (FAPESB), No. APP0021/20223 (R.O.). This work also was part of HERMES 51031 (J.C.). The research was in addition funded by Portuguese funds through the CMAT—Research Centre of Mathematics of University of Minho, Portugal, within projects UIDB/00013/2020 (https://doi.org/10.54499/UIDB/00013/2020) and UIDP/00013/2020 (https://doi.org/10.54499/UIDP/00013/2020) (C.C.).
Data Availability Statement
The data and codes used in this study are available by request from the authors.
Acknowledgments
The authors would like to thank the editors and anonymous reviewers for their valuable comments and suggestions, which helped us to improve the quality of this article.
Conflicts of Interest
The authors declare that they have no known competing financial interests or personal relationships that could have appeared to influence the work reported in this article.
References
- García-Sancho, M.; Lowe, J. A History of Genomics across Species, Communities and Projects; Springer: New York, NY, USA, 2023. [Google Scholar]
- Deng, D.; Chowdhury, M.H. Quantile regression approach for analyzing similarity of gene expressions under multiple biological conditions. Stats 2022, 5, 583–605. [Google Scholar] [CrossRef]
- Zhang, S. A comprehensive evaluation of SAM, the SAM R-package and a simple modification to improve its performance. BMC Bioinform. 2007, 8, 230. [Google Scholar] [CrossRef]
- Huang, J.; Yang, J.; Gu, Z.; Zhu, W.; Wu, S. A constrained generalized functional linear model for multi-loci genetic mapping. Stats 2021, 4, 550–577. [Google Scholar] [CrossRef]
- Hiremath, N.B.; Dayananda, P. Differential gene expression analysis of non-small cell lung cancer samples to classify candidate genes. Eng. Technol. Appl. Sci. Res. 2023, 13, 10571–10577. [Google Scholar] [CrossRef]
- Dolinski, A.C.; Homola, J.J.; Jankowski, M.D.; Robinson, J.D.; Owen, J.C. Differential gene expression reveals host factors for viral shedding variation in mallards (Anas platyrhynchos) infected with low-pathogenic avian influenza virus. J. Gen. Virol. 2022, 103, 001724. [Google Scholar] [CrossRef] [PubMed]
- Fletcher, M. Improved RNA-seq normalization. Nat. Genet. 2022, 5411, 1584. [Google Scholar] [CrossRef] [PubMed]
- Corchete, L.A.; Rojas, E.A.; Alonso-López, D.; De Las Rivas, J.; Gutiérrez, N.C.; Burguillo, F.J. Systematic comparison and assessment of RNA-seq procedures for gene expression quantitative analysis. Sci. Rep. 2020, 10, 19737. [Google Scholar] [CrossRef] [PubMed]
- Concha-Aracena, M.S.; Barrios-Blanco, L.; Elal-Olivero, D.; da Silva, P.H.F.; Nascimento, D.C.D. Extending normality: A case of unit distribution generated from the moments of the standard normal distribution. Axioms 2022, 11, 666. [Google Scholar] [CrossRef]
- Dubois, E.; Galindo, A.N.; Dayon, L.; Cominetti, O. Assessing normalization methods in mass spectrometry-based proteome profiling of clinical samples. Biosystems 2022, 215, 104661. [Google Scholar] [CrossRef]
- Ghandi, M.; Beer, M.A. Group normalization for genomic data. PLoS ONE 2012, 7, e38695. [Google Scholar] [CrossRef]
- Konishi, S. Normalizing and variance stabilizing transformations for intraclass correlations. Ann. Inst. Stat. Math. 1985, 37, 87–94. [Google Scholar] [CrossRef]
- Cortés-Ciriano, I.; Gulhan, D.C.; Lee, J.J.K.; Melloni, G.E.; Park, P.J. Computational analysis of cancer genome sequencing data. Nat. Rev. Genet. 2022, 23, 298–314. [Google Scholar] [CrossRef]
- Leiva, V.; Sanhueza, A.; Kelmansky, S.; Martinez, E. On the glog-normal distribution and its association with the gene expression problem. Comput. Stat. Data Anal. 2009, 53, 1613–1621. [Google Scholar] [CrossRef]
- Abrams, Z.B.; Johnson, T.S.; Huang, K.; Payne, P.R.; Coombes, K. A protocol to evaluate RNA sequencing normalization methods. BMC Bioinform. 2019, 20, 679. [Google Scholar] [CrossRef] [PubMed]
- Vilca, F.; Rodrigues-Motta, M.; Leiva, V. On a variance stabilizing model and its application to genomic data. J. Appl. Stat. 2013, 40, 2354–2371. [Google Scholar] [CrossRef]
- Tai, K.Y.; Dhaliwal, J.; Balasubramaniam, V. Leveraging Mann–Whitney U test on large-scale genetic variation data for analysing malaria genetic markers. Malar. J. 2022, 21, 79. [Google Scholar] [CrossRef] [PubMed]
- Hafemeister, C.; Satija, R. Normalization and variance stabilization of single-cell RNA-sequencing data using regularized negative binomial regression. Genome Biol. 2019, 20, 296. [Google Scholar] [CrossRef] [PubMed]
- Kelmansky, D.; Martinez, E.; Leiva, V. A new variance stabilizing transformation for gene expression data analysis. Stat. Appl. Genet. Mol. Biol. 2013, 12, 653–666. [Google Scholar] [CrossRef] [PubMed]
- Li, L.; Yu, X.; Sheng, C.; Jiang, X.; Zhang, Q.; Han, Y.; Jiang, J. A review of brain imaging biomarker genomics in Alzheimer’s disease: Implementation and perspectives. Transl. Neurodegener. 2022, 11, 42. [Google Scholar] [CrossRef]
- Corzo-Salamanca, J.A.; Vergara-Morales, M.E.; Babativa-Márquez, J.G. A runs test for the hypothesis of symmetry with one sided alternative. Univ. Sci. 2019, 24, 295–305. [Google Scholar] [CrossRef]
- Corzo, J.; Babativa, G. A modified runs test for symmetry. J. Stat. Comput. Simul. 2013, 83, 984–991. [Google Scholar] [CrossRef]
- Luecken, M.D.; Theis, F.J. Current best practices in single-cell RNA-seq analysis: A tutorial. Mol. Syst. Biol. 2019, 15, e8746. [Google Scholar] [CrossRef] [PubMed]
- Heumos, L.; Schaar, A.C.; Lance, C.; Litinetskaya, A.; Drost, F.; Zappia, L.; Lücken, M.D.; Strobl, D.C.; Henao, J.; Curion, F. Best practices for single-cell analysis across modalities. Nat. Rev. Genet. 2023, 24, 550–572. [Google Scholar] [CrossRef] [PubMed]
- Fan, Y.; Andrusivová, Ž.; Wu, Y.; Chai, C.; Larsson, L.; He, M.; Luo, L.; Lundeberg, J.; Wang, B. Expansion spatial transcriptomics. Nat. Methods 2023, 20, 1179–1182. [Google Scholar] [CrossRef]
- Love, M.I.; Huber, W.; Anders, S. Moderated estimation of fold change and dispersion for RNA-seq data with DESeq2. Genome Biol. 2014, 15, 550. [Google Scholar] [CrossRef]
- Robinson, M.D.; McCarthy, D.J.; Smyth, G.K. edgeR: A Bioconductor package for differential expression analysis of digital gene expression data. Bioinformatics 2010, 26, 139–140. [Google Scholar] [CrossRef]
- Chen, Y.; Chen, S.; Lei, E.P. DiffChIPL: A differential peak analysis method for high-throughput sequencing data with biological replicates based on Limma. Bioinformatics 2022, 38, 4062–4069. [Google Scholar] [CrossRef]
- McManus, C. Cerebral polymorphisms for lateralisation: Modelling the genetic and phenotypic architectures of multiple functional modules. Symmetry 2022, 14, 814. [Google Scholar] [CrossRef]
- Hui, W.; Gel, Y.R.; Gastwirth, J.L. lawstat: An R package for law, public policy and biostatistics. J. Stat. Softw. 2008, 28, 1–26. [Google Scholar] [CrossRef]
- Gastwirth, J.L.; Gel, Y.R.; Hui, W.W.; Lyubchich, V.; Miao, W.; Noguchi, K.; Lyubchich, M.V. Package ‘Lawstat’; R Foundation for Statistical Computing: Vienna, Austria, 2019. [Google Scholar]
- R Core Team. R: A Language and Environment for Statistical Computing; R Foundation for Statistical Computing: Vienna, Austria, 2023. [Google Scholar]
- Nayak, D.S.K.; Das, J.; Swarnkar, T. Quality control pipeline for next generation sequencing data analysis. In Proceedings of Intelligent and Cloud Computing; Springer: Singapore, 2021; pp. 215–225. [Google Scholar]
- Cabilio, P.; Masaro, J. A simple test of symmetry about an unknown median. Can. J. Stat. 1996, 24, 349–361. [Google Scholar] [CrossRef]
- Mira, A. Distribution-free test for symmetry based on Bonferroni’s measure. J. Appl. Stat. 1999, 26, 959–972. [Google Scholar] [CrossRef]
- Miao, W.; Gel, Y.; Gastwirth, J. A new test of symmetry about an unknown median. In Random Walk, Sequential Analysis and Related Topics—A Festschrift in Honor of Yuan-Shih Chow; World Scientific: Singapore, 2006; pp. 1–19. [Google Scholar]
- Nativio, R.; Lan, Y.; Donahue, G.; Sidoli, S.; Berson, A.; Srinivasan, A.R.; Shcherbakova, O.; Amlie-Wolf, A.; Nie, J.; Cui, X.; et al. An integrated multi-omics approach identifies epigenetic alterations associated with Alzheimer disease. Nat. Genet. 2020, 52, 1024–1035. [Google Scholar] [CrossRef]
- McCaw, Z.R.; Lane, J.M.; Saxena, R.; Redline, S.; Lin, X. Operating characteristics of the rank-based inverse normal transformation for quantitative trait analysis in genome-wide association studies. Biometrics 2020, 76, 1262–1272. [Google Scholar] [CrossRef]
- Modarres, R.; Gastwirth, J.L. Hybrid test for the hypothesis of symmetry. J. Appl. Stat. 1998, 25, 777–783. [Google Scholar] [CrossRef]
- Dillies, M.A.; Rau, A.; Aubert, J.; Hennequet-Antier, C.; Jeanmougin, M.; Servant, N.; Keime, C.; Marot, G.; Castel, D.; Estelle, J.; et al. A comprehensive evaluation of normalization methods for Illumina high-throughput RNA sequencing data analysis. Brief. Bioinform. 2013, 14, 671–683. [Google Scholar] [CrossRef] [PubMed]
- The Cancer Genome Atlas Research Network. Genomic and epigenomic landscapes of adult de novo acute myeloid leukemia. N. Engl. J. Med. 2013, 368, 2059–2074. [Google Scholar] [CrossRef] [PubMed]
- SEQC/MAQC-III Consortium. A comprehensive assessment of RNA-seq accuracy, reproducibility and information content by the Sequencing Quality Control Consortium. Nat. Biotechnol. 2014, 32, 903–914. [Google Scholar] [CrossRef]
- Conesa, A.; Madrigal, P.; Tarazona, S.; Gomez-Cabrero, D.; Cervera, A.; McPherson, A.; Szcześniak, M.W.; Gaffney, D.J.; Elo, L.L.; Zhang, X.; et al. A survey of best practices for RNA-seq data analysis. Genome Biol. 2016, 17, 13. [Google Scholar] [CrossRef]
- Yu, L.; Fernandez, S.; Brock, G. Power analysis for RNA-seq differential expression studies. BMC Bioinform. 2017, 18, 234. [Google Scholar] [CrossRef]
- McCaw, Z. RNOmni: Rank Normal Transformation Omnibus Test. Version 1.0.1.2. 2023. Available online: https://CRAN.R-project.org/package=RNOmni (accessed on 25 August 2024).
- Tang, F.; Barbacioru, C.; Wang, Y.; Nordman, E.; Lee, C.; Xu, N.; Wang, X.; Bodeau, J.; Tuch, B.B.; Siddiqui, A.; et al. mRNA-Seq whole-transcriptome analysis of a single cell. Nat. Methods 2009, 6, 377–382. [Google Scholar] [CrossRef] [PubMed]
- Andrews, T.S.; Kiselev, V.Y.; McCarthy, D.; Hemberg, M. Tutorial: Guidelines for the computational analysis of single-cell RNA sequencing data. Nat. Protoc. 2021, 16, 1–9. [Google Scholar] [CrossRef] [PubMed]
- Sanchez, L.; Leiva, V.; Galea, M.; Saulo, H. Birnbaum-Saunders quantile regression and its diagnostics with application to economic data. Appl. Stoch. Model. Bus. Ind. 2021, 37, 53–73. [Google Scholar] [CrossRef]
- Marchant, C.; Leiva, V.; Cavieres, M.F.; Sanhueza, A. Air contaminant statistical distributions with application to PM10 in Santiago, Chile. Rev. Environ. Contam. Toxicol. 2013, 223, 1–31. [Google Scholar] [PubMed]
- Palacios, C.A.; Reyes-Suarez, J.A.; Bearzotti, L.A.; Leiva, V.; Marchant, C. Knowledge discovery for higher education student retention based on data mining: Machine learning algorithms and case study in Chile. Entropy 2021, 23, 485. [Google Scholar] [CrossRef]
Disclaimer/Publisher’s Note: The statements, opinions and data contained in all publications are solely those of the individual author(s) and contributor(s) and not of MDPI and/or the editor(s). MDPI and/or the editor(s) disclaim responsibility for any injury to people or property resulting from any ideas, methods, instructions or products referred to in the content. |
© 2024 by the authors. Licensee MDPI, Basel, Switzerland. This article is an open access article distributed under the terms and conditions of the Creative Commons Attribution (CC BY) license (https://creativecommons.org/licenses/by/4.0/).