A Statistical Methodology for Evaluating Asymmetry after Normalization with Application to Genomic Data
Abstract
:1. Introduction
2. Methodology
2.1. Statistical Methods for Symmetry Evaluation
- •
- Cabilio–Masaro (CM) test: This test employs the sample mean (), median (), and standard deviation (S) [34]. The CM test statistic is computed aswhere n is the sample size. Under the null hypothesis of symmetry, the CM statistic follows a standard normal distribution. The CM test is particularly effective for large sample sizes, where the sample mean and standard deviation are estimators with good statistical properties.
- •
- Mira (M) test for symmetry: The M test evaluates symmetry by comparing the sample mean () with the median () [35]. The M test statistic is defined asThis statistic amplifies any deviation from symmetry. Under the null hypothesis of symmetry, the M statistic follows a standard normal distribution in large samples. For small samples, bootstrapping is employed to estimate accurate p-values, enhancing the test applicability across various sample sizes.
- •
- Miao–Gel–Gastwirth (MGG) test: This test, known for its robustness against outliers, uses a unique approach for its denominator to mitigate the impact of extreme values [36]. The MGG test statistic is defined aswhere the modified denominator J contrasts with traditional methods and is calculated asThe distinctive J feature reduces the influence of outliers, making the MGG test especially suitable for datasets with extreme variations.
2.2. Rp Test in RNA-Sequencing
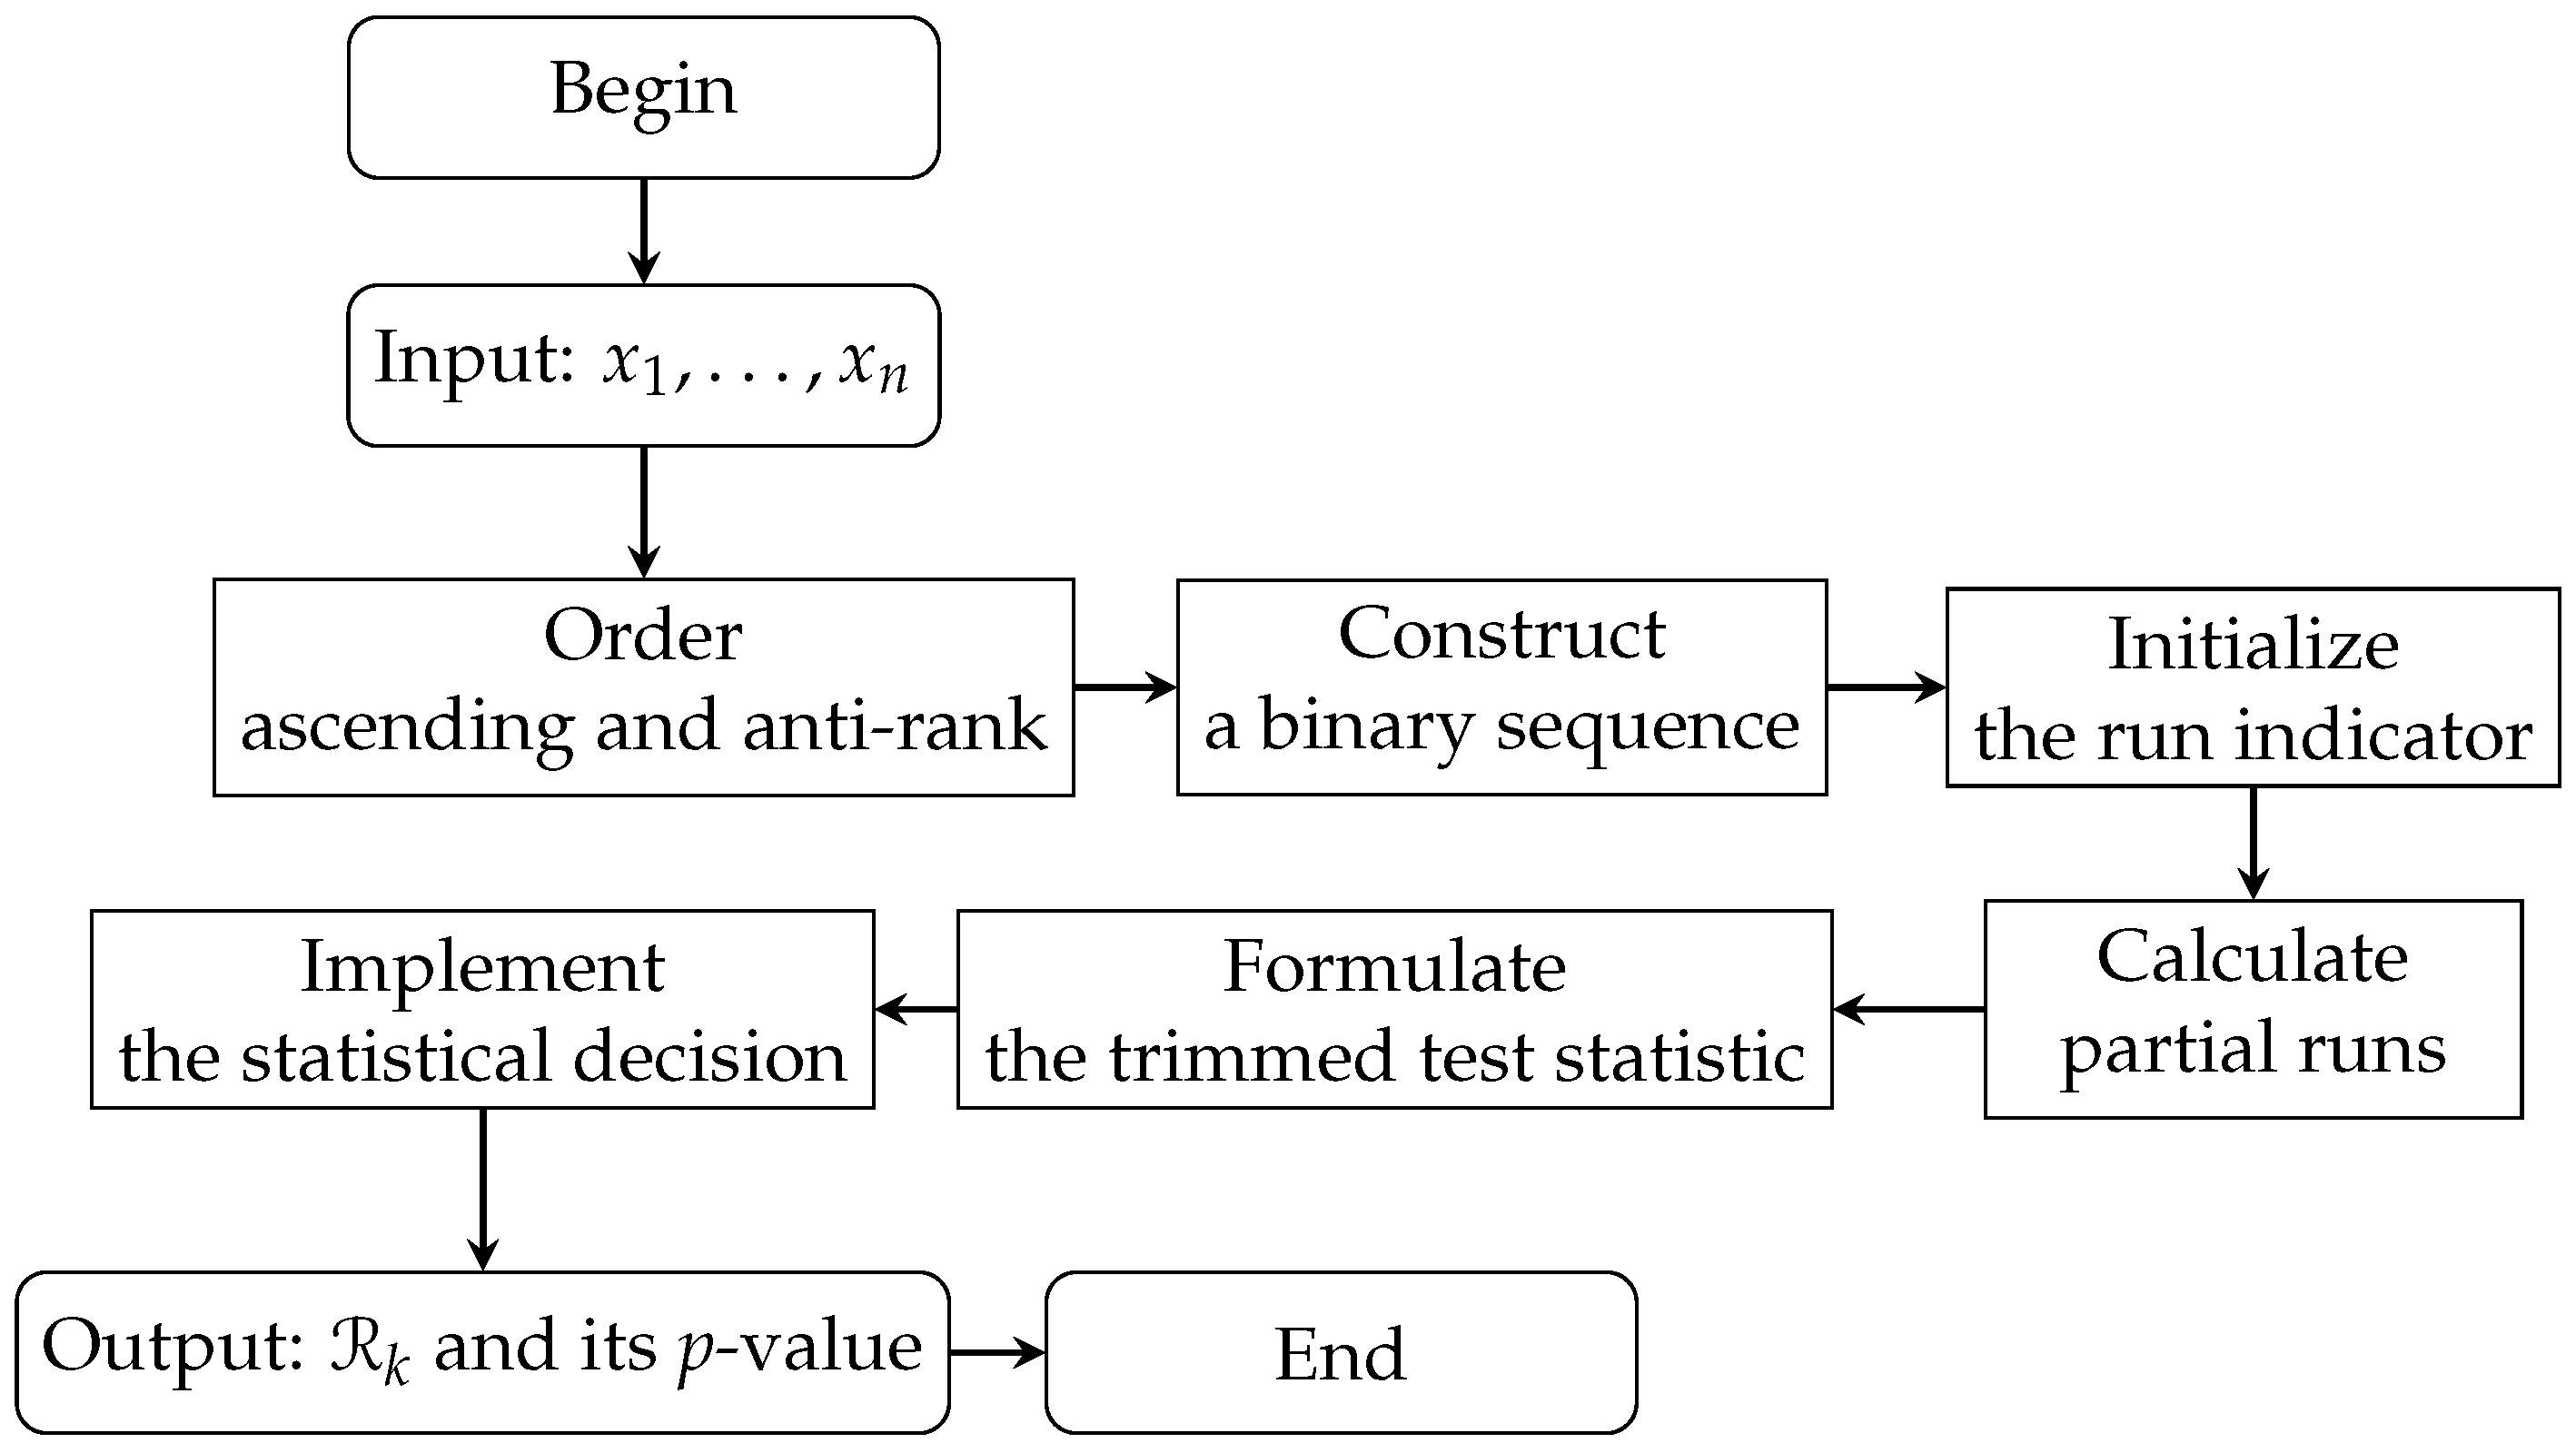
| Algorithm 1 Rp test for assessing symmetry in RNA-seq data. | |
| Input: Normalized gene expression values | |
| Output: Statistic of the Rp test and its p-value | |
| 1. Order ascending the absolute values to obtain a sequence | |
| 2. Compute the anti-rank for each , where represents the index in the original dataset | |
| 3. Construct a binary sequence using the sign of , with 1 indicating non-negative values and 0 indicating negative values | |
| 4. Initialize the run indicator as | |
| for each subsequent j do | |
| if the sign of changes then | |
| Update to mark the start of new runs | |
| end if | |
| end for | |
| 5. Calculate the partial number of runs for each observation, counting the runs up to observation j | |
| 6. Define the trimmed statistic of the Rp test | |
| 7. Evaluate the statistical significance of by calculating its p-value | |
| 8. Compare the p-value with a predefined significance level () to decide whether to reject the null hypothesis of symmetry or not | |
2.3. Integration of the Rp Test in the Broader Study Context
3. Simulation Studies for Evaluating the Robustness of the Rp Test
3.1. Simulation Setup
3.2. Test Implementation and Metrics
3.3. Simulation Results
4. Application to Real Genomic Data
4.1. Data Source and Preprocessing Overview
4.2. Evaluation of Symmetry of the Data Distribution
4.3. Robustness Assessment through Subsampling
4.4. Analysis of Symmetry Rejection across RNA-Seq Datasets
5. Discussion and Conclusions
Author Contributions
Funding
Data Availability Statement
Acknowledgments
Conflicts of Interest
References
- García-Sancho, M.; Lowe, J. A History of Genomics across Species, Communities and Projects; Springer: New York, NY, USA, 2023. [Google Scholar]
- Deng, D.; Chowdhury, M.H. Quantile regression approach for analyzing similarity of gene expressions under multiple biological conditions. Stats 2022, 5, 583–605. [Google Scholar] [CrossRef]
- Zhang, S. A comprehensive evaluation of SAM, the SAM R-package and a simple modification to improve its performance. BMC Bioinform. 2007, 8, 230. [Google Scholar] [CrossRef]
- Huang, J.; Yang, J.; Gu, Z.; Zhu, W.; Wu, S. A constrained generalized functional linear model for multi-loci genetic mapping. Stats 2021, 4, 550–577. [Google Scholar] [CrossRef]
- Hiremath, N.B.; Dayananda, P. Differential gene expression analysis of non-small cell lung cancer samples to classify candidate genes. Eng. Technol. Appl. Sci. Res. 2023, 13, 10571–10577. [Google Scholar] [CrossRef]
- Dolinski, A.C.; Homola, J.J.; Jankowski, M.D.; Robinson, J.D.; Owen, J.C. Differential gene expression reveals host factors for viral shedding variation in mallards (Anas platyrhynchos) infected with low-pathogenic avian influenza virus. J. Gen. Virol. 2022, 103, 001724. [Google Scholar] [CrossRef] [PubMed]
- Fletcher, M. Improved RNA-seq normalization. Nat. Genet. 2022, 5411, 1584. [Google Scholar] [CrossRef] [PubMed]
- Corchete, L.A.; Rojas, E.A.; Alonso-López, D.; De Las Rivas, J.; Gutiérrez, N.C.; Burguillo, F.J. Systematic comparison and assessment of RNA-seq procedures for gene expression quantitative analysis. Sci. Rep. 2020, 10, 19737. [Google Scholar] [CrossRef] [PubMed]
- Concha-Aracena, M.S.; Barrios-Blanco, L.; Elal-Olivero, D.; da Silva, P.H.F.; Nascimento, D.C.D. Extending normality: A case of unit distribution generated from the moments of the standard normal distribution. Axioms 2022, 11, 666. [Google Scholar] [CrossRef]
- Dubois, E.; Galindo, A.N.; Dayon, L.; Cominetti, O. Assessing normalization methods in mass spectrometry-based proteome profiling of clinical samples. Biosystems 2022, 215, 104661. [Google Scholar] [CrossRef]
- Ghandi, M.; Beer, M.A. Group normalization for genomic data. PLoS ONE 2012, 7, e38695. [Google Scholar] [CrossRef]
- Konishi, S. Normalizing and variance stabilizing transformations for intraclass correlations. Ann. Inst. Stat. Math. 1985, 37, 87–94. [Google Scholar] [CrossRef]
- Cortés-Ciriano, I.; Gulhan, D.C.; Lee, J.J.K.; Melloni, G.E.; Park, P.J. Computational analysis of cancer genome sequencing data. Nat. Rev. Genet. 2022, 23, 298–314. [Google Scholar] [CrossRef]
- Leiva, V.; Sanhueza, A.; Kelmansky, S.; Martinez, E. On the glog-normal distribution and its association with the gene expression problem. Comput. Stat. Data Anal. 2009, 53, 1613–1621. [Google Scholar] [CrossRef]
- Abrams, Z.B.; Johnson, T.S.; Huang, K.; Payne, P.R.; Coombes, K. A protocol to evaluate RNA sequencing normalization methods. BMC Bioinform. 2019, 20, 679. [Google Scholar] [CrossRef] [PubMed]
- Vilca, F.; Rodrigues-Motta, M.; Leiva, V. On a variance stabilizing model and its application to genomic data. J. Appl. Stat. 2013, 40, 2354–2371. [Google Scholar] [CrossRef]
- Tai, K.Y.; Dhaliwal, J.; Balasubramaniam, V. Leveraging Mann–Whitney U test on large-scale genetic variation data for analysing malaria genetic markers. Malar. J. 2022, 21, 79. [Google Scholar] [CrossRef] [PubMed]
- Hafemeister, C.; Satija, R. Normalization and variance stabilization of single-cell RNA-sequencing data using regularized negative binomial regression. Genome Biol. 2019, 20, 296. [Google Scholar] [CrossRef] [PubMed]
- Kelmansky, D.; Martinez, E.; Leiva, V. A new variance stabilizing transformation for gene expression data analysis. Stat. Appl. Genet. Mol. Biol. 2013, 12, 653–666. [Google Scholar] [CrossRef] [PubMed]
- Li, L.; Yu, X.; Sheng, C.; Jiang, X.; Zhang, Q.; Han, Y.; Jiang, J. A review of brain imaging biomarker genomics in Alzheimer’s disease: Implementation and perspectives. Transl. Neurodegener. 2022, 11, 42. [Google Scholar] [CrossRef]
- Corzo-Salamanca, J.A.; Vergara-Morales, M.E.; Babativa-Márquez, J.G. A runs test for the hypothesis of symmetry with one sided alternative. Univ. Sci. 2019, 24, 295–305. [Google Scholar] [CrossRef]
- Corzo, J.; Babativa, G. A modified runs test for symmetry. J. Stat. Comput. Simul. 2013, 83, 984–991. [Google Scholar] [CrossRef]
- Luecken, M.D.; Theis, F.J. Current best practices in single-cell RNA-seq analysis: A tutorial. Mol. Syst. Biol. 2019, 15, e8746. [Google Scholar] [CrossRef] [PubMed]
- Heumos, L.; Schaar, A.C.; Lance, C.; Litinetskaya, A.; Drost, F.; Zappia, L.; Lücken, M.D.; Strobl, D.C.; Henao, J.; Curion, F. Best practices for single-cell analysis across modalities. Nat. Rev. Genet. 2023, 24, 550–572. [Google Scholar] [CrossRef] [PubMed]
- Fan, Y.; Andrusivová, Ž.; Wu, Y.; Chai, C.; Larsson, L.; He, M.; Luo, L.; Lundeberg, J.; Wang, B. Expansion spatial transcriptomics. Nat. Methods 2023, 20, 1179–1182. [Google Scholar] [CrossRef]
- Love, M.I.; Huber, W.; Anders, S. Moderated estimation of fold change and dispersion for RNA-seq data with DESeq2. Genome Biol. 2014, 15, 550. [Google Scholar] [CrossRef]
- Robinson, M.D.; McCarthy, D.J.; Smyth, G.K. edgeR: A Bioconductor package for differential expression analysis of digital gene expression data. Bioinformatics 2010, 26, 139–140. [Google Scholar] [CrossRef]
- Chen, Y.; Chen, S.; Lei, E.P. DiffChIPL: A differential peak analysis method for high-throughput sequencing data with biological replicates based on Limma. Bioinformatics 2022, 38, 4062–4069. [Google Scholar] [CrossRef]
- McManus, C. Cerebral polymorphisms for lateralisation: Modelling the genetic and phenotypic architectures of multiple functional modules. Symmetry 2022, 14, 814. [Google Scholar] [CrossRef]
- Hui, W.; Gel, Y.R.; Gastwirth, J.L. lawstat: An R package for law, public policy and biostatistics. J. Stat. Softw. 2008, 28, 1–26. [Google Scholar] [CrossRef]
- Gastwirth, J.L.; Gel, Y.R.; Hui, W.W.; Lyubchich, V.; Miao, W.; Noguchi, K.; Lyubchich, M.V. Package ‘Lawstat’; R Foundation for Statistical Computing: Vienna, Austria, 2019. [Google Scholar]
- R Core Team. R: A Language and Environment for Statistical Computing; R Foundation for Statistical Computing: Vienna, Austria, 2023. [Google Scholar]
- Nayak, D.S.K.; Das, J.; Swarnkar, T. Quality control pipeline for next generation sequencing data analysis. In Proceedings of Intelligent and Cloud Computing; Springer: Singapore, 2021; pp. 215–225. [Google Scholar]
- Cabilio, P.; Masaro, J. A simple test of symmetry about an unknown median. Can. J. Stat. 1996, 24, 349–361. [Google Scholar] [CrossRef]
- Mira, A. Distribution-free test for symmetry based on Bonferroni’s measure. J. Appl. Stat. 1999, 26, 959–972. [Google Scholar] [CrossRef]
- Miao, W.; Gel, Y.; Gastwirth, J. A new test of symmetry about an unknown median. In Random Walk, Sequential Analysis and Related Topics—A Festschrift in Honor of Yuan-Shih Chow; World Scientific: Singapore, 2006; pp. 1–19. [Google Scholar]
- Nativio, R.; Lan, Y.; Donahue, G.; Sidoli, S.; Berson, A.; Srinivasan, A.R.; Shcherbakova, O.; Amlie-Wolf, A.; Nie, J.; Cui, X.; et al. An integrated multi-omics approach identifies epigenetic alterations associated with Alzheimer disease. Nat. Genet. 2020, 52, 1024–1035. [Google Scholar] [CrossRef]
- McCaw, Z.R.; Lane, J.M.; Saxena, R.; Redline, S.; Lin, X. Operating characteristics of the rank-based inverse normal transformation for quantitative trait analysis in genome-wide association studies. Biometrics 2020, 76, 1262–1272. [Google Scholar] [CrossRef]
- Modarres, R.; Gastwirth, J.L. Hybrid test for the hypothesis of symmetry. J. Appl. Stat. 1998, 25, 777–783. [Google Scholar] [CrossRef]
- Dillies, M.A.; Rau, A.; Aubert, J.; Hennequet-Antier, C.; Jeanmougin, M.; Servant, N.; Keime, C.; Marot, G.; Castel, D.; Estelle, J.; et al. A comprehensive evaluation of normalization methods for Illumina high-throughput RNA sequencing data analysis. Brief. Bioinform. 2013, 14, 671–683. [Google Scholar] [CrossRef] [PubMed]
- The Cancer Genome Atlas Research Network. Genomic and epigenomic landscapes of adult de novo acute myeloid leukemia. N. Engl. J. Med. 2013, 368, 2059–2074. [Google Scholar] [CrossRef] [PubMed]
- SEQC/MAQC-III Consortium. A comprehensive assessment of RNA-seq accuracy, reproducibility and information content by the Sequencing Quality Control Consortium. Nat. Biotechnol. 2014, 32, 903–914. [Google Scholar] [CrossRef]
- Conesa, A.; Madrigal, P.; Tarazona, S.; Gomez-Cabrero, D.; Cervera, A.; McPherson, A.; Szcześniak, M.W.; Gaffney, D.J.; Elo, L.L.; Zhang, X.; et al. A survey of best practices for RNA-seq data analysis. Genome Biol. 2016, 17, 13. [Google Scholar] [CrossRef]
- Yu, L.; Fernandez, S.; Brock, G. Power analysis for RNA-seq differential expression studies. BMC Bioinform. 2017, 18, 234. [Google Scholar] [CrossRef]
- McCaw, Z. RNOmni: Rank Normal Transformation Omnibus Test. Version 1.0.1.2. 2023. Available online: https://CRAN.R-project.org/package=RNOmni (accessed on 25 August 2024).
- Tang, F.; Barbacioru, C.; Wang, Y.; Nordman, E.; Lee, C.; Xu, N.; Wang, X.; Bodeau, J.; Tuch, B.B.; Siddiqui, A.; et al. mRNA-Seq whole-transcriptome analysis of a single cell. Nat. Methods 2009, 6, 377–382. [Google Scholar] [CrossRef] [PubMed]
- Andrews, T.S.; Kiselev, V.Y.; McCarthy, D.; Hemberg, M. Tutorial: Guidelines for the computational analysis of single-cell RNA sequencing data. Nat. Protoc. 2021, 16, 1–9. [Google Scholar] [CrossRef] [PubMed]
- Sanchez, L.; Leiva, V.; Galea, M.; Saulo, H. Birnbaum-Saunders quantile regression and its diagnostics with application to economic data. Appl. Stoch. Model. Bus. Ind. 2021, 37, 53–73. [Google Scholar] [CrossRef]
- Marchant, C.; Leiva, V.; Cavieres, M.F.; Sanhueza, A. Air contaminant statistical distributions with application to PM10 in Santiago, Chile. Rev. Environ. Contam. Toxicol. 2013, 223, 1–31. [Google Scholar] [PubMed]
- Palacios, C.A.; Reyes-Suarez, J.A.; Bearzotti, L.A.; Leiva, V.; Marchant, C. Knowledge discovery for higher education student retention based on data mining: Machine learning algorithms and case study in Chile. Entropy 2021, 23, 485. [Google Scholar] [CrossRef]

| Distribution | Type | ||||
|---|---|---|---|---|---|
| GL1 | 0 | 0.197454 | 0.134915 | 0.134915 | Symmetric |
| GL2 | 0 | −1 | −0.08 | −0.08 | Symmetric |
| GL3 | 0 | −0.397912 | −0.16 | −0.16 | Symmetric |
| GL4 | 0 | −1 | −0.24 | −0.24 | Symmetric |
| GL5 | −0.116734 | −0.351663 | −0.13 | −0.16 | Asymmetric |
| GL6 | 0 | −1 | −0.1 | −0.18 | Asymmetric |
| GL7 | 3.586508 | 0.04306 | 0.025213 | 0.094029 | Asymmetric |
| GL8 | 0 | −1 | −0.0075 | −0.03 | Asymmetric |
| GL9 | 0 | 1 | 1.4 | 0.25 | Asymmetric |
| GL10 | 0 | 1 | 0.00007 | 0.1 | Asymmetric |
| GL11 | 0 | −1 | −0.001 | −0.13 | Asymmetric |
| GL12 | 0 | −1 | −0.0001 | −0.17 | Asymmetric |
| n | Empirical | Distribution | MGG | CM | M | |||
|---|---|---|---|---|---|---|---|---|
| 20 | normal | 0 | 0.0632 | 0.0507 | 0.0338 | 0.0265 | 0.0336 | |
| GL1 | 0 | 0.0636 | 0.0512 | 0.0322 | 0.0273 | 0.0355 | ||
| GL2 | 0 | 0.0473 | 0.0357 | 0.0417 | 0.0243 | 0.0337 | ||
| GL3 | 0 | 0.0485 | 0.0389 | 0.0574 | 0.0239 | 0.0409 | ||
| GL4 | 0 | 0.0425 | 0.0334 | 0.0743 | 0.0258 | 0.0392 | ||
| GL5 | 0 | 0.0724 | 0.0571 | 0.0614 | 0.0266 | 0.0478 | ||
| GL6 | 0 | 0.1646 | 0.1282 | 0.1291 | 0.0564 | 0.0979 | ||
| GL7 | 0 | 0.2759 | 0.2195 | 0.1197 | 0.0827 | 0.1315 | ||
| GL8 | 0 | 0.3538 | 0.2804 | 0.2100 | 0.1284 | 0.1879 | ||
| GL9 | 0 | 0.5512 | 0.4405 | 0.1654 | 0.1617 | 0.1691 | ||
| GL10 | 0 | 0.7404 | 0.6089 | 0.4286 | 0.3212 | 0.3849 | ||
| GL11 | 0 | 0.8366 | 0.7177 | 0.6353 | 0.4479 | 0.4859 | ||
| GL12 | 0 | 0.8567 | 0.7418 | 0.6771 | 0.4714 | 0.5026 | ||
| lognormal | 0 | 0.8525 | 0.7395 | 0.7403 | 0.4864 | 0.4982 | ||
| 30 | normal | 0.1375 | 0.0535 | 0.5500 | 0.0392 | 0.0353 | 0.3800 | |
| GL1 | 0.1339 | 0.0522 | 0.0573 | 0.0346 | 0.0302 | 0.0357 | ||
| GL2 | 0.1133 | 0.0403 | 0.0414 | 0.0495 | 0.0296 | 0.3600 | ||
| GL3 | 0.1097 | 0.0375 | 0.0378 | 0.0635 | 0.0325 | 0.0397 | ||
| GL4 | 0.1133 | 0.3800 | 0.0354 | 0.8200 | 0.0311 | 0.0418 | ||
| GL5 | 0.1917 | 0.0705 | 0.7300 | 0.0747 | 0.0403 | 0.0496 | ||
| GL6 | 0.4198 | 0.2093 | 0.1942 | 0.1869 | 0.0999 | 0.1341 | ||
| GL7 | 0.6306 | 0.3952 | 0.3671 | 0.2009 | 0.1619 | 0.2070 | ||
| GL8 | 0.7589 | 0.5124 | 0.4737 | 0.3428 | 0.246 | 0.3074 | ||
| GL9 | 0.847 | 0.682 | 0.6069 | 0.232 | 0.2431 | 0.2211 | ||
| GL10 | 0.9773 | 0.8874 | 0.8158 | 0.6024 | 0.5274 | 0.5654 | ||
| GL11 | 0.9929 | 0.9471 | 0.8956 | 0.8165 | 0.6912 | 0.7087 | ||
| GL12 | 0.9956 | 0.956 | 0.9157 | 0.8473 | 0.7308 | 0.7311 | ||
| lognormal | 0.9953 | 0.958 | 0.9182 | 0.8951 | 0.7543 | 0.7396 | ||
| 50 | normal | 0.0758 | 0.0651 | 0.0586 | 0.0418 | 0.0402 | 0.0408 | |
| GL1 | 0.0699 | 0.0591 | 0.0509 | 0.0411 | 0.0398 | 0.0379 | ||
| GL2 | 0.5600 | 0.0447 | 0.0359 | 0.0508 | 0.0314 | 0.0389 | ||
| GL3 | 0.0547 | 0.4200 | 0.0369 | 0.0699 | 0.0327 | 0.0397 | ||
| GL4 | 0.0567 | 0.0399 | 0.0325 | 0.0908 | 0.0361 | 0.0418 | ||
| GL5 | 0.1263 | 0.1039 | 0.0858 | 0.0927 | 0.0486 | 0.0618 | ||
| GL6 | 0.3778 | 0.3444 | 0.2819 | 0.2959 | 0.1857 | 0.2245 | ||
| GL7 | 0.6718 | 0.6146 | 0.5172 | 0.3286 | 0.2883 | 0.3395 | ||
| GL8 | 0.8080 | 0.7644 | 0.6690 | 0.5349 | 0.4495 | 0.5132 | ||
| GL9 | 0.9320 | 0.8344 | 0.7139 | 0.3512 | 0.3740 | 0.3190 | ||
| GL10 | 0.9983 | 0.9813 | 0.9213 | 0.824 | 0.7859 | 0.8159 | ||
| GL11 | 0.9997 | 0.9940 | 0.9655 | 0.9564 | 0.9206 | 0.9323 | ||
| GL12 | 0.9999 | 0.9965 | 0.9695 | 0.9707 | 0.9400 | 0.9438 | ||
| lognormal | 0.9998 | 0.9968 | 0.9784 | 0.9840 | 0.9560 | 0.9479 | ||
| 100 | normal | 0.0669 | 0.0634 | 0.0586 | 0.0483 | 0.0487 | 0.0423 | |
| GL1 | 0.0659 | 0.0566 | 0.0529 | 0.0438 | 0.0437 | 0.0374 | ||
| GL2 | 0.0487 | 0.0429 | 0.0398 | 0.0548 | 0.0377 | 0.0423 | ||
| GL3 | 0.0485 | 0.0375 | 0.0324 | 0.0715 | 0.0409 | 0.0436 | ||
| GL4 | 0.0481 | 0.0377 | 0.0322 | 0.0961 | 0.0406 | 0.0452 | ||
| GL5 | 0.1591 | 0.1404 | 0.1201 | 0.1359 | 0.8500 | 0.0933 | ||
| GL6 | 0.6107 | 0.5890 | 0.5214 | 0.5250 | 0.4111 | 0.4451 | ||
| GL7 | 0.9141 | 0.8776 | 0.8014 | 0.6032 | 0.5711 | 0.6200 | ||
| GL8 | 0.9774 | 0.9621 | 0.9145 | 0.8348 | 0.7908 | 0.8286 | ||
| GL9 | 0.9892 | 0.9517 | 0.8759 | 0.5529 | 0.581 | 0.5179 | ||
| GL10 | 1 | 0.9994 | 0.9929 | 0.9786 | 0.9753 | 0.9807 | ||
| GL11 | 1 | 1 | 0.999 | 0.9988 | 0.9977 | 0.9986 | ||
| GL12 | 1 | 1 | 0.9994 | 0.9996 | 0.9994 | 0.9993 | ||
| lognormal | 1 | 1 | 0.9996 | 0.9999 | 0.9999 | 0.9996 |
| Dataset | Rp Test | p-Value | MGG Test | p-Value | CM Test | p-Value | M Test | p-Value |
|---|---|---|---|---|---|---|---|---|
| 1 | −2.6950 | 0.996 | −16.8080 | 1 | −17.0262 | 1 | −17.2877 | 1 |
| 2 | −0.1227 | 0.549 | −18.1936 | 1 | −18.5582 | 1 | −18.4214 | 1 |
| 3 | 0.7926 | 0.214 | −18.3478 | 1 | −18.5783 | 1 | −18.7437 | 1 |
| 4 | −0.5547 | 0.710 | −16.8183 | 1 | −17.0739 | 1 | −17.2347 | 1 |
| 5 | 0.3419 | 0.366 | −16.9436 | 1 | −17.2710 | 1 | −17.0738 | 1 |
| 6 | −3.2899 | 0.999 | −17.0684 | 1 | −17.3118 | 1 | −16.8988 | 1 |
| 7 | 0.0887 | 0.465 | −15.1808 | 1 | −15.3896 | 1 | −15.4853 | 1 |
| 8 | −3.0902 | 0.999 | −17.9734 | 1 | −18.1465 | 1 | −18.5181 | 1 |
| 9 | −1.7155 | 0.957 | −14.6008 | 1 | −14.8674 | 1 | −15.0311 | 1 |
| 10 | −1.8128 | 0.965 | −14.3613 | 1 | −14.5475 | 1 | −14.5453 | 1 |
| 11 | 1.3358 | 0.091 | −17.8693 | 1 | −18.1581 | 1 | −18.3331 | 1 |
| 12 | 1.1736 | 0.120 | −17.6595 | 1 | −17.9535 | 1 | −17.8061 | 1 |
| 13 | 0.3982 | 0.345 | −18.2651 | 1 | −18.5777 | 1 | −18.5486 | 1 |
| 14 | −2.9219 | 0.998 | −12.2041 | 1 | −12.3863 | 1 | −12.2216 | 1 |
| 15 | 2.5531 | 0.005 | −15.8770 | 1 | −16.1026 | 1 | −15.9890 | 1 |
| 16 | 0.9928 | 0.160 | −19.3036 | 1 | −19.6125 | 1 | −20.0872 | 1 |
| 17 | 3.0181 | 0.001 | −13.8194 | 1 | −14.0199 | 1 | −13.9879 | 1 |
| 18 | −0.4531 | 0.675 | −16.7694 | 1 | −17.1088 | 1 | −17.2301 | 1 |
| 19 | −1.8638 | 0.969 | −17.6307 | 1 | −17.9916 | 1 | −17.7343 | 1 |
| 20 | 0.4921 | 0.311 | −15.6244 | 1 | −15.8887 | 1 | −15.6862 | 1 |
| 21 | −2.1837 | 0.986 | −17.8140 | 1 | −18.2165 | 1 | −17.6224 | 1 |
| 22 | −2.5579 | 0.995 | −22.1083 | 1 | −22.4859 | 1 | −23.0092 | 1 |
| 23 | −5.3044 | 1 | −21.4939 | 1 | −21.9260 | 1 | −22.4050 | 1 |
| 24 | −4.9969 | 1 | −22.0210 | 1 | −22.4440 | 1 | −22.4021 | 1 |
| 25 | −4.2857 | 1 | −17.9044 | 1 | −18.2910 | 1 | −18.0124 | 1 |
| 26 | 1.2033 | 0.114 | −22.9884 | 1 | −23.4014 | 1 | −23.0682 | 1 |
| 27 | −3.8619 | 1 | −15.8874 | 1 | −16.1360 | 1 | −16.1700 | 1 |
| 28 | 2.9055 | 0.002 | −18.3866 | 1 | −18.5923 | 1 | −18.8854 | 1 |
| 29 | −1.5599 | 0.941 | −19.6007 | 1 | −19.8957 | 1 | −19.7064 | 1 |
| 30 | −0.6445 | 0.740 | −16.5039 | 1 | −16.7500 | 1 | −16.9535 | 1 |
| % of Rejection of H0 with | ||||
|---|---|---|---|---|
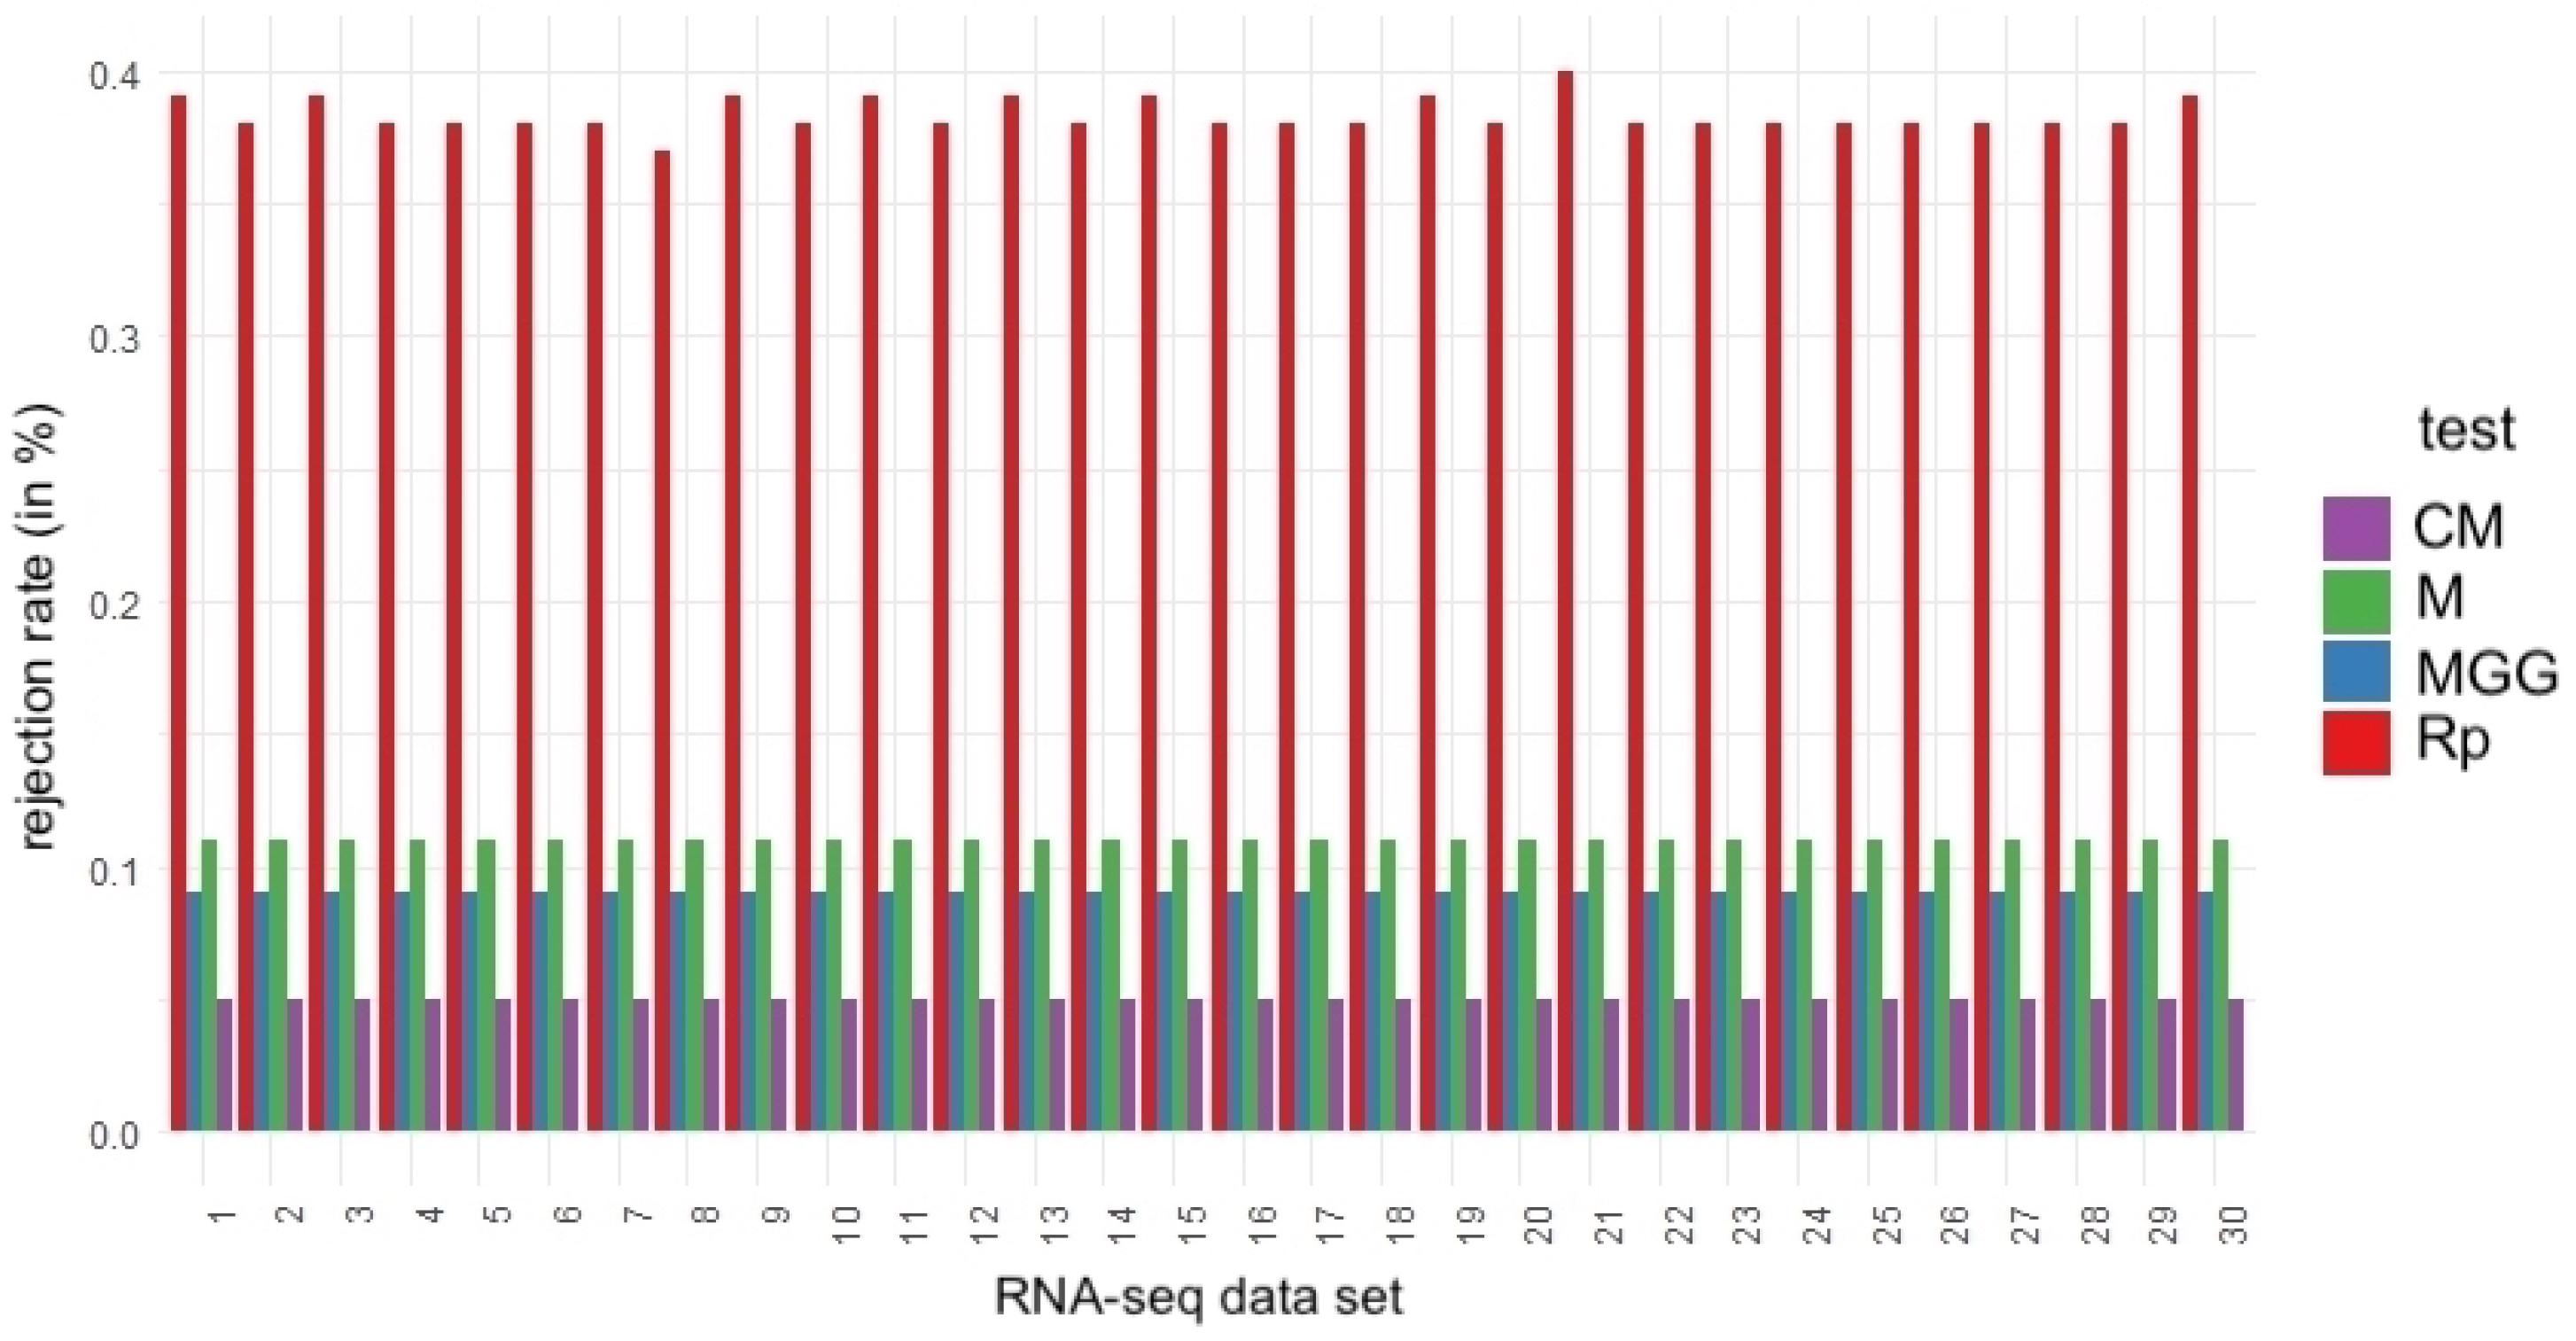
| RNA-Seq Subsample | Rp Test | MGG Test | M Test | CM Test |
| 1 | 0.39 | 0.09 | 0.11 | 0.05 |
| 2 | 0.38 | 0.09 | 0.11 | 0.05 |
| 3 | 0.39 | 0.09 | 0.11 | 0.05 |
| 4 | 0.38 | 0.09 | 0.11 | 0.05 |
| 5 | 0.38 | 0.09 | 0.11 | 0.05 |
| 6 | 0.38 | 0.10 | 0.12 | 0.05 |
| 7 | 0.38 | 0.09 | 0.11 | 0.05 |
| 8 | 0.37 | 0.09 | 0.12 | 0.05 |
| 9 | 0.39 | 0.10 | 0.12 | 0.05 |
| 10 | 0.38 | 0.09 | 0.11 | 0.05 |
| 11 | 0.39 | 0.09 | 0.11 | 0.05 |
| 12 | 0.38 | 0.09 | 0.11 | 0.05 |
| 13 | 0.39 | 0.09 | 0.12 | 0.05 |
| 14 | 0.38 | 0.09 | 0.11 | 0.05 |
| 15 | 0.39 | 0.09 | 0.11 | 0.05 |
| 16 | 0.38 | 0.08 | 0.11 | 0.04 |
| 17 | 0.38 | 0.09 | 0.11 | 0.05 |
| 18 | 0.38 | 0.09 | 0.11 | 0.04 |
| 19 | 0.39 | 0.09 | 0.11 | 0.05 |
| 20 | 0.38 | 0.09 | 0.12 | 0.05 |
| 21 | 0.40 | 0.09 | 0.11 | 0.05 |
| 22 | 0.38 | 0.09 | 0.11 | 0.05 |
| 23 | 0.38 | 0.09 | 0.11 | 0.05 |
| 24 | 0.38 | 0.09 | 0.11 | 0,05 |
| 25 | 0.38 | 0.09 | 0.11 | 0,05 |
| 26 | 0.38 | 0.09 | 0.11 | 0.05 |
| 27 | 0.39 | 0.09 | 0.11 | 0.05 |
| 28 | 0.38 | 0.09 | 0.12 | 0.05 |
| 29 | 0.38 | 0.09 | 0.12 | 0.05 |
| 30 | 0.39 | 0.09 | 0.11 | 0.05 |
Disclaimer/Publisher’s Note: The statements, opinions and data contained in all publications are solely those of the individual author(s) and contributor(s) and not of MDPI and/or the editor(s). MDPI and/or the editor(s) disclaim responsibility for any injury to people or property resulting from any ideas, methods, instructions or products referred to in the content. |
© 2024 by the authors. Licensee MDPI, Basel, Switzerland. This article is an open access article distributed under the terms and conditions of the Creative Commons Attribution (CC BY) license (https://creativecommons.org/licenses/by/4.0/).
Share and Cite
Leiva, V.; Corzo, J.; Vergara, M.E.; Ospina, R.; Castro, C. A Statistical Methodology for Evaluating Asymmetry after Normalization with Application to Genomic Data. Stats 2024, 7, 967-983. https://doi.org/10.3390/stats7030059
Leiva V, Corzo J, Vergara ME, Ospina R, Castro C. A Statistical Methodology for Evaluating Asymmetry after Normalization with Application to Genomic Data. Stats. 2024; 7(3):967-983. https://doi.org/10.3390/stats7030059
Chicago/Turabian StyleLeiva, Víctor, Jimmy Corzo, Myrian E. Vergara, Raydonal Ospina, and Cecilia Castro. 2024. "A Statistical Methodology for Evaluating Asymmetry after Normalization with Application to Genomic Data" Stats 7, no. 3: 967-983. https://doi.org/10.3390/stats7030059
APA StyleLeiva, V., Corzo, J., Vergara, M. E., Ospina, R., & Castro, C. (2024). A Statistical Methodology for Evaluating Asymmetry after Normalization with Application to Genomic Data. Stats, 7(3), 967-983. https://doi.org/10.3390/stats7030059


