Abstract
Convective storms represent a dangerous atmospheric phenomenon, particularly for the heavy and concentrated precipitation they can trigger. Given their high velocity and variability, their prediction is challenging, though it is crucial to issue reliable alarms. The paper presents a neural network approach to forecast the convective cell trajectory and intensity, using, as an example, a region in northern Italy that is frequently hit by convective storms in spring and summer. The predictor input is constituted by radar-derived information about the center of gravity of the cell, its reflectivity (a proxy for the intensity of the precipitation), and the area affected by the storm. The essential characteristic of the proposed approach is that the neural network directly forecasts the evolution of the convective cell position and of the other features for the following hour at a 5-min temporal resolution without a relevant loss of accuracy in comparison to predictors trained for each specific variable at a particular time step. Besides its accuracy ( of the position is about 0.80 one hour in advance), this machine learning approach has clear advantages over the classical numerical weather predictors since it runs at orders of magnitude more rapidly, thus allowing for the implementation of a real-time early-warning system.
1. Introduction
Convective storms, often referred to simply as thunderstorms, are intense local storms that are associated with a range of severe weather phenomena, including heavy rainfall, sudden temperature changes, flash floods, lightning, hail, and strong winds. They are named after an atmospheric phenomenon called convection, a type of motion caused by thermal imbalances within a fluid body. Specifically, it occurs when warm, moist air masses close to the Earth’s surface rise, due to their low density compared to the cooler air above (i.e., atmospheric instability). This rising motion creates vertical currents called “updrafts”. Thunderstorms can be originated by a single convective cell (originated by one updraft) or by several cells (multiple updrafts) [1]. The atmospheric conditions that lead to convective storms can develop in various geographical locations and climates, such as the tropics, or during the warmer months (spring and summer) in temperate regions.
Besides the interest in the physical processes related to their formation and evolution, several researchers focus on quantifying storms’ impacts. In fact, they have been the most costly type of natural disaster in economic terms in the last decades and the second most critical regarding human lives [2]. Between 1994 and 2013, 6873 natural disasters were recorded worldwide, resulting in 1.35 million deaths. The main types of disasters were floods, which were responsible for 43% of all events and affected about 2.5 billion people. Storms take the unfortunate second place, killing more than 244,000 people and causing economic damage of up to 936 billion US dollars. Furthermore, due to climate change, the intensity and frequency of these phenomena, and thus also their negative effects, may noticeably increase [3].
An accurate forecast of convective storms’ trajectory and intensity is paramount for mitigating their impact and reducing the associated damages. However, the complex interplay of atmospheric conditions is hard to be formalized into physically-based models. The prediction of these phenomena is thus a hard task for traditional forecasting methods, and innovative data-driven tools that come under the umbrella of artificial intelligence (e.g., machine learning and deep learning) are increasingly employed for this purpose.
These tools have become incredibly popular over the last decades, and nowadays are widely used for time series prediction in general, [4,5,6,7,8,9] and also specifically applied in the field of weather forecasting [10,11,12,13,14,15,16,17,18,19,20,21,22]. More and more researchers have adopted machine learning techniques instead of classical physically-based models [23], developing increasingly accurate predictors of intense precipitation [24,25]. Recent surveys on deep learning applications to the problem of intense rainfall episodes can be found in Fang et al. [26] and Hussein et al. [27].
Benevides et al. [28,29,30] proposed a short-term methodology for forecasting intense rainfalls, combining traditional meteorological data and innovative global navigation satellite system (GNSS) measures. As a result, the authors improved the detection of severe rain events and paved the way for further research, which showed improvements in forecasting rain events by adopting GPS measures [31,32].
These models can be used for practical applications, including nowcasting, alert systems, and sensor deployment. However, the problem is dealt with as a static classification task. These models predict the occurrence of intense rainfall only in one or a few points in a specific spatial domain, without providing any further information on the intensity and the area of influence of the phenomenon.
Forecasting convective storms’ trajectory remains extremely difficult, as they are short-lived and highly volatile. Initially, Han et al. [33] addressed the problem using a combination of image processing and linear regression. More recent research has successfully applied neural networks and data mining approaches to predict hurricanes’ trajectories [34,35]. Furthermore, deep neural networks and random forests were shown to be the most promising machine learning model used in meteorological nowcasting [36,37].
These techniques can be integrated with weather radars that produce reliable storm data with excellent detail. In addition to ground rainfall, many other parameters, such as the event’s spatial coverage, the precipitation’s vertical structure, and the ice particle distribution, can be retrieved. Moreover, radar observations have a high temporal resolution (5–10 min or shorter).
Huang et al. [38], for instance, used radar data and developed a cascade of two neural networks consisting of a location network to predict the storm position and a refining network to estimate the rainfall intensity. Bouget et al. [39] used a fusion of radar data and wind speed values to build a classifier that recognizes three different levels of rainfall over France. Since they start from radar and wind maps, their network has about 600,000 inputs to produce almost 50,000 output values at each 5-min step. Zhang et al. [40] fused radar maps with precipitation grid data and other computed values to forecast the precipitation amount and intensity in southeastern China. Such rich input improves the predictor’s performance by capturing the precipitation event’s key features. Peng et al. [41] proposed a graph neural network to relate better radar observations and rainfall measured values. Their results on southeastern China show that the proposed neural network reduces the well-known underestimation of high rainfall rates by radar measurements and effectively represents the spatial-temporal features of the precipitation field.
Following the same line, this work integrates artificial neural networks and radar data to build a forecasting model capable of predicting the evolution of intense convective storms one hour ahead. This would allow the development of a real-time alert procedure, a potentially helpful tool for civil protection activities. The peculiarity of this work consists in adopting a multi-variable and multi-output approach. Different variables constitute the model’s output, and their evolution is predicted at multiple time steps. In this way, we produce a complete characterization of the convective cell’s situation which is similar to that of a physically-based simulation model.
The rest of this article is organized as follows. Section 2 introduces the case study and the available dataset and presents the neural approaches adopted. Then, Section 3 and Section 4 report the numerical results and discuss the most significant insights that emerged. In the final section, we draw some concluding remarks.
2. Materials and Methods
2.1. Study Area
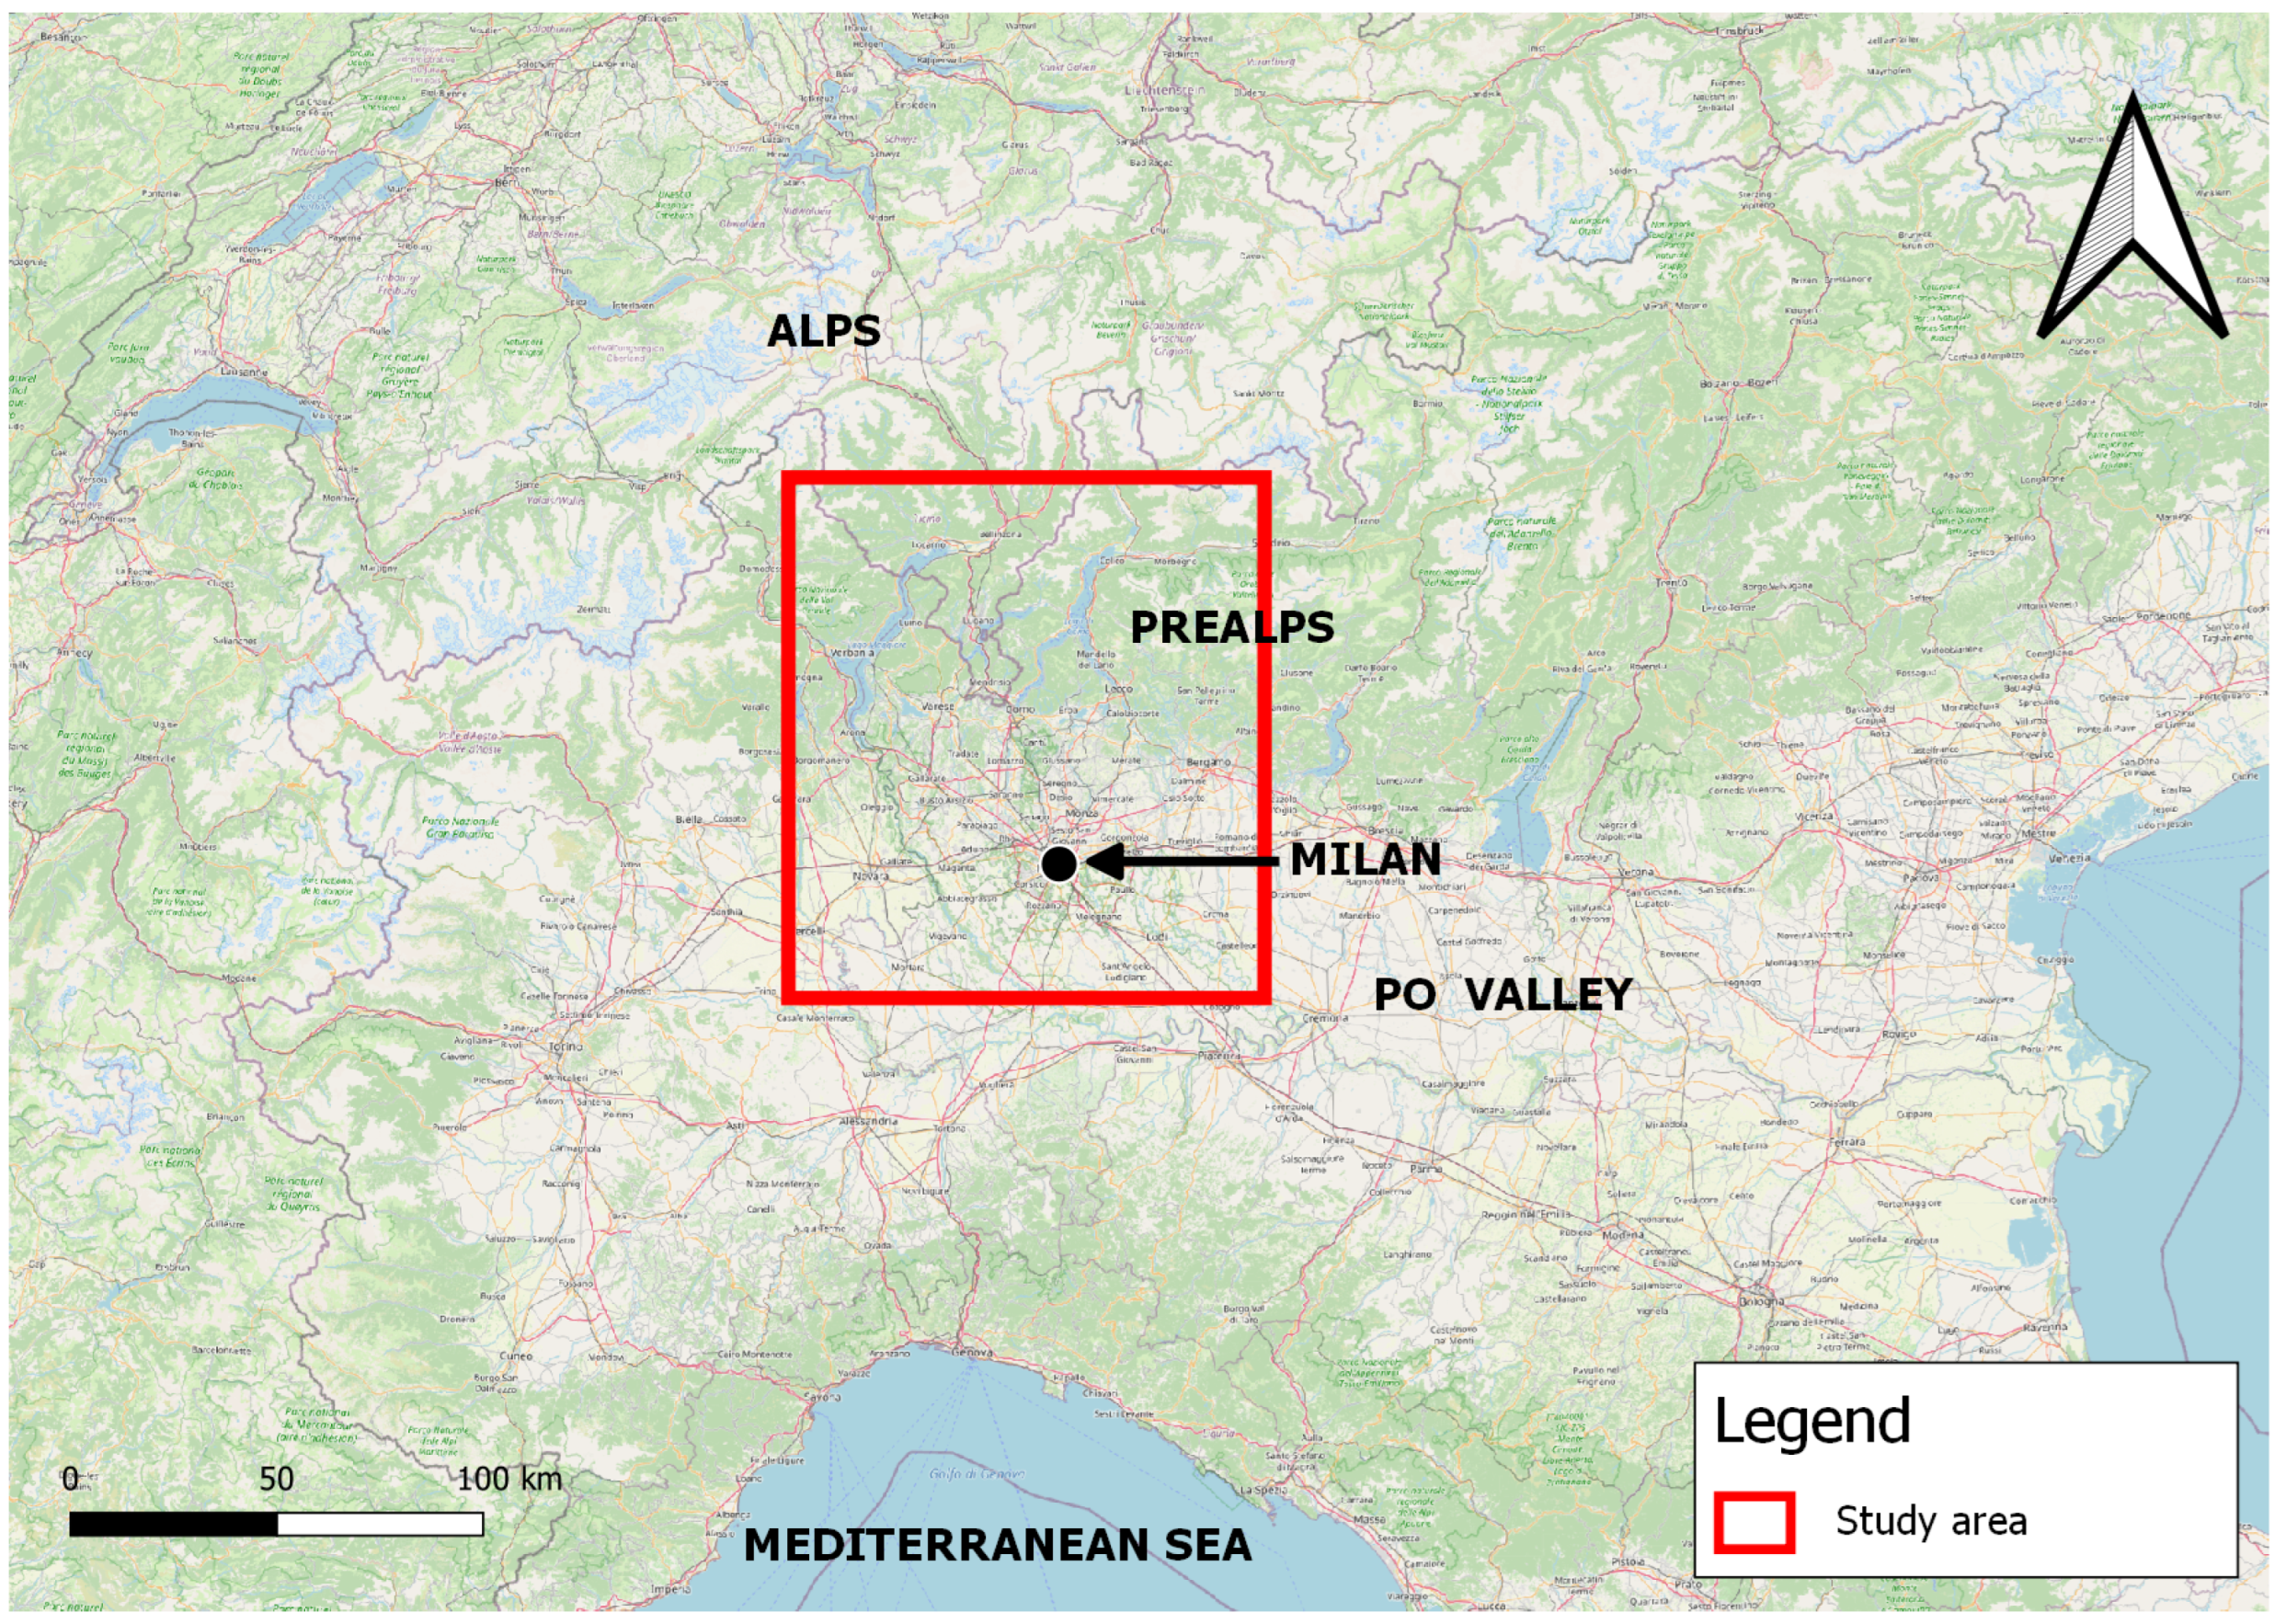
The study area of this work is shown in red in Figure 1 and lies primarily in Lombardy, northern Italy. Latitude spans from 45.25 to 46.25 N, while longitude is from 8.5 to 9.75 E, thus about 110 × 130 km2. The orography is quite heterogeneous. The north is dominated by the Pre-Alps and three big lakes: Lake Maggiore, Lake Lugano, and Lake Como. The Po Valley lies in the south, where the municipality of Milan is located. A strong connotation of urban sprawl characterizes the area, where the permeability of the soil is significantly reduced; the water is channelled and transported from north to south, amplifying the damage caused by heavy rains and floods. According to the Köppen-Geiger climate classification, the area has a fully humid, warm climate with a warm summer. It is subject to intense and sudden convective thunderstorms, especially in spring and summer. This is because the air, loaded with humidity, is heated by contact with the Earth’s surface, which is heated by the sunlight, undergoing an upward movement, forming clouds and producing precipitation or thunderstorms. Prevailing winds are from the southwest sector with a low average speed, around 2 m/s.
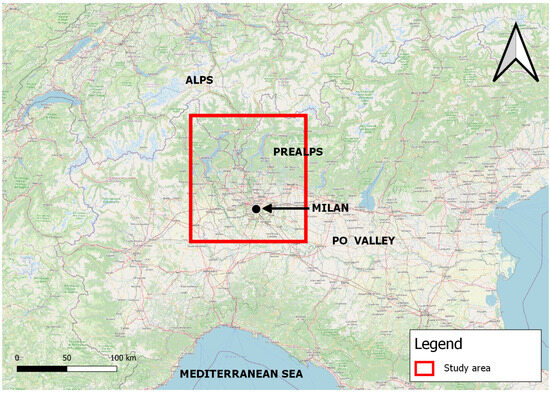
Figure 1.
Geographic overview of the study area.
2.2. Dataset
The dataset used in this work was acquired using the Thunderstorm Radar Tracking (TRT) algorithm developed by MeteoSwiss [42,43]. The TRT algorithm uses the reflectivity data of the composite images of the Swiss radar network, which consists of 3 volumetric C-band Doppler radars located at Monte Lema (1626 m asl), Albis (938 m asl), and La Dôle (1682 m asl), with a sensitivity of 0.2 mm/h at 230 km. The algorithm allows for determining the position of the centroids of the convective cells, their area and intensity (in terms of average and maximum reflectivity), following their evolution in time and space. The temporal resolution is five minutes, while the spatial resolution is 2 km. Cell trajectories are derived from sequences of radar images using a thresholding scheme. Convective cells are detected if they reach a minimum area of 16 km2 (4 pixels) and their minimum reflectivity exceeds 36 dBZ, with a difference between the maximum reflectivity and the value at the base of a cell larger than 6 dBZ (i.e., at least one pixel must reach 42 dBZ). As well known, the dBZ is a logarithmic dimensionless unit proportional to the density of raindrops in a unit volume. The algorithm can spot thunderstorms at an early or mature stage. Complex cases with several cells and splits and merges of cells are taken into account with the method of geographical overlapping, linking objects in consecutive radar images if they represent the same phenomena [42]. For each convective cell and time step, the dataset consists of coordinates of the center of mass, motion vector (i.e., both speed and direction), area of influence, average and maximum radar reflectivity, date and time, and event identification number.
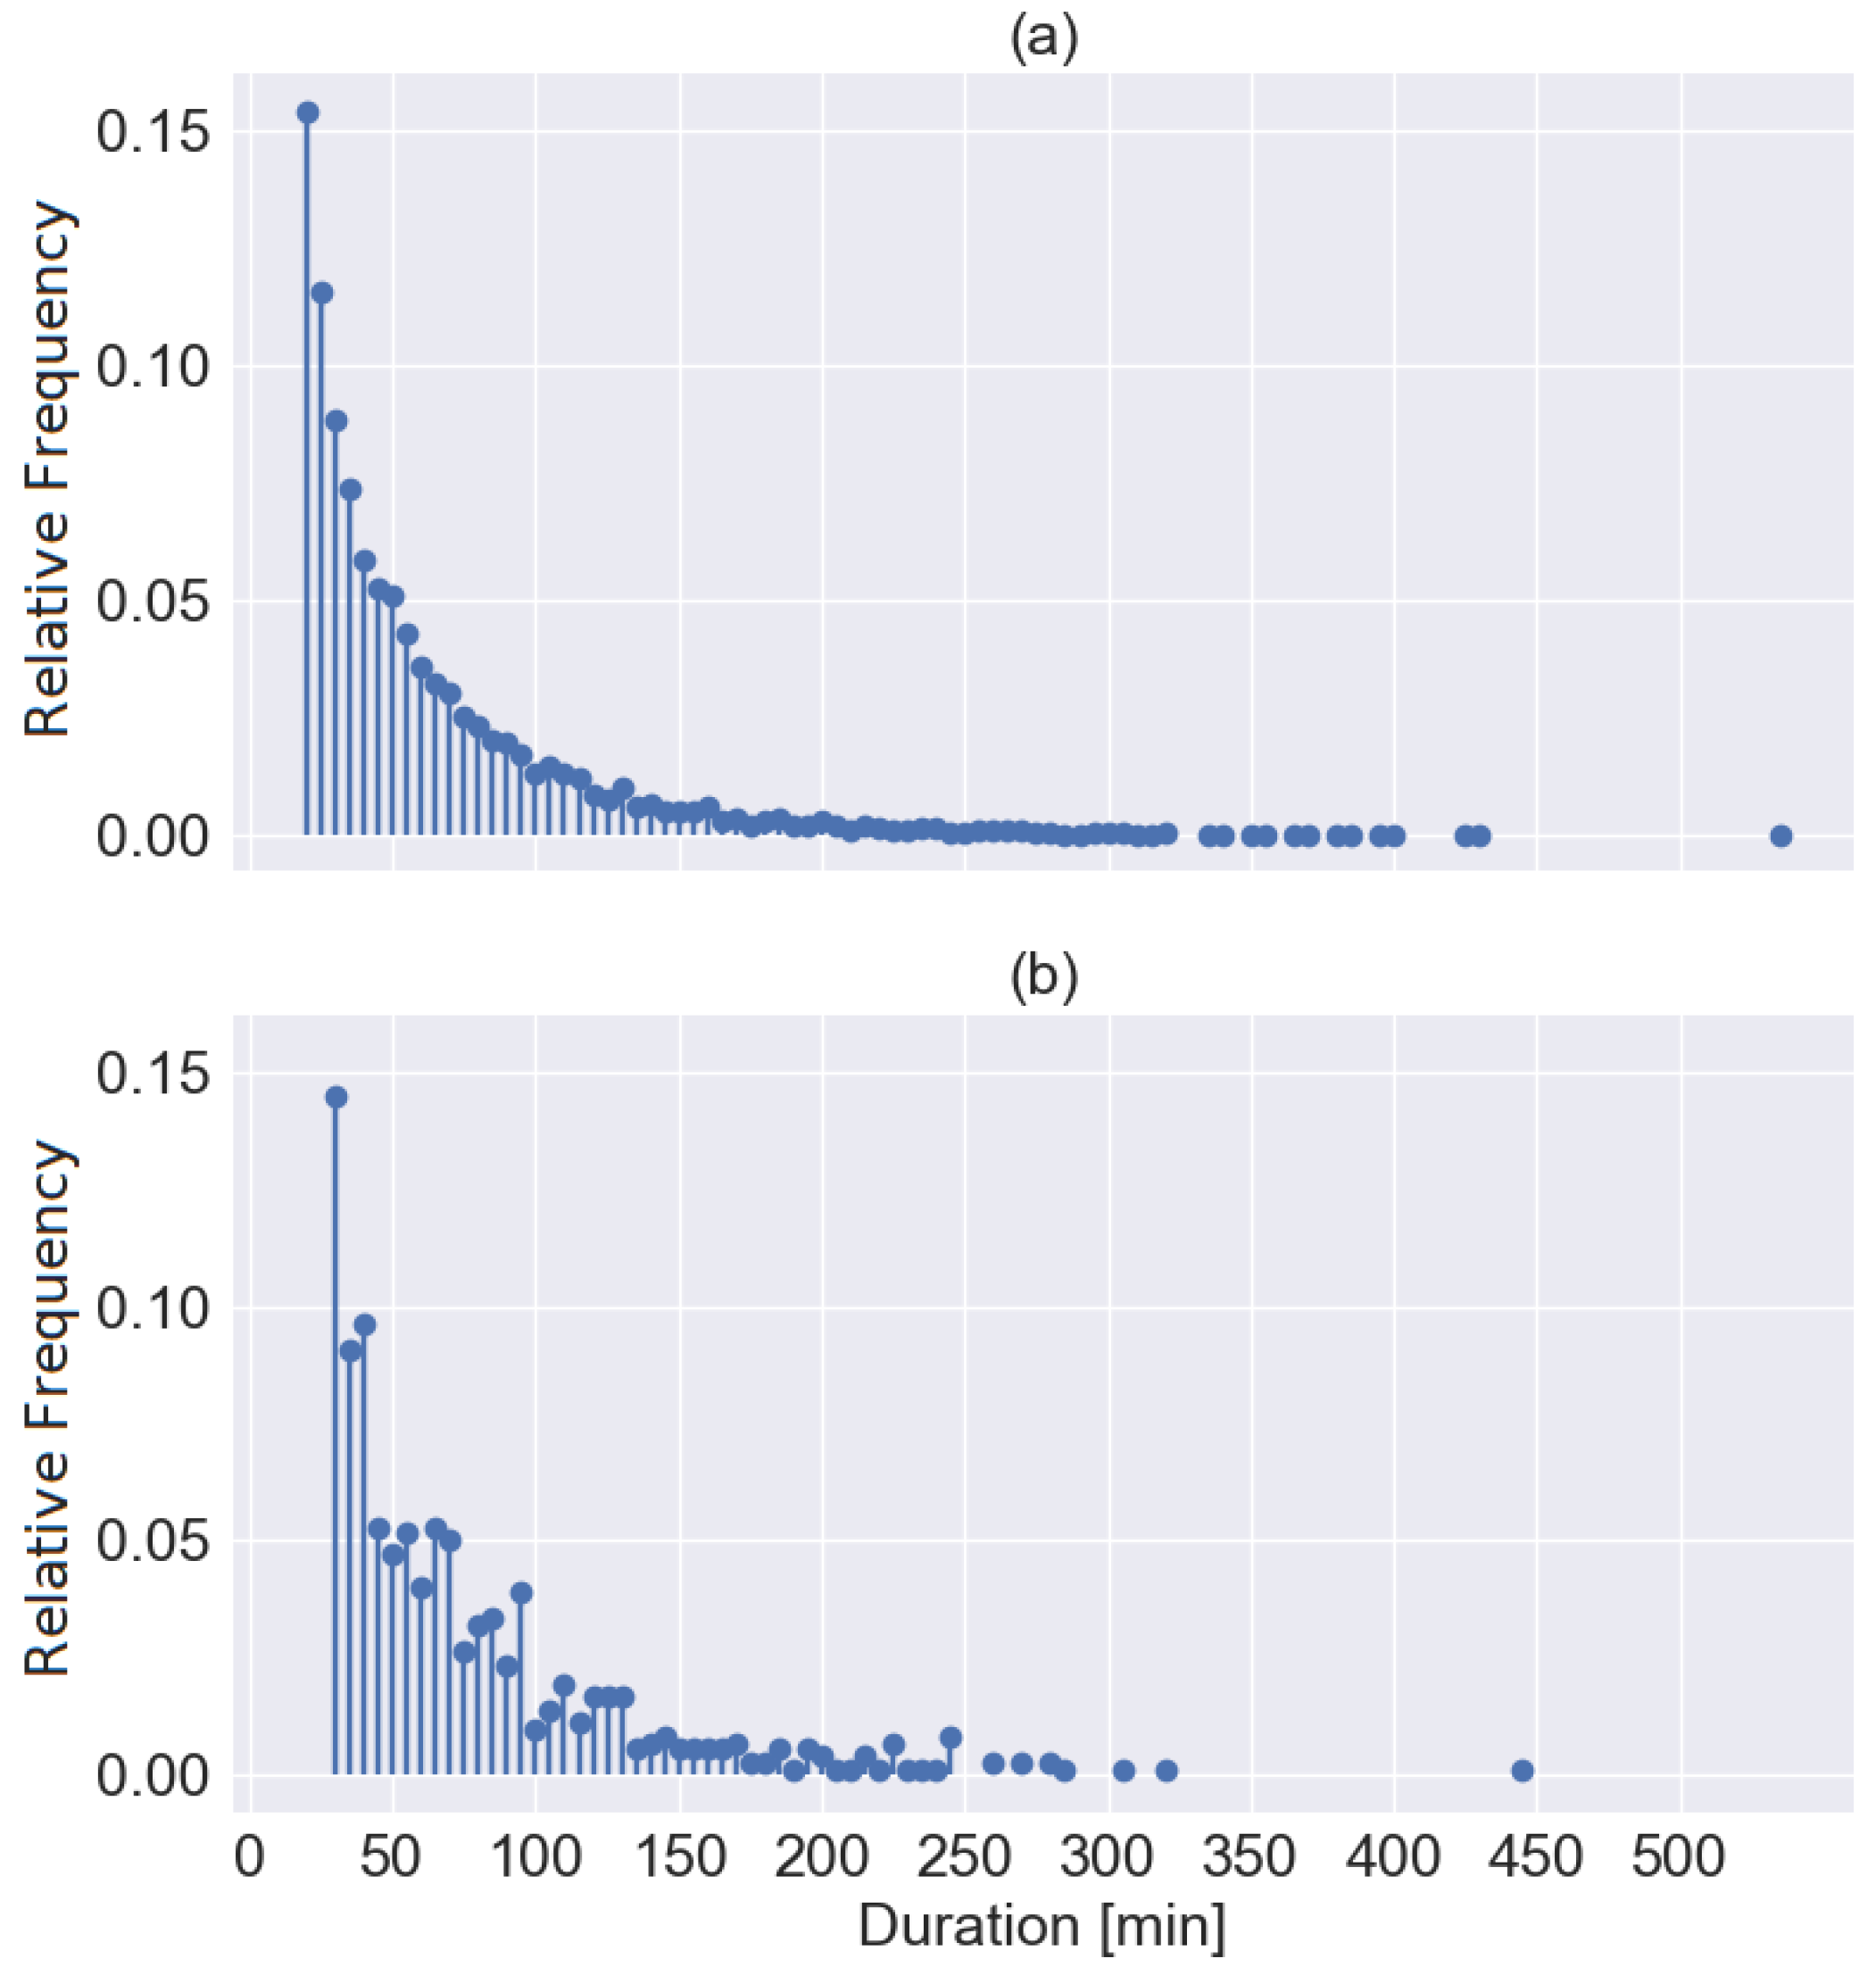
The dataset acquired by MeteoSwiss and employed in this paper spans nine years, consisting of 2010 data and from 2012 to 2019, corresponding to 9577 events affecting our study area. An essential feature of the storms is their duration, ranging from a minimum of 20 min to a maximum of 535 min. The average duration is 61 min, while the standard deviation is 49 min. Figure 2a shows the distribution of events’ duration between 2010 and 2018, while Figure 2b shows that of 2019.
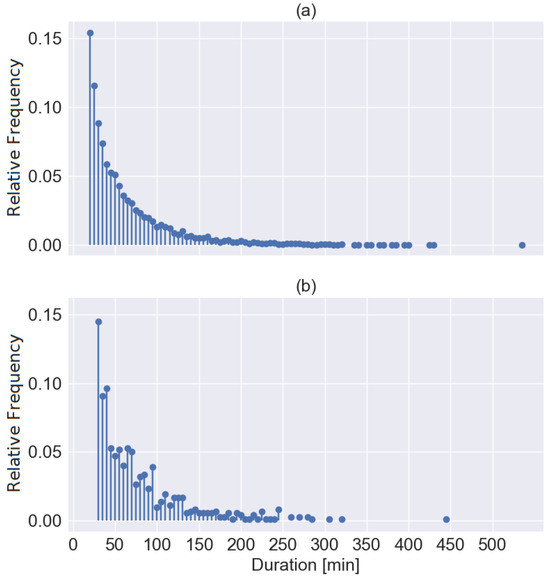
Figure 2.
Probability density function of storms’ duration: (a) years 2010 to 2018; (b) year 2019.
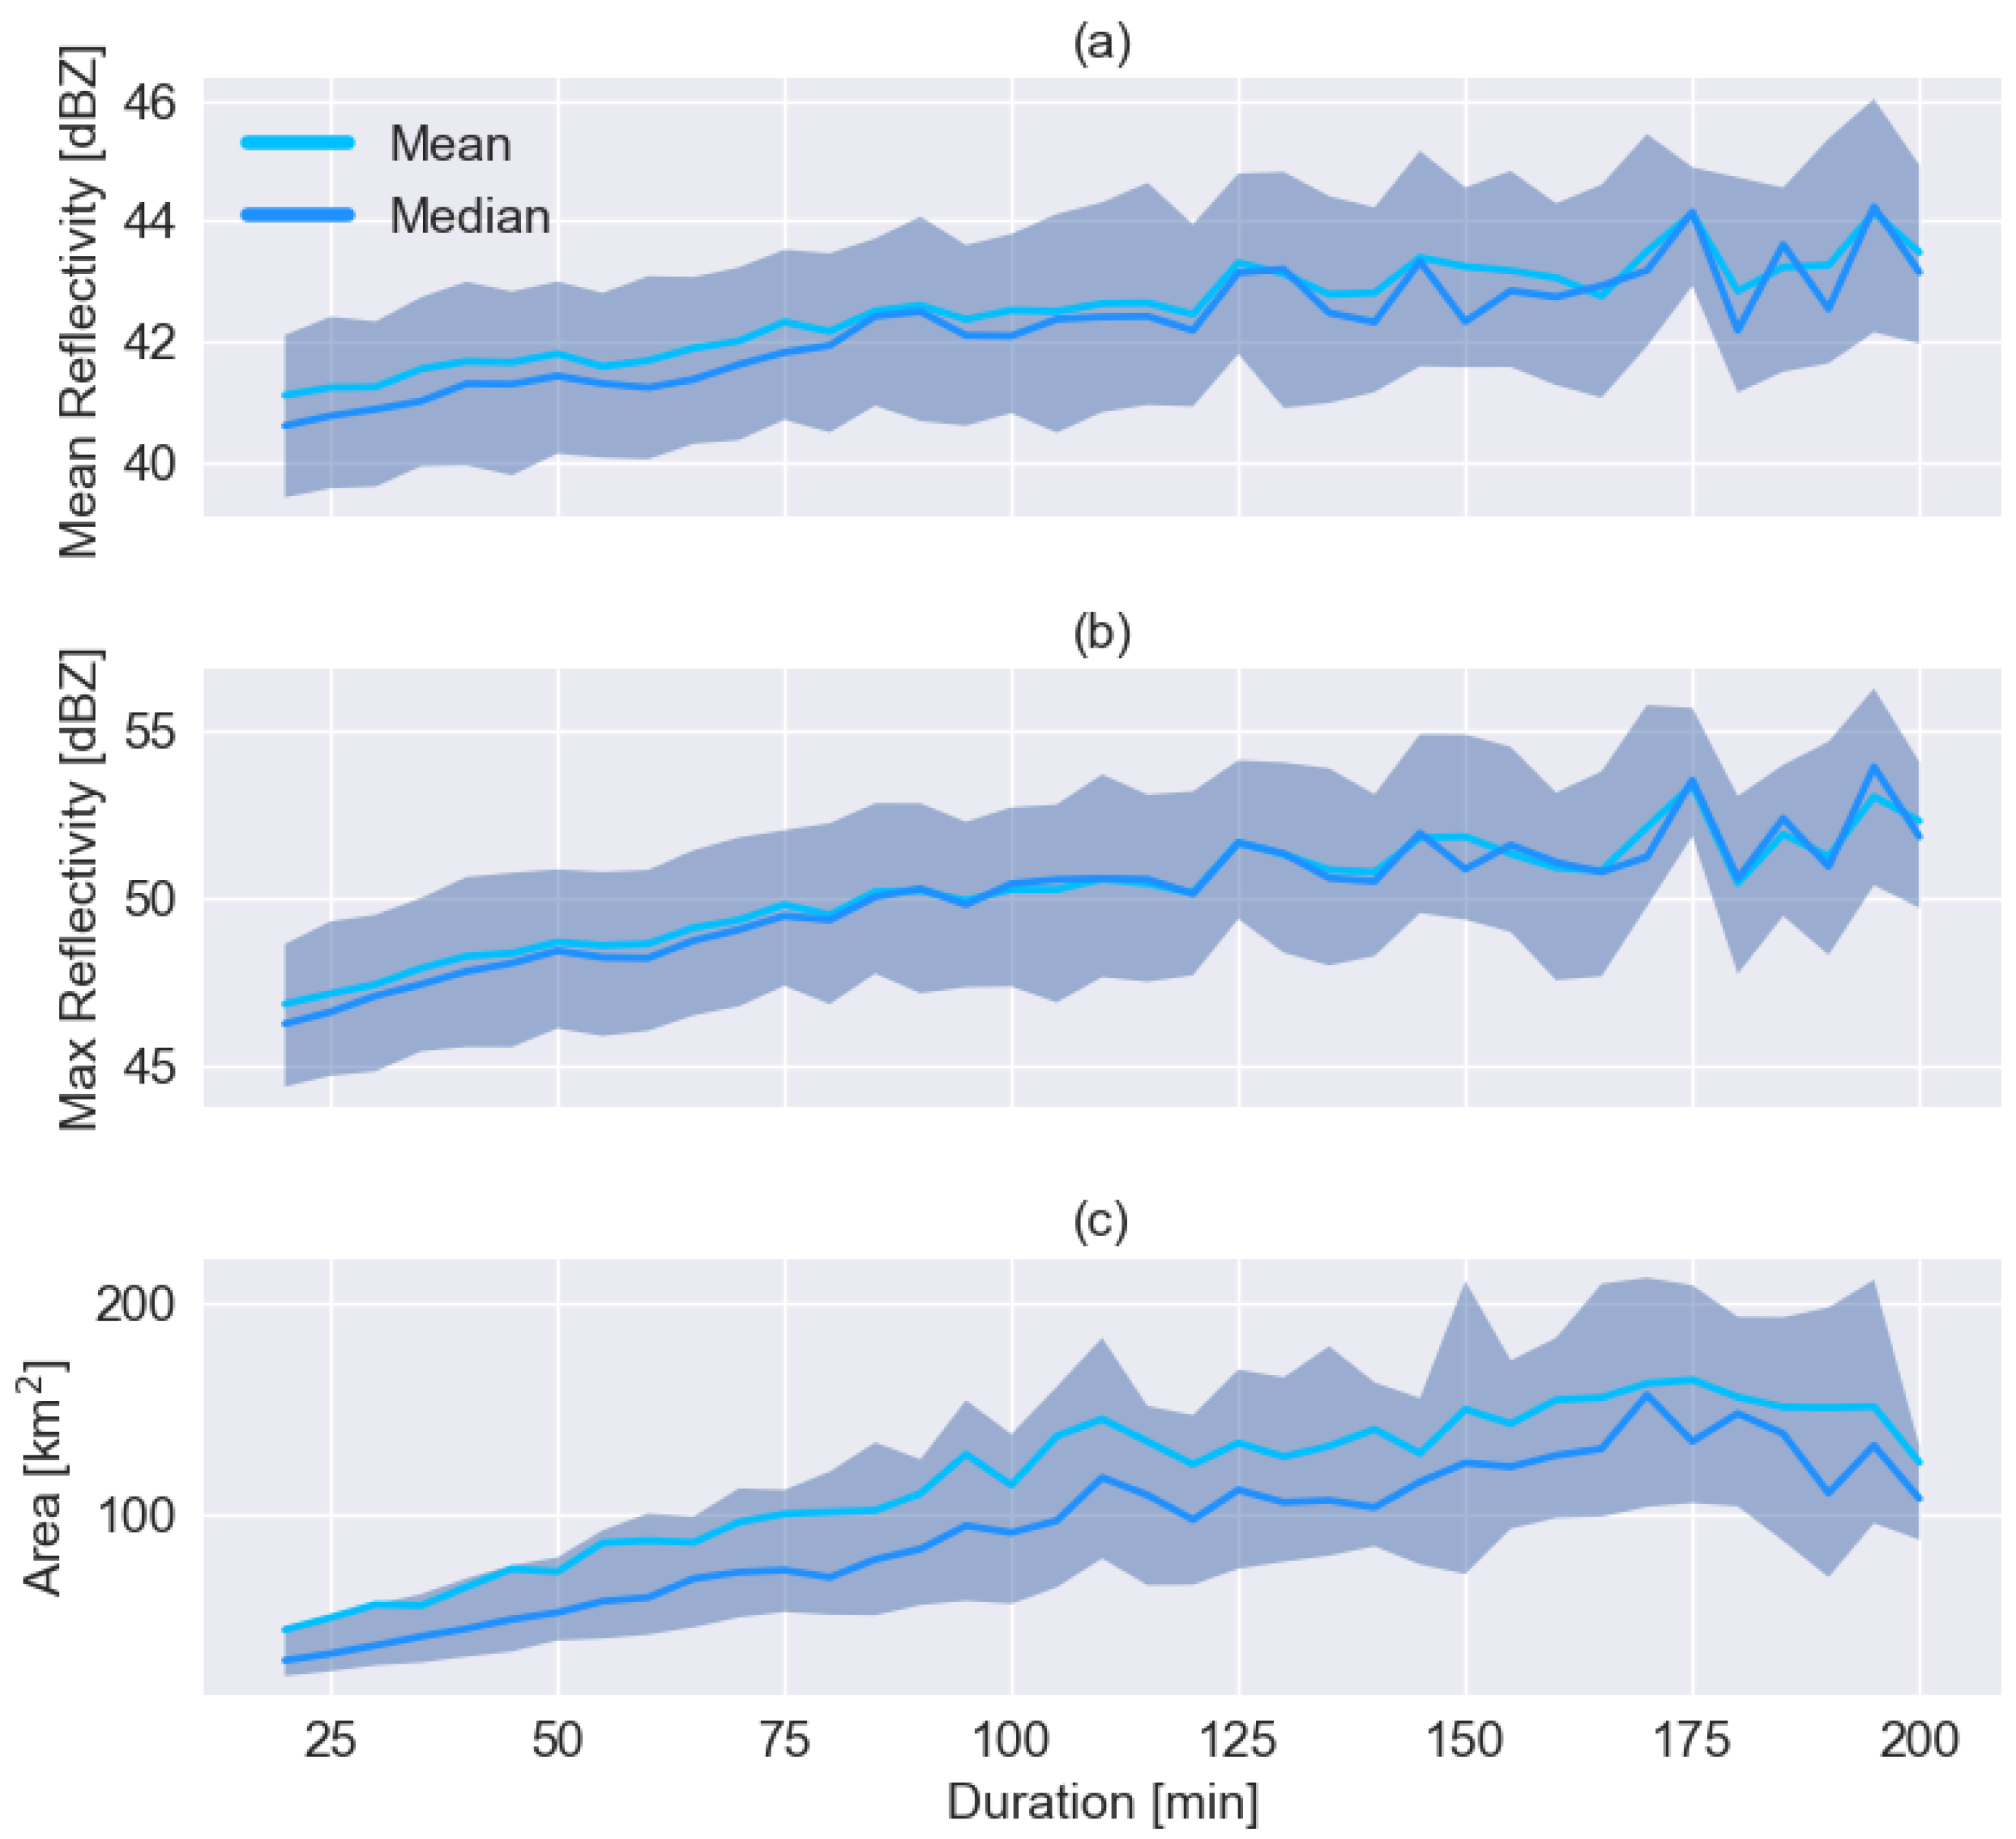
Figure 3a,b show the distribution of mean and maximum reflectivity and area as a function of the duration of the event. The analysis is limited to 20 to 200 min duration to guarantee the reliability of the results (95% of storms are included in this range). We can deduce interesting information and insights on the lifecycle of convective storms: longer episodes are usually associated with higher mean and max reflectivity (thus heavier precipitation), as noted by Davini et al. [44]. However, it also appears that the reflectivity variance is almost independent of the duration, which means that the precipitation may vary greatly, even for short episodes. The time-averaged area covered by the convective cell is wider for longer episodes, as shown in Figure 3c. The area’s variance increases with duration, too, and the distribution is asymmetric (see the difference between the median and mean values). Altogether, the ratio between the standard deviation and the average value, also known as the coefficient of variation (CV), shown in Table 1, is much more significant for the area than the other variables, indicating that forecasting its extension is generally more complex.
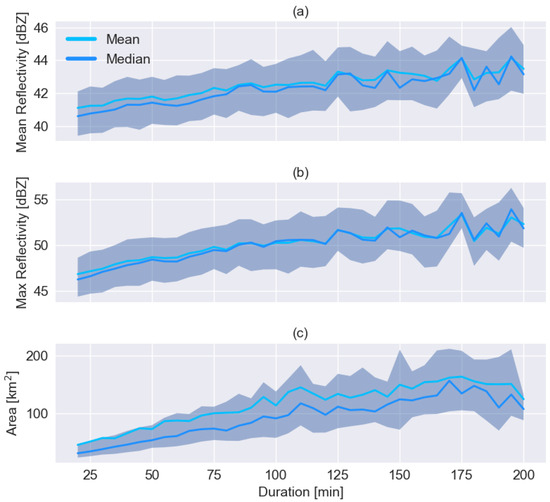
Figure 3.
Distribution of mean (a), and maximum (b) reflectivity, and the average thunderstorm area (c). The shaded area covers the interval between 0.25 and 0.75 quantiles. The continuous lines show the mean, in light blue, and median, in blue, of the considered variable.

Table 1.
Mean, standard deviation, and coefficient of variation of the dataset.
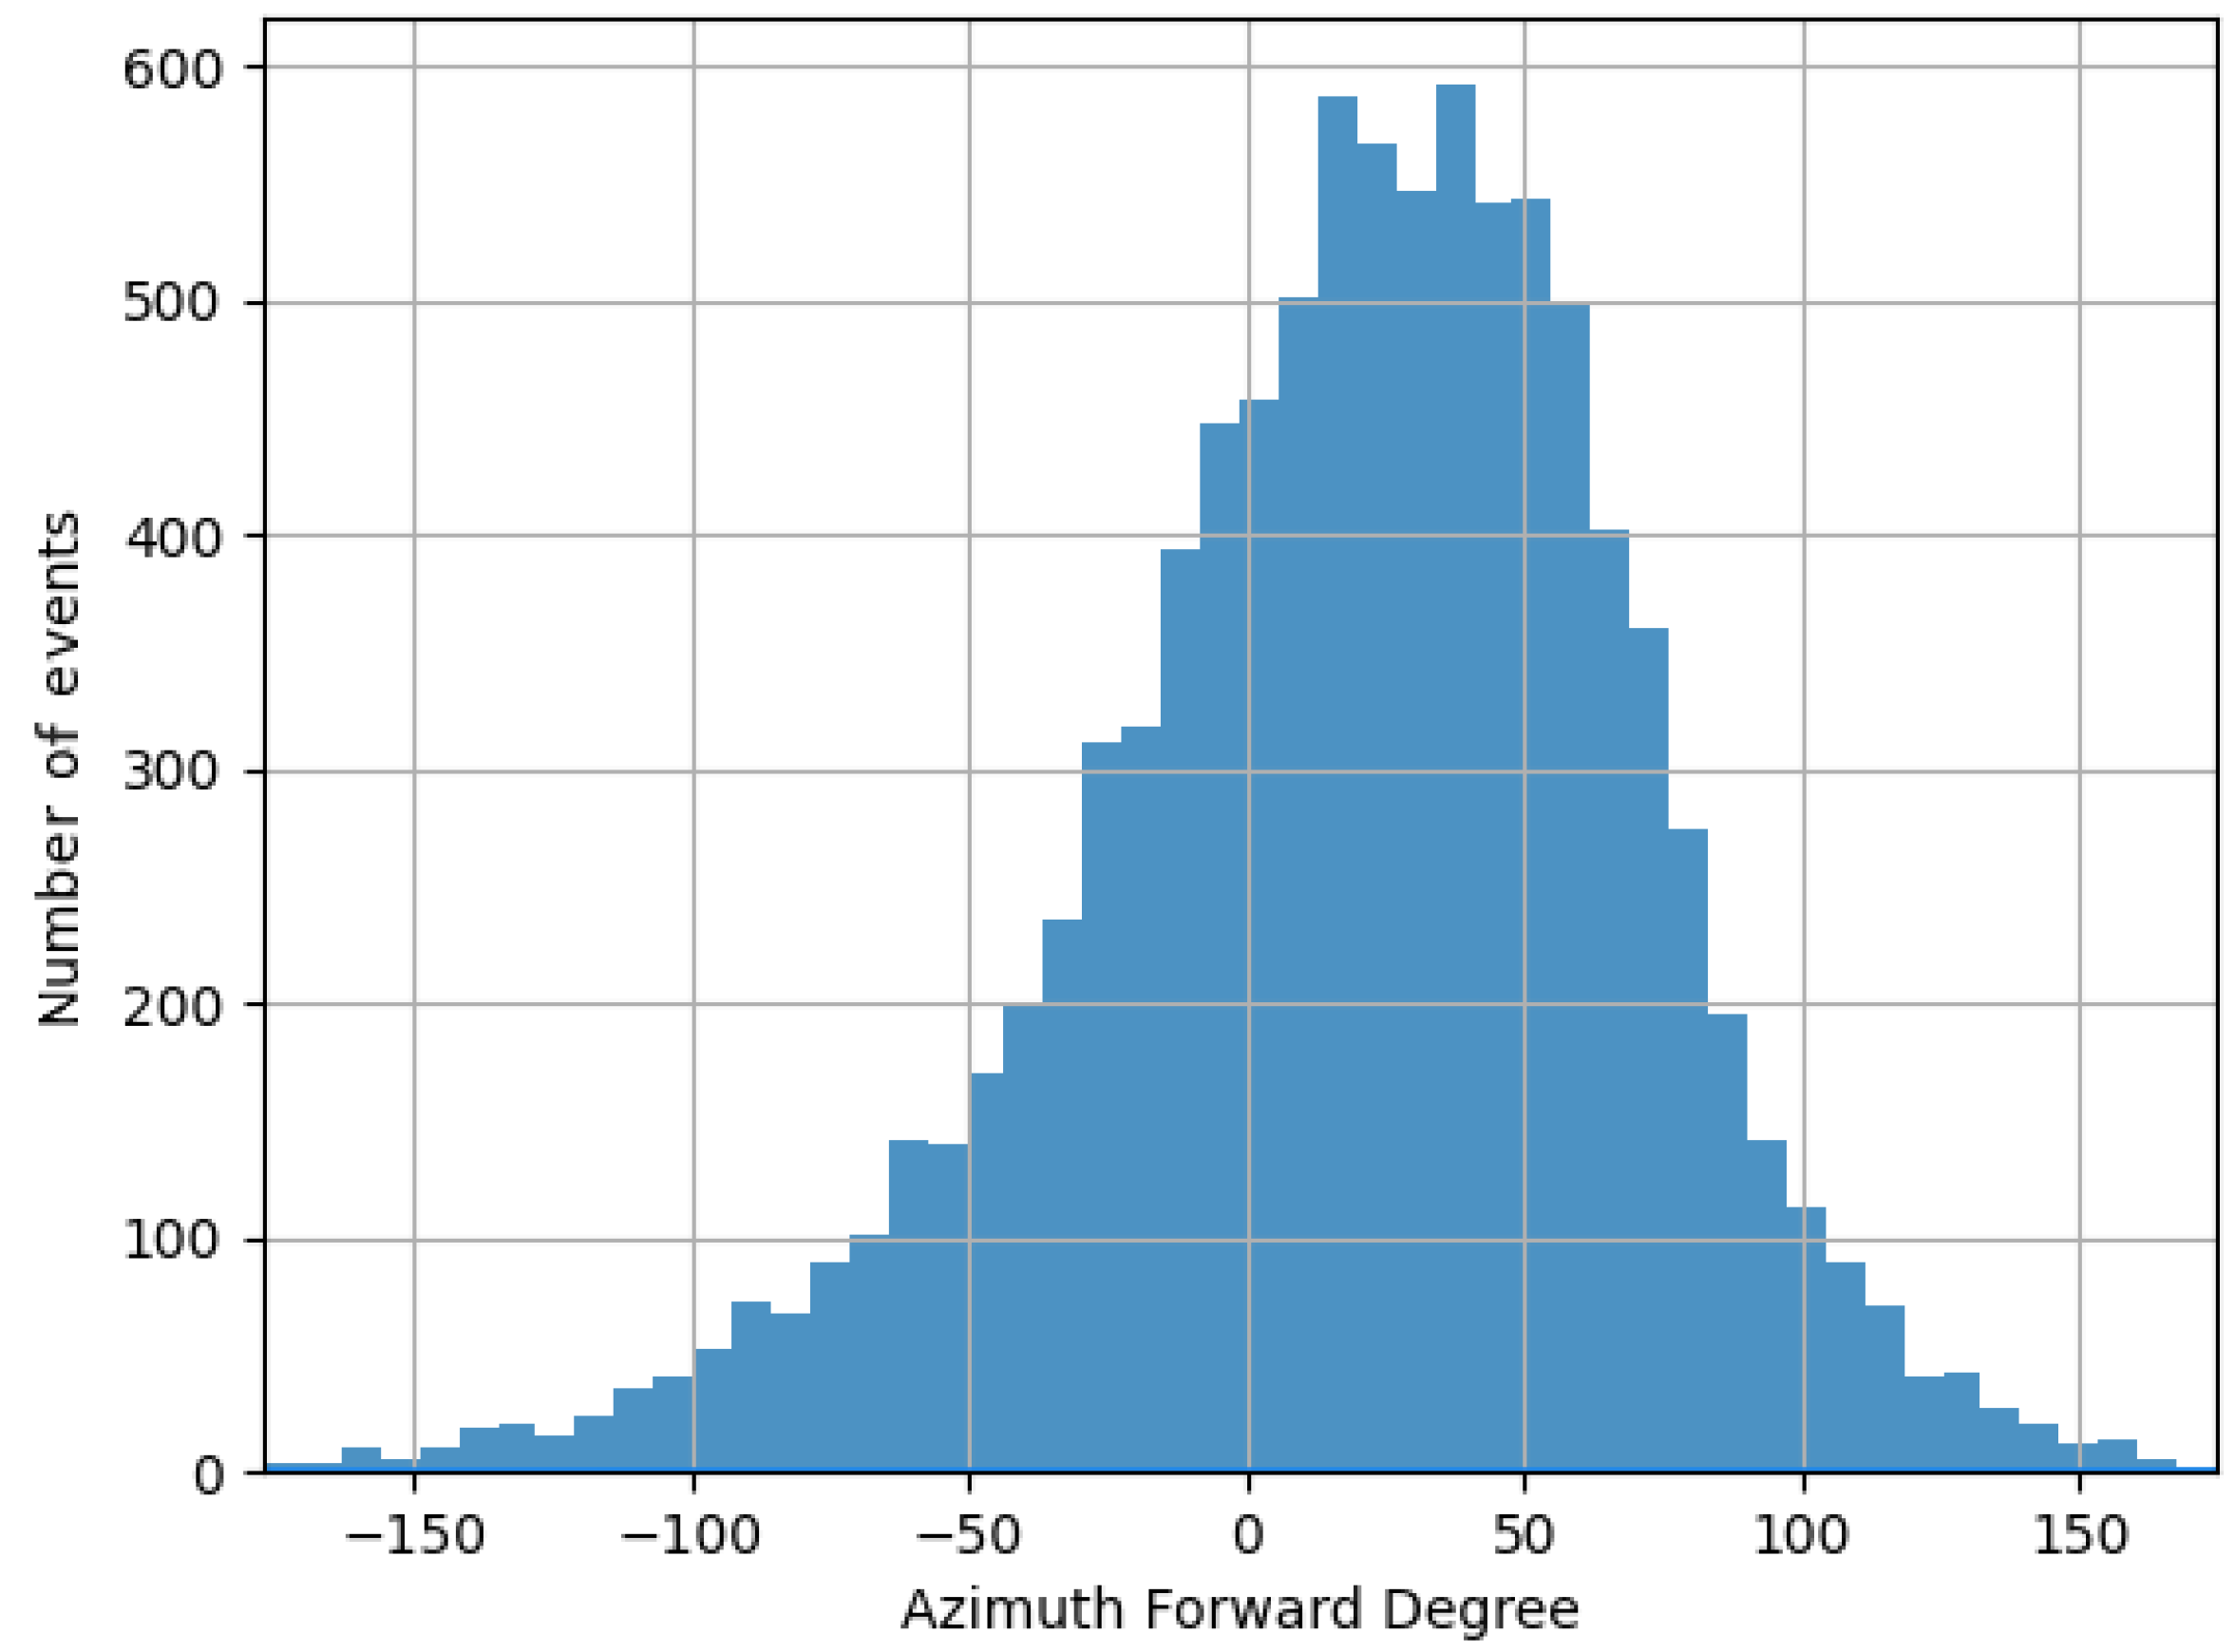
Another interesting feature is the storm’s direction. Figure 4 reports the distribution of the storms’ azimuth angles, i.e., the angles between the northward direction and the motion vector of the storms, measured clockwise. The distribution shows a predominant direction of the storms between 0 and 60 degrees, which is northeast, as noted in a previous study of this dataset [45]. Another verification of this pattern comes again from the analysis of Table 1. The longitude standard deviation is more significant than the latitude, meaning that the storms tend to move along a parallel rather than a meridian.
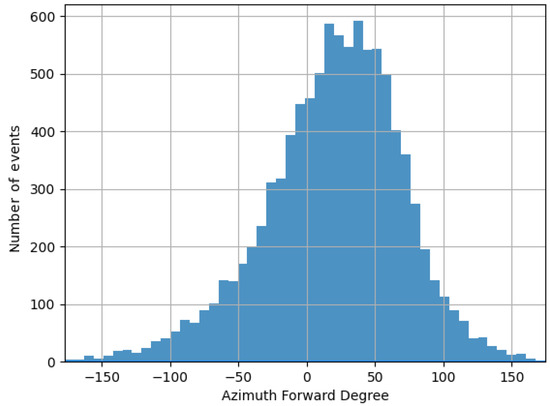
Figure 4.
Distribution of storms’ azimuth angle.
The strong relation between the reflectivity and the cells’ area and the frequency distributions of the direction and duration demonstrate that the phenomenon has some characteristic traits. These traits are determined by the orography of the region and its thermal patterns and facilitate the forecast of the cells’ evolution over limited horizons, like an hour. Thus, knowing the initial speed of change of position and dimension, a model should be able to extrapolate the following evolution with remarkable accuracy.
2.3. Neural Predictive Model
We adopted a feed-forward neural network (FFNN), given the high process variability and the lack of long-term effects, for which a recurrent architecture such as a long short-term memory network would have been preferable. However, FFNNs have been proven appropriate for several forecasting applications [46,47]. The neural model was programmed in Python using the Keras library, a high-level API for TensorFlow.
The time-series forecasting task is inherently dynamic because the variable to predict can be seen as the output of a dynamic system. FFNNs are static models that can arbitrarily reproduce complex mapping from the input to the output space. However, static models can be adapted to deal with dynamic tasks in different ways [48,49,50]. We adopted a multi-output approach; hence, we constructed a model predicting all the variables at every step of the considered forecasting horizon, combining a multi-step and a multi-variable approach. The goal is to predict the output variables 60 min ahead, with a time step of 5 min.
We used two lag observations as inputs to the model. As discussed above, this minimum number provides sufficient information about the convective cell’s current trajectory and the phenomenon’s current dynamic (i.e., whether the reflectivity or area is increasing or decreasing). A higher number of lag observations did not improve the model much and was considered less valuable in practice because it is essential to begin predicting as early as possible. Convective storms are, in fact, rapidly evolving phenomena.
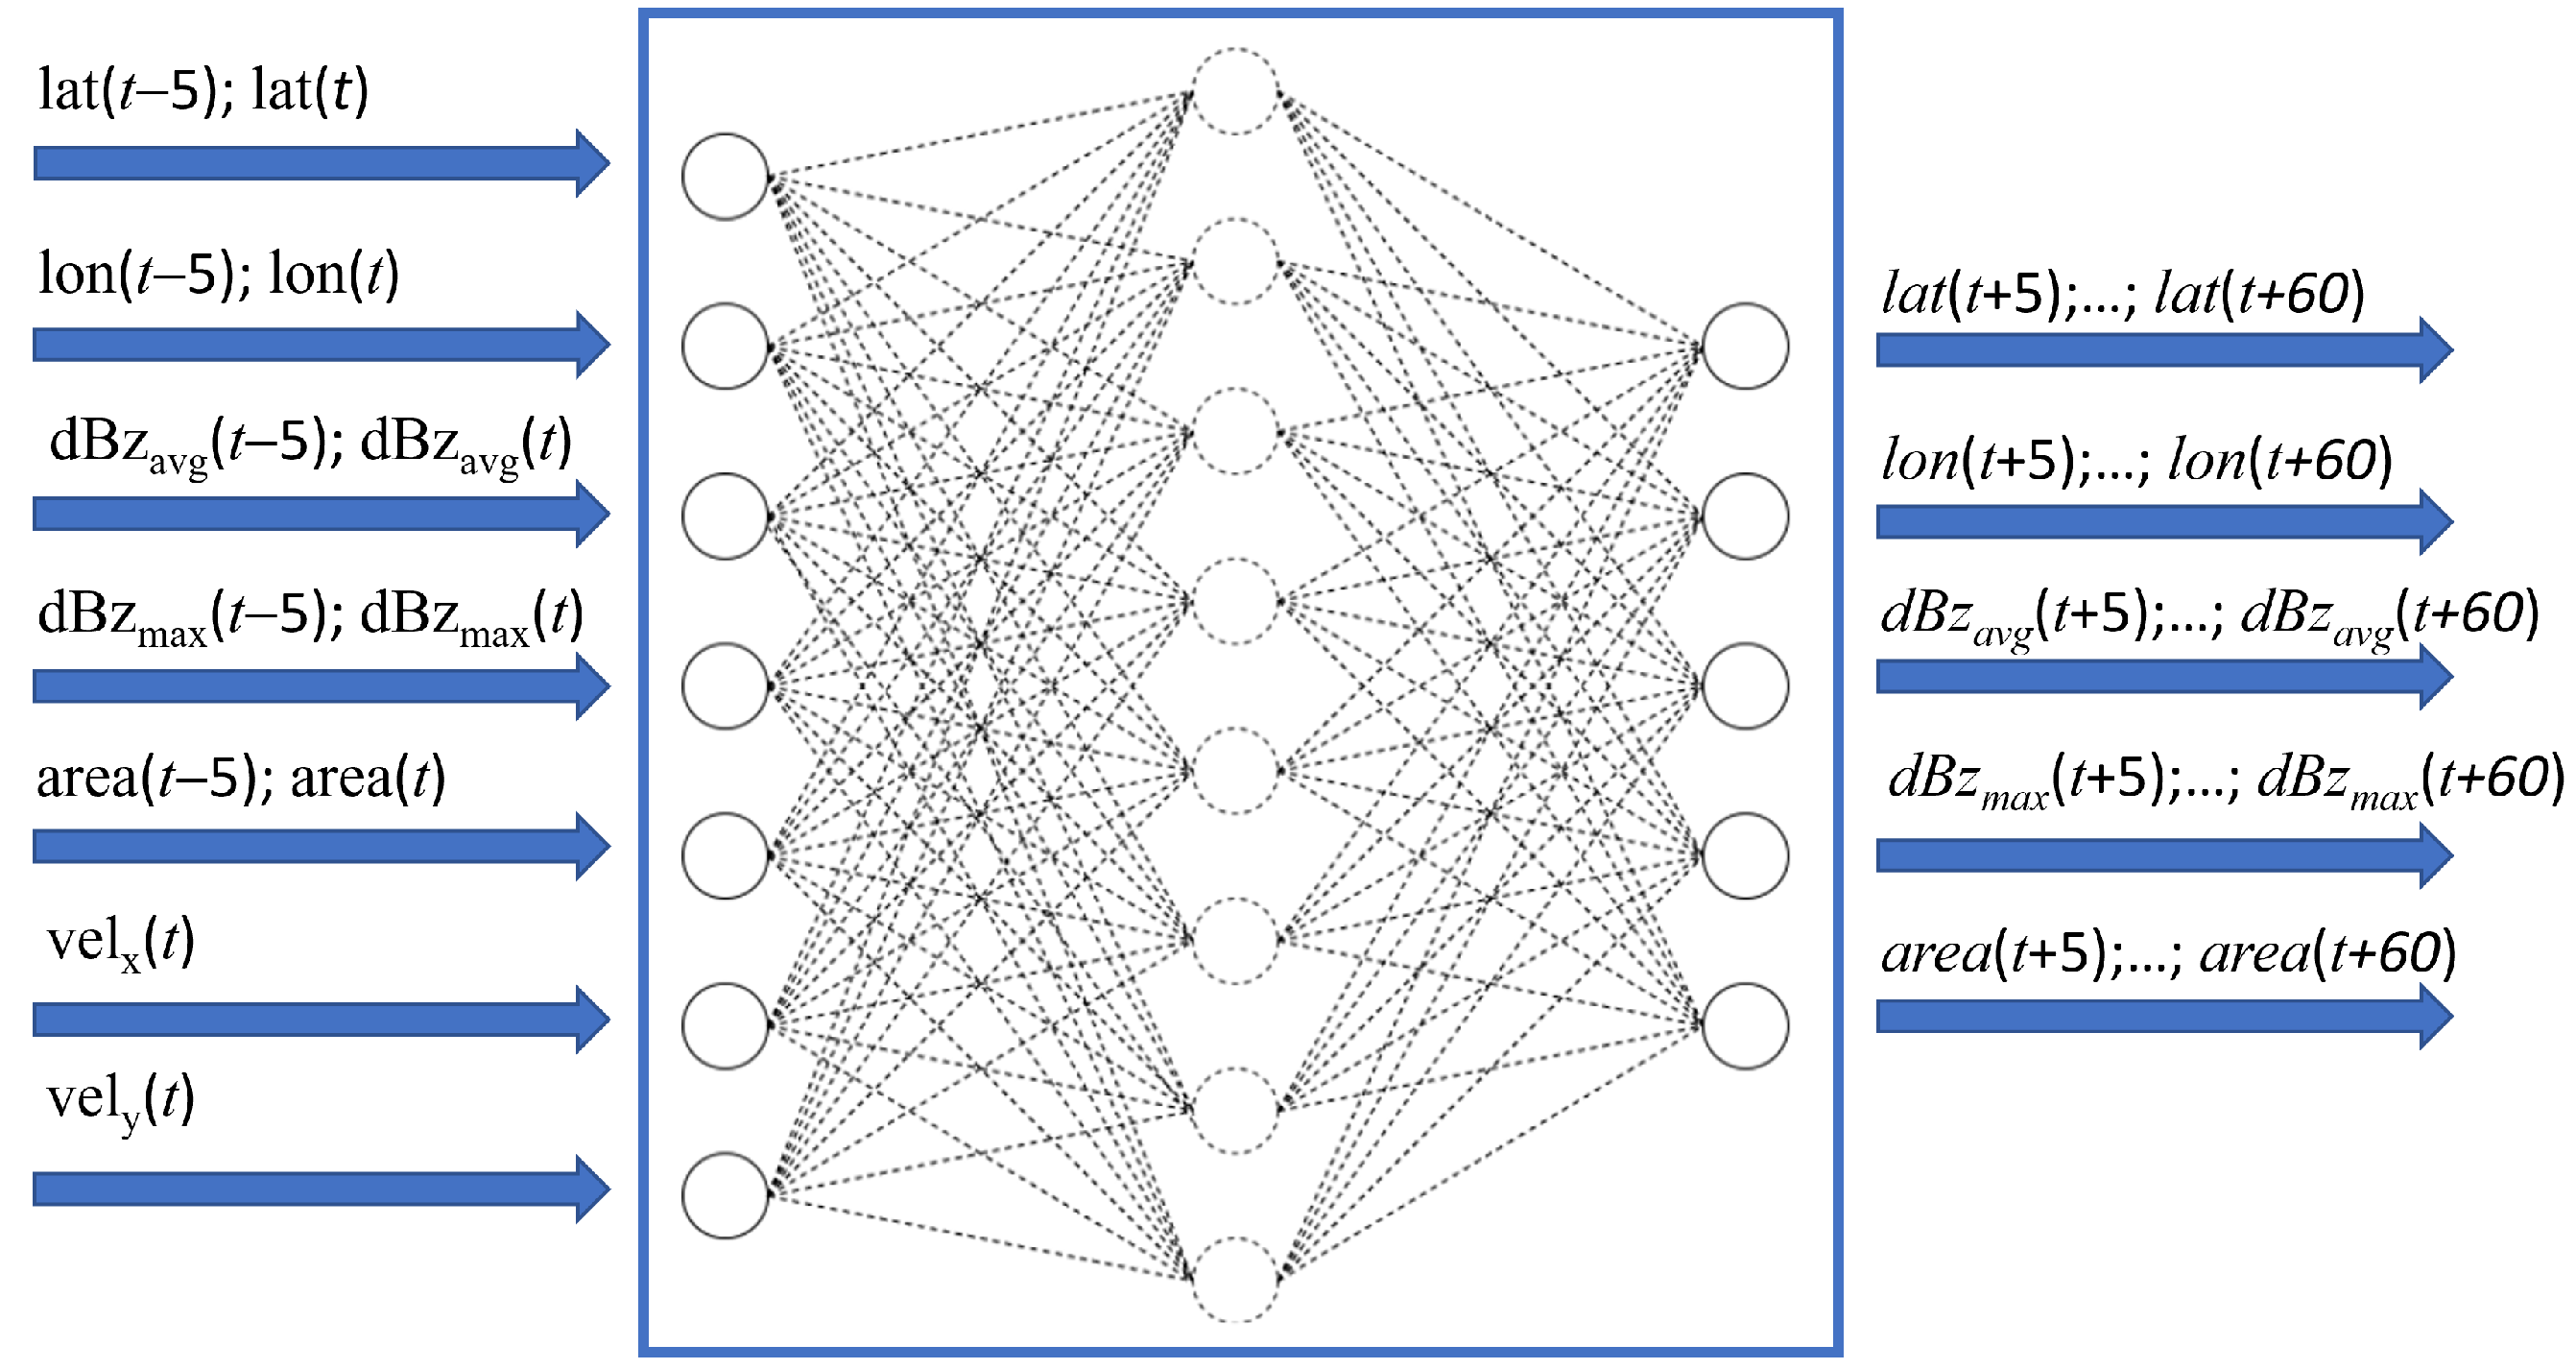
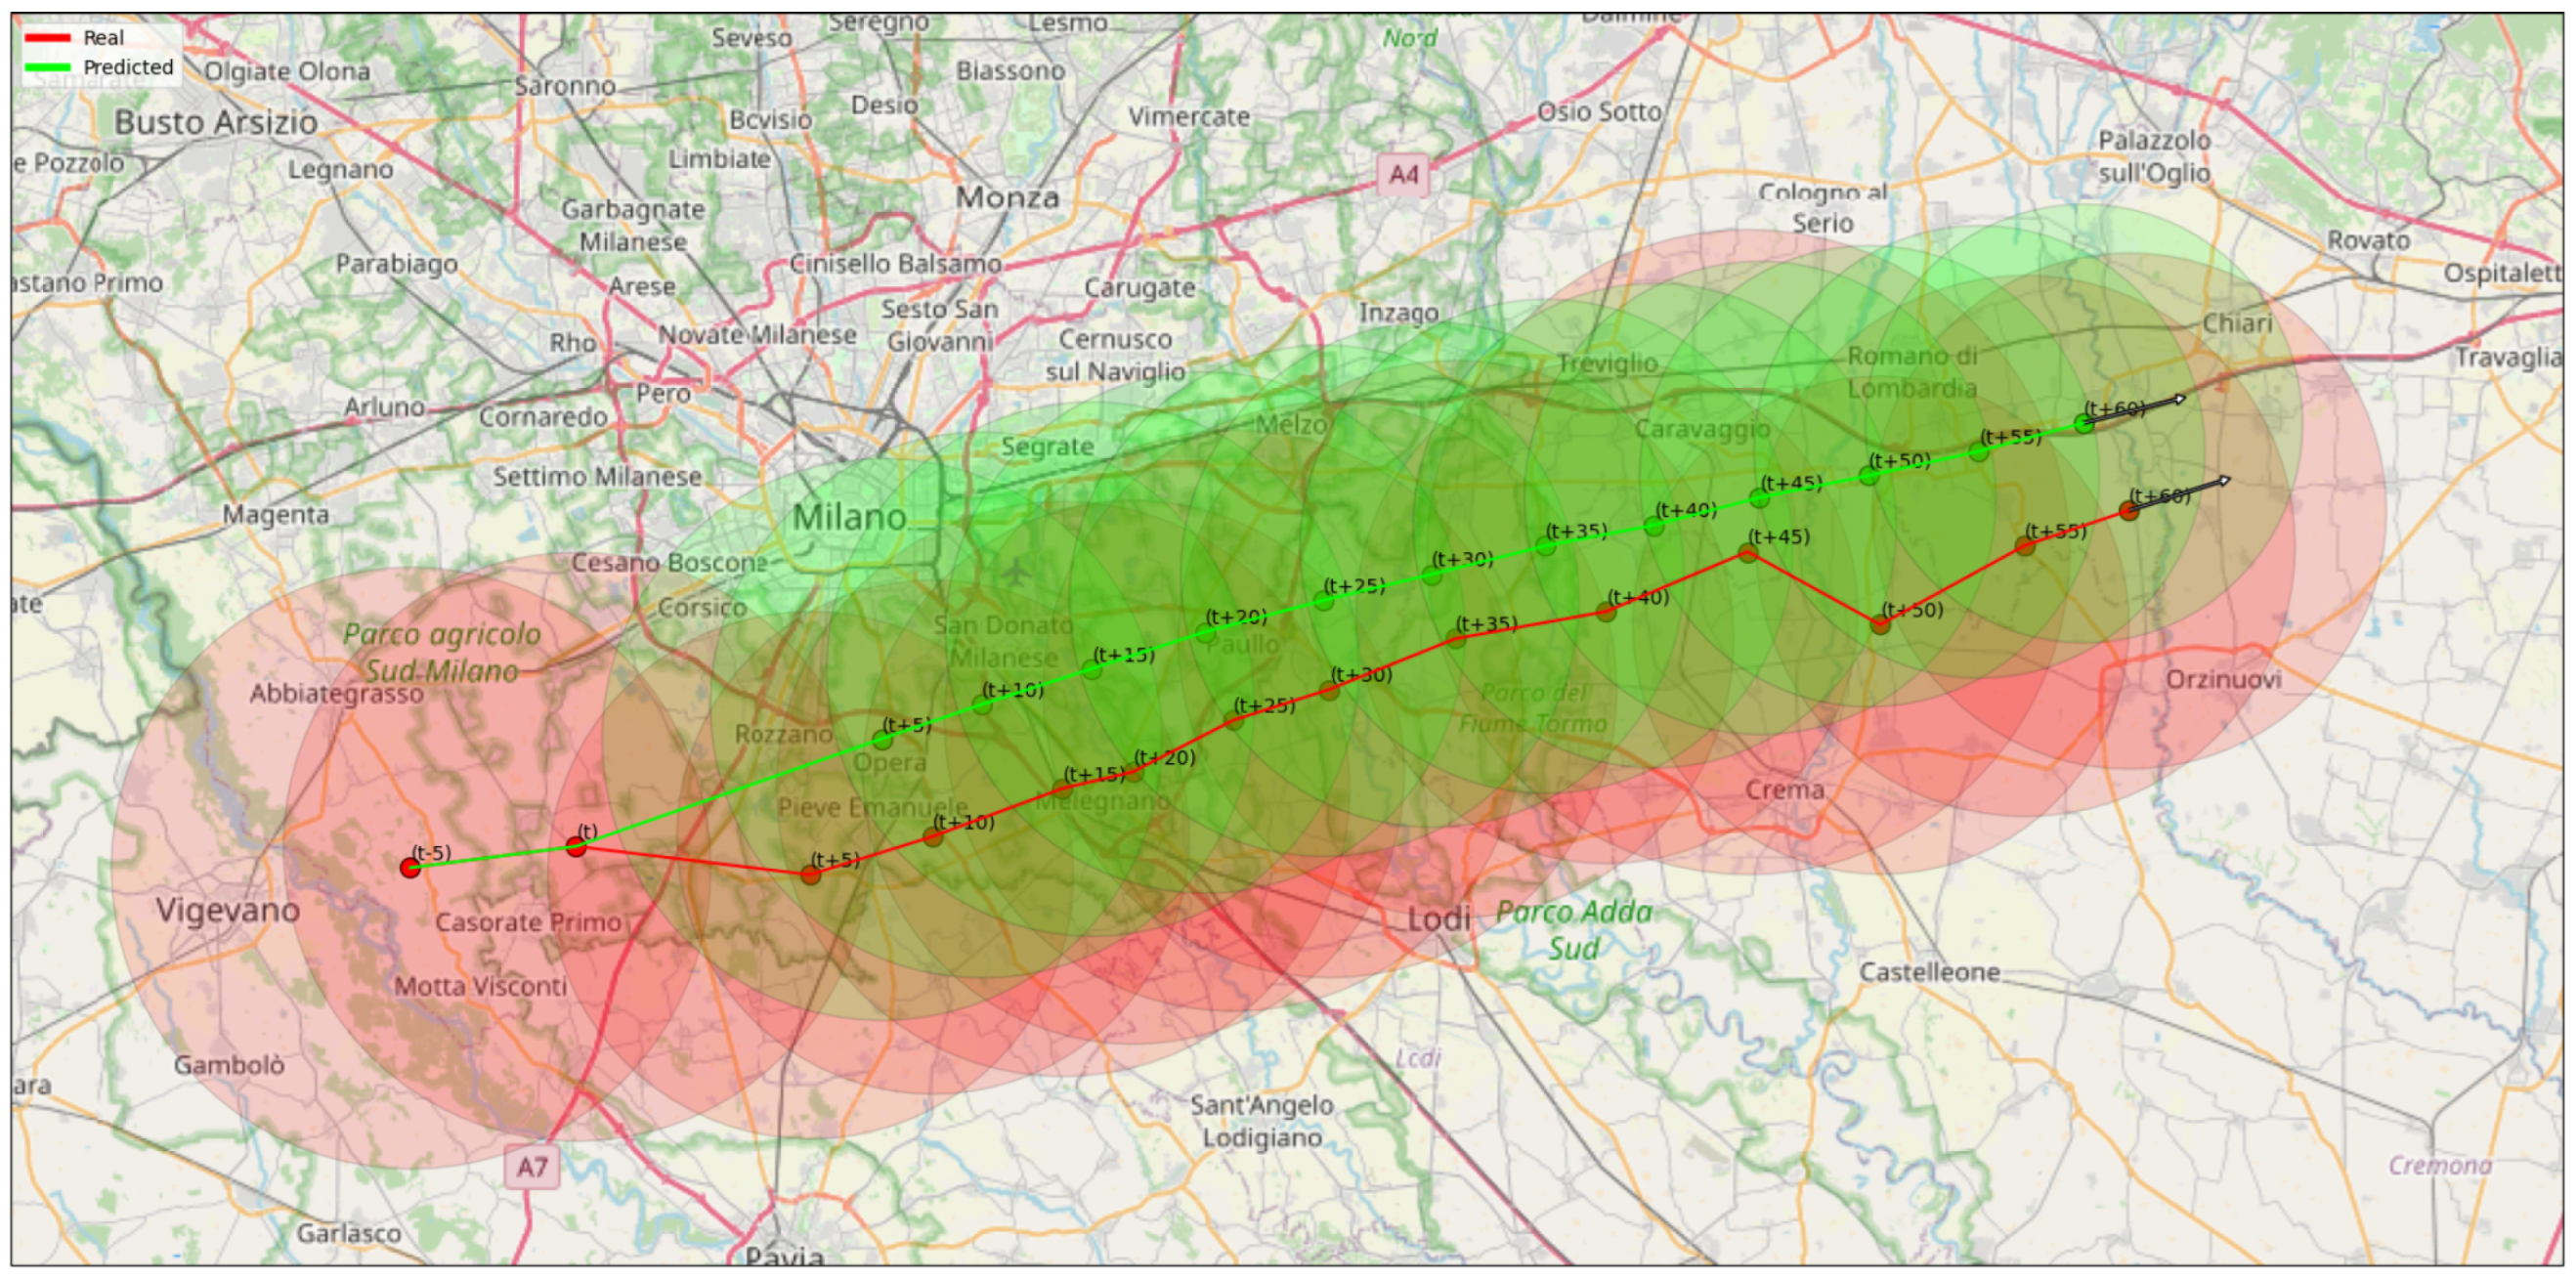
Figure 5 shows the input-output structure of the FFNN, while Figure 6 illustrates an example of trajectory prediction. At each time step, the storm features are forecasted for 5 to 60 min ahead, taking as input the current information (latitude and longitude of the cell center, average and maximum reflectivity, area, and the two horizontal components of the velocity vector) and that relative to the previous five minutes. In the figure, the actual trajectory of the convective cell is shown in red, and the predicted one in green. The dots indicate the position of the cell centroid. The area of each circle is proportional to the cell dimension and the color intensity to the average reflectivity.
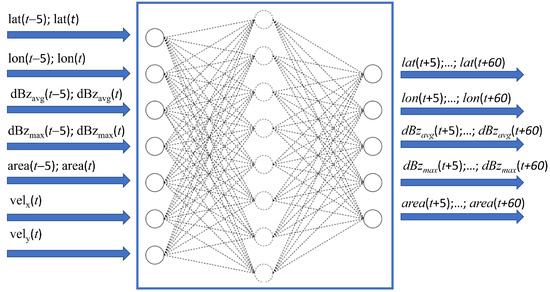
Figure 5.
Input-output structure of the neural network.
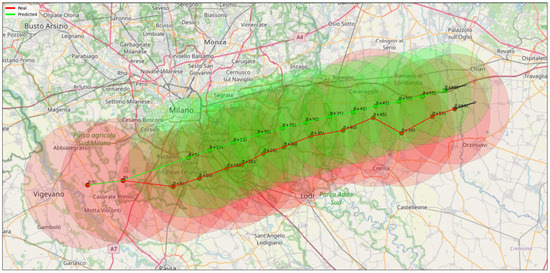
Figure 6.
Actual trajectory of a convective cell (red) and corresponding model’s predictions (green) taking two time steps (i.e., and t) as input and generating twelve time steps ahead (from to ). The dots indicate the position of the cell centroid. The area of each circle is proportional to the cell dimension and the color intensity to the average reflectivity.
Given two time steps as input and twelve steps as output, we consider only storms lasting at least 70 min for the model identification phase. Thus, we use only 37.2% of the thunderstorms in the dataset (which, nevertheless, means more than 3500 episodes). Finally, the remaining events will be used for assessing the accuracy of the neural predictor, which can be applied to events of any duration.
As customary for a regression task, we used the mean square error (MSE) as a loss function to train the network. This metric considers all five output variables for the entire prediction horizon, i.e., 12 time steps. Therefore, the metrics are weighted on 60 values (5 variables times 12 time steps). In addition, early stopping, which terminates the training when the monitored metric does not improve, was employed to avoid overfitting the training data. Before passing the data to the model, the identification dataset is normalized and split into training (2010 and 2012–2016), validation (2017–2018), and test set (2019). Figure 2 shows no change in the distribution of events’ duration; therefore, using 2019 as the test dataset is a coherent choice.
We implemented a traditional exhaustive search of the hyperparameter space to find the best combination (considering the validation set) among the following values:
- number of hidden layers = {1, 2};
- number of nodes = {8, 16, 32};
- optimization algorithm = {adam, AdaGrad, RMSProp};
- learning rate = {0.0001, 0.001, 0.01, 0.1};
- activation function = {ReLU, sigmoid};
- batch size = {32, 64, 128}.
The best combination of hyperparameters turned out to be a single hidden layer of 32 nodes with a sigmoid activation function, a learning rate equal to 0.001, a batch size of 32, and Adam as the optimizer. However, many other combinations of values performed very similarly, certifying the convergence and stability of the optimization process. For each combination of the hyperparameters, models were trained for at most 800 epochs (unless prevented by the early stopping procedure).
We adopted two metrics to evaluate the model on the test data: the score, a relative metric derived from the MSE, and the mean absolute error (MAE), as it is common practice in regression problems [5,37,51].
3. Results
3.1. Model Performance
Besides testing the neural network on the performance metrics presented above, the FFNN is compared with “persistence” as a benchmark [52,53,54,55,56,57,58,59]. The persistent model assumes the phenomenon maintains its characteristics, which means the velocity vector, the average and maximum reflectivity, and the area at time t remain constant for the following steps until .
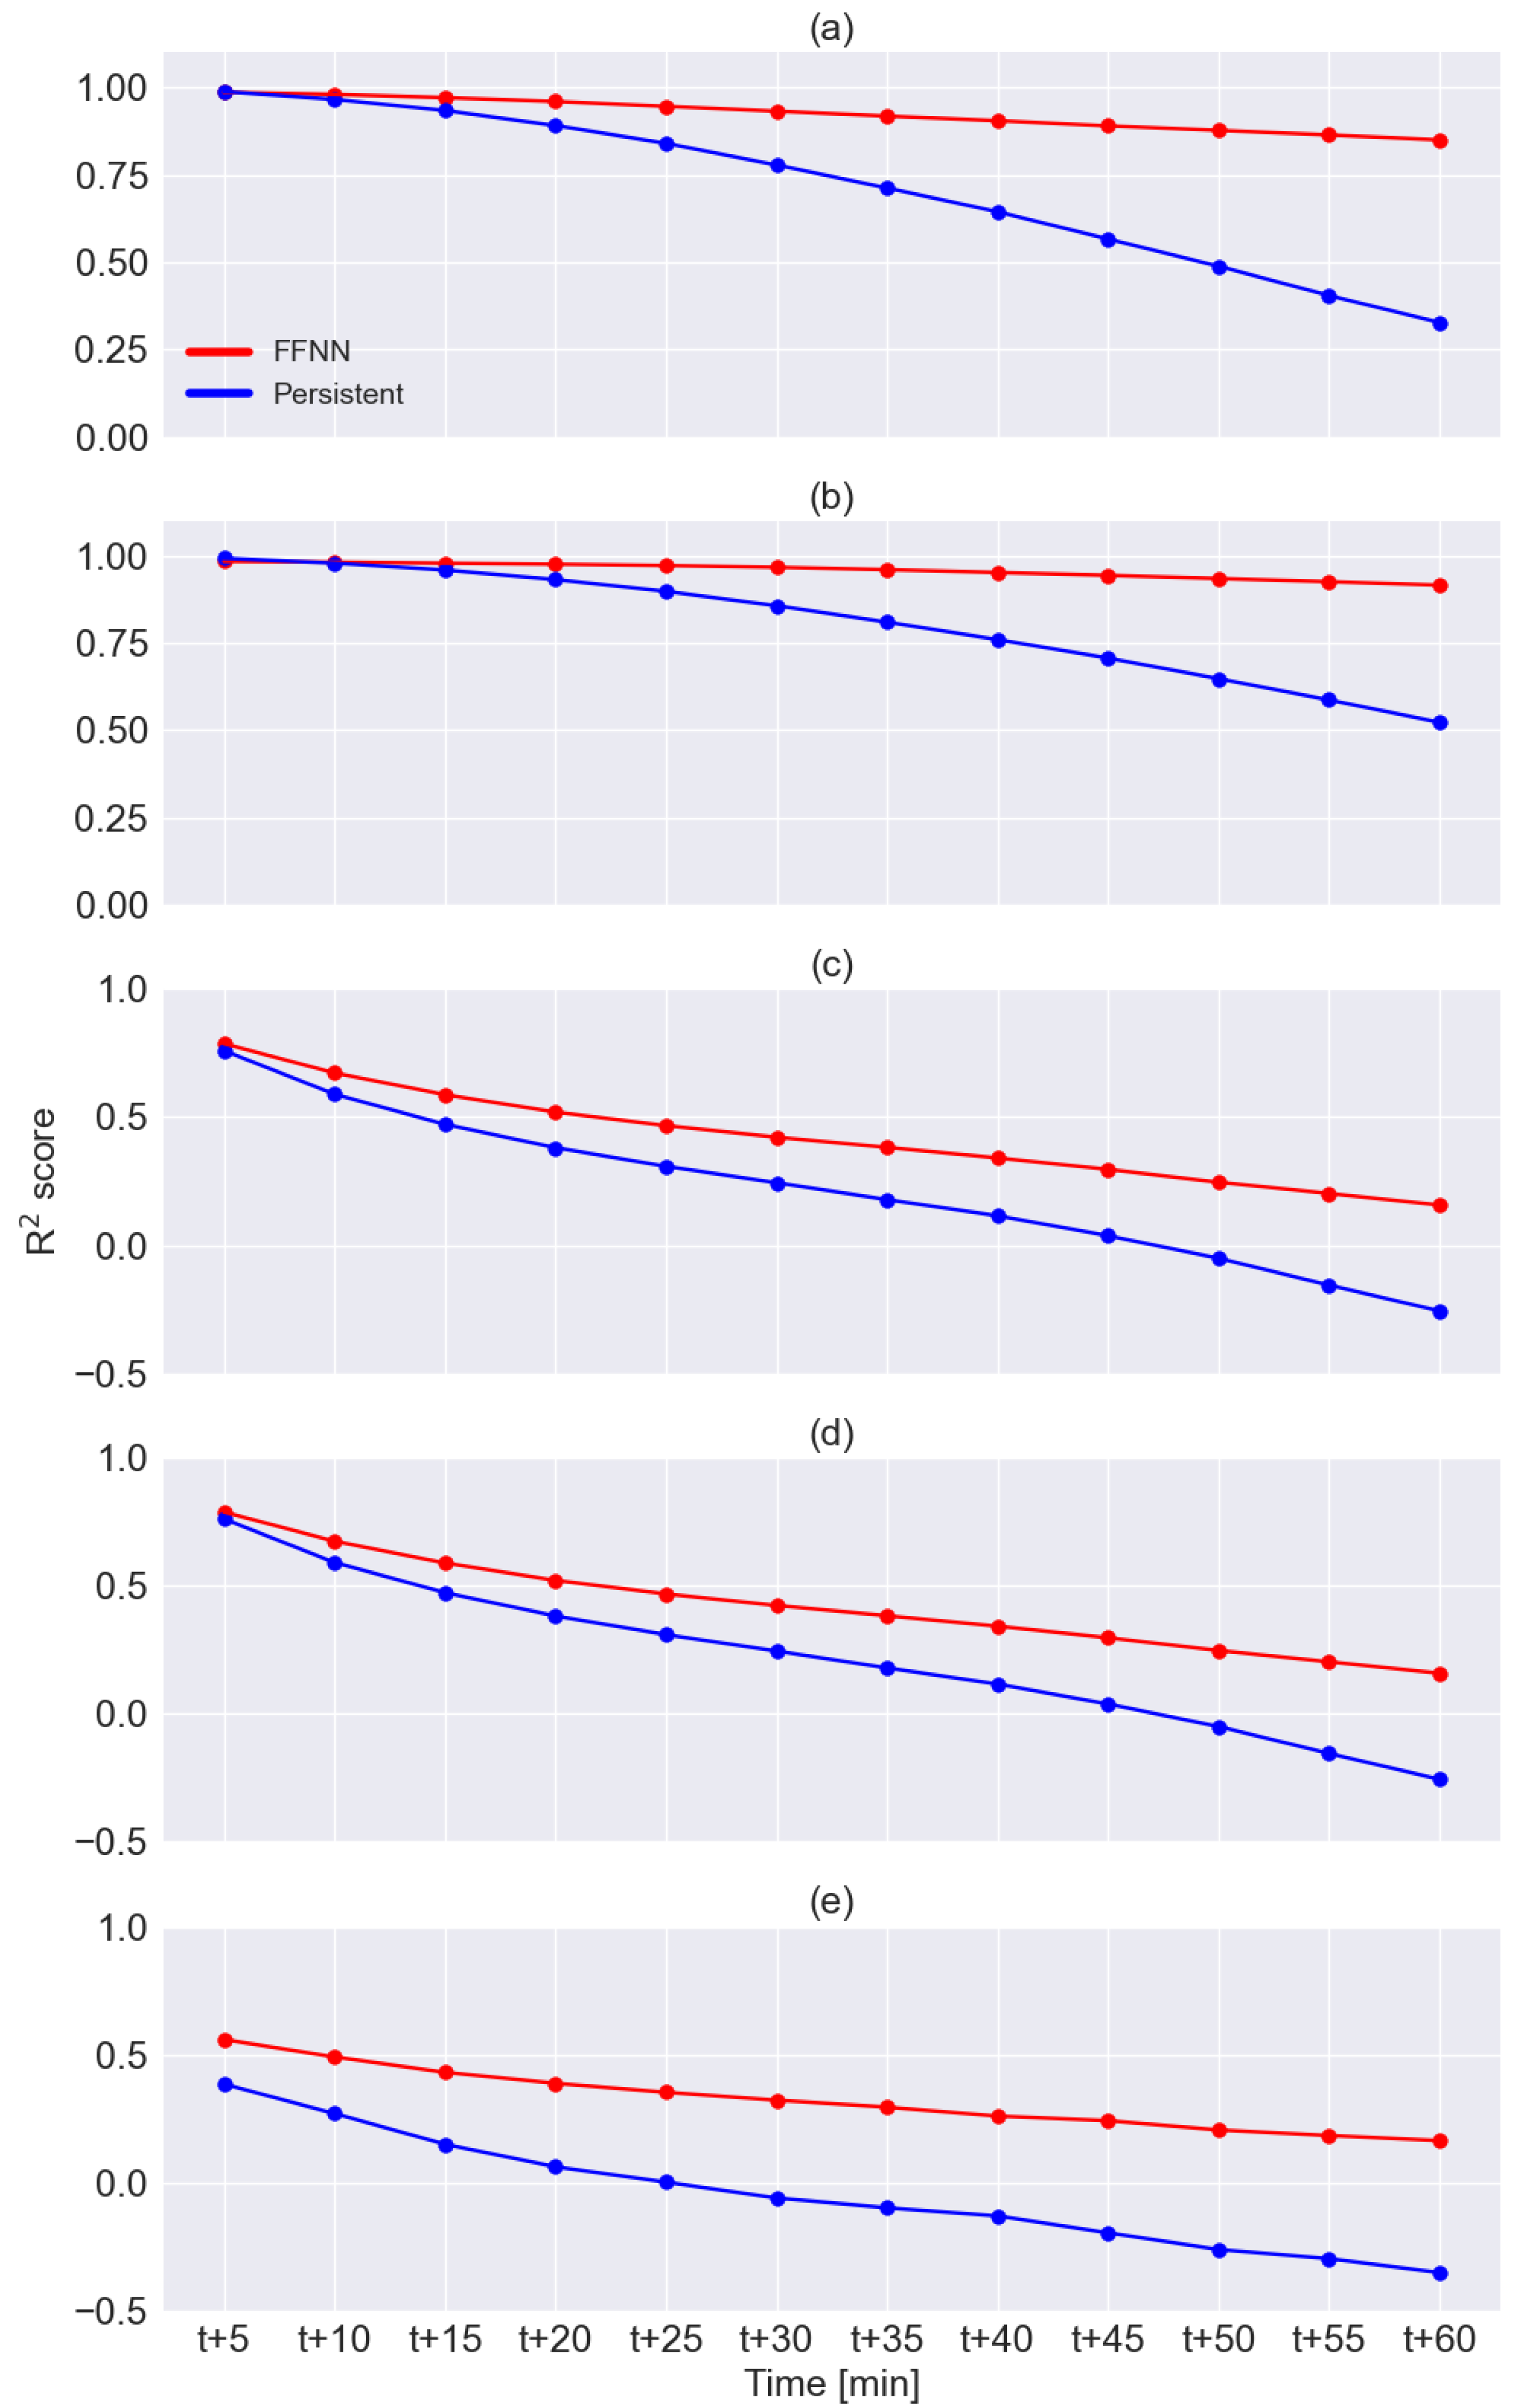
Table 2 reports the MAE of the FFNN and persistent models on the latitude and longitude output together with the percentage difference (computed as FFNN MAE minus persistent MAE divided by FFNN MAE). The FFNN ensures smaller errors for all the time horizons, except for the first time step (5 min ahead). This is because the FFNN is trained to maximize the average accuracy over the whole forecasting horizon [48,60]. It sacrifices precision at the first step to obtain a better overall performance. This could probably be avoided by defining a loss function that uses a decreasing set of weights to enhance the model accuracy on the first steps. However, this correction was not adopted in this study. The average forecast errors correspond, for the latitude, to 2.4 km and 11.0 km after 5 and 60 min, respectively. For the longitude, the average error after 5 min is 3.3 km, and after 60 min reaches 9.8 km. Errors on the longitude are larger since, as noted above, storms span a more extensive set of values in the horizontal direction, but this also means a larger difference between the two models that almost reaches 80% in the second half hour.

Table 2.
MAE of latitude and longitude (degrees) of FFNN and persistent models on the test dataset.
Table 3 shows the MAEs of the FFNN and persistent model on the average and maximum radar reflectivity outputs. Again, the FFNN outperforms the persistent regarding both average and maximum reflectivity.

Table 3.
MAE of average and maximum radar reflectivity (dBZ) of FFNN and persistent models on the test dataset.
Table 4 details the performances of the two models on the area output. Here, too, the FFNN performs consistently better than the persistent model, with differences increasing with the length of the forecasting horizon.

Table 4.
MAE of area (km2) of FFNN and persistent models on the test dataset.
Figure 7 compares the score for each output variable, showing the same trends as the MAE. The accuracy of both models obviously decreases with the time horizon. In all cases, the FFNN outperforms the persistent model, except for the prediction of latitude and longitude after 5 min, which, however, are almost equivalent.
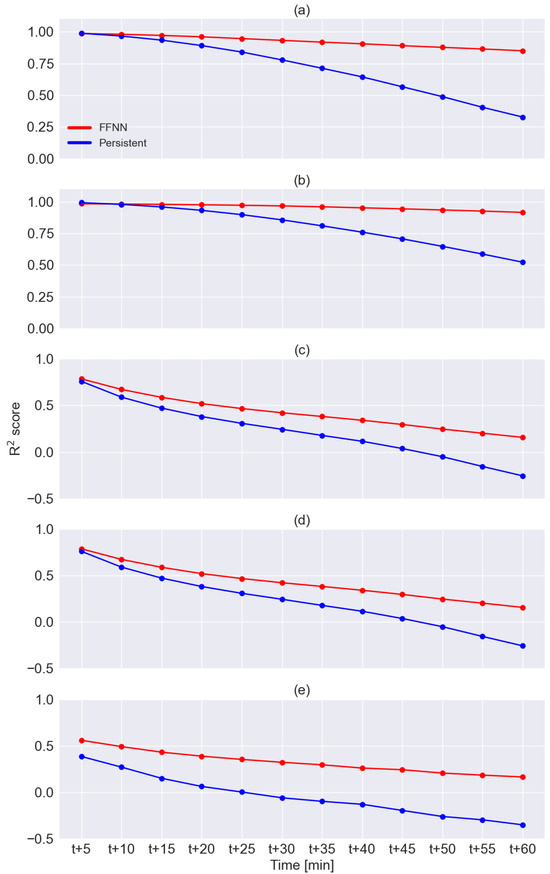
Figure 7.
scores comparing FFNN predictions (in red) and the persistent model outputs (in blue): latitude (a), longitude (b), average reflectivity (c), maximum reflectivity (d), and area (e). Note that the vertical axis is scaled differently between the five figures.
The better performance of the NN with respect to the persistent model can be explained by various reasons. The first is the use of the gradient of the input variables (i.e., the last two values) besides the current value. In this way, the network can extrapolate the current trend instead of just fixing the last value. The second is that the network, through training, has learned the most frequent dynamic of the convective cells. So, for instance, even when the gradient of a given variable (speed, area, reflectivity) varies consistently, the network knows that such an increase will terminate, and the variable will reach a plateau. In the same way, after a sequence of high values, the network predicts the start of the extinction phase. Finally, the NN can exploit the joint knowledge of all the variables and thus take advantage, for instance, of the known relation between area and reflectivity of a cell during its evolution.
3.2. Sample Storm Trajectories
For a final assessment of the model performance, we report the real and predicted trajectories of three representative convective storm events. Two simplifications are adopted to provide more straightforward readability. First, we assume a circular shape for both the actual and the forecasted areas, although the actual form of the convective cells may be much more complex. The size of the circles is proportional to the cell area. Second, only the forecasts 60 min ahead are represented.
3.2.1. Case 1
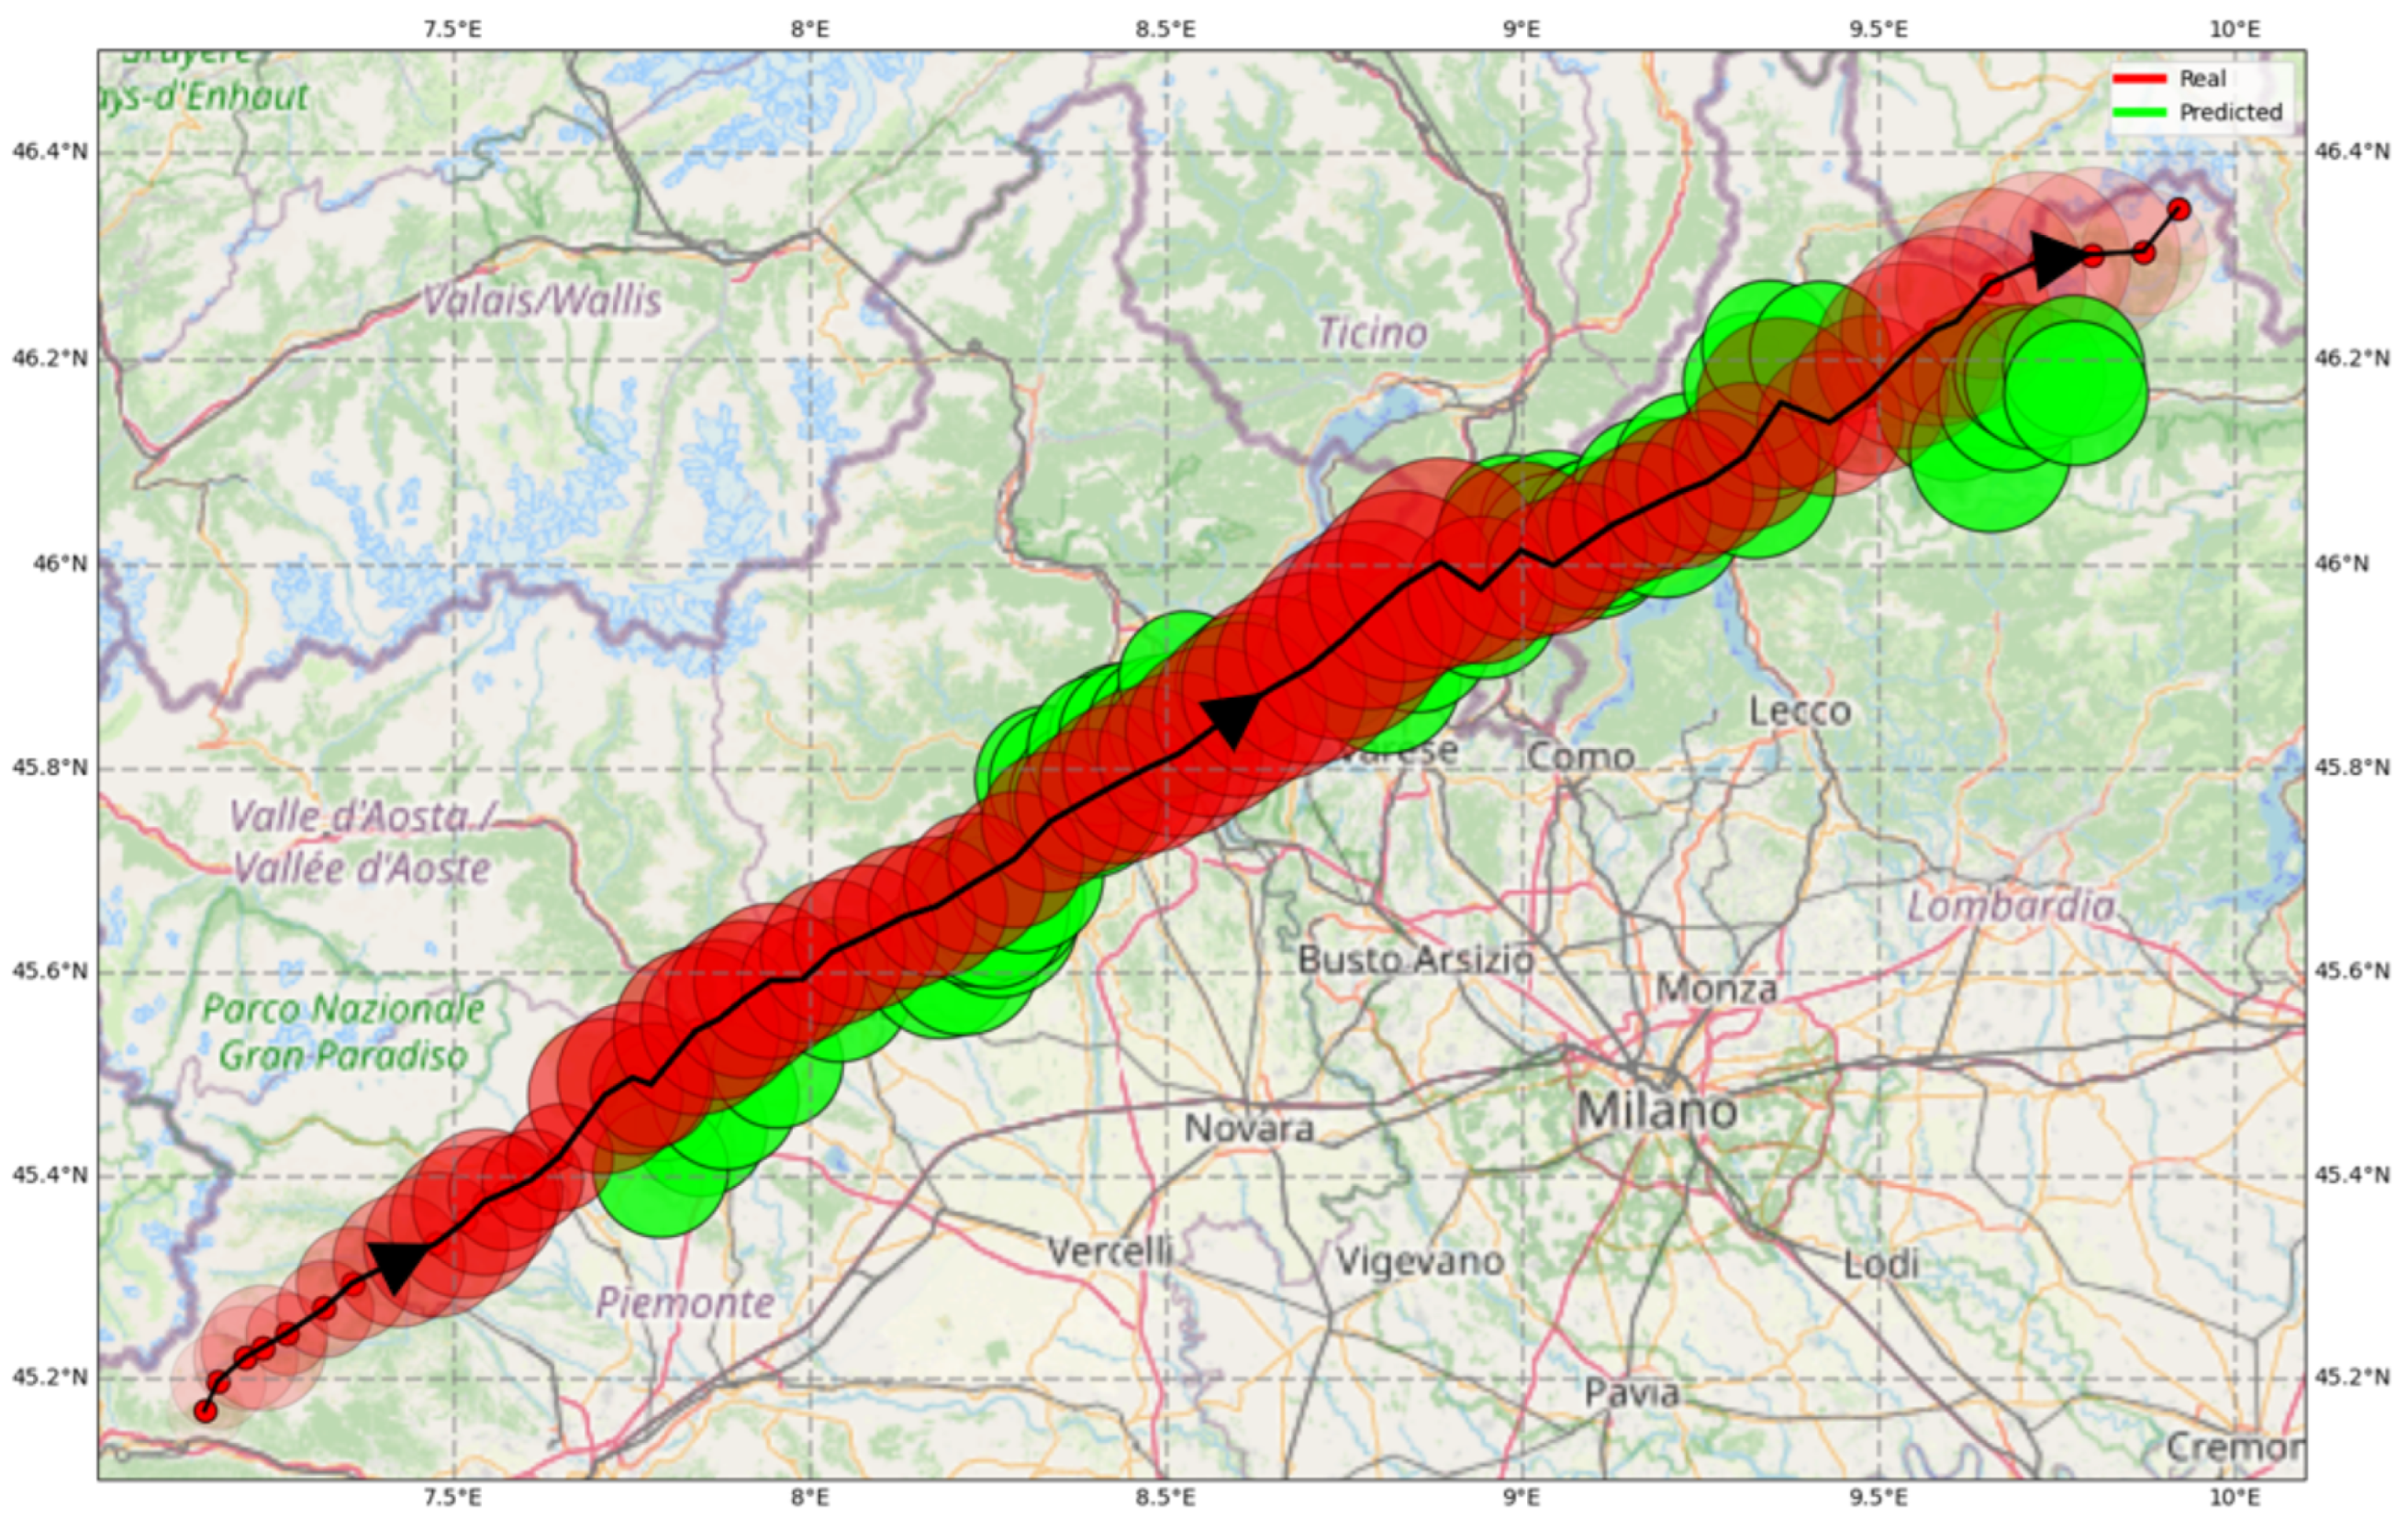
Figure 8 refers to the episode on 20 August 2019, which lasted from 14:00 to 19:00. The cell traveled about 250 km, moving systematically toward the northeast. As already pointed out, this is the typical behavior of the convective cells in this area, allowing the model to track the storm accurately. In the figure, the forecasted area and position are displayed for the first time only 70 min after the cell is first detected (10 min corresponding to the two warm-up steps plus 60 min representing the considered lead time; forecast from 5 to 55 min are computed but not displayed in the figure). The green (forecasted) circles almost coincide with the red (actual) ones, meaning the cell’s area is also interpreted correctly. After five hours, the reflectivity of the cell declines (lighter red circles on the upper right corners) and thus the prediction is the disappearance of the cell (reflectivity below the threshold of cell definition).
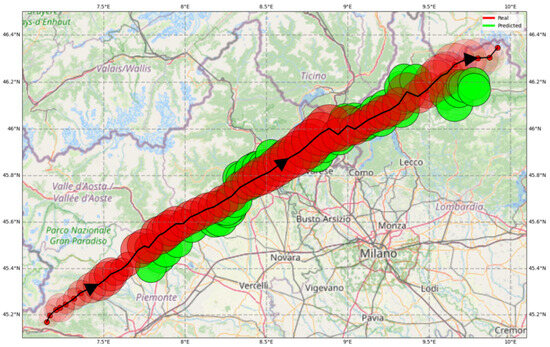
Figure 8.
Case 1. The convective cell developed on 20 August 2019 and lasted from 14:00 to 19:00. The actual path of the storm centroid is in black, and the area is in red. They are reported every five minutes. The predicted values one hour ahead are in green (predictions from 5 to 55 min ahead are not displayed). The area of each circle is proportional to the cell dimension and the color intensity to the average reflectivity. The arrows indicate the movement direction. Grid size: 0.5° lon; 0.2° lat.
3.2.2. Case 2
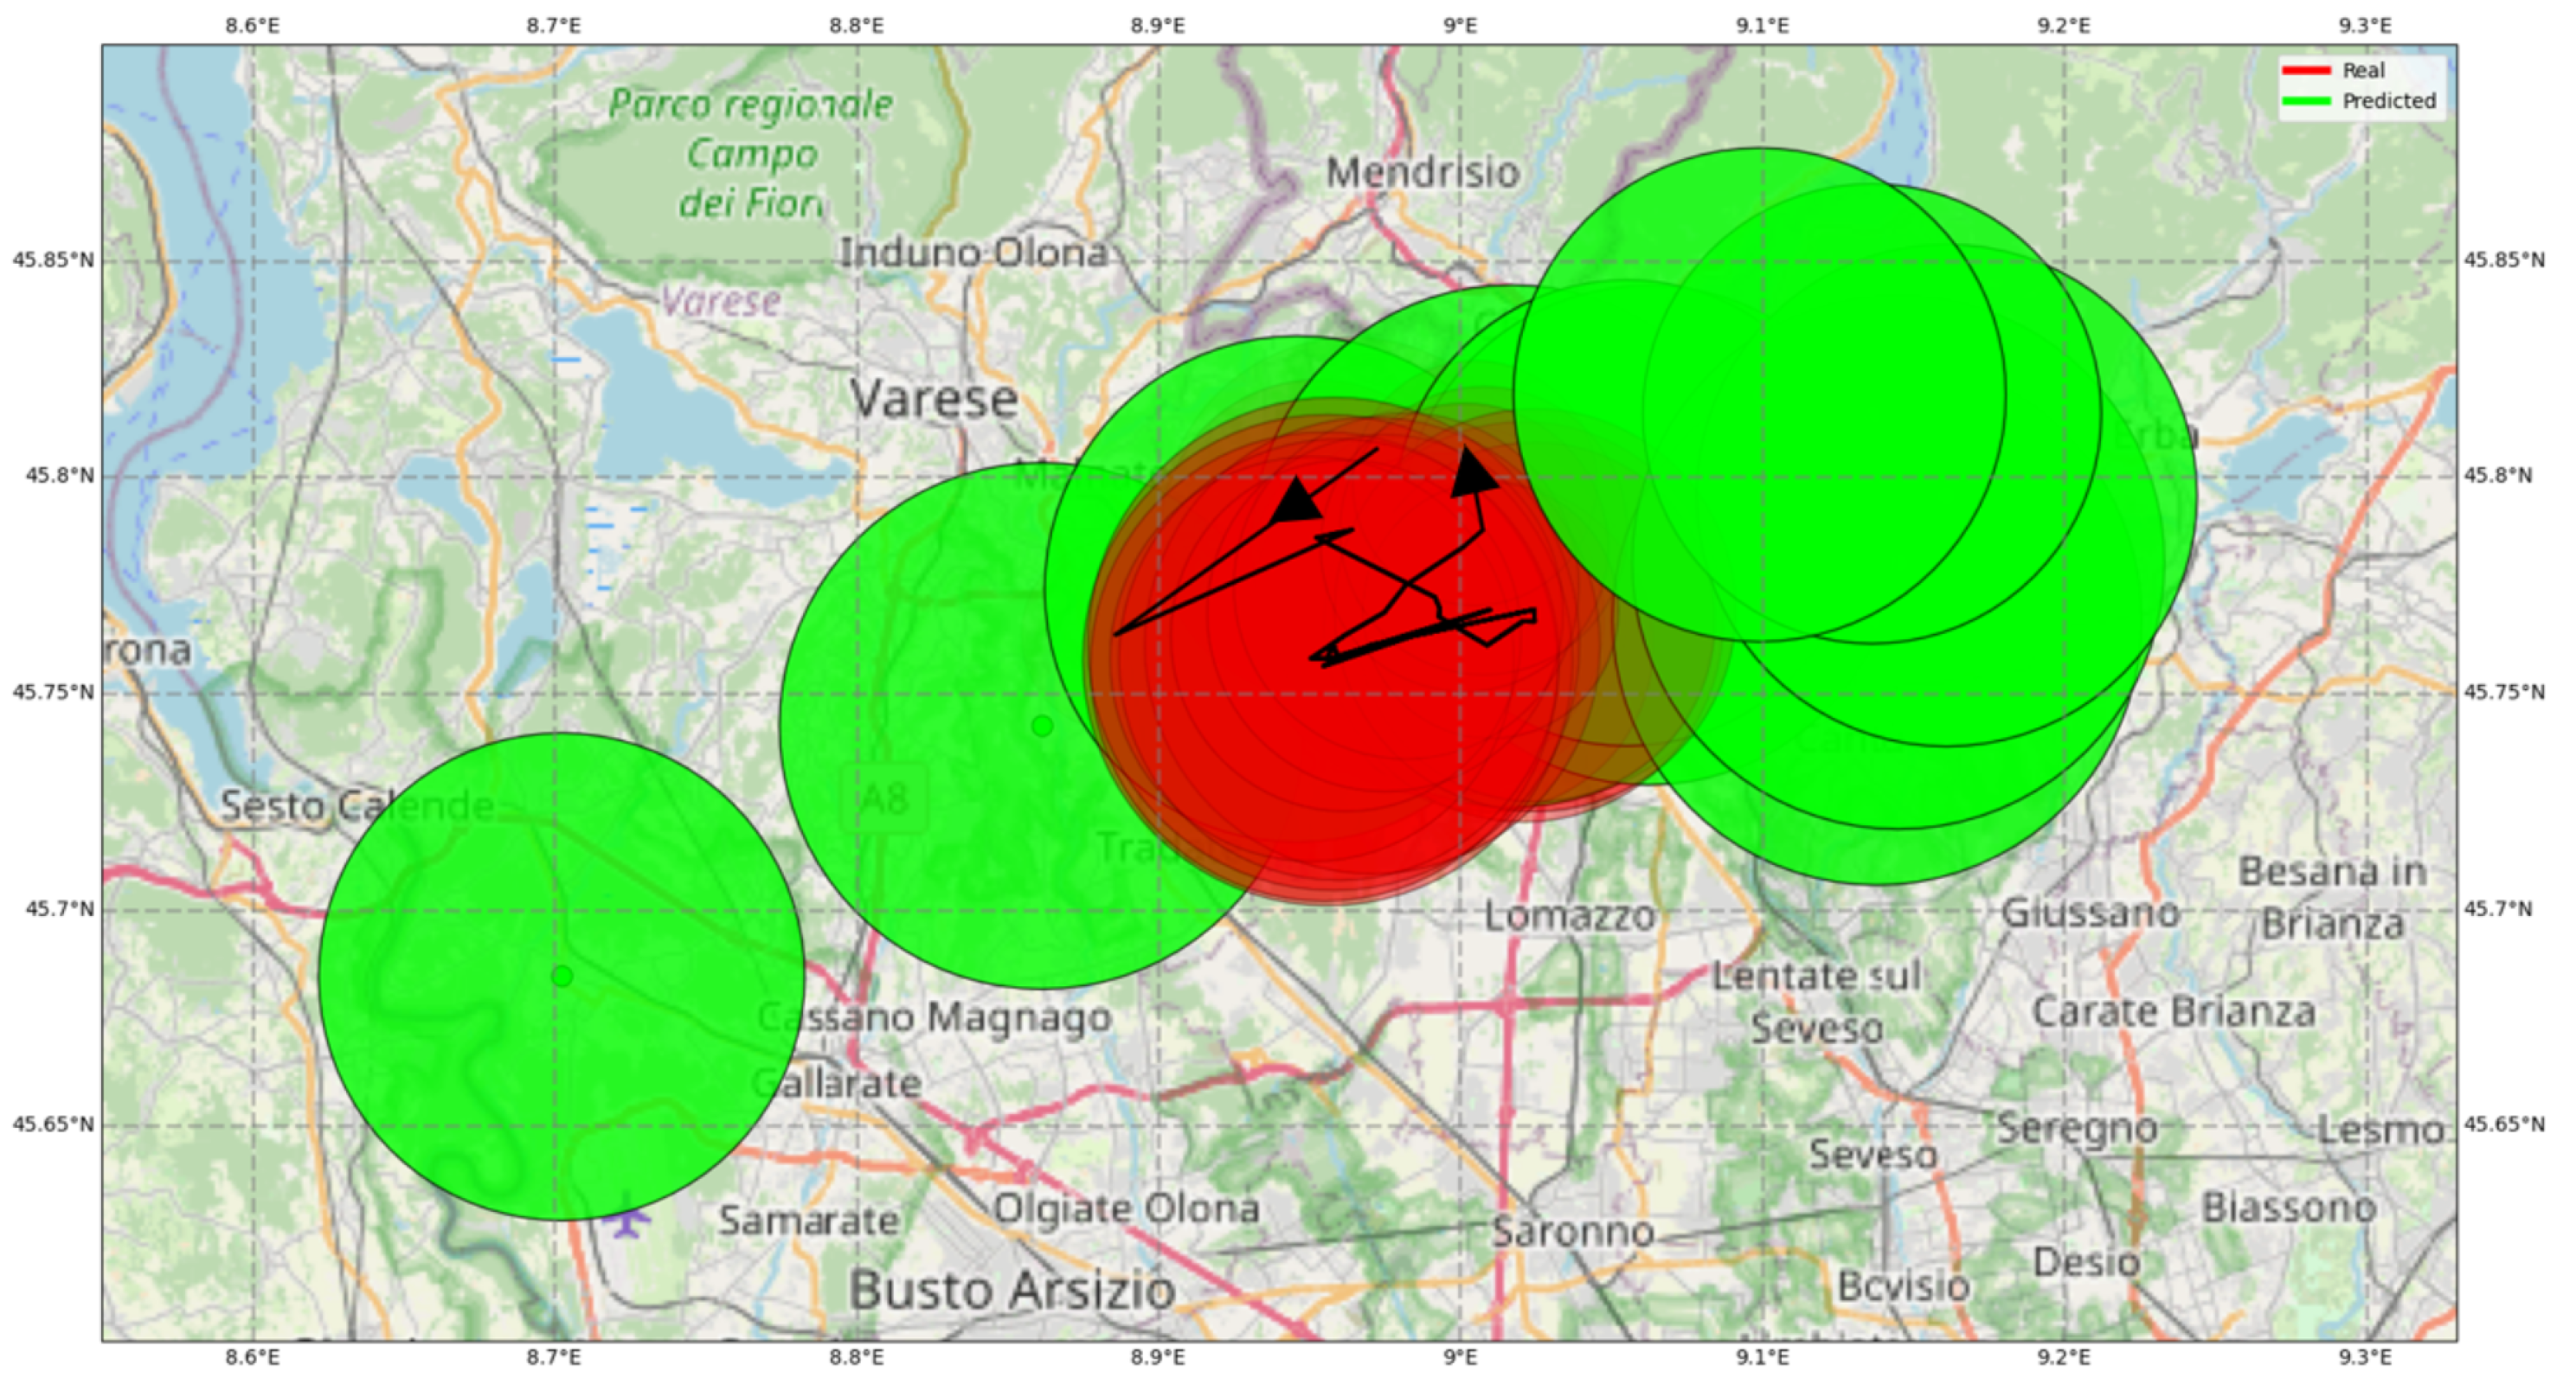
As a contrasting example, the storm illustrated in Figure 9, which took place on 18 June 2019 and lasted from 2:20 to 4:15, is relatively stationary. The cell’s centroid moves almost randomly around the initial position and spans less than 10 km. The model captures this unusual behavior relatively well; the actual and predicted areas frequently overlap. At times, however, the model fails to predict the direction of the sudden shifts. Despite this, given the limited movement of the cell, the model errors remain limited to less than 15 km.
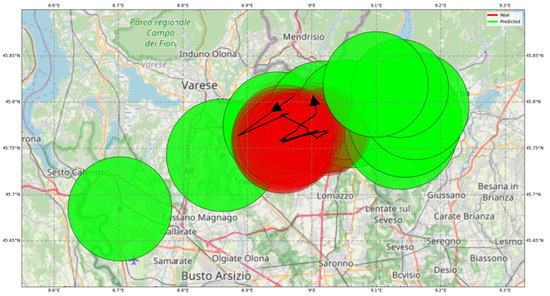
Figure 9.
Case 2 took place on 18 June 2019 and lasted from 2:20 to 4:15. The actual convective cell path is shown in black. The actual area is reported every five minutes. The predicted values one hour ahead are in green (predictions from 5 to 55 min ahead are not displayed). The area of each circle is proportional to the cell dimension and the color intensity to the average reflectivity. The arrows indicate the movement direction. Note that the scale of the figure is about five times larger than the previous one. Grid size: 0.1° lon; 0.05° lat.
3.2.3. Case 3
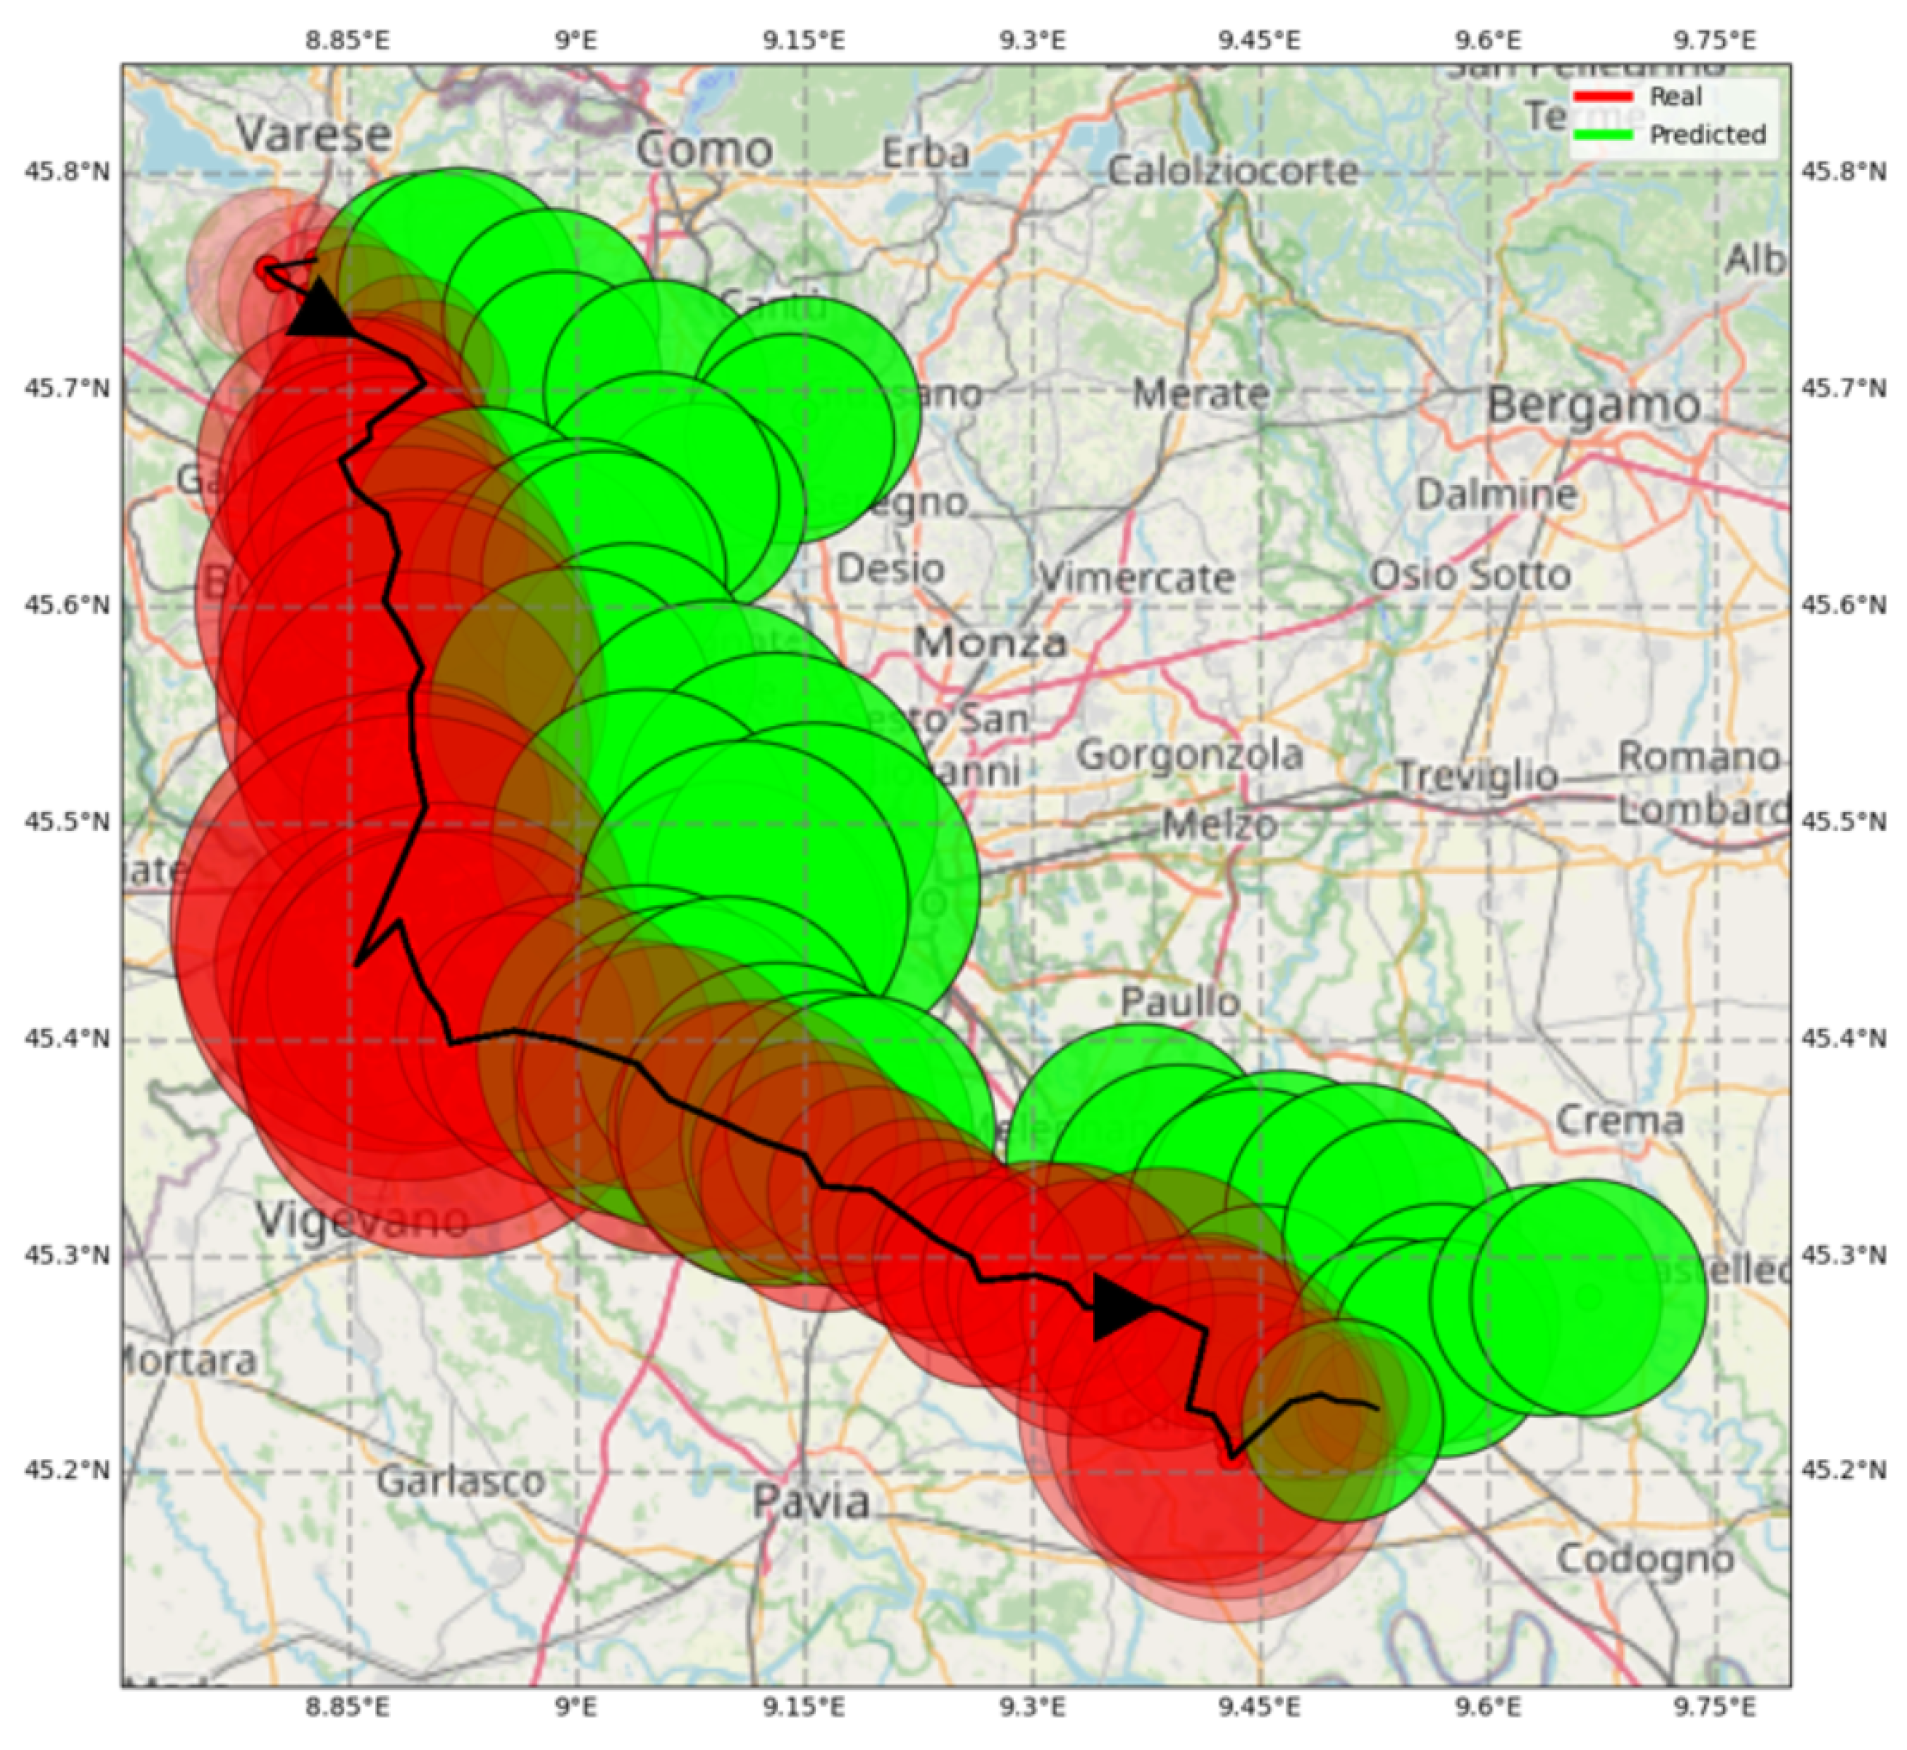
The third example in Figure 10 is an entirely different situation. The storm happened on 8 September 2019 and lasted from 14:15 to 18:40. Its path is peculiar. After an initial hour during which the cell remained almost in the same position, it moved to the south and then to the southeast, traveling for some 86 km, mainly toward the south. The model was not well trained to follow this kind of trajectory since they are infrequent, and thus, it forecasts a deviation toward the east at each time step. The errors, in this situation, may reach up to 15 km.
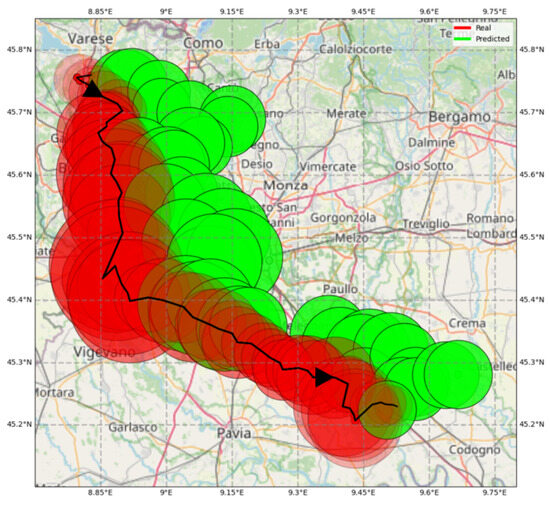
Figure 10.
Case 3. The convective cell developed on 8 September 2019 and lasted from 14:15 to 18:40. The actual path is in black, and the actual area is in red. They are reported every five minutes. The predicted values one hour ahead are in green (predictions from 5 to 55 min ahead are not displayed). The area of each circle is proportional to the cell dimension and the color intensity to the average reflectivity. The arrows indicate the movement direction. Again the scale of the map is different from that of the previous figures. Grid size: 0.15° lon; 0.1° lat.
4. Discussion
This work aimed at developing an artificial neural network to predict the trajectories of convective storms, together with some additional information on the storm characteristics (average and maximum radar reflectivity and area of influence) in the short term, i.e., up to 60 min ahead. From the practical viewpoint, the determination of the center of mass of the convective cell provided by the neural network with remarkable accuracy is, in a way, more relevant than the other storm characteristics. Once the radar signal detects the cell, it is already sufficiently strong, and thus a precise determination of the precipitation intensity does not change the alarm conditions. The same is also partially true for the area, which is determined by adopting a crisp boundary, whereas a fuzzy approach would be more realistic. In practice, a rainfall of 20.1 mm and one of 19.9 mm do not differ, even if the latter may be below the threshold determining the boundary of the cell. Another relevant point is the network’s ability to forecast storms of any duration since, when used in real-time, one cannot know how long the cell will continue to be active. To deal with these conditions, we assessed the performance of the network, which is trained on storms longer than 70 min, on shorter episodes. Table 5 shows, for instance, the values of the coefficient of determination computed for the geographical coordinates of all the storms with a duration longer than 40 min. It appears that the network still performs very accurately. Thus, it can reliably be used for forecasting even at the onset of the convective cell when its duration is unknown. In practice, when the reflectivity declines (see, for instance, the last real values in Figure 8), the forecast for the following steps may be below the threshold that defines the presence of a cell, and thus, the cell is forecasted to disappear.

Table 5.
Comparison between scores of latitude and longitude of the model tested on the original database of storms longer than 70 min (composed of 10 min of data as input and 60 as output) and longer than 40 min (10 min for input and 30 as output).
In quite the same way, we did not notice any difference in the accuracy of the predictions when developing separate networks for each cell characteristic. It seems that despite the loss function of the network being weighted on 60 standardized variables, as stated in Section 2.3, it can capture very well the specific features of the cells.
We showed that the FFNN generally manages to predict the direction and features of the storm when the phenomenon is following the predominant path towards the northeast, as Figure 8 illustrates. However, on some occasions, the model is less accurate when the cell moves differently. An additional complication is the general inability of the model to predict sudden shifts (Figure 9), which are highly challenging to forecast. This problem can be characteristic of thunderstorms comprising several cells in various phases. The birth, growth, or death of one or more cells may cause the centroid to move in an apparently unrelated manner with respect to the direction and velocity of the whole storm system.
A possible improvement would thus be to pre-process the meteorological field through a classifier that is able to detect the particular conditions and activate a neural predictor trained for that situation. This may also help overcome another study limitation, namely the inability to predict the birth and death of convective cells. The model continues to predict the trajectory of a storm for the whole horizon, even when the storm disappears after a few steps. To develop such a classifier, looking at other variables will probably be necessary. The two horizontal velocities already account for the wind direction in the current implementation. However, it may be worth incorporating a richer input, considering, for instance, the Zenit Total Delay (ZTD), a proxy of the vapor content of the atmosphere [32,61,62,63], or the cloud-to-ground lightning, which is also considered by the TRT algorithm [43].
5. Conclusions
A multi-variable multi-step neural network has shown to be reasonably accurate at predicting the evolution of convective cells, even with a simple and traditional internal structure. When an accurate convective cell tracking system is available (such as MeteoSwiss’s TRT), these networks require much less data and run orders of magnitude faster than physically-based numerical weather prediction (NWP) models [64] and do not need the same rigid grid subdivision of space. However, the two approaches might be integrated: NWP models could provide a more synoptic view, including, for instance, vertical wind and detailed pressure fields, which the network can exploit as additional input values. Furthermore, given their execution speed, the networks can be used for ensemble forecasting [65] starting from a set of initial conditions within the range of uncertainty of NWP model output. This will ultimately allow moving from a deterministic vision of the forecast (a cell at a specific position at a specific time) to a stochastic point of view (the probability of having a cell at a given position and time). Considering the high accuracy in convective cells’ forecasting reached in this study by simple neural networks, it is impossible to assess the efficiency of further improvements in general terms. It will be necessary to balance these developments’ additional costs with the benefits they can provide. This means that a rational decision can be taken only when the actual use of the forecast is defined. In conclusion, the proposed neural forecasting tool is a definite advancement with respect to the current state-of-the-art approaches, which usually focus only on the rainfall intensity and do not consider the storm trajectory. Moreover, from a practical perspective, it can be used as an early-warning system to inform and support the decisions of regional and municipal authorities and the civil protection departments.
Author Contributions
Conceptualization, G.G.; methodology, N.B., G.G. and M.S.; software, N.B. and M.S.; writing—original draft preparation, N.B.; writing—review and editing, G.G. and M.S. All authors have read and agreed to the published version of the manuscript.
Funding
This work was partially supported by the ICREN Project, funded under the PRIN call by the Italian Ministry of University and Research (title: Intense Convective Rainfall Events Nowcasting, CUP: D53D23004770006).
Data Availability Statement
Original radar data on which the study is based can be obtained under agreement with MeteoSwiss (https://www.meteoswiss.admin.ch/ (accessed on 10 March 2021)).
Acknowledgments
The authors acknowledge the contribution of Stefano Barindelli and the LAMPO Project, funded by Fondazione Cariplo (title: Lombardy based Advanced Meteorological Predictions and Observations, CUP: D49H17000020007) for pre-processing and structuring the original data.
Conflicts of Interest
The authors declare no conflicts of interest.
References
- Byers, H.R.; Braham, R.R. The Thunderstorm: Report of the Thunderstorm Project; US Government Printing Office: Washington, DC, USA, 1949.
- Wallemacq, P.; Guha-Sapir, D.; McClean, D.; CRED; UNISDR. The Human Cost of Natural Disasters—A Global Perspective; Centre for Research on the Epidemiology of Disaster (CRED): Brussels, Belgium, 2015. [Google Scholar]
- Levizzani, V.; Cattani, E. Satellite Remote Sensing of Precipitation and the Terrestrial Water Cycle in a Changing Climate. Remote Sens. 2019, 11, 2301. [Google Scholar] [CrossRef]
- Bontempi, G.; Ben Taieb, S.; Borgne, Y.A.L. Machine learning strategies for time series forecasting. In Proceedings of the European Business Intelligence Summer School, Brussels, Belgium, 15–21 July 2012; pp. 62–77. [Google Scholar] [CrossRef]
- Sangiorgio, M.; Dercole, F. Robustness of LSTM neural networks for multi-step forecasting of chaotic time series. Chaos Solitons Fractals 2020, 139, 110045. [Google Scholar] [CrossRef]
- Livieris, I.E.; Stavroyiannis, S.; Pintelas, E.; Pintelas, P. A novel validation framework to enhance deep learning models in time-series forecasting. Neural Comput. Appl. 2020, 32, 17149–17167. [Google Scholar] [CrossRef]
- Mahmoud, A.; Mohammed, A. A survey on deep learning for time-series forecasting. In Machine Learning and Big Data Analytics Paradigms: Analysis, Applications and Challenges; Springer: Cham, Switzerland, 2021; pp. 365–392. [Google Scholar] [CrossRef]
- Lara-Benítez, P.; Carranza-García, M.; Riquelme, J.C. An experimental review on deep learning architectures for time series forecasting. Int. J. Neural Syst. 2021, 31, 2130001. [Google Scholar] [CrossRef] [PubMed]
- Sangiorgio, M.; Dercole, F.; Guariso, G. Forecasting of noisy chaotic systems with deep neural networks. Chaos Solitons Fractals 2021, 153, 111570. [Google Scholar] [CrossRef]
- Chow, T.; Cho, S. Development of a recurrent Sigma-Pi neural network rainfall forecasting system in Hong Kong. Neural Comput. Appl. 1997, 5, 66–75. [Google Scholar] [CrossRef]
- Maqsood, I.; Khan, M.R.; Abraham, A. An ensemble of neural networks for weather forecasting. Neural Comput. Appl. 2004, 13, 112–122. [Google Scholar] [CrossRef]
- Corani, G.; Guariso, G. An application of pruning in the design of neural networks for real time flood forecasting. Neural Comput. Appl. 2005, 14, 66–77. [Google Scholar] [CrossRef]
- Salman, A.G.; Kanigoro, B.; Heryadi, Y. Weather forecasting using deep learning techniques. In Proceedings of the 2015 International Conference on Advanced Computer Science and Information Systems (ICACSIS), Hong Kong, China, 19–21 August 2015; pp. 281–285. [Google Scholar] [CrossRef]
- Holmstrom, M.; Liu, D.; Vo, C. Machine learning applied to weather forecasting. Meteorol. Appl. 2016, 10, 1–5. [Google Scholar]
- Rasel, R.I.; Sultana, N.; Meesad, P. An application of data mining and machine learning for weather forecasting. In Proceedings of the International Conference on Computing and Information Technology, Druskininkai, Lithuania, 12–14 October 2017; pp. 169–178. [Google Scholar] [CrossRef]
- Scher, S.; Messori, G. Predicting weather forecast uncertainty with machine learning. Q. J. R. Meteorol. Soc. 2018, 144, 2830–2841. [Google Scholar] [CrossRef]
- Singh, N.; Chaturvedi, S.; Akhter, S. Weather forecasting using machine learning algorithm. In Proceedings of the 2019 International Conference on Signal Processing and Communication (ICSC), Noida, India, 7–9 March 2019; pp. 171–174. [Google Scholar] [CrossRef]
- Sangiorgio, M.; Barindelli, S.; Guglieri, V.; Venuti, G.; Guariso, G. Reconstructing environmental variables with missing field data via end-to-end machine learning. In Proceedings of the International Conference on Engineering Applications of Neural Networks, Halkidiki, Greece, 5–7 June 2020; pp. 167–178. [Google Scholar] [CrossRef]
- Bhimavarapu, U. IRF-LSTM: Enhanced regularization function in LSTM to predict the rainfall. Neural Comput. Appl. 2022, 34, 20165–20177. [Google Scholar] [CrossRef]
- Barrera-Animas, A.Y.; Oyedele, L.O.; Bilal, M.; Akinosho, T.D.; Delgado, J.M.D.; Akanbi, L.A. Rainfall prediction: A comparative analysis of modern machine learning algorithms for time-series forecasting. Mach. Learn. Appl. 2022, 7, 100204. [Google Scholar] [CrossRef]
- Luo, C.; Xu, G.; Li, X.; Ye, Y. The Reconstitution Predictive Network for Precipitation Nowcasting. Neurocomputing 2022, 507, 1–15. [Google Scholar] [CrossRef]
- Marrocu, M.; Massidda, L. Coupling a Neural Network with a Spatial Downscaling Procedure to Improve Probabilistic Nowcast for Urban Rain Radars. Forecasting 2022, 4, 845–865. [Google Scholar] [CrossRef]
- Yano, J.I.; Ziemiański, M.Z.; Cullen, M.; Termonia, P.; Onvlee, J.; Bengtsson, L.; Carrassi, A.; Davy, R.; Deluca, A.; Gray, S.L.; et al. Scientific challenges of convective-scale numerical weather prediction. Bull. Am. Meteorol. Soc. 2018, 99, 699–710. [Google Scholar] [CrossRef]
- Sapucci, L.F.; Machado, L.A.T.; de Souza, E.M.; Campos, T.B. Global Positioning System precipitable water vapour (GPS-PWV) jumps before intense rain events: A potential application to nowcasting. Meteorol. Appl. 2019, 26, 49–63. [Google Scholar] [CrossRef]
- Hudnurkar, S.; Rayavarapu, N. Binary classification of rainfall time-series using machine learning algorithms. Int. J. Electr. Comput. Eng. 2022, 12, 1945–1954. [Google Scholar] [CrossRef]
- Fang, W.; Xue, Q.; Shen, L.; Sheng, V.S. Survey on the Application of Deep Learning in Extreme Weather Prediction. Atmosphere 2021, 12, 661. [Google Scholar] [CrossRef]
- Hussein, E.A.; Ghaziasgar, M.; Thron, C.; Vaccari, M.; Jafta, Y. Rainfall Prediction Using Machine Learning Models: Literature Survey. Artif. Intell. Data Sci. Theory Pract. 2022, 1006, 75–108. [Google Scholar] [CrossRef] [PubMed]
- Benevides, P.; Catalão, J.; Miranda, P.M.A. On the inclusion of GPS precipitable water vapour in the nowcasting of rainfall. Nat. Hazards Earth Syst. Sci. 2015, 15, 2605–2616. [Google Scholar] [CrossRef]
- Benevides, P.; Catalão, J.; Nico, G.; Miranda, P.M. Evaluation of rainfall forecasts combining GNSS precipitable water vapor with ground and remote sensing meteorological variables in a neural network approach. In Proceedings of the Remote Sensing of Clouds and the Atmosphere XXIII, SPIE, Berlin, Germany, 12–13 September 2018; Volume 10786, pp. 29–38. [Google Scholar] [CrossRef]
- Benevides, P.; Catalão, J.; Nico, G. Neural Network Approach to Forecast Hourly Intense Rainfall Using GNSS Precipitable Water Vapor and Meteorological Sensors. Remote Sens. 2019, 11, 966. [Google Scholar] [CrossRef]
- Li, H.; Wang, X.; Zhang, K.; Wu, S.; Xu, Y.; Liu, Y.; Qiu, C.; Zhang, J.; Fu, E.; Li, L. A neural network-based approach for the detection of heavy precipitation using GNSS observations and surface meteorological data. J. Atmos.-Sol.-Terr. Phys. 2021, 225, 105763. [Google Scholar] [CrossRef]
- Sangiorgio, M.; Barindelli, S.; Biondi, R.; Solazzo, E.; Realini, E.; Venuti, G.; Guariso, G. Improved extreme rainfall events forecasting using neural networks and water vapor measures. In Proceedings of the 6th International Conference on Time Series and Forecasting, Granada, Spain, 25–27 September 2019; pp. 820–826. [Google Scholar]
- Han, L.; Fu, S.; Zhao, L.; Zheng, Y.; Wang, H.; Lin, Y. 3D convective storm identification, tracking, and forecasting—An enhanced TITAN algorithm. J. Atmos. Ocean. Technol. 2009, 26, 719–732. [Google Scholar] [CrossRef]
- Alemany, S.; Beltran, J.; Perez, A.; Ganzfried, S. Predicting Hurricane Trajectories Using a Recurrent Neural Network. Proc. Aaai Conf. Artif. Intell. 2019, 33, 468–475. [Google Scholar] [CrossRef]
- Oueslati, W.; Tahri, S.; Limam, H.; Akaichi, J. A New Approach for Predicting the Future Position of a Moving Object: Hurricanes’ Case Study. Appl. Artif. Intell. 2021, 35, 2037–2066. [Google Scholar] [CrossRef]
- Sangiorgio, M.; Barindelli, S.; Guglieri, V.; Biondi, R.; Solazzo, E.; Realini, E.; Venuti, G.; Guariso, G. A comparative study on machine learning techniques for intense convective rainfall events forecasting. In Proceedings of the International Conference on Time Series and Forecasting, Granada, Spain, 25–27 September 2019; pp. 305–317. [Google Scholar] [CrossRef]
- Cornejo, A.; Landeros-Ayala, S.; Matias, J.M.; Ortiz-Gomez, F.; Martinez, R.; Salas-Natera, M. Method of rain attenuation prediction based on long–short term memory network. Neural Process. Lett. 2022, 54, 2959–2995. [Google Scholar] [CrossRef]
- Huang, X.; Luo, C.; Ye, Y.; Li, X.; Zhang, B. Location-Refining neural network: A new deep learning-based framework for Heavy Rainfall Forecast. Comput. Geosci. 2022, 166, 105152. [Google Scholar] [CrossRef]
- Bouget, V.; Béréziat, D.; Brajard, J.; Charantonis, A.; Filoche, A. Fusion of Rain Radar Images and Wind Forecasts in a Deep Learning Model Applied to Rain Nowcasting. Remote Sens. 2021, 13, 246. [Google Scholar] [CrossRef]
- Zhang, F.; Wang, X.; Guan, J. A Novel Multi-Input Multi-Output Recurrent Neural Network Based on Multimodal Fusion and Spatiotemporal Prediction for 0–4 Hour Precipitation Nowcasting. Atmosphere 2021, 12, 1596. [Google Scholar] [CrossRef]
- Peng, X.; Li, Q.; Jing, J. CNGAT: A Graph Neural Network Model for Radar Quantitative Precipitation Estimation. IEEE Trans. Geosci. Remote Sens. 2022, 60, 1–14. [Google Scholar] [CrossRef]
- Hering, A.; Morel, C.; Galli, G.; Sénési, S.; Ambrosetti, P.; Boscacci, M. Nowcasting thunderstorms in the Alpine region using a radar based adaptive thresholding scheme. In Proceedings of the European Conference on Radar in Meteorology and Hydrology (ERAD), Visby, Sweden, 6–10 September 2004; pp. 206–211. [Google Scholar]
- Hering, A.M.; Germann, U.; Boscacci, M.; Sénési, S. Operational nowcasting of thunderstorms in the Alps during MAP D-PHASE. In Proceedings of the Fifth European Conference on Radar in Meteorology and Hydrology, Helsinki, Finland, 30 June–4 July 2008. [Google Scholar]
- Davini, P.; Bechini, R.; Cremonini, R.; Cassardo, C. Radar-Based Analysis of Convective Storms over Northwestern Italy. Atmosphere 2011, 3, 33. [Google Scholar] [CrossRef]
- Sangiorgio, M.; Barindelli, S. Spatio-temporal analysis of intense convective storms tracks in a densely urbanized Italian basin. ISPRS Int. J. Geo-Inf. 2020, 9, 183. [Google Scholar] [CrossRef]
- Lima, A.R.; Cannon, A.J.; Hsieh, W.W. Nonlinear regression in environmental sciences using extreme learning machines: A comparative evaluation. Environ. Model. Softw. 2015, 73, 175–188. [Google Scholar] [CrossRef]
- Abdulkarim, S.A.; Engelbrecht, A.P. Time series forecasting using neural networks: Are recurrent connections necessary? Neural Process. Lett. 2019, 50, 2763–2795. [Google Scholar] [CrossRef]
- Guariso, G.; Nunnari, G.; Sangiorgio, M. Multi-step solar irradiance forecasting and domain adaptation of deep neural networks. Energies 2020, 13, 3987. [Google Scholar] [CrossRef]
- Cano-Rocha, H.; Gonzalez-Garcia, R. Stochastic one-step training for feedforward artificial neural networks. Neural Process. Lett. 2020, 52, 2021–2041. [Google Scholar] [CrossRef]
- Sangiorgio, M.; Dercole, F.; Guariso, G. Neural Approaches for Time Series Forecasting. In Deep Learning in Multi-Step Prediction of Chaotic Dynamics; Springer International Publishing: Cham, Switzerland, 2021; pp. 43–57. [Google Scholar] [CrossRef]
- Watson, P.L.; Koukoula, M.; Anagnostou, E. Influence of the characteristics of weather information in a thunderstorm-related power outage prediction system. Forecasting 2021, 3, 541–560. [Google Scholar] [CrossRef]
- Kober, K.; Tafferner, A. Tracking and nowcasting of convective cells using remote sensing data from radar and satellite. Meteorol. Z. 2009, 1, 75–84. [Google Scholar] [CrossRef] [PubMed]
- Marrocu, M.; Massidda, L. Performance comparison between deep learning and optical flow-based techniques for nowcast precipitation from radar images. Forecasting 2020, 2, 194–210. [Google Scholar] [CrossRef]
- Ghimire, G.R.; Sharma, S.; Panthi, J.; Talchabhadel, R.; Parajuli, B.; Dahal, P.; Baniya, R. Benchmarking real-time streamflow forecast skill in the Himalayan region. Forecasting 2020, 2, 230–247. [Google Scholar] [CrossRef]
- Gürses-Tran, G.; Monti, A. Advances in time series forecasting development for power systems’ operation with MLOps. Forecasting 2022, 4, 501–524. [Google Scholar] [CrossRef]
- Shouman, M.A. New Weather Forecasting Applications. Alex. J. Manag. Res. Inf. Syst. 2023, 1, 45–70. [Google Scholar] [CrossRef]
- Pirone, D.; Cimorelli, L.; Del Giudice, G.; Pianese, D. Short-term rainfall forecasting using cumulative precipitation fields from station data: A probabilistic machine learning approach. J. Hydrol. 2023, 617, 128949. [Google Scholar] [CrossRef]
- Saadi, M.; Furusho-Percot, C.; Belleflamme, A.; Trömel, S.; Kollet, S.; Reinoso-Rondinel, R. Comparison of three radar-based precipitation nowcasts for the extreme July 2021 flooding event in Germany. J. Hydrometeorol. 2023, 24, 1241–1261. [Google Scholar] [CrossRef]
- Massidda, L.; Bettio, F.; Marrocu, M. Probabilistic day-ahead prediction of PV generation. A comparative analysis of forecasting methodologies and of the factors influencing accuracy. Sol. Energy 2024, 271, 112422. [Google Scholar] [CrossRef]
- Melgar-García, L.; Gutiérrez-Avilés, D.; Rubio-Escudero, C.; Troncoso, A. A novel distributed forecasting method based on information fusion and incremental learning for streaming time series. Inf. Fusion 2023, 95, 163–173. [Google Scholar] [CrossRef]
- Aichinger-Rosenberger, M.; Aregger, M.; Kopp, J.; Soja, B. Detecting Signatures of Convective Storm Events in GNSS-SNR: Two Case Studies From Summer 2021 in Switzerland. Geophys. Res. Lett. 2023, 50, e2023GL104916. [Google Scholar] [CrossRef]
- Aragón Paz, J.M.; Mendoza, L.P.O.; Fernández, L.I. Near-real-time GNSS tropospheric IWV monitoring system for South America. GPS Solut. 2023, 27, 93. [Google Scholar] [CrossRef]
- Baldysz, Z.; Nykiel, G.; Baranowski, D.B.; Latos, B.; Figurski, M. Diurnal variability of atmospheric water vapour, precipitation and cloud top temperature across the global tropics derived from satellite observations and GNSS technique. Clim. Dyn. 2023, 62, 1965–1982. [Google Scholar] [CrossRef]
- Dewitte, S.; Cornelis, J.P.; Müller, R.; Munteanu, A. Artificial intelligence revolutionises weather forecast, climate monitoring and decadal prediction. Remote Sens. 2021, 13, 3209. [Google Scholar] [CrossRef]
- Scher, S.; Messori, G. Ensemble methods for neural network-based weather forecasts. J. Adv. Model. Earth Syst. 2021, 13, e2020MS00233. [Google Scholar] [CrossRef]
Disclaimer/Publisher’s Note: The statements, opinions and data contained in all publications are solely those of the individual author(s) and contributor(s) and not of MDPI and/or the editor(s). MDPI and/or the editor(s) disclaim responsibility for any injury to people or property resulting from any ideas, methods, instructions or products referred to in the content. |
© 2024 by the authors. Licensee MDPI, Basel, Switzerland. This article is an open access article distributed under the terms and conditions of the Creative Commons Attribution (CC BY) license (https://creativecommons.org/licenses/by/4.0/).

