Abstract
The demand for a new concept of heritage, in which monuments and landscapes are considered active factors in creating a sense of history, is esteemed not only from a scientific and academic perspective, but as well as part of a more sensitive and efficient strategy to link cultural heritage and tourism, by bringing an integrative perspective to the forefront. Implementing such strategies is strictly correlated with the ability to support decision-makers and to increase people’s awareness towards a more comprehensive approach to heritage preservation. In the present work, a robust socioeconomic impact model is presented. Moreover, this work attempts to create an initial link between the economic impacts and natural hazards induced by the changes in the climatic conditions that cultural heritage sites face. The model’s novel socioeconomic impact analysis is the direct and indirect revenues related to the tourism use of a site, on which local economies are strongly correlated. The analysis indicated that cultural heritage sites provide a range of both market and non-market benefits to society. These benefits provide opportunities for policy interventions for the conservation of the cultural heritage sites and their promotion, but also to their protection against the impacts of climate change and natural disasters.
1. Introduction
Cultural heritage refers to tangible and intangible assets that constitute the legacy of physical artworks and intangible attributes of a society that are inherited from past generations, maintained in the present and bestowed for the benefit of future generations [1]. In economic terms, even if some cultural heritage assets are used for economic exploitation mainly through tourism, the overall approach for evaluating their economic values is different from other goods or services. A major difference is that their market supply is fixed in time. Even when visitors are charged to enter a cultural heritage site, the fact is that the access fees are not related to its true value, not even, at least, to the economic cost for providing access to or for maintaining the site. This means that non-market valuation methods should be used to determine the value that people assign to cultural heritage sites by visiting, using and conserving them [2]. The need to substantially classify the importance of heritage assets in terms of their historical, aesthetic, educational, artistic and economic contribution has motivated an ever-increasing application of valuation methods. These methods should be able to assess the monetary values for the protection and management of heritage from a societal point of view, which in turn could be used in heritage project appraisal and decision making.
Presently, it is well understood and widely accepted that cultural heritage can play a significant role in economic development. During the 1970s and 1980s in the UNESCO (United Nations Educational, Scientific and Cultural Organization) conventions, starting from UNESCO’s 1972 Convention [3] concerning the Protection of the World Cultural and Natural Heritage, there was a growing discussion about the links between cultural policy and economic development. In the same period, the World Heritage Convention and Burra Charter, based on the significance of cultural heritage in many countries, recognized the need for assigning resources to the implementation of protection measures for cultural heritage. However, the discussion on the possibility of using economics-based tools in decision making for cultural heritage started during the 1990s [4]. Even though the economic profitability of heritage is a well-established concept in cultural policy, it only came along in the 1960s–1970s, in the general climate of “new public management” in the United Kingdom and central Europe. The concept has gained new attraction during the last decade of economic recession in Europe. Moreover, in recent studies by the World Bank and the Inter-American Development Bank, the importance of cultural heritage in sustainable development was pointed out and the potential role of cultural heritage in the economic regeneration of historic urban centres was highlighted. Furthermore, there is a strong link between economic growth and the exploitation of cultural heritage sites for tourism, as in many cases, tourism is considered as an important source of revenue that provides significant economic payoffs [5,6].
All cultural heritage assets have an economic value [1], although it is not always easy to be quantified [1]. This economic value should, however, be considered in the development planning, especially for cultural heritage sites that are inside urban fabric. The inclusion of cultural heritage sites in the decision-making process for development is based on the consideration that their societal value is considered as that of an “unpriced good” characterized by attributes and society links that are not included in the conventional market metrics commonly used in assessing the economic outcome of an investment [7,8,9].
A reliable assessment of the socioeconomic and historic cultural value of monuments, or cultural heritage in general, to be used for operational purposes in preservation and conservation policies, presents many difficulties [10]. A common approach is to rely on tourism revenues in order to have a partial feedback on the interest of society in monument conservation and/or restoration, but the non-market benefits of such assets are likely to be a significant component of the economic impacts and should not be considered [6].
A first step in developing the theory of cultural value is to recognize that this is a concept reflecting a number of different dimensions of value [3]. If so, it might be possible to disaggregate the cultural value of a certain cultural good or service into its constituent elements, and to consider cultural heritage as an aggregate of services, that is, having no other value, for example, scientific, inspirational, recreational, educational and so on. Then, a cultural heritage site can be treated as an asset and can be assigned with a certain value. The net effect of additions to and subtractions from the capital stock within a given time period indicates the net investment/appreciation in the cultural capital during this period. This cultural capital can be measurable in both economic and cultural terms, and determines the opening value of the stock at the beginning of the next period. However, measures of its economic value may be not capable of representing the full range and complexity of the cultural worth of an asset.
Cultural heritage investment projects typically refer to a range of activities, such as conservation, upgrading visitors’ access or adaptive reuse of the heritage items involved. The economic valuation of the relevant capital expenditures can use standard investment assessment techniques. The fact that the assets involved are items of cultural capital indicates that, in addition to its economic payoff, cultural benefits like increased knowledge of the history of a place and sharing cultural heritage have to be also assessed [11].
Climate change, on the other hand, has a proven effective impact on a wide range of economic sectors and activities. This could result in changes in profitability in agriculture or forestry, changes in tourism supply and demand patterns, loss of production due to flooding or the costs of rebuilding infrastructure after extreme weather events. These examples indicate that the economic sensitivity of a region will be largely dependent on its physical, environmental, social and cultural characteristics. Moreover, climate change has direct and significant effects on tourism in general, affecting operators, destinations and visitors [12]. Thus, understanding the implications of climate change in relation to destination competitiveness and tourist demand patterns has been identified as a research priority in this field [13].
A region’s attractiveness, and most of the types of tourist activities it can host, depend heavily on the local weather and climate [14]. Climate change, by improving what was previously a less favourable climate or vice versa, can alter destinations to be more/less attractive for visitors. Moreover, the impact of climate change on tourism may also be indirect. Destinations of cultural heritage may become less attractive as a result of climate induced impacts on the natural and the built environment, which is a complementary asset for the tourism infrastructure [15,16,17].
Notably, the net losses or gains induced by the changes in climatic conditions will depend on the change in the tourists’ evaluation of climate-related amenities, which determine their choice of destination, length of stay and visiting period.
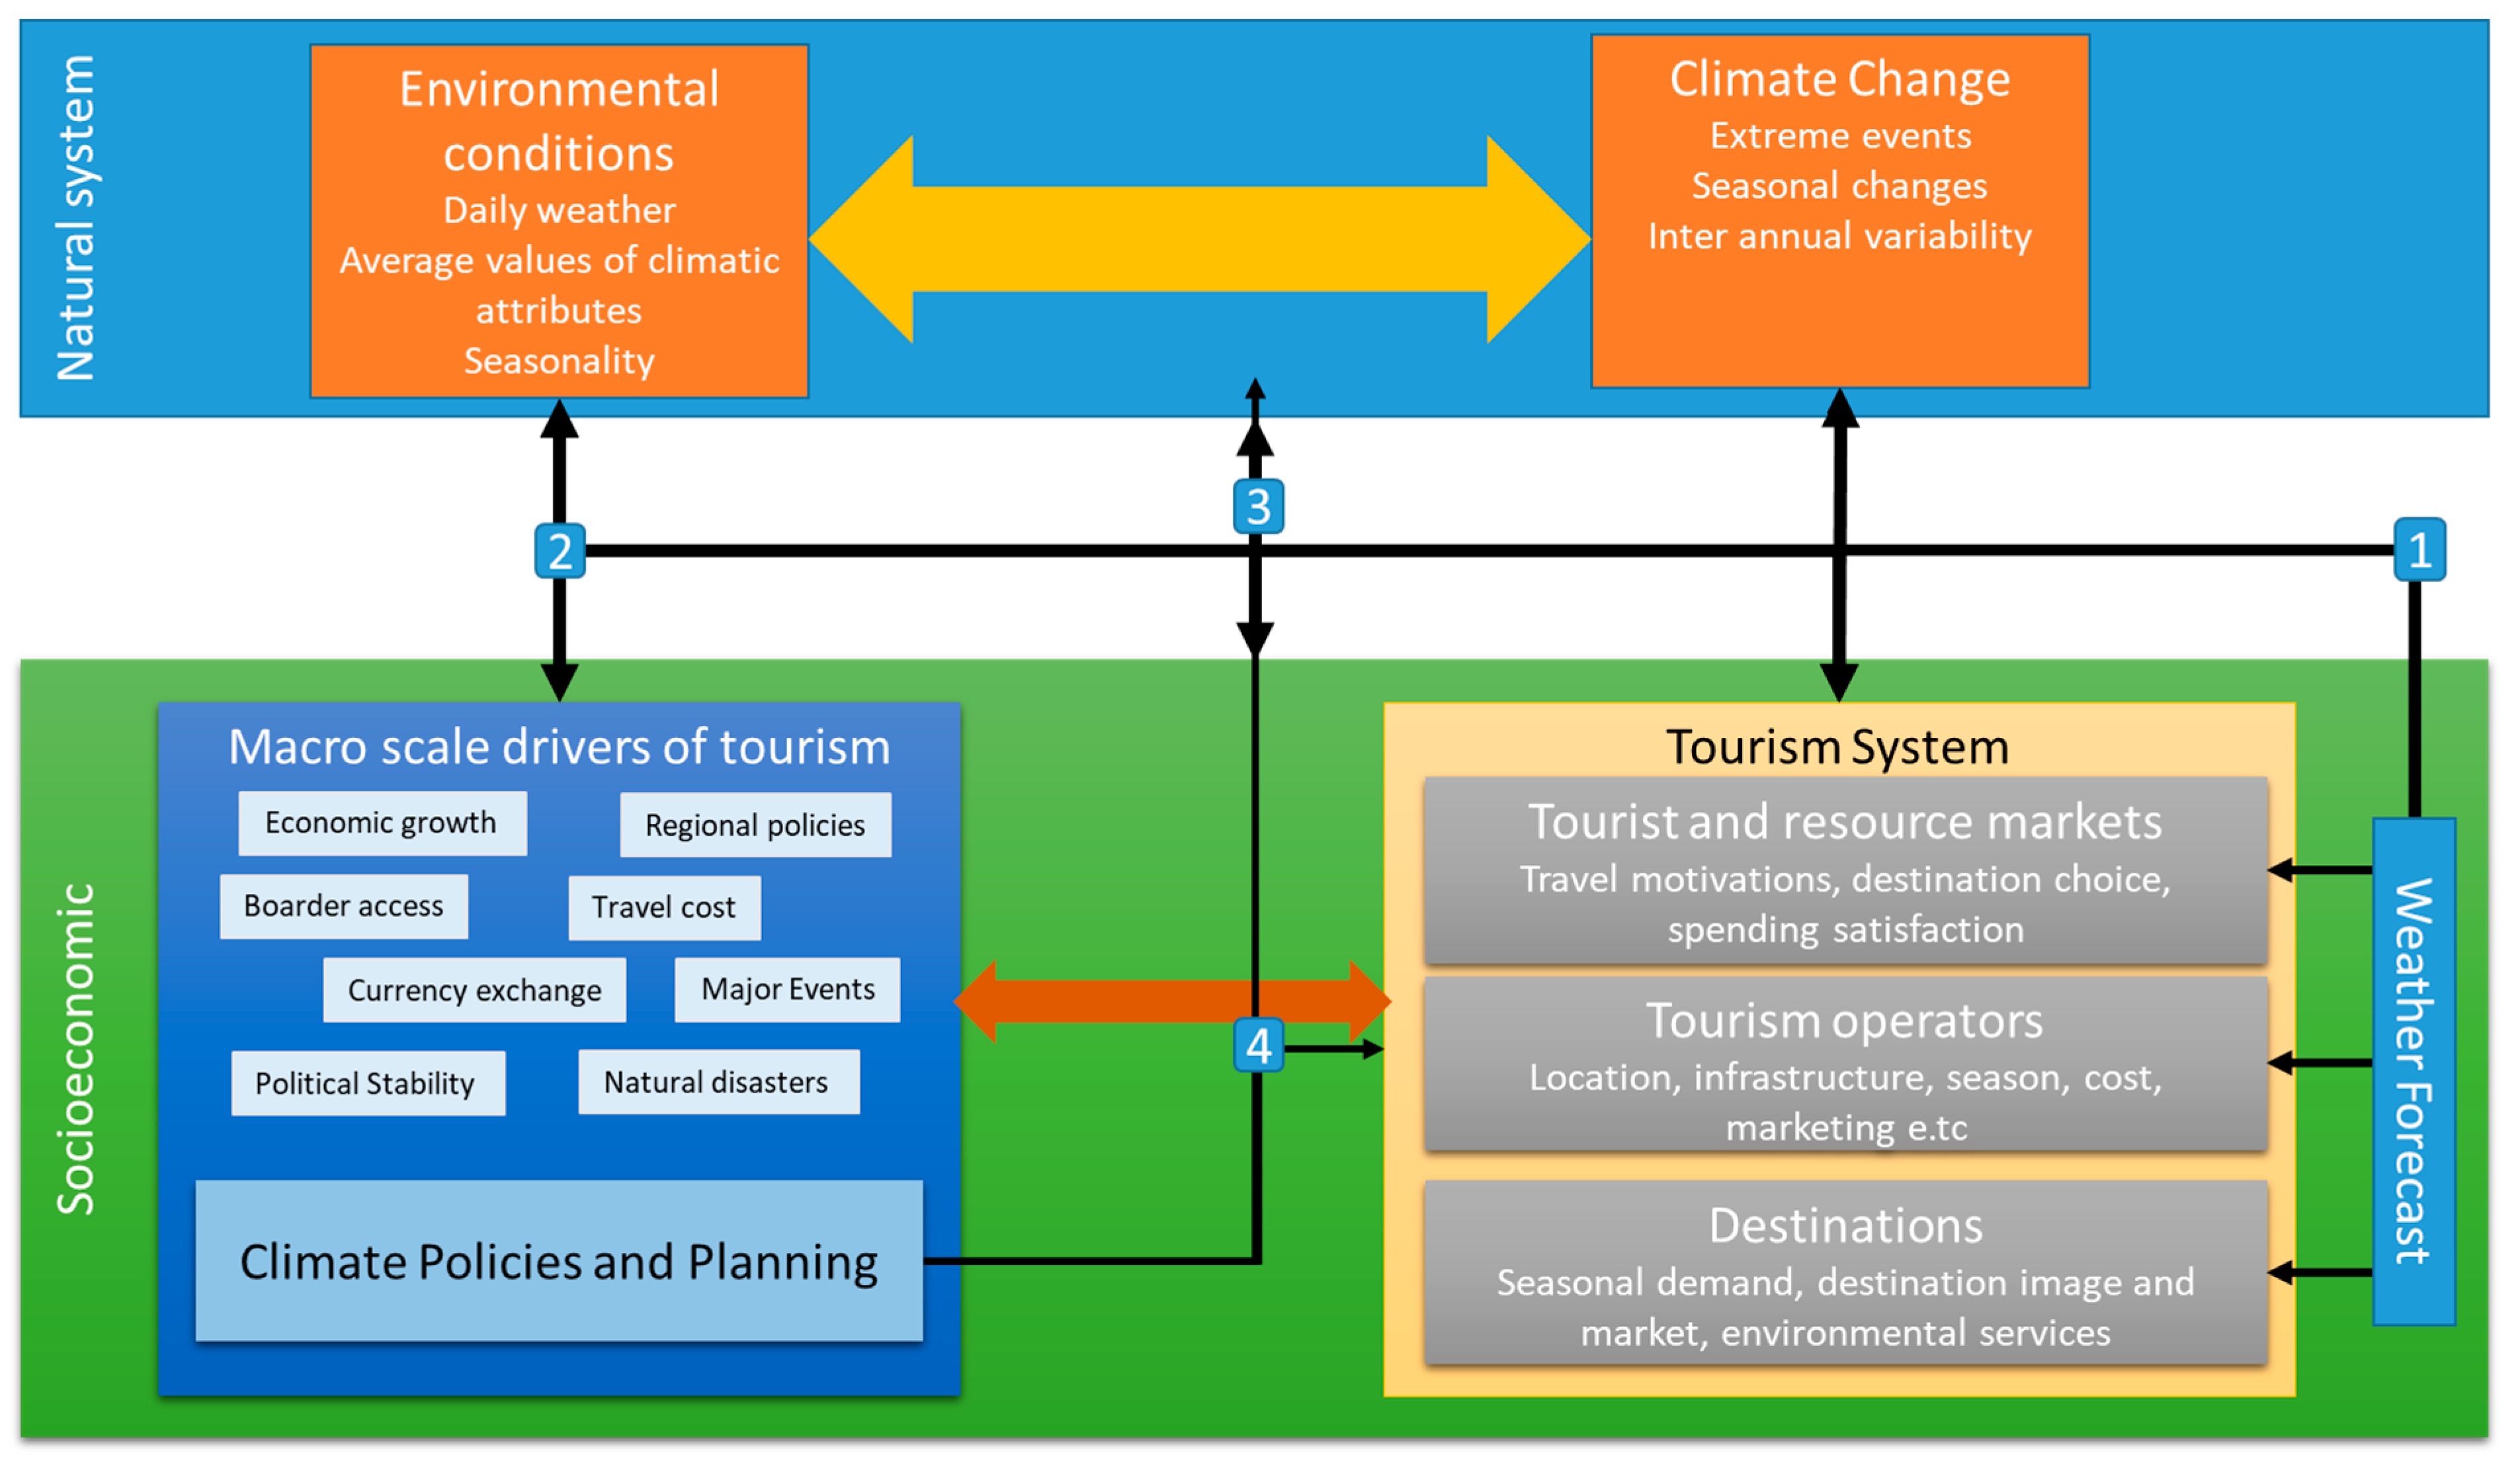
The multifaceted interface between climate change and the tourism system is illustrated in Figure 1, which sets out the four broad pathways (arrows 1–4) by which climate change can affect the future prospects of tourism [13]. The first pathway includes the direct climatic impacts that affect the length and quality of climate-dependent tourism seasons. In the second pathway, the indirect climate-induced environmental change, affecting the natural assets, influences the destination image. In the third pathway, the indirect climate induces socioeconomic change such as decreased economic growth and discretionary wealth, increased political instability and security risks or changing attitudes toward travel. Finally, the fourth pathway includes the policy responses of other sectors, such as mitigation policy, which could alter transport cost structures and destination or modal choices, as well as adaptation policies related to water rights or insurance costs; this has important implications for tourism development and operating costs [13].
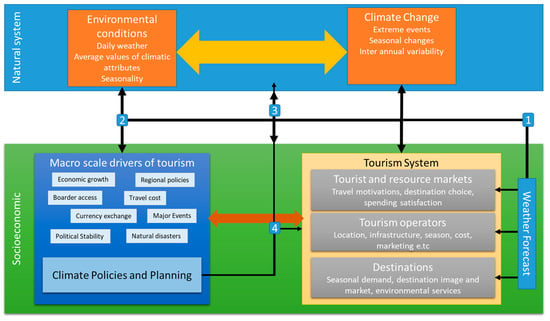
Figure 1.
Climate change impact pathways (1: Weather to environmental conditions; 2: Macroscale drivers of Tourism to environmental conditions; 3 Socioeconomics to Natural System and 4: Climate Policies on Natural system) on international tourism (modified from the literature [18]).
In recent years, growing and diverse research has explicitly focused on the relation between tourism and climate change. Several studies focus on particular tourism destinations and investigate how the regional tourism sector is exposed to and is or can be modified by climate change.
Other studies build statistical models of behaviour by focusing on the tourism demand of certain types or groups of tourists as a function of weather and climate [19], which can be thought of as sensitivity analyses [18]. Changes in tourism demand have also been addressed in simulation models, where the projected changes in tourism flows are evaluated on the basis of how climate change affects the attractiveness of a place relative to its competitors [20]. A climate change vulnerability framework has also been developed for the tourism sector [18], for example, beach tourism. For example, sunbathing and swimming are more linked under specific weather conditions and environmental changes than other tourism activities, for example, sightseeing, with this link being the source of vulnerability [21,22]. A key finding in the literature is that tourism is very sensitive to climate change, both in tourism source and destination regions. It is also sensitive to climate seasonality, and according to Viner [23], it is “the seasonal contrasts that drive the demand for summer vacations in Europe” [23]. For the Mediterranean region’s climate, changes may result in seasonal changes and extended tourism seasons. Tourism may decrease during summer because of the increased temperature during this period of the year, whereas tourism in spring and autumn may increase. In central Europe, climate change will affect traditional winter tourism regions. During winter, significant reductions in natural snow cover are expected to shorten the season, and thereby significantly impact on the ski industry. Nevertheless, the effect of extreme weather phenomena is yet to be evaluated.
Cultural goods usually embody a sense of a symbolic meaning for society and a reference to an important era, a style or a celebrated event in the past. Cultural heritage assets can be considered as living parts of past human activities, carrying a great historic value and a high degree of local specificity. As cultural heritage assets are present for long periods, their reference to society is, at least partially, the result of shared values held among locals or, sometimes, a broader community [24]. Thus, it can be assumed that cultural heritage assets can provide goods that are emerging out of common values of society [1]. In this context, Nijkamp [1] argues that the economic evaluation of cultural heritage assets finds their roots in the evaluation of non-priced goods, and are related to the evaluation of environmental goods. In this concept, the value of a visit to a cultural heritage site is not only the value that is attached to recreation, but there is also a value coming from education. Thus, estimations of fully separate values for each of the above benefits may be impossible. However, a partial separation of these values aiming to identify some of the broader benefits in categories (e.g., use and non-use) may still be possible. Furthermore, values can be defined in terms of primary and secondary benefits. Primary benefits are the direct benefits from a cultural heritage asset to the profits of the management authorities, whereas secondary benefits refer to wider socioeconomic impacts that may be distant from the actual cultural heritage asset, such as a museum’s impact on employment creation, tourism and gross domestic product (GDP).
The above discussion provides a context for assessing the economic value of cultural heritage assets, but the evaluation task itself is still filled with many uncertainties and dilemmas. To this end, the economic literature offers a wide array of approaches. These may range from methods that use behavioural-oriented approaches, to stated preference methods, such as contingent valuation analysis or conjoint analysis. Other more quantitative approaches include multi-attribute utility methods; market-based methods, such as travel cost, and hedonic price models. All of these approaches have pros and cons, depending on the conditions under which they are applied [25]. The fact that cultural heritage assets also have a cultural value, differentiates them from other kinds of assets. In the practical world of heritage decision making, assigning an appropriate value, economic, cultural, or a mix of the two, to heritage assets and to the relevant services is an all-pervading challenge.
As in the case of evaluating natural environments, for the identification of the economic value of heritage assets, it is customary to distinguish between use and non-use values, that is, between the direct value to consumers of the heritage services as a private good, and the value accruing to those who experience the benefits of the heritage as a public good. Sometimes these effects are referred to as market and non-market values, respectively [24].
A distinction is drawn, for example, between the active use of a heritage building or site and the passive use that arises as an incidental experience for individuals, such as when pedestrians enjoy the aesthetic qualifications of a monument when they happen to pass by [24]. The latter benefit is classified as a positive externality. Although in practice, a monetary value could be assigned to it, it is usually neglected in any calculation of the economic value of cultural heritage, as a result of difficulties in defining populations of beneficiaries and their respective willingness to pay, in order to enjoy and/or protect cultural heritage assets in valid terms.
Turning to the non-use value, it can be observed that cultural heritage assets yield public good benefits that can be classified in the same ways in which the non-market benefits of environmental amenities, such as forests and so on. These non-use values are not observable in market transactions, as no market exists where they can be exchanged, even though there is the argument that the social economy sector is an aspect.
The economic impact studies can be used for the valuation of cultural heritage assets, especially those attracting large numbers of tourists who spend money in the relevant area [26]. These impact studies try to monetize the direct and indirect effects of a cultural heritage asset on its impact area. These studies focus mainly on the distinct good character of these assets, which is usually captured by market transactions instead of by merit or public good characteristics [27].
To measure the direct net impact of cultural heritage assets on user groups, it is important to identify the main spending groups in the region affected by the relevant assets. Next, the indirect net impacts depend on the chain or induced effects of the direct net impacts for the related impact area. Clearly, the amount of leakage in a multiplier sense depends on the size and nature of the impact area [18]. Baaijens and Nijkamp [27] offer an empirical meta-analysis approach regarding the relevant leakages in the tourism regions, and present a rough set analysis approach to estimate the income multipliers for different characteristics of the impact areas [28], which can be used for estimating the indirect economic value of cultural heritage sites.
The conservation of cultural heritage assets, especially in historic city centres, is likely to give rise to significant non-market benefits. These benefits arise as public goods enjoyed in various ways by businesses, residents and visitors, both in the cultural heritage site and in the wider area.
2. Case Study Areas
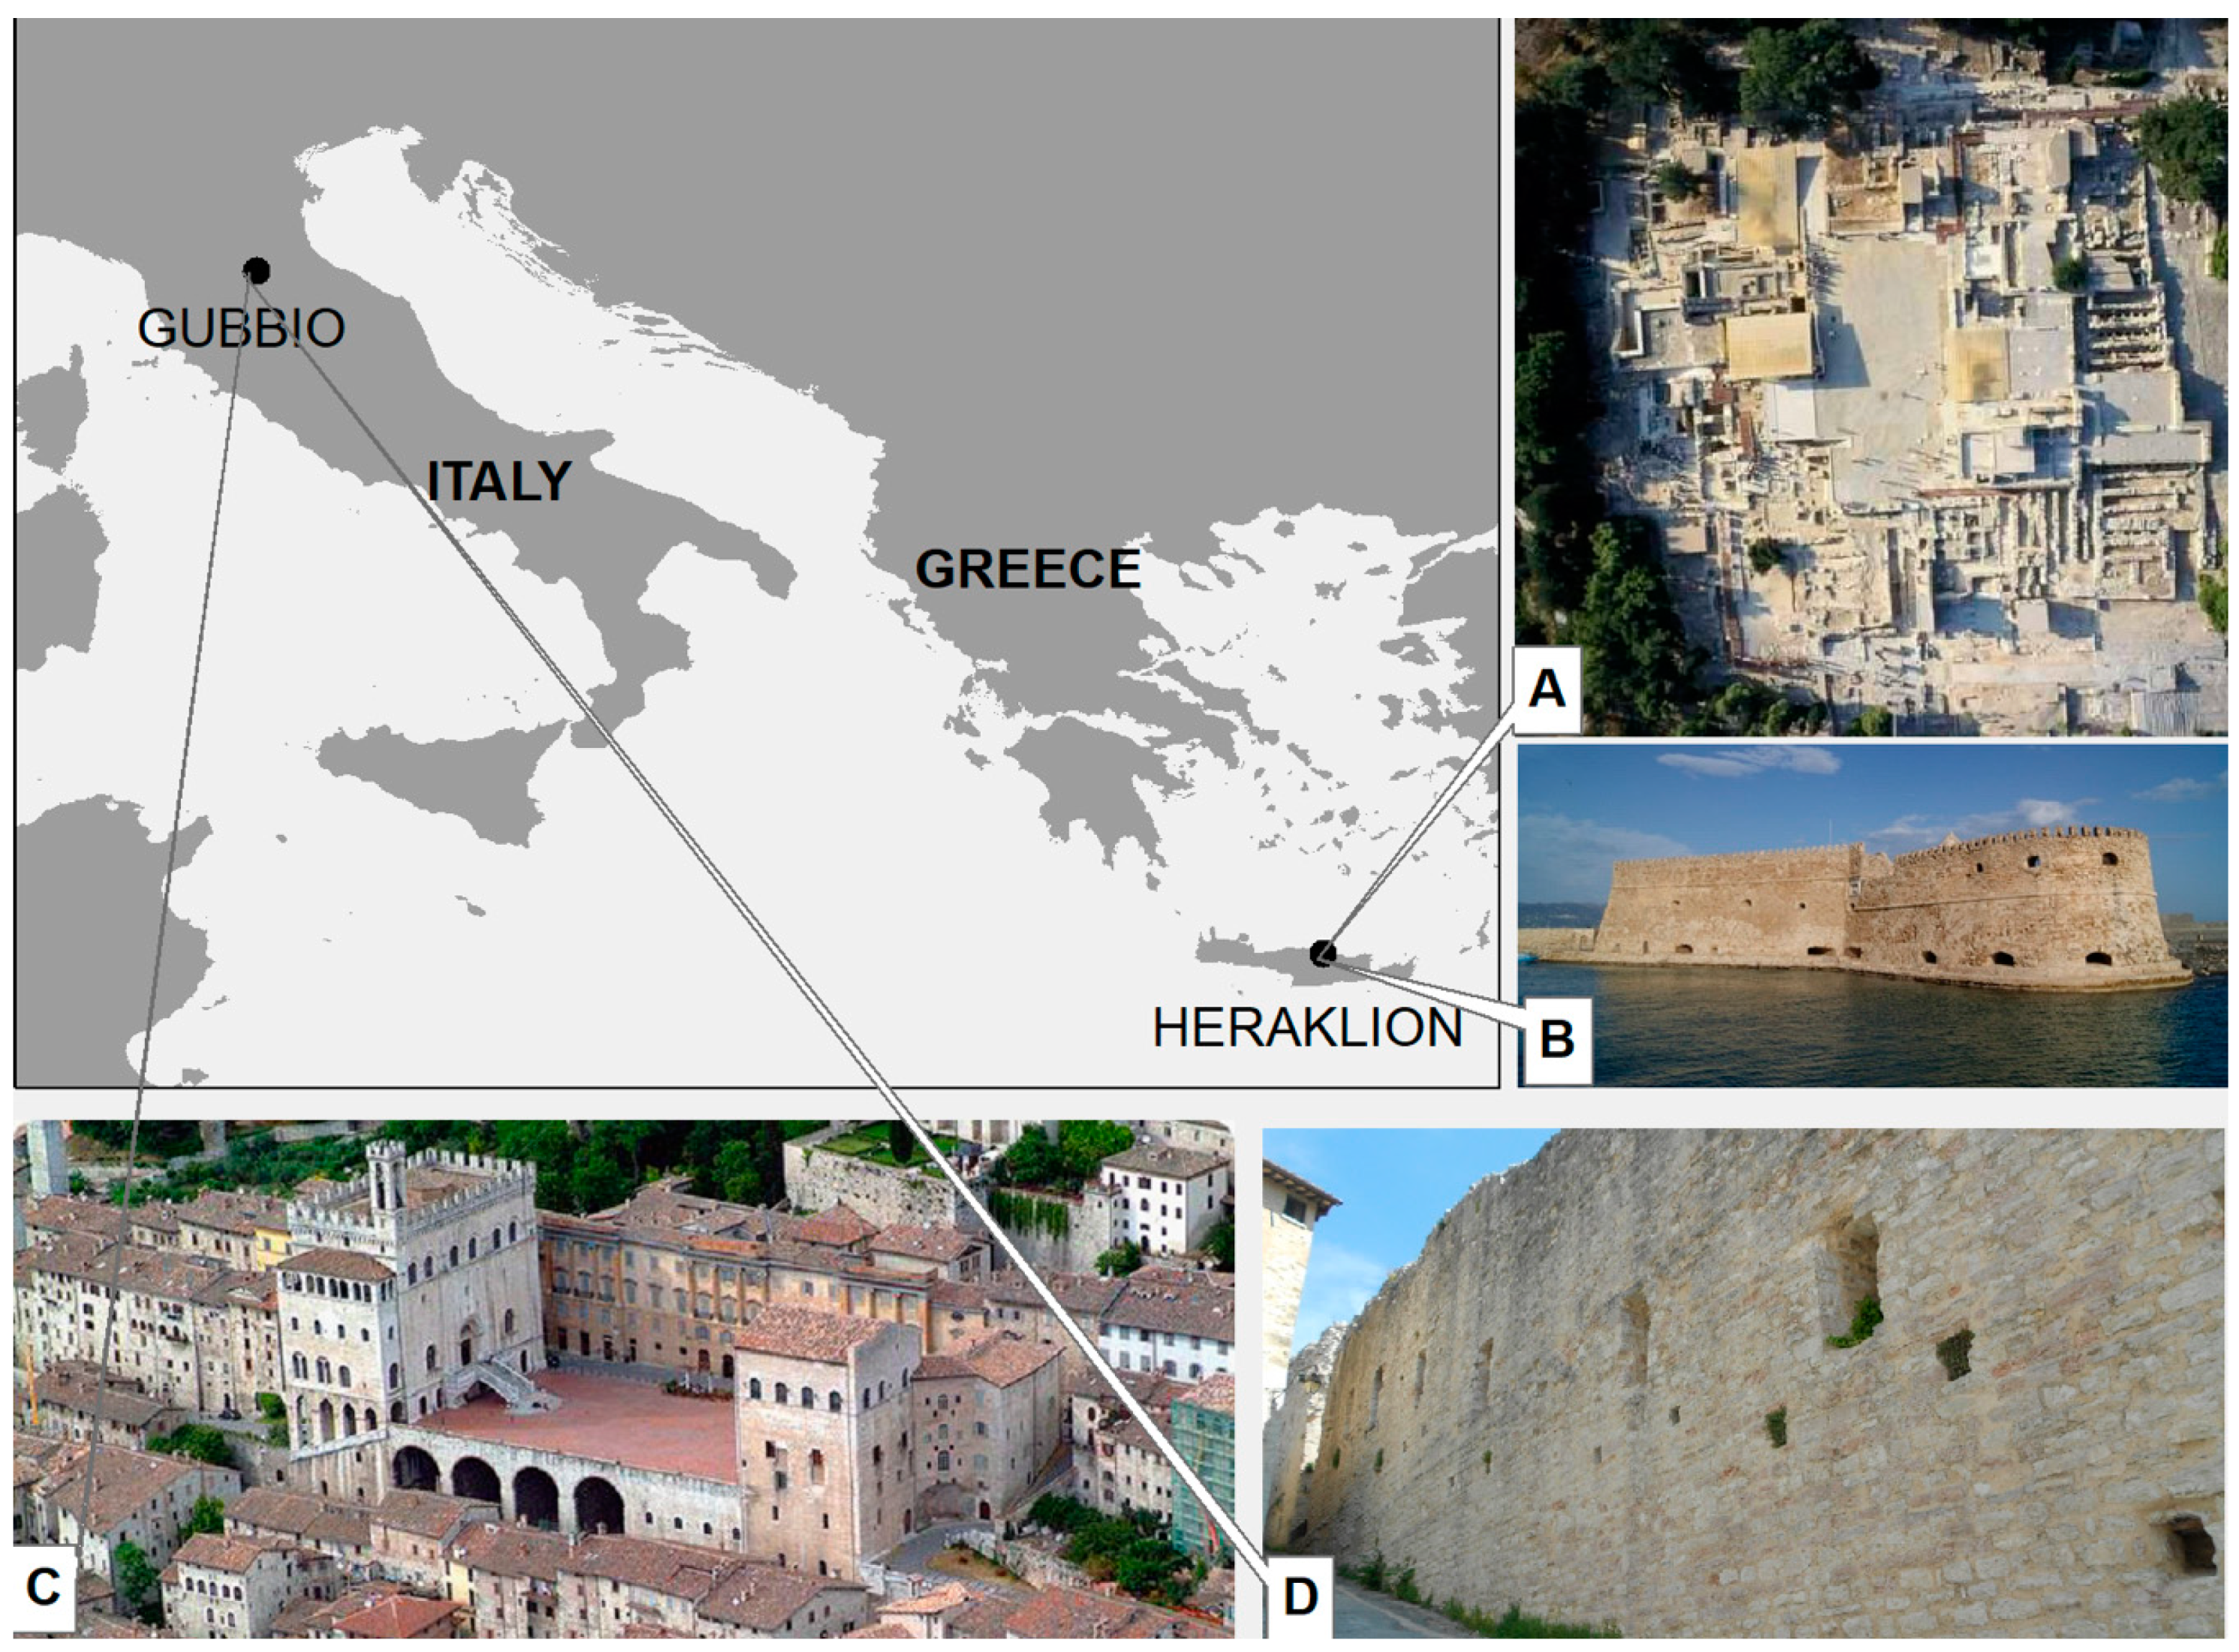
This work is part of the European Project HERACLES (HEritage Resilience Against CLimate Events on Site), and the two cities that were chosen as the case study areas are Gubbio in Italy and Heraklion in Greece. Then, for each city, two specific monuments were chosen. The selection of the sites was based on the fact that cultural heritage has an important role in their identity, economy and everyday life. For Heraklion, the monuments are the Minoan Knossos Palace, the centre of the first civilization of the Mediterranean basin (the Minoan civilization is in the tentative UNESCO list), and the Sea Fortress of “Koules”, which symbolises all of the monuments facing risk of hazards from climatic change, such as a significant impact from the sea (Figure 2A,B). Gubbio represents the historical monumental towns in Italy and in Europe that were built in the past, following criteria from when the climate conditions were very different from nowadays, and that presently suffer the effects of climate change that could endanger their safety. The Gubbio monuments included in the study are the Gubbio walls and Palazzo dei Consoli (Figure 2C,D).
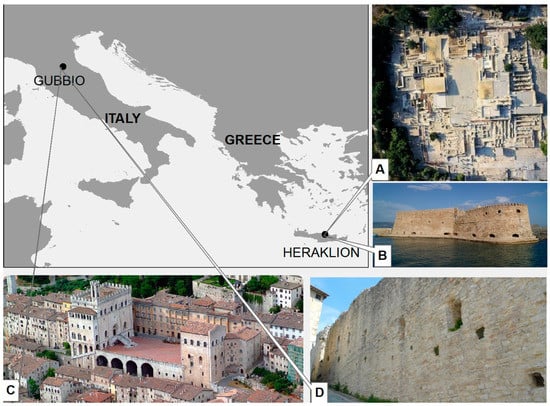
Figure 2.
Case study areas: (A) Knossos Palace; (B) Rocca a Mare (Koules); (C) Palazzo dei Consoli; (D) Guddio Walls.
2.1. Region of Crete and Heraklion Monuments
The island of Crete is the cradle of the Minoan civilization (c. 2700–1100). It is located in the southern part of the Aegean Sea, separating the Aegean from the Libyan Sea. It is the largest and most populated of the Greek islands and the fifth largest in the Mediterranean Sea. Its population is more than 600,000 people. In the post-war years, the economy of the island was predominantly based on agriculture. The economy began to change radically during the 1970s as tourism started gaining importance. Crete produces the 5.7% of the total GDP of the country, where 31% is produced in the primary sector, 13% in the secondary and 56% in the tertiary sector of the regional GDP, as the region of Crete reports. The corresponding percentages for the country are 15% in the primary sector, 25% in the secondary sector and 60% in the tertiary sector [29,30].
Crete is one of the most popular holiday destinations in Greece. In total, more than four million tourists visit Crete every year, with the capacity of the Island based on official records being 5.5 million [31,32]. In recent years, the tourism sector has been dynamically developing and gives incentives for important investments in hotel units and for hotel infrastructure upgrade [33]. At the same time, the sector faces structural problems, consisting mainly of its seasonal nature and the limited expansion of tourists to the inland settlements. Tourism infrastructures are mainly gathered in the northern coast with rather smaller centres in the south, while its course is largely influenced by outward, uncontrollable conditions, contributing to fluctuations in its performance. An important, competitive advantage of the tourist industry is the high percentage of high standard hotel infrastructures.
Heraklion is the largest city and the administrative capital of the island. The city of Heraklion is the largest urban centre in Crete (the fourth largest municipality in Greece) and the economic centre of the island. Heraklion has the largest share of industrial activity in Crete. More than 60% of the industrial units of Crete are located around the city. The dominant position in the tertiary sector holds the sectors of trade and tourism. The concentration of infrastructure is located within the connective tissue of the residential areas of Heraklion.
The Minoan Knossos Palace is a spectacular Bronze-Age citadel and represents the ceremonial, economic, social and political centre of the first civilization of the Mediterranean basin, namely the Minoan civilization. Also known as the Palace of Minos, as a citadel, it is considered Europe’s oldest city. It was continuously inhabited from the Neolithic period (7000–3000 BC) until Roman times. It is located in the southeast of the city of Heraklion, and is the largest and the most glorious of the all Minoan Palaces in Crete, covering an area of 22,000 sqm. The Palace was excavated partly by M. Kalokairinos, and fully by Sir A. Evans between 1900 and 1905 [34,35]. The Sea Fortress of “Koules” is located in the port of Heraklion and constitutes a characteristic type of Venetian military architecture. Similar fortifications can be found in all of the major cities in Crete (Rethymnon and Chania), as well as in other locations in the Mediterranean basin (Cyprus). In fact, an important part of the cultural heritage in Greece and in Europe is on the coastal area throughout the Mediterranean (cities, ports, lighthouses, fortresses and other monuments), which face the risk of hazards from climatic change, such as a significant impact from the sea (sea level rising, increasing intensity of extreme weather phenomena combined with the air and land associated hazards, increased salinity accelerating corrosion and deterioration of materials and structures, etc). The Venetian Sea-Fortress is an emblematic monument for the city of Heraklion. Better known as Kοules, it is situated at the edge of the northwest breakwater of the Venetian harbour [36,37]. Overall, the monuments of Heraklion are the giant Venetian walls (the largest in the Mediterranean) with the various gates. In the historic centre, the Archaeological Museum is one of the most important in Greece. Moreover, other monuments include Loggia; the square with the Fountain of Lions; Basilica of San Marco and the churches of Saint Titos, Saint Minas, Saint Catherine and Saint Peter. However, the monuments of Knossos and the Fortress “Roca al Mare”, along with the Archaeological Museum, are the ones attracting the most tourist attention [31].
2.2. Umbria Region and Gubbio
Umbria is referred as “Il cuore verde d ‘Italia” (the green heart of Italy) because of its central position in Italy and its environmental characteristics. It is bordered by Tuscany to the west, Marche to the east and Lazio to the south, and is the only Italian region having neither a coastline nor a common border with other countries. Umbria’s current economic structure is the result of a series of transformations that took place during the 1970s and 1980s, when a rapid expansion among small- and medium-sized firms and a gradual downsizing among the large firms, which had hitherto characterised the region’s industrial base, took place. By 2012, the industrial system was characterized by micro- and small-size firms operating in trade (24.71%), agriculture (21.45%), construction (15.13%) and manufacturing (9.86%), with a gradual transition, compared to the past, from a system strongly focused on agriculture, to one where the service sector and industry play a major role. Regarding its industrial specialisation, Umbria maintained, even with some resizing, an employment advantage in the traditional and basic food industries, clothing, non-metal mineral processing and metallurgy. As for the other manufacturing sectors, the latest data available in 2013 show the decline of the chemical industry, accounting for 0.88% in 2012, and a significant presence in the wood, paper and printing industries, areas where the region has a specialization index, which were ranked in the second position, after the food sector. Tourism includes about four million tourists a year, of which about half a million come from abroad. Tourism in the area covers a wide range of interests, such as, religious, historical, artistic, congressional and environmental [38].
Gubbio is the capital of one of the largest Italian municipalities (the seventh largest with its 524 square km), with a population of around 32,000 inhabitants, and traditions dating back to about 1000 AC (i.e., Festa dei Ceri—Saint Ubaldo day), which is to be inscribed in the list for the immaterial UNESCO Heritage Site.
In Gubbio, urban planners and administrators met and created the “Gubbio Charter 1960” and the Italian National Association for the historic-artistic centres (ANCSA), which set a number of criteria for intervening in the historic centres, and its content was considered in the Venice Charter in 1964 (International Charter for Restoration) and in the European Charter of the Architectural Heritage adopted by the Council of Europe in 1975. The old town of Gubbio is positioned at the bottom of the Apennines hillside, which dominates the town from the northeast side. The old town is surrounded by city walls that were built approximately 1500 years ago. Concerning the economic aspects, currently, the territory is in strong economic difficulties because of the crisis of different industrial sectors and a rising unemployment rate. The sector presenting growth potential is tourism. The main attractions for Gubbio tourism are of cultural, religious, natural and artistic heritage, as well as artistic handicraft and gastronomic heritage.
The Gubbio Walls were built after the fall of the Roman Empire, when the settlements in the plains were occupied by the Goths and were abandoned to move on the mountain. The current appearance of the old town of Gubbio began to form after three centuries of Barbarian populations’ raids (Heruli and Goths), of real invasions (Normans, Ungarians and Saracens) and alternate dominations (Longobards and Byzantines). At the end of the Middle Ages, the most important monuments of Gubbio were build. Those include, among others, the complex of the “Consoli Palace”, Podestà Palace (the actual Town Hall) and “Piazza Grande’’. Gubbio is a town with medieval streets and the most notable attractions are the Palazzo dei Consoli and its gallery and adjoining Piazza Grande, the plain-faced Duomo and the medieval city walls in the mountainous backdrop.
The Consoli Palace was built between 1332 and 1349 and was designed by Angelo da Orvieto. The Palace has a rectangular shape and a very articulated distribution of volumes. Since 1901, it has hosted the town museum, presenting an art gallery, ceramics section, archaeological and oriental collections, and a section on the period leading to the unification of Italy (Risorgimento). Since the nineteenth century, many restorations were made, as follows: the re-building of the main stairs; reinforcement interventions with anti-seismic techniques after the earthquakes of the early 1980s, particularly the one of 1984; the cleaning of the façade and interior walls; optimization of the museum lighting and plumbing and the restoration of the wooden external portals and doors [39,40,41,42,43].
3. Materials and Methods
In this work, the total economic value framework for cultural heritage was used to identify a primary categorisation of the use and non-use benefits, with the “use” benefits being subdivided into direct and indirect categories [44,45]. Direct use benefits cover a wide range and can include residential, commercial, tourism, leisure, educational and religious related benefits. Indirect use benefits could arise in the form of enhanced community image and social interaction.
Following the total economic value framework for cultural heritage, it is considered that each cultural heritage site creates four types of value, namely: direct economic value, indirect economic value, non-market value and cultural value. The method applied here is restricted to the first two types of value because of the difficulties in quantifying the latter two types of value. The aim of this modification is to estimate the economic value of the cultural heritage sites that contribute to revenues by considering that there are no changes in the non-market and the cultural value of the sites.
The estimations of the total economic value for a cultural heritage site, for a certain period of time, is based on the forecast for the expected number of visitors during the relevant period, in the area of the site. More specifically, the total economic value for cultural heritage site Si for year Yt (TEVit) is the sum of the direct economic value of Si for year Yt (DEVit) and the indirect economic value of Si for year Yt (IEVit).
DEVit is the expected revenue of Si during Yt. For year Yt, DEVit is the product of the expected number of visitors in Si multiplied by the expected ticket price of Si.
The net present value of the DEVit, from year Tstart to year Tend, for a certain rate of return (r), is given by the following:
The IEV capitalizes the inter-industry socioeconomic effects created by the expected number of visitors for year Yt in the area where Si is located. This is based on the argument, according to which cultural heritage site Si contributes to a large extent to make an area famous and attractive for tourists. Therefore, this branding effect is capitalized in the indirect value created by visitors in the area of Si.
In this context, IEVit is the expected volume of expenditures of the expected number of visitors in the relevant area during Yt. For year Yt, IEVit is the product of the expected number of visitors in the area of Si multiplied by the average length of stay of the visitors in the area of Si, multiplied by the average daily expenditure per visitor in the area of Si.
The net present value of the IEVit, from year Tstart to year Tend, for a certain rate of return (r), is given by the following:
Based on the above analysis, the net present total economic value of a cultural heritage site Si, from year t to year T, is as follows:
3.1. Available Data
The estimation of the DEV and IEV of the test beds is based on the relevant forecasts regarding the expected number of visitors. These forecasts are based on the arrivals during 2010–2015 to the regions and cities where the monuments are located, as well as on the expected future growth rates of the arrivals to the relevant destinations.
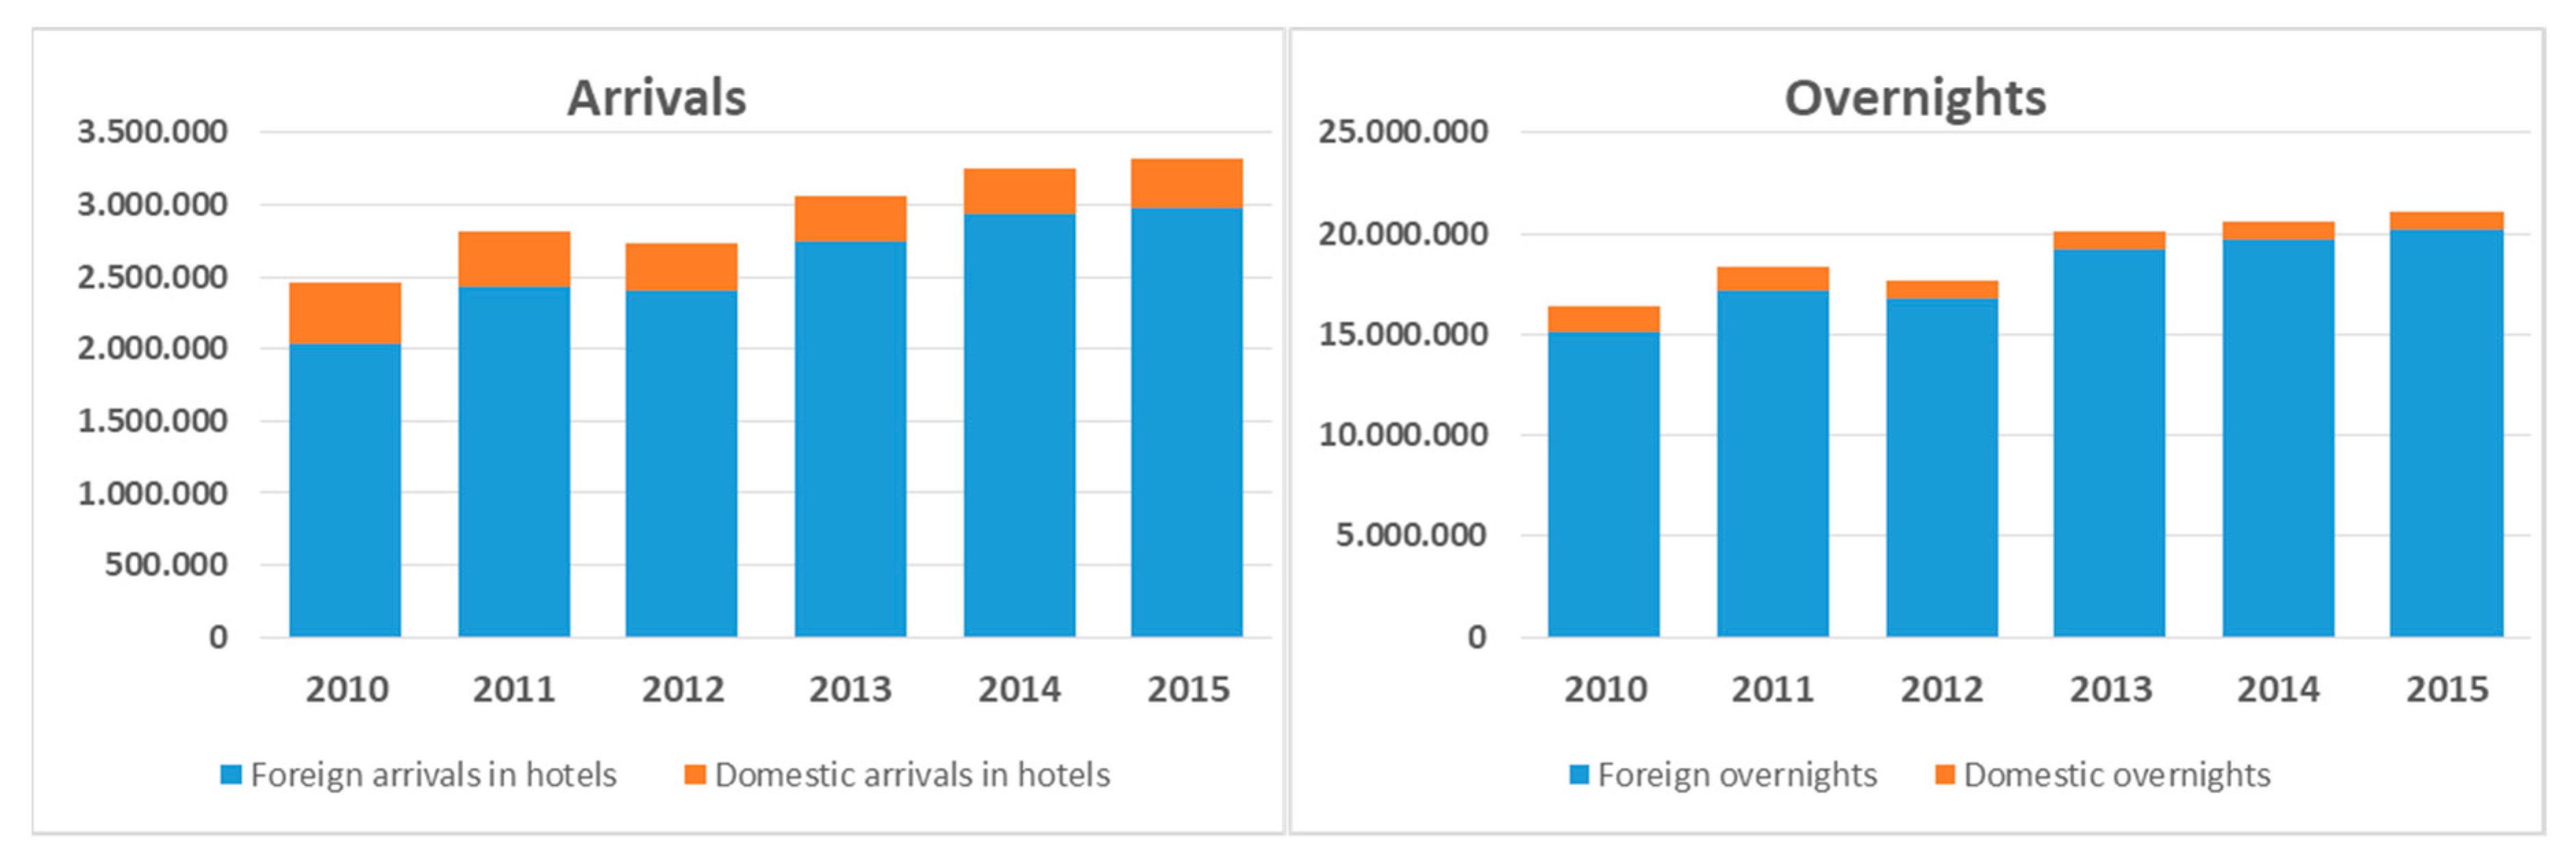
The forecasts regarding the expected number of visitors in Crete is based on the arrivals in Crete during 2010–2015 (Table 1 and Figure 3), and on the expected annual growth rate of 1.8% for foreign arrivals to Southern and Mediterranean Europe destinations provided by the European Commission [22].

Table 1.
Arrivals and overnights in Crete during 2010-2015.
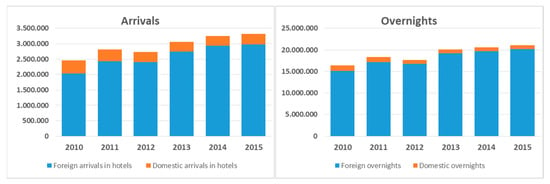
Figure 3.
Arrivals (left) and overnights (right) in Hotels for Crete.
The foreign and domestic overnights (Figure 3) are used to estimate the foreign and domestic average length of stay, which will be used for the estimation of the IEV of the Knossos Palace and the fortress of Rocca al Mare (Koules).
Detailed data concerning arrivals and overnights per regional unit of Crete are presented in Table 1. It should be noted that regarding the arrivals in Crete, besides hotels, there are arrivals in different types of accommodation, such as rent rooms. Yet, the relevant available data are not certified by the Hellenic Statistical Authority or any other official data provider and their use may drive to overestimated results.
Regarding the average length of stay, based on the data of arrivals and overstays (Table 2), it is estimated that the average length of stay of foreign visitors in Crete during 2010–2015 was 7.09 days. The average length of stay for domestic visitors was 3.04 days.

Table 2.
Average length of stay in Crete during 2010–2015.
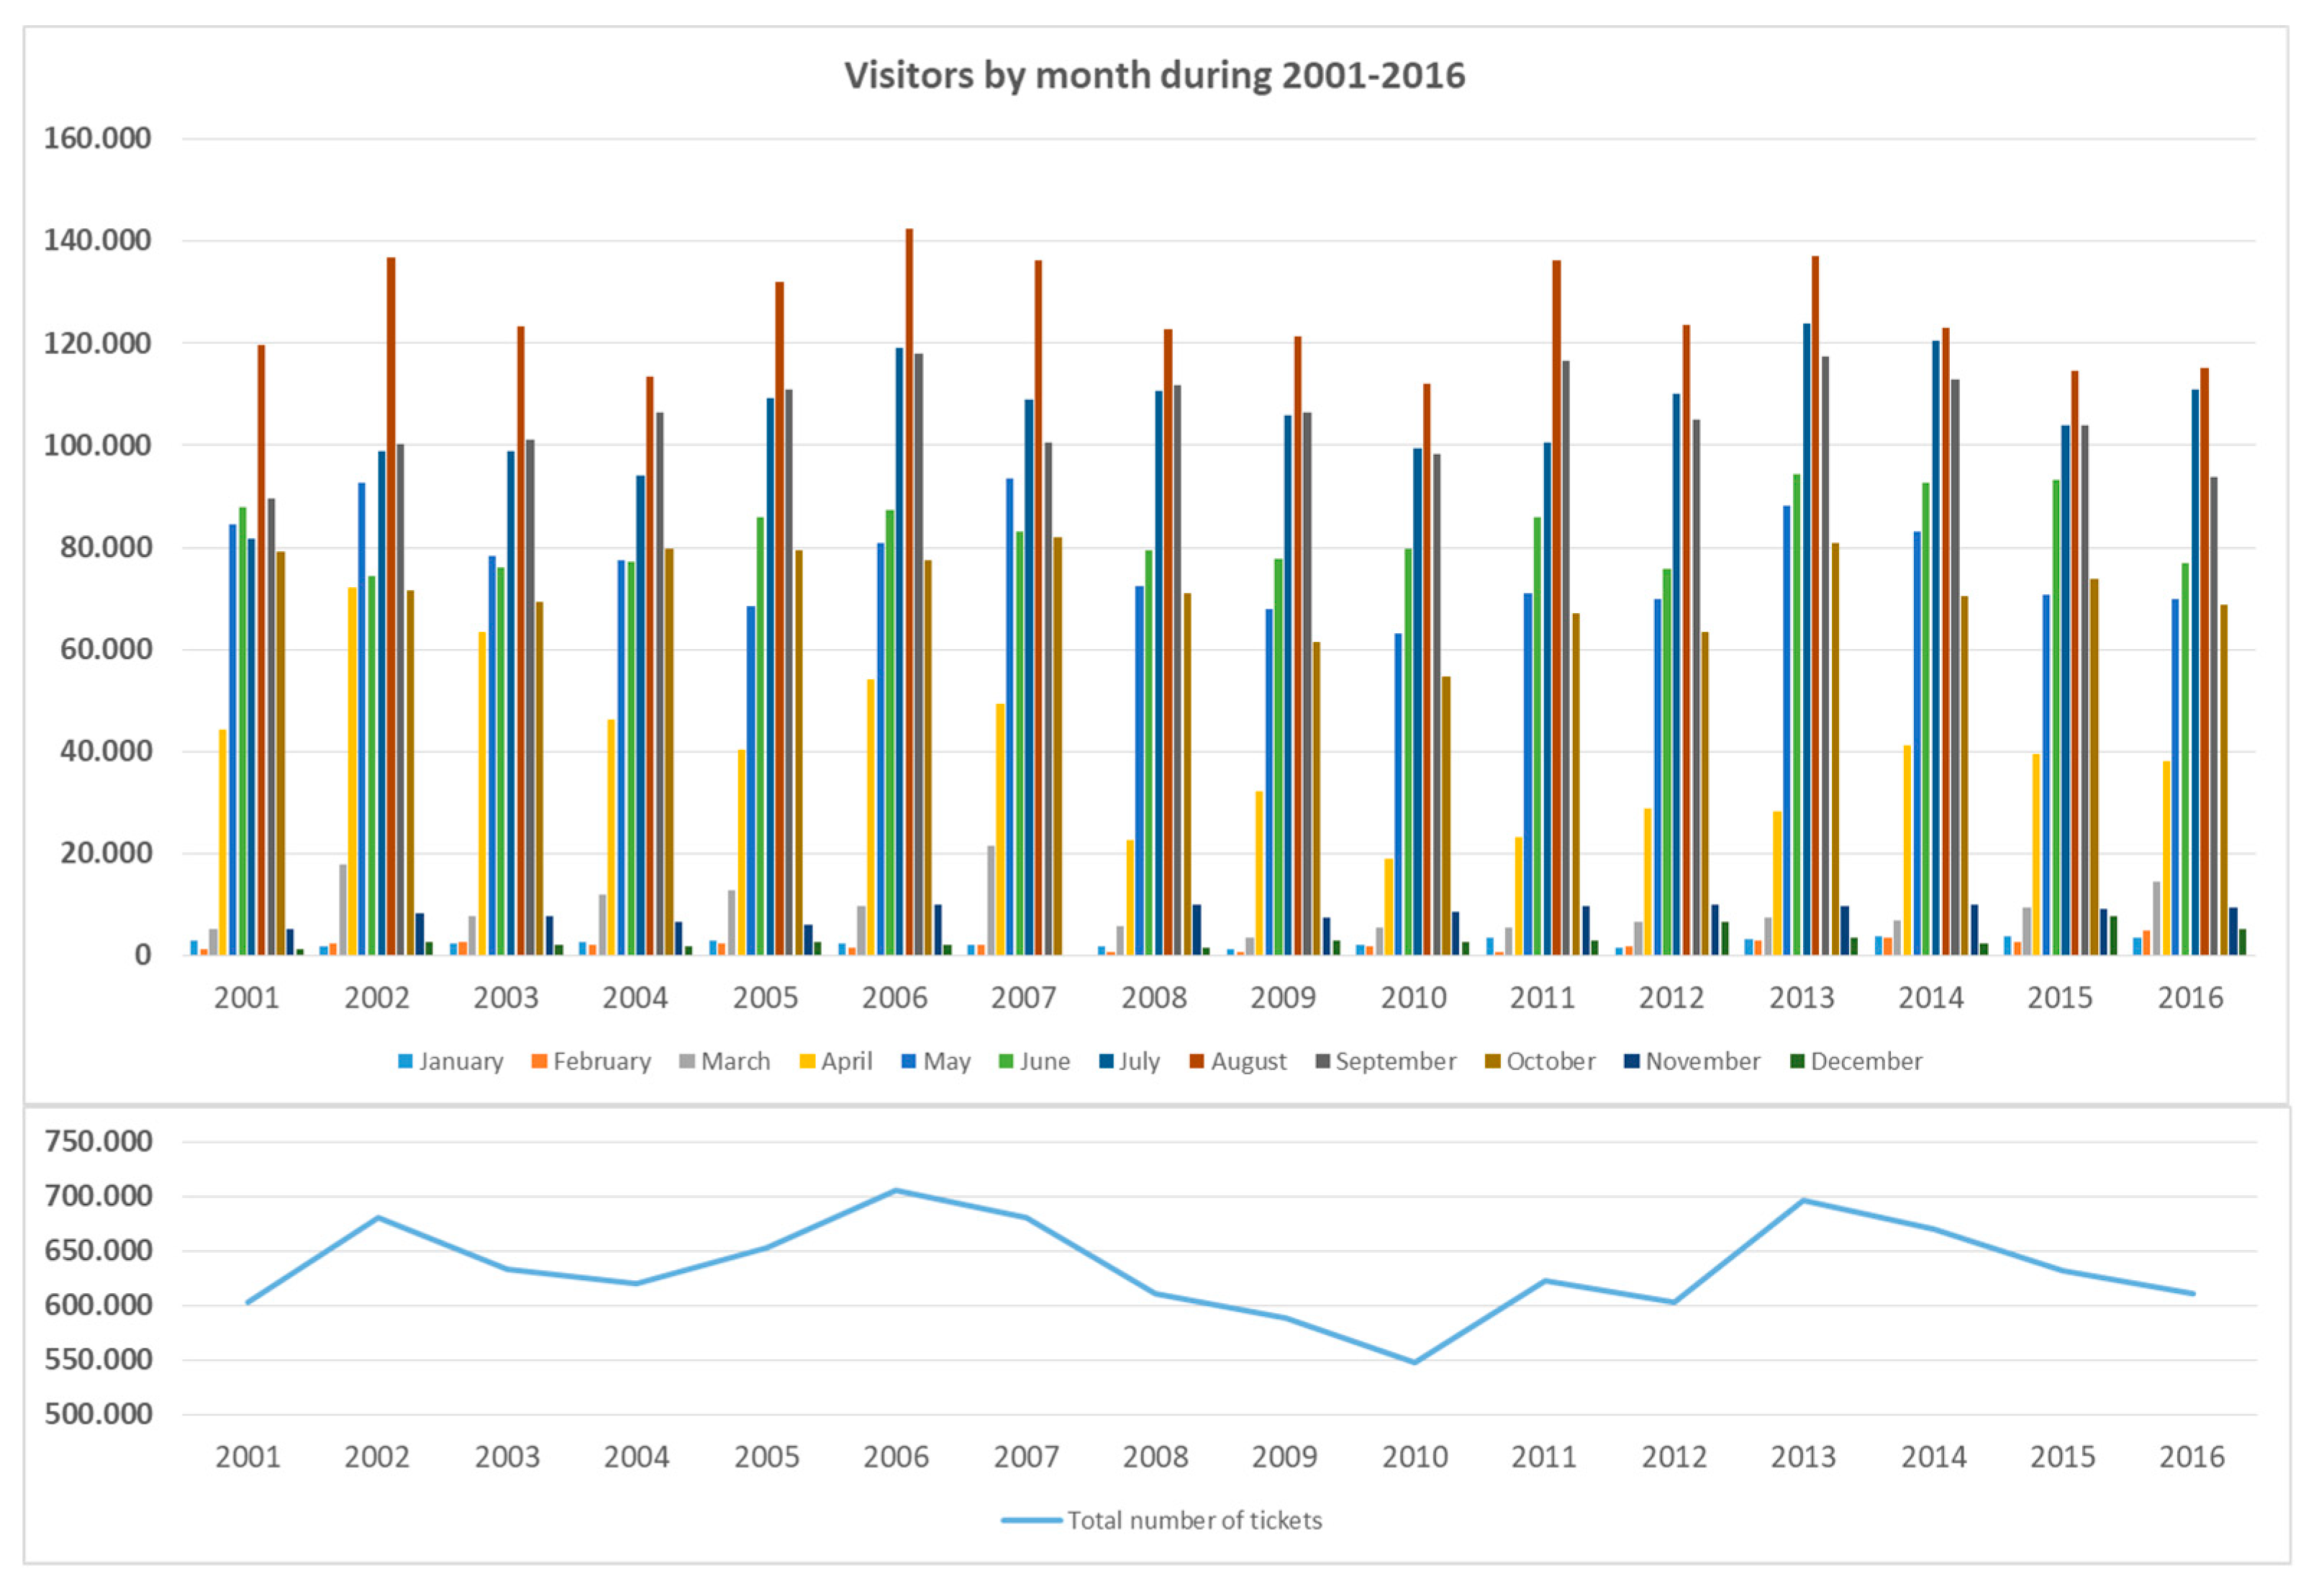
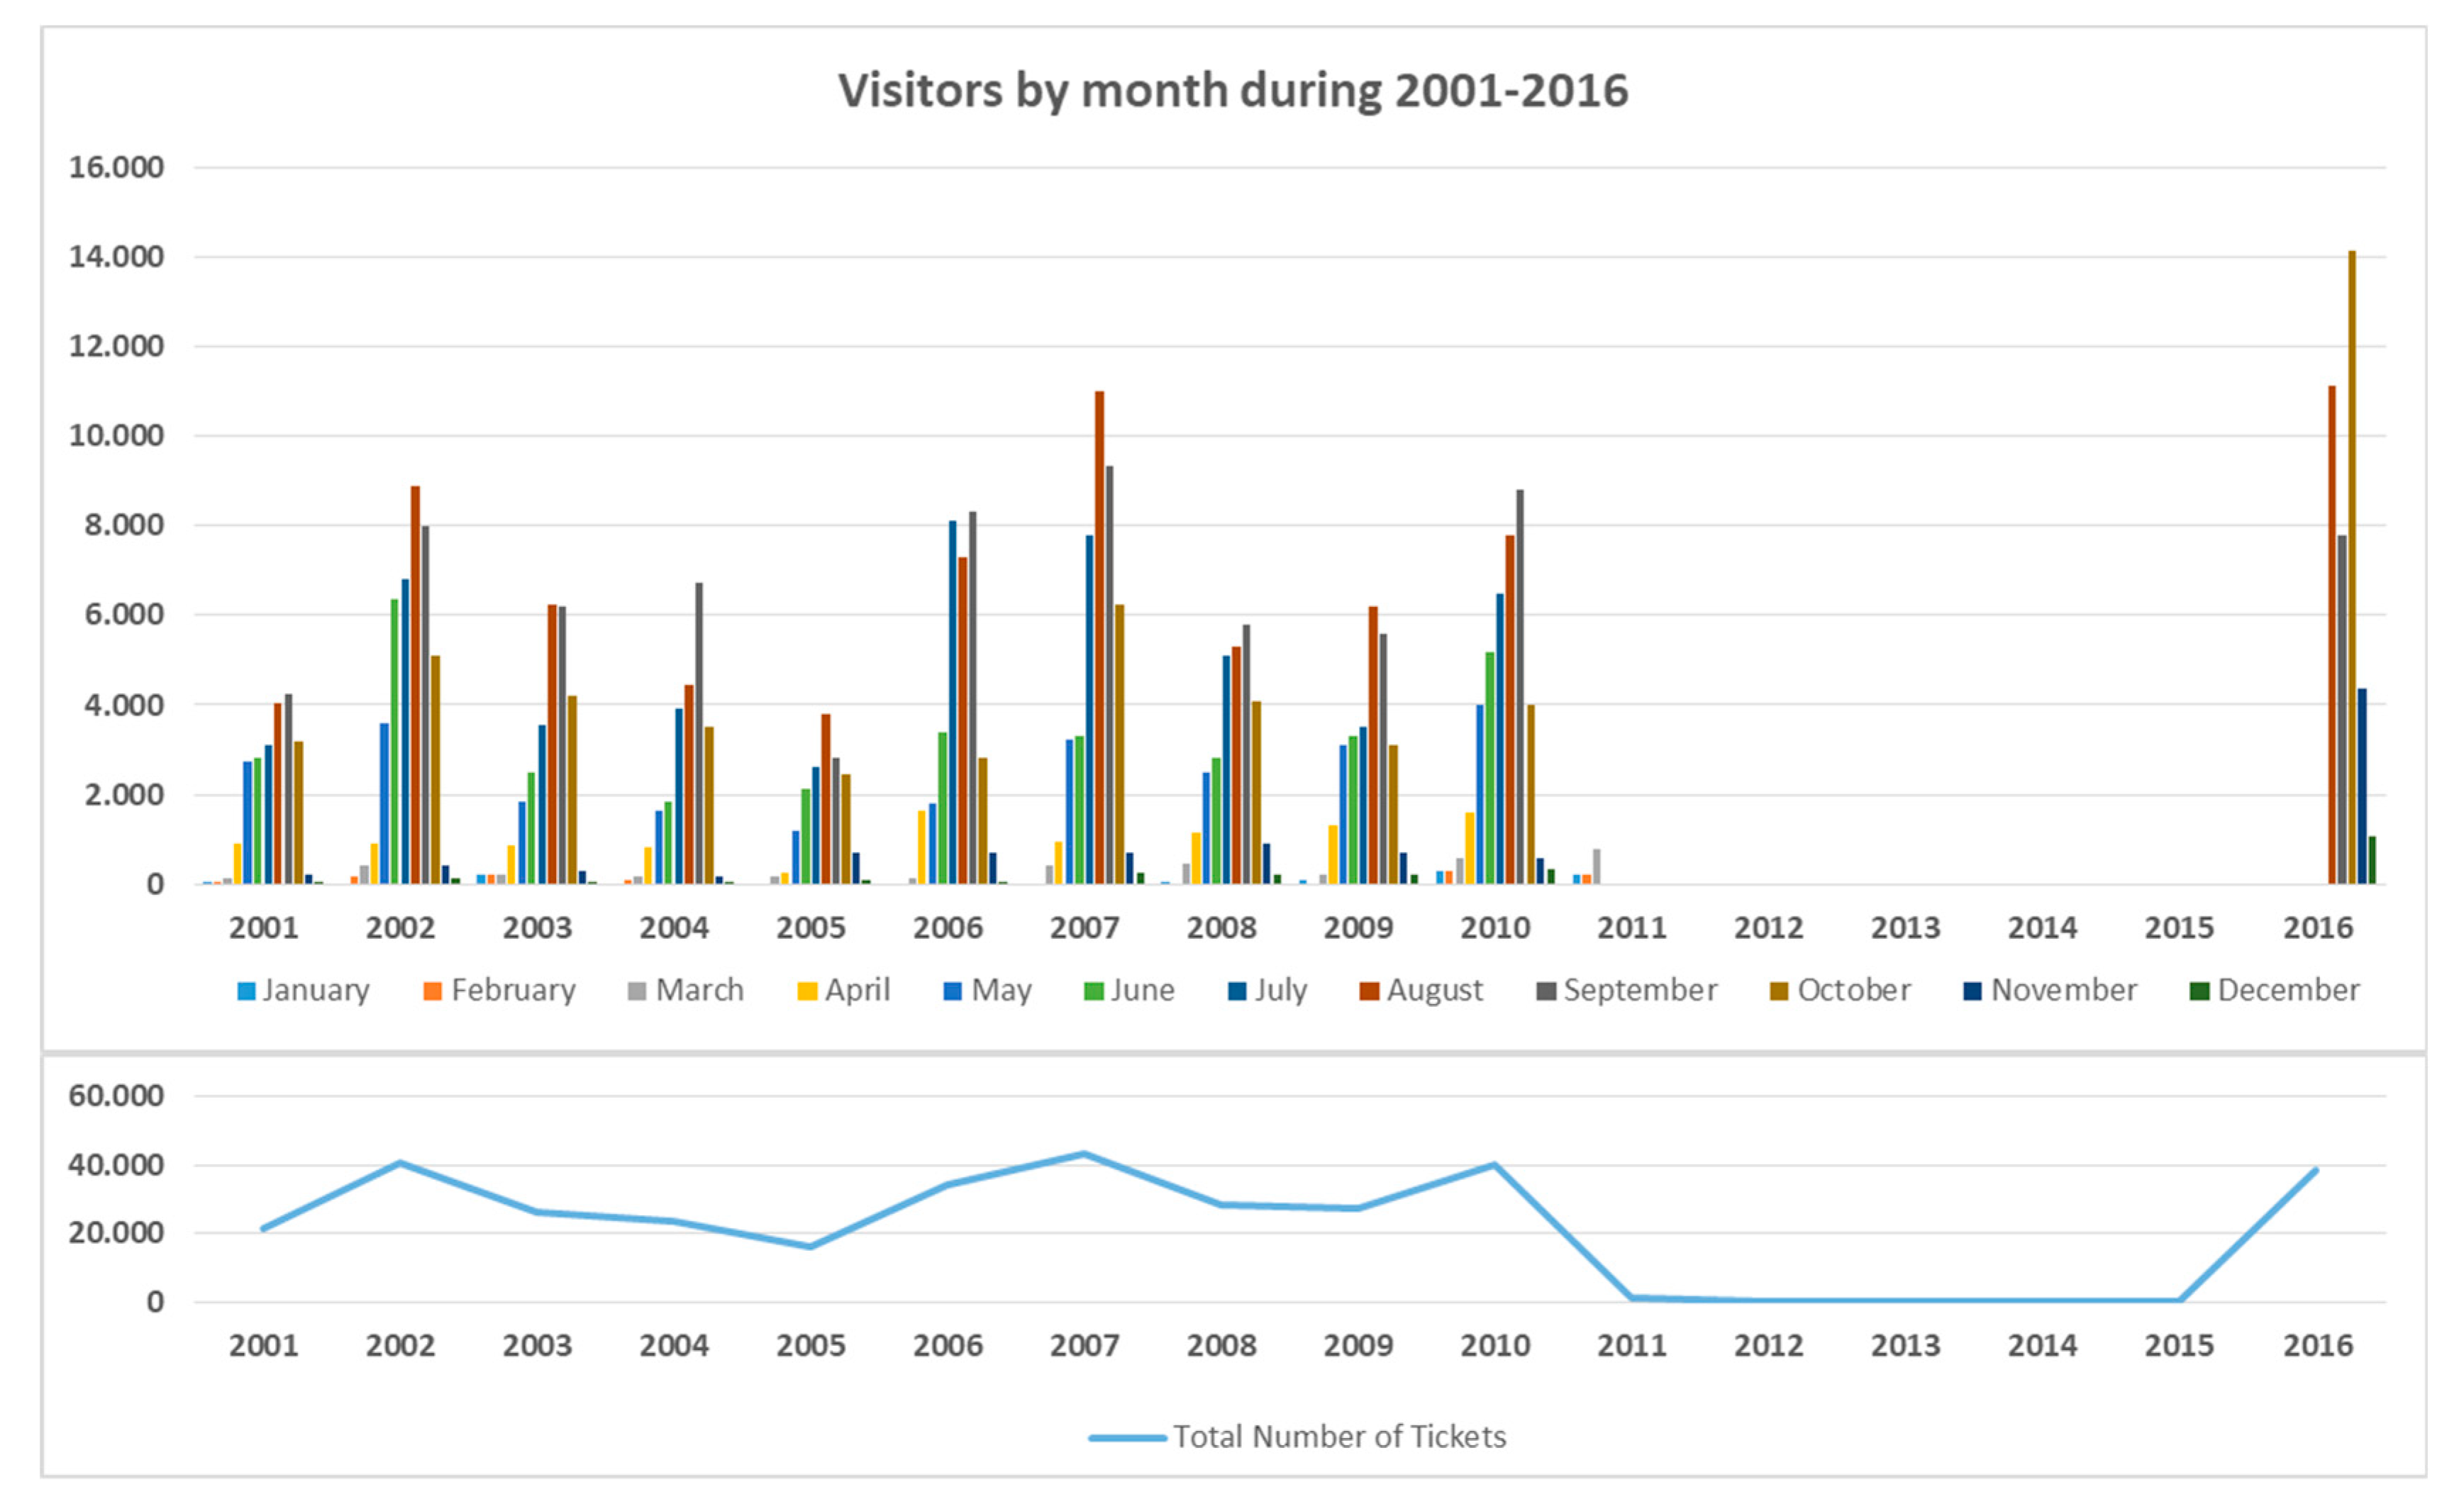
Regarding the Knossos Palace, the number of visitors by month during 2001–2016 is given in Figure 4. Prices for the different ticket types, the number of visitors by ticket type and month during 2001–2015, as well as the respective revenues by month during 2001–2016, are available from the Archaeological Receipts Fund.
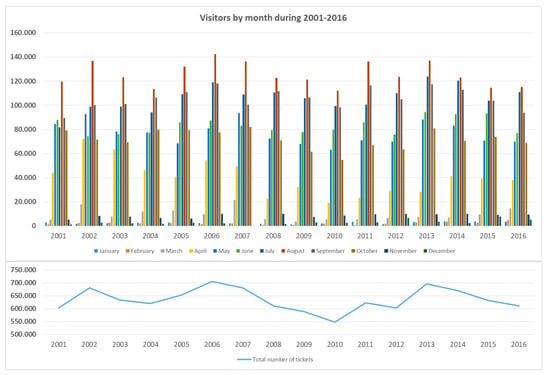
Figure 4.
Number of visitors in Knossos during 2001–2016.
Regarding Rocca al Mare, the number of visitors by month during 2001–2016 is given in Figure 5. It should be noted that the fortress of Rocca al Mare was closed from April 2011 to 17 August 2016 for conservation and renovation.
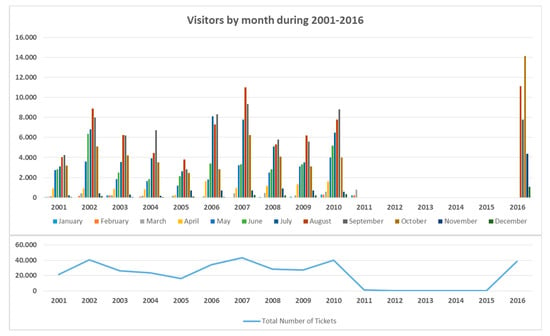
Figure 5.
Visitors in Rocca al Mare during 2001–2016.
For the estimation of the IEV of the Knossos Palace and the fortress of Rocca al Mare, the relevant data for the average daily expenditure of tourists in Crete were not available. For this reason, the relevant expenditure will be approximated by the average daily expenditure in Greece [32].
The estimation of the total economic value of Gubbio is based on the forecast regarding the expected number of visitors in Gubbio. This forecast is based on the arrivals, overnights and average length of stay in Gubbio during 2012–2016 (Table 3 and Figure 6). This data set is available from the Region of Umbria—Directorate for Tourism.

Table 3.
Arrivals, overnights and average length of stay in Gubbio during 2012–2016.

Figure 6.
Arrivals (left) and overnights (right) in Hotels for Gubbio.
It should be noted that for the case of Gubbio, there is no data about admissions, tickets and revenues in cultural heritage sites, because, in the present study, the whole town was considered a cultural heritage site. Hence, there will be no discrimination between the direct and indirect economic value upon the total economic value.
There are no direct data for the average expenditure per tourist in Gubbio, which, for this reason, will be approximated by the average expenditure per tourist in the Umbria Region. This data is available from the Banca d’ Italia Frontier Survey, and according to it, the total number of visitors in the Umbria region in 2014 was 215,102, with the total tourism expenditure being 270 million euros. The respective data for 2015 were 217,185 tourists and 232 million euros. Based on the above, the average expenditure per visitor during 2015–2016 is 1068 €.
4. Results
4.1. The Knossos Palace and the Fortress of Rocca al Mare
The estimation of the direct economic value of the Knossos Palace and the fortress of Rocca al Mare takes the foreign and domestic arrivals in Crete in 2015 as the bases (Table 4), as well as the expected annual growth rate (1.8%) of foreign arrivals to Southern and Mediterranean Europe destinations provided by the European Commission [22]. It should be noted that there is no such forecast for domestic arrivals in the above destinations. For this reason, it was assumed that the expected annual growth rate of the domestic arrivals to Crete was 1.8%, too. The foreign and domestic arrivals in Crete during 2015–2030 are given in Table 4. The forecasts are estimated until 2030, because thereafter, future trends regarding tourist arrivals are not available, and hence any estimation would lack confidence.

Table 4.
Foreign and domestic arrivals in Crete from 2016–2030.
Within this period, the annual percentage of those arriving in Crete and visiting the Knossos Palace was considered to be 21.47% as the average for the period of 2010–2015 (Table 5).

Table 5.
Average percentage of those arriving in Crete and visiting the Knossos Palace and the fortress of Rocca al Mare.
The fortress “Rocca al Mare” was closed for conservation and renovation from April 2011 to 17 August 2016. Hence, the percentage of those arriving in Crete and visiting the fortress of Rocca al Mare for this period cannot be estimated. However, it should be noted that the visits to Rocca al Mare, via their link with visits to Knossos, are implicitly linked to the total arrivals in Crete as well. This is so because stylized facts suggest that these two sites are treated, jointly with the Archaeological Museum of Heraklion, as the most visited cultural heritage sites in Heraklion, which can be supported by the fact that there is a thought to develop a combined ticket option for those monuments, as it has been discussed from personal communications from the authors with the Ephorate of Antiqueties of Heraklion. For this reason, the total number of tickets at Knossos is linked to the total number of tickets at Rocca al Mare during 2001–2010, when both sites were accessible by visitors. It was found that 4.78% of those who visited the Knossos Palace visited the fortress of Rocca al Mare as well.
4.1.1. The Direct Economic Value of the Knossos Palace
During 2002–2015, the average percentage of full tickets at Knossos (15 €) was 69.74%; the respective percentage for reduced tickets (8 €) was 7.44%; for the package full ticket, valid for Knossos and the Heraklion Archaeological Museum, (16 €) it was 10.60%; for package reduced tickets (8 €) it was 1.37% and for free admissions it was 10.85% (data from the Archaeological Receipts Fund). It is assumed that the above ticket prices and the respective average percentages will remain in these levels.
Using the above data for tickets, as well as the forecasts from Table 4, we found that the average annual percentage of those arriving in Crete and visiting the Knossos Palace was 21.47% (Table 5); the annual number of tickets for Knossos during 2016–2030 is given in Table 6.

Table 6.
Direct economic value of the Knossos Palace. DEVK—direct economic value of the Knossos Palace; NPV—net present values.
Hence, the expected annual total direct revenues in Knossos during 2016–2030 are given in Table 6. The latter is the direct economic value of the Knossos Palace (DEVK). Based on this, the expected net present value of the DEVK for the years 2016–2030, and for the rate of return r = 10% is 110,663,499.18 €.
4.1.2. The Direct Economic Value of the Fortress of Rocca al Mare
For the years with available data, the average percentage of full tickets for Rocca al Mare (2 €) was 69.74%, and the percentage for reduced tickets (1 €) and free admissions was 7.44% and 10.85%, respectively (data from the Archaeological Receipts Fund). It is assumed that the above ticket prices as well as the respective average percentages will remain in the same levels.
Using the above data for tickets, as well as the forecasts from Table 4, we found that 4.78% of those who visited the Knossos Palace visited the fortress of Rocca al Mare as well; the annual number of tickets for Rocca al Mare during 2016–2030 is given in Table 7.

Table 7.
The direct economic value of the fortress of Rocca al Mare. DEVRM—direct economic value of Rocca al Mare.
Hence, the expected annual total direct revenues in Rocca al Mare during 2016–2030 are given in Table 7. The latter is the direct economic value of Rocca al Mare (DEVRM). Based on this, the expected net present value of the DEVRM for the years 2016–2030 and for s rate of return of r = 10% is 426,635.83 €.
4.1.3. The Indirect Economic Value of the Knossos Palace and the Fortress of Rocca al Mare
As foreign and domestic visitors in Crete differ with respect to their average length of stay, the indirect economic value for the Heraklion test beds is disentangled between that created by foreign visitors and that created by domestic visitors. More specifically, for each type of visitor, the indirect economic value is the product of the expected annual arrivals in Crete multiplied by the average length of stay in Crete multiplied by the average daily expenditure per visitor.
In this context, based on Table 2, the average length of stay of foreign visitors in Crete during 2010–2015 was 7.09 days, and for domestic visitors was 3.04 days. Moreover, the average daily expenditure of tourists in Crete was 71.10 €.
The estimation of the indirect economic value of the Knossos Palace and the fortress of Rocca al Mare (IEVKRM) is given in Table 8. Based on this, the expected net present value of the relevant IEV for years 2016–2030 and for a rate of return of r = 10% is 14,281,877,469.31 €.

Table 8.
The indirect economic value of the Knossos Palace and the fortress of Rocca al Mare. IEVKRM—indirect economic value of the Knossos Palace and the fortress of Rocca al Mare.
4.1.4. The Total Economic Value of the Knossos Palace and the Fortress of Rocca al Mare
The total economic value of Knossos Palace and the fortress of Rocca al Mare is defined by the direct economic value of Knossos + the direct economic value of Rocca al Mare + the indirect economic value of Knossos and Rocca al Mare.
Then, the summation of the respective net present values gives the NPV of the total economic value of Knossos and Rocca al Mare for the years 2016–2030, and for rate of return r = 10%, which is 14,281,877,469.31 €.
4.2. The Town of Gubbio
The context of the test sites in Gubbio differs from the respective in Heraklion. In particular, Gubbio’s Consoli Palace is a monument that can be visited, while the whole area is a living town with many places with historic-symbolic meanings related to the past. Consoli Palace is the most representative and visited monument in Gubbio, and it also hosts a museum. The Town Walls in Gubbio have a significant value for the identity of the town. They are an attractive destination for visitors, but they do not constitute a discrete site in the usual term, as access is free and it is not possible to count the touristic flows. For these reasons, the analysis is based on the total number of tourists visiting Gubbio, considering the whole town as a test site. The estimations for Gubbio are based on the monthly arrivals during 2012–2016 and are given separately for Italian and foreign visitors [46]. Then, taking the expected annual growth rate of 2.0% for foreign arrivals to destinations in Western Europe and Northern Europe, provided by the European Commission [22] upon the data for Gubbio for 2016, the arrivals in Gubbio during 2016–2030 are given in Table 9. Moreover, the average expenditure per visitor per day is 56.5 €, while the average length of stay is two days, based on the estimations of Banca d’ Italia for 2015 (Table 9). It is assumed that the average expenditure per visitor will remain as it is.

Table 9.
Direct economic Value of Consoli Palace. DEV—Direct Economic Value.
4.2.1. The Direct Economic Value of Consoli Palace
For Consoli Palace, the respective estimations are based on the annual expected arrivals. Using the forecast regarding the expected annual arrivals in Gubbio during 2016–2030 and the average annual percentage of those arriving in Gubbio and visiting the palace, which is 22.87%, the expected annual number of tickets at Consoli Palace during 2016–2030 is estimated in Table 9. Moreover, it is known that there are five ticket options, namely: full ticket (7 €), reduced ticket (5 €), students (4 €), Gubbio students (2 €), and free admission. It is also known that for the period of 2010–2016, the average percentage of full tickets was 47.47%, and the respective percentage for reduced tickets was 49.97%, for Students full tickets was 1.30%, for package reduced tickets was 0.01% and for free admissions was 1.25% [45]. It is assumed that the above ticket prices as well as the respective average percentages will remain as they are.
Based on the above assumptions, the expected annual revenues from Consoli Palace by type of ticket during 2016–2030 and the expected annual total direct revenues from Consoli Palace during 2016–2030 are estimated in Table 9. The latter is the direct economic value (DEV) of the Consoli Palace. Based on this, the net present value of the DEV of the Consoli Palace for the rate of return of r = 10% is estimated as 6,938,428.4 5€ for the years 2016–2030, which includes reference year 2016.
4.2.2. The Indirect Direct Economic Value of Consoli Palace
The estimations for Gubbio are based on the monthly arrivals during 2012–2016 and are given separately for Italian and foreign visitors. Then, by taking the expected trend suggested by the European Commission [47] for Northern Europe (+2.0% per year) from the data for Gubbio for 2016, the expected arrivals in Gubbio 2016–2030 are given in Table 10. Also, for Gubbio, the forecasts are estimated until 2030, because thereafter, future trends regarding tourist arrivals are not available and hence, any estimation would lack confidence.

Table 10.
Expected arrivals and total economic value for Gubbio 2016–2030. TEVG—total economic value of the town of Gubbio.
It should also be noted that for Gubbio, there is no discrimination between direct and indirect economic value upon the total economic value, because the whole town has been considered as the whole site.
The average expenditure per visitor per day is evaluated as 113 €, while the average length of stay is considered was two days, based on the estimations of Banca d’ Italia for 2016. It is assumed that the above average expenditure per visitor will remain as it is.
Therefore, the total economic value of Gubbio will be given by the annual expected visitors in Gubbio during 2017–2030, multiplied by the average daily expenditure per visitor per day. The estimation of the total economic value (TEV) of the town of Gubbio is given in Table 9. Based on this, the expected net present value of the TEV of the town of Gubbio for a rate of return of r = 10% is estimated to be 211,447,984.11 € for the years 2016–2030.
4.2.3. The Total Economic Value of the Gubbio Monuments
The total economic value of the palace of the Gubbio Monuments is the sum of the direct economic value of Consoli Palace and the indirect value from thee Gubbio monuments.
Then, the respective net present values (NPV) give the NPV of the total economic value for 2016–2030, and it is estimated to be 218,386,412.56 €. From these, 6,938,428.45€ correspond to the NPV of the direct economic value of Consoli Palace for the period 2016–2030, while 211,447,984.11 € is the NPV of the indirect economic value of the Gubbio monuments for the period of 2016–2030, which includes the reference year 2016.
Hence, the total economic value of Gubbio will be given by the annual expected visitors in Gubbio multiplied by the average daily expenditure per visitor. The estimation of the total economic value of the town of Gubbio (TEVG) is given in Table 10.
Based on this, the expected net present value of the TEVG, for the years 2016–2030 and for a rate of return of r = 10% is 211,447,984.11 €.
4.3. Effects of a Natural Hazard on Gubbio Tourism
Natural disasters can often reduce the number of tourists to a region. Psychological uncertainty about the levels of safety and services results in a reduction in tourism flows [48]. The effects of a natural hazard on social and economic vulnerability can be measured by identifying the indicators that are related to aspects such as residential structures, population and social structure, monumental heritage and tourist arrivals [49].
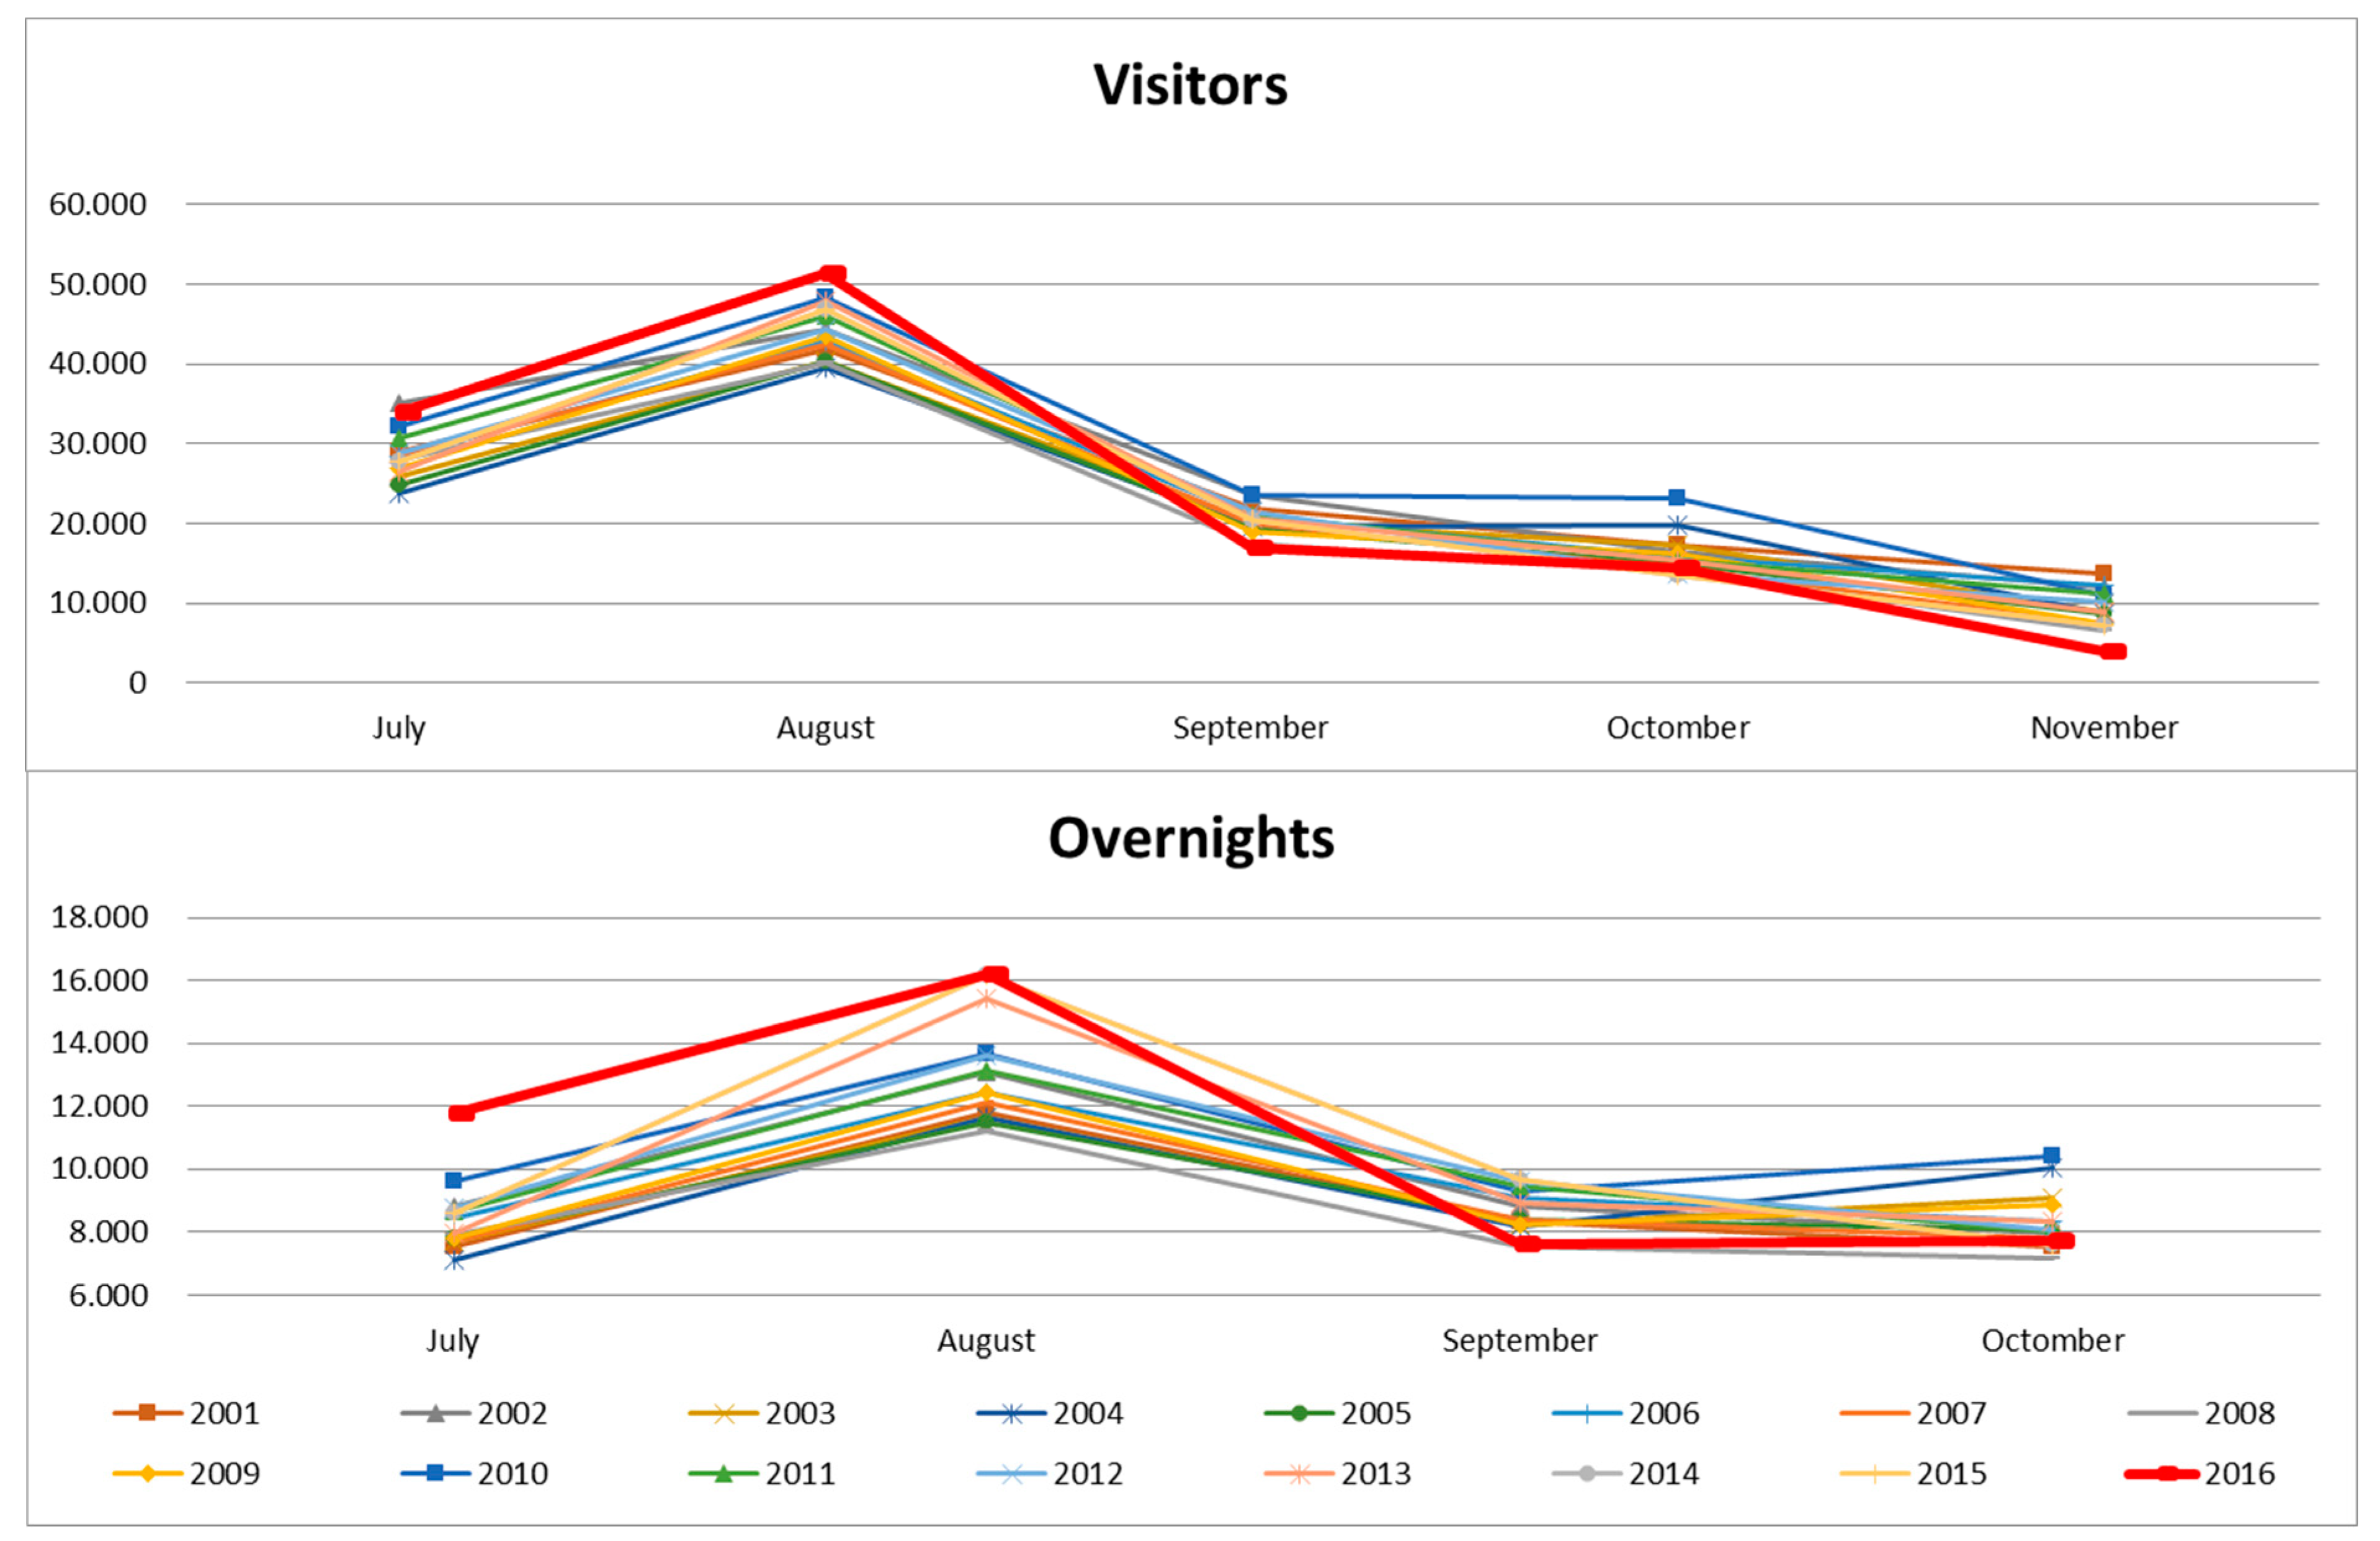
It is possible to assess, using real data, the effect of a natural hazard, an earthquake in the present case, on tourism in Gubbio. On 24 August 2016, a 6.2 magnitude earthquake hit central Italy. On 26 August 2016, the official figures of the national civil protection agency reported that the earthquake caused the death of 297 people. In addition to the loss of human life, widespread destruction of cultural heritage was also reported [50]. Amatrice was almost completely destroyed, including the façade and the rose window of the Saint Agostino Church, as well as the museum dedicated to painter Nicola Filotesio, student and companion of Raphael, which were very important cultural heritage monuments [51]. From 30 August 2016, the initial earthquake was followed by at least 2.500 aftershocks. The tremor and a number of aftershocks were felt across the whole of central Italy. The evolution of tourist flows in Gubbio was mainly been characterized by positive trends, during 2011–2015, in terms of visitors (Figure 6).
By comparing the number of visitors and the overnights (Figure 7) during September, before and after the earthquake of 24 August 2016, it can be seen that both visitors and overnights reached their maximum during August 2016, while September 2016 registered the lowest values during 2001–2016. Deep public concern, fed by the widespread media coverage regarding the earthquake damage and the persisting risks contributed to a significant decrease in tourism. The effects were particularly evident during September and October. In these two months, the tourist flows, in standard conditions, would have been reduced rates but with smaller rates, similar to the previous years (Figure 7).
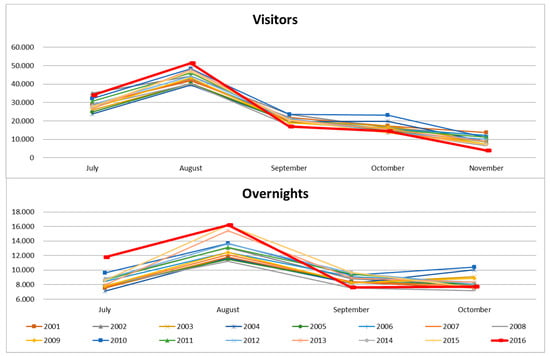
Figure 7.
Number of visitors and overnights in Gubbio from July to October (2001–2016).
The aforementioned earthquake caused monetary losses in the tourism industry of Gubbio, which were estimated based on the assumption that if the earthquake had not happened, the average length of stay would be two days. Moreover, visitors and overnights would have followed the trend of the previous year (i.e., 2015), and, according to the forecasts, the expected number of visitors would have been 22,414. Yet, only 7.606 visitors registered in Gubbio in September 2016. This suggests that the relevant earthquake resulted in almost 14,808 less visitors. In terms of revenues, this represents a loss of 1,673,304 € for Gubbio.
Comparing the Italians’ and foreigners’ arrivals in Umbria from August to October during 2015–2016 (Table 11), one finds that it was mainly Italians who avoided to visit Gubbio after the earthquake of 24 August 2016. This is rationalized as domestic tourists have relatively higher flexibility to adjust to a shock in their country and rearrange their trip, as compared with incoming tourists from abroad.

Table 11.
Number of People Visiting/Sleeping in Gubbio [47].
Furthermore, another important earthquake was registered on 31 October 2016, with a magnitude of around 6.1–6.5. The medieval basilica of St Benedict in Norcia, the town closest to the epicentre, was among the buildings destroyed, together with many others. This second earthquake impacted even more severely on the cultural heritage assets of the area, showing their vulnerability and the need of effective mitigation actions.
The above earthquakes had very long-term effects on the socio-economic aspects in nearby areas too. In fact, in Gubbio, after the earthquake, the number of visitors fell dramatically (in November and December, when two important events take place—the International Truffle Fair and the Christmas Market).
On an annual basis, even in 2017, the trend was extremely negative; during June 2016–May 2017, 206,191 arrivals and 88,703 overnights were registered, compared with 218.203 arrivals and 101.329 overnights during June 2015–May 2016 (arrivals: −12.5%; overnights: −5.5%).
5. Societal Impact from the Protection of Cultural Heritage Assets in Heraklion
The preservation of cultural heritage assets does not only contribute to the broader concept of economic development, but also pertains to long changes in the economy (e.g., increase of diversity of goods and services, quality, changes in economic sectors and employment that also reflect the societal changes). Societal changes are initially driven by structural changes in the economy. In the Heraklion paradigm, as tourism became a primary sector of the economy in the 1980s, this resulted in movement from rural areas to the city, and also in the abandonment of some traditional cultivations, such as the vineyard cultivation, in combination with the constantly falling prices of olive oil and some vegetables. The areas with a large decline in agriculture are those exhibiting a rapid development of tourism. Consequently, the population focused on employment in the tourism sector and abandoned agriculture [52]. Moreover, the city of Heraklion does not follow the common Sea Sand Sun tourism model, as, because of the geomorphology of the area, there are no large beaches to support this model. Thus, Heraklion city tourism depends mainly on visitors in Knossos, the archaeological museum of Heraklion and the Venetian city walls, part of which is the Koules fortress [52]. Factors such as the quality of the natural and cultural environment, embeddedness in the local economic and cultural context, long term perspectives and impacts of given projects and investments on the local economy and local community, especially their impact on quality and level of life of the local population are considered. Taking a more recent and extensive perspective on development as a socio-economic process, the changes taking place at a large scale in the wider Heraklion area, which also included a partial restoration and protection of the coastal Venetian walls of the city, resulted in a variety of new societal needs. These included changes in land uses from residential to commercial, the need for more public spaces and so on [33].
6. Discussion
An economic analysis within a risk assessment model related to climatic change and natural hazards is likely to valuate scenarios with and without alternative interventions. Risk managers can compare the baseline risk from climate change impacts with the changes in risk because of different interventions to mitigate risks. Once the protection and preservation benefits have been estimated, changes in the costs in the industry and government sector, in both the short and long term, can be estimated for each intervention under consideration.
The linkage between risk assessment and economic analysis, as a mean/criterion of supporting decision-making in cultural heritage management, is a very novel approach still under development. The methods of economic analysis that could be used for evaluating the costs and benefits of cultural heritage are based on the economic value, which can be determined for most products and services by examining their attributes and prices in the marketplace. However, in cultural heritage management, a market price for restoration and maintenance actions does not yet exist.
The evaluation of the benefits under different risk management interventions for reducing climatic change impact, in the context of risk assessment, can be based on the direct and indirect value of the sites. These values present the socioeconomic values of the sites and are used as the exposure value in the risk assessment.
The risk analysis model will incorporate the climate change hazards and the value that cultural heritage embodies. In general, the risk affecting cultural heritage is the product of the vulnerability of cultural heritage climatic change impacts multiplied by the value of cultural heritage.
To establish a basis for comparing diverse risks and for ranking policy alternatives, analysts must translate diverse outcomes into a common unit of analysis.
The outcome of a quantitative risk assessment will generally provide an estimate of the baseline climate change risks. Usually, quantitative risk assessments give complete probability distributions rather than just specific estimates of risk. The nature of each policy decision needs to be clearly understood in order to allow for the identification of those who benefit and those who are disadvantaged by that policy. In particular, it is important to ensure that the benefits and disadvantages are accrued fairly, for example, that one group does not benefit at the expense of another being exposed to increased risk. The anticipated economic costs of the cultural heritage interventions (e.g., requiring changes in the behaviour of site management, government and possibly visitors) can then be compared with the economic evaluation of the improvements in cultural heritage management outcomes.
7. Conclusions
The analysis of the socioeconomic value of cultural heritage sites stated that they provide a range of both market and non-market benefits to society, where some of them are related to use values and others to non-use values. In the case of conservation, non-market benefits often play a significant role, which requires the assessment of socioeconomic risk.
The analysis for the cultural heritage sites revealed that the direct socioeconomic value of each site under study depends crucially on the forecast regarding tourism arrivals, as well as on the pricing strategy of the site. Moreover, the indirect socioeconomic value of each site depends on the average length of stay and daily expenditures. This provides opportunities for policy interventions for the conservation of the cultural heritage sites and for the promotion of their non-market cultural value. In order to do this, protection measures need to ensure the integrity of cultural heritage with respect to the impact of climate change.
The fact that different types of protection and conservation measures can, in a best-case scenario, lead to market and non-market benefits, does not lead automatically to their implementation. Instead, these values should be compared to the opportunity costs of conservation, less tight restrictions and so on. Addressing this question requires that decision-makers understand and assess the inevitable trade-offs between competing goals. The most common trade-offs are between values associated with conservation and development. The choices made by decision makers and land managers can largely affect both the type and magnitude of the value generated. Trade-offs are also present when addressing the welfare impacts at different levels of the economy. Benefits may accrue to one group, but with a cost for another group. The suggested framework for addressing the trade-offs associated with alternative land use decisions is a cost–benefit analysis.
From the Umbria 2016 earthquake case, it can be seen that disasters reduce the number of tourists in an area, even if it is not seriously affected by the event. A reduction in tourism demand is likely to occur, as people may have concerns about their general safety. Another very important aspect, which is very difficult to evaluate in depth, is the enormous number of cultural heritage sites/monuments/artefacts/assets that are destroyed because of the effects of natural hazards and climate change extreme effects.
This destruction has serious repercussions on the local communities in terms of the economy, but also in terms of cultural identity, not considering the worldwide effect of the destruction of important cultural heritage assets. All of these considerations evidence once more the importance to act according to a preventive maintenance/conservation plan, as well to implement all of the safety measures in order to reduce the potential damages due to natural and climate change events.
Author Contributions
Conceptualization, G.A. and C.M.; Methodology, G.A. and C.M.; Software, G.A. and C.M.; Validation, G.A., C.M. and N.A.; Formal Analysis, G.A. and C.M.; Investigation, G.A. and C.M.; Resources, G.A. and C.M.; Data Curation, G.A. and C.M.; Writing-Original Draft Preparation, G.A. and C.M.; Writing-Review & Editing, G.A., C.M. and N.A.; Visualization, G.A.; Supervision, G.A.; Project Administration, N.A.; Funding Acquisition, G.A. and N.A.
Funding
This research was funded by HERACLES (HEritage Resilience Against CLimate Events on Site) DRS-11-2015 grant number number 700395.
Acknowledgments
The authors would like to thank the Ephorate of Antiquities of Heraklion and the Gubbio Municipality for providing the data. Also, we would like to thank Dr Giuseppina Padeletti for reviewing the manuscript in its initial form.
Conflicts of Interest
The authors declare no conflict of interest.
References and Notes
- Nijkamp, P. Economic Valuation of Cultural Heritage. In The Economics of Uniqueness: Investing in Historic City Cores and Cultural Heritage Assets for Sustainable Development; Licciardi, G., Amirtahmasebi, R., Eds.; World Bank: Washington, DC, USA, 2012; pp. 75–103. [Google Scholar]
- Ready, R.; Navrud, S. International benefits transfer: Methods and validity tests. Ecol. Econ. 2006, 60, 429–434. [Google Scholar] [CrossRef]
- UNESCO. Convention Concerning the Protection of the World Cultural and Natural Heritage; UNESCO: Paris, France, 1972. [Google Scholar]
- ICOMOS. Charter for the Protection and Management of the Archaeological Heritage; ICOMOS: Charenton-le-Pont, France, 1990. [Google Scholar]
- Colette, A. Climate Change and World Heritage; Report on Predicting and Managing the Impacts of Climate Change on World Heritage and Strategy to Assist States Parties to Implement Appropriate Management Responses; UNESCO World Heritage Centre: Paris, France, 2007. [Google Scholar]
- Throsby, D. Heritage Economics: A Conceptual Framework. In The Economics of Uniqueness: Investing in Historic City Cores and Cultural Heritage Assets for Sustainable Development; Licciardi, G., Amirtahmasebi, R., Eds.; World Bank: Washington, DC, USA, 2012; pp. 45–72. [Google Scholar]
- Avrami, E.; Mason, R.; de la Torre, M. Values and Heritage Conservation; Getty Conservation Institute: Los Angeles, CA, USA, 2000. [Google Scholar]
- Barbier, E.B.; Burgess, J.C.; Folke, C. Cultural-Economic Analyses of Art Museums: A British Curator’s Viewpoint. In Economics of the Arts: Selected Essays; Ginsburgh, V., Menger, P.-M., Eds.; North Holland: Amsterdam, The Netherlands, 1996; pp. 255–274. [Google Scholar]
- ICOMOS. Charter for the Conservation of Historic Towns and Urban Areas; ICOMOS: Charenton-le-Pont, France, 1987. [Google Scholar]
- Licciardi, G.; Amirtahmasebi, R. The Economics of Uniqueness: Investing in Historic City Cores and Cultural Heritage Assets for Sustainable Development; World Bank: Washington, DC, USA, 2012. [Google Scholar]
- Besculides, A.; Lee, M.E.; McCormick, P.J. Residents’ perceptions of the cultural benefits of tourism. Ann. Tour. Res. 2002, 29, 303–319. [Google Scholar] [CrossRef]
- Scott, D.; Gössling, S.; Hall, C.H. International Tourism and Climate change. WIREs Clim. Chang. 2012, 3, 213–232. [Google Scholar] [CrossRef]
- Scott, D.; Lemieux, C. Weather and Climate Information for Tourism. Geneva and Madrid: Commissioned White Paper for the World Climate Conference; WMO: Geneva, Switzerland; UNWTO: Madrid, Spain, 2003. [Google Scholar]
- Lückenkötter, J.; Langeland, O.; Langset, B.; Tranos, E.; Davoudi, S.; Lindner, C. Economic impacts of climate change on Europe’s regions. In European Climate Vulnerabilities and Adaptation: A Spatial Planning Perspective; Schmidt-Thome, P., Greiving, S., Eds.; John Wiley & Sons: Hoboken, NJ, USA, 2013; pp. 95–110. [Google Scholar]
- OECD. Tourism Trends and Policies; OECD: Paris, France, 2010. [Google Scholar]
- Knudson, C.; Kay, K.; Fisher, S. Appraising geodiversity and cultural diversity approaches to building resilience through conservation. Nat. Clim. Chang. 2018, 8, 678–685. [Google Scholar] [CrossRef]
- Wisner, B. Climate change and cultural diversity. Int. Soc. Sci. J. 2010, 61, 131–140. [Google Scholar] [CrossRef] [PubMed]
- Perch-Nielsen, S.L.; Amelung BKnutti, R. Future climate resources for tourism in Europe based on the daily Tourism Climatic Index. Clim. Chang. 2010, 103, 363–381. [Google Scholar] [CrossRef]
- Bigano, A.; Hamilton, J.M.; Maddison, D.; Tol, R.S.J. Predicting tourism flows under climate change. An editorial comment on Gössing and Hall. Clim. Chang. 2006, 79, 175–180. [Google Scholar] [CrossRef]
- Hamilton, J.M.; Maddison, D.J.; Tol, R.S.J. Climate change and international tourism: A simulation study. Glob. Environ. Chang. 2005, 15, 253–266. [Google Scholar] [CrossRef]
- Alexandrakis, G.; Manasakis, C.; Kampanis, N.A. Valuating the effects of beach erosion to tourism revenue. A management perspective. Ocean Coast. Manag. 2015, 111, 1–11. [Google Scholar] [CrossRef]
- Alcamo, J.; Moreno, J.M.; Nováky, B.; Bindi, M.; Corobov, R.; Devoy, R.J.N.; Giannakopoulos, C.; Martin, E.; Olesen, J.E.; Shvidenko, A. Europe. Climate Change 2007: Impacts, Adaptation and Vulnerability; Contribution of Working Group II to the Fourth Assessment Report of the Intergovernmental Panel on Climate Change; Parry, M.L., Canziani, O.F., Palutikof, J.P., van der Linden, P.J., Hanson, C.E., Eds.; Cambridge University Press: Cambridge, UK, 2007; pp. 541–580. [Google Scholar]
- Viner, D. Tourism and its interactions with climate change. J. Sustain. Tour. 2006, 14, 317–322. [Google Scholar] [CrossRef]
- Throsby, D. Economics and Culture; Cambridge University Press: Cambridge, UK, 2001. [Google Scholar]
- Lazrak, F.; Nijkamp, P.; Rietveld, P.; Rouwendal, J. Cultural Heritage and Creative Cities: An Economic Evaluation Perspective. In Sustainable City and Creativity; Fusco Girard, L., Nijkamp, P., Eds.; Ashgate: Aldershot, UK, 2011; pp. 225–245. [Google Scholar]
- Snowball, J.D. Measuring the Value of Culture: Methods and Examples in Cultural Economics; Springer: Berlin, Germany, 2008. [Google Scholar]
- Baaijens, S.; Nijkamp, P. Meta-Analytic Methods for Comparative and Exploratory Policy Research: An Application to the Assessment of Regional Tourist Multipliers. J. Policy Model. 2000, 22, 821–858. [Google Scholar] [CrossRef]
- Van Leeuwen, E.S.; Nijkamp, P.; Rietveld, P. Economic Impacts of Tourism: A Meta-analytic Comparison of Regional Output Multipliers. In Tourism and Regional Development: New Pathways; Giaoutzi, M., Nijkamp, P., Eds.; Ashgate: Aldershot, UK, 2006; pp. 115–132. [Google Scholar]
- Ikkos, A.; Koutsos, S. The Contribution of Tourism to the Greek Economy in 2015, 2nd ed.; INSETE: Athens, Greece, 2017. [Google Scholar]
- Ikkos, A. The Contribution of Tourism to the Greek Economy in 2014; INSETE: Athens, Greece, 2015. [Google Scholar]
- Hellenic Statistical Authority (ELSTAT). Domestic Tourism, Workforce, Arrivals, Regional Distribution; Hellenic Statistical Authority: Piraeus, Greece.
- Bank of Greece. Available online: https://www.bankofgreece.gr/Pages/en/Statistics/externalsector/balance/travelling.aspx (accessed on 17 October 2017).
- Rempis, N.; Alexandrakis, G.; Tsilimigkas, G.; Kampanis, N. Coastal use synergies and conflicts evaluation in the framework of spatial, development and sectoral policies. Ocean Coast. Manag. 2018, 166, 40–51. [Google Scholar] [CrossRef]
- Efstratiou, N.; Karetsou, A.; Ntinou, M. (Eds.) The Neolithic Settlement of Knossos in Crete. New Evidence for the Early Occupation of Crete and the Aegean Islands; Prehistory Monographs 42; Academic Press: Philadelphia, PA, USA, 2013; p. 217. [Google Scholar]
- Marinatos, N. Sir Arthur Evans and Minoan Crete: Creating the Vision of Knossos; I.B. Tauris: London, UK, 2015; p. 224. [Google Scholar]
- Detorakis, T.E. History of Crete; Th. Detorakis: Iraklion, Greece, 1994. [Google Scholar]
- Tsompanaki, C. The Cretan War 1645–1669. The Siege and the Epic of Chandakas; Tsompanaki Publishers: Athens, Greece, 2008. [Google Scholar]
- Regione Umbria. Available online: www.formazioneturismo.com/dati-turistici-banca-italia/ (accessed on 18 October 2017).
- Sisani, S. Gubbio: Nuove riflessioni sulla forma urbana. Archeol. Class 2010, 61, 75–134. [Google Scholar]
- Hubert, É. La construction de la ville: Sur l’urbanisation dans l’Italie médiévale. In Annales. Histoire, Sciences Sociales; Cambridge University Press: Cambridge, UK, 2004; Volume 59, pp. 109–139. [Google Scholar]
- Fiore, F.P. Interventi Urbani in Una Signoria Territoriale del Quattrocento a Urbino e Gubbio. Publ. l’École Fr. Rome 1989, 122, 407–437. [Google Scholar]
- Luongo, A. Gubbio Nel Trecento: Il Comune Popolare e la Mutazione Signorile (1300–1404); Viella: Rome, Italy, 2016. [Google Scholar]
- Carvalho, F.; Lopes, A.; Curulli, A.; da Silva, T.P.; Lima, M.M.R.A.; Montesperelli, G.; Ronca, S.; Padeletti, G.; Veiga, J.P. The Case Study of the Medieval Town Walls of Gubbio in Italy: First Results on the Characterization of Mortars and Binders. Heritage 2018, 1, 468–478. [Google Scholar] [CrossRef]
- Serageldin, I. Very Special Places. The Architecture and Economics of Intervening in Historic Cities; The World Bank: Washington, DC, USA, 1999. [Google Scholar]
- Mourato, S.; Mazzanti, M. Economic Valuation of Cultural Heritage: Evidence and Prospects. In Assessing the Values of Cultural Heritage—Research Report; de la Torre, M., Ed.; Getty Conservation Institute: Los Angeles, CA, USA, 2002. [Google Scholar]
- Data from the Gubbio Municipality
- European Commission. International Tourism Trends in EU-28 Member States—Current Situation and Forecast for 2020-2025-2030; European Commission: Brussels, Belgium, 2016. [Google Scholar]
- Bateman, I.; Carson, R.T.; Day, B.; Hanemann, M.; Hanley, N.; Hett, T.; Jones-Lee, M.; Loomes, G.; Mourato, S.; Ozdemiroglu, E.; et al. Economic Valuation with Stated Preference Techniques: A Manual.; Edward Elgar: Cheltenham, UK, 2002. [Google Scholar]
- Nishimura, T.; Kajitani, Y.; Tatano, H. Damage assessement in tourism caused by an earthquake disaster. J. Integr. Disaster Risk Manag. 2013, 3, 56–74. [Google Scholar] [CrossRef]
- Kennedy, M. Art Experts Fear Serious Earthquake Damage to Historic Italian Buildings. The Guardian, 24 August 2016; ISSN 0261-3077. [Google Scholar]
- Dichiarante, A. Terremoto nel centro Italia, i Danni al patrimonio artistic [Earthquake in Central Italy, the damage to artistic heritage]. La Repubblica, 24 August 2016. (In Italian) [Google Scholar]
- Region of Crete, Greece—Smart Specialisation Platform Note, Smart Specialisation Strategy of the Region of Crete, 2015, 34.
© 2019 by the authors. Licensee MDPI, Basel, Switzerland. This article is an open access article distributed under the terms and conditions of the Creative Commons Attribution (CC BY) license (http://creativecommons.org/licenses/by/4.0/).

