RBS, PIXE, Ion-Microbeam and SR-FTIR Analyses of Pottery Fragments from Azerbaijan
Abstract
1. Introduction
2. Materials and Methods
3. Results and Discussion
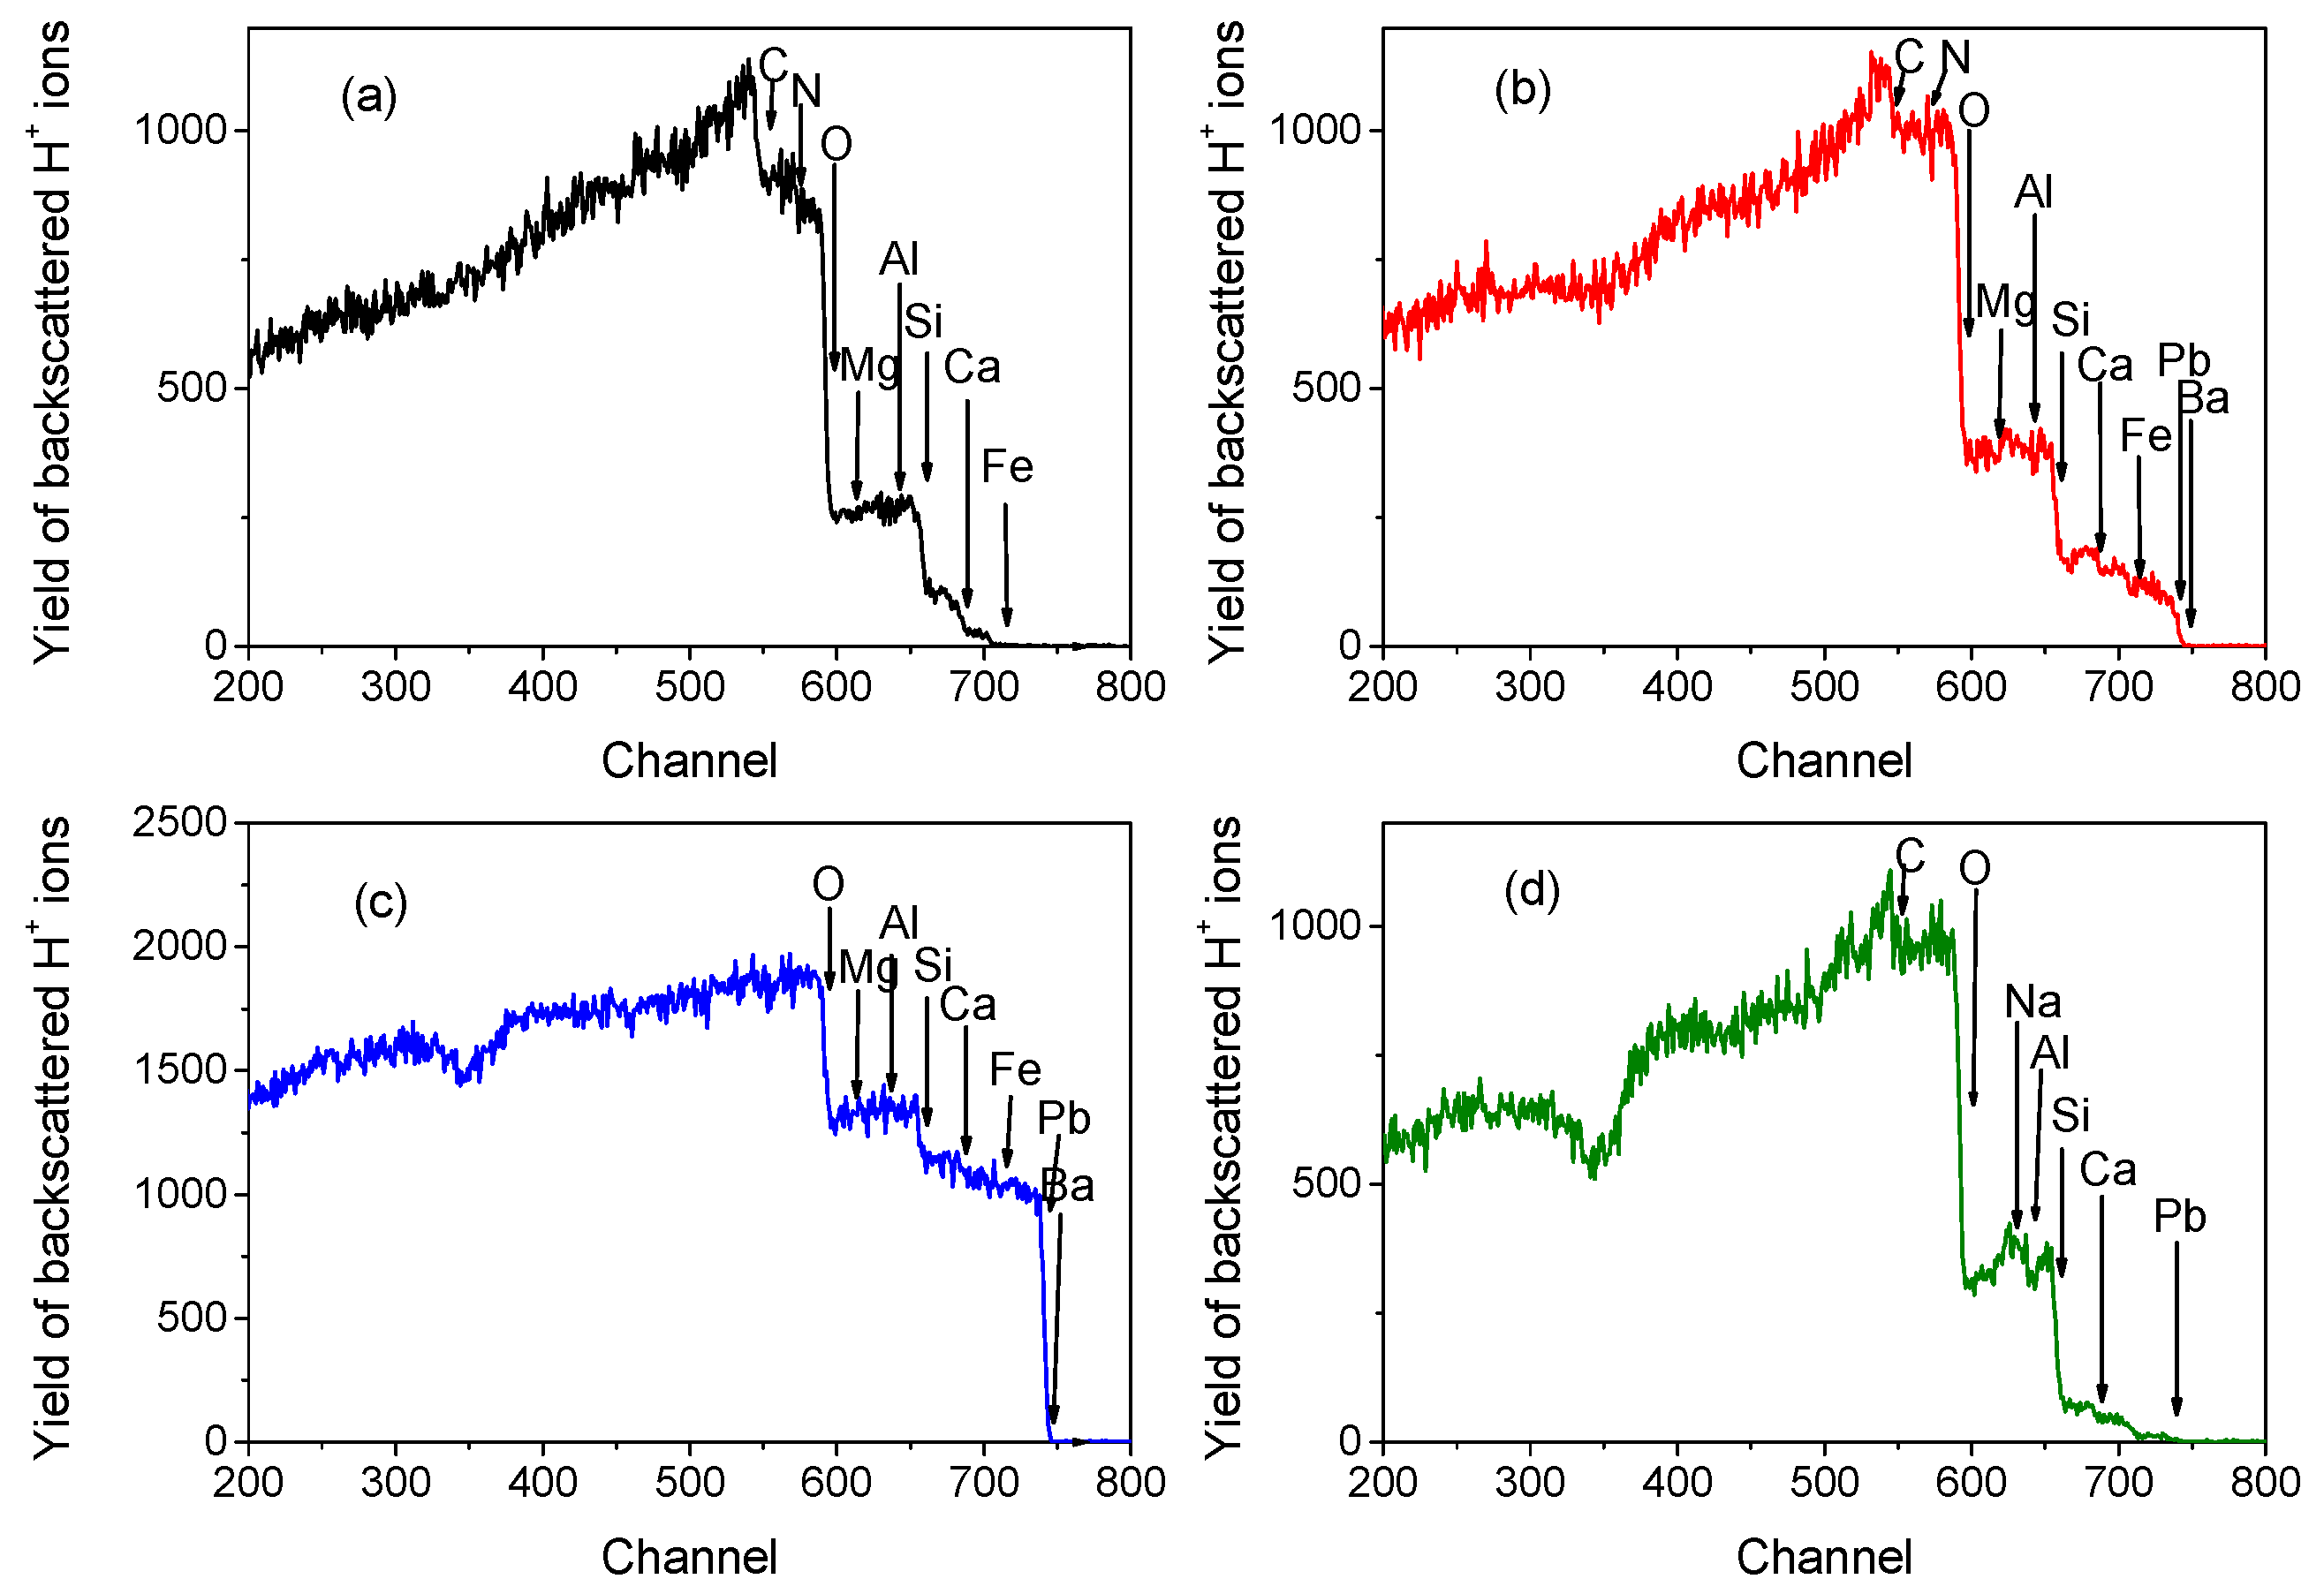
3.1. RBS-PIXE Analysis
3.2. Ion-Microbeam Analysis
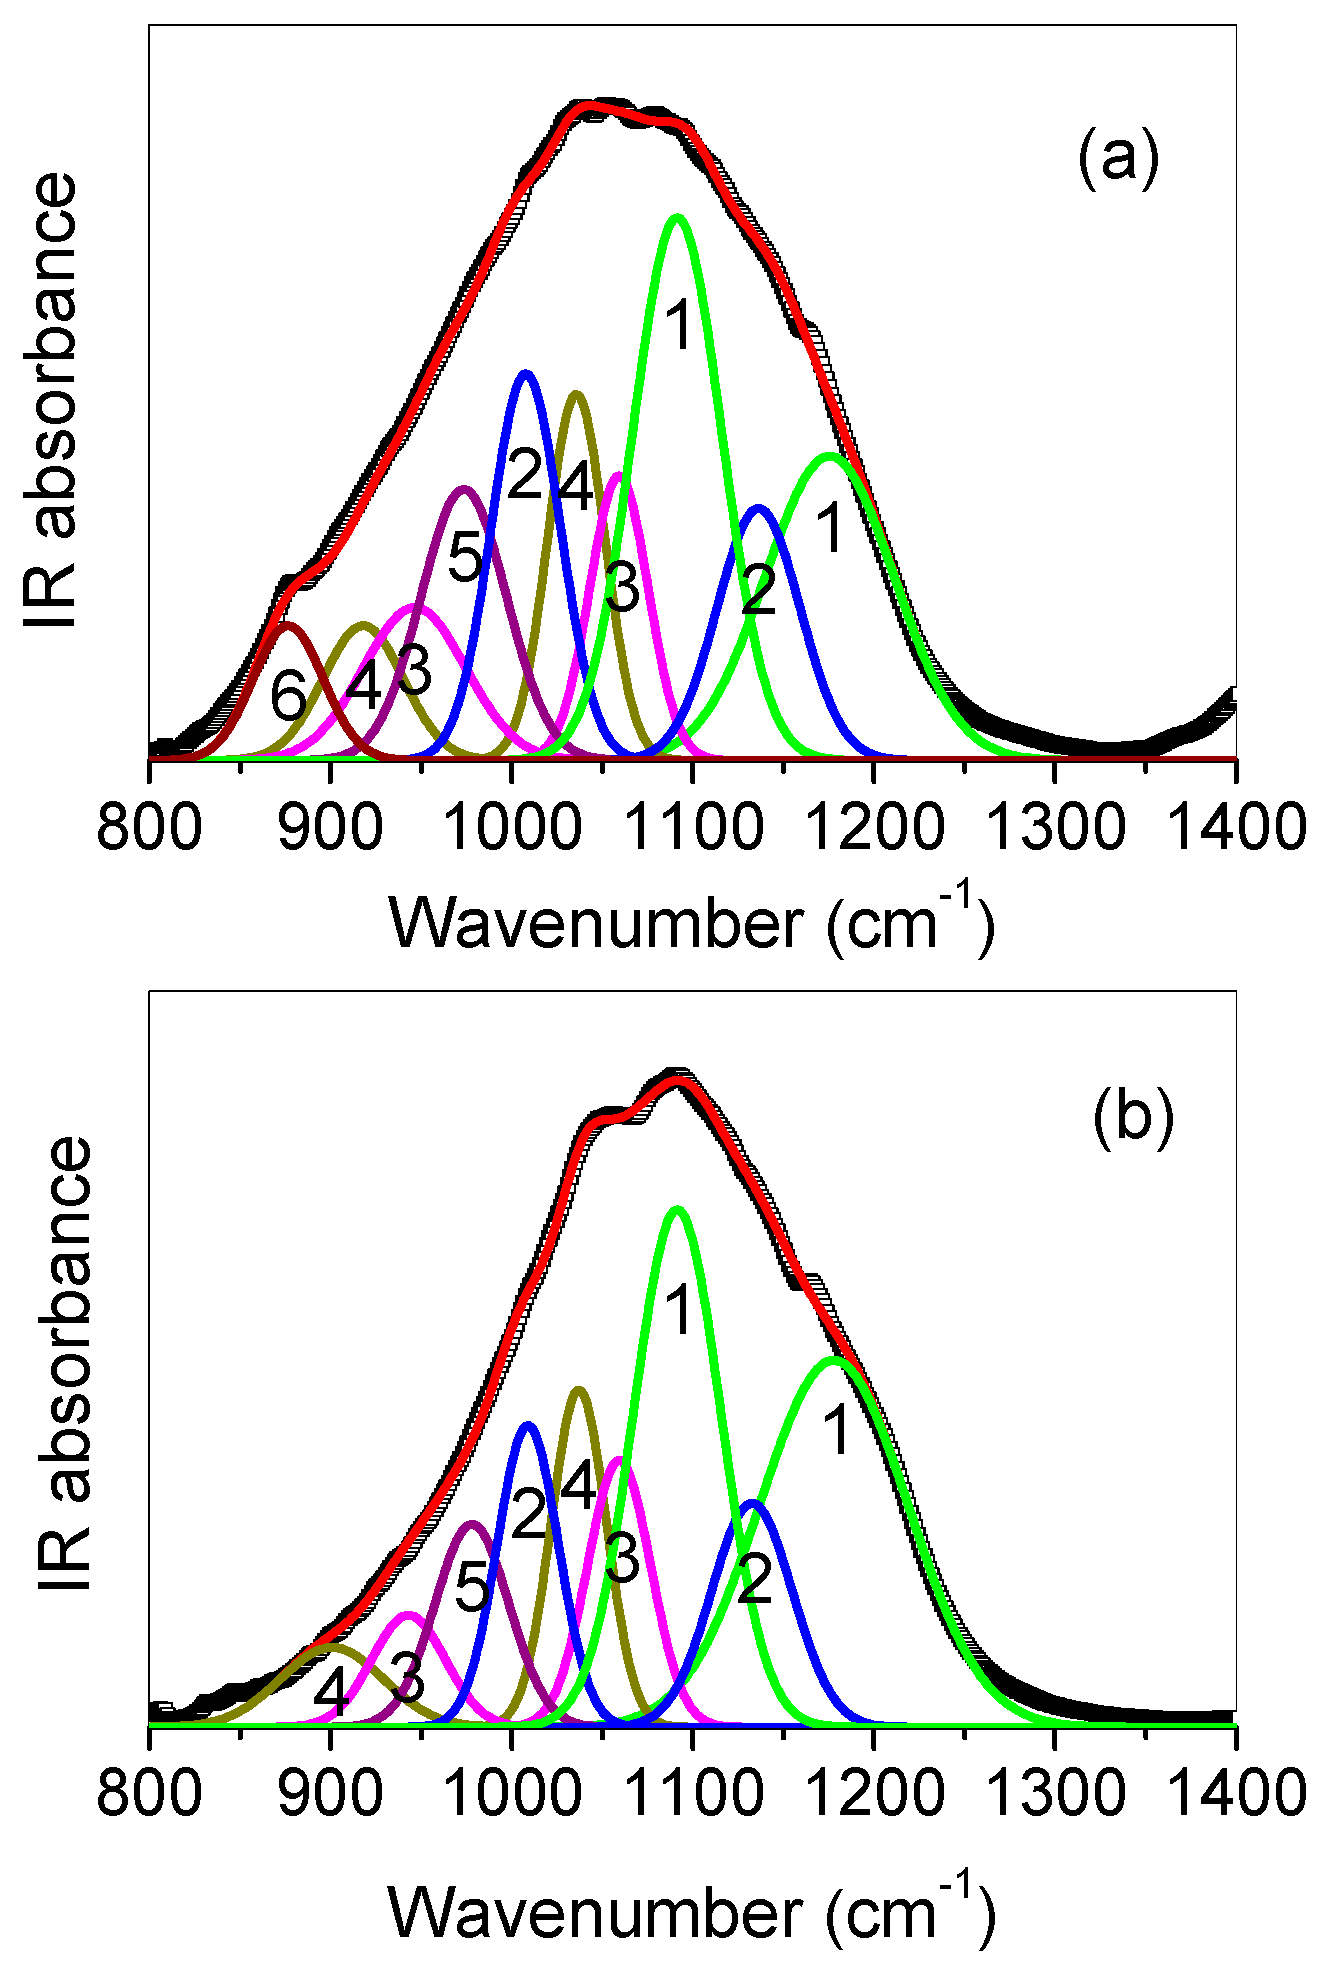
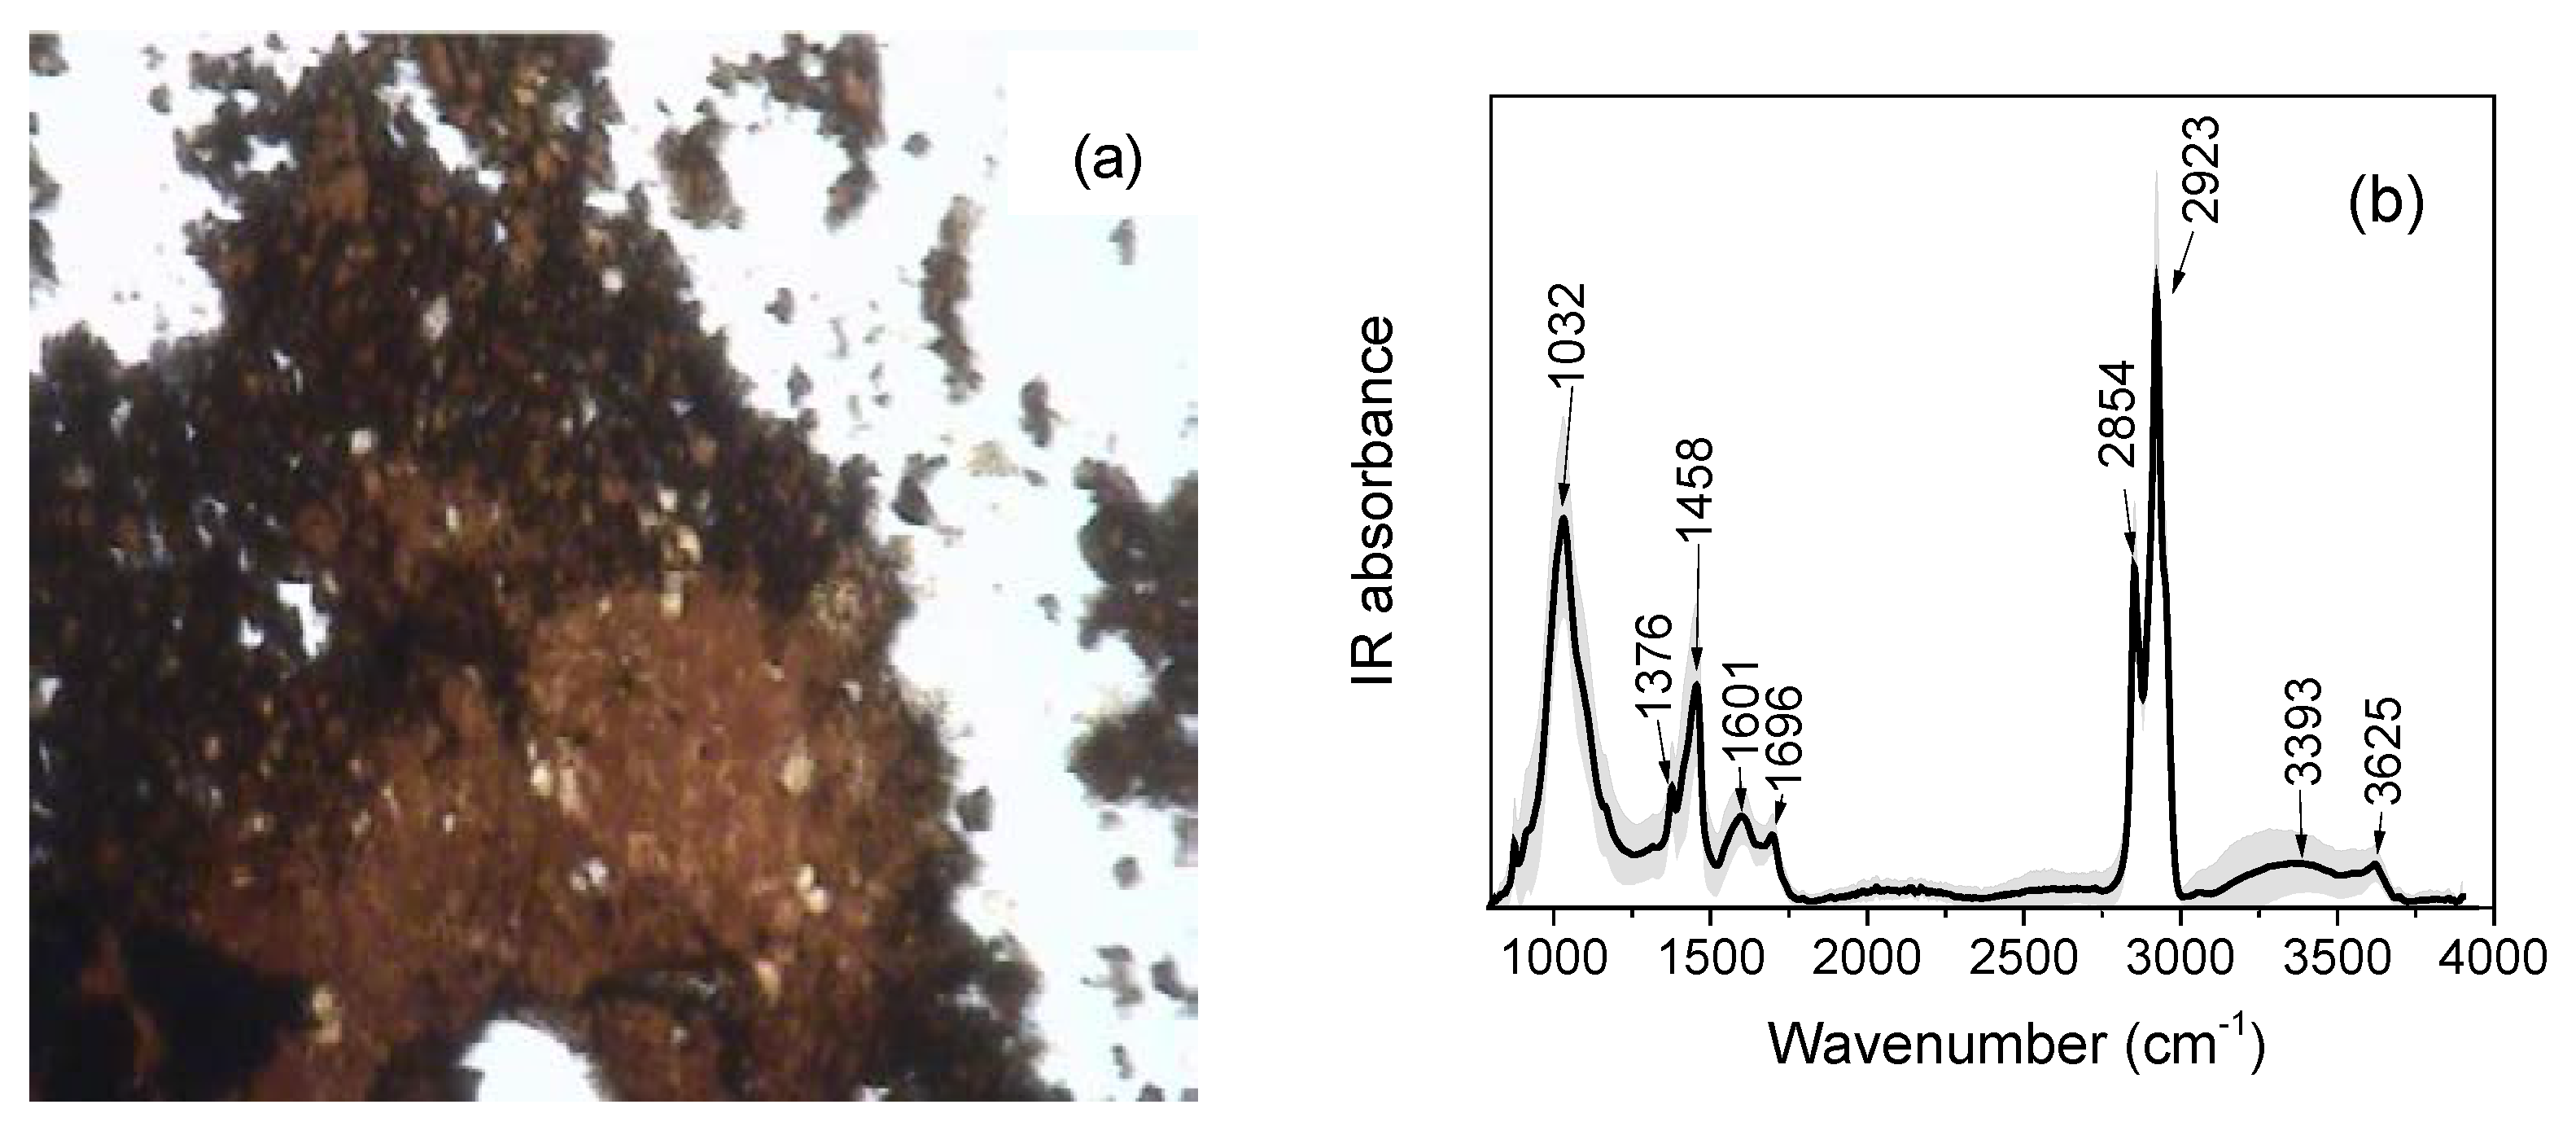
3.3. SR-Based FTIR Spectroscopy Analysis
4. Conclusions
Author Contributions
Funding
Acknowledgments
Conflicts of Interest
References
- Bayazit, M.; Işık, I.; Issi, A.; Genç, E. Archaeometric investigation of the Late Chalcolithic-Early Bronze Age I and the 1st–2nd millennium BCE potteries from Kuriki-Turkey. Appl. Clay Sci. 2016, 126, 180–189. [Google Scholar] [CrossRef]
- Szilágyi, V.; Gyarmati, J.; Tóth, M.; Taubald, H.; Balla, M.; Kasztovszky, Z.; Szakmány, G. Petro-mineralogy and geochemistry as tools of provenance analysis on archaeological pottery: Study of Inka Period ceramics from Paria, Bolivia. J. South Am. Earth Sci. 2012, 36, 1–17. [Google Scholar] [CrossRef]
- Javanshah, Z. Chemical and mineralogical analysis for provenancing of the Bronze Age pottery from Shahr-I-Sokhta, South Eastern Iran. Sci. Cult. 2018, 4, 83–92. [Google Scholar]
- Aquilia, E.; Barone, G.; Crupi, V.; Longo, F.; Majolino, D.; Mazzoleni, P.; Venuti, V. Multi-technique characterization of ancient findings from Gela (Sicily, Italy). J. Anal. At. Spectrom. 2011, 26, 977–983. [Google Scholar] [CrossRef]
- Samanian, K.; Abbasi, Z.; Kaldareh Ismailzadeh, A. Archaeometrical study of the used materials in Qajar easel painting using XRD, XRF, PLM and FTIR techniques: A case study of “Egyptian Girl” tablout. Mediterr. Archaeol. Archaeom. 2013, 13, 159–179. [Google Scholar]
- Bardelli, F.; Barone, G.; Crupi, V.; Longo, F.; Majolino, D.; Mazzoleni, P.; Venuti, V. Combined non-destructive XRF and SR-XAS study of ar, chaeological artefacts. Anal. Bioanal. Chem. 2011, 399, 3147–3153. [Google Scholar] [CrossRef] [PubMed]
- Crupi, V.; Kasztovszky, Z.; Khalilli, F.; La Russa, M.F.; Macchia, A.; Majolino, D.; Rossi, B.; Rovella, N.; Ruffolo, S.A.; Venuti, V. Evaluation of complementary methodologies applied to a preliminary archaeometric study of glazed pottery from Agsu (Azerbaijan). Int. J. Conserv. Sci. 2016, 7, 901–912. [Google Scholar]
- Crupi, V.; Majolino, D.; Venuti, V.; Barone, B.; Mazzoleni, P.; Pezzino, A.; La Russa, M.F.; Ruffolo, S.A.; Bardelli, F. Non-destructive identification of green and yellow pigments: The case of some Sicilian Renaissance glazed pottery. Appl. Phys. A Mater Sci. Process. 2010, 100, 845–853. [Google Scholar] [CrossRef]
- Sedek, H. Multi-analytical approach for the study of glazed pottery from Al-Fustat, Egypt. Mediterr. Archaeol. Archaeom. 2016, 16, 65–71. [Google Scholar]
- Nishiaki, Y.; Guliyev, F.; Kadowaki, S. Chronological contexts of the earliest pottery neolithic in the South Caucasus: Radiocarbon dates for Göytepe and Hacı Elamxanlı Tepe, Azerbaijan. Am. J. Archaeol. 2015, 119, 279–294. [Google Scholar] [CrossRef]
- Jabiev, G.; Khalilli, F. Researches of the Agsu Archaeological Expedition in 2010—I Volume; Miras: Agsu, Azerbaijan, 2010. [Google Scholar]
- Ye, L.; Liu, M.T.; Huang, W.; Yang, S.; An, Z. PIXE/RBS studies of ancient pottery from Jinsha ruins site of Chengdu. Nucl. Phys. Rev. 2010, 27, 493–499. [Google Scholar]
- Zhang, Z.Q.; Cheng, H.S.; Xia, H.N.; Jiang, J.C.; Yang, F.J. Non-destructive analysis and appraisal of ancient Chinese porcelain by PIXE. Nucl. Instrum. Methods Phys. Res. Sect. B Beam Interact. Mater. Atoms 2002, 190, 488–491. [Google Scholar]
- Cheng, H.S.; Zhang, Z.Q.; Song, J.; Gao, M.H.; Zhu, D.; Lin, J.W.; Feng, S.L. PIXE study on ancient pottery from Chinese Shanghai area. Nucl. Instrum. Methods Phys. Res. Sect. B Beam Interact. Mater. Atoms 2006, 249, 601–603. [Google Scholar] [CrossRef]
- Torrisi, L.; Italiano, A.; Cutroneo, M.; Gentile, C.; Torrisi, A. Silver coins analyses by X-ray fluorescence methods. J. X-ray Sci. Technol. 2013, 21, 381–390. [Google Scholar]
- Cutroneo, M.; Havranek, V.; Torrisi, L.; Svecova, B. Ion Micro Beam, promising methods for interdisciplinary research. J. Instrum. 2016, 11, 1–9. [Google Scholar] [CrossRef]
- Macková, A.; Kučera, J.; Kameník, J.; Havránek, V.; Kranda, K. Ion and Neutron Beams Discover New Facts from History. Nucl. Phys. News 2017, 27, 12–17. [Google Scholar] [CrossRef][Green Version]
- Sadek, H.; El Hady, A. Characteristics of ancient Egyptian glazed ceramic objects from Fatimid and Mamluk periods as revealed by ion beam analysis. In IOP Conference Series: Materials Science and Engineering, Proceedings of the International Conference on the Use of X-ray (and related) Techniques in Arts and Cultural Heritage (XTACH 11), Sharjah, United Arab Emirates, 7–8 December 2011; IOP Publishing: Bristol, UK, 2012; Volume 37, p. 012016. [Google Scholar]
- Bouquillon, A.; Castaing, J.; Salomon, J.; Zucchiatti, A.; Lucarelli, F.; Mando, P.A.; Prati, P.; Lanterna, G.; Vaccari, M.G. IBA techniques to study renaissance pottery techniques. Fundam. Appl. Asp. Mod. Phys. 2001, 9, 441–448. [Google Scholar]
- Salvadó, N.; Butí, S.; Tobin, M.J.; Pantos, E.; Prag, A.J.N.W.; Pradell, T. Advantages of the use of SR-FT-IR microspectroscopy: Application to cultural heritage. Anal. Chem. 2005, 77, 3444–3451. [Google Scholar] [CrossRef]
- Carr, G.L. High-resolution microspectroscopy and sub-nanosecond time-resolved spectroscopy with the synchrotron infrared source. Vib. Spectrosc. 1999, 19, 53–60. [Google Scholar] [CrossRef]
- Carr, G.L. Resolution limits for infrared microspectroscopy explored with synchrotron radiation. Rev. Sci. Instrum. 2001, 72, 1613–1619. [Google Scholar] [CrossRef]
- NIST-CANAM. Available online: http://www.ujf.cas.cz/cs/vyzkum-a-vyvoj/velke-vyzkumne-infrastruktury-a-centra/canam/about-the-project/ (accessed on 1 June 2019).
- Ryan, C.G.; Cousens, D.R.; Sie, S.H.; Griffin, W.L. Quantitative analysis of PIXE spectra in geosciences applications. Nucl. Instrum. Methods Phys. Res. Sect. B Beam Interact. Mater. Atoms 1990, 49, 271–276. [Google Scholar] [CrossRef]
- IBANDL. Available online: https://www-nds.iaea.org/ibandl/ (accessed on 1 June 2019).
- Ziegler, J. SRIM, The Stopping and Range of Ions in Materials. Available online: http://www.srim.org/ (accessed on 1 June 2019).
- Lupi, S.; Nucara, A.; Perucchi, A.; Calvani, P.; Ortolani, M.; Quaroni, L.; Kiskinova, M. Performance of SISSI, the infrared beamline of the ELETTRAstorage ring. JOSA B 2007, 24, 959–964. [Google Scholar] [CrossRef]
- Infrared and Raman Users Group Spectral Database; Price, B.A., Pretzel, B., Eds.; IRUG: Philadelphia, PA, USA, 2007; Volumes 1–2. [Google Scholar]
- Database of ATR-FT-IR Spectra of Various Materials. Available online: http://lisa.chem.ut.ee/IR_spectra/ (accessed on 1 June 2019).
- Barone, G.; Crupi, V.; Galli, S.; Majolino, D.; Migliardo, P.; Venuti, V. Spectroscopic investigation of Greek ceramic artefacts. J. Mol. Struct. 2003, 651–653, 449–458. [Google Scholar] [CrossRef]
- Cui, J.F.; Rehren, T.; Lei, Y.; Cheng, X.; Jiang, J.; Wu, X. Western technical traditions of pottery making in Tang Dynasty China: Chemical evidence from the Liquanfang Kiln site. Xi’an city. J. Archaeol. Sci. 2010, 37, 1502–1509. [Google Scholar] [CrossRef]
- Wu, J.; Hou, T.; Zhang, M.; Li, Q.; Wu, J.; Li, J.; Deng, Z. An analysis of the chemical composition, performance and structure of China Yixing Zisha pottery from 1573 A.D. to 1911 A.D. Ceram. Int. 2013, 39, 2589–2595. [Google Scholar] [CrossRef]
- Figueiredo, M.O.; Pereira da Silva, T.; Veiga, J.P. Ancient glazed ceramic tiles: A long-term study from the remediation of environmental impacts to the non-destructive characterization of materials. In Proceedings of the International Seminar on Conservation of Glazed Ceramic Tiles: Research and Practice, Lisbon, Portugal, 1 January 2009. [Google Scholar]
- Tite, M.S.; Freestone, I.; Mason, R.; Molera, J.; Vendrell-Saz, M.; Wood, N. Lead glazes in antiquity—Methods of production and reasons for use. Archaeometry 1998, 40, 241–260. [Google Scholar] [CrossRef]
- Özçatal, M.; Yaygıngöl, M.; İssib, A.; Kara, A.; Turan, S.; Okyar, F.; Pfeiffer Taş, Ş.; Nastova, I.; Grupče, O.; Minčeva-Šukarova, B. Characterization of lead glazed potteries from Smyrna (Izmir/Turkey) using multiple analytical techniques; Part I: Glaze and engobe. Ceram. Int. 2014, 40, 2143–2151. [Google Scholar] [CrossRef]
- Molera, J.; Pradell, T.; Salvadό, N.; Vendrell-Saz, M. Evidence of tin oxide recrystallization in opacified lead glazes. J. Am. Ceram. Soc. 1999, 82, 2871–2875. [Google Scholar] [CrossRef]
- Dejoie, C.; Sciau, P.; Li, W.; Noé, L.; Mehta, A.; Chen, K.; Luo, H.; Kunz, M.; Tamura, N.; Liu, Z. Learning from the past: Rare ε-Fe2O3 in the ancient black-glazed Jian (Tenmoku) wares. Sci. Rep. 2014, 4, 4941(1)–4941(9). [Google Scholar] [CrossRef]
- Barilaro, D.; Crupi, V.; Interdonato, S.; Majolino, D.; Venuti, V.; Barone, G.; La Russa, M.F.; Bardelli, F. Characterization of blue decorated Renaissance pottery fragments from Caltagirone (Sicily, Italy). Appl. Phys. A 2008, 92, 91–96. [Google Scholar] [CrossRef]
- Barilaro, D.; Barone, G.; Crupi, V.; Majolino, D.; Mazzoleni, P.; Tigano, G.; Venuti, V. FT-IR absorbance spectroscopy to study Sicilian “proto-majolica” pottery. Vib. Spectrosc. 2008, 48, 269–275. [Google Scholar] [CrossRef]
- Sotiropoulou, S.; Papliaka, Z.E.; Vaccari, L. Micro FTIR imaging for the investigation of deteriorated organic binders in wall painting stratigraphies of different techniques and periods. Microchem. J. 2016, 124, 559–567. [Google Scholar] [CrossRef]
- Issi, A. Estimation of ancient firing technique by the characterization of semi-fused Hellenistic potsherds from Harabebezikan/Turkey. Ceram. Int. 2012, 38, 2375–2380. [Google Scholar] [CrossRef]
- Iordanidis, A.; Garcia-Guinea, J.; Karamitrou-Mentessidi, G. Analytical study of ancient pottery from the archaeological site of Aiani, northern Greece. Mater. Charact. 2009, 60, 292–302. [Google Scholar] [CrossRef]
- Murray, H.H. Overview—Clay mineral application. Appl. Clay Sci. 1991, 5, 379–395. [Google Scholar] [CrossRef]
- Trindade, M.J.; Dias, M.I.; Coroado, J.; Rocha, F. Mineralogical transformations of calcareous rich clays with firing: A comparative study between calcite and dolomite rich clays from Algarve, Portugal. Appl. Clay Sci. 2009, 42, 345–355. [Google Scholar] [CrossRef]
- Jovanovski, G.; Makreski, P.; Kaitner, B.; Šoptrajanov, B. Minerals from Macedonia. X-ray powder diffraction vs. vibrational spectroscopy in mineral identification. Contributions Sec. Math. Tech. Sci. 2009, 30, 7–34. [Google Scholar] [CrossRef][Green Version]


| Sample | Typology | Description |
|---|---|---|
| AZR3 | Glazed pottery | Dark beige ceramic body, black glaze |
| AZR5 | Glazed pottery | Reddish ceramic body, dark yellow glaze |
| AZR7 | Glazed pottery | Reddish ceramic body, yellowish glaze |
| AZR1 | Faience | White ceramic body, light blue glaze |
| Sample | C | N | O | Na | Mg | Al | Si | Ca | Fe | Ba | Pb | |
|---|---|---|---|---|---|---|---|---|---|---|---|---|
| Relative atomic concentration (%) | AZR3 | 17.8 | 5.4 | 45.2 | 2.7 | 4.2 | 7.7 | 9.1 | 5 | 1.6 | 0.05 | MDL |
| AZR5 | 2.3 | 1.7 | 59 | MDL | 0.7 | 7 | 19.3 | 1.2 | 2.3 | MDL | 0.02 | |
| AZR7 | 6.6 | MDL | 58.3 | MDL | 0.2 | 5 | 14.5 | 4.5 | 0.05 | 0.1 | 0.02 | |
| AZR1 | 3.0 | 3.9 | 54.6 | 9 | 4 | 5.8 | 16.5 | 1.2 | MDL | 0.1 | 0.01 |
| Sample | C | N | O | Na | Mg | Al | Si | Ca | Fe | Ba | Pb | |
|---|---|---|---|---|---|---|---|---|---|---|---|---|
| Relative atomic concentration (%) | AZR3 | 11.3 | 12.1 | 42 | MDL | 5.7 | 9.8 | 9.8 | 7.8 | 1.03 | 0.03 | MDL |
| AZR5 | 4.3 | 8.2 | 49.5 | MDL | 8.2 | 13 | 11.4 | 1.9 | 2.1 | 0.42 | 0.57 | |
| AZR7 | MDL | MDL | 57.8 | MDL | 7.6 | 4.8 | 16.9 | 3.7 | 2.0 | 0.76 | 6.2 | |
| AZR1 | 6.7 | MDL | 58.3 | 9.0 | MDL | 0.3 | 21 | 2.9 | MDL | MDL | 0.06 |
| (a) | Sample | Na | Mg | Al | Si | P | S | Cl | K | Ca | Ti | Fe |
| AZR3 | 0.71 | 1.26 | 9.23 | 25.59 | 0.52 | 0.21 | 797 ppm | 2.5 | 9.38 | 6.7 | 4.5 | |
| AZR5 | 0.33 | 0.38 | 2.42 | 12.8 | 0.5 | 7.1 | 0.974 | 0.3 | 0.4 | 1.6 | 1.5 | |
| AZR7 | 0.14 | 1.85 | 16.7 | 47.0 | 0.55 | 0.15 | 0.885 | 3.0 | 6.7 | 13.0 | 5.0 | |
| AZR1 | 4.54 | 1.06 | 14.69 | 48.0 | 71 ppm | 0.086 | 0.71 | 1.2 | 1.34 | 1.3 | 0.5 | |
| (a) | Sample | Cu | Zn | Ge | Br | Zr | Pb | |||||
| AZR3 | 14 ppm | 0.04 | MDL | MDL | 450 ppm | MDL | ||||||
| AZR5 | 27 ppm | 1.25 | 0.56 | 0.16 | 0.13 | 20 | ||||||
| AZR7 | 14 ppm | 0.025 | MDL | 0.025 | MDL | MDL | ||||||
| AZR1 | 2.72 | 0.13 | MDL | MDL | MDL | MDL | ||||||
| (b) | Sample | Cr | Mn | Ga | As | Se | ||||||
| AZR3 | 257 ppm | 840 ppm | 830 ppm | MDL | 456 ppm | |||||||
| AZR5 | 40 ppm | 210 ppm | 830 ppm | 150 ppm | MDL | |||||||
| AZR7 | 75 ppm | 630 ppm | 80 ppm | MDL | MDL | |||||||
| AZR1 | 50 ppm | 190 ppm | 80 ppm | 78 ppm | MDL |
| (a) | Sample | Na | Mg | Al | Si | P | S | Cl | K | Ca | Ti | Fe |
| AZR3 | 0.33 | 1.05 | 5.02 | 20.7 | 0.58 | 0.3 | 885 ppm | 2.5 | 13.4 | 4.8 | 3.44 | |
| AZR5 | 0.63 | 1.10 | 7.03 | 25.8 | 0.23 | 0.7 | 1.7 | 2.04 | 1.08 | 6.7 | 5.05 | |
| AZR7 | 0.63 | 0.51 | 4.09 | 20.0 | 0.46 | 3.5 | 1.3 | 0.38 | 0.33 | 4.8 | 0.92 | |
| AZR1 | 7.3 | 0.87 | 2.2 | 31.0 | 71 ppm | 0.25 | 2.6 | 1.2 | 2.4 | 2.1 | 1.01 | |
| (a) | Sample | Cu | Zn | Ga | Pb | |||||||
| AZR3 | 694 ppm | 0.05 | 66 ppm | 71 ppm | ||||||||
| AZR5 | 513 ppm | 0.088 | 660 ppm | 4.92 | ||||||||
| AZR7 | 139 ppm | 1.01 | 0.003 | 20.1 | ||||||||
| AZR1 | 5.43 | 0.8 | 0.002 | 0.46 | ||||||||
| (b) | Sample | Cr | Mn | As | Se | Br | Zr | |||||
| AZR3 | 91 ppm | 841 ppm | 41 ppm | MDL | MDL | MDL | ||||||
| AZR5 | 66 ppm | 766 ppm | 103 ppm | MDL | 110 ppm | 88 ppm | ||||||
| AZR7 | 10 ppm | 37 ppm | MDL | 698 ppm | MDL | 635 ppm | ||||||
| AZR1 | 10 ppm | 243 ppm | 157 ppm | MDL | MDL | MDL |
| Sample | Mineral | ||||||
|---|---|---|---|---|---|---|---|
| Quartz | Oligoclase | Orthoclase | Diopside | Montmorillonite | Anorthite | Calcite | |
| AZR3 | +++ | ++ | − | + | + | + | + |
| AZR5 | +++ | ++ | − | + | + | + | + |
| AZR7 | +++ | ++ | − | + | + | + | − |
| AZR1 | +++ | − | +++ | ++ | ++ | + | + |
© 2019 by the authors. Licensee MDPI, Basel, Switzerland. This article is an open access article distributed under the terms and conditions of the Creative Commons Attribution (CC BY) license (http://creativecommons.org/licenses/by/4.0/).
Share and Cite
Torrisi, L.; Venuti, V.; Crupi, V.; Silipigni, L.; Cutroneo, M.; Paladini, G.; Torrisi, A.; Havránek, V.; Macková, A.; La Russa, M.F.; et al. RBS, PIXE, Ion-Microbeam and SR-FTIR Analyses of Pottery Fragments from Azerbaijan. Heritage 2019, 2, 1852-1873. https://doi.org/10.3390/heritage2030113
Torrisi L, Venuti V, Crupi V, Silipigni L, Cutroneo M, Paladini G, Torrisi A, Havránek V, Macková A, La Russa MF, et al. RBS, PIXE, Ion-Microbeam and SR-FTIR Analyses of Pottery Fragments from Azerbaijan. Heritage. 2019; 2(3):1852-1873. https://doi.org/10.3390/heritage2030113
Chicago/Turabian StyleTorrisi, Lorenzo, Valentina Venuti, Vincenza Crupi, Letteria Silipigni, Mariapompea Cutroneo, Giuseppe Paladini, Alfio Torrisi, Vladimír Havránek, Anna Macková, Mauro Francesco La Russa, and et al. 2019. "RBS, PIXE, Ion-Microbeam and SR-FTIR Analyses of Pottery Fragments from Azerbaijan" Heritage 2, no. 3: 1852-1873. https://doi.org/10.3390/heritage2030113
APA StyleTorrisi, L., Venuti, V., Crupi, V., Silipigni, L., Cutroneo, M., Paladini, G., Torrisi, A., Havránek, V., Macková, A., La Russa, M. F., Birarda, G., Vaccari, L., Macchia, A., Khalilli, F., Ricca, M., & Majolino, D. (2019). RBS, PIXE, Ion-Microbeam and SR-FTIR Analyses of Pottery Fragments from Azerbaijan. Heritage, 2(3), 1852-1873. https://doi.org/10.3390/heritage2030113


