1. Introduction
Textiles contain important archaeological information about everyday life, religion, art, technical culture, religion, and history of ancient peoples. Unfortunately, ancient textiles are rare in archaeological sites compared to ceramic, metal, and wood artifacts because of their structural fragility under the action of humidity, temperature, fungi, microbes, and insects. Nevertheless, especially in Egypt or the Near East, there are many cases in which well-preserved textiles have been discovered in crypts and ground caves. Archeological textiles can comprise braided and woven structures from animal or vegetable fibers. Fragments of linen burial cloths indicate that weaving with flax was already used about 8000–9000 years ago [
1]. Indeed, flax is a vegetable textile frequently used by populations of the Mediterranean geographical area. One reason is that linen fibers are the most resistant vegetable fibers to environmental aging agents (oxygen, humidity, light, etc.).
Deterioration of vegetable fibers is related to cellulose degradation, the main component of their structure. Cellulose in linen fabrics is a polymer, which contains anhydroglucose units bonded by β-glycosidic bonds. Aging of textiles can have thermal, hydrolytic, photolytic, photochemical, and enzymatic origins. All these physical and chemical agents degrade cellulose, provoking the scission of the polymeric chains by breaking the β-glycosidic bonds [
2,
3,
4]. Within any glucose unit, three hydroxyl groups are available for oxidation, leading to a great variety of structural modifications and combinations of the cellulose through oxidative processes. Depending on the particular stress imposed on cellulose, the individual hydroxyl groups in both the polymeric chain and the anhydroglucose units are involved to a varying extent in giving rise to carbonyl and carboxyl groups. These groups are usually introduced in the structure of cellulose through material processing steps, such as bleaching. Furthermore, high energy radiation can cause a considerable increase in carbonyl groups in addition to chain scission, mainly through the action of the generated radical species. For example, the number of carbonyls introduced by γ-irradiation is directly correlated to the applied dosage [
5].
Carbonyl and carboxyl group formations in cellulose are also caused by natural aging, which happens at room temperature and humidity. Indeed, the presence of oxygen, often in the presence of light, induces many auto-oxidative reactions. In fact, natural aging of cellulosic fabrics is due to two main processes: hydrolytic cleavage of the glycosidic bond [
6,
7,
8] and oxidation [
9,
10,
11,
12], which mainly depends on average room temperature values. Indeed, the role of atmospheric oxygen is crucial. Radical reactions come into play leading to formation of carbonyl or carboxyl groups, to chain cleavage, and thus also to a loss in the degree of polymerization and in the fiber strength.
Recently, new dating methods of textiles have been proposed based on the mechanical analysis such as breaking strength, Young modulus, and loss factor and on opto-chemical analyses (by FT-IR and Raman spectroscopies) as a function of the age of the fabric [
13,
14,
15]. These new dating methods are possible alternatives to the radiocarbon dating of textiles [
16]. Kim et al. [
17] investigated the influence of oxidation in the cellulose crystalline domains and showed that the degree of crystallinity of the oxidized cellulose determined by X-ray diffraction decreases according to the oxidation level. This finding, in principle, could allow the obtainment of information about the age of the textile by means of x-ray structural characterization. For this reason, the aim of this paper is to study by means of X-ray diffraction the decrease of the degree of polymerization of cellulose in naturally aged linen fabrics as a function of the aging time, mainly due to thermal and hydrolytic actions which have occurred where they have been preserved for centuries.
In the present paper, by characterizing the textile threads with Wide-Angle X-ray Scattering (WAXS), we have investigated the possibility of extracting structural information suitable for deriving the age of ancient linen fabrics. The work can be summarized in three main parts: (1) the analysis of the WAXS data collected from radiocarbon/historically dated ancient linen threads; (2) the study of the degree of polymerization of cellulose as a function of the aging time; and (3) the X-ray dating obtained by our novel approach compared to other dating of the same investigated linen threads, such as radiocarbon (14C) or Historical Records (HR). In the discussion of the results, we analyze expected limits of application of the proposed new dating method by verifying the WAXS-derived aging times of linen’s threads also from a statistical point of view.
2. Degree of Polymerization as a Function of the Aging Time
Cellulose consists of linear, polymeric chains of cyclic (anhydroglucose) units of which number per chain is called the Degree of Polymerization (
DP) [
3]. During polymerization, the chains of cellulose molecules are organized in both crystalline and amorphous regions, in micro-fibrils, and finally into fibres. The depolymerization, i.e., the increase in the number of Chain Breaks (
CB), is the main mechanism of cellulose degradation.
The
CB is proportional to the Scission Fraction of Cellulose Unit (SFCU), which can be related to the
DP by means of the following equation [
3,
4]:
where
is the degree of polymerization at time
t and
is the degree of polymerization before the degradation of cellulose starts.
DP represents the average number of monomers in the cellulose polymer. Therefore,
DP(
t) gives a measure of the length of cellulose polymer after the aging time
t. The natural aging process that degrades cellulose in thousands of years can be accelerated in suitable ovens by increasing the temperature to reach the maximum number of
in few thousands of hours. For this reason, by accelerating the process in ovens, the degradation of cellulose is studied under controlled conditions, but there are no data available concerning the
DP decrease due to thermal, hydrolytic, and oxidative natural aging occurring at room temperature. Threads of ancient fabrics are studied here by WAXS to retrieve the first experimental information about
or
CB(
t) for very long natural aging processes.
To relate
CB(
t) to some quantities measured by WAXS on linen threads, we have defined the fraction of maximum
CB, a parameter given by the ratio between
CB at any aging time and the normalized asymptotic value obtained for very long aging times (see Equations (A5) and (A6) in
Appendix A):
where
is the reaction rate at the oven temperature
at which the accelerated degradation process has been measured and
is the temperature at which fabrics have been preserved during the centuries (i.e., the local average room temperature). Given
,
, and
, Equation (2) depends only on two quantities, the
DP activation energy
and the
DP maximum fractional loss (
). The Arrhenius shift factor
has the following expression [
2]:
where
R is the gas constant (see
Appendix A for further details). The first task of this work is to obtain information by WAXS about
and
for the natural aging of linen, which occurs over many centuries.
3. WAXS Characterization of Ancient Linen Threads
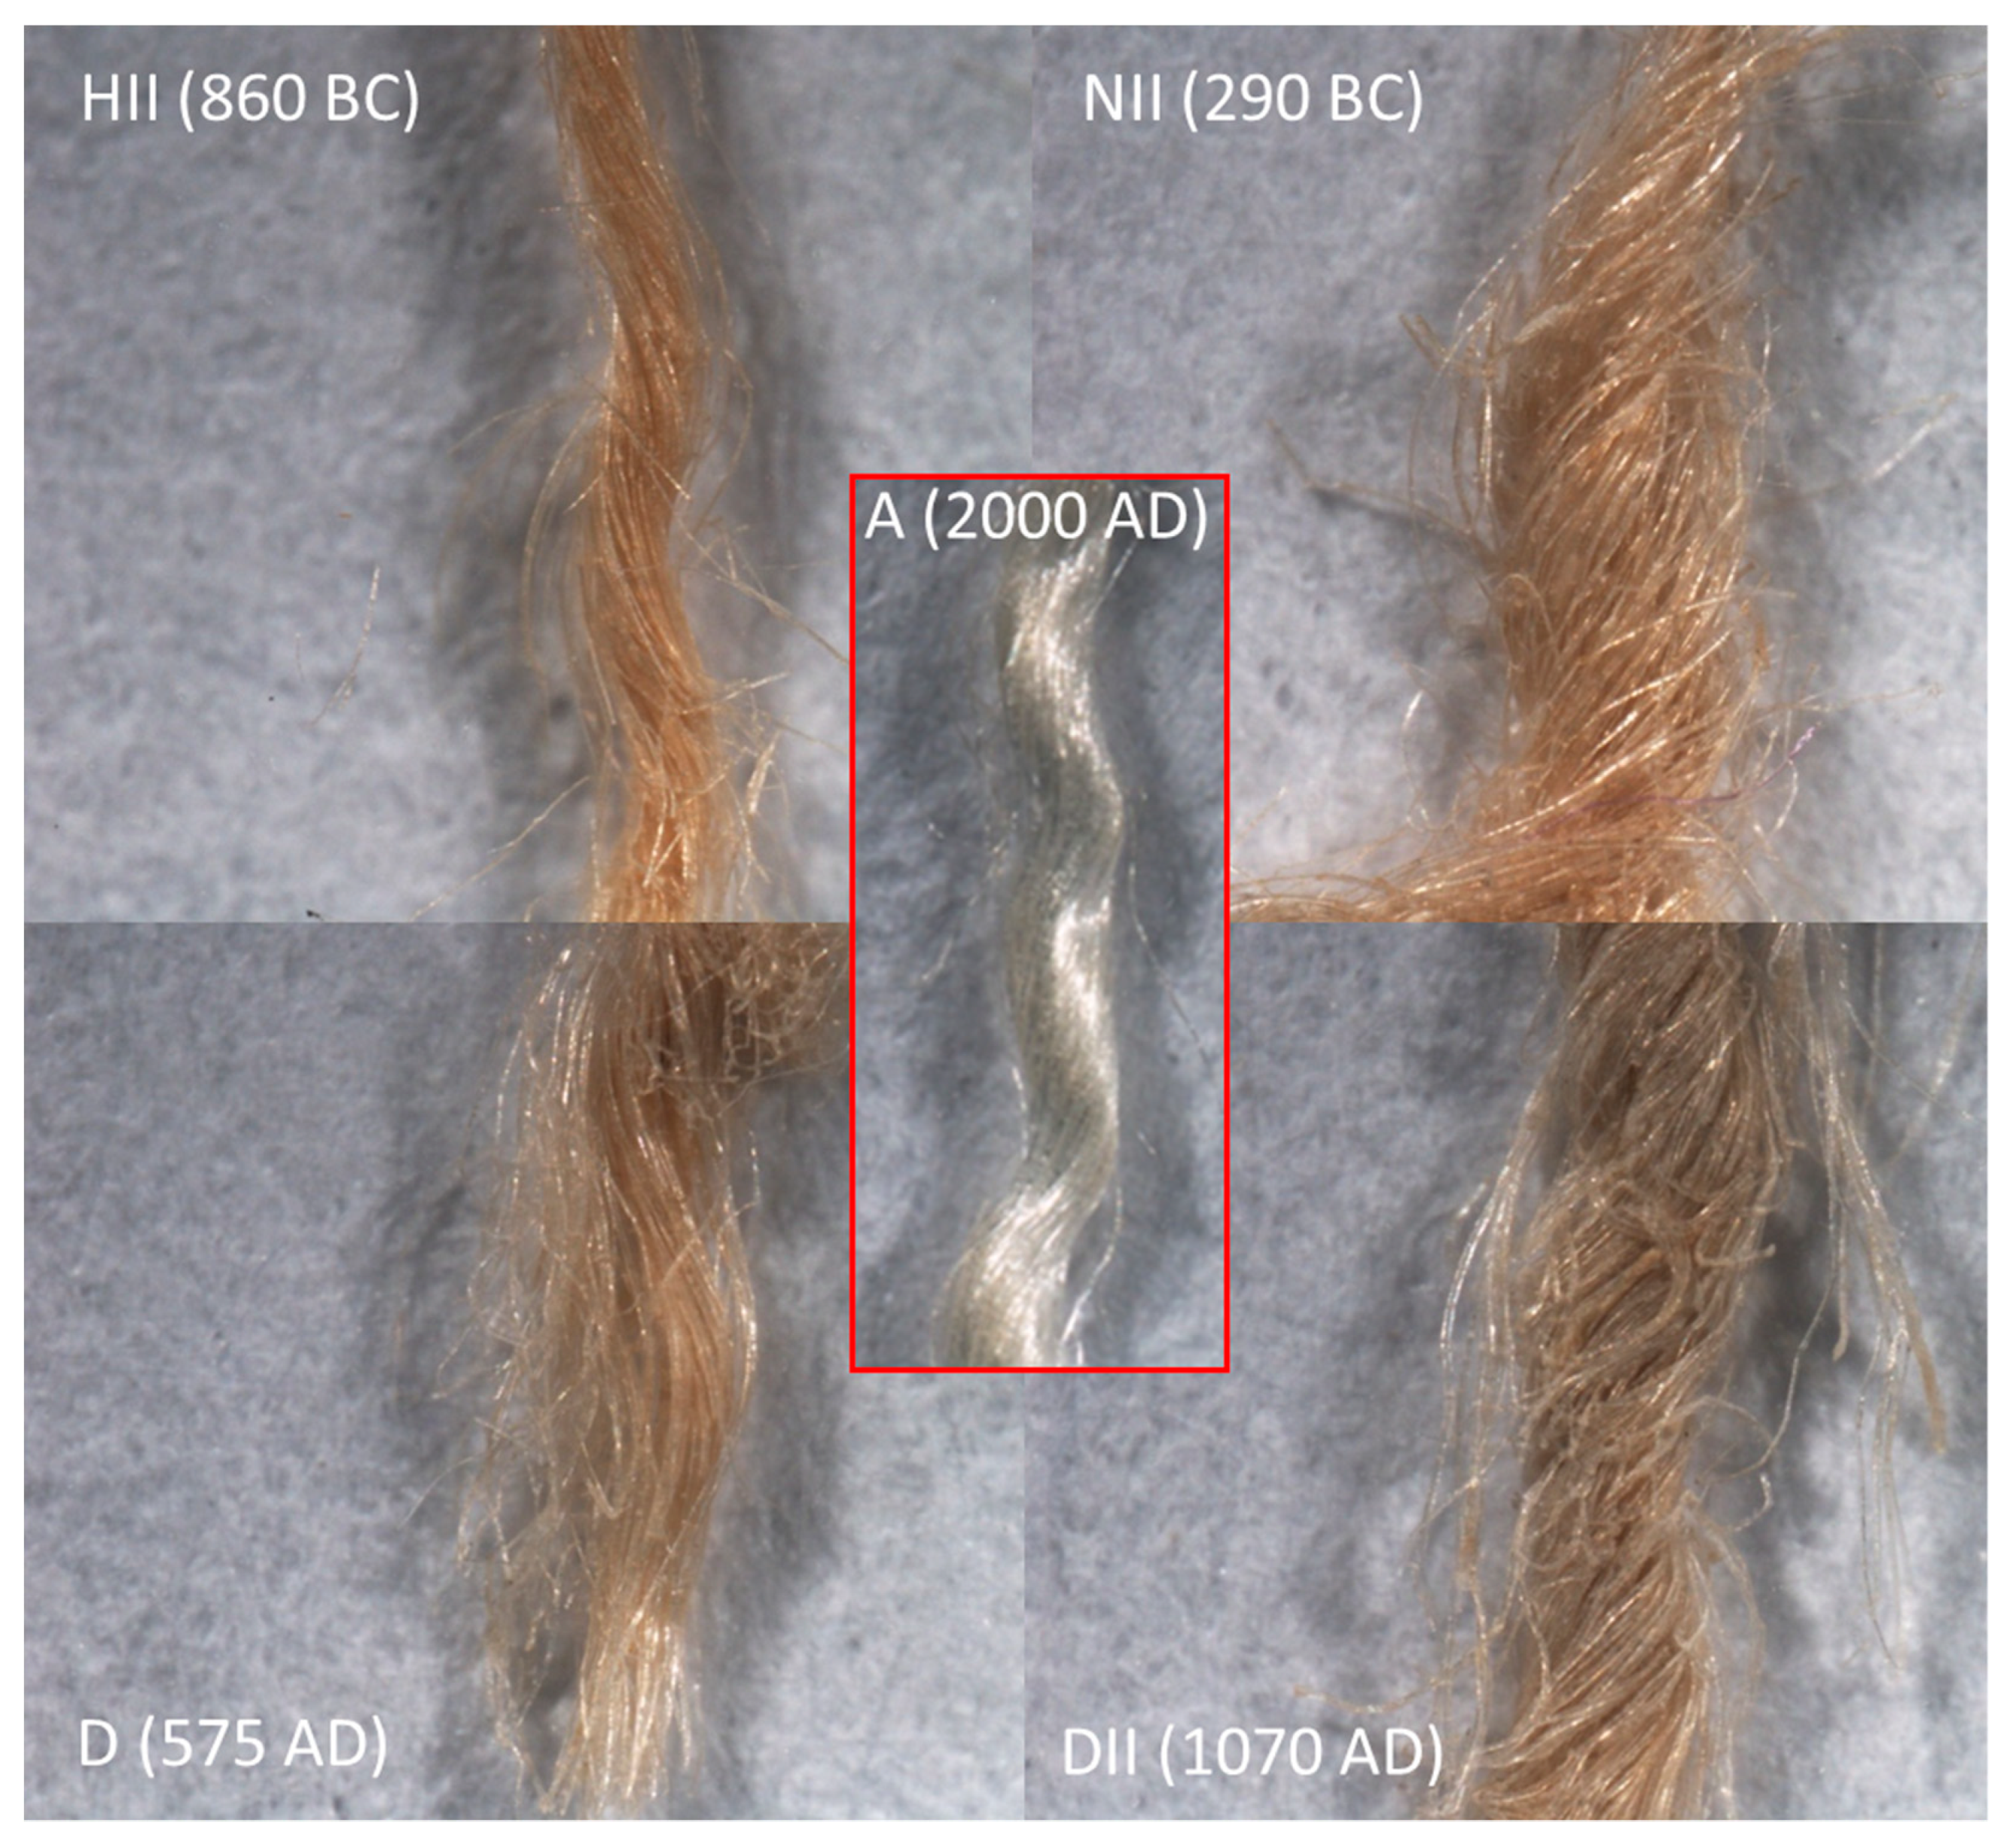
The characterized samples were linen threads, about 1 cm long and 0.2–0.6 mm wide. Some of them are shown in
Figure 1. The threads shown in
Figure 1 have been taken from fabric samples already studied by other authors [
13,
15], of which the nomenclature and average
14C/HR dating are reported in
Figure 1 and in the following text. The main data of the characterized samples are summarized in the first two columns of
Table 1.
WAXS experiments were performed at the X-ray Micro Imaging Laboratory (XMI-LAB) on all the linen samples reported in
Table 1. The laboratory is equipped with an Fr-E+ SuperBright rotating copper anode micro-source (λ = 0.154 nm, 2475 W) coupled through a focusing multilayer optics Confocal Max-Flux (CMF 15–105) to a Small/Wide-angle X-ray scattering SAXS/WAXS (SWAXS) three-pinhole camera equipped for X-ray scanning microscopy. An image plate (IP) detector (250 × 160 mm
2, with 100 μm effective pixel size) with an offline Rigaku RAXIA-Di reader was employed to collect WAXS data. WAXS data were collected for each linen sample directly mounted on the sample holder with an acquisition time of 1800 s. The spot size at the sample position was about 200 μm. The image plate detector was placed at about 10 cm from the sample, giving access to a range of scattering vector moduli (q = 4π × sinϑ/λ) from 1.5 to around 35 nm
−1. Two-dimensional (2D) patterns were then converted into one-dimensional (1D) data profiles after the calibration procedure.
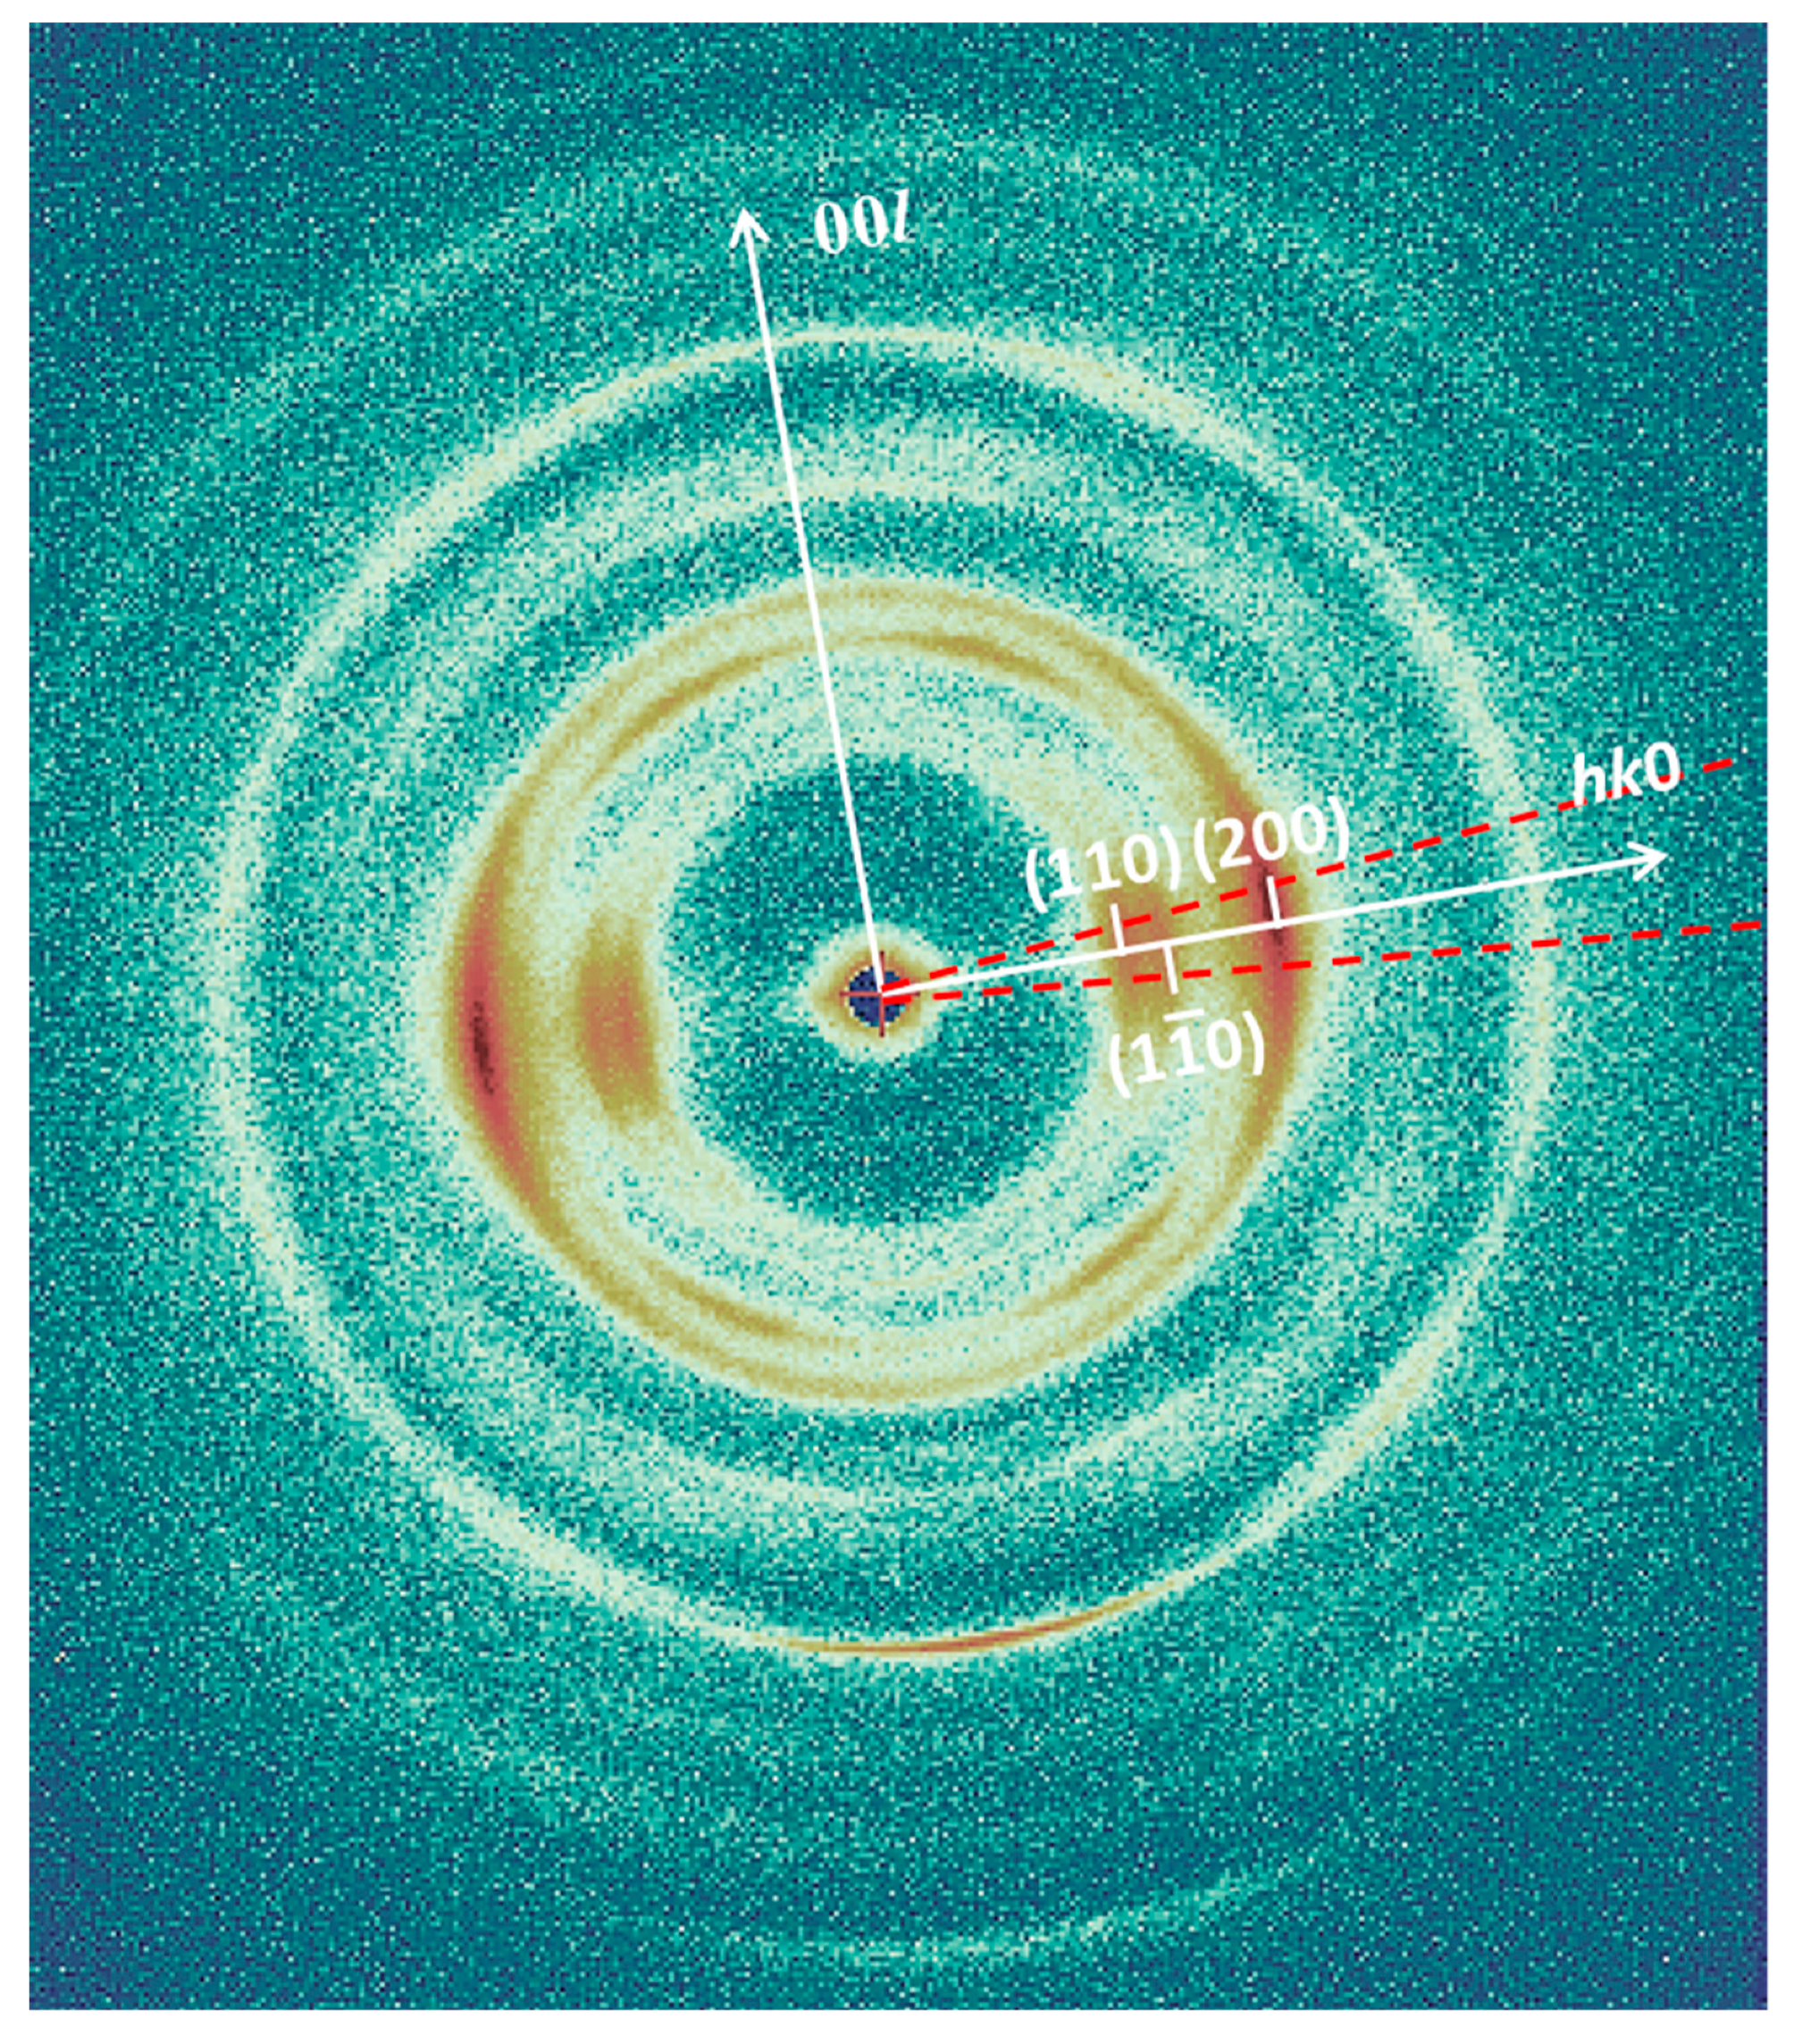
Figure 2 displays the 2D WAXS pattern measured on sample D (575 AD) of
Figure 1.
Figure 3 shows the average scattered intensity of the WAXS patterns of some of the investigated textile samples, integrated in a 10-degree wide angular sector between the two red dashed lines of
Figure 2 around the
hk0 equatorial fiber-diffraction axis, where
h and
k are the Miller’s crystallographic indexes. This information was extracted from all 2D WAXS patterns of the investigated samples. In particular, in
Figure 3, we report the experimental results obtained from sample A (
Figure 3, black curve), FII (
Figure 3, green light curve), D (
Figure 3, red curve), and LII (
Figure 3, blue curve), characterized by very different ages. They exhibit clear differences in the scattering profiles, already visible from visual inspection of the curves. The profiles were rescaled to the same integrated intensity in the q-range 1.5–4.0 nm
−1, i.e., the region of the incident beam tail. After this rescaling, it is evident that the diffraction WAXS intensity peaks depend on the age of the linen threads. This dependence was used to date the ancient linen threads from WAXS data.
Indeed, crystalline cellulose is known to have (1) a diamond-shaped cross section, with exposed (110) and (1–10) crystal faces, and (2) a rectangular-shaped cross section with exposed (200) and (010) faces [
18]. Cellulose degradation rates are slightly different for the two crystallographic configurations (diamond- and rectangular-shaped). Moreover,
DP is not simply related to the crystallinity of cellulose.
DP could be the same in both crystalline and amorphous regions of cellulose, even if the decrease of the degree of polymerization with age is usually faster in the amorphous regions. However, only spatially ordered chains will contribute to the diffraction peaks. Thus, with WAXS, we can inspect the
DP of the crystalline regions of the investigated linen threads.
Reaction with cellulosic chains will most likely take place on the surfaces of cellulose crystallites and at defects where water and oxygen can penetrate. Thermal rupture of chains can occur inside crystallites as well as on their outer surfaces based on normal first-order kinetic rupture of glycosidic links. Following rupture of cellulose chains, crystallite volumes will reduce by disordering at surfaces as well as by increasing disorder within crystallites following internal chain thermal rupture. Thus, an average reduction in crystallite volume will ensue but as a consequence of two different mechanisms. The integrated diffraction intensities are proportional to the crystallite volumes and, thus, proportional to the length of the cellulose polymeric chains, i.e., to
DP(
t) of polymeric chains in the crystalline regions at the aging time
t. Therefore, the inverse of the integrated intensity under the main cellulose diffraction peaks can be used to obtain experimental information about 1/
DP(
t). However, from Equation (1),
CB(
t) is related to 1/
DP(
t). Thus, by WAXS quantifying the reduction in the intensity of the cellulose diffraction peaks shown in
Figure 3, it is possible to obtain experimental information about
CB(
t).
4. X-ray Aging Parameter
Table 1 summarizes some experimental quantities obtained by WAXS: the scattered intensity, integrated below the (110) and (1–10) diffraction peaks <
I>
q∊[0.9,1.3] in the scattering vector q-range = 9.0–13.0 nm
−1 (yellow region of
Figure 3); the maximum intensity in the entire q-range, dominated by the intensity of the (200) peak (
IM); and the minimum background intensity between the (1–10) and (200) diffraction peaks (
Im). The symbol <...> stands for the average of the scattered intensities in the indicated q-range. The term <
I>
q∊[0.9,1.3] stands for the intensity in an angular sector of 10 degrees around the hk0 axis averaged in the scattering q-range from 0.9 to 1.3 nm
−1 and is referred in the following as
ID.
From these experimental quantities, we extracted the Aging Factor (
AF), which is proportional to the inverse of
ID, i.e., proportional to the inverse of
DP(
t). The integrated intensity under every diffraction peak is also proportional to the number of crystalline cellulose chains, which diffract photons in well-defined scattering directions, defined by the Bragg law. Therefore, in the definition of
AF, it is necessary to insert a quantity proportional to the number of cellulose chains, which cause diffraction. In turn, this quantity depends on the actual thickness of the sample, which changes for every sample and comprises a different number of fibres, as shown in
Figure 1. This contribution to the intensity of the peaks can be taken into account by the maximum-to-minimum ratio of the main (200) peak, evaluated as follows:
where
IM is the maximum intensity corresponding to the (200) diffraction peak and
Im is the minimum scattered background intensity that occurs at about q = 13.3 nm
−1 between the (1–10) and (200) peaks.
Thus, the Aging Factor (
AF) is defined by the following equation:
which is a quantity proportional to the actual thickness of the sample and to the inverse of
DP(
t). We have considered only natural aging to determine unknown quantities such as
and
, from which the cellulose degradation process depends on. Natural aging happens when the textiles have suffered only thermal, hydrolytic, photochemical, and oxidative degradation processes at stationary room conditions over the centuries.
Our experimental tests indicate that samples in which cellulose has been degraded by natural aging (thermal, hydrolytic, oxidative, and photochemical processes at room temperature and humidity) are characterized by
RMm values larger than 4. Let us note that the maximum-to-minimum ratio of the main (200) peak
RMm can be also indirectly related to the degree of crystallinity of the cellulose through the following relation [
19]:
Although the above relation usually overestimates the degree of crystallinity of cellulose [
20], it indicates that, below a given level of crystallinity, corresponding to
RMm values smaller than 4, causes other than natural aging have probably contributed to the degradation of cellulose. Indeed, the
DP maximum fractional loss and the
DP activation energy values change under the action of enzymes or acid/basic solutions, which strongly accelerated cellulose degradation. Our tests indicate that even an empirical and approximated evaluation of
C, through Equation (6), allows a rapid comparison of cellulose samples [
20] to make a preliminary judgement if the linen fabric has suffered mainly a natural aging process and so to discard samples that could have suffered more aggressive degradation processes.
The intervals reported in columns 4–7 of
Table 1 by means of the “±” symbol are uncertainty intervals related to the repeatability of the WAXS measurement in the same point of the same sample. The interval values reported in columns 7–8 of
Table 1 have been obtained by propagating the corresponding uncertainties. They correspond to a single measurement of 1800 s on a single point of the sample. For homogeneous degradation due to natural aging of the sample along its extension, it is possible to derive
AF values which do not depend on the particular position on the thread within the uncertainty range of the measurements. Indeed, either repeating the measurement on the same point or changing the point of analysis along the thread, the same results are obtained, within the experimental errors. Therefore, if the sample degradation is homogeneous along all its extension, the averaging of many measurements allows for the reduction of the uncertainty intervals obtained relative to a single one. For the representativeness of the WAXS characterization of a single thread for the whole fabric, see the Discussion section. We checked that repeating the WAXS characterization, in the same point of the linen threads after an irradiation of 15 h with the X-ray beam (8 KeV of energy) used in the measurements does not cause a measurable structural degradation within the experimental errors. Moreover, the average of four measurements of 1800 s, which halves the corresponding uncertainties, is already sufficient to reduce the uncertainty interval enough to become comparable with other source of errors, like the uncertainty on the average room temperature.
AF values obtained by a single measurement of 1800 s are reported in the last column of
Table 1, and plotted in
Figure 4. From
Figure 4, the almost linear growth of the parameter
AF as a function of the aging time estimated by
14C/HR dating up to about 25–30 centuries, after which saturation occurs, is evident. This finding can be related to the evolution equation of
CB, reported in
Appendix A [
3,
4], as a function of the aging time
t.
From Equation (1), it follows that CB(t) is proportional both to DP(t), the degree of polymerization at time t, and to DP(t = 0), the degree of polymerization before the degradation of cellulose. Therefore, we can introduce an aging parameter related to AF − AFmin, a quantity that is proportional to 1/DP(t) − 1/DP(t = 0), where AFmin is the minimum value of the aging factor, corresponding to the maximum value of DP, that is DP(t = 0), without any degradation due to natural aging. This value could be obtained by the contemporary linen sample of raw flax, for which we can put the aging time t = 0 on the scale of centuries. Therefore, AF − AFmin is proportional just to CB(t). Moreover, we have introduced a normalized CBnor in Equation (2) to have an a-dimensional quantity to evaluate natural aging of cellulose.
For the same aim, we can introduce a normalized Aging Parameter (
AP) obtained from WAXS measured values, as follows:
where the
AFmin is the minimum value corresponding to contemporary raw flax and
AFmax is the maximum value obtained for very long aging times.
Given the proportionality of
to 1/
DP(
t) − 1/
DP(
t = 0), we can consider
AP as an experimental evaluation of
CBnor obtained by WAXS. Thus, the evolution equation of
CBnor can be used to fit the aging parameter
AP values derived from
AF values determined by the WAXS measurements (see
Figure 4) as a function of the aging time
t. In this way, we can experimentally determine the
DP maximum fractional loss,
, and the
DP activation energy,
, for the natural aging of linen that occurred during very long periods of time at about stationary conditions over a time scale of many centuries. The evaluation of these quantities is a prerequisite to perform an X-ray dating of ancient linen threads. Whenever the fraction of maximum
CB, i.e., the
CBnor values, can be quantitatively derived by
AP, the X-ray aging times obtained can be compared with those obtainable by other dating methods.
5. X-ray Determination of Linen Aging Parameters
The normalized
AP values, obtained by applying Equation (7) to the mean of the measured
AF values, are reported in
Table 2, together with the age of the samples determined by
14C/HR dating. Sample A has been discarded by the analysis because bleaching processes have introduced a nonnatural aging, i.e., an accelerated
DP reduction due to the chemical action of oxygen used for the decolorization of the textile [
2]. This finding is evident also by our WAXS characterization, which gives an
AP value of the bleached thread (sample A) larger than that obtained by the raw flax sample (sample B). Indeed, the oxidative bleaching of the fiber has introduced a number of
CB, causing a certain level of structural degradation of the fabric. For further considerations about the action of acid, basic, enzymatic chemical processes on the structural degrade of cellulose, see the Discussion Section.
For
the reaction rate
of the linen
DP degradation, usually given in h
−1 (denoted in the following as
h−1), is reported to be
[
4]. Natural aging depends on the average room temperature at which cellulose degradation occurs. To evaluate the temperature excursions for longer time periods, we can rely on a detailed analysis of tree rings’ growth [
21]. A 100-year spline filter shows that the global mean temperature oscillations in the last two millennia have been contained in a range of ±0.9 °C. The duration of these warmer or cooler periods of large temperature variations has been at most about two centuries. Moreover, a long-term cooling trend of about 0.6 °C has been manifested in the last two millennia, from the beginning of the Christian Era until the beginning of 1900 [
21]. The average room temperature of the last century is very similar to that of the Roman period about 2000 years ago. The average room temperature in the last century is available today for many countries [
22]. For Egypt, West Bank, and Israel the average temperatures in the last century have been 22.5 °C, 19.4 °C, and 19.5 °C, respectively. Therefore, due to the results reported in weather data banks [
22], these values can be considered the average room temperatures of the last two millennia within small variations, indeed, with a reduction of about 0.6 °C in the last two millennia, divided between twenty centuries, leading to 0.03 °C variations per century. The variations of ±0.9 °C with a maximum duration of about two centuries averaged over a longer period of two millennia, as it was applied a 1000-year spline filter to climate data, are equivalent to a fluctuation of about 0.09 °C per century. Therefore, within an indetermination of about Δ
Tr = 0.1, the temperature of the last century can be considered representative to the last two millennia.
However, local microclimate conditions can cause differences in the average room temperatures of some degrees with respect to average values of the surrounding regions. This happens in the Dead Sea Valley, the deepest depression of the Earth. Two samples—DII (Jericho) and NII (Engedi)—come from this depression. Mean annual temperatures for these localities in a temporal range of some decades are available. For Jericho, we found 21.5 °C [
23]. For Engedi, we found a mean annual temperature of 23.9 °C for the years 1982–2012 [
24], which should imply about 23.5 °C for the average room temperature in the last century due to the increasing average room temperatures of the last few decades. For Fayyum and Masada, we found about 21.0 °C. In the last column of
Table 2, we reported temperatures expressed with an accuracy of 0.5 °C. They can be considered the average values at which the fabrics were aged during the time. Room temperatures in
Table 2 have been given in °C, a unit commonly used for meteorological and climate studies. Conversion in Kelvin allows their use in the theoretical formulae of cellulose degradation.
There are no available data about the relative humidity during the last two millennia for all the localities where the considered linen fabrics aged. Nevertheless, the studied samples come from regions with similar climate, semidesert, with an average relative humidity ranging between 50 and 60%. Averaging over many centuries leads to very similar relative humidity values.
values between
and
have been measured for cotton and linen at 90 °C and 50% of relative humidity [
4]. An increment of 10% of the relative humidity, from 50% to 60%, causes an increment of about 10% of the cellulose
[
25]. Therefore, we can put
both for cotton and linen at a relative humidity ranging between 50% and 60%, with an error on the
value related to an error of about 5% on an average relative humidity value of about
.
From Equations (A5) and (A6) reported in
Appendix A, since
AP values can be considered an experimental evaluation of
CBnor obtained by WAXS, a relation between the aging time
t and the other quantities involved in the natural degradation process of the cellulose can be obtained:
Through Equation (8), an evaluation of the natural aging time of fabrics’ threads can be calculated directly from the measured AP values and the estimated average room temperatures , given the measured at and estimated the values of and .
To estimate
and
, we use the experimental data of sample FII, aged at an average room temperature of about 21.0 °C (see
Table 2). Its dating has been derived by HR (siege of Masada). The
AP values, reported in
Table 2, have been determined by the WAXS
AF values shown in
Figure 4. Let us note the linear dependence of
AF and, thus, of
AP, if
t ranges from 10 to about 20 centuries. Indeed, if we consider also the sample just before of FII, sample D, in particular, if we consider the aging time’s region corresponding to the two samples D and FII, we note a linear growth of the
AF values (see
Figure 4). Since
AP values are proportional to
AF values and
AP values can be considered an experimental evaluation of
CBnor, the linear growth of
AF values in the aging time’s region of the D and FII samples will be related to the slope of
at half of its maximum value. In
Appendix A, we have derived a relation which relates the
DP activation energy
to this slope (Equation (A10)):
From samples D and FII, we can estimate this slope:
From Equations (9) and (10), we obtain an estimated
DP activation energy
of
kJ/mole, a value that falls in the range of activation energies measured for the degradation of cellulosic materials [
25,
26]. We can determine also
by imposing that Equation (8) leads to 19.55 ± 0.1 centuries as the aging time for the sample FII, of which the dating has been obtained by HR. Our approach has allowed, for the first time to our knowledge, the determination of the factors which affect the natural aging of linen cellulose at room conditions of temperature and humidity, a process which happens very slowly, requiring period of times of many centuries or thousands of years.
6. X-ray Dating
In the previous section, in order to obtain an estimate of the values of and , we have used the HR dating of sample FII together with the evaluation of the slope of at half of its maximum value, obtained by using the 14C dating of sample D. 14C dating values of the other samples DII, NII, E, and HII have not been used. Therefore, they are useful for a reliability check of X-ray dating obtained by Equation (8), based on the WAXS experimental evaluation of CBnor given by AP. Sample LII is not useful for the check of reliability of X-ray dating because it is too ancient and has reached the maximum AP value. In addition, the contemporary sample B is not useful for the check of reliability of X-ray dating because it has not suffered any aging degradation process. In fact, because DP degradation has an asymptotic behavior as a function of t, we can associate a finite aging time value only up to a maximum AP value of 0.99 because, for AP→1, Equation (8) is indeterminate. For this reason, for sample LII, we cannot obtain any X-ray dating, and for AP values very close to 1, the uncertainty interval of the determined aging time is expected to be very large.
The results obtained by Equation (8) and by the measured
AP values for
,
, and
=
kJ/mole have been summarized in
Table 3. The time intervals reported in the last column of
Table 3 should correspond to a 95% level of confidence. The larger 95% right confidence levels of samples NII and HII with respect to the left-hand values are due to the saturation of the
CBnor curve towards 1 for large aging times. Indeed, these two samples are both characterized by very large
AP values of about 0.98, and the width of their +2σ uncertainty interval (right-hand value) is about 70% larger than the −2σ interval (left-hand value). Further statistical insight about this point will be discussed in
Appendix B.
The comparison with the dating of the fabrics obtained by
14C confirms that the X-ray dating reported in
Table 3 could be a valid and reliable new method to estimate the time when ancient fabrics, which have suffered natural aging, were made because any information about the dating of samples DII, NII, E, and HII has not been used to perform the corresponding X-ray dating. In fact, the obtained X-ray dating can be considered conditioned almost totally by the HR dating of sample FII and almost completely independent by the
14C dating of the other samples. Indeed, the estimate of the slope of the
curve, i.e., of the fraction of maximum
CB, at half of its maximum is partially dependent only on the
14C dating of sample D. In the third column of
Table 3, for X-ray aging times, we show in parentheses the [−2σ,2σ] interval which, for older samples, is not symmetric with respect to the median value due to saturation effects in the decreasing degree of polymerization of cellulose, which seems to stop after several thousands of years. For details about the
14C date ranges reported in the third column of
Table 1, one can refers to previous works [
13,
15]. To facilitate the comparison with the X-ray dating results, the
14C dating values reported in the second column of
Table 3 have been obtained by expressing the data ranges of the third column of
Table 1 as a median value with a [−2σ,2σ] interval. However, it should be noted that, due to the non-monotonic nature of the
14C calibration curve,
14C dating very often leads to the impossibility to summarize the data range interval as a median value with symmetric left and right 95% confidence level limits, since the calculated age distribution can be also bi- or trimodal. Therefore, the
14C aging time median values reported in
Table 3 have to be considered only as equivalent values to allow a direct comparison with the X-ray corresponding dating values.
Figure 5 summarizes the results reported in
Table 3 and shows the effect of the average room temperature on the increment of
CB in the natural aging of linen threads. In
Appendix B, the relationships between
14C and X-ray dating have been further analysed by a suitable statistical analysis of data.
7. Discussion
Our analysis has shown that ancient linen threads that have suffered natural aging due to the oxidative, photochemical, and hydrolytic actions at room temperature and humidity over very long period of times of many centuries can be dated by WAXS characterization of the structural degradation of the cellulose fibers. The X-ray dating results are in agreement with the 14C dating. Additionally, the measurements are not destructive. These findings allow comparison of different dating methods on the same piece of textile, if needed.
The method does not need any sample preparation, requires just a few hours of measurements, and costs a few hundreds of euros to realize the whole X-ray characterization and data analysis of a single sample. Exploiting table-top X-ray micro-sources, dating of a textile sample can be performed also on a submillimeter area, e.g., 0.2 × 0.5 mm
2. However, this possibility is based on the assumption that the ancient textile fabric is homogeneous in its physical/chemical/structural characteristics, i.e., the analyzed small thread is representative of the full textile. This important assumption is critical for other dating methods too. For example, in some cases,
14C dating of textile fabrics suffers from the impossibility to eliminate all textile carbon contaminants through the standard procedure of sample cleaning, thus leading to possible wrong dating [
16]. Therefore, the possibility to perform dating of a textile by using complementary sources of information could be very useful to solve eventual doubtful cases.
Our WAXS measurements indicate that even an approximated but rapid evaluation of the degree of crystallinity of the analyzed sample can allow the selection of ancient threads that most probably have suffered only natural aging over the centuries. These threads are characterized by a higher crystallinity than through other causes of aging (enzymatic and acid/alkaline agents) which accelerate the degradation of the textile with respect to natural aging at room temperature and humidity.
The proposed approach applied to linen threads can be generalized to any textile fabrics. The analyzed threads should be made by the same kind of natural fibers. Indeed, fabrics and paper made by other textile fibers (cotton, hemp, jute, kozo, etc.) could be characterized by DP parameters and activation energy values that can be different from linen. Therefore, if one considers a textile different from linen to predict its age by means of the theoretical formula given by Equation (8) and a WAXS characterization of its threads, the following quantities have to be either experimentally determined or known: ; ; and . However, cotton and linen seem to be characterized by very similar reaction rates, measured with accelerated aging in oven experiments. Therefore, when applying the new dating method to ancient cotton threads, only the DP fractional loss and the DP activation energy for natural aging processes, which last many centuries, need to be determined. Finally, to determine unknown experimental quantities which affect cellulose degradation, such as the DP activation energy involved in natural aging of the textile, another ancient sample of the same textile of which dating is known from other reliable sources (e.g., 14C/HR dating) should be available.
In summary, our results have shown that the independent X-ray dating of four ancient linen threads is in agreement with the corresponding
14C dating. This result shows that
14C and X-ray methods, if necessary, could be used together to increase the reliability of dating measurements in order to determine the possible presence of either inhomogeneity or impurity in the sample, which could affect the dating resulting by a specific method. The agreement obtained among
14C and X-ray dating has been also quantitatively analysed by a novel statistical analysis of the data (see
Appendix B), showing that the two methods of estimating the aging time are compatible within the experimental uncertainties for the linen samples analyzed here.
8. Conclusions
We propose a novel method for X-ray dating of textiles in which cellulose degradation is due to natural aging, i.e., to thermal, oxidative, hydrolytic, and photochemical processes at room temperature and humidity conditions. In particular, with this approach, we have experimentally determined by means of a WAXS characterization of some threads the DP maximum fractional loss and the DP activation energy for the natural aging of linen. Natural aging is a degradation process of cellulose, which very slowly reduces the degree of polymerization, DP, requiring many centuries or thousands of years to reach saturation.
The method is not destructive, giving the possibility to analyze the same sample with other experimental techniques. The preliminary results discussed in the paper show that the proposed X-ray approach could be considered to yield novel, independent, and complementary information available to integrate and compare with already existing dating methods on ancient textile fabrics. Further studies will help to clarify the potentiality of the new X-ray dating method proposed here. In particular, the effects of mordant, dyes, and ancient beating procedures of extraction of the textile fibers could, in principle, affect the initial values or the time evolution of the degree of polymerization of cellulose. Specific studies on these topics would allow the clarification of the limits of applicability of this new proposed dating method of ancient textile fabrics.

 ,
, 


