Article

Patterns of the Expanding City: An Algorithmic Interpretation of Otto Wagner’s Work

Department of Civil Engineering, City Science Research Lab, University of Debrecen, 4028 Debrecen, Hungary
Heritage 2021, 4(3), 1062-1079; https://doi.org/10.3390/heritage4030059
Submission received: 20 May 2021 / Revised: 14 June 2021 / Accepted: 21 June 2021 / Published: 26 June 2021
(This article belongs to the Special Issue Heritage Patterns—Representative Models)

Abstract

:
Central Europe witnessed an urban boom at the beginning of the 20th century. By that time, the leading state of the area was Austria-Hungary, with Vienna as its capital. Before the First World War, even larger expansion of the cities was predictable. Otto Wagner, a leading architect of the empire and an expert in urban planning and architectural theory, published his vision about the future of the evolution of cities in 1911. In this book, he formulates clear rules about how a city should sustainably expand in a controlled manner. In this article, these rules of the inherited patterns are systematised and turned into recursive algorithms to simulate the urban growth controlled by them and the resulting patterns. The algorithms are tested on 1911 Vienna and, as comparison, on 2021 Miskolc, a medium-sized city in Hungary with different geographic surroundings. In the article, the resulting patterns are presented in 2D and 3D.

1. Introduction: Otto Wagner’s Urban Planning Perspectives

Viennese architect Otto Wagner (1841–1918) published his study about the perspectives in urban planning in 1911 (Die Groszstadt. Eine Studie über diese von Otto Wagner) [1]. As far as I know, a comprehensive English version of it has not been published yet, but a shortened version was published in 1912 in Architectural Record, with the commentary of A.D.F. Hamlin [2]. By that time, Wagner was one of the most influential architects of the Austro-Hungarian Empire, with experience not only in architecture but education, urban planning, and architectural theory as well. The most recent comprehensive monograph on his life and work was published in 2018 [3]. The majority of his works connects him to the imperial capitol Vienna. He can be referred to as an urban architect: the vast majority of his realised works were built in urban context, and he was interested in the urban architecture not only on the level of buildings. He created several solutions for urban squares (most importantly for the Karlsplatz in Vienna, even without mandate), he was the author of several award-winning regulation plans for Vienna, and with his work related to the Stadtbahn and the Donaukanal, he had invaluable contribution to the modern infrastructure and cityscape of Vienna as well.
As a theorist, he published his ground-breaking work on modern architecture entitled ‘Moderne Architektur’ for the first time in 1896, one year before the birth of Le Corbusier [4]. During his lifetime, this book was published in further three, expanded editions. He discusses principles for urban planning in these bands and in the regulation plans made by him. The aforementioned book ‘Großstadt’ can be seen as a conclusion of these [5] (p. 56). According to his own statement in the foreword, his invitation to a congress at Columbia University served as the first impulse for writing the book. Another aspect was that he was very unsatisfied with the contemporary regulation plans.
The era referred to as the Gründerzeit had witnessed an urban boom in Central Europe. In Austria-Hungary, the years between the Compromise (Ausgleich, 1867) and the First World War (1914) were especially flourishing. This is the era when the modern cities of the country evolved [6]. In many cities, the number of inhabitants had been multiplied during these years. Based on that, the main starting point of Wagner’s book was the assumption that large cities double in size in thirty to fifty years. This means that “their governing bodies are forced to take care that houses, public buildings, main streets, sanitary arrangements, etc., shall be properly located in advance; otherwise, instead of the hoped-for ideal a chaos would result which could be restored to order only at enormous expense” [2] (p. 492). He separates the regulation of the existing neighbourhoods from the new ones and emphasises the need of foresight and advance planning to be able to deal with the problem of the rapid expansion of cities.

The Roots of Otto Wagner’s Principles and Their Contemporary Context

Wagner’s principles are deeply rooted in the urban development of Vienna. He already in 1892/93 used the existing, gradually evolving system of radial and circular streets as a starting point in his first, award-winning regulation plan for Vienna. In Vienna, the ring of the loosely connected individual outskirts (Vosstädte) outside of the Glacis existed already in the 18th century. (Figure 1) Their street grids were adapted with pragmatic irregularities to the respective local situation and the necessarily deviating angles of the radial streets [5] (p. 56).
Another Viennese feature to mention is the architecture of the Ringstraße. This representative boulevard was constructed on the empty area of the glacis, to connect the medieval city core with the aforementioned outskirts. According to Nikolaus Pevsner, this magnificent ensemble of monumental public buildings can be seen as a representative sign of the crisis of urban planning. It does not provide an answer to the sudden growth of the city, and the architects of that time “should have concentrated on the adequate housing of the vast new working-class populations of these cities and on the planning of adequate routes of traffic for the worker to get to his job and back every day” [8] (pp. 211–212).
Wagner was aware of these problems. He discusses already in 1898 the importance of traffic, economic, and sanitation demands [9] (p. 31). His expanding grid resembles Ildefons Cerdà’s plan, which is an unvarying grid, realised in Barcelona [10] (p. 152). The main similarity is that the main element in both plans is the urban block and thus the enclosed streets. However, the similarities stop here. Cerdà’s grid does not reflect the existing city core at all, and his randomly positioned diagonal streets are not present in Wagner’s system. These diagonal streets are present in Daniel Hudson Burnham’s plan for Chicago too (1909), another work, which is sometimes cited as a parallel to Wagner’s work [5] (p. 58).
Wagner refused the use of the continuous green belt too because it would be an obstacle for the unlimited growth. Instead of that, he proposed large green centres for each district. The inspiration for this idea can be the Mall in Washington D.C. [5] (p. 56).
Discussing contemporary ideas, the most important theorist to mention is Camillo Sitte. He was also Viennese, and he was born only two years after Wagner. They are usually discussed in the literature as antipodes: Sitte would be the “romantic archaist” while Wagner the “rational functionalist” [11] (p. 27) [12] (pp. 95–101). It is true that Wagner argues in his writings with the ideas of Sitte (without naming him), but, as it will be discussed in this article, their principles are not so distant from each other.

2. Materials and Methods

2.1. Generative Simulation: The Algorithms

The aim of this article is to create a generative simulation using the rules discussed in the 1911 book. The artistic or architectural evaluation of the principles does not belong to the main goals, only their technical validation: whether an infinitely expanding city can evolve using these principles or not. I would like to emphasise that this is a theoretical question, a kind of thought experiment, but it can have its lessons in the aspects of the evolution of cities, parametric urban planning, and urban morphology “to understand the diversity of forms in terms of the underlying generative principles” [12] (p. 16). It is a procedural approach: through the establishment of generative processes, with the use of algorithmic 3D software, it is possible to generate the expanding city with the definition and variation of constants, parameters, and variables. The software of choice for this purpose is Rhinoceros 3D with Grasshopper. The geometry here is actually a data flow, using complex data trees. (Figure 2) Quoting Luca D’Acci, “quantification and mathematical modelling are means enabling us to discover partially predictable macro paths of our behaviours otherwise unreadable” [13] (p. 1).
Wagner’s 110-years-old rules are especially suitable for generative modelling. His system is very similar to the hierarchical approach of urban morphology, where the base unit, the lowermost hierarchical level, is the single apartment as a cell [12] (p. 27) [11] (p. 28). In his book, he defined the district and the urban block as units of aggregation [6] (p. 190). Discussing cells, Hillier and Hanson describe two pathways of growth: subdivision and accumulation [14] (p. 19). In Wagner’s book the growth of the districts is accumulation, while the evolution of the blocks inside of the districts can be seen as subdivision.
The accumulation of the districts as cells, based on the properties of their already existing neighbours is similar to the cellular automata. This model of self-reproducing automata was invented by John von Neumann (born in 1903 in Austria-Hungary) in the 1940s and today is used for modelling urban growth and transformation (among other fields) [15].

2.2. The Rules Provided by Wagner’s Text and Related Drawings

As it was mentioned, Wagner discusses separately the existing parts of the city from the new districts to be established. In the case of the existing parts, the maintaining of the already existing beauty is the most important, and special consideration of each individual case is needed. “But it is the new and undeveloped quarters that can and must be systematized” [2] (p. 492).
The basis of this systematisation is the system of the districts (In German, Bezirk; in the 1912 translation, ward). “The situation and boundaries of the wards or boroughs form the foundation of the systematized regulation of the great city” [2] (p. 492). In his system, new radial roads connect to the existing roads on the edge of the existing city. These radial roads are connected to more or less circular zone roads (Zonenstrasse). The districts are determined by the radial roads and zone roads. The distance of the zone roads is 2–3 km, and the size of one district is 500–1000 ha. The districts are separate units, with own centre, facilities, public buildings, etc., and with 100,000–150,000 inhabitants. “The separate wards or boroughs will be developed at exact intervals fixed in advance according to a well laid plan, and thus form a group of small cities around a center” [2] (p. 493). The primary roads (radial roads, zone roads) have a width of 80–100 m.
There is no green belt present, but every district has plenty of green areas. The more or less concentric rings of districts surround the centre of the city. According to the conditions, these circles can be closed or open. The distance from the city centre is a key factor: some functions have to be closer (e.g., state and national parliaments, great art collections), some farther to it (e.g., cemeteries, depots, barracks, fields for sports of all sorts).
On the district level, each district has a large open centre (Luftzentrum, air centre) with a main square, greenery, and public buildings. Residential buildings reside on city blocks divided into four to six lots, and each block has to front a garden, square, or park. The streets inside of the districts are at least 23 m wide, and this is the maximum height of the residential houses as well.
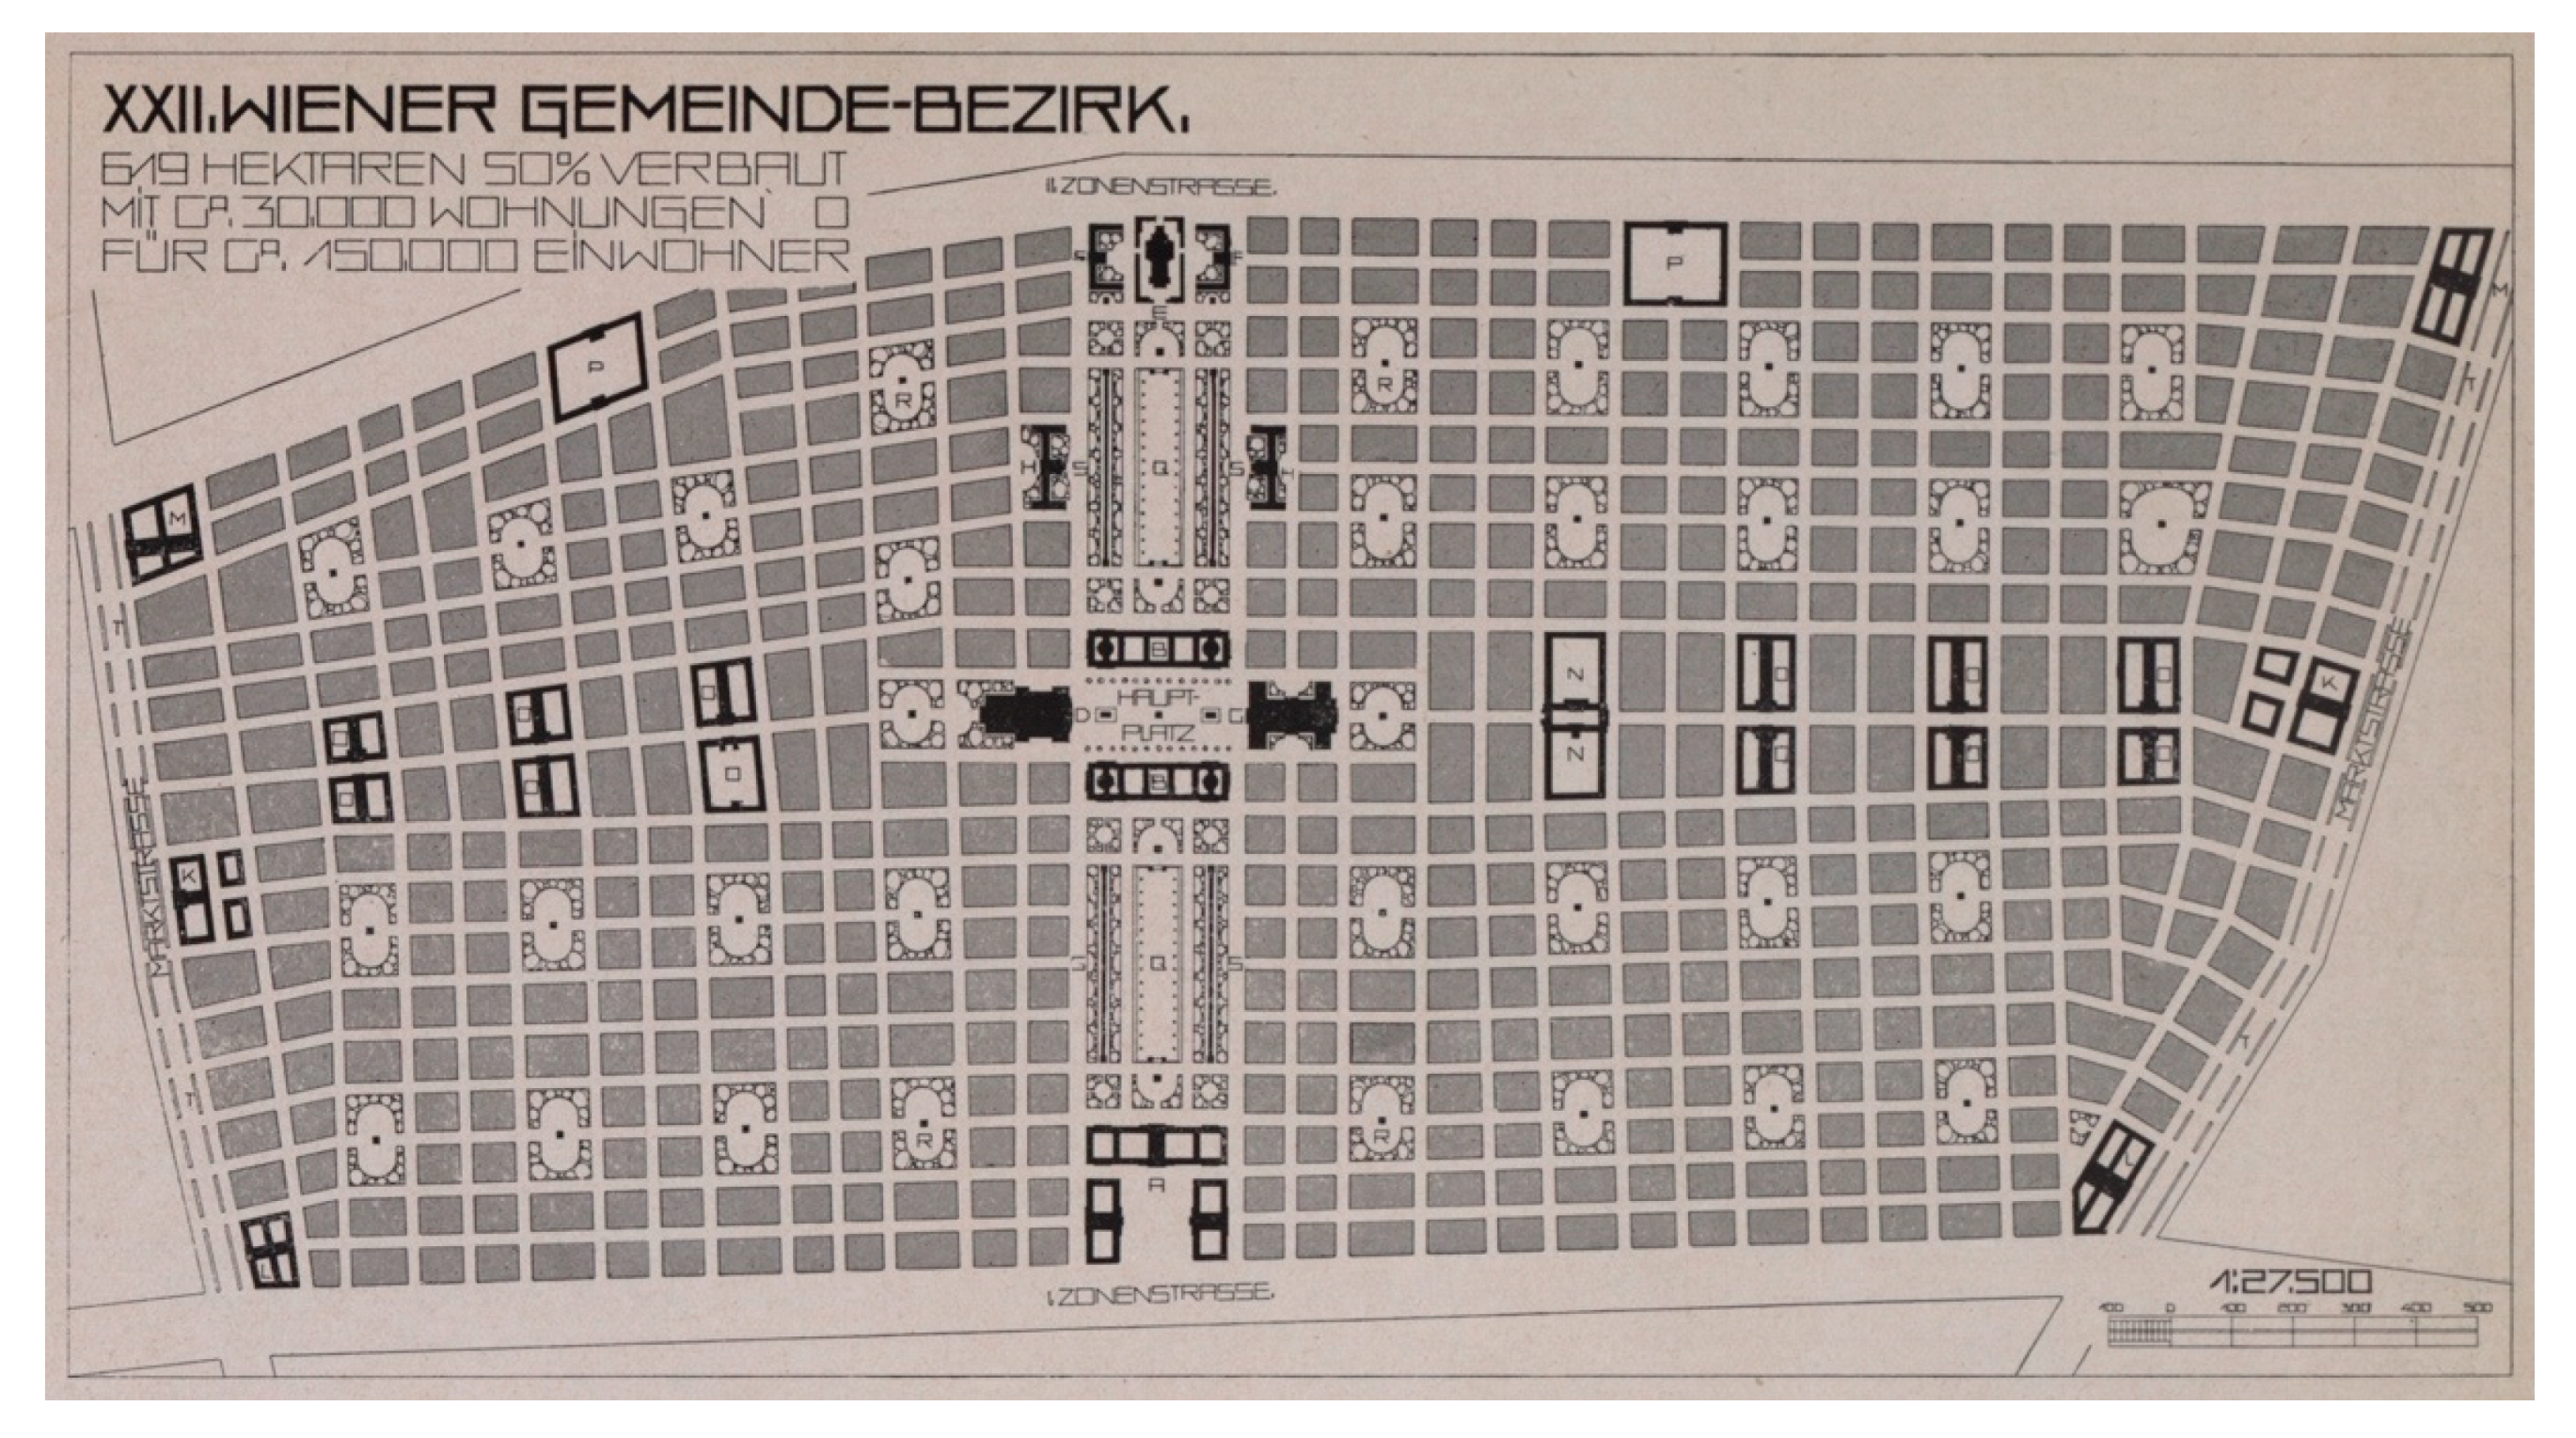
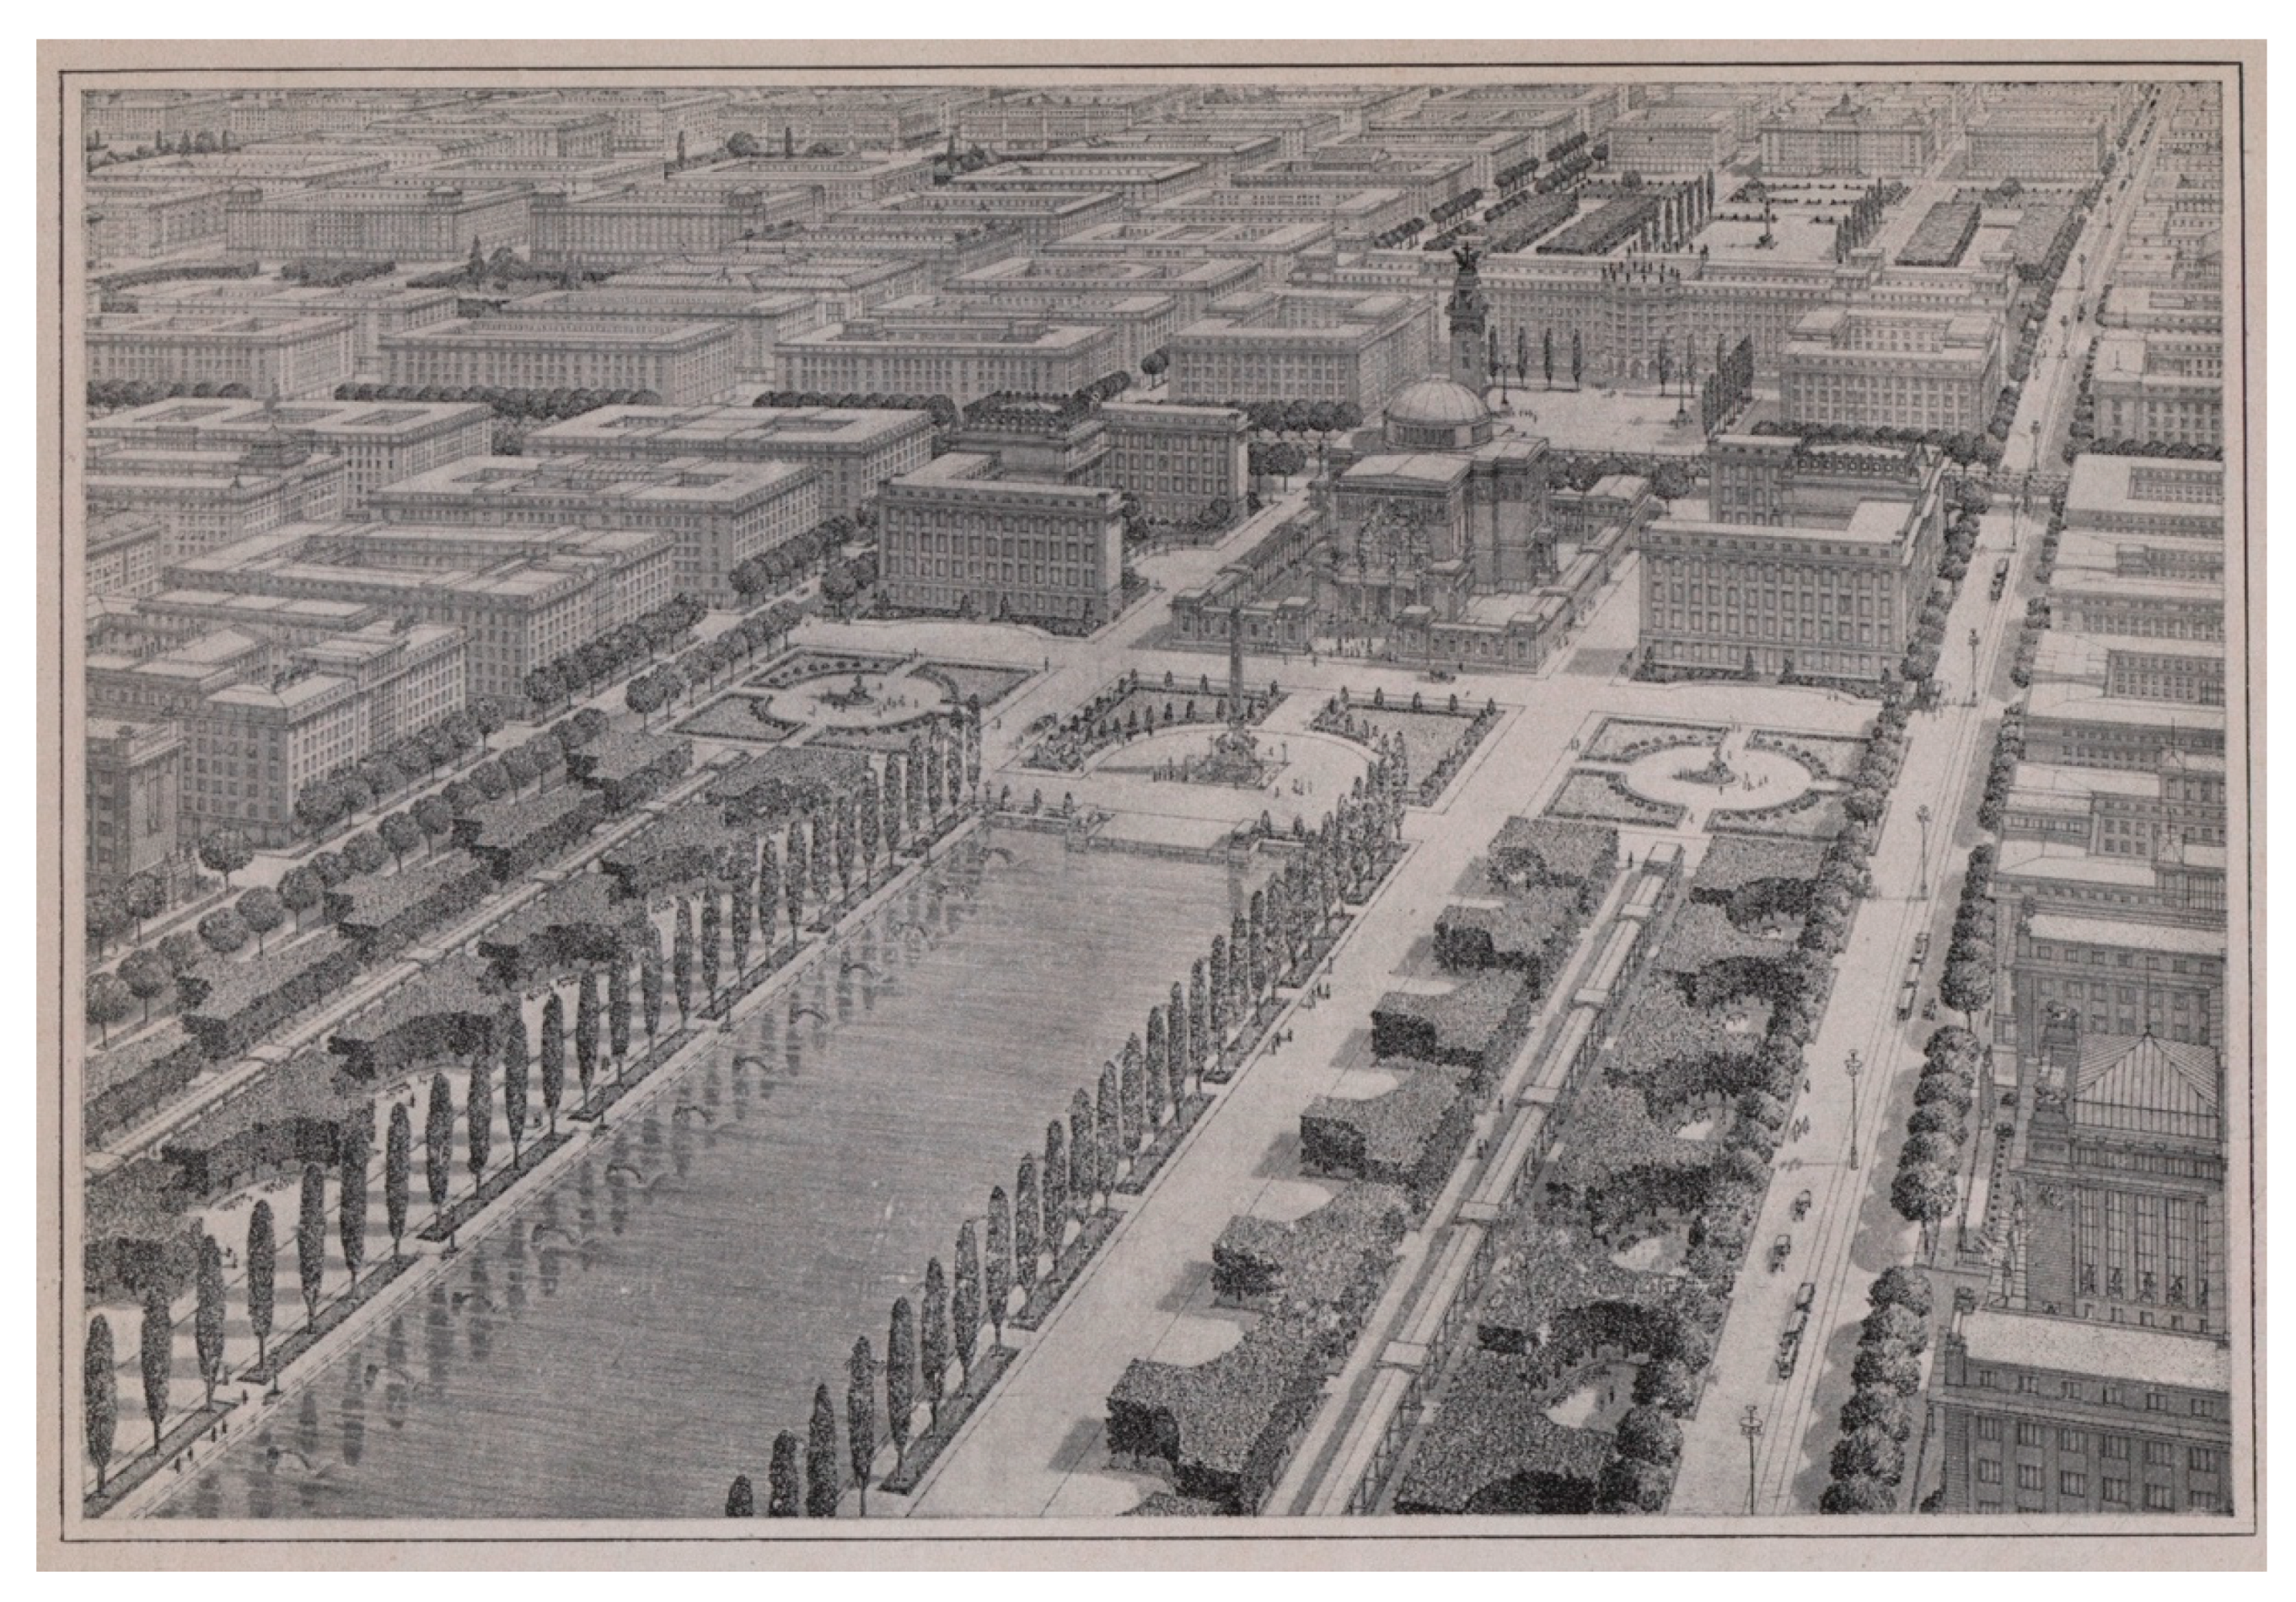
Wagner provides three drawings to illustrate the general principles discussed above: a proposed zone map of Vienna at the scale of 1:100,000, displaying the primary (zone and radial) roads, to a radius of 14 km (Figure 3); a map of the proposed District XXII at the scale of 1:27,500 (Figure 4); and an artistic perspective visualisation of the centre of that district (Figure 5).
In the first drawing (Figure 3), it can be observed how the new districts connect to the existing streets of Vienna and how the terrain affects the order. The most important constraints are the Danube north-east from the centre and the Wienerwald mountains to the west. Two major roads flank the Danube on the two sides, and there is a bridge on each zone road. The concentric system of the districts on the flat area on the other side of the Danube can evolve almost without any disturbance. Since the rings are greater according to their distance from the centre, some radial roads branch to avoid the emergence of too large districts. However, due to the mountains, the grid becomes irregular on the west side, almost every zone road closes to itself, and thus the system is circular. The mountainous districts are larger, and therefore with the same number of inhabitants (which is a key factor), the population density, and thus the building density, in them must be lower.
In the drawing of the proposed District XXII (Figure 4), the layout of the blocks, public buildings, and parks can be observed. The drawing is oriented approximately to the south. The district’s position is approximately on the Wienerberg, with the Triester Straße as its axis. Unlike the current Triester Straße, which is an expressway, the main axis here is an open area with the width of 280 m. It serves as the centre of the district with the main public buildings and as its Luftzentrum with the large parks. The four- or six-plot blocks are clearly distinguishable. The smaller parks form a secondary grid, and they have the area of two six-plot blocks. There is a secondary axis, perpendicular to the main one. Around this axis, the blocks are larger (approximately eight plots), and several other public buildings are located here too. In contrast to the text discussing the general rules, not every residential block is facing a park, although at least the corner of each is adjacent to one. The only exceptions are on the edge of the district, where the non-parallel radial roads distort the system.
The artistic representation (Figure 5) displays the connection of the proposed District XXII to the proposed District XXXV from a bird’s eye view. The view direction is to the south. It displays the Luftzentrum with an architectonic garden including a major pool, a church, public buildings, and the zone road II behind the church. Behind it, the main axis of District XXXV can be seen with its public buildings and all around the blocks of the residential buildings. These buildings shape perimeter blocks, surrounding a common courtyard (this arrangement is not displayed on the less detailed district plan (Figure 4), where the blocks are represented only by solid rectangles).

2.3. Wagner’s Rules as a Base of Algorithmic Modelling

Wagner’s text and drawings provide clear rules for algorithmic modelling. The input data for the algorithm are the following:
  • The exit points of the main streets on the perimeter of the existing city.
  • The elements of the terrain that distort the system of the districts: rivers, mountains, etc.
The generative algorithm consists of two main parts (Figure 6 and Figure 7). The first one generates the boundaries of the new districts (and thus the radial and zonal roads, similarly as it can be seen in Figure 3), and the second one populates the districts, based on Wagner’s two drawings about District XXII, seen in Figure 4 and Figure 5.
The main steps for generating an (either open or closed, based on the circumstances) ring of districts are the following:
  • An (either open or closed) curve is generated using the aforementioned exit points;
  • The curve is offset to the outside by 2 km (this amount can be measured on Wagner’s drawing);
  • Trapezoids are created using the relevant corner points of the two curves;
  • The trapezoids are offset to the inside by 50 m to create the segments of the radial and zone roads.
For the generation of the next ring, input points are needed again. It is not possible to simply use the corners of the curve generated in the first step above because as the city expands, the edges of these polylines grow gradually, and, according to Wagner’s rules, the area of each district has to be limited to 500–1000 ha. To avoid the too large district area, if the external edge of a district-trapezoid grows above 4700 m, an extra point is added as a starting point of a new radial road on the next ring. To incorporate some controlled irregularity to the system, the position of this point is randomly generated: it is either in the middle point of the relevant segment or in either trisect point. This point is then slightly moved in the direction away from the centre to avoid the too long straight segments of the zone roads.
The other extreme value has to be treated as well: the districts cannot be too small. Based on the initial situation, it is possible that some of the corners of the offset polyline generated in the first step get closer than the corners of the original one. In the concluding steps, this distance would be gradually smaller, converging to zero and even turning into negative. To avoid this, a subroutine is created. If the summary of any adjacent segment lengths is under 2100 m, the common endpoint of the two segments is deleted from the output, and therefore the relevant radial road ends there. Thus, not every radial street is a straight line with infinite length. As it was discussed above, not only the points serve as input data but elements of the terrain too. These are implemented as closed curves, which distort the system. If the position of a generated point is inside of such a curve, that point is either repositioned to the closest location on the boundary curve or is removed from the inputs to the next level.
Eventually, the ‘unbegrenzte Großstadt’, the expanding city, is a recursive process, where each ring of districts is created by the same algorithm. Only the inputs vary: each level inherits the output of the previous one as input, and this can theoretically be repeated infinite times.
The second main part of the algorithm generates the blocks and buildings inside of the districts. The input here is the trapezoid, which is the boundary of the relevant district. For the creation of the layout, Wagner’s rules and his drawings of the proposed District XXII were used (Figure 4 and Figure 5), with simplifications. The base point is the middle point of the smaller parallel edge (the ‘inside’ segment) of the trapezoid. This point serves as a local origin, the local X axis is parallel to the aforementioned inside segment, and the local Y is perpendicular to it. The base point is then moved by 35 m on the local Y towards the middle of the trapezoid and serves as the base point of the grid defining the base points of the public buildings and residential blocks. Because of this grid system, the position of the blocks and buildings can be flexibly defined. (Figure 8) In the solution shown in Figure 8, the width of the main axis (the Luftcentrum with the main square) is 300 m; then, after the first row of the blocks, the rhythm of the grid along the local X axis is the following, repeating to both directions: 100-118.75-118.75. Using 75 × 75 m dimensions for the four-plot blocks and 75 × 112.5 m for the six-plot blocks, this results in 25 m wide streets (according to Wagner, the minimum width of the streets has to be 23 m). The height of the residential blocks is randomised between 18 and 23 m, the maximum defined by Wagner.
Along the local Y axis, each grid point (block centre) is 100 m away from the other. In the case of the rows with four-plot blocks, every grid point is occupied; in the case of the six-plot blocks, the rhythm is the following: ABBAABBABBBABBAABBA, where A means block and B means void. With this solution, the situation is almost the same as in Wagner’s drawing (Figure 4). Some public buildings are also defined: two of them are flanking the main square; on one side of the main axis, a church is defined, on the other side, another public building; and on the secondary axis, 1–1 building in the third park to both directions.
To summarise, the two-step algorithm at first aggregates the districts as cells then populates them with urban blocks. In the first step, one district can be considered as a cell, in the second, one block. In the first step, the aggregation is infinite, in the second one, its limit is the boundary of the given district.
There are still some limitations and simplifications in the algorithm. Most importantly, the line-like elements, such as smaller rivers, railways, highways are not implemented as constraints. Secondly, the districts differ only by their shape. The given layout of the buildings is only one solution of the possible many, but for this experiment, I wanted to keep the system as simple as possible. (Figure 7 is a hint of its complexity.) In the next step, it would be possible to incorporate variables, define more building types, and use a more differentiated street layout. For example, the streets next to the radial roads could step out of the strict grid and could be parallel to the radial road, as they are in the drawing of Wagner. (Figure 4) An important key parameter to implement—mentioned by Wagner too—is the distance from the centre. Using this parameter, more differentiation in layout and functions could be defined.

3. Results: Proof of the Generative Concept

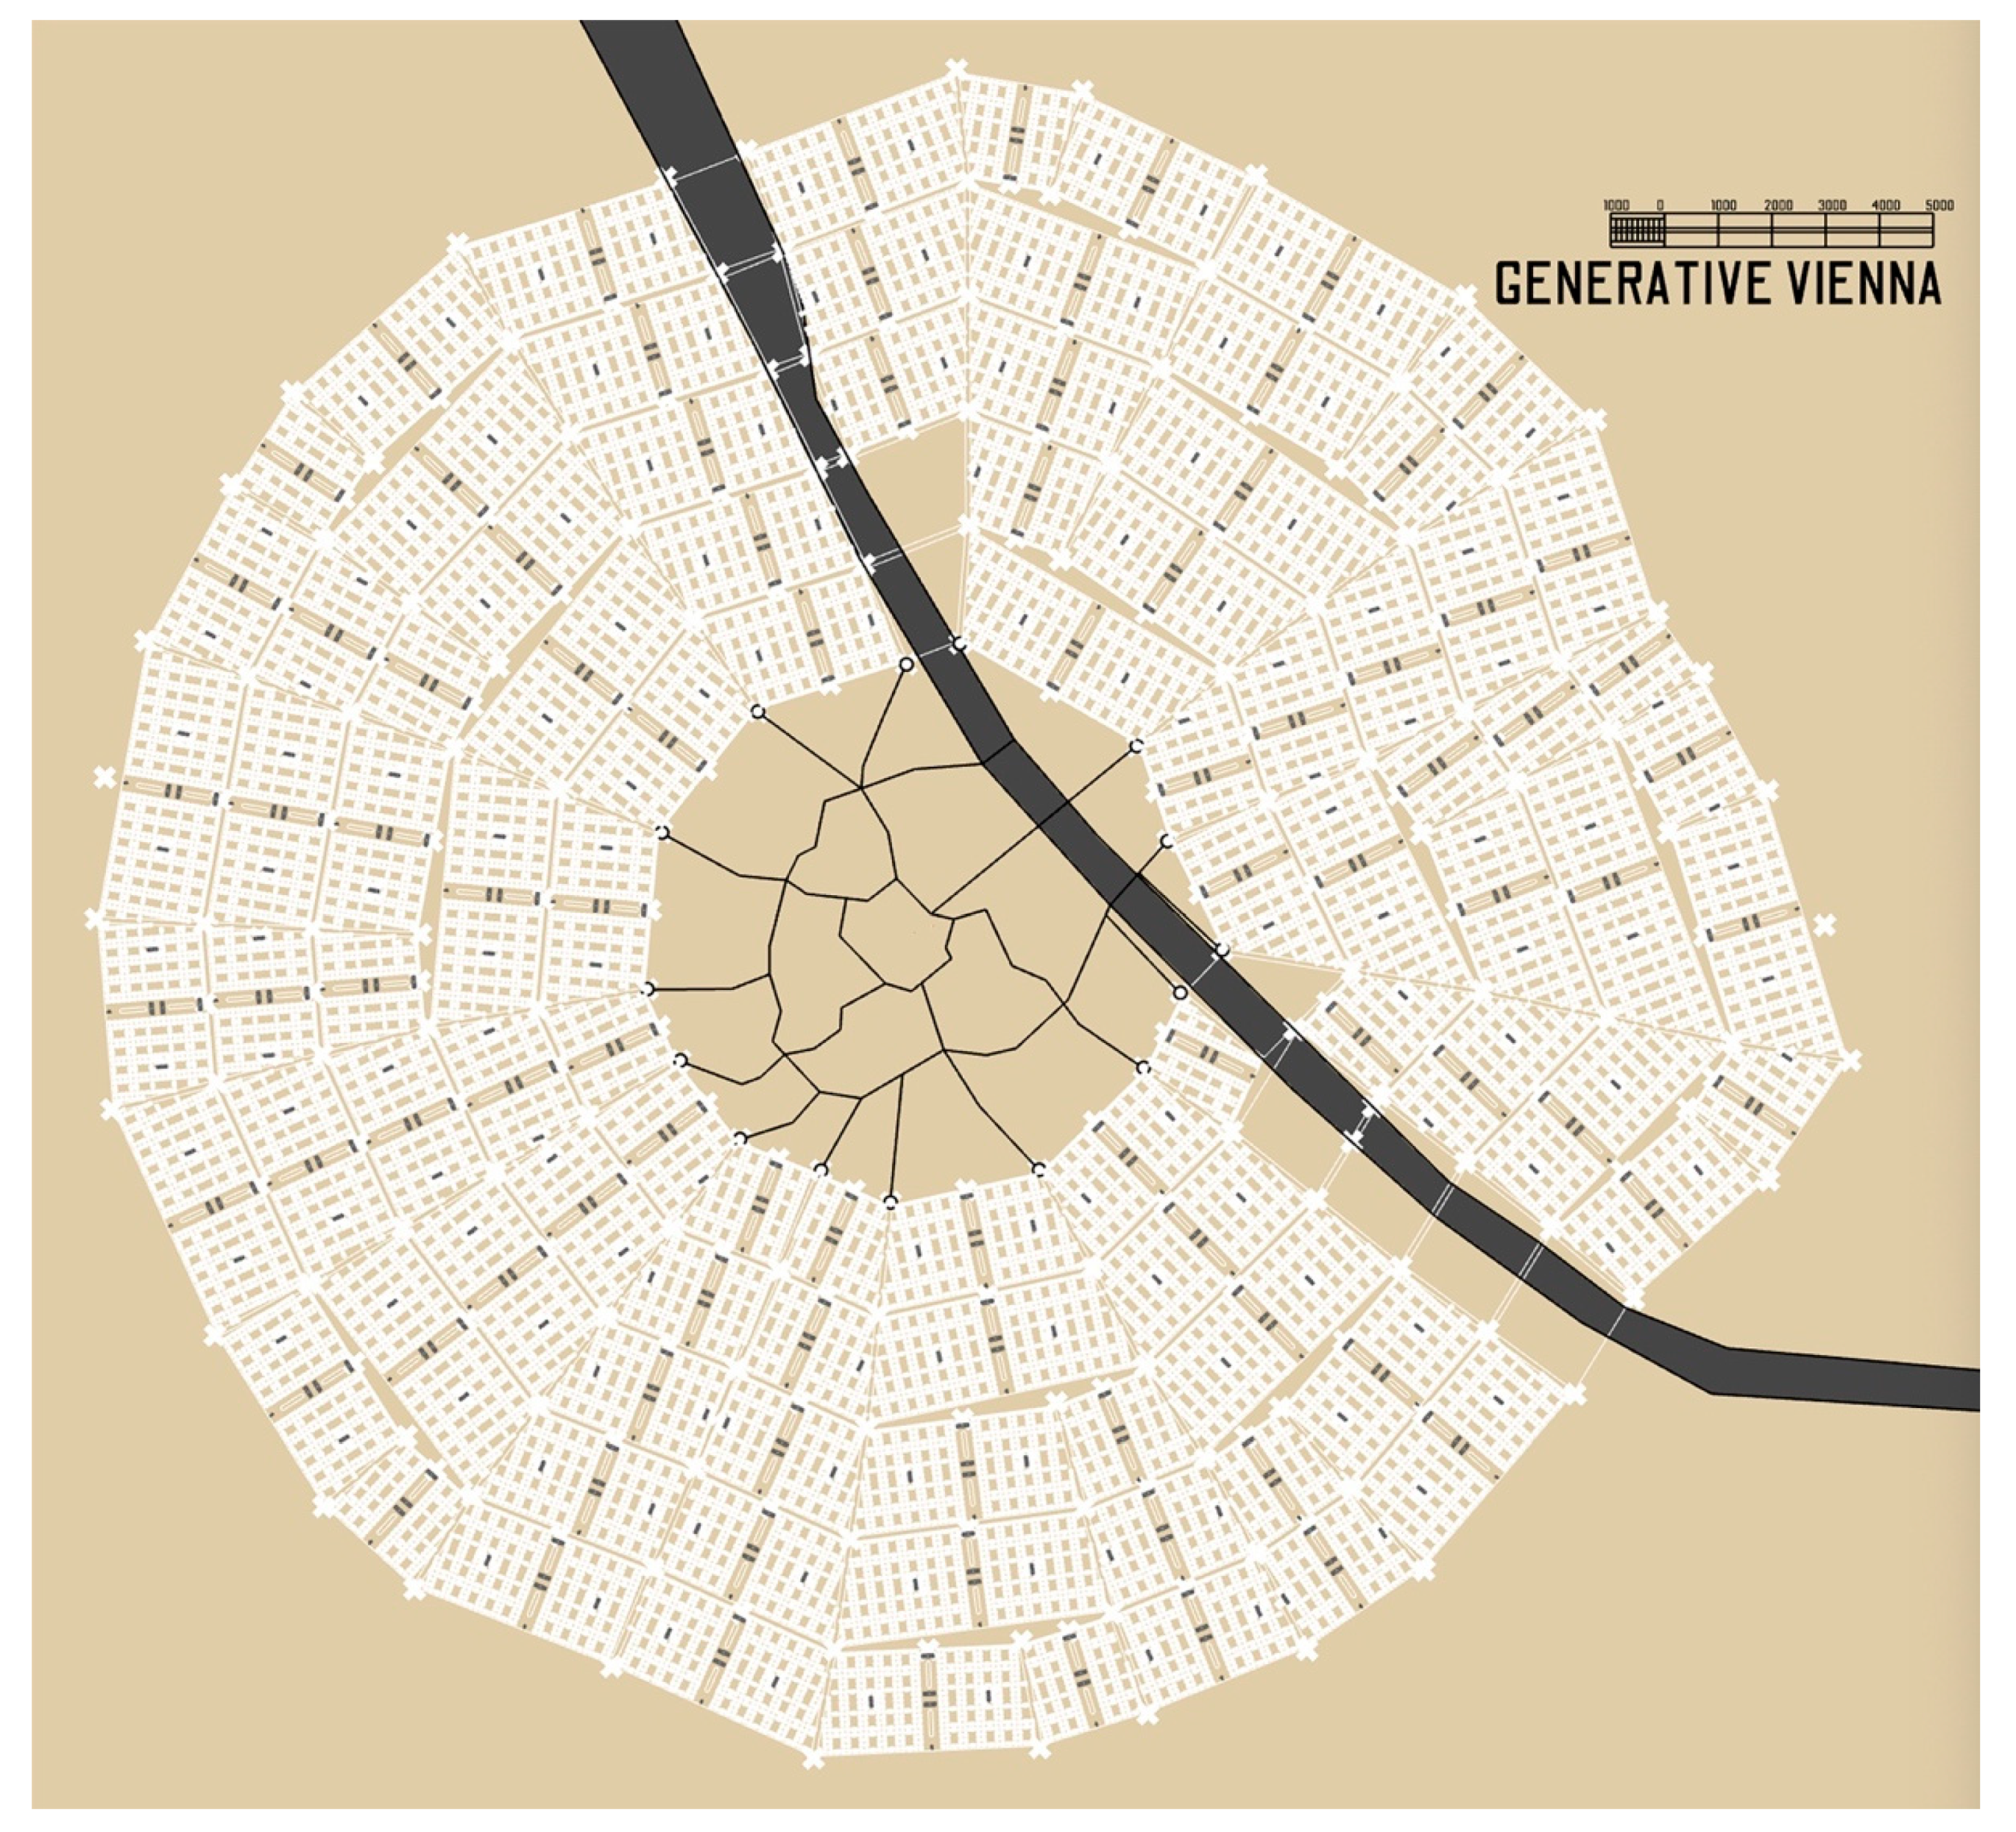
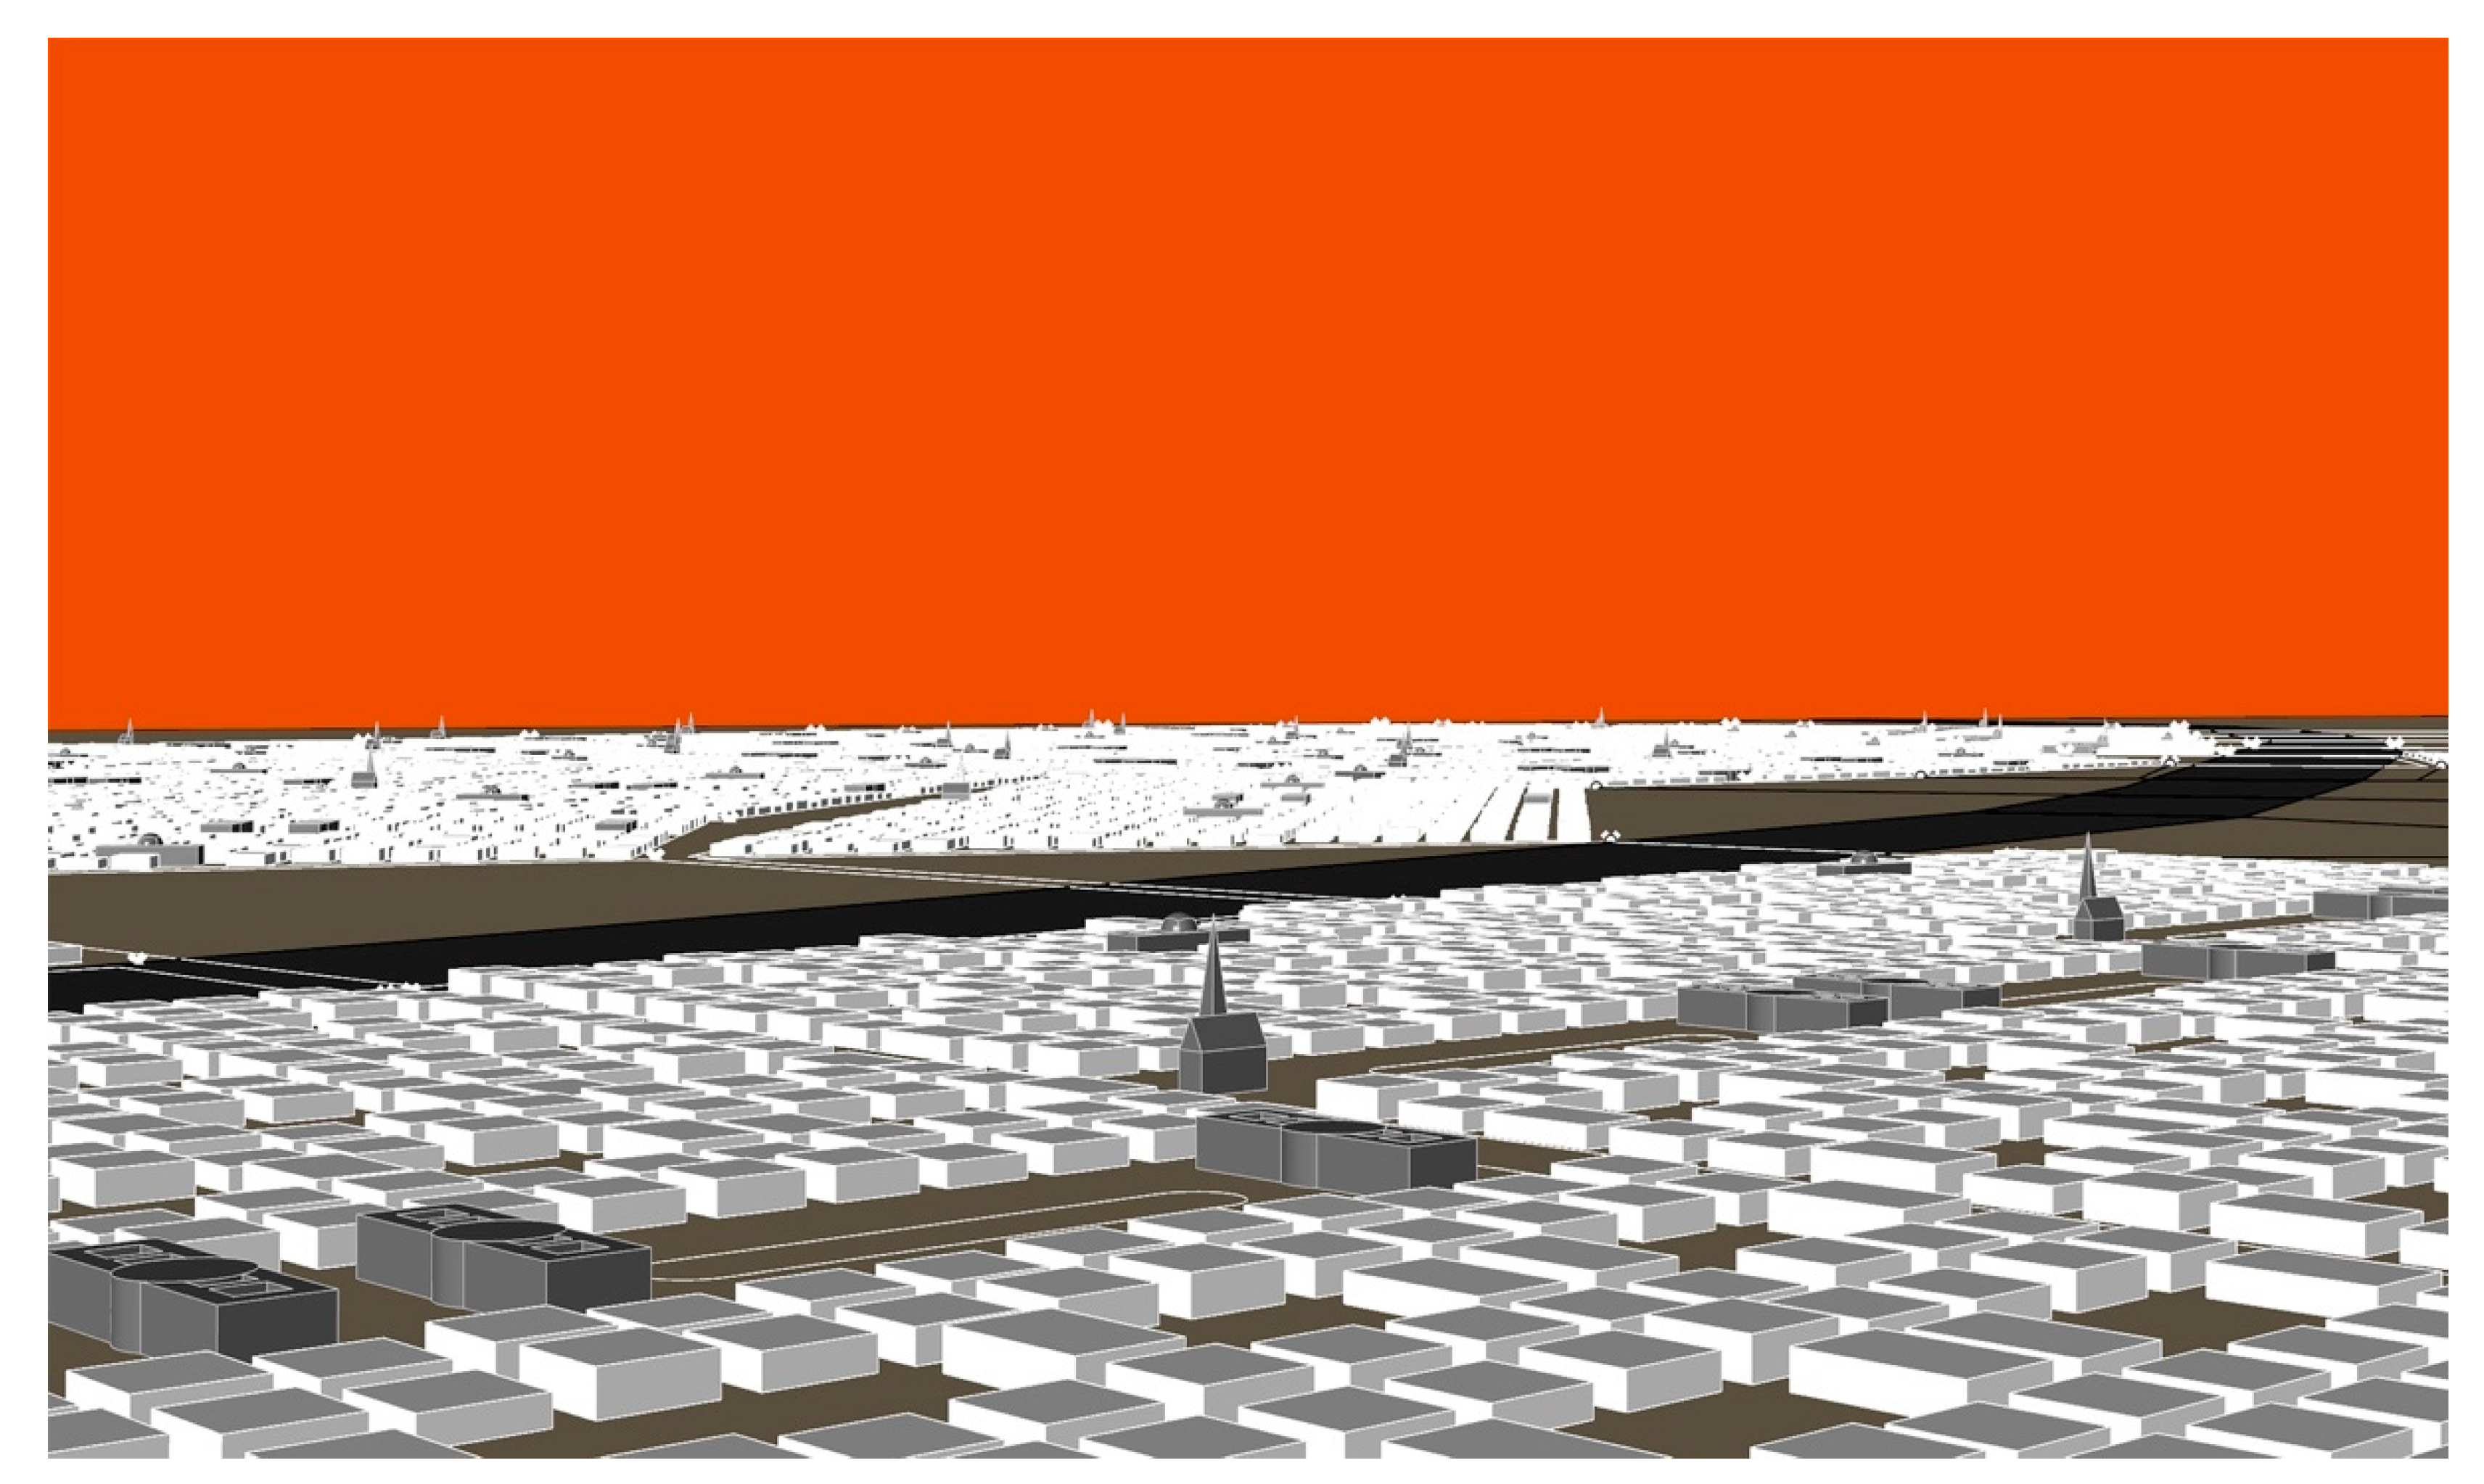
The algorithm was tested on two cities. At first, as an obvious choice, Wagner’s map of Vienna served as a starting point (Figure 3). The aforementioned two inputs—the exit points of the roads and the closed boundary where no points and built-in area can exist, namely the Danube—were defined on that map. (Figure 9) A major simplification is that the terrain of the Wienerwald was not taken into account. The circles of the districts are closed, as they are in Wagner’s drawing. The fully automatised system follows fairly the system proposed by Wagner (except, of course, on the aforementioned area of the Wienerwald). (Figure 10) The grid is distorted by the Danube. New points emerge in the intersections where the axis of a zone road meets the boundary of the Danube, and they obey the same rules discussed before. When a district trapezoid is inside the Danube, the algorithm coding the buildings of that district is blocked. This has an interesting result: in some cases, larger inhabited areas emerge next to the Danube. Of course, with manual post-working this could be omitted, but the goal was to entirely automatise the generative process. In Figure 10, Figure 11, Figure 12 and Figure 13, five rings are present with a total diameter of 32 km, and the process can be continued infinitely.
The second testing ground was the current state of Miskolc, a medium-sized city in Northern Hungary. (Figure 14) Its geographic location is irrelevant: since the rules in Wagner’s work, and thus the generative algorithm based on them, are intended to be universally usable, it could be tested on any other city. The goal was to test the feasibility of the algorithm on a city that differs from 1911 Vienna. Here is no major river, but the mountainous area to the west was defined as a restricted zone, and thus the rings of the districts are open. (Figure 15) The irregular boundary of the mountain zone served as a good testing ground for the algorithm. In contrast to the case of Vienna, a manual preselection of the points was needed between the algorithmic levels. In some cases, some of the output points of the lower level had to be manually disabled before the set of points could be provided to the next level as input due to the irregular boundary and the open ring. (Figure 16) Besides that, the algorithm created by the rules for Vienna worked very well for the very different situation, as it can be seen in Figure 17.
The generative cities could be tested with different quantitative methods to compare them to real cities, but this is out of the scope of this article. Just to mention one aspect, according to Bellomo and Terna, the following features can be referred to all living systems:
  • Ability to chase a purpose or a strategy
  • Heterogeneous expression of the said purpose/strategy
  • Nonlinearly additive interactions evolving due to learning
  • Darwinist selection and time as a key variable
  • Complexity in the interpretation of reality and rare events [16] (pp. 317–318).
For these generative cities, these points are more or less valid. With the implementation of all of the details in Wagner’s work, the resulting cities could be considered as living systems.

4. Discussion: Wagner’s Rules and the Current Trends of Urban Planning

To put Wagner’s rules in context, it is important to emphasise that they are the result of a very different era than ours. In 1911, the Ford Model T was only 3 years old. The industrial, technical, and economical progression seemed to be infinite and therefore the evolution of the cities. Looking back from 2021, Wagner’s foresight to avoid what is now referred to as urban sprawl is striking: he propagated the mixed-use neighbourhoods, the importance of the enclosed spaces, the sustainability, the importance of the public transport and the local centres, the appropriate density opposite to the idea of the garden city, and the careful, long-term strategic planning. His principles are echoing in the contemporary tendencies of urban planning. Karsten Pålsson lists in his book entitled ‘How to Design Humane Cities’ the following general guidelines:
  • High land-use intensity to create sufficient, critical mass as the basis for urban life;
  • High building configuration coverage, attractive common urban space;
  • Limited building height;
  • Spaciousness near housing and access to large parks. Contrast between dense buildings and parks provides an alternative to suburban landscapes;
  • Mixed use.
According to him, the final goal is to create low-rise high-density cities of five-to-six stories [17] (p. 41).
All of these principles are present in Wagner’s book. Discussing the redesign of cities, Pålsson emphasises the importance of the local centres, the developing new dense urban areas, and the densification of modernism’s urban areas. His proposals and advice converge to Wagner’s principles.
On a more local level, it must be emphasised again that Wagner’s principles are rooted deeply in the urban pattern of the contemporary Vienna. He and Camillo Sitte were the two most influential urban planners of the empire, and both of them used Vienna as a kind of lab: they proposed several theoretical plans for parts of the city. At first sight, their principles differ a lot: Sitte is considered ‘artistic’, with the ideal of the picturesque small town, while Wagner ‘rationalist’, with the ideal of the unlimited, geometrically designed metropolis. However, under the surface, their principles are strikingly similar: they both emphasise the importance of the preservation of the existing beauty of the cities, the importance of the carefully planned enclosed spaces, the limited heights, the urban blocks, and the carefully positioned public buildings [5] (p. 59). This similarity between the two Viennese is even more striking when we compare them to the seminal principles of Le Corbusier. He denied the raison d’etre of the urban tissue itself: in his ideal city, there are no streets and urban blocks at all, the old neighbourhoods are to be demolished, and the districts are single-use. “All reference to an urban life, to a traditional neighbourhood life, is abolished: no more ‚corners’, or ‚opposites’, or ‚next doors’” [18] (pp. 114–123).
Although Wagner’s system of the districts was not realised, Vienna is even today a relatively dense city, where the urban sprawl barely exists: there are districts where the urban blocks reach the edge of the city. This pattern is the result of an almost organic growth, echoed in Wagner’s principles and survived until today [19]. The famous social housing programme of Vienna started in the era of the ‘Red Vienna’ (1918–1934) has been using similar urban blocks as Wagner [20]. According to Wolfgang Sonne, an unbroken line is reaching from the Ringstraße-Vienna to the Red Vienna, from the Heinrichhof to the Reumannhof, and the link between them is the Großstadt of Wagner [5] (p. 59). The line is even longer: similar patterns can be recognised in a relatively fresh urban development plan for the neighbourhood Aspern [21].
Vienna is chosen year by year for the title of the most liveable city of the world by Mercer’s international comparative study. Mercer examines the following factors [22]:
  • Political and social environment (political stability, crime, law enforcement, etc.).
  • Economic environment (currency exchange regulations, banking services).
  • Socio-cultural environment (media availability and censorship, limitations on personal freedom).
  • Medical and health considerations (medical supplies and services, infectious diseases, sewage, waste disposal, air pollution).
  • Schools and education (standards and availability of international schools).
  • Public services and transportation (electricity, water, public transportation, traffic congestion, etc.).
  • Recreation (restaurants, theatres, cinemas, sports, and leisure).
  • Consumer goods (availability of food/daily consumption items, cars).
  • Housing (rental housing, household appliances, furniture, maintenance services).
  • Natural environment (climate, record of natural disasters).
Without further exposition, this is how Wagner characterises the urban life: “Profit, social position, comfort, luxury, low death rate, the presence of all the spiritual and physical necessities of life, possibilities both good and evil of recreation, and lastly Art, are all factors” [2] (p. 492). He was aware of the growing importance of public services and transport too: “an efficient system of transportation, a faultless street-cleaning department, living accommodations provided with every comfort and suited to every social grade” [2] (p. 490).
A.D.F. Hamlin’s words from the 1912 Architectural Record are perfect as a closing remark:
“It [Wagner’s ’Großstadt’] emphasizes the fundamental importance of carefully planned thoroughfares and transit facilities, laid out ahead of the need, not long after the need has become acute; for public service rather than for speculative profit; facilities which shall guide urban development into favorable conditions and not follow the haphazard growth of ragged and unrelated fringes of speculative suburbs.
Perhaps fifty years hence Professor Wagner’s propositions will appear less fantastic and chimerical to Americans than they will to some who read them for the first time today” [2] (p. 486).

5. Appendix

It is part of the beauty of generative modelling that during the work sometimes shocking results can emerge, usually due to unintended data tree matching. These are sometimes instructive, sometimes strange, and sometimes simply beautiful. Some of these can be seen in Figure 18.

Funding

This research received no external funding.

Institutional Review Board Statement

Not applicable.

Informed Consent Statement

Not applicable.

Data Availability Statement

Not applicable.

Conflicts of Interest

The author declares no conflict of interest.

References

  1. Wagner, O. Die Groszstadt. Eine Studie Über Diese von Otto Wagner, 1st ed.; Verlag von Anton Schroll u. Komp: Wien, Austria, 1911. [Google Scholar]
  2. Wagner, O. The Development of a Great City. Together with an appreciation of the Author by A. D. F. Hamlin. In The Architectural Record; The Architectural Record Company: New York, NY, USA, 1912; Volume 31, pp. 485–500. [Google Scholar]
  3. Nierhaus, A.; Orosz, E.M. Otto Wagner, 1st ed.; Nierhaus, A., Orosz, E.M., Eds.; Residenz Verlag: Wien, Austria, 2018. [Google Scholar]
  4. Wagner, O. Moderne Architektur: Seinen Schülern ein Führer auf Diesem Kunstgebiete, 1st ed.; Schroll: Wien, Austria, 1896. [Google Scholar]
  5. Sonne, W. Großstadtbaukunst. Otto Wagners Städtebau im internationalen Kontext. In Otto Wagner, 1st ed.; Nierhaus, A., Orosz, E.M., Eds.; Residenz Verlag: Wien, Austria, 2018; pp. 52–59. [Google Scholar]
  6. Lovra, É. Városok az Osztrák-Magyar Monarchiában. Városszövetés Várostipológia 1867–1918, 1st ed.; Terc Kft.: Budapest, Hungary, 2019. [Google Scholar]
  7. Grimm, M.V. GRUND-RISS der K[aiserlich]-K[öniglichen] Haupt- und Residenz-Stadt WIEN: Mit Allen Vorstädten und der Umliegenden Gegend, 1st ed.; T. Mollo et Comp: Wien, Austria, 1798. [Google Scholar]
  8. Pevsner, N. An Outline of European Architecture; John Murray: London, UK, 1948. [Google Scholar]
  9. Lampugnani, V.M. Vienna Fin-de-siècle: Between Artistic City Planning and Unlimited Metropolis. In Sitte, Hegemann and the Metropolis. Modern Civic Art and International Exchanges, 1st ed.; Bohl, C.C., Lejeune, J.-F., Eds.; Routledge: New York, NY, USA, 2009; pp. 25–37. [Google Scholar]
  10. Kostof, S. The City Shaped. Urban Patterns and Meanings through History, 1st ed.; Bulfinch Press: Boston, MA, USA, 1991. [Google Scholar]
  11. Moravánszky, Á. Die Architektur der Donaumonarchie, 1st ed.; Ernst: Berlin, Germany, 1988. [Google Scholar]
  12. Kropf, K. The Handbook of Urban Morphology, 1st ed.; Wiley: Chichester, UK, 2017. [Google Scholar]
  13. D’Acci, L. On Urban Morphology and Mathematics. In The Mathematics of Urban Morphology, 1st ed.; D’Acci, L., Ed.; Springer: Cham, Switzerland, 2019; pp. 1–18. [Google Scholar]
  14. Hillier, B.; Hanson, J. The Social Logic of Space, 1st ed.; Cambridge University Press: Cambridge, UK, 1984. [Google Scholar]
  15. Clarke, K.C. Mathematical Foundations of Cellular Automata and Complexity Theory. In The Mathematics of Urban Morphology, 1st ed.; D’Acci, L., Ed.; Springer: Cham, Switzerland, 2019; pp. 163–170. [Google Scholar]
  16. Bellomo, N.; Terna, P. On the Complex Interaction Between Mathematics and Urban Morphology. In The Mathematics of Urban Morphology, 1st ed.; D’Acci, L., Ed.; Springer: Cham, Switzerland, 2019; pp. 315–333. [Google Scholar]
  17. Pålsson, K. How to Design Humane Cities: Public Spaces and Urbanity, 1st ed.; DOM Publishers: Berlin, Germany, 2019. [Google Scholar]
  18. Panerai, P.; Castex, J.; Depadule, J.C.; Samuels, I. Urban Forms. The Death and Life of the Urban Block, 1st ed.; Routledge: London, UK, 2004. [Google Scholar]
  19. Raith, E. A korszerű városi lakóház. A várostervezés szempontjai = The up-to-date urban dwelling house. The aspects of the urban planning. In Modell Vagy Külön út: Bécs Szociális Építészete = Model or Separate Track: The Social Architecture of Vienna, 1st ed.; Tamáska, M., Kocsis, J.B., Eds.; Martin Opitz: Budapest, Hunguary, 2018; pp. 81–92. [Google Scholar]
  20. Kadi, J. A szociális lakásépítés három korszaka Bécsben = The three periods of the social housing in Vienna. In Modell Vagy Külön út: Bécs Szociális Építészete = Model or Separate Track: The Social Architecture of Vienna, 1st ed.; Tamáska, M., Kocsis, J.B., Eds.; Martin Opitz: Budapest, Hunguary, 2018; pp. 51–61. [Google Scholar]
  21. Fiedler, J.; Hofstatter, K.; Holzer, P.; Knierbein, S.; Lainer, R.; Pilz, T.; Raith, E.; Scheuvens, R. Die Instrumente des Städtebaus, 1st ed.; Wien 3420 Aspern Development AG: Wien, Austria, 2010. [Google Scholar]
  22. Vienna Tops Mercer’s 21st Quality of Living Ranking. 2019. Available online: https://www.mercer.com/newsroom/2019-quality-of-living-survey.html (accessed on 14 June 2021).
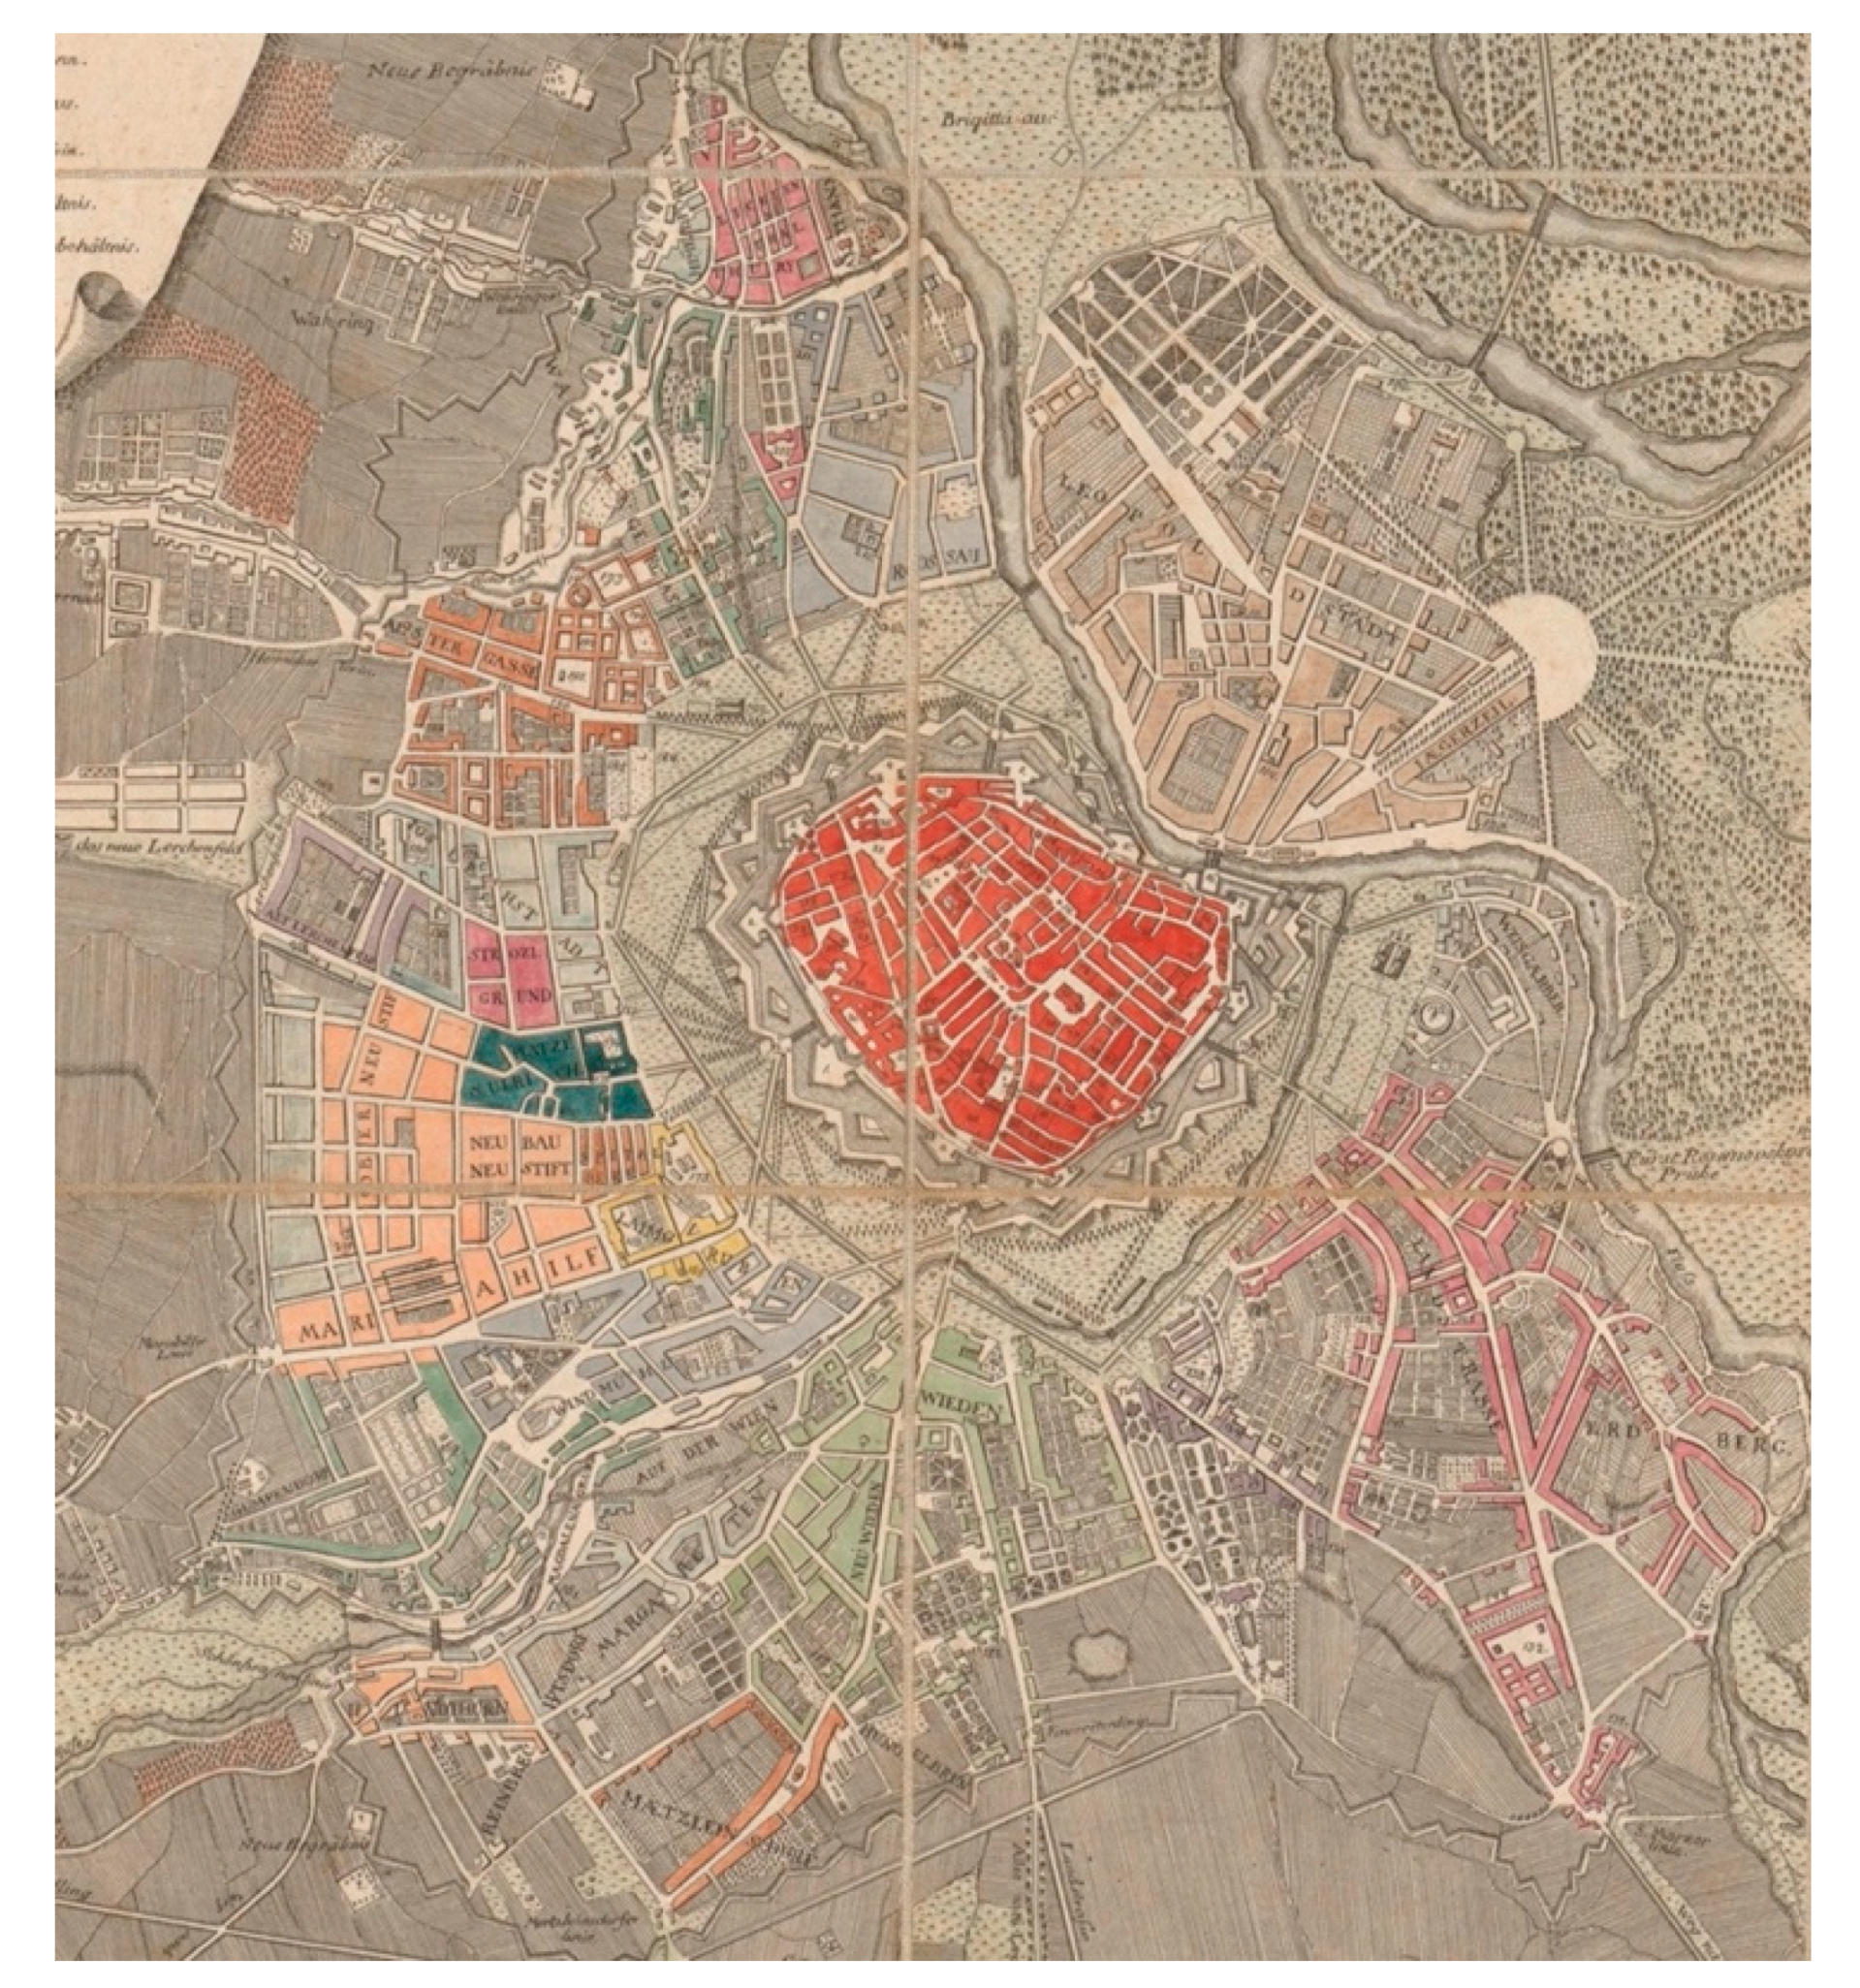
Figure 1. Vienna in 1798. The medieval city centre (red) is in the middle, the fortifications with the Glacis (grey) around it, and the external ring of outskirts (various colours). Source: [7].
Heritage 04 00059 g001
Figure 2. Data tree representation of the public buildings of the first ring of districts in the generative model discussed in this article. Source: Author’s work.
Heritage 04 00059 g002
Figure 3. “Vienna divided to districts by radial and zone roads, as an example for the regulation of a large city.” Drawing: Otto Wagner. Source: [1] (pp. 12–13).
Heritage 04 00059 g003
Figure 4. “Layout plan of the proposed District XXII of Vienna.” Drawing: Otto Wagner. Source: [1] (p. 11).
Heritage 04 00059 g004
Figure 5. “View to the air centre (Luftzentrum) of the future District XXII of Vienna.” Drawing: Otto Wagner. Source: [1] (p. 14).
Heritage 04 00059 g005
Figure 6. The Grasshopper definition (algorithm) coding the system of the districts. The data flow from the left to the right. The aggregation is a recursive process: the subsequent rings inherit their input from the output of the previous ring. Source: Author’s work.
Heritage 04 00059 g006
Figure 7. The Grasshopper definition (algorithm) that populates the districts with buildings. The data flow from the left to the right. Each district is populated with the same algorithm, only the input—the boundary of the given district—differs. Source: Author’s work.
Heritage 04 00059 g007
Figure 8. A generated district with the boundary trapezoid and the base point of the grid (white X). Source: Author’s work.
Heritage 04 00059 g008
Figure 9. The inputs for generating the system of districts for Vienna. The white dots are the starting points of the radial roads; the dark grey surface is the area where no points or buildings can exist. Source: Author’s work.
Heritage 04 00059 g009
Figure 10. The generated district system using the input seen in Figure 8. Each ring of districts is generated by the same algorithm. Source: Author’s work.
Heritage 04 00059 g010
Figure 11. The district system populated by buildings. The buildings in each district are generated by the same algorithm. Source: Author’s work.
Heritage 04 00059 g011
Figure 12. Scaled-up detail of Figure 11: the external districts. Source: Author’s work.
Heritage 04 00059 g012
Figure 13. Three-dimensional view of the model seen in Figure 10. Source: Author’s work.
Heritage 04 00059 g013
Figure 14. Map of Miskolc, Hungary. Source: OpenStreetMap.
Heritage 04 00059 g014
Figure 15. The inputs for generating the system of districts for Miskolc. The white dots are the starting points of the radial roads, the dark grey surface is the area where no points or buildings can exist. Source: Author’s work.
Heritage 04 00059 g015
Figure 16. The generated district system using the input seen in Figure 13. Each ring of districts is generated by the same algorithm. Source: Author’s work.
Heritage 04 00059 g016
Figure 17. The district system populated by buildings. The buildings in each district are generated by the same algorithm. Scheme 16 (pp. 317–318).
Heritage 04 00059 g017
Figure 18. Unintended geometries during the modelling process. Source: Author’s work.
Heritage 04 00059 g018
Publisher’s Note: MDPI stays neutral with regard to jurisdictional claims in published maps and institutional affiliations.