Review

Geomatic Sensors for Heritage Documentation: A Meta-Analysis of the Scientific Literature

Department of Civil Engineering and Geomatics, Faculty of Engineering and Technology, Cyprus University of Technology, Saripolou 2-8, 3036 Limassol, Cyprus
*
Author to whom correspondence should be addressed.
Heritage 2023, 6(10), 6843-6861; https://doi.org/10.3390/heritage6100357
Submission received: 21 September 2023 / Revised: 11 October 2023 / Accepted: 17 October 2023 / Published: 19 October 2023

Abstract

:
This review paper aims to provide a meta-analysis of the scientific literature for heritage documentation and monitoring using geo-information sensors. The study initially introduces the main types of geomatic sensors that are currently widely used for heritage studies. Although the list provided here is indicative rather than exhaustive, it provides a general overview of the variety of sensors used for different observation scales. The study next focuses on the existing literature, based on published documents. Targeted queries were implemented to the Scopus database to extract the relevant information. Filtering was then applied to the results so as to limit the analysis on the specific thematic sub-domains that is applied for heritage documentation and monitoring. These domains include, among other close-range and underwater photogrammetry, Terrestrial Laser Scanner, Unmanned Aerial Vehicles platforms, and satellite observations. In total, more than 12,000 documents were further elaborated. The overall findings are summarized and presented here, providing further insights into the current status of the domain.

1. Introduction

In the past, a variety of sensors has been used for documentation and monitoring purposes of heritage sites [1,2,3,4,5,6]. As the technology advances and sensor capabilities have increased, there have been more studies on the subject. Geomatic sensors have been used in applications such as close-range approaches with red-green-blue (RGB) cameras and Terrestrial Laser Scanners (TLS), as well as underwater studies [7,8,9,10,11]. Low-altitude sensors on Unmanned Aerial Vehicles (UAVs) have also been widely used with RGB and multispectral cameras, as well as lidar and thermal sensors [12,13,14,15]. Additionally, researchers have been interested in using aerial and satellite sensors for observing heritage sites and monuments on a macro scale [16,17]. The following section provides a brief overview of the sensors and methodologies currently used for cultural heritage documentation and monitoring, categorized by the platform or environment where they are most commonly used.

1.1. Close-Range Sensors

1.1.1. RGB Sensors

RGB sensors are passive sensors, commonly used for closed-range photogrammetric applications. These sensors operate in the visible part of the spectrum, between 380–750 nm. While CMOS sensors are sensitive to approximately 350–1050 nm, an infrared filter (750–1000 nm) is applied to reproduce natural colors visible to humans. By replacing the infrared filter with a red one, some cameras can be easily customized to near infrared, hence CMOS records infrared wavelengths into the red channel of the RGB image file [18,19].
The versatility and variety of available RGB cameras in the market are unmatched by any other sensor in the cultural heritage field [20]. Cameras can be classified based on their sensors and lenses [21]. CMOS sensors are usually classified according to their physical size and resolution, which affects the physical pixel size and amount of recorded light. Other sensor characteristics of interest include the color pattern and an antialiasing digital filter.
Lenses are characterized by their focal length and material. Focal length affects the size of the covered area at a given object-to-camera distance and depends on the application. Two lens materials are available: plastic (acrylic) and glass (crystal), with the latter being preferable. Other important characteristics are the number of elements in the lens, chromatic aberrations, distortion, and whether it is a prime or zoom lens [21].
Camera manufacturers prioritize different characteristics, based on the intended application and the final cost of the camera. For example, camera rigidity is desirable for 3D reconstruction applications, but it increases camera weight, making it challenging to mount the camera on a drone. Cameras with interchangeable lenses are more versatile, but this feature also increases camera size and weight. LCD screens and control dials are desirable for professional users, but useless if the device is mounted on a drone. Other characteristics of interest for specific applications include recording in raw format, a wired or wireless connection for remote control, triggering and data recording, a hot shoe for flash, and synchronization for precise triggering.
The primary purpose of such sensors is general-purpose recording and documentation, but they are increasingly used for 3D reconstruction through Structure from Motion (SfM) and Multi-View Stereo (MVS) techniques [22,23]. Calibration is necessary for both types of measurements to achieve high standards [24]. A color checker in the frame of each photo is usually sufficient to achieve color accuracy, while accurate 3D reconstruction requires a rigid camera [25,26]. The camera must be either calibrated before the photo acquisition or self-calibrated during post-processing, while several ground control points must be measured using a higher-order accuracy method, i.e., a total station, to ensure high geometric accuracy and georeferencing.
While there are many different sensors in the market, it is essential to highlight the 360° cameras, which have gained attention from the community as an easy means to record data quickly without missing any information [27,28,29]. There are two main applications for such cameras: virtual tours and 3D reconstruction. The former is served even by affordable commercial cameras, but the latter requires high-end dedicated cameras. Such cameras consist of an array of sensors, which are triggered simultaneously. The most common and affordable approach is two small image sensors mounted back-to-back, coupled with 180° spherical lenses. Most expensive implementations consist of 3–25 sensors and lenses connected with a rigid body, triggered simultaneously. The advantage of more sensors is that each covers a much smaller field of view, limiting the lens distortions and increasing the overall resolution. The same comments for the single-lens cameras apply to each set of sensors and lenses. It should be mentioned that a camera with multi-lenses/sensors should be used for 3D reconstruction if good results are expected [27].

1.1.2. Terrestrial Laser Scanners

The LiDAR technology [30] being used in Terrestrial Laser Scanners (TLS) are active sensors, emitting laser in the 900–1064 nm wavelength, which is reflected by the surrounding objects and returned to the scanner. The scanner measures the time of flight (TOF) or phase shift and calculates the distance from the reflected surface. Modern TLS cover a 360° × 270° window area or even more, and they can acquire points at a rate between 30 K and 2 M points per second [31,32,33].
Beside the laser measurement technology (TOF or phase shift), which directly affects acquisition rate and range, other essential characteristics of TLS include angular resolution, distance accuracy, signal-to-noise ratio, multiple responses, and a coaxial RGB camera. Final point accuracy from the laser head is a combination of distance and angular accuracy, and varies roughly in the 5–15 mm @ 100 m range.
The collected point clouds from TLS are co-registered or geo-registered during the post-processing. The former may be done using sphere targets, and the latter using targets measured with other methods, usually a combination of total stations and Global Navigation Satellite Systems (GNSS). For the final alignment, Iterative Closest Point (ICP) algorithms are employed [34,35,36,37]. Most TLS use complementary sensors, such as GNSS, barometers, and digital compasses, to estimate the initial position and accelerate alignment during post-processing. Some modern TLS use LiDAR or visual Simultaneous Location And Mapping (SLAM) techniques to co-register neighboring scans instead of the aforementioned sensors.
Simultaneous Localization And Mapping (based on visual, IMU, or combined) is also being used to eliminate the need for the scanner to be stationary [38,39,40,41,42]. The implementation of such scanners maybe handheld, backpack, car, or drone mounted. The user holds a rotating laser profiler while walking around and inside the monument. Recorded data are stored and merged into a single-point cloud during post-processing. Such methods are faster in data acquisition, i.e., a monument can be covered in a fraction of the time if stationary TLS were used. However, they are of inferior accuracy, varying from 30 mm to 50 mm @ 100 m range. Professional calibration and service of TLS is necessary, as they are complex and sensitive equipment [43,44].

1.2. Low-Altitude Sensors

Similar sensors are also used in low-altitude applications. The drone RGB sensor is like the RGB sensor discussed previously, but it onboards a drone, allowing for more advantageous positions and angles for photography. The rise of location-aware drones equipped with single-frequency GNSS at the beginning of the 2010s allowed for autonomous flights aimed at large-scale mapping [45,46]. In the following years, multicopper drones were extensively used with oblique photographs for detailed 3D reconstruction of cultural heritage monuments and sites [47,48,49,50,51].
Cameras onboard drones have similar characteristics to standard ones but must be optimized for weight and space. Additionally, given that the object-to-camera distance may be easily altered by proper flying height, the need for interchangeable lenses is limited. The image scale can be controlled by the flying height rather than the lens focal length. Wide lens cameras are adopted in most cases, since they also provide a favorable base-to-height ratio, for better height precision.
Drone vendors prefer small and light cameras, hence cameras free of LCD screens, dials and buttons, viewfinders, etc. In fact, they adopt small custom-made cameras (Original Equipment Manufacturers), focusing on the best lens–sensor selection and optimizing them for size and weight.
Although the camera and drone should be considered as two separate pieces of equipment, each with its own characteristics, vendors dominating the recreational market have introduced combo solutions and have unified characteristics for their products, limiting users’ choices. Some drones allow for payload choices, including various RGB cameras, thermal, multispectral, hyperspectral, and LiDAR sensors [52,53,54,55,56,57], but these are aimed at specialized applications/customers.

1.3. Underwater Sensors

Underwater RGB is a passive sensor but when using flash/lights it becomes active. The natural sunlight is heavily reduced with depth, and taking photos without an artificial light source becomes impracticable. Apart from the passive/active nature of the underwater RGB sensor and limitations imposed by the environment, two more shortcomings need to be noted concerning the recorded information.
The water strongly absorbs the infrared, red, and green wavelengths (from shallow to deep), and the color is diminished to blue. Therefore, color accuracy cannot be ensured, even with color checkers, because the light attenuation depends on environmental parameters and lights-to-object-to-camera distance, which varies from pixel to pixel. Therefore, intense illumination and color differences appear in underwater photos. This problem is an active field of research on haze-removal and color-restoration techniques [58]. So far, there is no algorithm that can work universally.
Having the camera in a watertight enclosure means the light travels through many media (water, glass, air, glass, sensor). Hence the photogrammetric principle of straight light transmission is invalid. Given that the camera is rigidly fixed to the lens body and there are no severe misalignments, the geometric image deformations are radial and tangential to the principal point or near it. Therefore, they can be compensated with the existing lens-distortion models, and the whole process is resolved through camera self-calibration. Dome ports are more suitable than flat ones; hence, the latter introduces several other deformations, like a strong color aberration. After the emergence of SfM–MVS techniques, several applications for underwater heritage geometric documentation have been released [59,60,61,62,63,64].

1.4. Aerial and Satellite Sensors

Aerial and satellite sensors have been widely used for cultural heritage [65,66,67]. Aerial photogrammetry was one of the oldest techniques for reconnaissance over extensive archaeological landscapes and heritage objects [68]. Archive aerial images are now considered of great value as these can provide valuable information related to a landscape that has been changing due to modern construction [69,70]. Similarly, the role of sensors onboard satellite platforms has increased in the last decade. This increase is mainly due to the increased capabilities and improvement of the space sector that can provide enhanced spatial and spectral imagery. Satellites today can provide multispectral and hyperspectral data covering from approximately 380 nm to 2500 nm, while thermal sensors are becoming available today at a very high resolution (5 m) [71,72,73,74,75].

2. Review Studies

Several review studies have been presented to depict the state of the art of specific thematic pillars for heritage. For instance, in [76], Agapiou and Lysandrou explore the evolution of remote sensing for archaeology; in [77], Tapete and Cigna study the trends and perspectives of spaceborne SAR remote sensing for archaeological landscape and cultural heritage applications; Cuca et al., [78] evaluated the interconnection between hazards and Sustainable Development Goals, etc. Moreover, Argyrou and Agapiou [79] provided a review analysis of the use of remote sensing technologies for archaeological applications through the recent advanced image processing techniques, while earlier Luo et al. [80] presented detailedoverview of the evolution of airborne and spaceborne remote sensing for heritage applications. Similar review papers have also been presented for photogrammetry [81,82,83], drone applications [84,85] etc.
Nevertheless, an overview presentation from the perspective of geomatic sensors, in general and not per thematic priority, is limited in the literature. A concise overview of existing technologies was presented by Campana et al. in 2008 [86] in contrast to several studies and applications using multi-sensor geomatic technologies for heritage [87,88,89,90]. Of course, review papers can be found for specific domains, such as 3D-imaging sensors [91] and Earth Observation sensors for monitoring cultural landscapes [92]. The limited review studies and meta-analysis of the scientific landscapes for geomatic sensors are not peculiar. Such sensors span different sub-disciplines such as remote sensing, photogrammetry, image processing, 3D modelling and visualization. In addition, geomatic technology is growing and changing rapidly.
As [93] argues, a systematic literature review through bibliometric analysis is an excellent way to summarize relevant research information. By extracting data and analyzing the performance of gathered documents in the literature, bibliometric analysis can also identify new potential partners for collaboration and reveal emerging trends in the research field. The analysis can include details regarding institutions, countries, and publications. As a result, bibliometric analysis is a valuable technique for giving an overview of research.
This study aimed to study and perform a meta-analysis of the existing literature focusing on the wider use and exploitation of geomatic sensors. The study also aimed to highlight some of the benefits and applications that geomatic technologies may offer for heritage documentation and monitoring.

3. Materials and Methods

The meta-analysis of the literature review was based on the available literature and published documents accessible from the Scopus engine (accessed on 8 August 2023) [94]. Scopus is a widely accepted repository and indexing database that hosts necessary metadata from published documents, such as authors’ names and affiliations, abstracts and keywords, titles, publishers, sources, etc. [95]. Table 1 summarizes the information exported as .csv and .ris from the Scopus engine. Based on these metadata, a quantitative meta-analysis can be carried out aiming to identify gaps and trends or to highlight core areas of interest and experts—active groups of the domain.
The Scopus engine has been used in the past as a reference for various review papers and studies in several thematic domains, including archaeology [96], forestry [97], and agriculture [98]. A review of the limitations and potential of using the Scopus engine for meta-analysis of scientific literature can be found in [99,100,101].
The analysis presented here implies the Preferred Reporting Items for Systematic Reviews and Meta-Analyses (PRISMA) protocol developed for such meta-analysis review studies [102]. PRISMA protocol provides guidelines for systematic reviews to be reported completely and accurately. PRISMA protocol enables users to interpret and appraise the review findings appropriately.
For this study, specific Boolean queries were applied to the Scopus engine to retrieve the necessary metadata in the form of .csv and .ris formats for further processing (Figure 1). The following queries were executed exclusively on Scopus: “heritage AND sensor” (query 1, Q1); “heritage AND documentation” (query 2, Q2); “heritage AND drone” (query 3, Q3); “heritage AND photogrammetry” (query 4, Q4); “heritage AND remote sensing” (query 5, Q5); “heritage AND laser scanner” (query 6, Q6); “heritage AND camera” (query 7, Q7); and “heritage AND satellite” (query 8, Q8). The queries were limited to show only documents published after 2000.
In total, 18,627 documents were retrieved from the Scopus engine as follows: Q1: 2386 documents; Q2: 5453 documents; Q3: 371 documents; Q4: 2988 documents; Q5: 1995 documents, Q6: 1077 documents, Q7: 1888 documents; and Q8: 2469 documents.
Duplicated documents were then excluded (4361 documents) from the study. From the remaining documents (14,266), 1784 were further excluded as these were considered “non-relevant.” “Non-relevant” papers were excluded, as these were filtered by the Scopus engine as non-relevant to our study scientific fields such as “Energy” with 275 documents, “Business, Management and Accounting” with 263 documents, and “Economics, Econometrics and Finance with 262 documents. The documents remaining (12,482 documents) were further elaborated in the Scopus environment [94], Microsoft Excel 365 [103], SankeyMATIC [104], VOSviewer 1.6.19 [105,106], and CiteSpace 6.2R4 [107,108]. The results from this analysis are presented in the next section.

4. Results

This section presents the overall findings and results of the meta-analysis of the remaining (12,482) documents found in the Scopus engine. Various types of analysis were carried out, and the results are presented below.

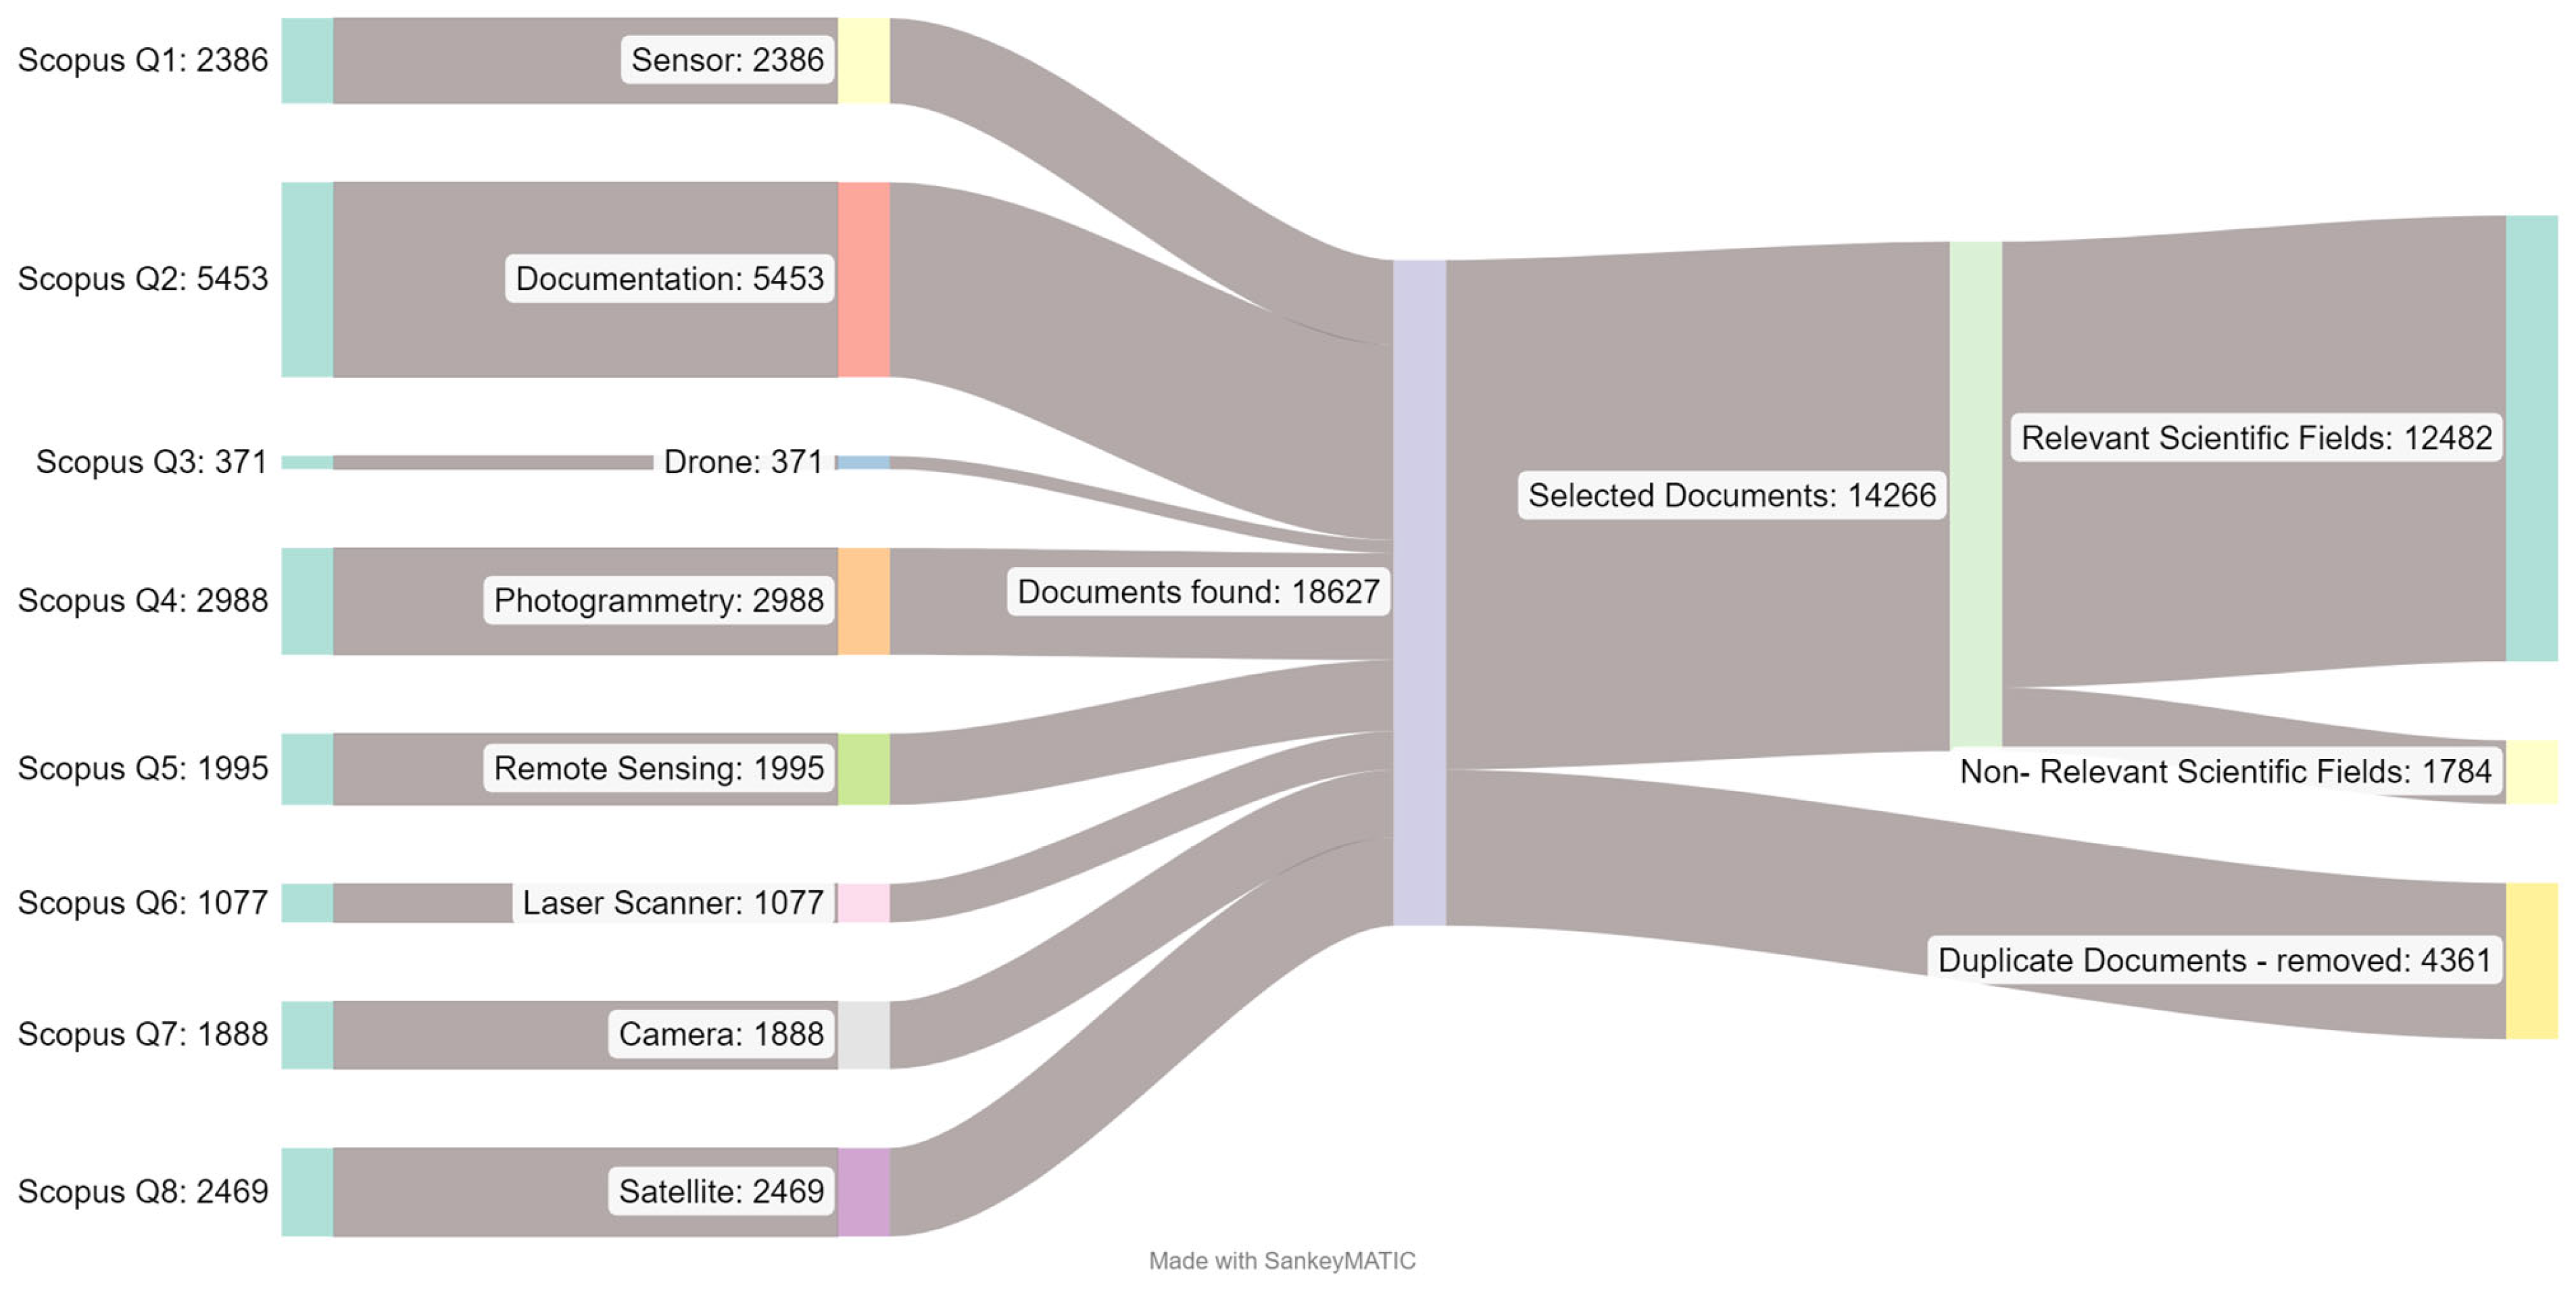
4.1. Productivity: Documents in Number

Following the queries in the Scopus engine, the total number of documents per year can be summarized and visualized (see Figure 2). As shown in Figure 2, in recent years, and especially after 2010, an increase in relevant publications can be observed. Blue dots in Figure 2 correspond to the total number of documents published per year, while the dash line is the moving average trendline per two years. Based on the statistics, most of the documents were published after 2000. Indeed, since 2000 the total number of documents published within this period corresponds to 97% of the total publications. In addition, after 2019, the total number of publications per year is more than 1000 documents. Most of the publications found in the Scopus engine are written in English (94%), while the rest are written in other languages, including Spanish (2%), Italian (1%), French, Chinese (<1%) and others (~1%). The English language overshadows other relevant studies written in other languages and is not included in the Scopus engine. This issue is further elaborated in the Section 5.
The published record is distributed in different scientific fields, as shown in Figure 3, and based on the classification of the subject area from the Scopus engine. The most prominent scientific fields are “Social Sciences” at 20%, “Computer Science” at 19.6%, “Engineering” at 14%, “Arts and Humanities” at 13%, and “Earth and Planetary Sciences” at 11.7%. These scientific fields correspond to 78.3% of the total publications. Other disciplines, such as “Mathematics,” “Environmental Science,” etc. also host fewer records.

4.2. Documents per Type

Documents found in the Scopus engine can be of different types. As was found (Figure 4), most of the available literature (87%) dealing with geomatic sensors for heritage is published either as conference papers (44%) or journal article papers (43%). The remaining publications are considered as other types of documents, such as book chapters (5%), review articles and review conferences papers (3.5% and 2%, respectively).
Figure 5 presents the top 20 journals and conference proceedings that published related studies. However, these top 20 journal/conference proceedings represent only 35% of the list of journal articles and conference proceedings series. Based on the outcomes from the Scopus engine, more than 130 different sources published related documents. This number indicates the rather fragmentary research landscape of the “heritage documentation and monitoring” domain. Indeed, as the specific concept of heritage documentation and monitoring through geomatic sensors is quite broad, this inevitably influences the wider spectrum of related studies and thematic priorities.
By far, the International Archives of the Photogrammetry Remote Sensing and Spatial Information Science ISPRS Archives distribute the highest number of relevant documents, with 1555 documents, approximately 12.5% of the overall literature. The four top sources are derived from conference proceedings. Regarding journal articles, Remote Sensing and the Journal of Archaeological Science are the top two journals in terms of productivity.
Let us look only for the “review” type papers, either published as scientific journals or as conference proceedings. We see that most of the review papers are focused on either remote sensing or photogrammetric applications (Figure 6). Other targeted reviews are focused on other specific technological advancements, such as LiDAR, 3D modelling, aerial photography, laser scanner, ground penetrating radars, etc. Most of these review papers are published in USA and Italy (86 and 84 papers, respectively).

4.3. Co-Occurrence of Keywords

The frequency of the selected keywords mentioned by the authors was also analyzed. This analysis was carried out in the VOSviewer environment. More than 23,000 different keywords can be found in all papers (12,482 documents), and therefore a threshold of five as the minimum number of occurrences was set in the analysis. This threshold returns 1244 keywords, further elaborated and visualized, as shown in Figure 7. The size of the circle indicates the number of times the authors mention the specific keyword in their articles. In contrast, the different color indicates the different clusters as the software and resolution parameters perform these. A cluster is a set of closely related nodes (keywords) grouped.
Although Figure 7 is difficult to interpret due to the large amount of information, some key nodes (keywords) can be observed. UAV, 3d modelling, virtual and augmented reality, and calibration are some of the main keywords commonly found in published articles. Furthermore, Figure 7 demonstrates the extent of the approaches, methodologies, disciplines, and tools that were applied in the past for heritage documentation and monitoring purposes.
A deeper analysis of the outcomes of Figure 7 can be made using automatically generated labels. Automatically generated cluster labels can deliver valuable intermediate steps and help researchers identify clusters (key thematic areas/domains). Based on the keywords of the available documents, three main clusters have been made (clusters #0 to #2) for 2010–2022. As Chen et al. [107] argue, while manually labelling a cluster can be “a very rewarding process of learning about the underlying speciality and result in insightful and easy to understand labels, it requires a substantial level of domain knowledge, and it tends to be time-consuming and cognitively demanding because of the synthetic work required over a diverse range of individual publications. In addition, it is hard for others to follow the heuristics and criteria used in the original analytic reasoning process.” CiteSpace automatically generates labels for clusters to summarize the major themes of these clusters. The labelling procedure includes the initial selection of candidates for cluster labels from noun phrases and index terms of citing articles of each cluster, which are then ranked based on three different algorithms (see more in [107]).
The results of this analysis are shown in Table 2. Various essential labels are provided for each cluster (#0–#2). Similar keywords can also be seen between the clusters, indicating the knowing intersection between the different studies. Looking into the labels, one may argue that a group of literature (cluster #0) is focused on using remote sensing technologies, including UAVs and lidar, as part of archaeological prospection studies. In contrast, another cluster (cluster #1) is oriented toward documenting and visualizing heritage sites and monuments. Finally, studies under the third cluster (cluster #2) are focused on heritage monitoring and visualization—graphics of the end-products of the documentation. The order of these clusters is random.
We can further reduce our analysis to only “review” type documents. The co-occurrence of keywords suggested by the authors indicates a clearer picture of the last year’s scientific “review” landscape. Figure 8 shows the results from the co-occurrence analysis of the review papers and their related clusters and connections between them. Several geomatic technologies are discussed in these review papers. It is essential to highlight the term “automation” (bottom right in Figure 8), which was a relevant hot topic in the literature, to the semi- or fully-automated procedures and methodologies and the “collaborative research” that is becoming a new trend in the literature (top left on Figure 8). Other known technologies and approaches, such as 3d modelling, laser, scanner, BIM, photogrammetry, navigation systems etc. are also part of the review of the landscape.

4.4. Documents per Country and Affiliations

Regarding productivity per country and institution, the VOSviewer software was used. Productivity per country is based on the authors’ affiliations, not the area of interest (application area). Based on the findings (Figure 9), Italy and the USA are the leading countries in this domain, publishing more than 4500 documents. UK, France, Germany, China, and Spain follow in terms of productivity, with total publications of more than 4000. It is, therefore, evident that most of the available literature found in the Scopus engine (>8500 documents out of 12,482) is driven by the institutions hosted in the previously mentioned countries. This number corresponds to up to 70% of the total publications. These countries are also well connected, indicating a continuous knowledge exchange between the authors (i.e., as co-authors in the same document). As shown in Figure 9, other countries, primarily European, follow with relevant high levels of networking. Nevertheless, other regions beyond Europe are less productive in this domain and less connected with the rest of the research network. The countries can be found in the outer limits of the network diagram of Figure 9.
Regarding the institutions that are active in this domain, we see that six out of seven more productive institutions in the domain of heritage documentation and monitoring are based in Italy (Figure 10). Indeed, Research Centre of Italy (CNR), Politecnico di Milano, Politecnico di Torino and others can be considered as core research institutions of the domain. The French CNRS, NASA, and the Chinese Academy also have key roles in the evolution of the scientific field. Other institutions based in Cyprus, Greece, Spain, and UK are part of the top 20 most productive institutions of this domain. Nevertheless, it should also be pointed out that these 20 institutions and research centers contribute up to 25% of the total publications.

5. Discussion

The previous analysis provided further insights regarding the scientific literature review on geomatic technologies used for cultural heritage monitoring and documentation. Key institutions and countries that have been active in this domain have been identified in the last years, as well as other information dealing with, for instance, the type of papers published, the journal, proceedings and keywords used by authors in their research articles.
Nevertheless, a key question concerning this domain concerns identifying recent trends and concepts/tools widely adopted in recent years. Answering this question is essential for researchers to know the changes in the research landscape and to identify potential gaps. One way of doing this study is to examine the keywords that authors provide in their articles (see previous section). However, this can sometimes be chaotic, due to the large number of keywords provided in a single document by the authors and the heterogeneity of the different sub-disciplines.
Another way our study acts is to identify keywords within the top-cited papers during a specific period. Mapping citations instead of keywords in published documents provides the opportunity to study the acceptance of specific sub-domains (clusters) by the scientific community. To do so, the CiteSpace environment was used, isolating the top 25 most-cited authors since 2010. The analysis was carried out using the so-called citation burst approach. Citation burst is an indicator of a most active area of research. Citation burst detects a burst event lasting for multiple years and a single year. In our case study, the minimum duration was two years. Citation burst analysis is based only on papers that have attracted an “extraordinary degree of attention from its scientific community” [109]. The burst detection in CiteSpace is based on Kleinberg’s algorithm [110].
The results of this analysis are visualized in Table 2. Citation burst analysis generates a summary list of keywords (top 25) associated with citation bursts. The visualization shows which keywords have the most substantial citation bursts and in which periods the most substantial bursts took place (with red color, beginning and end). For instance, at the beginning of 2010, keywords such as three-dimensional, sensors, calibration, image processing and satellite were populated in the literature. The most exciting part of Table 3 is the last rows, which provide recent domain trends. These include the use of UAVs, antennas, monitoring and deep learning.

6. Conclusions

This study aimed to provide an overview of the scientific literature regarding the use of geomatic sensors and technologies for heritage documentation and monitoring. For this purpose, the Scopus repository was used. Specific filters have been applied to extract the relevant information, which was then screened out and further processed in various environments.
The results of this analysis, outlined in the previous sections, were initially focused on the characterization of the existing literature (type of document and productivity). In contrast, the analysis was then focused on the most widely cited journals and conference proceedings that host articles with the relevant topic. The analysis also identified active institutions in this domain, countries and keywords. The analysis was finally focused on identifying trends in literature.
As demonstrated, the scientific landscape of using geomatic technologies for heritage is not static but dynamic. Geomatic technologies have been widely populated for cultural heritage applications, while the scientific field is quite broad: from underwater to close-range to low-altitude and satellite observations. At the same time, the scientific landscape is quite fragmented because of the different sub-domains and expertise needed. The leading institutions and countries are Italy and USA, but in general European institutions lead the scientific field. Recently advanced image processing, such as deep learning algorithms, is expected to be further studied in the following years based on the analysis of recent trends.
Of course, our analysis here needs to be completed. Using a single repository cannot be considered an all-inclusive scientific repository of existing knowledge. It should also be stressed that more than 90% of the documents found in the Scopus engine are written in English, eliminating other studies in other languages. In addition, further insights as part of a future study can be carried out to investigate the role of the impact factor of the journal publications, collaboration of research groups, and networking.
Geomatic technologies are expected to be elaborated and applied to cultural heritage shortly. Their use is expected to contribute further to the 3D documentation and recording, preservation, and restoration (digital or physical), archaeological excavation progress monitoring, and other recent trends such as the digital twins, XR applications, and others.

Author Contributions

Conceptualization, methodology, A.A.; writing—original draft preparation, A.A. and D.S. writing—review and editing, A.A. and D.S. All authors have read and agreed to the published version of the manuscript.

Funding

This project has received funding from the European Union’s Horizon Europe Framework Programme (HORIZON-WIDERA-2021-ACCESS-03, Twinning Call) under the grant agreement no. 101079377 and the UKRI under project number 10050486.

Data Availability Statement

The metadata of the papers reviewed and analyzed here can be downloaded through the Scopus engine following the criteria (keywords) indicated in the paper.

Conflicts of Interest

The authors declare no conflict of interest. Views and opinions expressed are, however, those of the authors only and do not necessarily reflect those of the European Union or the UKRI. Neither the European Union nor the UKRI can be held responsible for them.

References

  1. Markiewicz, J.; Tobiasz, A.; Kot, P.; Muradov, M.; Shaw, A.; Al-Shamma’a, A. Review of surveying devices for structural health monitoring of cultural heritage buildings. In Proceedings of the 2019 12th International Conference on Developments in eSystems Engineering (DeSE), Kazan, Russia, 7–10 October 2019; pp. 597–601. [Google Scholar]
  2. Adamopoulos, E.; Rinaudo, F. Close-range sensing and data fusion for built heritage inspection and monitoring—A review. Remote Sens. 2021, 13, 3936. [Google Scholar] [CrossRef]
  3. Kot, P.; Markiewicz, J.; Muradov, M.; Lapinski, S.; Shaw, A.; Zawieska, D.; Tobiasz, A.; Al-Shamma’a, A. Combination of the photogrammetric and microwave remote sensing for Cultural Heritage documentation and preservation–preliminary results. Int. Arch. Photogramm. Remote Sens. Spat. Inf. Sci. 2020, 43, 1409–1413. [Google Scholar] [CrossRef]
  4. Lercari, N.; Jaffke, D.; Campiani, A.; Guillem, A.; McAvoy, S.; Delgado, G.J.; Bevk Neeb, A. Building Cultural Heritage Resilience through Remote Sensing: An Integrated Approach Using Multi-Temporal Site Monitoring, Datafication, and Web-GL Visualization. Remote Sens. 2021, 13, 4130. [Google Scholar] [CrossRef]
  5. Vileikis, O.; Khabibullaeyev, F. Application of Digital Heritage Documentation for Condition Assessments and Monitoring Change in Uzbekistan. In Proceedings of the ISPRS Annals of the Photogrammetry, Remote Sensing and Spatial Information Sciences, Beijing, China, 10 September 2021; Volume 8, No. M-1-2021. pp. 179–186. [Google Scholar]
  6. Bräuer-Burchardt, C.; Munkelt, C.; Bleier, M.; Heinze, M.; Gebhart, I.; Kühmstedt, P.; Notni, G. Underwater 3D Scanning System for Cultural Heritage Documentation. Remote Sens. 2023, 15, 1864. [Google Scholar] [CrossRef]
  7. Yilmaz, H.M.; Yakar, M.; Gulec, S.A.; Dulgerler, O.N. Importance of digital close-range photogrammetry in documentation of cultural heritage. J. Cult. Herit. 2007, 8, 428–433. [Google Scholar] [CrossRef]
  8. Rüther, H.; Smit, J.; Kamamba, D. A comparison of close-range photogrammetry to terrestrial laser scanning for heritage documentation. South. Afr. J. Geomat. 2012, 1, 149–162. [Google Scholar]
  9. Lerma, J.L.; Navarro, S.; Cabrelles, M.; Villaverde, V. Terrestrial laser scanning and close range photogrammetry for 3D archaeological documentation: The Upper Palaeolithic Cave of Parpalló as a case study. J. Archaeol. Sci. 2010, 37, 499–507. [Google Scholar] [CrossRef]
  10. Lee, T.O. An Examination of Close-Range Photogrammetry and Traditional Cave Survey Methods for Terrestrial and Underwater Caves for 3-Dimensional Mapping. Doctoral Dissertation, University of Southern California, Los Angeles, CA, USA, 2018. [Google Scholar]
  11. Menna, F.; Agrafiotis, P.; Georgopoulos, A. State of the art and applications in archaeological underwater 3D recording and mapping. J. Cult. Herit. 2018, 33, 231–248. [Google Scholar] [CrossRef]
  12. Murtiyoso, A.; Grussenmeyer, P. Documentation of heritage buildings using close-range UAV images: Dense matching issues, comparison and case studies. Photogramm. Rec. 2017, 32, 206–229. [Google Scholar] [CrossRef]
  13. Bakirman, T.; Bayram, B.; Akpinar, B.; Karabulut, M.F.; Bayrak, O.C.; Yigitoglu, A.; Seker, D.Z. Implementation of ultra-light UAV systems for cultural heritage documentation. J. Cult. Herit. 2020, 44, 174–184. [Google Scholar] [CrossRef]
  14. Li, Z.; Yan, Y.; Jing, Y.; Zhao, S.G. The design and testing of a LiDAR Platform for a UAV for heritage mapping. Int. Arch. Photogramm. Remote Sens. Spat. Inf. Sci. 2015, 40, 17–24. [Google Scholar] [CrossRef]
  15. Brumana, R.A.; Oreni, D.A.; Van Hecke, L.; Barazzetti, L.U.; Previtali, M.A.; Roncoroni, F.A.; Valente, R.I. Combined geometric and thermal analysis from UAV platforms for archaeological heritage documentation. ISPRS Ann. Photogramm. Remote Sens. Spat. Inf. Sci. 2013, 2, 49–54. [Google Scholar] [CrossRef]
  16. Monna, F.; Rolland, T.; Denaire, A.; Navarro, N.; Granjon, L.; Barbé, R.; Chateau-Smith, C. Deep learning to detect built cultural heritage from satellite imagery.-Spatial distribution and size of vernacular houses in Sumba, Indonesia. J. Cult. Herit. 2021, 52, 171–183. [Google Scholar] [CrossRef]
  17. Agapiou, A.; Hadjimitsis, D.G.; Alexakis, D.; Sarris, A. Observatory validation of Neolithic tells (“Magoules”) in the Thessalian plain, central Greece, using hyperspectral spectroradiometric data. J. Archaeol. Sci. 2012, 39, 1499–1512. [Google Scholar] [CrossRef]
  18. Berra, F.E.; Gaulton, R.; Barr, S. Commercial Off-the-Shelf Digital Cameras on Unmanned Aerial Vehicles for Multitemporal Monitoring of Vegetation Reflectance and NDVI. IEEE Trans. Geosci. Remote Sens. 2017, 55, 4878–4886. [Google Scholar] [CrossRef]
  19. Geert, V.; Philippe, S.; Dirk, P.; Frank, V. Spectral Characterization of a Digital Still Camera’s NIR Modification to Enhance Archaeological Observation. Geoscience and Remote Sensing, IEEE Trans. Geosci. Remote Sens. 2009, 47, 3456–3468. [Google Scholar] [CrossRef]
  20. Maas, H.G. Close-Range Photogrammetry Sensors. In Advances in Photogrammetry, Remote Sensing and Spatial Information Science: 2008 ISPRS Congress Book; CRC Press: Boca Raton, FL, USA, 2008; pp. 63–72. [Google Scholar]
  21. Luhmann, T.; Fraser, C.; Maas, H.G. Sensor modelling and camera calibration for close-range photogrammetry. ISPRS J. Photogramm. Remote Sens. 2016, 115, 37–46. [Google Scholar] [CrossRef]
  22. Kholil, M.; Ismanto, I.; Fu’Ad, M.N. 3D Reconstruction Using Structure from Motion (SFM) Algorithm and Multi View Stereo (MVS) Based on Computer Vision. In IOP Conference Series: Materials Science and Engineering; IOP Publishing: Bristol, UK, 2021; Volume 1073, p. 012066. [Google Scholar]
  23. Torresani, A.; Remondino, F. Videogrammetry vs. photogrammetry for heritage 3D reconstruction. Int. Arch. Photogramm. Remote Sens. Spat. Inf. Sci. 2019, XLII-2/W15, 1157–1162. [Google Scholar] [CrossRef]
  24. Balletti, C.; Guerra, F.; Tsioukas, V.; Vernier, P. Calibration of action cameras for photogrammetric purposes. Sensors 2014, 14, 17471–17490. [Google Scholar] [CrossRef]
  25. Remondino, F.; Fraser, C. Digital camera calibration methods: Considerations and comparisons. Int. Arch. Photogramm. Remote Sens. Spat. Inf. Sci. 2006, 6, 266–272. [Google Scholar]
  26. Cronk, S.; Fraser, C.; Hanley, H. Automated metric calibration of colour digital cameras. Photogramm. Rec. 2006, 21, 355–372. [Google Scholar] [CrossRef]
  27. Herban, S.; Costantino, D.; Alfio, V.S.; Pepe, M. Use of low-cost spherical cameras for the digitisation of cultural heritage structures into 3d point clouds. J. Imaging 2022, 8, 13. [Google Scholar] [CrossRef]
  28. Murtiyoso, A.; Grussenmeyer, P.; Suwardhi, D. Technical considerations in Low-Cost heritage documentation. Int. Arch. Photogramm. Remote Sens. Spat. Inf. Sci. 2019, 42, 225–232. [Google Scholar] [CrossRef]
  29. Fangi, G.; Pierdicca, R.; Sturari, M.; Malinverni, E.S. Improving spherical photogrammetry using 360 omni-cameras: Use cases and new applications. Int. Arch. Photogramm. Remote Sens. Spat. Inf. Sci. 2018, 42, 331–337. [Google Scholar] [CrossRef]
  30. Zhien, W.; Massimo, M. Challenges and Opportunities in Lidar Remote Sensing. Front. Remote Sens. 2021, 2, 641723. [Google Scholar] [CrossRef]
  31. Abmayr, T.; Härtl, F.; Reinköster, M.; Fröhlich, C. Terrestrial laser scanning: Applications in cultural heritage conservation and civil engineering. In Proceedings of the ISPRS Working Group V4 2005, Mestre-Venice, Italy, 22–24 August 2005. [Google Scholar]
  32. Nuttens, T.; De Maeyer, P.; De Wulf, A.; Goossens, R.; Stal, C. Terrestrial Laser Scanning and Digital Photogrammetry for Cultural Heritage: An Accuracy Assessment; FIG Working Week: Marrakech, Morocco, 2011; p. 10. [Google Scholar]
  33. Grussenmeyer, P.; Landes, T.; Doneus, M.; Lerma, J. Basics of Range-Based Modelling Techniques in Cultural Heritage 3D Recording. In 3D Recording, Documentation and Management of Cultural Heritage; Whittles Publishing: Dunbeath, UK, 2016. [Google Scholar]
  34. Kushwaha, S.K.; Dayal, K.R.; Sachchidanand Raghavendra, S.; Pande, H.; Tiwari, P.S.; Agrawal, S.; Srivastava, S.K. 3D Digital Documentation of a Cultural Heritage Site Using Terrestrial Laser Scanner—A Case Study. In Applications of Geomatics in Civil Engineering: Select Proceedings of ICGCE 2018; Springer: Singapore, 2020; pp. 49–58. [Google Scholar]
  35. Grussenmeyer, P.; Landes, T.; Voegtle, T.; Ringle, K. Comparison methods of terrestrial laser scanning, photogrammetry and tacheometry data for recording of cultural heritage buildings. Int. Arch. Photogramm. Remote Sens. Spat. Inf. Sci. 2008, 37, 213–218. [Google Scholar]
  36. Bernat, M.; Janowski, A.; Rzepa, S.; Sobieraj, A.; Szulwic, J. Studies on the use of terrestrial laser scanning in the maintenance of buildings belonging to the cultural heritage. In Proceedings of the 14th Geoconference on Informatics, Geoinformatics and Remote Sensing, SGEM. ORG, Albena, Bulgaria, 19–25 June 2014; Volume 3, pp. 307–318. [Google Scholar]
  37. Klapa, P.; Mitka, B.; Zygmunt, M. Application of Integrated Photogrammetric and Terrestrial Laser Scanning Data to Cultural Heritage Surveying. In IOP Conference Series: Earth and Environmental Science; IOP Publishing: Bristol, UK, 2017; Volume 95, p. 032007. [Google Scholar]
  38. Keitaanniemi, A.; Rönnholm, P.; Kukko, A.; Vaaja, M.T. Drift analysis and sectional post-processing of indoor simultaneous localization and mapping (SLAM)-based laser scanning data. Autom. Constr. 2023, 147, 104700. [Google Scholar] [CrossRef]
  39. Barba, S.; Ferreyra, C.; Cotella, V.A.; di Filippo, A.; Amalfitano, S. A SLAM integrated approach for digital heritage documentation. In Proceedings of the International Conference on Human-Computer Interaction, Málaga, Spain, 22–24 September 2021; pp. 27–39. [Google Scholar]
  40. Ortiz-Coder, P.; Sánchez-Ríos, A. An integrated solution for 3D heritage modeling based on videogrammetry and V-SLAM technology. Remote Sens. 2020, 12, 1529. [Google Scholar] [CrossRef]
  41. Rodríguez-Gonzálvez, P.; Jiménez Fernández-Palacios, B.; Muñoz-Nieto, Á.L.; Arias-Sanchez, P.; Gonzalez-Aguilera, D. Mobile LiDAR System: New Possibilities for the Documentation and Dissemination of Large Cultural Heritage Sites. Remote Sens. 2017, 9, 189. [Google Scholar] [CrossRef]
  42. Lauterbach, H.A.; Borrmann, D.; Heß, R.; Eck, D.; Schilling, K.; Nüchter, A. Evaluation of a Backpack-Mounted 3D Mobile Scanning System. Remote Sens. 2015, 7, 13753–13781. [Google Scholar] [CrossRef]
  43. Lichti, D.; Stewart, M.P.; Tsakiri, M.; Snow, A.J. Calibration and testing of a terrestrial laser scanner. Int. Arch. Photogramm. Remote Sens. 2000, 33, 485–492. [Google Scholar]
  44. Rietdorf, A.; Gielsdorf, F.; Gruendig, L. A concept for the calibration of terrestrial laser scanners. In Proceedings of the INGEO 2004 and FIG Regional Central and Eastern European Conference of Engineering Surveying, Bratislava, Slovakia, 11–13 November 2004; Volume 11, p. 13. [Google Scholar]
  45. Gowroju, S.; Santhosh Ramchander, N. Applications of Drones—A Review. In Drone Technology; Mohanty, S.N., Ravindra, J.V.R., Surya Narayana, G., Pattnaik, C.R., Mohamed Sirajudeen, Y., Eds.; Wiley-Scrivener: Austin, TX, USA, 2023; pp. 183–206. [Google Scholar] [CrossRef]
  46. Meyer, D.; Fraijo, E.; Lo, E.; Rissolo, D.; Kuester, F. Optimizing UAV Systems for Rapid Survey and Reconstruction of Large Scale Cultural Heritage Sites. In 2015 Digital Heritage; IEEE: Piscataway, NJ, USA, 2015; Volume 1, pp. 151–154. [Google Scholar]
  47. Georgopoulos, A.; Oikonomou, C.; Adamopoulos, E.; Stathopoulou, E.K. Evaluating unmanned aerial platforms for cultural heritage large scale mapping. Int. Arch. Photogramm. Remote Sens. Spat. Inf. Sci. 2016, 41, 355–362. [Google Scholar] [CrossRef]
  48. Gong, Y.; Zhang, F.; Jia, X.; Huang, X.; Li, D.; Mao, Z. Deep Neural Networks for Quantitative Damage Evaluation of Building Losses Using Aerial Oblique Images: Case Study on the Great Wall (China). Remote Sens. 2021, 13, 1321. [Google Scholar] [CrossRef]
  49. Oczipka, M.; Bemmann, J.; Piezonka, H.; Munkabayar, J.; Ahrens, B.; Achtelik, M.; Lehmann, F. Small Drones for Geo-Archaeology in the Steppes: Locating and Documenting the Archaeological Heritage of the Orkhon Valley in Mongolia. In Remote Sensing for Environmental Monitoring, GIS Applications, and Geology IX; SPIE: Bellingham, WA, USA, 2009; Volume 7478, pp. 53–63. [Google Scholar]
  50. Bagnolo, V.; Paba, N. UAV-based photogrammetry for archaeological heritage site survey and 3D modeling of the sardus pater temple (Italy). Int. Arch. Photogramm. Remote Sens. Spat. Inf. Sci. 2019, 42, 45–51. [Google Scholar] [CrossRef]
  51. Stek, T.D. Drones over Mediterranean landscapes. The potential of small UAV’s (drones) for site detection and heritage management in archaeological survey projects: A case study from Le Pianelle in the Tappino Valley, Molise (Italy). J. Cult. Herit. 2016, 22, 1066–1071. [Google Scholar] [CrossRef]
  52. Matyukira, C.; Mhangara, P. Advancement in the Application of Geospatial Technology in Archaeology and Cultural Heritage in South Africa: A Scientometric Review. Remote Sens. 2023, 15, 4781. [Google Scholar] [CrossRef]
  53. Uribe, P.; Angás, J.; Romeo, F.; Pérez-Cabello, F.; Santamaría, D. Mapping Ancient Battlefields in a multi-scalar approach combining Drone Imagery and Geophysical Surveys: The Roman siege of the oppidum of Cabezo de Alcalá (Azaila, Spain). J. Cult. Herit. 2021, 48, 11–23. [Google Scholar] [CrossRef]
  54. Koutsoudis, A.; Ioannakis, G.; Pistofidis, P.; Arnaoutoglou, F.; Kazakis, N.; Pavlidis, G.; Chamzas, C.; Tsirliganis, N. Multispectral aerial imagery-based 3D digitisation, segmentation and annotation of large scale urban areas of significant cultural value. J. Cult. Herit. 2021, 49, 1–9. [Google Scholar] [CrossRef]
  55. Materazzi, F.; Pacifici, M. Archaeological crop marks detection through drone multispectral remote sensing and vegetation indices: A new approach tested on the Italian pre-Roman city of Veii. J. Archaeol. Sci. Rep. 2022, 41, 103235. [Google Scholar] [CrossRef]
  56. Khelifi, A.; Ciccone, G.; Altaweel, M.; Basmaji, T.; Ghazal, M. Autonomous service drones for multimodal detection and monitoring of archaeological sites. Appl. Sci. 2021, 11, 10424. [Google Scholar] [CrossRef]
  57. Patrucco, G.; Cortese, G.; Giulio Tonolo, F.; Spanò, A. Thermal and optical data fusion supporting built heritage analyses. Int. Arch. Photogramm. Remote Sens. Spat. Inf. Sci. 2020, 43, 619–626. [Google Scholar] [CrossRef]
  58. Vlachos, M.; Skarlatos, D. An Extensive Literature Review on Underwater Image Colour Correction. Sensors 2021, 21, 5690. [Google Scholar] [CrossRef]
  59. Diamanti, E.; Løvås, H.S.; Larsen, M.K.; Ødegård, Ø. A multi-camera system for the integrated documentation of Underwater Cultural Heritage of high structural complexity; The case study of M/S Helma wreck. IFAC-Pap. OnLine 2021, 54, 422–429. [Google Scholar] [CrossRef]
  60. Selmo, D.; Sturt, F.; Miles, J.; Basford, P.; Malzbender, T.; Martinez, K.; Thompson, C.; Earl, G.; Bevan, G. Underwater reflectance transformation imaging: A technology for in situ underwater cultural heritage object-level recording. J. Electron. Imaging 2017, 26, 011029. [Google Scholar] [CrossRef]
  61. Skarlatos, D.; Agrafiotis, P. Image-Based Underwater 3DReconstruction for Cultural Heritage: From Image Collection to, 3.D. Critical Steps and Considerations. In Visual Computing for Cultural Heritage Springer Series on Cultural Computing; Liarokapis, F., Voulodimos, A., Doulamis, N., Doulamis, A., Eds.; Springer: Cham, Switzerland, 2020. [Google Scholar] [CrossRef]
  62. Skarlatos, D.; Demestiha, S.; Kiparissi, S. An ‘open’ method for 3D modelling and mapping in underwater archaeological sites. Int. J. Herit. Digit. Era 2012, 1, 1–24. [Google Scholar] [CrossRef]
  63. Drap, P.; Merad, D.; Hijazi, B.; Gaoua, L.; Nawaf, M.M.; Saccone, M.; Chemisky, B.; Seinturier, J.; Sourisseau, J.-C.; Gambin, T.; et al. Underwater Photogrammetry and Object Modeling: A Case Study of Xlendi Wreck in Malta. Sensors 2015, 15, 30351–30384. [Google Scholar] [CrossRef]
  64. Hu, K.; Wang, T.; Shen, C.; Weng, C.; Zhou, F.; Xia, M.; Weng, L. Overview of Underwater 3D Reconstruction Technology Based on Optical Images. J. Mar. Sci. Eng. 2023, 11, 949. [Google Scholar] [CrossRef]
  65. Lindsay, I.; Mkrtchyan, A. Free and Low-Cost Aerial Remote Sensing in Archaeology: An Overview of Data Sources and Recent Applications in the South Caucasus. Adv. Archaeol. Pract. 2023, 11, 1–20. [Google Scholar] [CrossRef]
  66. Uribe, P.; Pérez-Cabello, F.; Bea, M.; De La Riva, J.; Martín-Bueno, M.; Sáenz, C.; Serreta, A.; Magallón, M.A.; Angás, J. Aerial mapping and multi-sensors approaches from remote sensing applied to the roman archaeological heritage. Int. Arch. Photogramm. Remote Sens. Spat. Inf. Sci. 2015, XL-5/W4, 461–467. [Google Scholar] [CrossRef]
  67. Agapiou, A.; Alexakis, D.D.; Hadjimitsis, D.G. Spectral sensitivity of ALOS, ASTER, IKONOS, LANDSAT and SPOT satellite imagery intended for the detection of archaeological crop marks. Int. J. Digit. Earth 2014, 7, 351–372. [Google Scholar] [CrossRef]
  68. Winton, H.; Horne, P. National archives for national survey programmes: NMP and the English heritage aerial photograph collection. Landsc. Through Lens. Aer. Photogr. Hist. Enviroment. Aer. Archaeol. Res. Group 2010, 2, 7–18. [Google Scholar]
  69. Cowley, D.C.; Stichelbaut, B.B. Historic aerial photographic archives for European archaeology. Eur. J. Archaeol. 2012, 15, 217–236. [Google Scholar] [CrossRef]
  70. Cowley, D.; Ferguson, L. Historic Aerial Photographs for Archaeology and Heritage Management. In Space Time and Place, Proceedings of the III International Conference on Remote Sensing in Archaeology, Tiruchirappalli, India, 17–21 August 2009; BAR International Series 2118; British Archaeological Reports Ltd.: Oxford, UK, 2010; pp. 17–21. [Google Scholar]
  71. Agapiou, A. Remote sensing heritage in a petabyte-scale: Satellite data and heritage Earth Engine© applications. Int. J. Digit. Earth 2017, 10, 85–102. [Google Scholar] [CrossRef]
  72. Pappu, S.; Akhilesh, K.; Ravindranath, S.; Raj, U. Applications of satellite remote sensing for research and heritage management in Indian prehistory. J. Archaeol. Sci. 2010, 37, 2316–2331. [Google Scholar] [CrossRef]
  73. Lasaponara, R.; Masini, N. Satellite Remote Sensing: A New Tool for Archaeology. In Proceedings of the I International EARSeL Workshop “Advances in Remote Sensing for Archaeology and Cultural Heritage Management”, Rome, Italy, 30 September 2008; Springer: Dordrecht, The Netherlands, 2012; p. 366. [Google Scholar] [CrossRef]
  74. Agapiou, A.; Hadjimitsis, D.G.; Alexakis, D.D.; Papadavid, G. Examining Phenol. Cycle Barley (Hordeum Vulgare) Using Satell. Situ Spectroradiometer Meas. Detect. Buried Archaeol. Remain. GISci. Remote Sens. 2012, 49, 854–872. [Google Scholar] [CrossRef]
  75. Agapiou, A.; Lysandrou, V.; Sarris, A.; Papadopoulos, N.; Hadjimitsis, D.G. Fusion of satellite multispectral images based on ground-penetrating radar (GPR) data for the investigation of buried concealed archaeological remains. Geosciences 2017, 7, 40. [Google Scholar] [CrossRef]
  76. Agapiou, A.; Lysandrou, V. Remote sensing archaeology: Tracking and mapping evolution in European scientific literature from 1999 to 2015. J. Archaeol. Sci. Rep. 2015, 4, 192–200. [Google Scholar] [CrossRef]
  77. Tapete, D.; Cigna, F. Trends and perspectives of space-borne SAR remote sensing for archaeological landscape and cultural heritage applications. J. Archaeol. Sci. Rep. 2017, 14, 716–726. [Google Scholar] [CrossRef]
  78. Cuca, B.; Zaina, F.; Tapete, D. Monitoring of Damages to Cultural Heritage across Europe Using Remote Sensing and Earth Observation: Assessment of Scientific and Grey Literature. Remote Sens. 2023, 15, 3748. [Google Scholar] [CrossRef]
  79. Argyrou, A.; Agapiou, A. A Review of Artificial Intelligence and Remote Sensing for Archaeological Research. Remote Sens. 2022, 14, 6000. [Google Scholar] [CrossRef]
  80. Luo, L.; Wang, X.; Guo, H.; Lasaponara, R.; Zong, X.; Masini, N.; Wang, G.; Shi, P.; Khatteli, H.; Chen, F.; et al. Airborne and spaceborne remote sensing for archaeological and cultural heritage applications: A review of the century (1907–2017). Remote Sens. Environ. 2019, 232, 111280. [Google Scholar] [CrossRef]
  81. Jebur, A.K. The Techniques of Cultural Heritage: Literature Review. Saudi J. Civ. Eng. 2022, 6, 108–114. [Google Scholar] [CrossRef]
  82. Magnani, M.; Douglass, M.; Schroder, W.; Reeves, J.; Braun, D.R. The digital revolution to come: Photogrammetry in archaeological practice. Am. Antiq. 2020, 85, 737–760. [Google Scholar] [CrossRef]
  83. Marín-Buzón, C.; Pérez-Romero, A.; Lopez-Castro, J.L.; Ben Jerbania, I.; Manzano-Agugliaro, F. Photogrammetry as a new scientific tool in archaeology: Worldwide research trends. Sustainability 2021, 13, 5319. [Google Scholar] [CrossRef]
  84. Pepe, M.; Alfio, V.S.; Costantino, D. UAV platforms and the SfM-MVS approach in the 3D surveys and modelling: A review in the cultural heritage field. Appl. Sci. 2022, 12, 12886. [Google Scholar] [CrossRef]
  85. Lo Brutto, M.; Garraffa, A.; Meli, P. UAV platforms for cultural heritage survey: First results. ISPRS Ann. Photogramm. Remote Sens. Spat. Inf. Sci. 2014, 2, 227–234. [Google Scholar] [CrossRef]
  86. Campana, S.; Sordini, M.; Remondino, F. Integration of geomatics techniques for the digital documentation of heritage areas. In Proceedings of the 1st International EARSeL Workshop, CNR, Rome, Italy, 30 September 2008; Volume 30, pp. 309–312. [Google Scholar]
  87. Bitelli, G.; Dellapasqua, M.; Girelli, V.A.; Sanchini, E.; Tini, M.A. 3D Geomatics Techniques for an integrated approach to Cultural Heritage knowledge: The case of San Michele in Acerboli’s Church in Santarcangelo di Romagna. Int. Arch. Photogramm. Remote Sens. Spat. Inf. Sci. 2017, 42, 291–296. [Google Scholar] [CrossRef]
  88. Vacca, G.; Dessi, A. Low-Cost Geomatics Surveys for Emergency Interventions on Cultural Heritage. The Case of Historic Wall in Cagliari. In International Conference on Computational Science and Its Applications; Springer Nature: Cham, Switzerland, 2023; pp. 650–664. [Google Scholar]
  89. Sánchez-Aparicio, L.J.; Riveiro, B.; Gonzalez-Aguilera, D.; Ramos, L.F. The combination of geomatic approaches and operational modal analysis to improve calibration of finite element models: A case of study in Saint Torcato Church (Guimarães, Portugal). Constr. Build. Mater. 2014, 70, 118–129. [Google Scholar] [CrossRef]
  90. Girelli, V.A.; Borgatti, L.; Dellapasqua, M.; Mandanici, E.; Spreafico, M.C.; Tini, M.A.; Bitelli, G. Integration of geomatics techniques for digitizing highly relevant geological and cultural heritage sites: The case of San Leo (Italy). Int. Arch. Photogramm. Remote Sens. Spat. Inf. Sci. 2017, 42, 281–286. [Google Scholar] [CrossRef]
  91. Sansoni, G.; Trebeschi, M.; Docchio, F. State-of-the-art and applications of 3D imaging sensors in industry, cultural heritage, medicine, and criminal investigation. Sensors 2009, 9, 568–601. [Google Scholar] [CrossRef]
  92. Cuca, B.; Hadjimitsis, D.G. Space technology meets policy: An overview of Earth Observation sensors for monitoring of cultural landscapes within policy framework for Cultural Heritage. J. Archaeol. Sci. Rep. 2017, 14, 727–733. [Google Scholar] [CrossRef]
  93. Salleh, S.Z. Bibliometric and content analysis on publications in digitization technology implementation in cultural heritage for recent five years (2016–2021). Digit. Appl. Archaeol. Cult. Herit. 2022, 25, e00225. [Google Scholar] [CrossRef]
  94. Scopus Engine. Available online: https://www.scopus.com/search/form.uri?display=basic&zone=header&origin=AuthorProfile#basic (accessed on 8 August 2023).
  95. About Scopus. Available online: https://blog.scopus.com/about#:~:text=Scopus%20is%20a%20source-neutral,promote%20ideas%2C%20people%20and%20institutions (accessed on 8 August 2023).
  96. Jamil, A.H.; Yakub, F.; Azizan, A.; Roslan, S.A.; Zaki, S.A.; Ahmad, S.A. A Review on Deep Learning Application for Detection of Archaeological Structures. J. Adv. Res. Appl. Sci. Eng. Technol. 2022, 26, 7–14. [Google Scholar]
  97. Ostoić, S.K.; Salbitano, F.; Borelli, S.; Verlič, A. Urban forest research in the Mediterranean: A systematic review. Urban For. Urban Green 2018, 31, 185–196. [Google Scholar] [CrossRef]
  98. Malanski, P.D.; Dedieu, B.; Schiavi, S. Mapping the research domains on work in agriculture. A bibliometric review from Scopus database. J. Rural. Stud. 2021, 81, 305–314. [Google Scholar] [CrossRef]
  99. Burnham, J.F. Scopus database: A review. Biomed. Digit. Libr. 2006, 3, 1–8. [Google Scholar] [CrossRef]
  100. Salisbury, L. Web of Science and Scopus: A comparative review of content and searching capabilities. Charlest. Advis. 2009, 11, 5–18. [Google Scholar]
  101. Pranckutė, R. Web of Science (WoS) and Scopus: The titans of bibliographic information in today’s academic world. Publications 2021, 9, 12. [Google Scholar] [CrossRef]
  102. Page, M.J.; Moher, D.; McKenzie, J.E. Introduction to PRISMA 2020 and implications for research synthesis methodologists. Res. Synth. Methods 2022, 13, 156–163. [Google Scholar] [CrossRef]
  103. Microsoft Corporation. Microsoft Excel. 2023. Available online: https://office.microsoft.com/excel (accessed on 8 August 2023).
  104. SankeyMATIC. Available online: https://sankeymatic.com/about/ (accessed on 8 August 2023).
  105. Van Eck, N.J.; Waltman, L. VOSviewer Manual, Manual for VOSviewer Version; Volume 1, University of Leiden: Leiden, The Netherlands, 2011. [Google Scholar]
  106. VOSviewer 1.6.19. Available online: https://www.vosviewer.com (accessed on 8 August 2023).
  107. Chen, C.; Ibekwe-SanJuan, F.; Hou, J. The structure and dynamics of co-citation clusters: A multiple-perspective co-citation analysis. J. Am. Soc. Inf. Sci. Technol. 2010, 61, 1386–1409. [Google Scholar] [CrossRef]
  108. Chen, C. CiteSpace II: Detecting and visualizing emerging trends and transient patterns in scientific literature. J. Am. Soc. Inf. Sci. Technol. 2006, 57, 359–377. [Google Scholar] [CrossRef]
  109. CiteSpace. Interpret Results. Available online: https://sites.google.com/site/citespace101/first-example/4-3-interpret-results (accessed on 8 August 2023).
  110. Kleinberg, J. Bursty and hierarchical structure in streams. In Proceedings of the Eighth ACM SIGKDD International Conference on Knowledge Discovery and Data Mining, Edmonton, AB, Canada, 23–26 July 2002; pp. 91–101. [Google Scholar]
Figure 1. Overall methodology applied on Scopus.
Heritage 06 00357 g001
Figure 2. Total number of documents published after 2000 per year.
Heritage 06 00357 g002
Figure 3. Distribution of published documents per scientific field in percentage.
Heritage 06 00357 g003
Figure 4. Documents per type of publication.
Heritage 06 00357 g004
Figure 5. Top 20 journals and conference proceeding dealing with geomatic sensors for heritage.
Heritage 06 00357 g005
Figure 6. Top 15 thematic keywords used for “review” type papers.
Heritage 06 00357 g006
Figure 7. Co-occurrence analysis of authors’ keywords as published in all document’s papers.
Heritage 06 00357 g007
Figure 8. Co-occurrence analysis of authors’ keywords as published in review papers.
Heritage 06 00357 g008
Figure 9. Productivity of related documents per country and their links with other regions.
Heritage 06 00357 g009
Figure 10. Top 20 institutions regarding productivity in terms of heritage documentation and monitoring.
Heritage 06 00357 g010
Table 1. Information extracted from Scopus engine.
NoInformation Extracted from Scopus
1.Author(s)
2.Document title
3.Year
4.EID (Scopus Electronic Identifier)
5.Source title
6.Volume, issues, pages
7.Citation count
8.Source and document type
9.Publication stage
10.DOI
11.Open access
12.Affiliations
13.Publisher
14.Language of original document
15.Abstract
16.Author keywords
17.Indexed keywords
Table 2. Cluster labelling based on the keywords of the selected documents.
ClusterLabel
#0remote sensing; archaeology; lidar; historical geography; supervised classifiers; aerial vehicles; system program; supervised classifiers; spectral analysis
#1terrestrial laser; cultural heritage; dimensional computer graphics; system program; computer vision; dimensional computer; three dimensional
#2dimensional computer; human computer; interactive computer; damage detection; damage comparison; dimensional computer graphics; massive point; least squares
Table 3. List of keywords (top 25) that are associated with citation bursts (red color indicates the period where the specific keyword is substantial refer to the literature).
KeywordsYearStrengthBeginEnd2010–2022
three dimensional201083.7620102013▃▃▃▃▂▂▂▂▂▂▂▂▂
sensors201032.920102013▃▃▃▃▂▂▂▂▂▂▂▂▂
calibration201025.8820102016▃▃▃▃▃▃▃▂▂▂▂▂▂
image processing201023.2520102016▃▃▃▃▃▃▃▂▂▂▂▂▂
satellites201020.2220102016▃▃▃▃▃▃▃▂▂▂▂▂▂
design201019.4220102012▃▃▃▂▂▂▂▂▂▂▂▂▂
research201017.8720102013▃▃▃▃▂▂▂▂▂▂▂▂▂
nasa201016.6420102012▃▃▃▂▂▂▂▂▂▂▂▂▂
photography201126.9820112015▃▃▃▃▃▂▂▂▂▂▂▂
laser scanner201119.0920112013▃▃▃▂▂▂▂▂▂▂▂▂
terrestrial laser scanning201213.7620122017▂▂▃▃▃▃▃▃▂▂▂▂▂
surface analysis201033.2120132017▂▂▂▃▃▃▃▃▂▂▂▂▂
system program documentation201319.4420132015▂▂▂▃▃▃▂▂▂▂▂▂▂
spectroscopy201315.420132014▂▂▂▃▃▂▂▂▂▂▂▂▂
information management201216.6920152019▂▂▂▂▂▃▃▃▃▃▂▂▂
3 d modeling201216.2420152017▂▂▂▂▂▃▃▃▂▂▂▂▂
close-range photogrammetry201018.4120162017▂▂▂▂▂▂▃▃▂▂▂▂▂
structure from motion201325.4520172019▂▂▂▂▂▂▂▃▃▃▂▂▂
uav201419.2720172022▂▂▂▂▂▂▂▃▃▃▃▃▃
antennas201736.9320182022▂▂▂▂▂▂▂▃▃▃▃▃
heritage201616.0320182022▂▂▂▂▂▂▂▂▃▃▃▃▃
landscape archaeology201916.1820192020▂▂▂▂▂▂▂▂▂▃▃▂▂
textures201215.820192020▂▂▂▂▂▂▂▂▂▃▃▂▂
monitoring201014.9320192022▂▂▂▂▂▂▂▂▂▃▃▃▃
deep learning202031.2820202022▂▂▂▂▂▂▂▂▂▂▃▃▃
Disclaimer/Publisher’s Note: The statements, opinions and data contained in all publications are solely those of the individual author(s) and contributor(s) and not of MDPI and/or the editor(s). MDPI and/or the editor(s) disclaim responsibility for any injury to people or property resulting from any ideas, methods, instructions or products referred to in the content.

