Article

Computed Tomography Analysis of the Manufacture of Cast Head-Bust Figurines by Patricia ‘Pat’ Elvins (1922–2011)

by
Dirk H. R. Spennemann
1,* and
Clare L. Singh
2
1
Gulbali Institute, Charles Sturt University, P.O. Box 789, Albury, NSW 2640, Australia
2
School of Dentistry and Medical Sciences, Charles Sturt University, Locked Bag 588, Wagga Wagga, NSW 2678, Australia
*
Author to whom correspondence should be addressed.
Heritage 2023, 6(2), 2268-2291; https://doi.org/10.3390/heritage6020120
Submission received: 19 December 2022 / Revised: 7 February 2023 / Accepted: 15 February 2023 / Published: 20 February 2023
(This article belongs to the Special Issue Non-invasive Technologies Applied in Cultural Heritage)

Abstract

:
The Alice Springs sculptor Patricia Elvins created a number of busts of Indigenous Australian men, women, and children, which were distributed as casts for the gift and souvenir market. Produced between the early-1960s and the early-1990s, these varnished casts exist with four different artists’ signatures, representing collaboration with different production potters who produced the casts. Macroscopic analysis shows significant differences in weight between casts of the same bust. CT scanning was carried out to understand the make-up of these casts and to illuminate differences in production techniques. The scanning revealed that all figurines were cast, but that casting techniques varied not only between production potters but also among figurines of the same potter. It revealed differences in the densities of the casting material, both between and within specimens, suggesting that production was not standardized but occurred in smaller batches, possibly on demand of low-volume sales stock. The study has shown the potential of non-destructive CT scanning to go beyond this and serve as a tool to examine the casting process itself as well as to contribute to an understanding of the nature of the plasters used.

1. Introduction

In Australia, the period of the late-1930s to mid-1960s was a time when State and Federal governments engaged in a systematic attempt to assimilate Indigenous Australian peoples into ‘mainstream’ Anglo-Celtic culture though the forced removal of children of part Indigenous Australian ancestry from their parents and education in State-sponsored homes (‘Stolen Generation’) [1]. At the same time, some anthropologists and curators of Indigenous Australian material culture held in museums began to promote Indigenous Australian motifs as a national resource of inspiration [2].
Following World War II, non-Indigenous artists, often recent European arrivals of non-Anglo-Celtic background, widely appropriated Indigenous Australian cultural motifs without asking for permission. These motifs were commonly decontextualized, isolated, and recombined to decorate magazine covers, posters, and, in particular, pottery [2]. Some of the pottery was decorated with culturally and racially stereotyped images of Indigenous Australians, portraying men as older, spear- and boomerang-carrying hunters. Women were often shown in a sexualized fashion while children are generally depicted as infantilized ideals untouched by any cultural influences bar nature [2,3]. Similar stereotyping occurred in table-top or wall-mounted sculptures, mainly heads, of Indigenous Australian men, women, and children. The majority of these were plaster-cast figurines (such as those by Alexander Takacs) or hollow face representations created by Takacs, Alva Stone, as well as a range of other artists.
The overwhelming majority of these artists lived in the metropolitan centers, primarily Sydney, and had obtained their knowledge of Indigenous Australian culture from looking at books and exhibits in the anthropological galleries of the state museums as well as talking to the curators [2]. None had lived in communities where they would have been knowingly exposed to Indigenous Australian people, while only few, if any, had visited such communities.
One of the exceptions is the Geelong (Victoria)-born sculptor Patricia ‘Pat’ Elvins (27 November 1922–12 September 2011). Trained as an artist at the Gordon Technical School (Geelong) and Melbourne Technical College, specializing in pottery, Elvins spent a year (1953–54) in Alice Springs (Northern Territory), working as a kitchen, house, and bar maid [4]. At the time, Alice Springs was a semi-remote community of some 4000 people [5]. She left, as, in her own words, she ‘could not hack the lifestyle’ [6]. She moved to Perth (Western Australia) where she worked from 1955 to 1956 as a designer of animal figurines for Darbyshire Pottery, a small but influential studio operated by Jean and Bill Darbyshire from 1946 to 1956 [7,8]. Following another short stint in Alice Springs in 1957 and a further art study in Geelong (1958 and 1962), Pat Elvins returned to Alice Springs for good [4]. There, she experimented with local clays and colors, producing her first artworks for the emerging tourist trade, which she perceived to be a significant future economic force [7]. Elvins decided to model the heads of local Indigenous Australian people ‘because [she had] always admired their faces, particularly before their features were coarsened by excessive drinking’ [9]. The production of the figurines depicting Indigenous Australians commenced in 1963. The first bust sculpted by Elvins was that of an Indigenous Australian woman of Maryvale Station, where Elvins was staying at the time [9]. Several busts and figurines followed. In a newspaper item in which she deplored that her work had been illegally copied (by creating a mold from one of her casts), Elvins noted that ‘my figurines are portraits of actual people, mainly Aborigines on Maryvale Station, and are the result of my having lived and worked among them…they are not something I copied out of a book’ [10].
While a number of individual artworks have been documented, both commissioned and commercial work [4], the majority of her works are plaster-cast figurines produced in molds. Acquired by tourists visiting Alice Springs, these figurines have been distributed across the globe as souvenirs and have become collectible items in their own right.
Much of the mechanics of the production of these plaster-cast figurines is unknown at this point. The figurines exist with four different hand-written artists’ signatures on their bases: ‘Pat Elvins|Alice Springs’; ‘E&B|Australia’; ‘E&M|Australia’; ‘E&P|Australia’. It appears that Elvins collaborated with production potters or casters who generated stock as needed. A newspaper item that discusses the sale of unauthorized copies of some of her statuettes in the early-1970s notes that, at that time, Pat Elvins had all her figurines cast by the Geelong art gallery proprietor George Beggs [10], which accounts for the figurines that are marked ‘E & B’. After Beggs, the production of casts was taken over by Chris Pepper, a production potter in Newcomb (Geelong) (marked ‘E & P’) [11]. The identity of the third collaborator is less clear, as the commonly noted attribution, Pat McMahon (marked ‘E & M’), cannot be independently verified. As several extra-large pieces of Elvins are marked ‘E&M Sculptures|Geelong|Australia’, it would appear that the production of all three casting series occurred in Geelong.
Preliminary examination of pieces or the same cast shape revealed significant differences in weight, not only between different signatures but also between examples with the same signature, while the overall dimensions remain the same (within 1–4 mm) [4]. The minimal variation in dimensions does not adequately explain the weight variations (where heavy pieces can weigh 40% more than the light pieces).
Three possible explanations for the weight differences can be envisaged:
(1)
The artist (caster) used a different compound for the matrix of the casts (e.g., dental stone vs. Plaster of Paris);
(2)
The artist included extraneous material (e.g., metal or stone) in the casts to increase the heft of the figurine and, thus, make it feel more substantial;
(3)
Or the core of the casts of lighter specimens is partially hollow.
As all figurines are heavily varnished, nondestructive external observation does not provide the required answers. As the integrity of the varnish forms an integral part of a figurine’s value, nondestructive techniques need to be employed.

1.1. Casting Compounds

Chalkware, i.e., figurines cast from a mixture of gypsum plaster (‘Plaster of Paris’), became ubiquitous from the late-nineteenth century onward, primarily in ecclesiastical settings. Initially used for larger figures, it also found application in smaller figurines. Mixed into a paste or slurry of varied viscosity (depending on the proportion of water mixed in), the Plaster of Paris mixture could be poured into molds where it set. The resulting casts could then be finished off by sanding and carving [12]. Chalkware was more suited for small sculptures and larger figurines than for small figurines as it was relatively soft and, thus, prone to damage when handling. Consequently, small figurines and other decorative objects were more commonly made from ceramic slipware that could also be cast in molds, air-dried, and, thus, hardened, before being decorated, glazed, and fired.
The properties of Plaster of Paris could be influenced by adding binding agents such as glue or a small amount of Portland cement, which would influence its hardness but also the ability to modify the surface of the final cast [13]. Other agents sped up or retarded the setting time of Plaster of Paris in the molds [13]. The surface of plaster casts could be hardened or sealed by immersing the final case in a borax solution or melted wax [13].
Another option for small figurines was to substitute Plaster of Paris with dental cements, which had been in existence since the 1870s (Sorel’s cement [14]). In an interview in the mid-1990s, Elvins stated that she used Patternstone for her first figurines [15]. Patternstone is a form of hydrostone or dental die stone, which had been developed for dentists to make casts of teeth (to design dentures). While Patternstone could be cast as easily as Plaster of Paris, it not only has a higher density and, thus, weight, but importantly possesses greater strength while, at the same time, allowing for the casting of finer features.

1.2. The Use of Computed Tomography (CT) in Heritage Studies

Clinical computed tomography (CT) was developed to examine anatomy in greater detail, and to allow for multi-planar examination than possible with standard X-ray technology. CT was seen as the most appropriate nondestructive means of examination of the figurines as CT allows not only for examining the internal appearance of an object at any angle and orientation but also for measuring the density of an object at 0.5 mm slices®.
For obvious reasons, CT-scanning has been widely used to examine Egyptian, South American, Medieval, and modern European mummies, both of humans and animals, in order to understand the anatomy and pathology of the person thus preserved, the grave goods that are included in the wrapping, or the animal species that was embalmed [16,17,18,19,20]. CT-scans have been used to examine, in a non-destructive manner, the dietary components of human coprolites dating to the Neolithic period [21].
Outside applications in physical anthropology, CT-scanning has been employed in the heritage field to examine the nature and distribution of plasters used in past repairs of fossil specimens [22], understanding the nature of internal fastenings to wooden sculptures [23] and music instruments [24,25], understanding the nature of cut marks on paleolithic antler implements [26], understanding the content of sealed Egyptian votiv boxes [27], and understanding the nature and distribution of insect (borer) damage inside a music instrument (wooden cornet) [23] as well as infested wooden beams removed from a historic bridge [28]. CT-scanning of historic wooden objects also allowed the assessment of cellular structure of the wood and, thus, determine the species of plant from which the wood derived [29] or the measure of a series of tree-ring widths for dendrochronological age determination [30,31,32].
In sculpture and plaster casts, the ability to examine an object at any angle and orientation, and to progressively ‘slice’ through that object, makes CT scanning a unique tool to not only identify metal or other armatures inside plaster sculptures (giving them internal stabilty), but also to examine the work progress in the creation of the plaster casts. Badde and Illerhaus could demonstate different densities of plasters, including the hardening of temporary surfaces in the plaster cast model for the Goethe-Schiller Monument in Weimar (Germany) or the plaster cast of a statue by Honoré Daumier [33]. Other examples demonstrate the presence and nature of relics inside wooden sculptures [34].
Unlike other studies, which could take samples of the plasters (as these were later additions and, thus, less significant or even intrusive) and, thus, could employ X-ray spectroscopy (EDX) and X-ray fluorescence (XRF) [22], it was not possible to take samples from the cast figurines of this study without damaging them. Thus, the study reported in this paper was confined to purely nondestructive examination.

2. Materials and Methods

2.1. The Samples

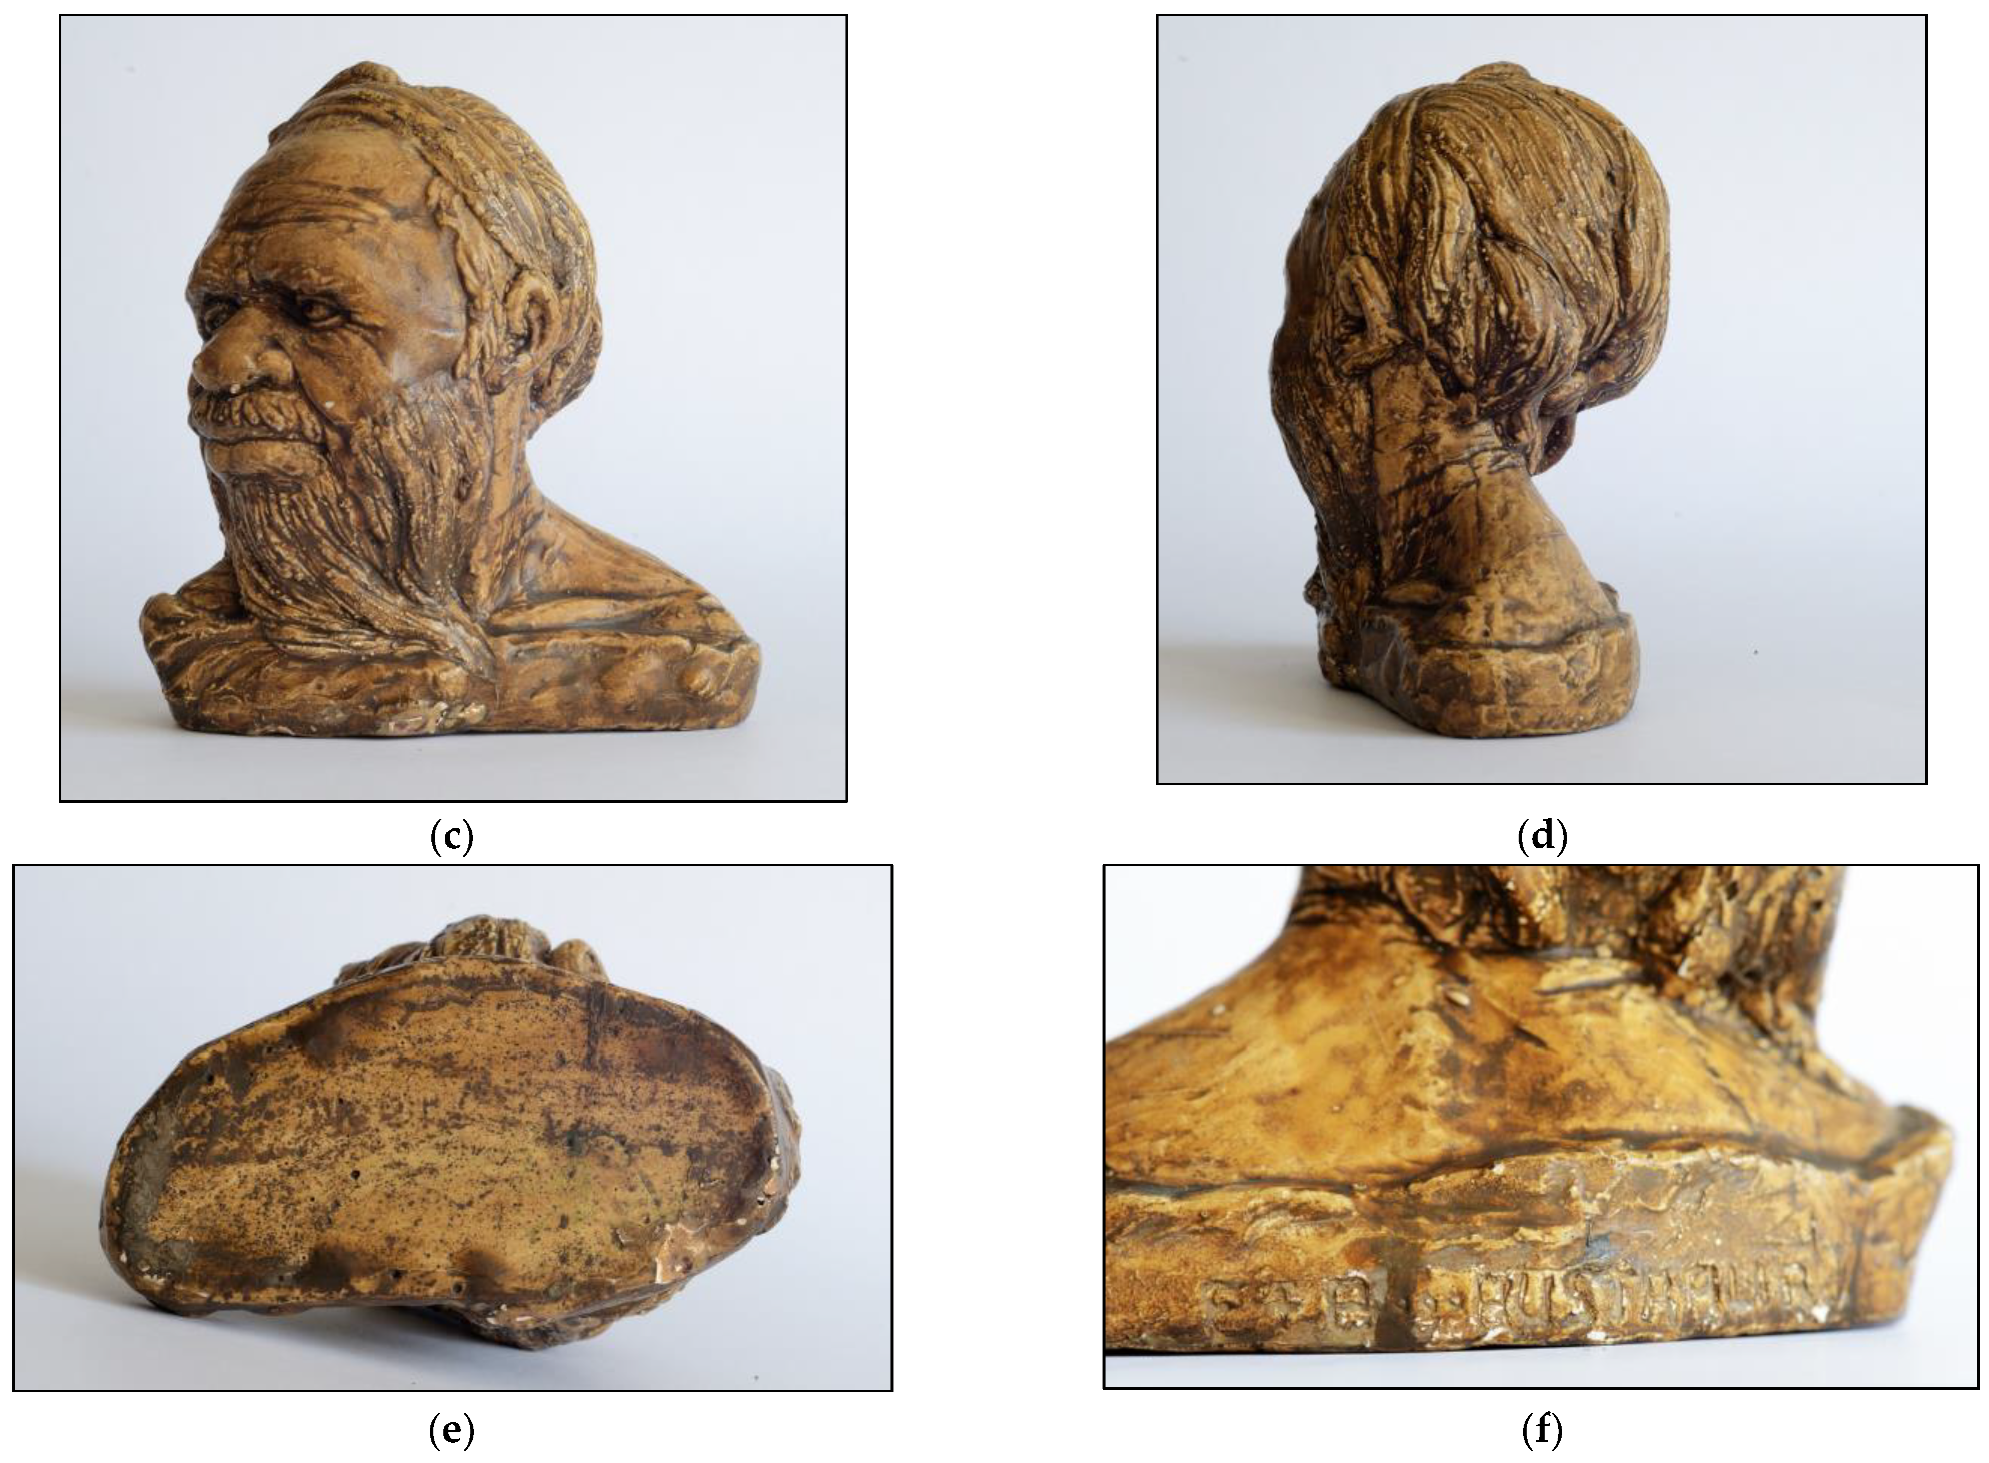
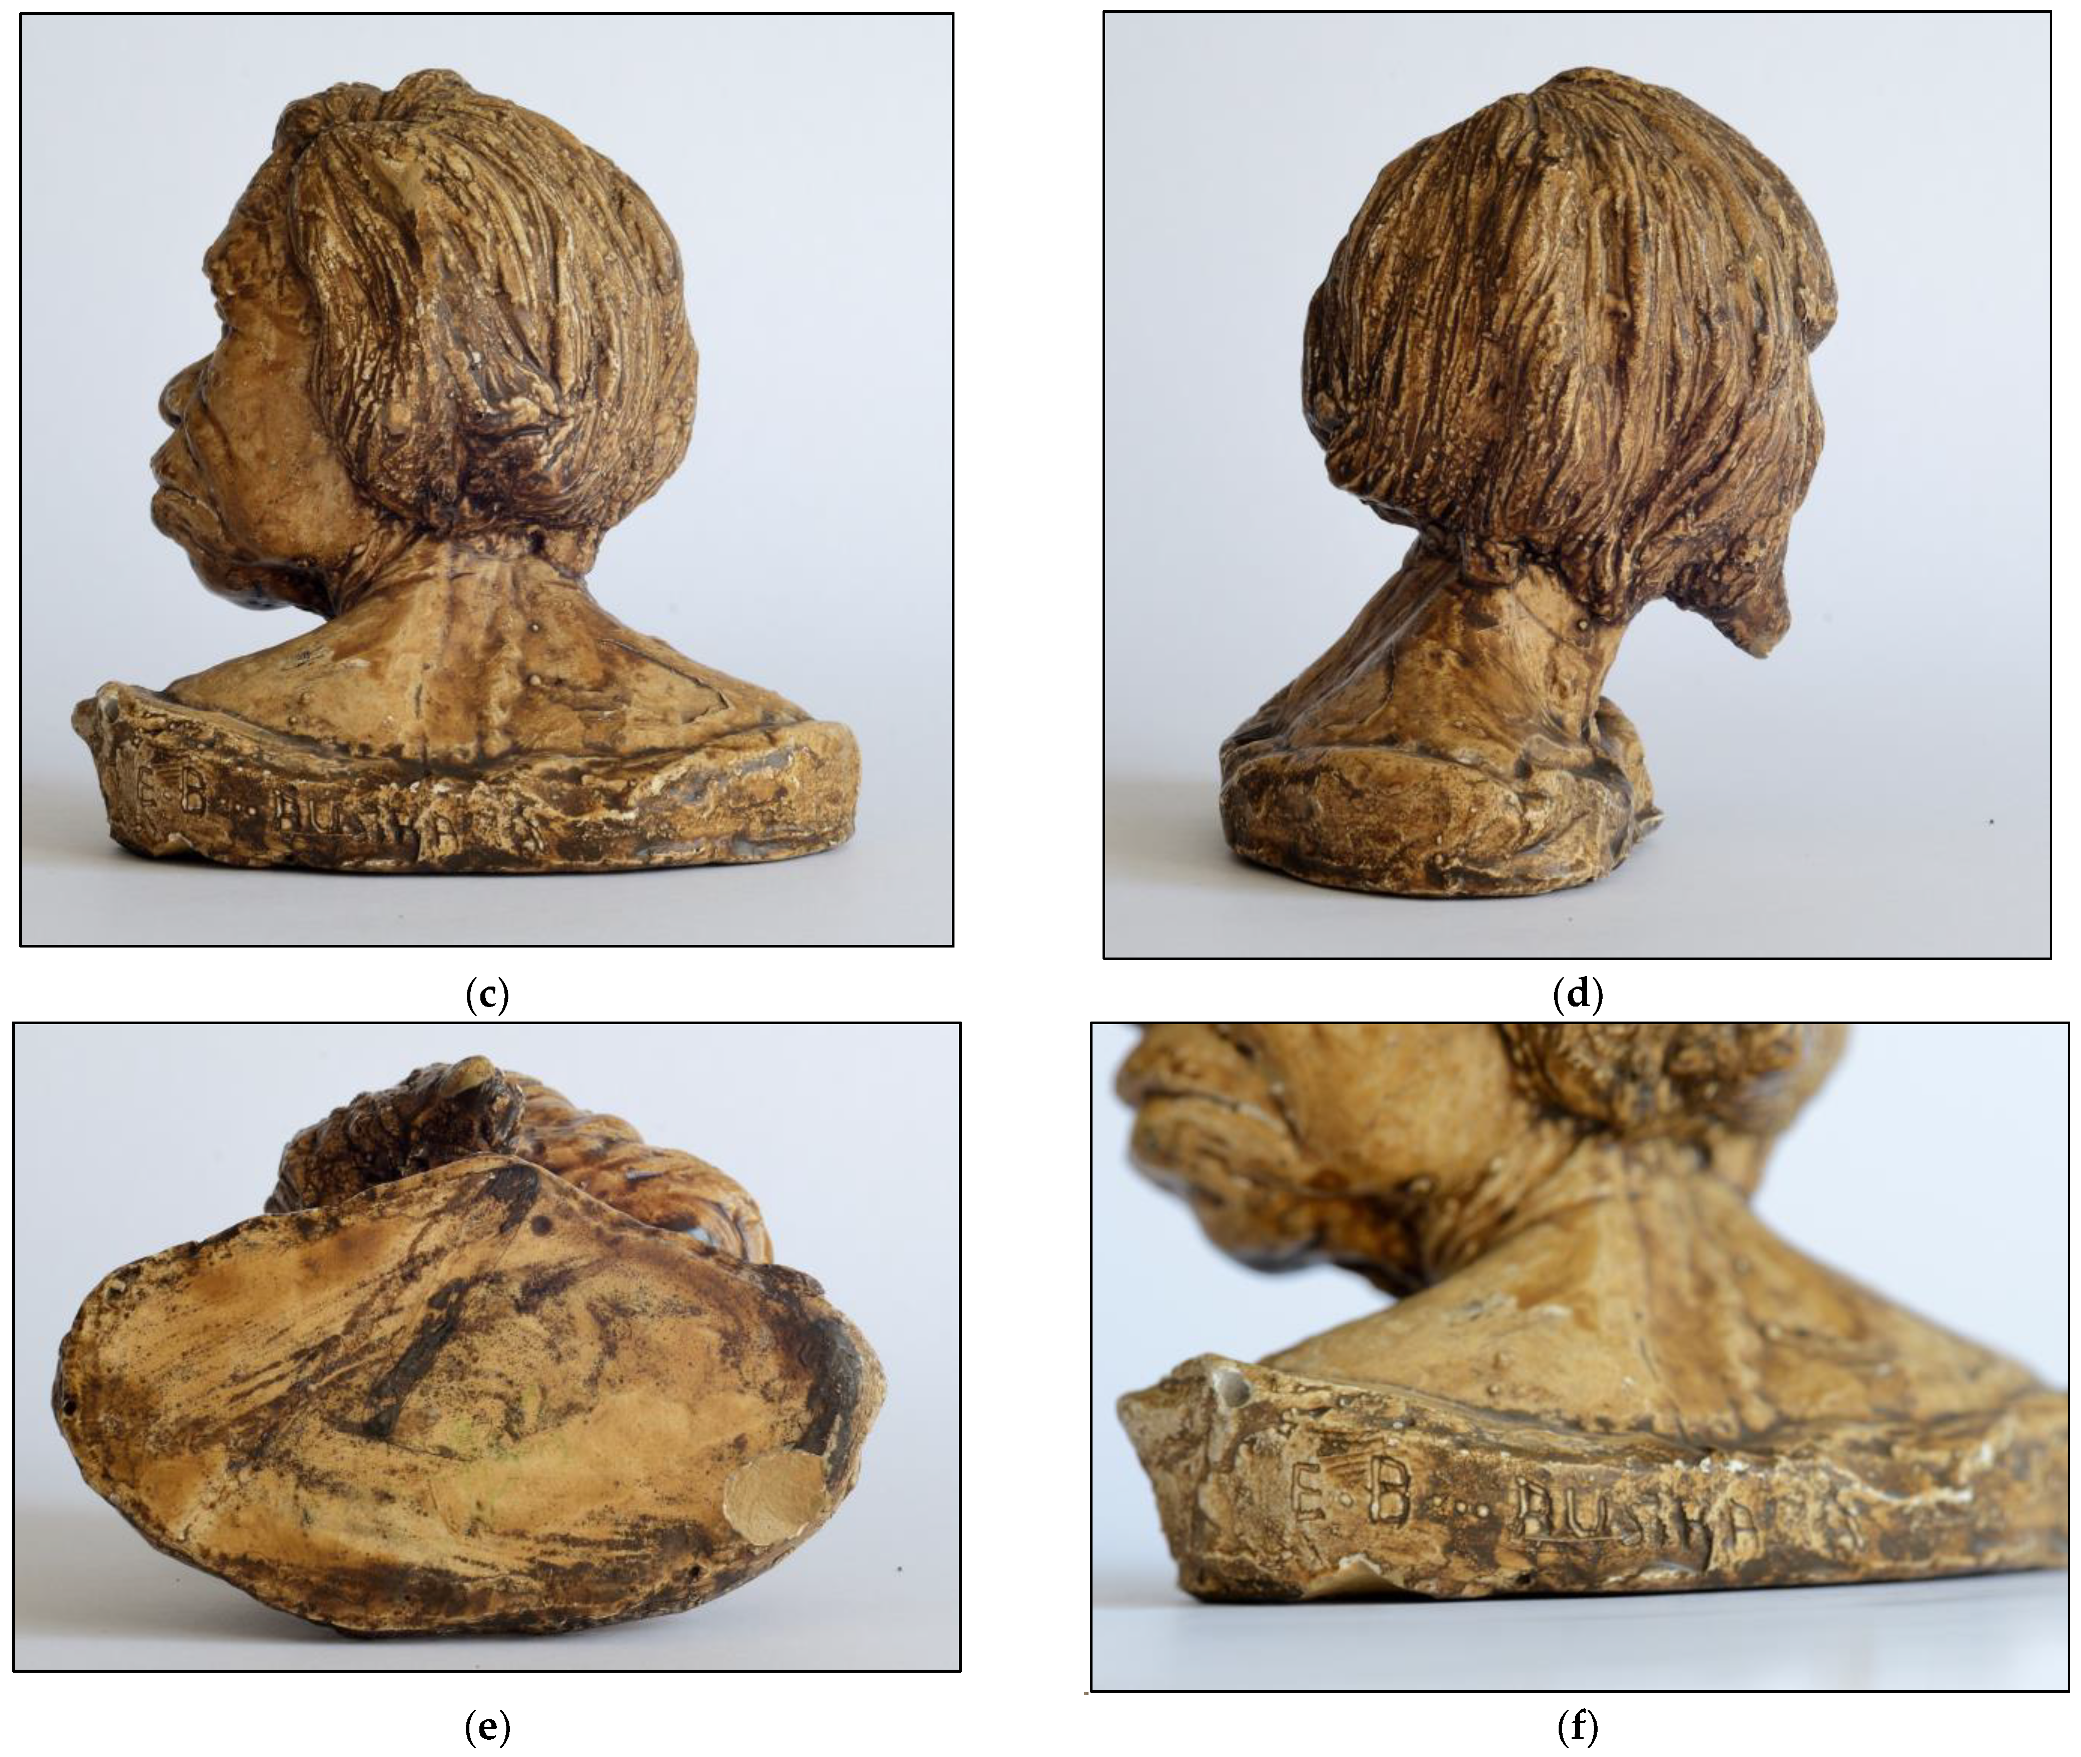
The samples of cast sculptures were sourced on the open market (eBay, Facebook) as part of a project examining the works of the artist [4], with the exception of OME1 that was kindly donated. In total, 8 examples of the cast of a male Indigenous Australian elder (Figure 1) and five examples of the cast of a female Indigenous Australian elder (Figure 2) could be assessed. Both sets include casts with E&B, E&M, and E&P signatures. In addition, one example of a cast of a male elder, signed ‘Pat Elvins’, could also be examined. The nature and dimensions of the casts are summarized in Table 1 The colors of a cast’s varnish were recorded using the Munsell Color Scheme [35,36].
In terms of production sequence, casts signed ‘Pat Elvins’ are the oldest, starting in 1963, followed by casts signed E&B (late-1960s–early-1970s), E&P (1970s), and finally E&M (1980s) [4].

2.2. Control Samples

To assess plaster densities against known types of plaster, a series of control targets were cast. Given that the artist mentioned in an interview that she had used dental plaster (Patternstone) for her figurines, at least in the early days [15], a range of dental plasters was sourced from several dental laboratories and cast into circular target discs of 15 mm thickness and 20–30 mm diameter. Three target discs were cast using Patternstone H, one using the prescribed proportions, and two with a higher water content to reduce viscosity. In addition, a standard sample of Plaster of Paris was sourced from a commercial hardware store. The characteristics and technical details of the control targets are set out in Table 2.

2.3. Instrumentation and Data Collection

The statues were non-destructively imaged on a clinical multi-detector row Canon Prime SP computed tomography scanner (80 × 0.5 mm). The X-ray tube energy was 80 kilovolts (kV) and was utilized to allow maximum image contrast. The statues were placed in the isocenter of the gantry and scanned on the smallest scan field of view (sFOV) available. A tube current of 80 milliamperes (mA) and scan time of approximately 5 s resulted in a spiral pitch factor of 0.638, creating overlapped volumes. Adaptive iterative dose reduction (AIDR 3D) was applied at a medium level to reduce image noise.
Scanning was performed by an Australian Health Practitioner Regulation Agency registered medical radiation practitioner in Wodonga Hospital. The data were reconstructed on bone and soft algorithms and transferred to and stored on Charles Sturt University’s picture archiving and communication system (PACS).

2.4. Data Interpretation and Measurements

The data were remotely accessed via a web-based interface of the Agfa HealthCare Enterprise Imaging XERO Viewer 8.0.1.24. The scans were examined in all three planes using the multiplanar reformats (MPRs) to view the images. As the scan volume was acquired via a detector array that consisted of 0.5 mm elements, this resulted in 0.5 mm isotropic voxels for viewing. From the bone algorithm volumes, MPRs were performed with statues being viewed in the axial, sagittal, and coronal planes. Three-dimensional rendered images were created using the soft algorithm volumes and viewed using Vitrea software (vers. 17.4). Vitrea is medical imaging software with a range of capabilities for viewing and measuring clinical scan data. The generic 3D gallery was selected due automatic segmentation of pixels, i.e., removal of any pixels that do not relate to the main object. This process is non-destructive, much like Photoshop—pixels may be added or subtracted in a manner similar to layers. Any pixels removed are added to a file that may be selected or unselected via a tick box. Volume data were selected using the ‘visible’ tool and then the MPR (with tint MPR), to ensure that all pixels relating to the statue were selected.
A Hounsfield unit (HU) describes the attenuation of ionizing radiation by an object and, hence, its density. Water will measure 0 HU while pure air will measure −1000 HU. The denser the object, the higher the HU. Densities within the statues were determined using the HU tool, throwing a circular mask over selected target areas (regions of interest, ROIs). This returned an averaged HU value for the selected region of interest, as well as standard deviation. Individual readings (HU, standard deviation, area in mm2) were recorded for several non-overlapping ROIs of the main matrix of the figurine, for areas of higher density and lower density (that may have contained air). While care was taken to create circles of similar area, this was not always possible. To account for the variation in area, the observed individual readings, which are averages in themselves, were combined into weighted averages (Table 3).
The density of globular cavities was assessed by selecting a vertical slice through the median line of the figurine and marking off a 40 mm line on the image. A screenshot of the image was imported into PowerPoint, the 40 × 40 mm mask superimposed, and the number of cavities counted out.
In a second, methodologically different approach, the volumes of the figurines were calculated using Vitrea software (see above), which also allowed for calculating Hounsfield units averaged across an entire figurine (Table 4).

2.5. Terminology

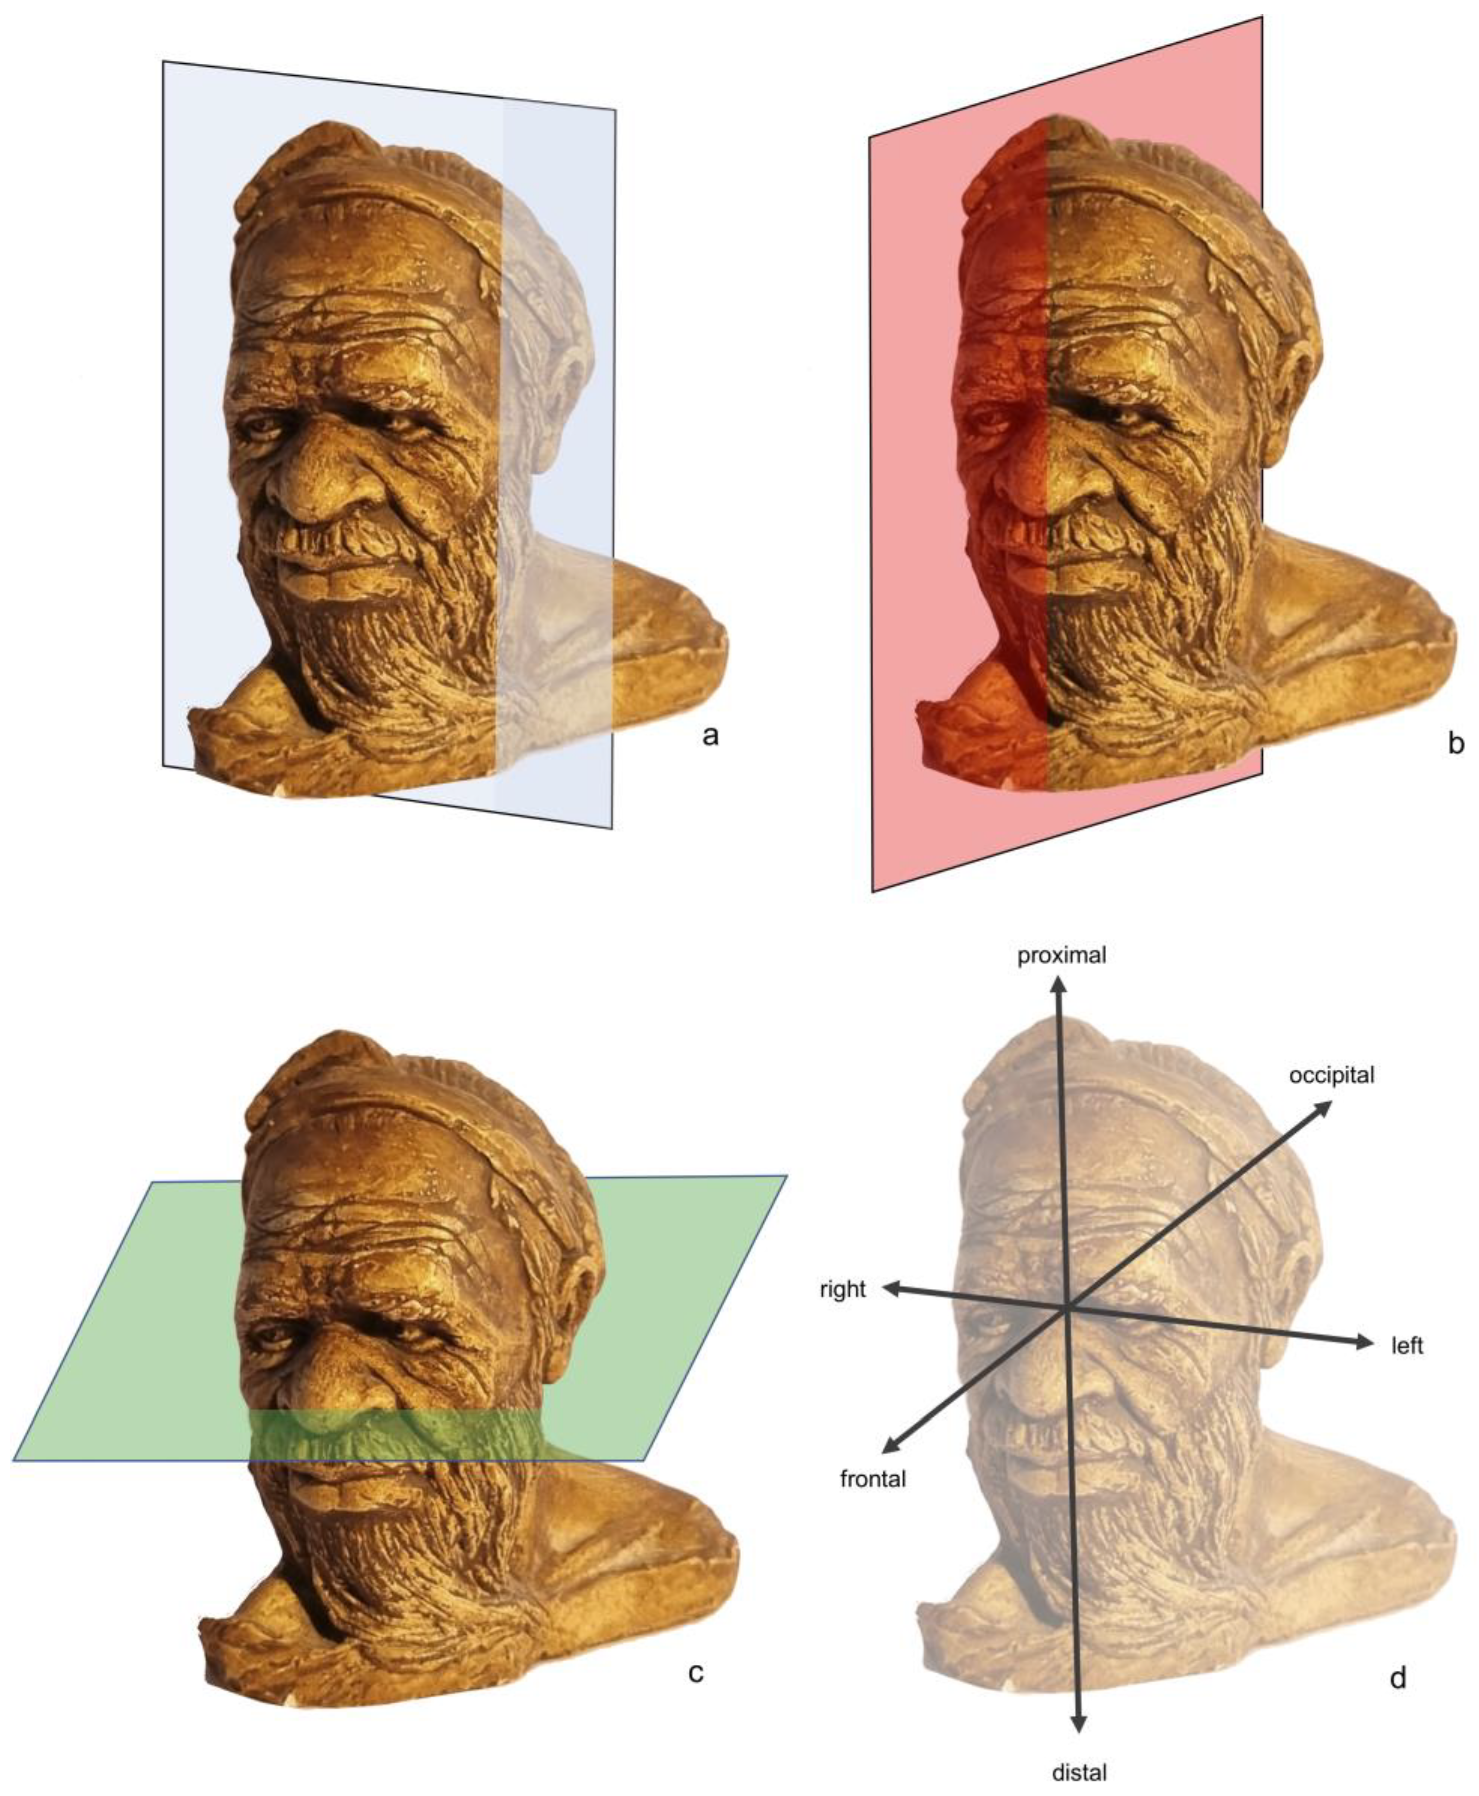
The terminology of the Computed Tomography planes and the orientation of cranial directions are explained in Figure 3 In addition, where appropriate, anatomical terms such as frontal, parietal, and occipital are used to describe locations on a figurine’s heads.

2.6. Statistics

The Hounsfield units of regions of interest as calculated by PACS are given as an average with standard deviation. Multiple, non-overlapping readings of ROIs were taken with the average weighted means of these ROI readings calculated in MS Excel. The significance of the differences in weighted means between different matrices within or between specimens was calculated using the Mentor emulator in Analytical Group’s SigTest calculator [37,38].

3. Results

3.1. Male Figurines

Eight male figurines were available for investigation: one ‘Pat Elvins’, two E&B, four E&M, and one E&P.
Specimen OMB1—Cast with signature ‘E & B’. The cast is comprised of a uniform matrix with numerous trapped air bubbles.
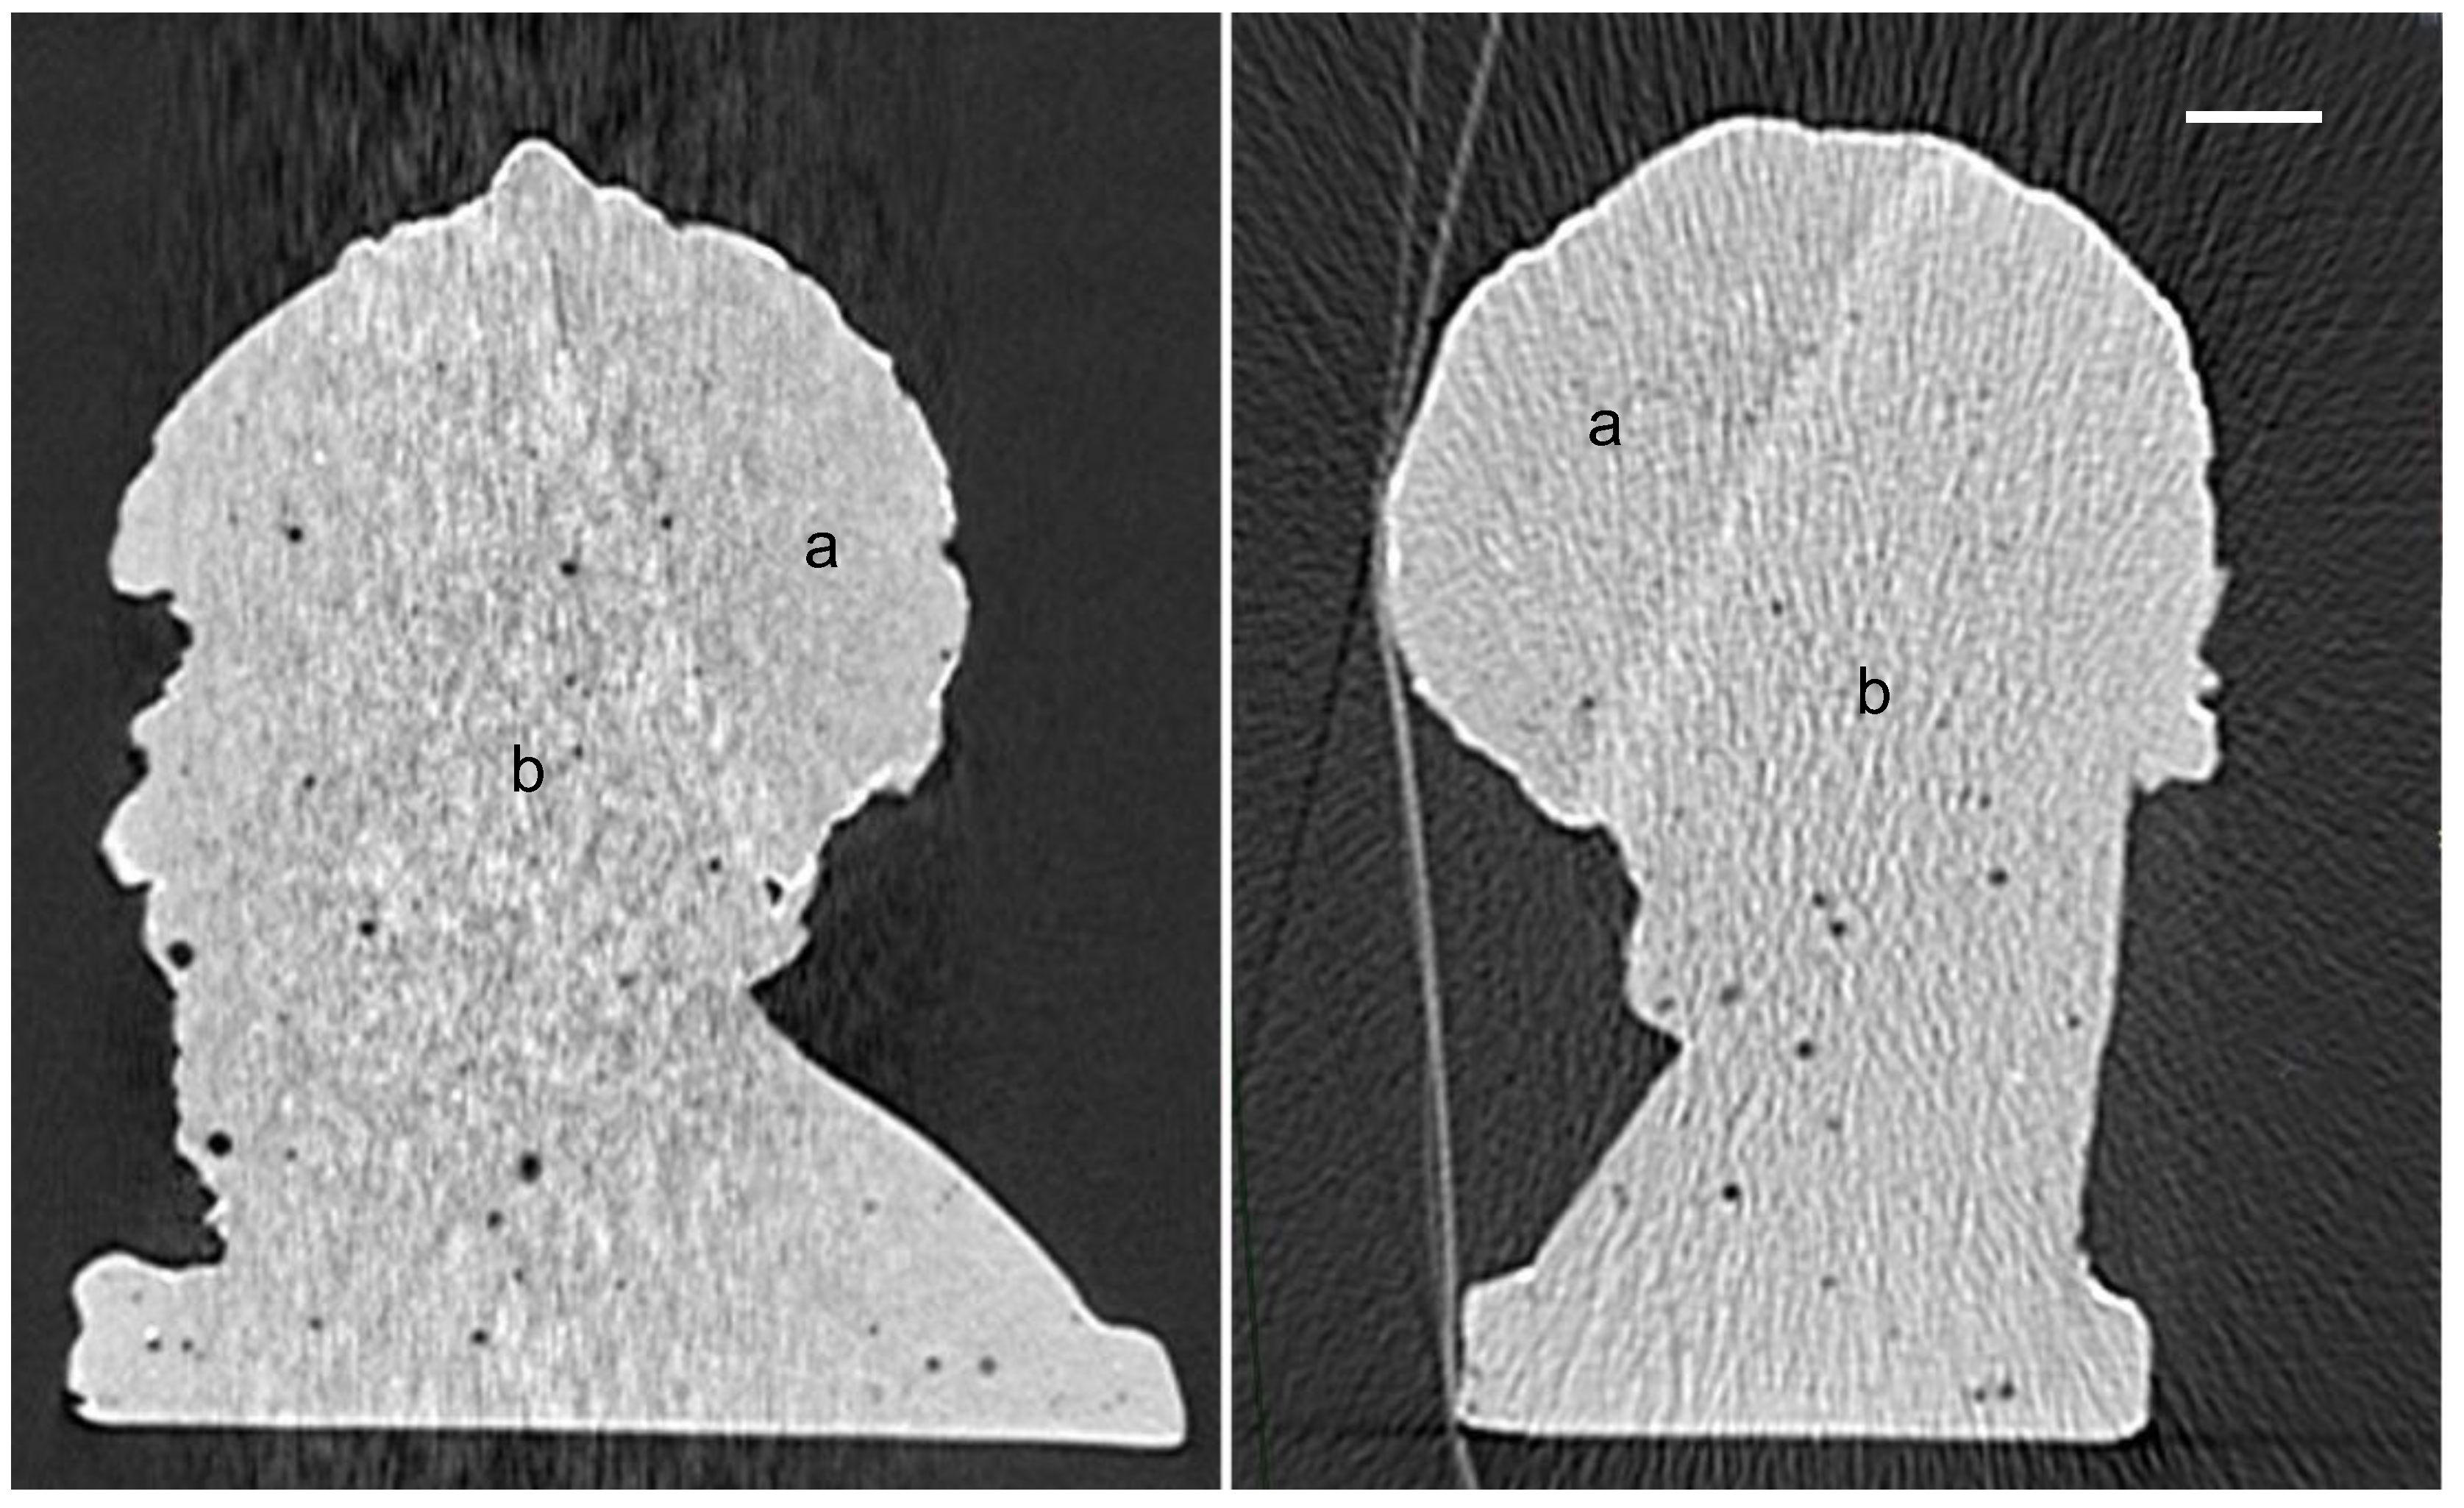
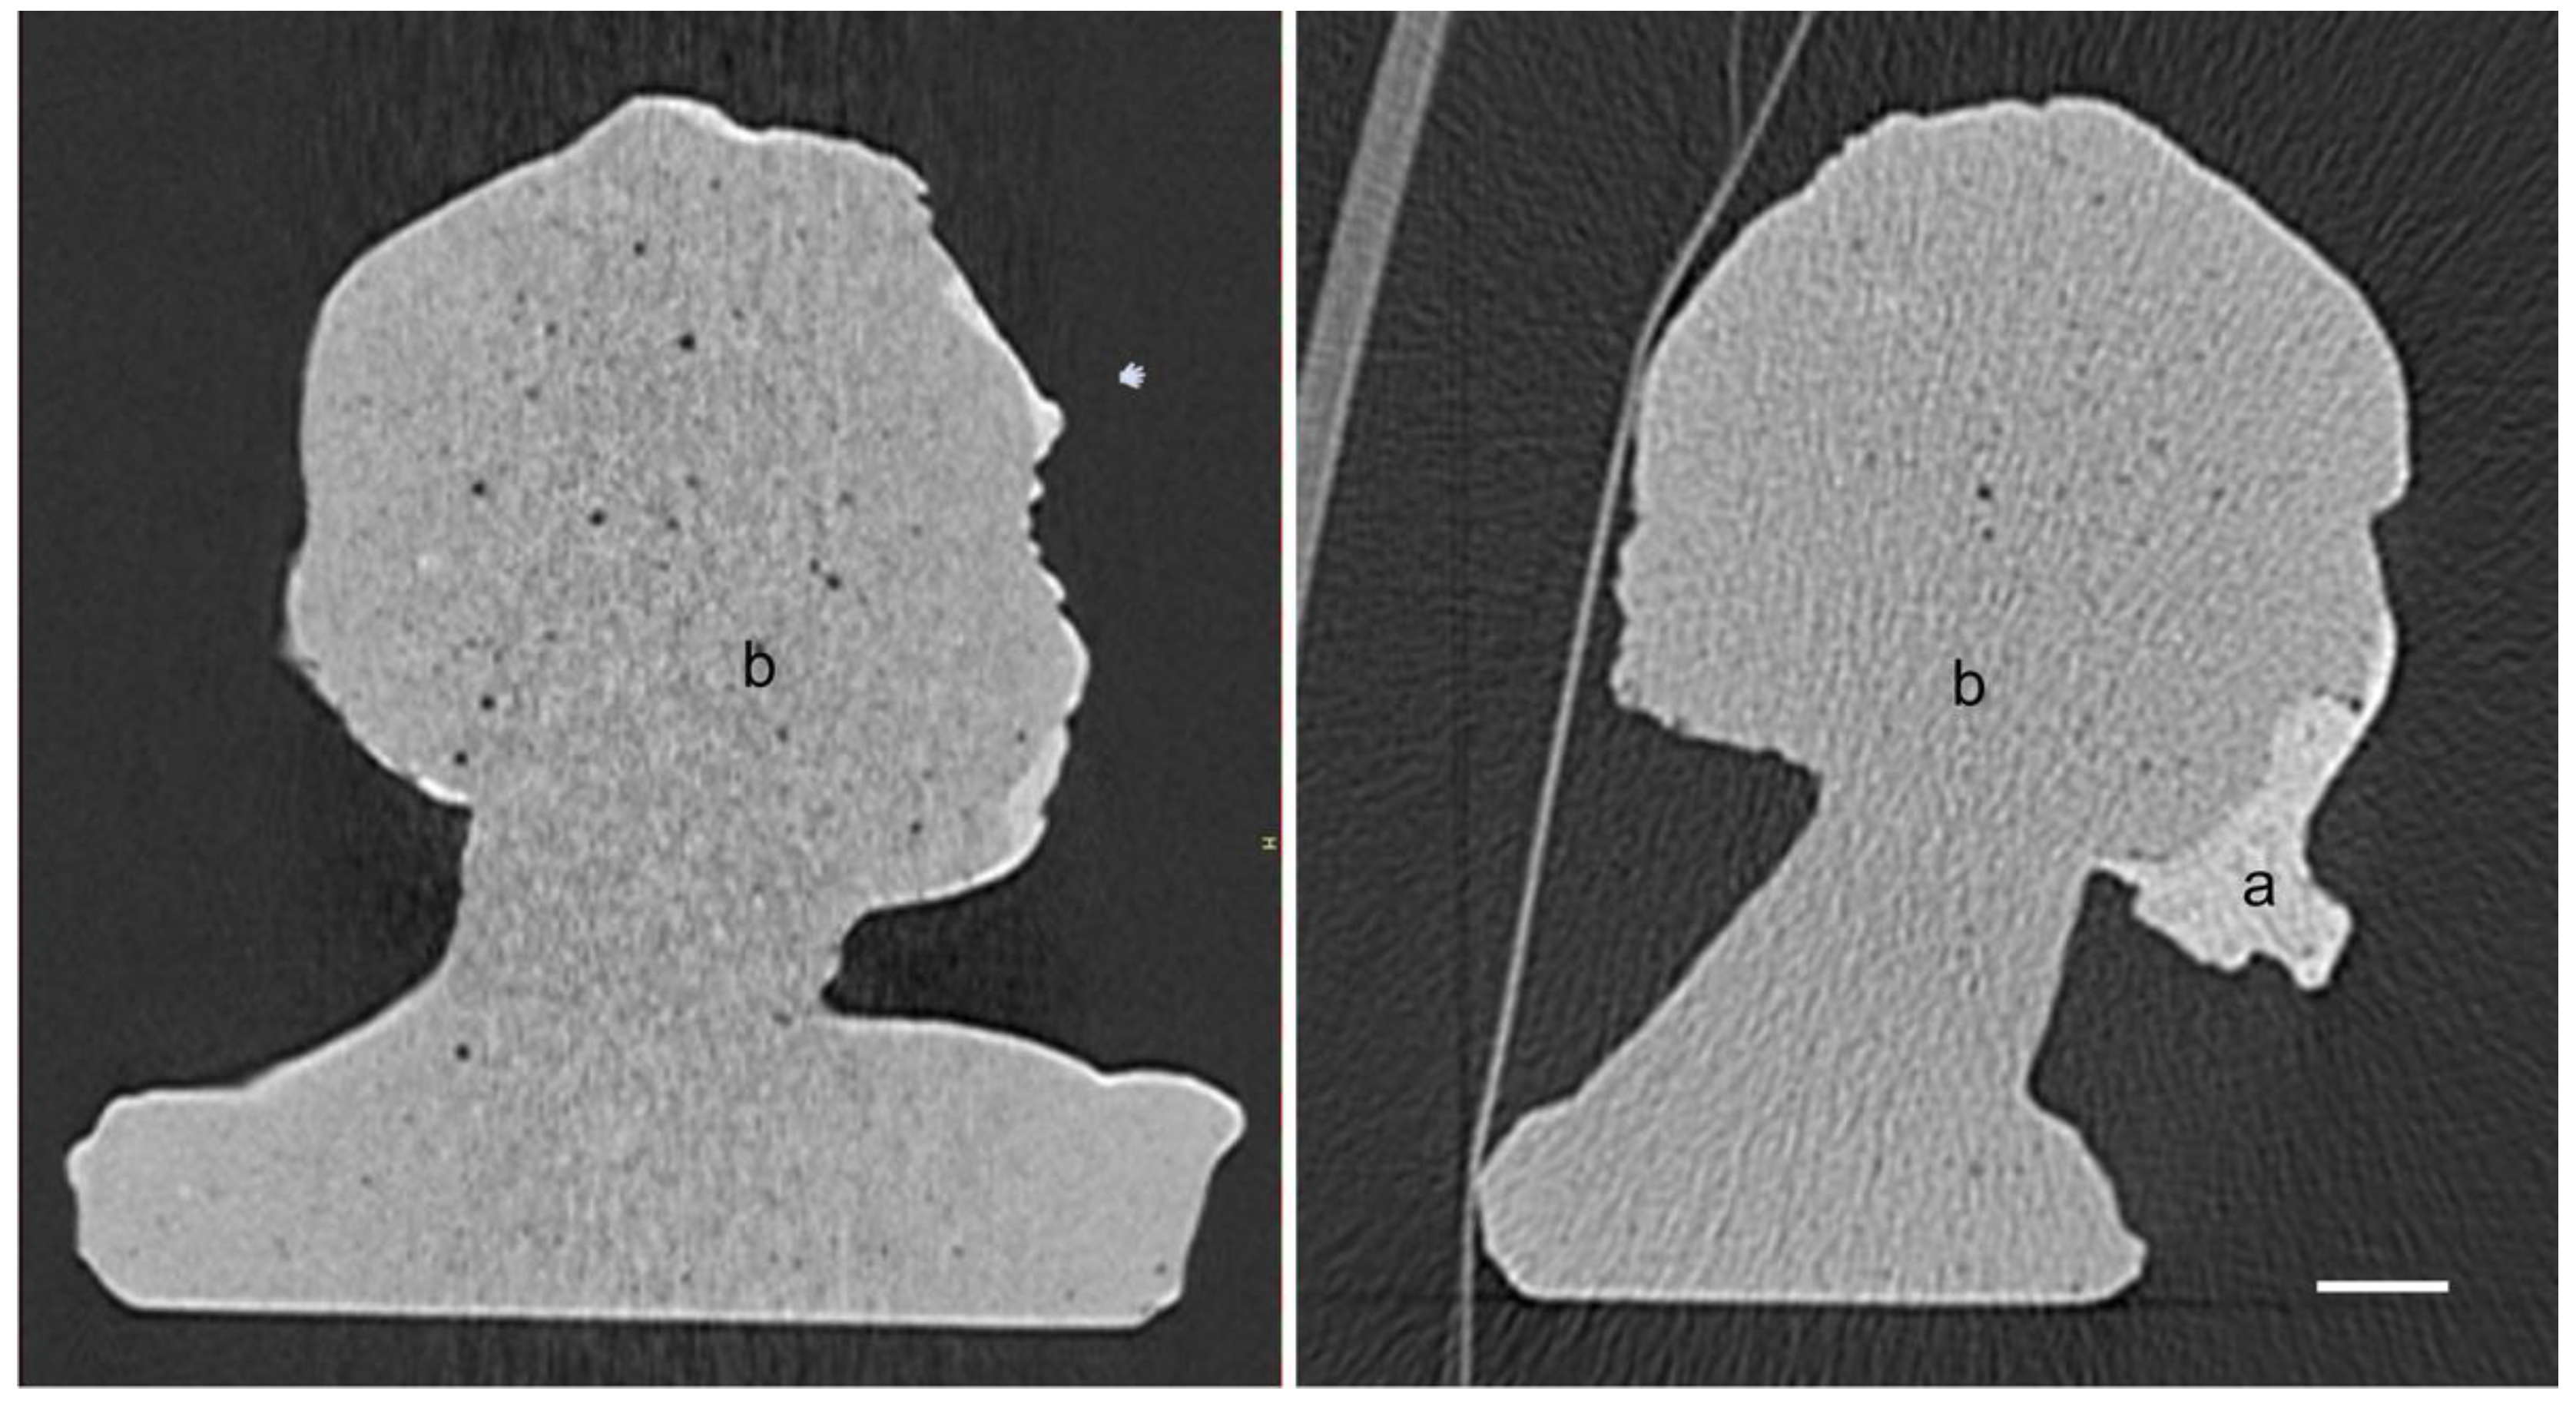
Specimen OMB2—Cast with signature ‘E & B’. The majority of the cast is comprised of a uniform matrix with a small number of trapped air bubbles. The figurine shows a large section of less dense matrix along the parietal, occipital, and proximal areas of the head, all with a straight and albeit amorphous boundary from the main body (Figure 4).
Specimen OME1—Cast with signature ‘Pat Elvins’. The majority of the cast is comprised of a uniform matrix with very few trapped air bubbles. Similar to specimen OMB2, the figurine shows a straight and albeit amorphous boundary along the parietal, occipital, and proximal areas of the head (Figure 5). Unlike OMB2, however, the matrix of the two parts is the same.
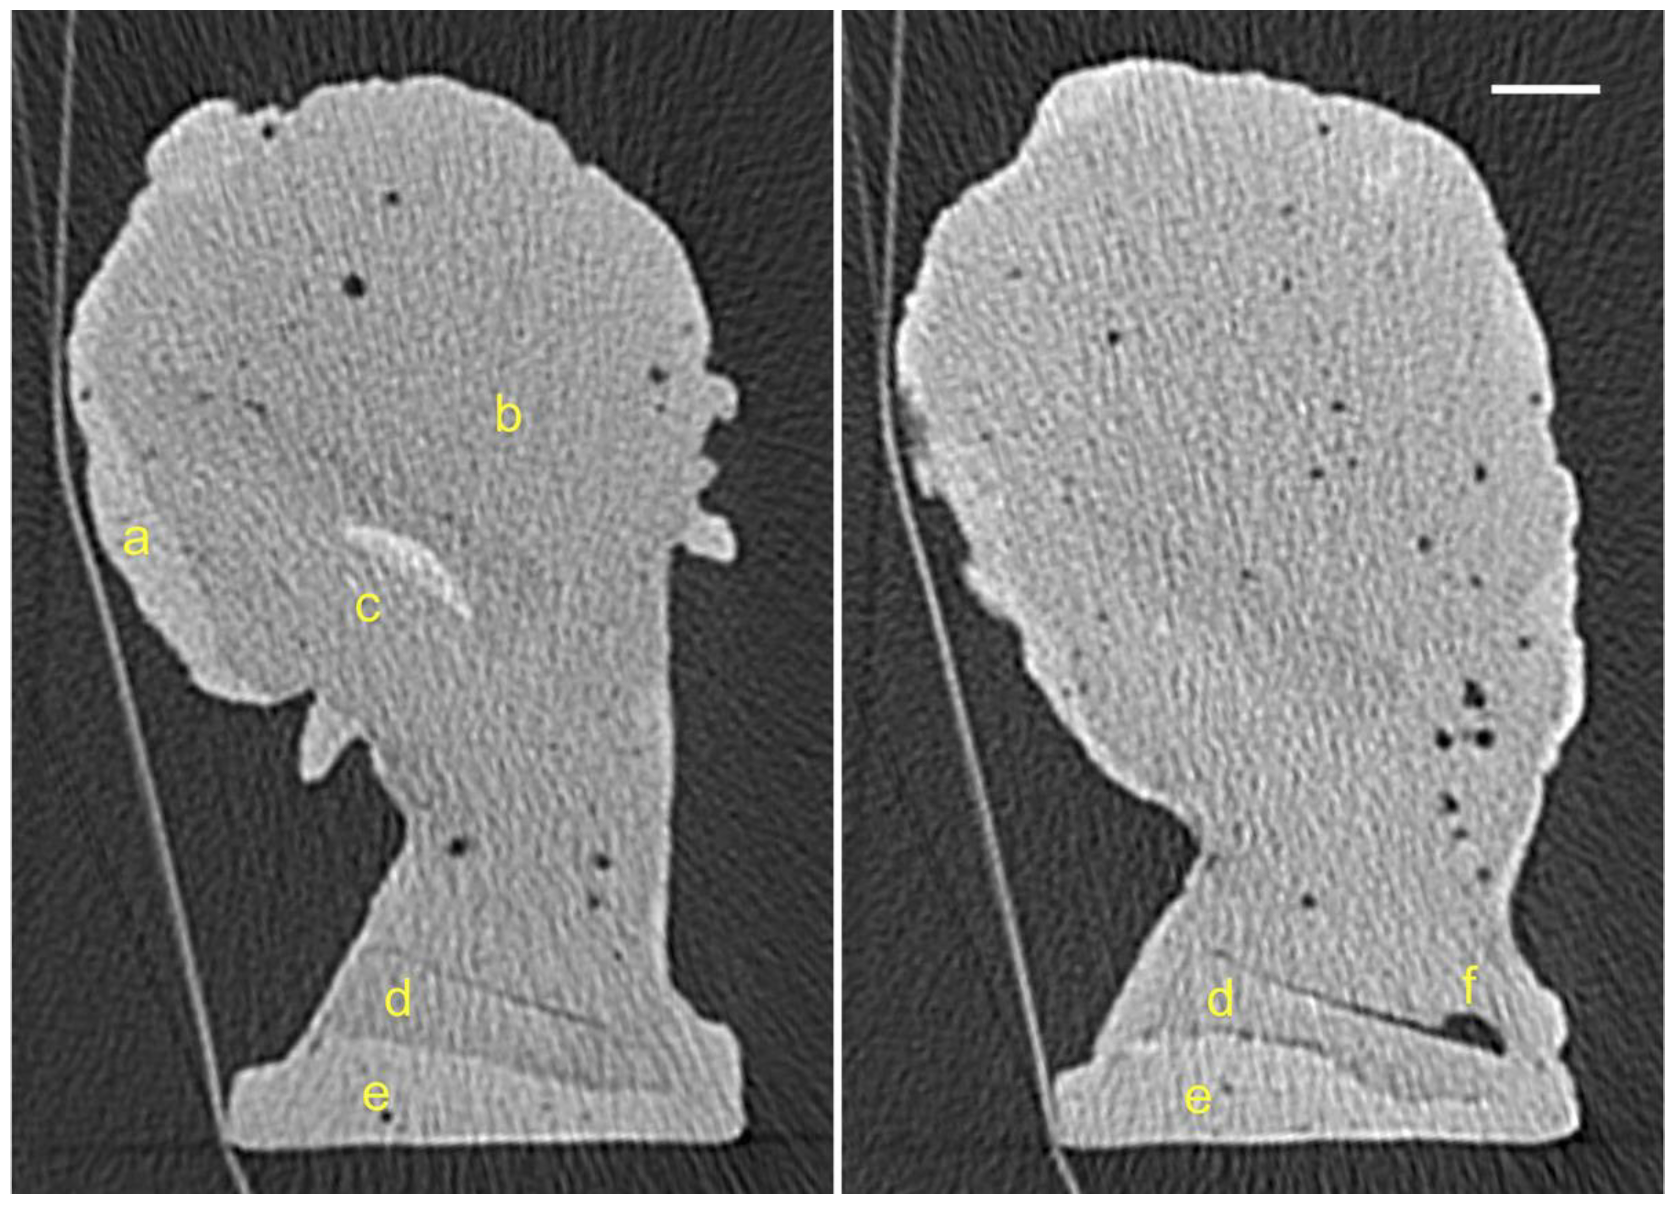
Specimen OMM1—Cast with signature ‘E & M’. The majority of the cast is comprised of a uniform matrix with a numerous trapped air bubbles (Figure 6 and Figure 7). The figurine shows a patch of denser matrix along the right parietal separated with a diffuse boundary from the main body (Figure 6a). This suggests that casting material with a higher viscosity and, hence, density may have been used, possibly scraped from the sides of the mixing bowl. Inside, the middle of the cast of a convex section (3 × 14 × 6 mm) is much denser than the surrounding matrix (Figure 6c). Given that the margins of the convex section are more discretely defined than the margins to the denser matrix along the right parietal, it would appear that this is an inclusion rather than a glob of different viscosity. The neck area of the figurine exhibits a wedge-shaped feature with well-defined less dense edges (Figure 6d). The proximal surface of the 6–9 × 29 × 53 mm feature is slightly convex with trapped airspaces of up to 1 mm in diameter and a well-defined 3 × 6 mm air bubble in the center of the neck. The base of the figurine is filled with a matrix that is denser than the main matrix (Figure 6e).
Specimen OMM2—Cast with signature ‘E & M’. The majority of the cast is comprised of a uniform matrix with numerous trapped air bubbles. The figurine shows patches of denser matrix along the parietal, occipital, and proximal areas of the head, all with a diffuse boundary from the main body.
Specimen OMM3—Cast with signature ‘E & M’. The majority of the cast is comprised of a uniform matrix with a few trapped air bubbles and small (1–3 mm diameter) inclusions of very dense material. The figurine shows patches of denser matrix along the frontal margins. The boundary with the main matrix is well defined, suggesting minimal mixing of the matrices. The distal section of the figurine shows banding in a deep convex shape (Figure 8).
Specimen OMM4—Cast with signature ‘E & M’. The majority of the cast is comprised of a uniform matrix with numerous trapped air bubbles. There are significantly more larger bubbles (diameters 2–3 mm) in the matrix of this specimen than in the matrix of any of the other specimens.
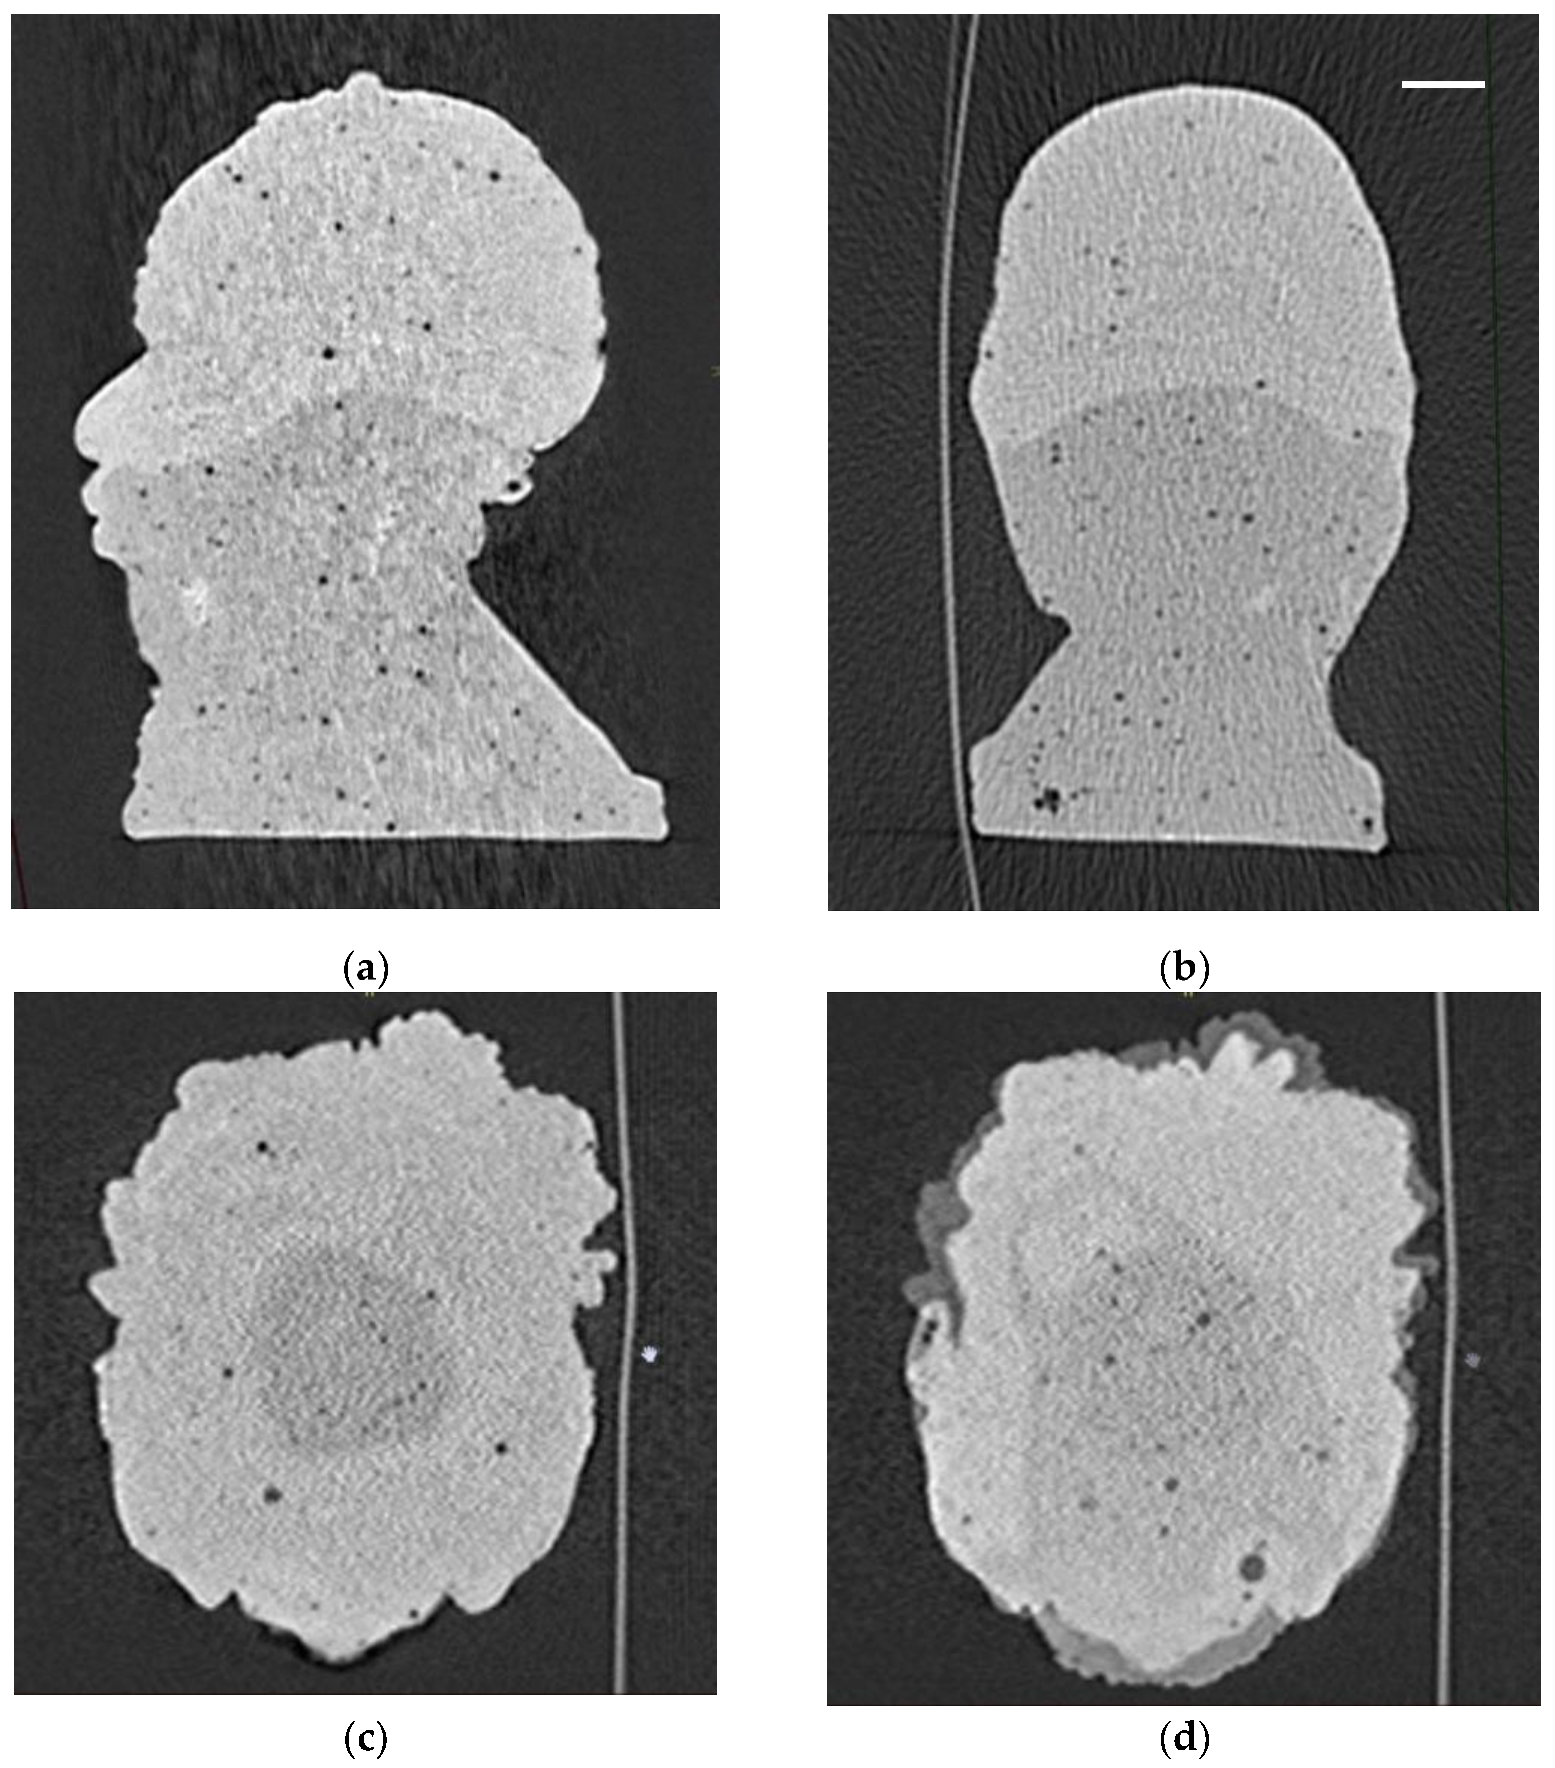
Specimen OMP1—Cast with signature ‘E & P’. The majority of the cast is comprised of two different kinds of matrix. The proximal half is filled with uniform denser matrix with few trapped air bubbles (1.3/100 mm2), while the distal half and neck are filled with a uniform less dense matrix with numerous trapped air bubbles (4.0/100 mm2). The border between the matrices is diffuse and shows a marked, 10 mm deep concave indentation (Figure 9).

3.2. Female Figurines

Five female figurines were available for investigation: one E&B, two E&M, and one E&P.
Specimen OWB1—Cast with signature ‘E&B’. The cast is comprised of a uniform matrix with numerous trapped air bubbles.
Specimen OWM1—Cast with signature ‘E&M’. The majority of the cast is comprised of a uniform matrix with few trapped air bubbles. The figurine shows patches of denser matrix along the right parietal area, in particular, the protruding curl of hair (Figure 10).
Specimen OWM2—Cast with signature ‘E&M’. The cast is comprised of a uniform matrix with numerous trapped air bubbles.
Specimen OWP1—Cast with signature ‘E&M’. The majority of the cast is comprised of a uniform matrix with a few trapped air bubbles. The figurine shows patches of denser matrix along the right parietal area, in particular, the protruding curl of hair.
Specimen OWP2—Cast with signature ‘E&P’. The majority of the cast is comprised of a uniform matrix with a few trapped air bubbles. The figurine shows patches of denser matrix along the right parietal area, in particular, the protruding curl of hair. The main matrix also contains amorphous inclusions (4 × 4 mmm 4 × 13 mm) of denser matrix.

3.3. Controls

All controls exhibited a uniform matrix without any visible trapped air bubbles.

3.4. Matrix Densities

The average densities of the main matrix as well as the matrix at the edges of the figurines are set out in Table 3, as densities of trapped air bubbles and overall bubble density. To account for variations in the integrated area, the observed individual readings, which are averages in themselves, were combined into weighted averages.
The statistical comparison between the different specimens was only carried out within each production group (i.e., E&M) with the exception of specimen OMM4, which, given its high HU value, was also tested against all E&B specimens. The assessment of the differences in weighted means between the main matrices of the different specimens showed significantly different densities (two-tailed test [38]) only for pairings involving specimens OMM3 (OMM1, p = 0.0005; OMM2, p = 0.0002; OMM4, p = 0.0096; OWM1, p = 0.0007) and OMM4 (OMM2, p = 0.0121; OMM4, p < 0.0000).
Among the figurines that exhibited a matrix of higher density in some edge elements when compared to the main body (Table 3), the difference in weighted means was statistically highly significant in specimens OMM3 (p < 0.0000), OWM1 (p < 0.001), and OWP1 (p < 0.0087) (two-tailed test [38]).
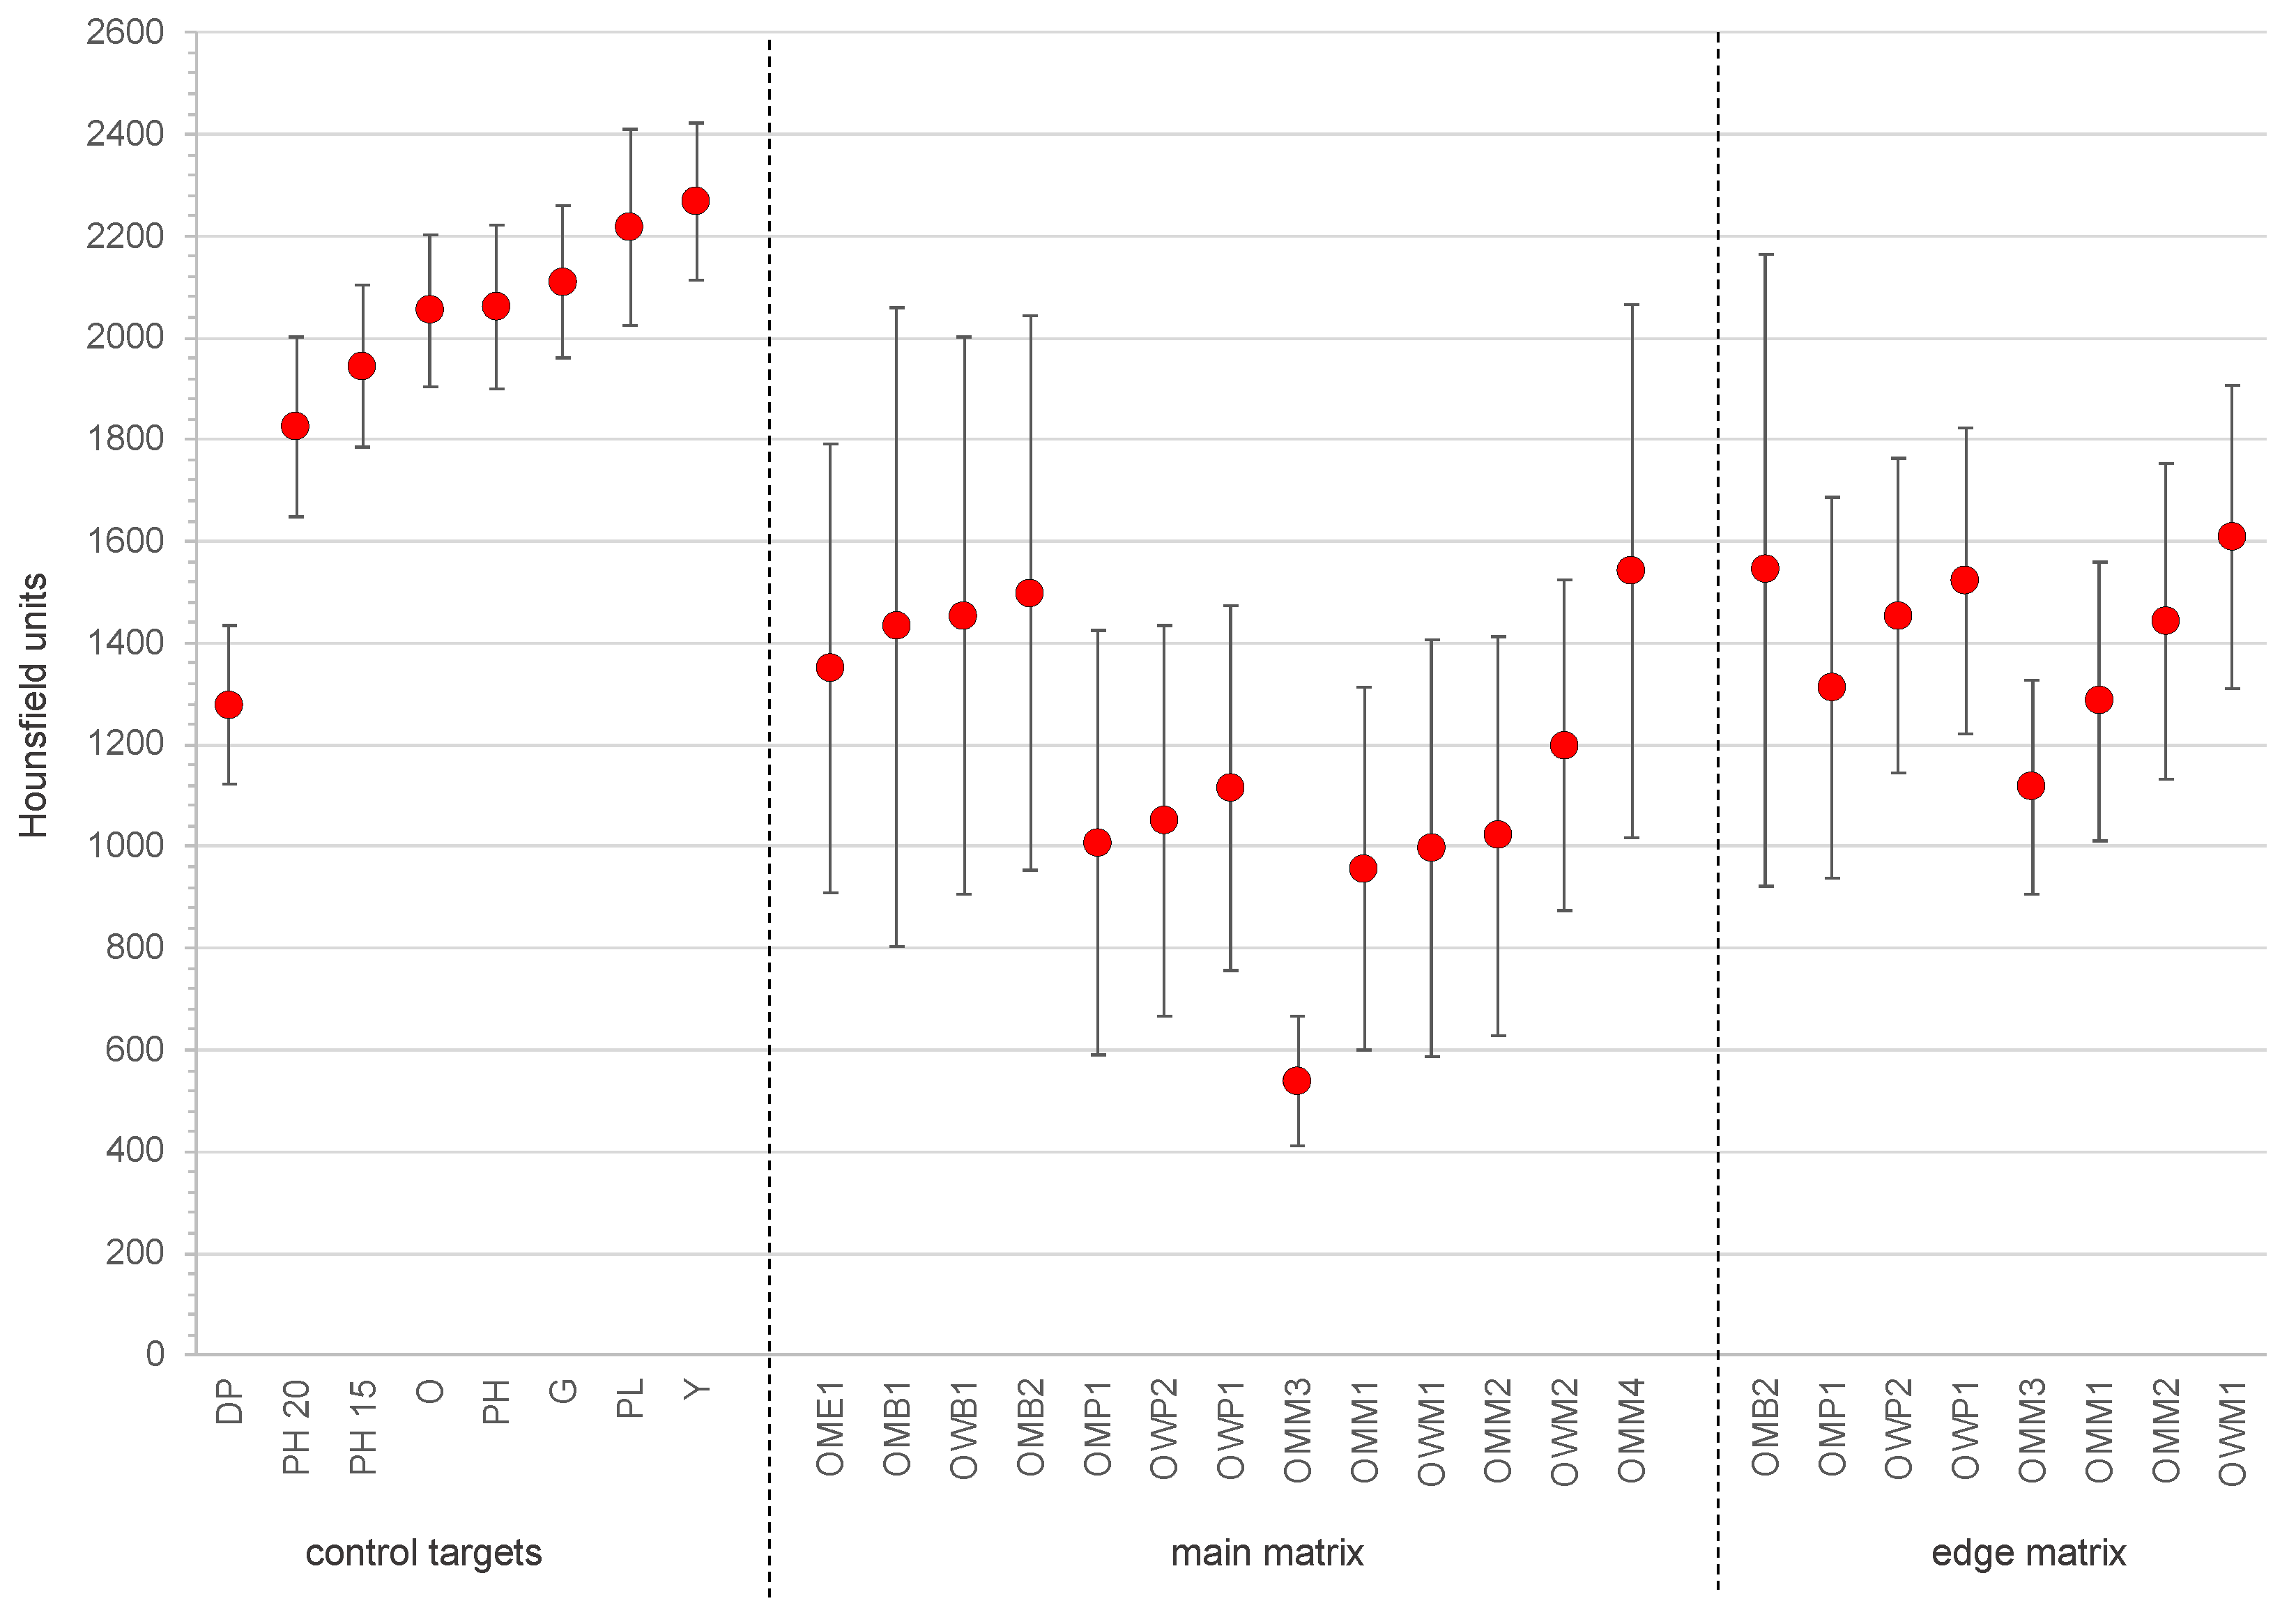
The PACS allows the measurement of Hounsfield units as spot values (0.5 × 0.5 mm pixel) or as averages calculated across a defined region of interest (ROI) (which is selected using a circular tool). Measurements of ROIs return both an average and a standard deviation (Figure 11). The more homogenous the composition of a material, the smaller the standard deviation will be. Thus, the proportion of the standard deviation of an ROI in relation to the calculated average HU of the ROI will provide an indication of the relative homogeneity of the matrix, where the smaller the proportion, the more homogenous the composition (Table 4).
In all but one case (OMB2), the edge matrix is statistically significantly more homogenous than the main matrix of the figurine (Table 4; t-test, two-tailed, two-sample unequal variance).

4. Discussion

The CT examination of the eight male and five female figurines revealed considerable variation between the casting processes used for the figurines. All are made solely from plaster with globular cavities or the admixture of extraneous material (e.g., metal or stone).
As noted, some of the figurines have a small layer of denser matrix at the margins, primarily where the details of the face and hair are located, while they have the common, less dense matrix in the core and in the neck area. While this applies to all three specimens of the E&P series (Table 3), it applies to only half the specimen of the four casts of the E&B /Pat Elvins series (OWB2 and OME1) and one third of the six casts of the E&M series. As the boundaries between the two matrix bodies are diffuse and not cleanly delineated, it appears that the core matrix was added to the form at a time when the edge matrix was still plastic and, thus, the two pours could partially mix.
In the case of instance specimens OME1 and OMB2, the occipital section of the head that had been filled with matrix was insignificantly denser than the rest of the figurine, clearly indicating two different pours of casting material. The margin between the two was very diffuse in the case of OMB2 (Figure 4) but more pronounced in the case of OME1 (Figure 5). As the boundary is less than 1 mm wide, it was difficult to obtain HU values for larger areas (and, thus, be consistent with the other measurements). Spot readings of areas with 2–3 mm circumference could be taken, however, returning values between 2700 and 3100 HU (STD ranging from 52 to 152). This suggests a settling of the casting material and, thus, some elapse of time between the two pours.
This difference in matrix density is difficult to interpret. In most instances, the parts of the cast that exhibit casting material with a higher density are only small. There are two possible explanations. Either casting material with a higher viscosity was used for these parts, or the differences were caused by the casting process.

4.1. Effects of Casting Plaster Preparation

While it is possible that the artist/caster could have used completely different types of plaster for the main matrix and the edge matrix, this is highly unlikely. There is some evidence that differential preparation of the same plaster powder with result in different densities.
Numerous studies exist that use Plaster of Paris in creating phantoms to emulate cortical bone. These report single HU values (with SD) but commonly do not report details of casting, time elapsed between casting and scanning, and/or the mixing ratios of Plaster of Paris and water employed [39,40,41]. An exception is the study by Ali et al., who noted that the HU values for all ratios decreased with curing time, plateauing after ten days. Their observations showed that the higher the proportion of Plaster of Paris, the lower the resulting HU values will be. A fully cured sample with a mixing ratio of 42/50 Plaster of Paris/H2O (in g) resulted in 800 HU, whereas a sample with a ratio of 30/50 returned 1250 HU [42].
Similar differences could be observed for the control targets made from Patternstone H, for which three different proportions were prepared (Table 2). In this case, however, the density not only decreased with increased H2O content (Table 3) but did so a linear fashion (Pearson’s r = 0.9999).

4.2. Effects of the Casting Process

In addition to the relative proportions of plaster powder and water, the mixing and pouring process will also affect the outcome of the matrix and, thus, the cast. Insufficient stirring during the mixing process will result in incomplete mixing, and, thus, in clumping of non-hydrated gypsum, which has a lower density than hydrated gypsum powder. Too vigorous a stirring will introduce and trap air bubbles in the mixture. To release such bubbles, casting manuals recommend that the mold (or the table on which it stands) be tapped regularly during the casting process before the matrix hardens [43,44].
As observed, most of the figurine contains air bubbles in their matrix. The bubble density, as reported in Table 3, only reflects those bubbles that are readily observable in the CT scan, i.e., those with a diameter of 0.5 mm or greater. Given the technology used, it can be surmised that the matrix will contain trapped bubbles that are smaller than are detectable as individual bubbles. These will return different HU values within the 0.5 mm slices and, thus, will reduce the HU as averaged for the selected region of interest.
Assuming that the same plaster type was used with the same mixing proportions, the observed different densities are caused by the physical and mixing casting process, resulting in a different homogeneity of the matrix. The proportion of the standard deviation of a region of interest in relation to the calculated average HU of the region of interest will provide an indication of the relative homogeneity of the matrix (Table 4). Indeed, the control samples, which were prepared as per the instructions, stirring slowly and for the prescribed time, and which were then carefully poured, contain no air bubbles, but also exhibit a very homogenous matrix, with proportions of the standard deviation in the 6.8–9.8% range, which is comparable to the values of 23.6–41.9% for the main matrices and 18.2–36.9% for the edge matrices (Table 4). The only exceptions to this are the controls for Plaster of Paris (16.8%) and dental plaster DP (12.01%), which have a lower level of homogeneity despite careful preparation than the other controls. It is likely that this is correlated with the size of the gypsum/plaster grains making up the powder.
The differences in homogeneity are significant in all but two of the figurines that exhibit different densities between the main and the edge matrix (Table 4). The two exceptions are OMB2 and OME1. Unlike the others, where the denser matrix makes up only a very small part, the two exceptions had almost half the head filled with the statistically insignificantly denser matrix.
The density differences are interpreted in terms of casting process. Given that the areas where higher-density matrix can be observed are those with fine detail as well as protrusions (e.g., the hair), it would appear that the caster pressed the plaster into the mold, using a spatula or similar tool. This would have compressed and expelled most air bubbles. Indeed, the areas of higher density (specimens OMB2 and OME1 excepted) do not contain major air bubbles.
While the majority of the matrix was poured into the mold, some compression must have occurred as evidenced in specimen OOM3. In addition, a (pre-)hardened piece of plaster was pressed into the base section of at least one figurine (specimen OMM1).

4.3. Identification of the Raw Material Used

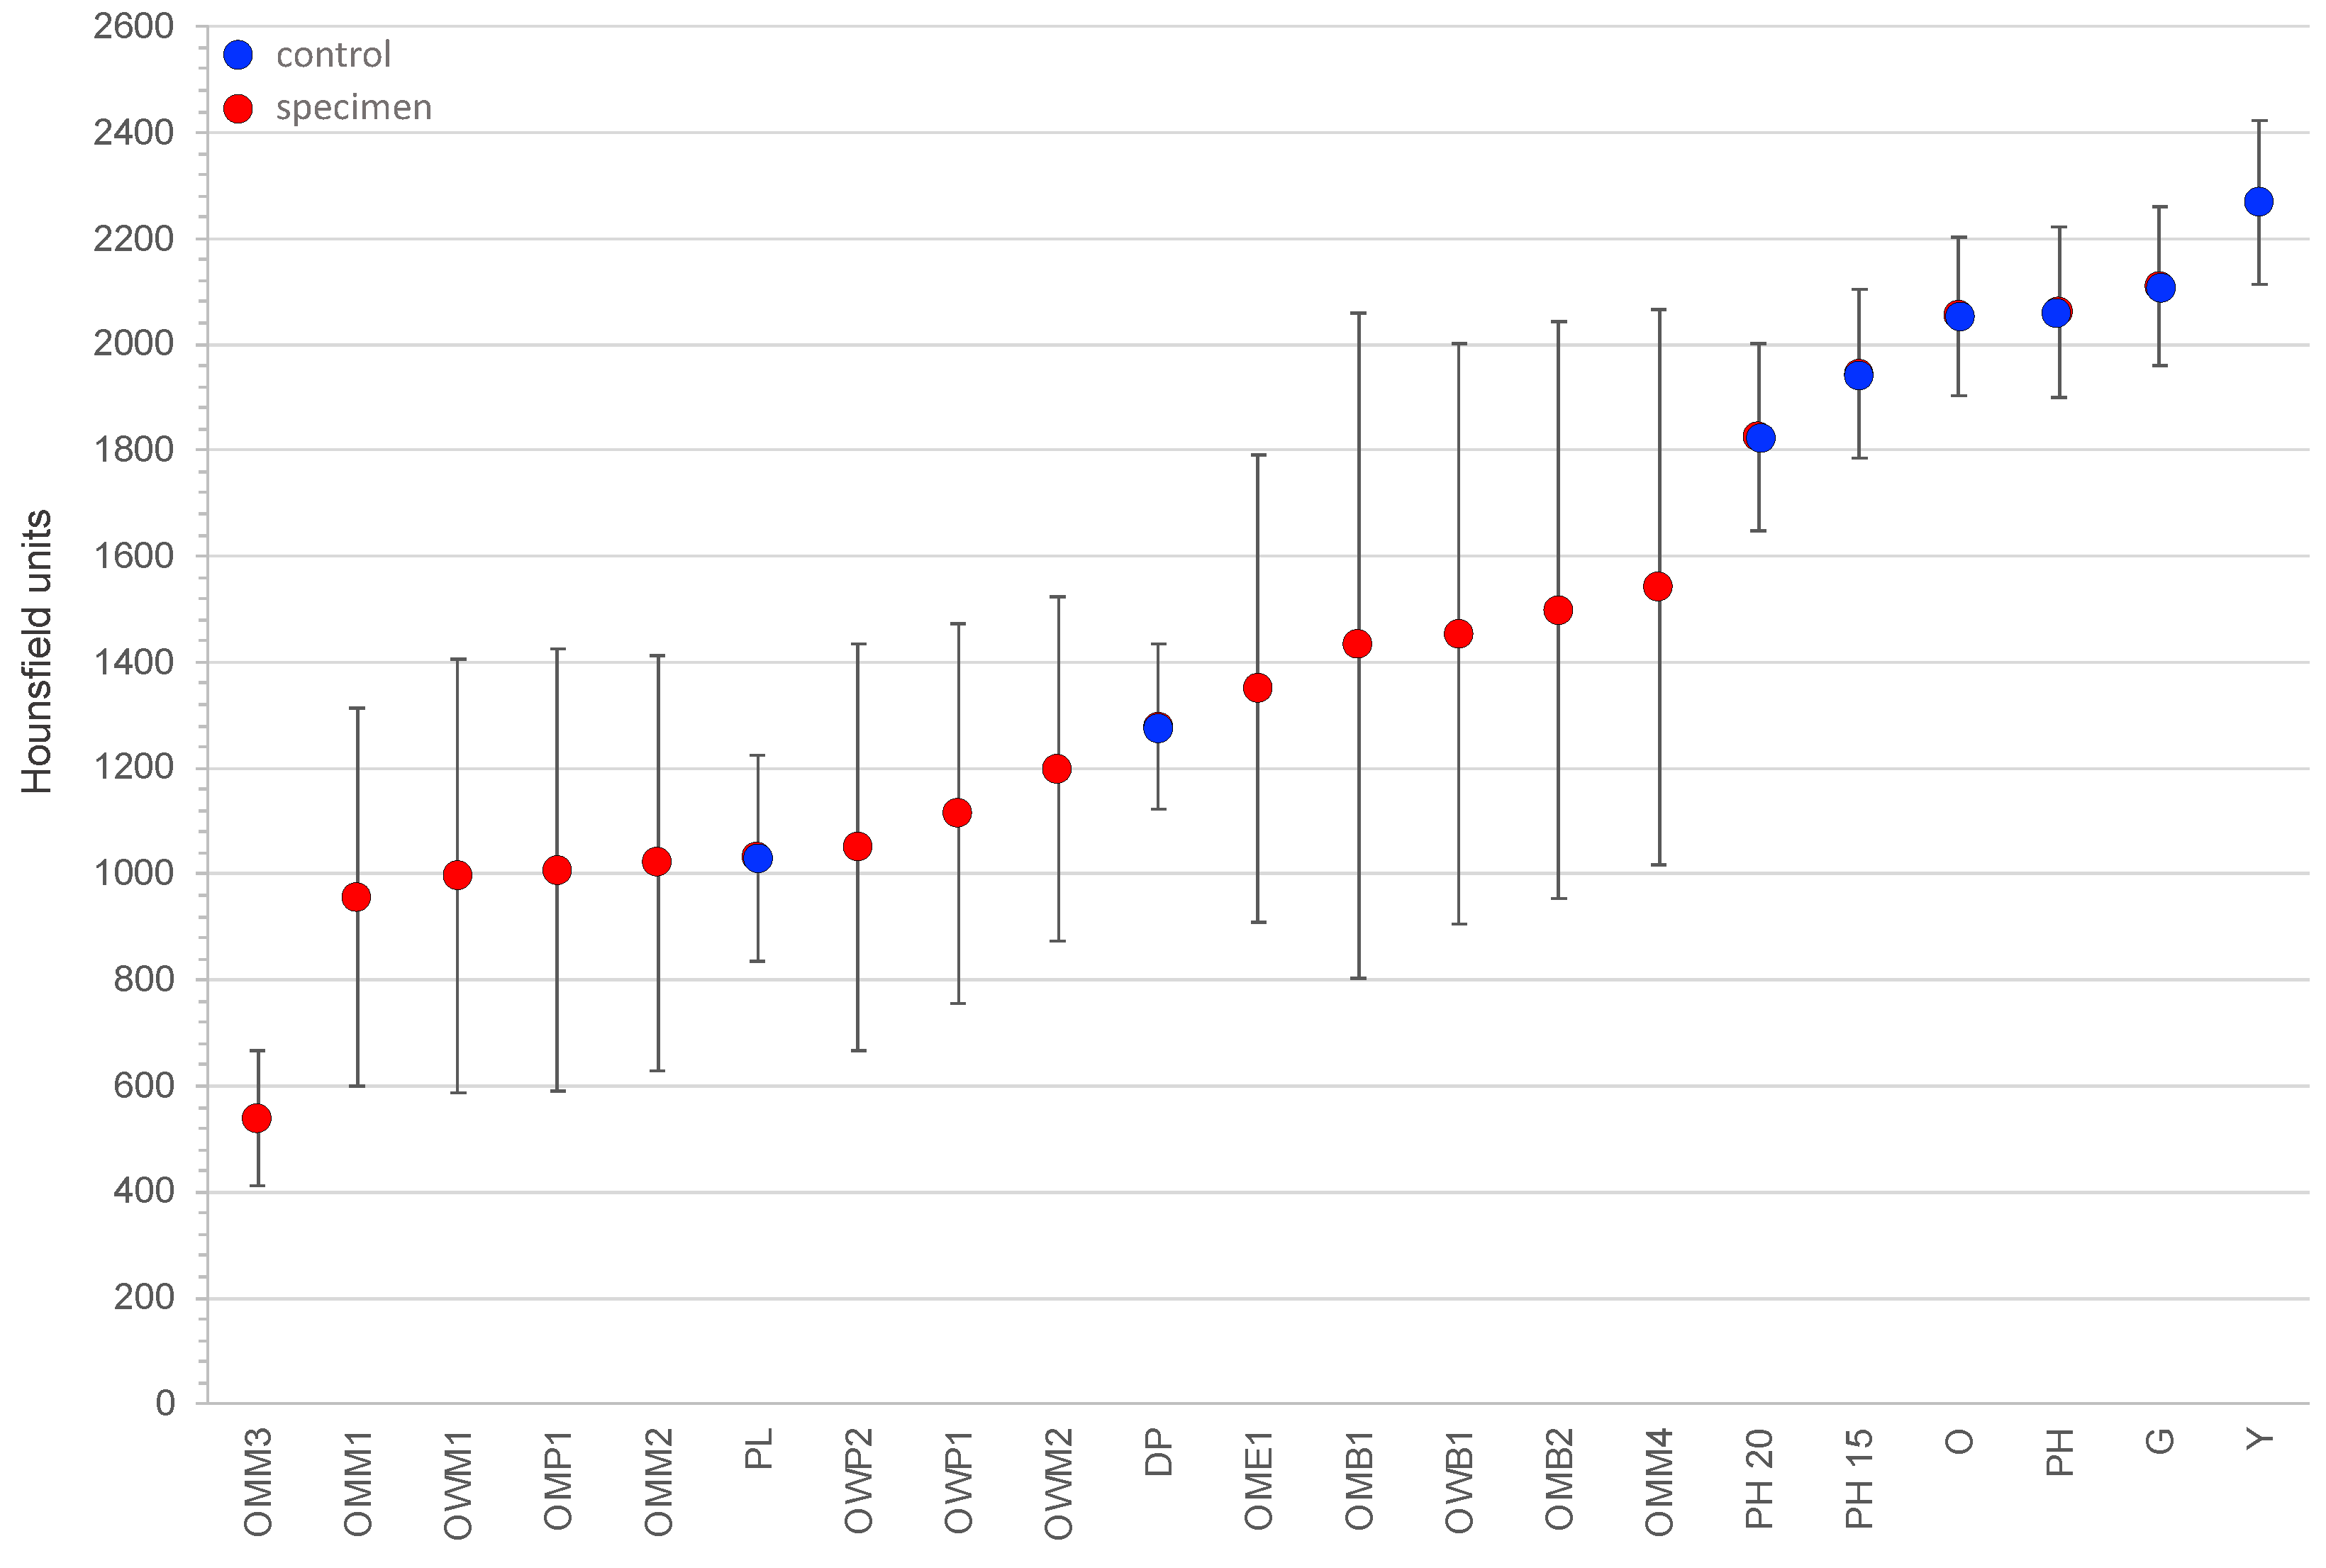
As noted, the artist Pat Elvins had stated that she used Patternstone for her first figurines [15]. It is not known what raw material was used by the casters George Beggs (‘E & B’), Pat McMahon (‘E & M’), and Chris Pepper (‘E & P’). When considering the controls that could be sourced for the study, all controls but dental plaster (DP) and standard Plaster of Paris (PL) have a statistically significant higher density than any of the assessed main matrices.
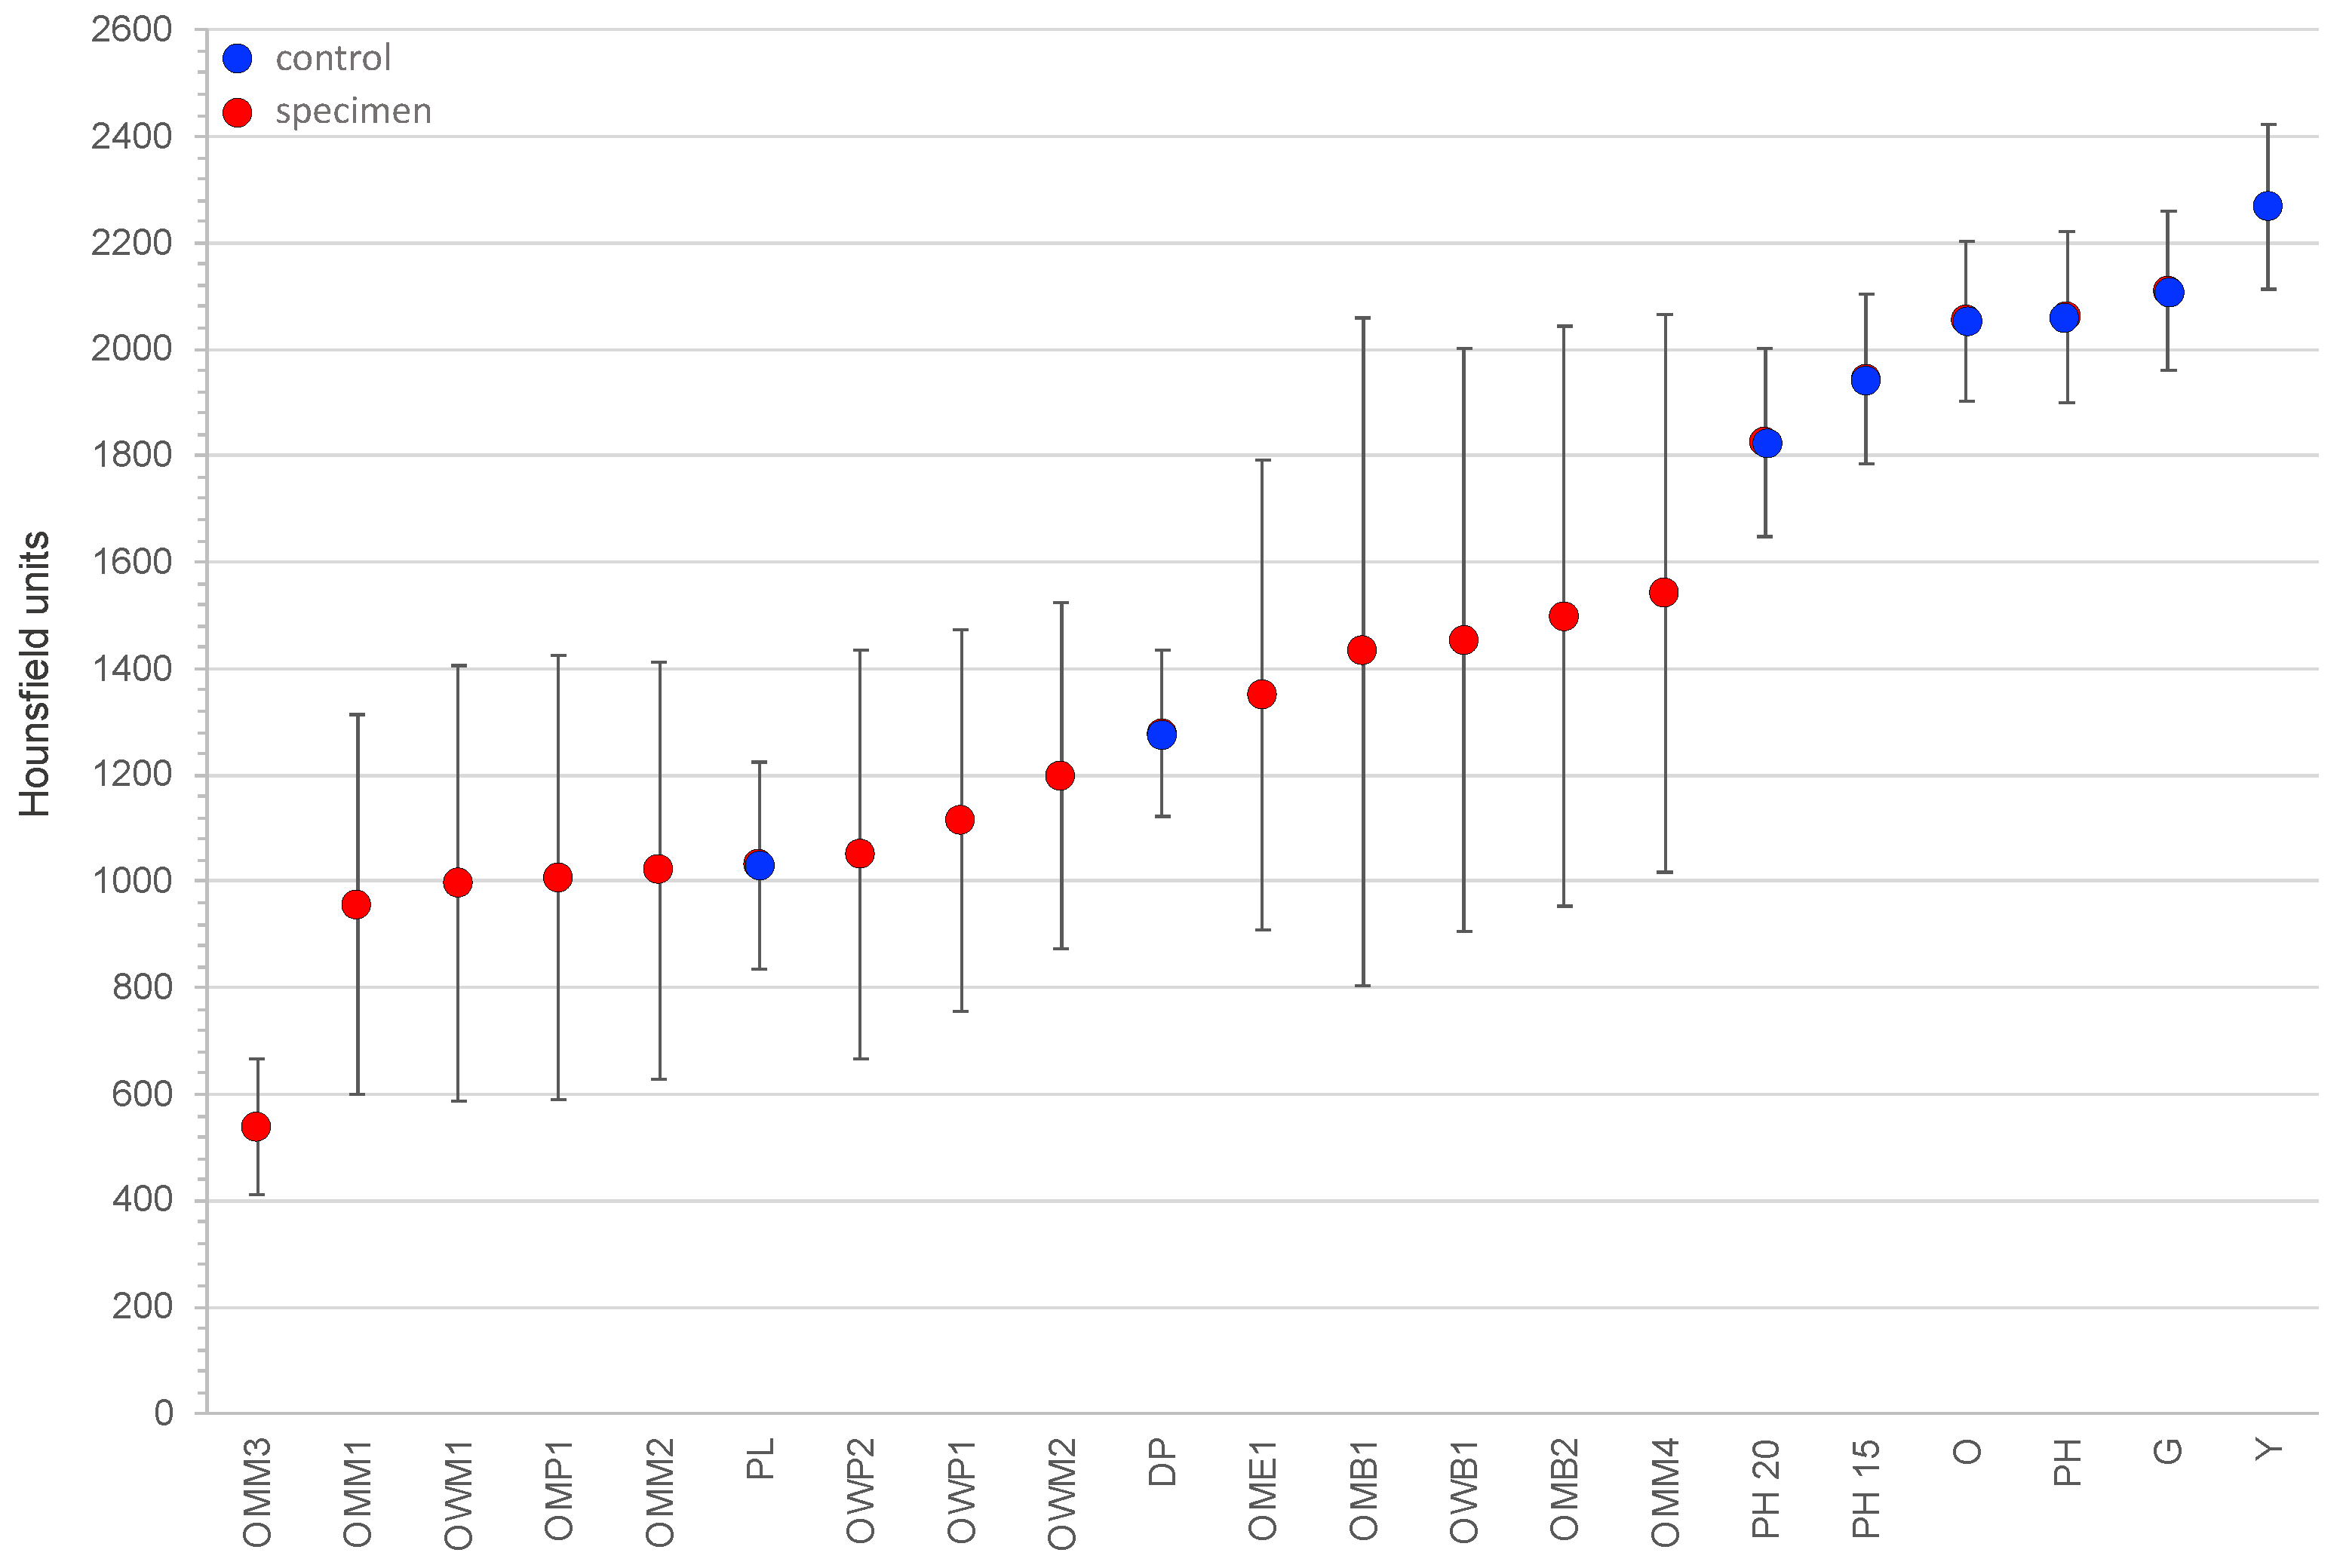
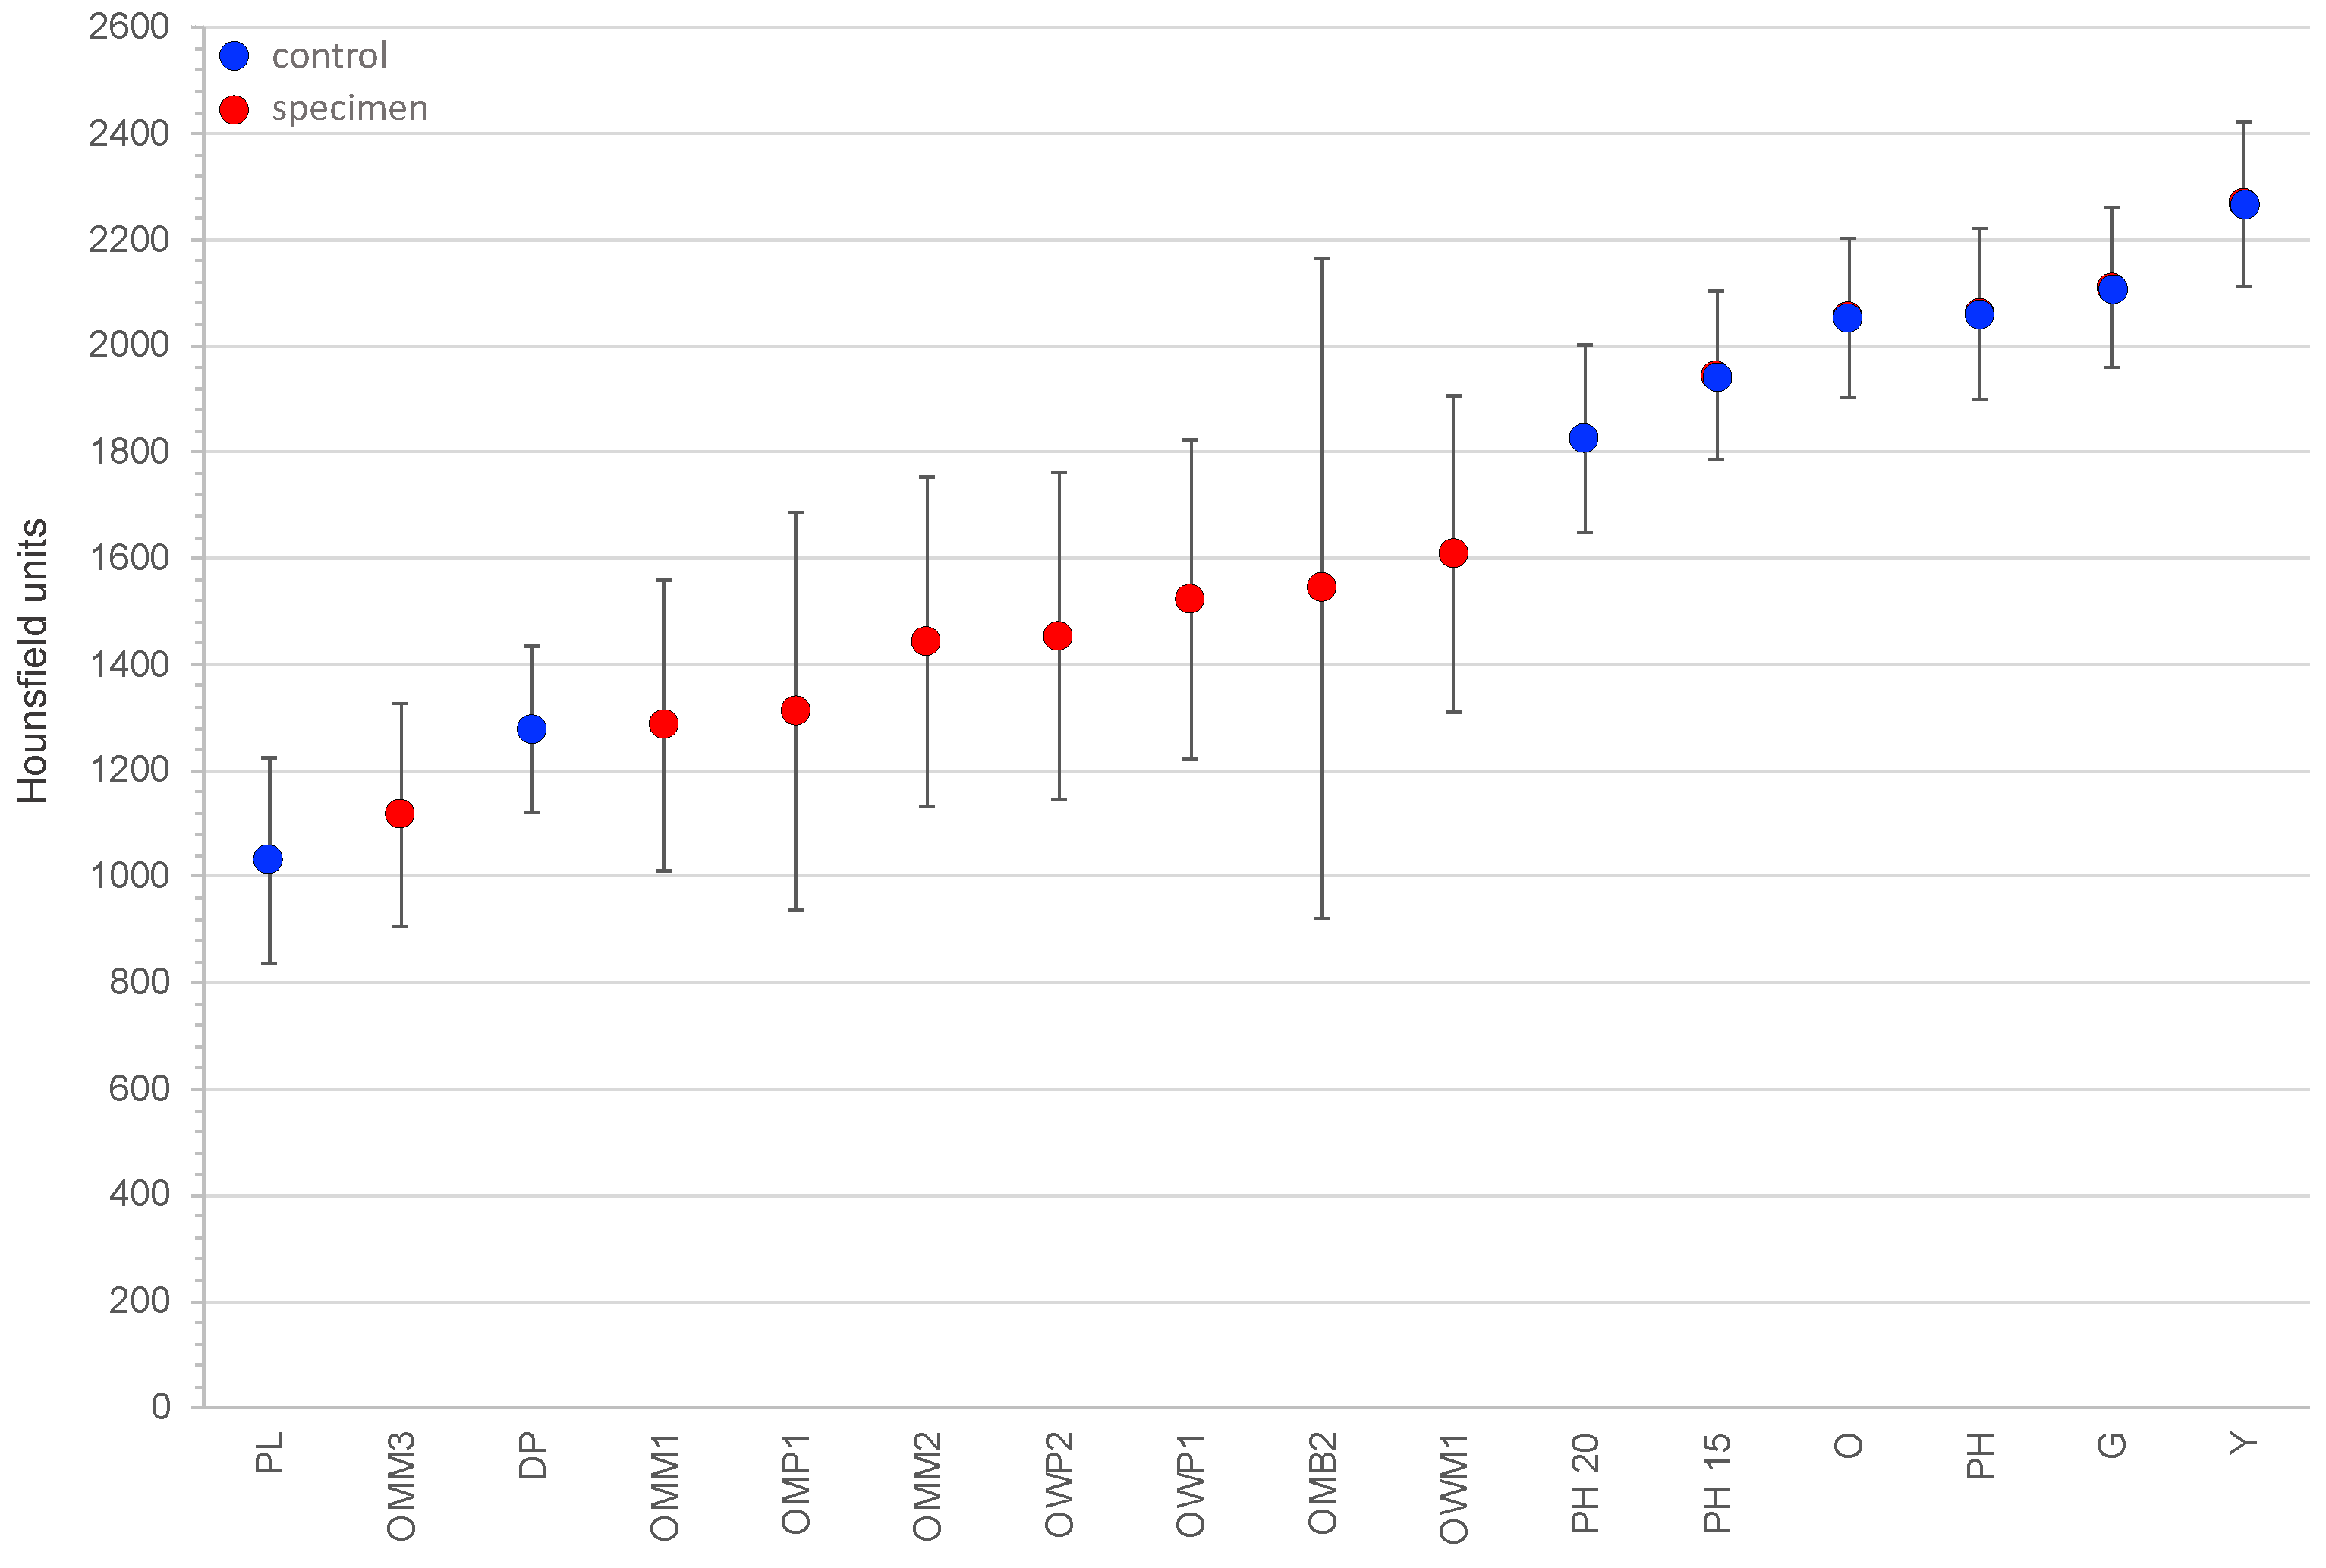
The values for dental plaster (Figure 12) and standard Plaster of Paris (Figure 13) intersperse with the main matrix values observed for specimens. The significance ranges suggest that plain Plaster of Paris is a good candidate. Given that the edge matrix is denser than the main matrix, however, it is improbable that Plaster of Paris could have been used for all but specimen OMM3. While the significance range for dental plaster covers the edge matrix values for most specimens, it does not cover OWM1, which is significantly denser (p = 0.0020). Furthermore, each edge matrix with a higher density than dental plaster is likely to contain microbubbles that are too small to detect, suggesting that the density of the plaster, if correctly mixed, would be even higher.
The other dental plasters of the control samples are too dense, even when allowing for vigorous mixing and the inclusion of microbubbles. This suggests that the casters used a dental plaster that had a higher density than the Ainsworth Dental Plaster control tested here (Figure 14), but a lower density than Patternstone H. The use of plain Plaster of Paris can be excluded.
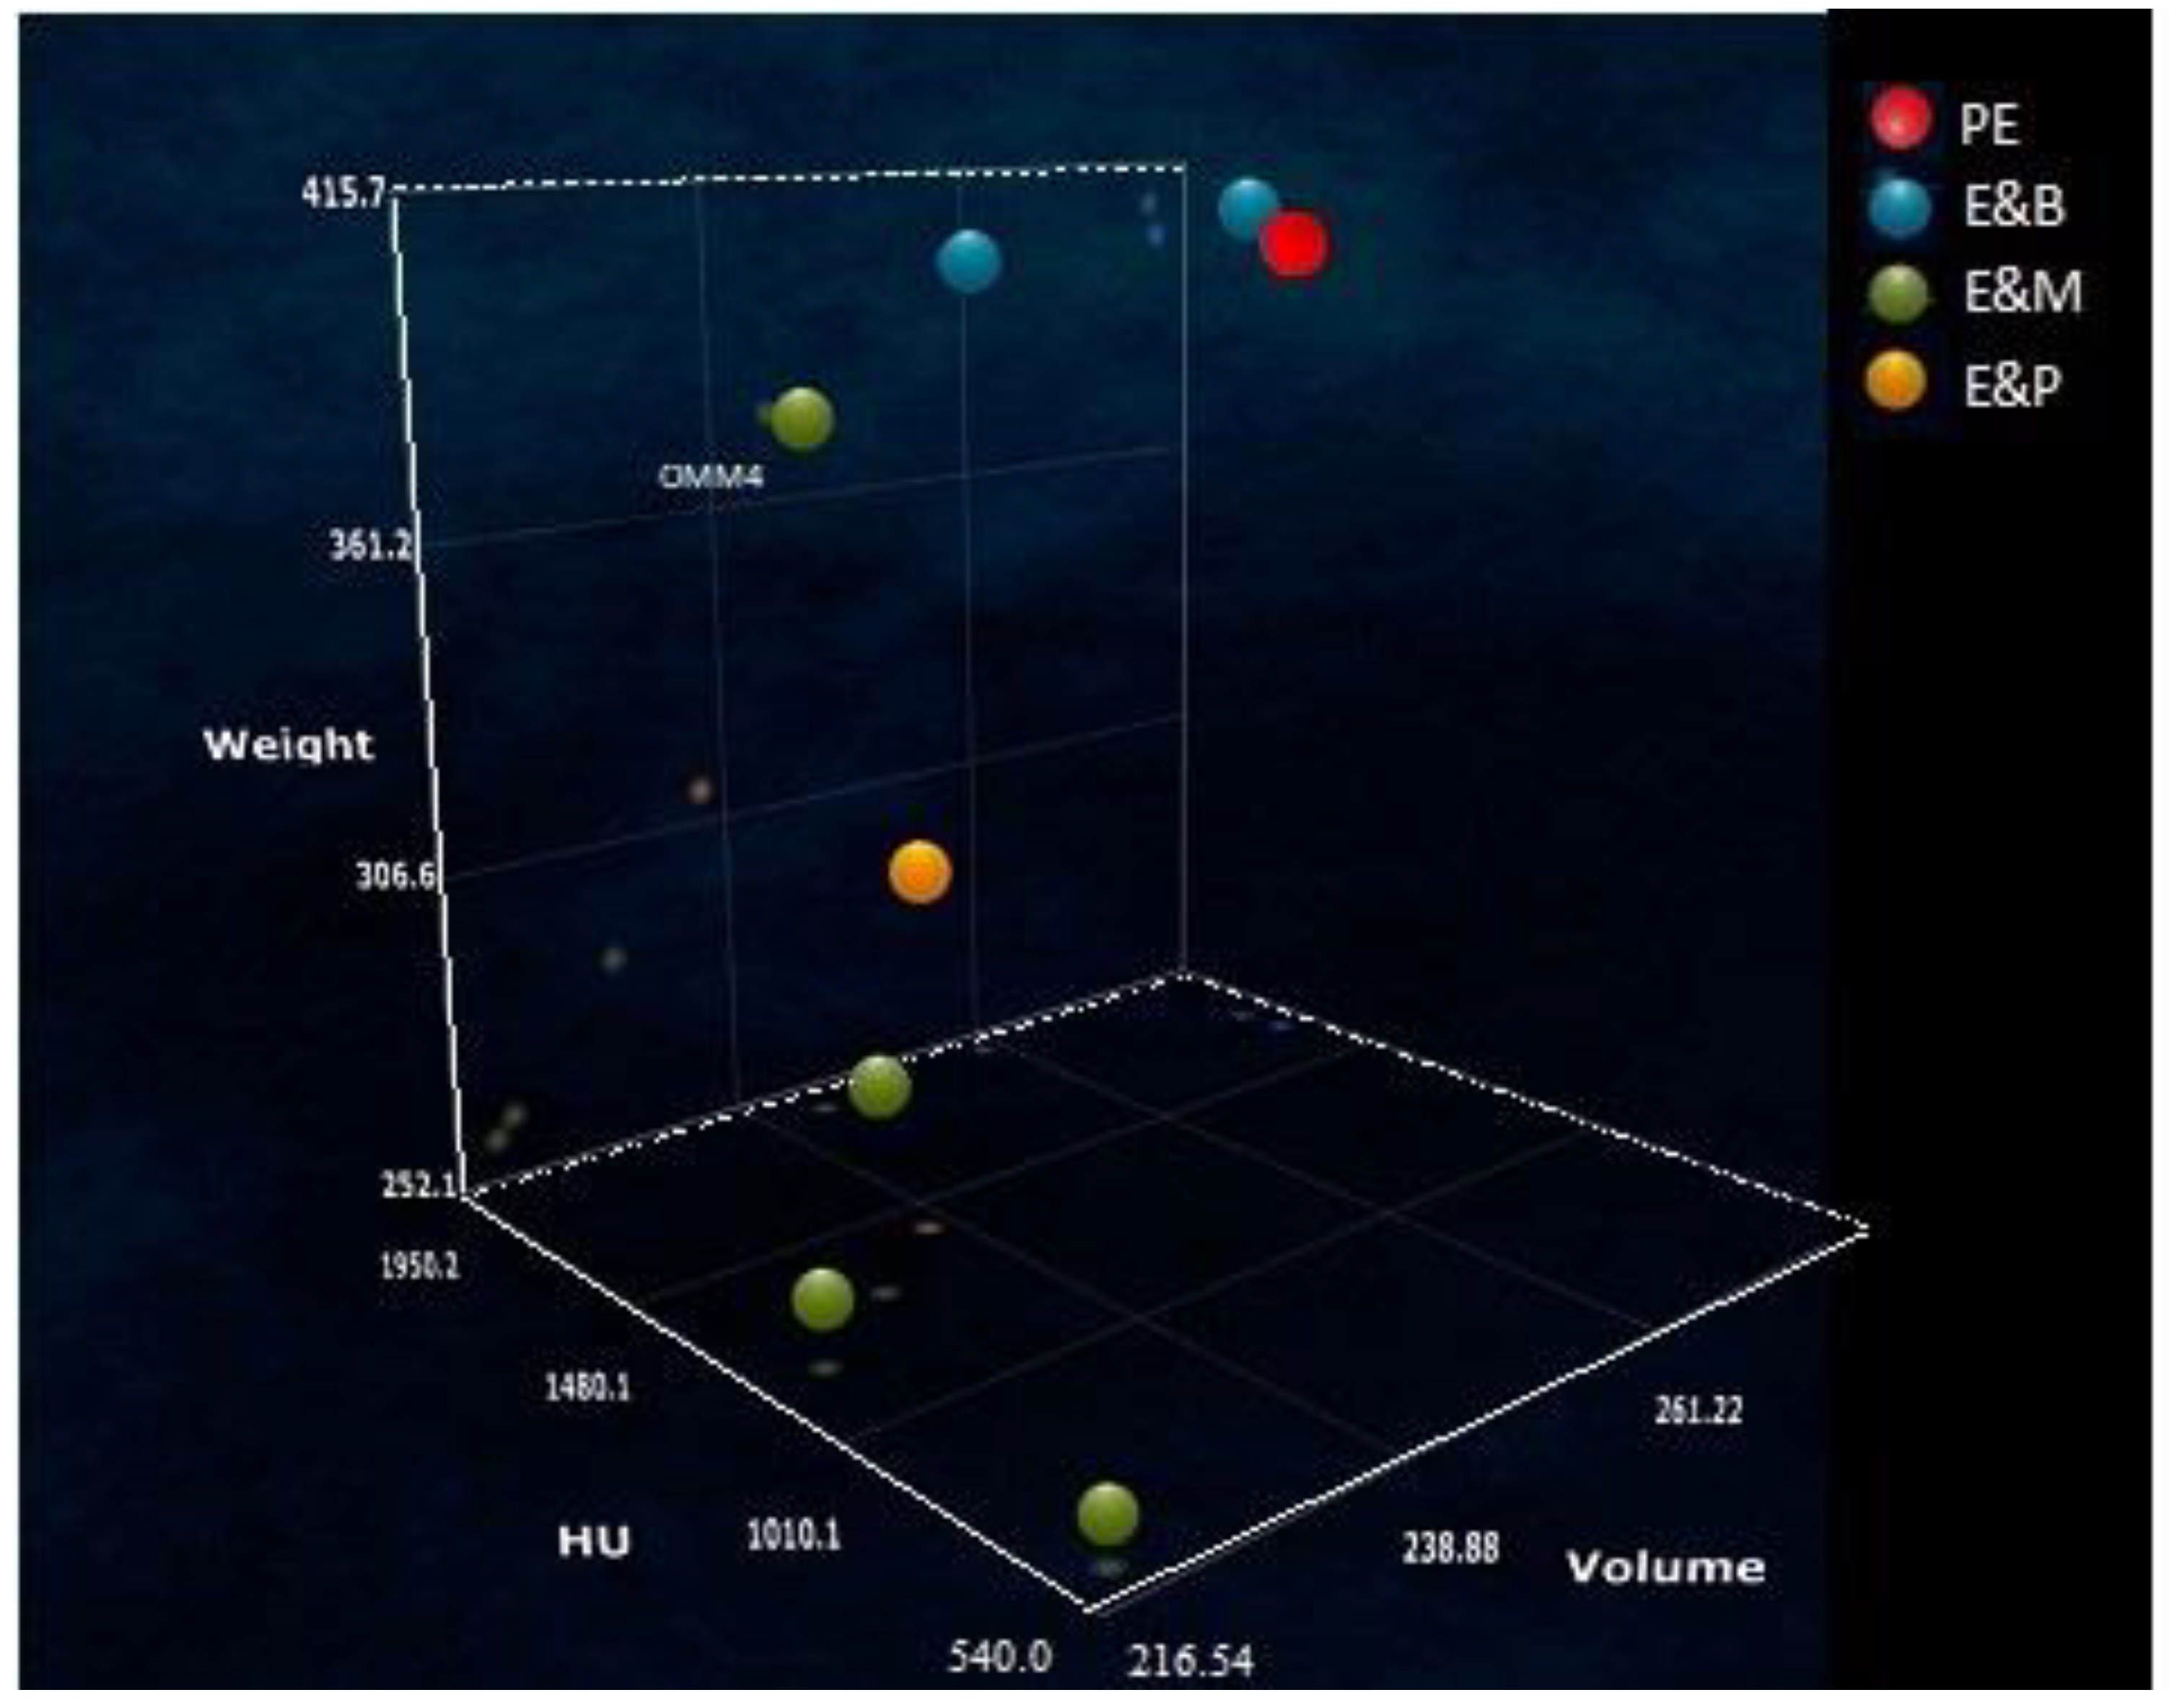
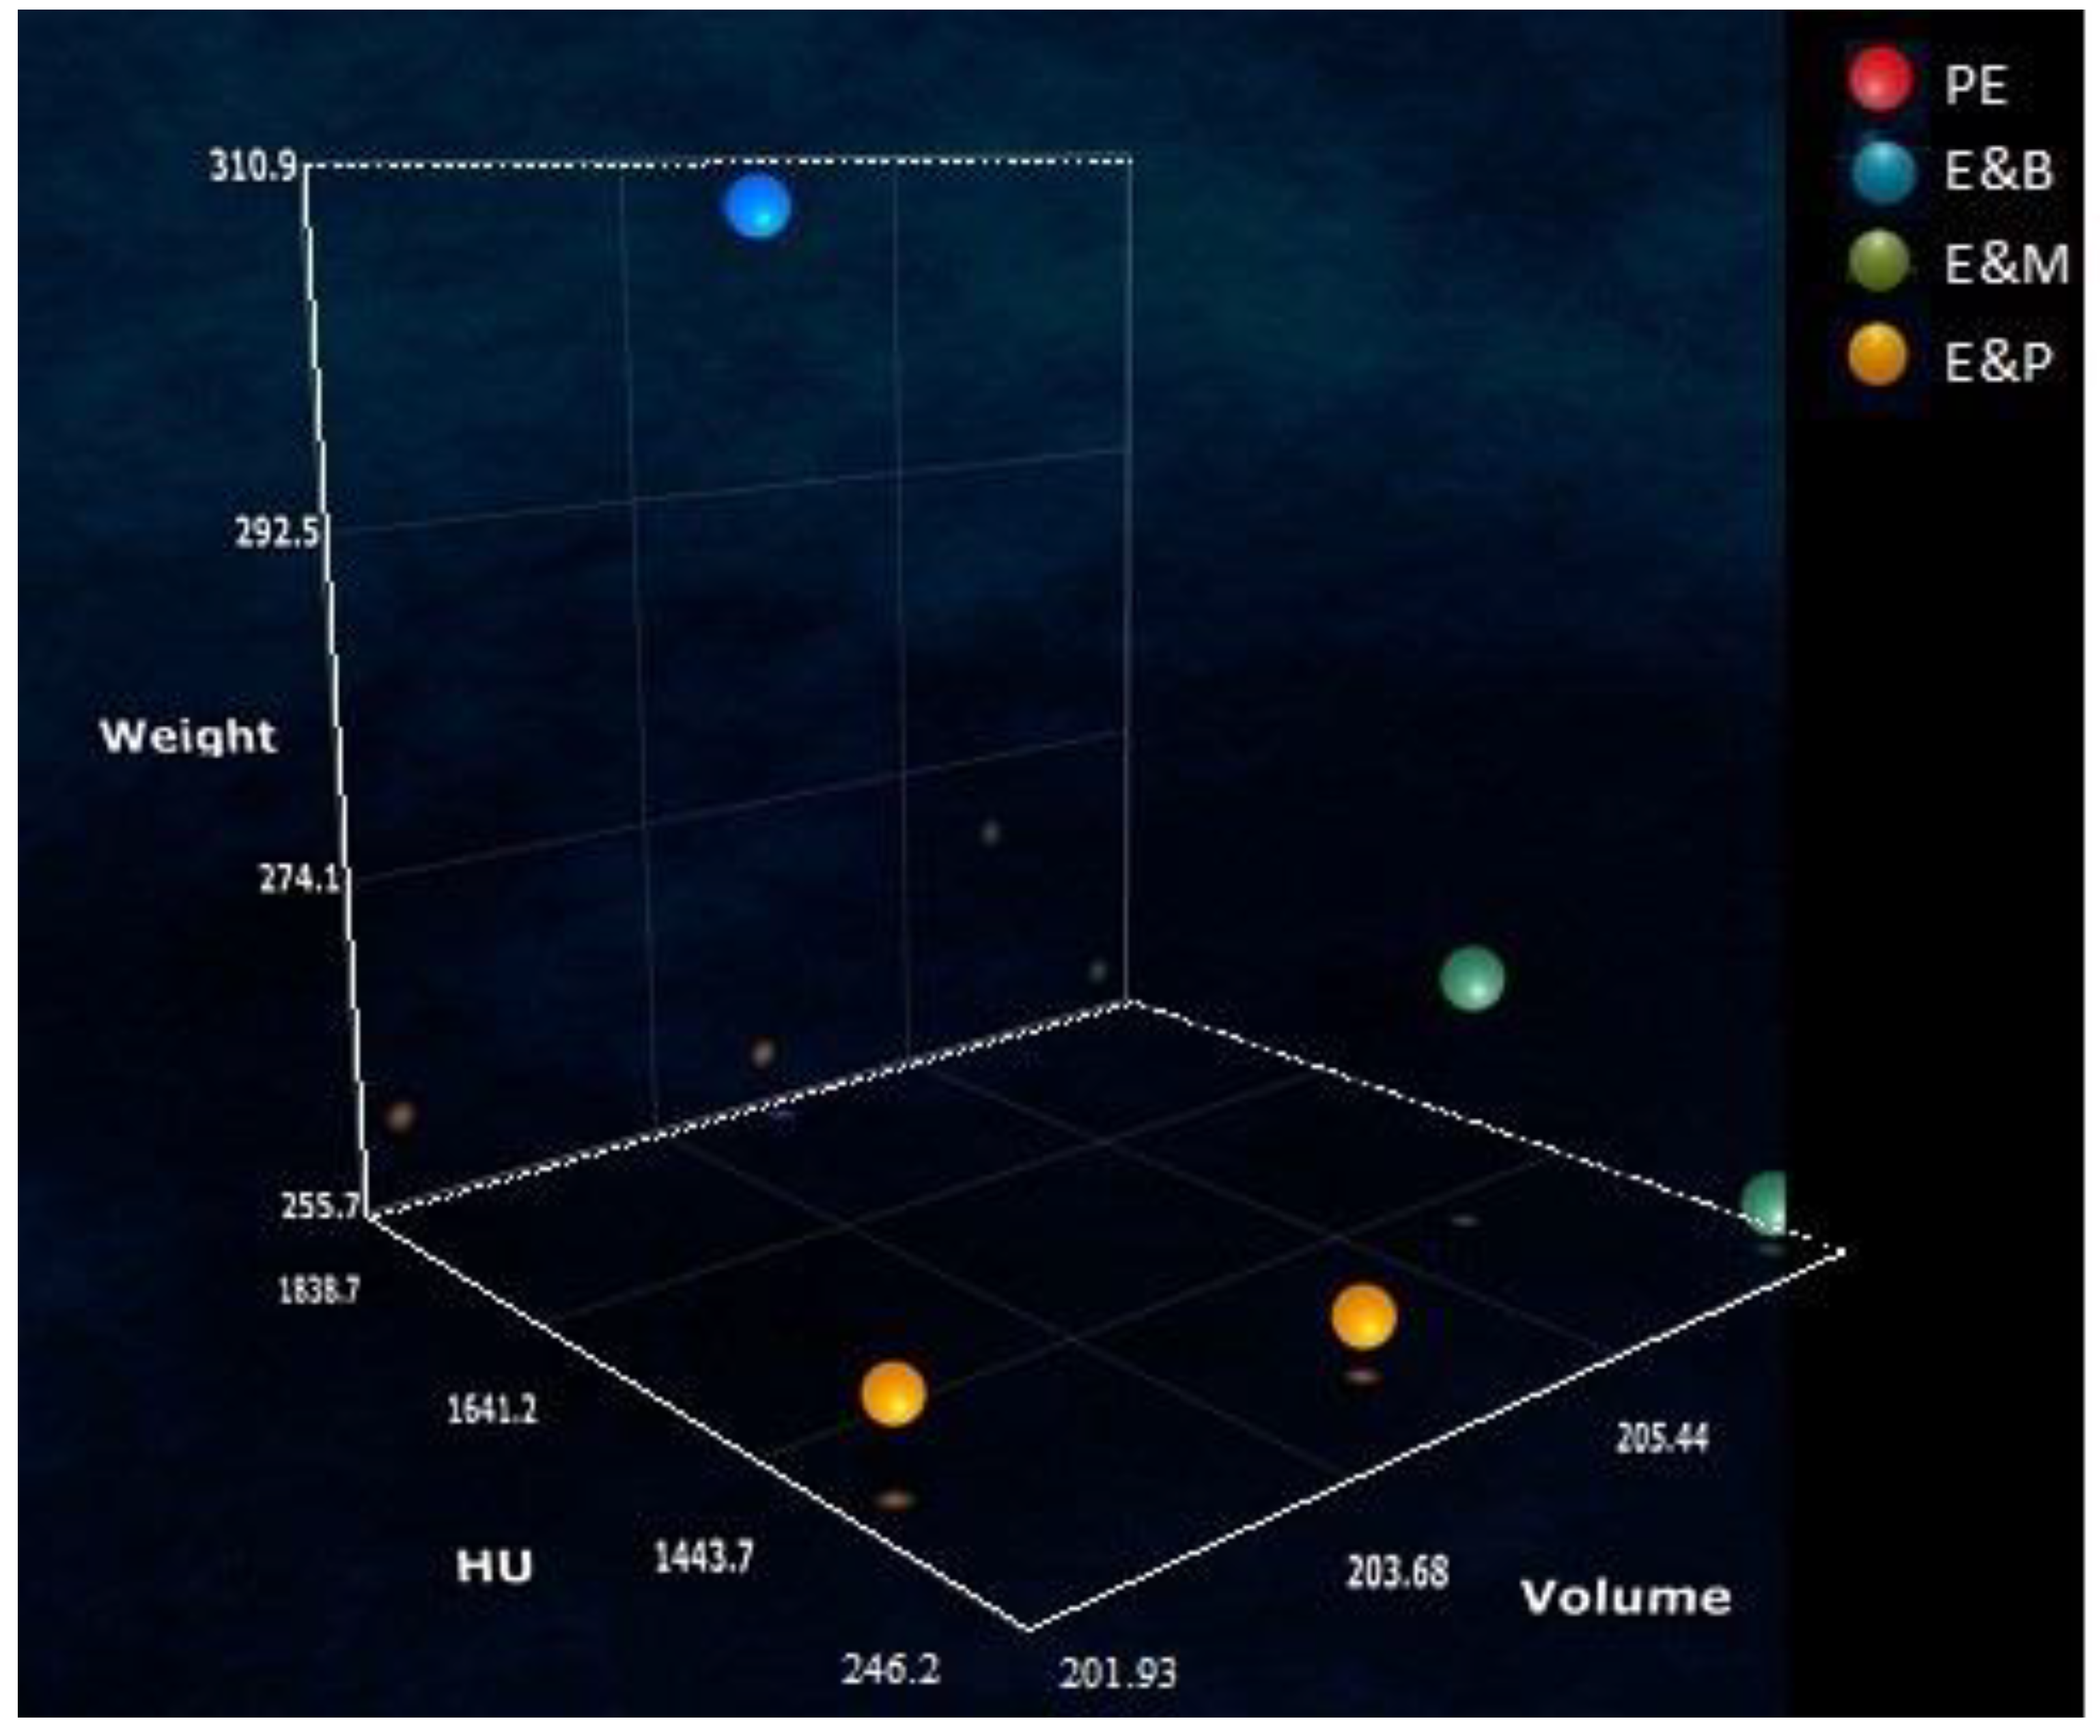
The calculation of volume and average Hounsfield Units of the figurines (via Vitrea software) allows for examining the correlation of weight, volume, and density of the figurines (Table 5). The 3D visualization shows that the four groups of casts (Pat Elvins, E&B, E&P, and E&M) do not cluster cleanly (Figure 15). Figurine OMM4 is significantly denser than all other figurines of the E&M group and groups with the chronologically early E&B/Pat Elvins figurines. In addition, while figurine OMM3 clusters with the E&M group, its density is significantly lower, making it an outlier. Among the female figurines, the clustering of the three groups appears consistent (Figure 16).

5. Conclusions

This study employed the use of clinical computed tomography to understand the production process of plaster figurines created by the Alice Springs artist Pat Elvins. It could show that all figurines were cast, but that casting techniques varied not only between casters (i.e., E&B vs E&M) but also among figurines of the same caster. The observed large diversity in process and matrix densities suggests that production was not standardized but occurred in smaller batches, possibly on demand of low-volume sales stock. This is supported by the apparent outliers in the 3D plots.
The majority of previous studies using CT scanning looked at the analysis of hidden contents (e.g., bodies in mummies), internal discrete cellular structure (e.g., wood examination for dendrochronology), or hidden construction components (e.g., armatures in sculptures). The study has shown the potential of non-destructive CT scanning to go beyond this and serve as a tool to examine the casting process itself as well as to contribute to an understanding of the nature of the plasters used. CT scanning cannot, however, replace various spectrometric methods to understand the chemical composition of the plasters. That requires access to matrix that is not covered in varnish (which is non-existent in the case of the specimens) or the destructive removal of sections of the varnish.

Author Contributions

Conceptualization, D.H.R.S.; Methodology, D.H.R.S. and C.L.S.; Formal analysis, D.H.R.S. and C.L.S.; Investigation, C.L.S.; Resources, D.H.R.S.; Data curation, C.L.S.; Writing—original draft, D.H.R.S.; Writing—review & editing, D.H.R.S. and C.L.S.; Supervision, D.H.R.S. All authors have read and agreed to the published version of the manuscript.

Funding

This research received no external funding.

Institutional Review Board Statement

Not applicable.

Data Availability Statement

Not applicable.

Acknowledgments

We are indebted to Anna Cliston (Dental Assistant, CSU Dental & Oral Health Clinic, Albury, NSW) for the manufacture of control targets from a range of dental cements; Julie Coleman (The Orien Group, Sydney) for the supply of a sample of Patternstone H dental plaster; Aileen Kilgariff (via Fran Kilgariff, Alice Springs, NT) who kindly donated sample OME1 to DHRS; Natalie McIntosh (Medical Imaging Manager-Wodonga, Albury-Wodonga Health) for facilitation of access to the CT-scanner; Luke Restall (Deputy Chief Radiographer, Albury-Wodonga Health) for performing the CT-scans.

Conflicts of Interest

The authors declare no conflict of interest.

References

  1. Wilson, R.D.; Wilkie, M. Bringing Them Home: Report of the National Inquiry into the Separation of Aboriginal and Torres Strait Islander Children from their Families; Human Rights and Equal Opportunity Commission: Canberra, Australia, 1997. [Google Scholar]
  2. Spennemann, D.H.R. Appropriating “Aboriginal” Australian Art in the Atomic Age. Cultural Appropriation and Stereotyping of Indigenous Australia in Gift and Souvenirs Ware of the 1950s to 1970s; Revised ed.; Retrospect: Albury, Australia, 2022. [Google Scholar]
  3. Conor, L. The ‘Piccaninny’: Racialized childhood, disinheritance, acquisition and child beauty. Postcolonial Stud. 2012, 15, 45–68. [Google Scholar] [CrossRef]
  4. Spennemann, D.H.R. Mid-Century Souvenirs of the Australian Outback: The portrayal of Indigenous Australians in Pat Elvins’ Sculptures. Arts 2023, in press. [Google Scholar]
  5. Informed decisions. Alice Springs Town Council LGA Community Profile. Available online: https://profile.id.com.au/rda-northern-territory/about?WebID=100 (accessed on 14 December 2022).
  6. Grimm, D. Pat’s sculptures feature many dimensions. Cent. Advocate 1988, 2. [Google Scholar]
  7. Anonymous. Native Figurines as Souvenirs. Age 1963, 11. [Google Scholar]
  8. Erickson, D. Commercial Art Pottery in Western Australia 1920s–1960s. Australiana 2003, 25, 28–35. [Google Scholar]
  9. Watt, R. Trying to preserve a culture. New art works tell old, old stories. Cent. Advocate 1971, 16. [Google Scholar]
  10. Anonymous. Artist claims work ‘pirated’. Cent. Advocate 1972. [Google Scholar]
  11. Harrington, E. Pat Elvins Aborigial Bust [Comment to a FaceBook Post by Vintage Hidden Gems]. 2022. Available online: https://m.facebook.com/115748969831713/photos/pcb.821829935890276/821829612556975/?type=3&eid=ARBEid1dAkcqsriGZiux90EDsKlgibEESzxqSlK8tdKBcNs2u8GqiLdo7TAY1fUEbovDb6v28qiop6ip (accessed on 7 February 2022).
  12. Promey, S.M. Chalkware, Plaster, Plaster of Paris. Medium Study. Conversat. Online J. Cent. Study Mater. Vis. Cult. Relig. 2014. [Google Scholar] [CrossRef] [Green Version]
  13. Clarke, C.D. Molding and Casting: Its Technic and Application; for Moulage Workers, Sculptors, Artists, Physicians, Dentists, Criminologists, Craftsmen, Pattern Makers and Architectural Modelers; John D. Lucas Company: Perrineville, NJ, USA, 1938. [Google Scholar]
  14. Spennemann, D.H.R. Stanislas Sorel’s zinc-based paints. Trans. Inst. Met. Finish. 2020, 98, 8–13. [Google Scholar] [CrossRef]
  15. Brown, S. Chatting with Centralians. A Recorded History of Thirty Centralians; Historical Society of the Northern Territory: Casuarina, Australia, 1998. [Google Scholar]
  16. Bibb, R.; McKnight, L. Identification of bird taxa species in ancient Egyptian mummies: Part 2, a qualitative evaluation of the utility of CT scanning and 3D printing. J. Archaeol. Sci. Rep. 2022, 46, 103668. [Google Scholar] [CrossRef]
  17. Sutherland, M.L. Use of Computed Tomography scanning in a ‘virtual’ bioarchaeology of care analysis of a Central Coast Peruvian mummy bundle. Int. J. Paleopathol. 2019, 25, 129–138. [Google Scholar] [CrossRef] [PubMed]
  18. Ventura, L.; Fornaciari, G.; Calabrese, A.; Arrizza, L.; Fornaciari, A. Paleopathology of a 19th century mummy of a nobleman from Popoli, central Italy. Med. Hist. 2020, 4, 29–34. [Google Scholar]
  19. Lynnerup, N. Medical Imaging of Mummies and Bog Bodies—A Mini-Review. Gerontology 2009, 56, 441–448. [Google Scholar] [CrossRef] [PubMed]
  20. Ventura, L.; Bruno, F.; Barile, A.; Masciocchi, C. Bilateral fabella in the mummy of the Blessed Jean Bassand (c. 1360–1445): A unique description in ancient human remains. Int. J. Osteoarchaeol. 2021, 31, 1276–1279. [Google Scholar] [CrossRef]
  21. Ngan-Tillard, D.; Zeiler, J. Neolithic Human Diet Based on Studies of Coprolites from the Swifterbant Culture Sites, the Netherlands: Micro-CT scanning analysis. In Neolithic Human Diet Based on Studies of Coprolites from the Swifterbant Culture Sites, the Netherlands; Cultural Heritage Agency of the Netherlands: The Hague, The Netheralnds, 2022; pp. 45–60. [Google Scholar]
  22. Wilson, P.F.; Smith, M.P.; Hay, J.; Warnett, J.M.; Attridge, A.; Williams, M.A. X-ray computed tomography (XCT) and chemical analysis (EDX and XRF) used in conjunction for cultural conservation: The case of the earliest scientifically described dinosaur Megalosaurus bucklandii. Herit. Sci. 2018, 6, 58. [Google Scholar] [CrossRef]
  23. Bossema, F.G.; Coban, S.B.; Kostenko, A.; van Duin, P.; Dorscheid, J.; Garachon, I.; Hermens, E.; van Liere, R.; Batenburg, K.J. Integrating expert feedback on the spot in a time-efficient explorative CT scanning workflow for cultural heritage objects. J. Cult. Herit. 2021, 49, 38–47. [Google Scholar] [CrossRef]
  24. Bulcke, J.V.D.; Van Loo, D.; Dierick, M.; Masschaele, B.; Van Hoorebeke, L.; Van Acker, J. Nondestructive research on wooden musical instruments: From macro- to microscale imaging with lab-based X-ray CT systems. J. Cult. Herit. 2017, 27, S78–S87. [Google Scholar] [CrossRef]
  25. Dorscheid, J.; Bossema, F.G.; van Duin, P.; Coban, S.B.; van Liere, R.; Batenburg, K.J.; Di Stefano, G.P. Looking under the skin: Multi-scale CT scanning of a peculiarly constructed cornett in the Rijksmuseum. Herit. Sci. 2022, 10, 161. [Google Scholar] [CrossRef]
  26. Bello, S.; De Groote, I.; Delbarre, G. Application of 3-dimensional microscopy and micro-CT scanning to the analysis of Magdalenian portable art on bone and antler. J. Archaeol. Sci. 2013, 40, 2464–2476. [Google Scholar] [CrossRef]
  27. Masson-Berghoff, A.; O’Flynn, D. Absent, invisible or revealed ‘relics’? X-radiography and CT scanning of Egyptian bronze votive boxes from Naukratis and elsewhere. Br. Mus. Stud. Anc. Egypt Sudan 2019, 24, 159–174. [Google Scholar]
  28. Björngrim, N.; Myronycheva, O.; Fjellström, P.-A. The use of large-scale X-ray computed tomography for the evaluation of damaged structural elements from an old timber bridge. Wood Mater. Sci. Eng. 2022, 17, 1028–1029. [Google Scholar] [CrossRef]
  29. Rankin, K.E.; Hazell, Z.J.; Middleton, A.M.; Mavrogordato, M.N. Micro-focus X-ray CT scanning of two rare wooden objects from the wreck of the London, and its application in heritage science and conservation. J. Archaeol. Sci. Rep. 2021, 39, 103158. [Google Scholar] [CrossRef]
  30. Okochi, T. A nondestructive dendrochronological study on japanese wooden shinto art sculptures using micro-focus X-ray Computed Tomography (CT): Reviewing two methods for scanning objects of different sizes. Dendrochronologia 2016, 38, 1–10. [Google Scholar] [CrossRef]
  31. Domínguez-Delmás, M.; Bossema, F.G.; van der Mark, B.; Kostenko, A.; Coban, S.B.; van Daalen, S.; van Duin, P.; Batenburg, K.J. Dating and provenancing the Woman with lantern sculpture—A contribution towards attribution of Netherlandish art. J. Cult. Herit. 2021, 50, 179–187. [Google Scholar] [CrossRef]
  32. Daly, A.; Streeton, N.L.W. Non-invasive dendrochronology of late-medieval objects in Oslo: Refinement of a technique and discoveries. Appl. Phys. A 2017, 123, 431. [Google Scholar] [CrossRef]
  33. Badde, A.; Illerhaus, B. Three Dimensional Computerized Microtomography in the Analysis of Sculpture. Scanning 2008, 30, 16–26. [Google Scholar] [CrossRef]
  34. Vuola, K.; Reijonen, H.; Kaasalainen, T.; Saat, R. Medieval Wood Sculpture of an Unknown Saint from Nousiainen: From Materials to Meaning. Mirator 2018, 19, 43–66. [Google Scholar]
  35. Munsell Color. Munsell Soil Color Charts; Macbeth Division of Kollmorgen Instruments: Baltimore, MD, USA, 1975. [Google Scholar]
  36. Gerharz, R.R.; Lantermann, R.; Spennemann, D.H.R. Munsell Color Charts: A necessity for archaeologists? Aust. J. Hist. Archaeol. 1988, 6, 88–95. [Google Scholar]
  37. Madansky, A. Alternative Approaches to Significance Testing with Weighted Means; The Analytical Group, Inc.: Chicago, IL, USA, 2020. [Google Scholar]
  38. Analytical Group. SigTest [Significance Calculator]. 2020. Available online: https://www.analyticalgroup.com/download/Alternative%20Approaches.pdf (accessed on 15 February 2023).
  39. Grehn, M.; Stille, M.; Ziemann, C.; Cremers, F.; Rades, D.; Buzug, T.M. A New Phantom for Individual Verification of the Dose Distribution in Precision Radiotherapy for Head-and-Neck Cancer. Anticancer Res. 2019, 39, 6931–6938. [Google Scholar] [CrossRef] [Green Version]
  40. Alrehily, F.; Hogg, P.; Twiste, M.; Johansen, S.; Tootell, A. Development and validation of a bespoke phantom to test accuracy of Cobb angle measurements. Radiography 2019, 26, e78. [Google Scholar] [CrossRef]
  41. Schneider, U.; Pedroni, E.; Lomax, A. The calibration of CT Hounsfield units for radiotherapy treatment planning. Phys. Med. Biol. 1996, 41, 111–124. [Google Scholar] [CrossRef] [PubMed]
  42. Ali, A.M.; Hogg, P.; Johansen, S.; England, A. Construction and validation of a low cost paediatric pelvis phantom. Eur. J. Radiol. 2018, 108, 84–91. [Google Scholar] [CrossRef]
  43. Babcock, L.E. Casting with plaster of Paris. Paleontol. Soc. Spec. Publ. 1989, 4, 320–325. [Google Scholar] [CrossRef]
  44. Norsker, H.; Danisch, J. Mouldmaking and Plaster of Paris. In Forming Techniques—For the Self-Reliant Potter; Norsker, H., Ed.; Springer: Berlin/Heidelberg, Germany, 1991; pp. 114–147. [Google Scholar]
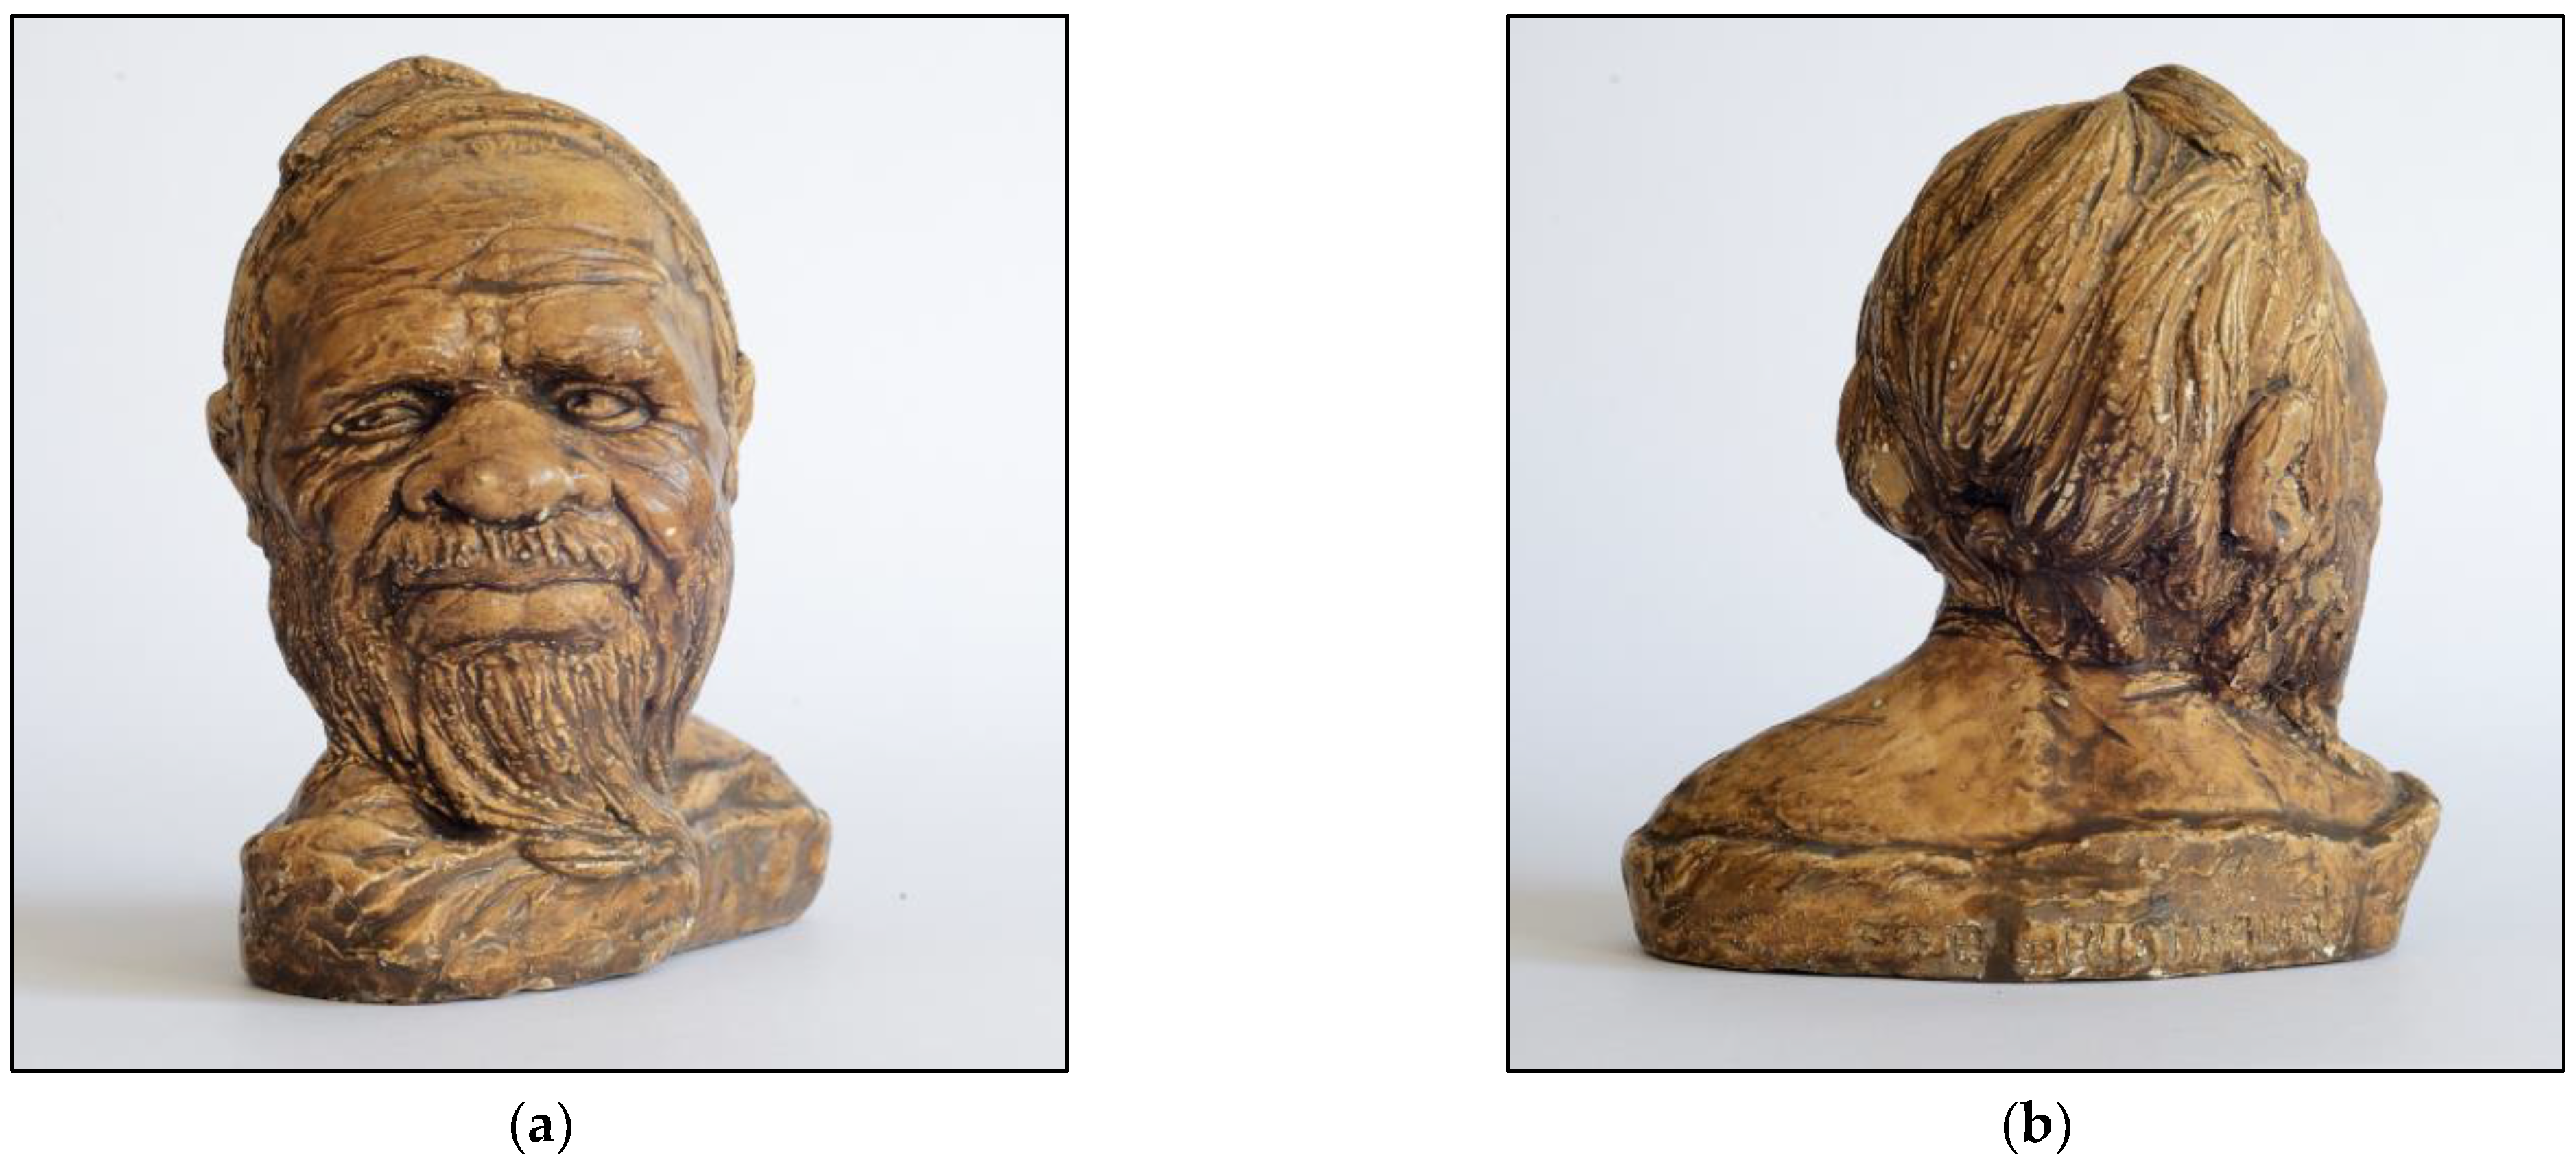
Figure 1. Figurine of a male elder by Pat Elvins. Shown is specimen OMB1. For dimensions, see Table 1.
Heritage 06 00120 g001aHeritage 06 00120 g001b
Figure 2. Figurine of a female elder by Pat Elvins. Shown is specimen OWB1. For dimensions, see Table 1.
Heritage 06 00120 g002aHeritage 06 00120 g002b
Figure 3. Terminology used for the description of Computed Tomography scans of the figurines. (a) Coronal plane; (b) sagittal plane, (c) transverse plane; (d) definitions for the endpoint of the planes.
Heritage 06 00120 g003
Figure 4. Specimen OMB2. Sagittal plane (left) and coronal plane (right). (a) Less dense matrix along occipital and right parietal part (1473 ± 548 HU); (b) main matrix (1555 ± 557). The scale bar represents 10 mm.
Heritage 06 00120 g004
Figure 5. Specimen OME1. Sagittal plane (left) and coronal plane (right). (a) Less dense matrix along occipital and right parietal part (1321 ± 523 HU); (b) main matrix (1329 ± 506). The scale bar represents 10 mm.
Heritage 06 00120 g005
Figure 6. Specimen OMM1. Coronal plane, slices 118/238 (left) and 139/238 (right). (a) Denser matrix along the right occipital area of the figurine (1260 ± 309 HU); (b) main matrix (899 ± 334 HU); (c) inclusion of denser matrix, 3 × 14 mm (1604 ± 523 HU); (d) defined area of same matrix as the majority of the head, 5–9 × 29 mm (899 ± 325 HU); (e) denser matrix at the base (1014 ± 226 HU); (f) trapped air bubble 3 × 6 mm (−1062 ± 416 HU). The scale bar represents 10 mm.
Heritage 06 00120 g006
Figure 7. Specimen OMM1. Sagittal plane (left) and transverse plane (right). (a) Denser matrix along the frontal area of the figurine; (b) main matrix; (c) inclusion of denser matrix; (d) defined area of same matrix as the majority of the head; (e) denser matrix at the base. The scale bar represents 10 mm.
Heritage 06 00120 g007
Figure 8. Specimen OMM3. Sagittal plane (left) and coronal plane (right). (a) Denser matrix along the frontal area of the figurine (971 ± 202 HU); (b) main matrix (533 ± 134 HU); (c) well-defined inclusions of denser matrix (1113 ± 227 HU); (d) banding in a deep convex shape (960 ± 211 HU); (e) amorphous inclusion of denser matrix (1119 ± 154 HU). The scale bar represents 10 mm.
Heritage 06 00120 g008
Figure 9. Specimen OMP1. (a) Sagittal plane; (b) coronal plane; (c) transverse plane of interface between the two matrices, slice toward the proximal end of the head; (d) transverse plane of interface between the two matrices, slice toward the distal end of the head. The scale bar represents 10 mm.
Heritage 06 00120 g009
Figure 10. Specimen OWM1. Sagittal plane (left) and coronal plane (right). (a) Denser matrix along the parietal area of the figurine (1586 ± 301 HU); (b) main matrix (998 ± 404 HU). The scale bar represents 10 mm.
Heritage 06 00120 g010
Figure 11. Weighted averages (with standard deviations) of the Hounsfield units of the control targets and the main and edge matrices of the specimens examined in this study.
Heritage 06 00120 g011
Figure 12. Seriation of weighted averages (with standard deviations) of the Hounsfield units of the control targets and the main matrices of the specimens examined in this study. The shaded area encompasses all samples where the density of the main matrix does not differ significantly from that of control sample DP (dental plaster).
Heritage 06 00120 g012
Figure 13. Seriation of weighted averages (with standard deviations) of the Hounsfield units of the control targets and the main matrices of the specimens examined in this study. The shaded area encompasses all samples where the density of the main matrix does not differ significantly from that of control sample PL (Plaster of Paris).
Heritage 06 00120 g013
Figure 14. Seriation of weighted averages (with standard deviations) of the Hounsfield units of the control targets and the main matrices of the specimens examined in this study. The shaded area encompasses all samples where the density of the edge matrix does not differ significantly from that of the control sample DP (dental plaster).
Heritage 06 00120 g014
Figure 15. Three-dimensional scatter plot of volume weight and average Hounsfield Units of male figurines. Scatterplot generated with MiaBella online visualization.
Heritage 06 00120 g015
Figure 16. Three-dimensional scatter plot of volume weight and average Hounsfield Units of female figurines. Scatterplot generated with MiaBella online visualization.
Heritage 06 00120 g016
Table 1. Details of the figurines examined in this study.
CodeSignatureDimensionsWeightColor
Male Figurines
OMB1E & B103 × 73 × 113 mm408.3 g10 YR 6.5/8
OMB2E & B103 × 60 × 104 mm400.3 g10 YR 6.5/7
OME1Pat Elvins102 × 67 × 113 mm402.4 g5 YR 6.5/7
OMM1E & M101 × 70 × 103 mm262.9 g10 YR 6.5/5
OMM2E & M99 × 67 × 117 mm285.9 g10 YR 4.5/6
OMM3E & M101 × 70 × 105 mm259.5 g10 YR 4.5/5
OMM4E & M101 × 64 × 106 mm376.3 g10 YR 7/5
OMP1E & P100 × 71 × 104 mm312.3 g10 YR 6.5/7
Female Figurines
OWB1E & B93 × 65 × 95 mm308.4 g10 YR 5.5/8
OWM1E & M95 × 61 × 97 mm258.2 g10 YR 7.5/5
OWM2E & M93 × 66 × 96 mm269.2 g10 YR 7/6
OWP1E & P94 × 65 × 96 mm260.6 g10 YR 6.5/6
OWP2E & P94 × 65 × 96 mm258.7 g10 YR 7.5/4
Table 2. Characteristics and technical details of the control targets.
CodeManufacturerBrandH2O
mL/100 g
Stated Strength
(mPa) at 1 h/24 h
DPAinsworthDental plaster45–50 *10/15
GLordellGypsum Yellowstone33 *24/n.s.
OAinsworthOrtho plaster33–35 *21/41
PHInvestoPatternstone H32 *28/70
PH 15InvestoPatternstone H48 **?
PH 20InvestoPatternstone H64 **?
PLDingoPlaster of Paris75n/a
YAinsworthYellowstone28–30 *25/51
* as per instructions; ** modified concentration to reduce viscosity; n.s. not stated.
Table 3. Hounsfield unit measurements of the density of the figurines and targets as well as the significance of difference between the densities of the main matrix and the edge matrix. n = number of density samples taken.
Main MatrixEdge Matrixt-TestGlobular Cavities in Main Matrix
SampleAvgStdnAvgStdnpAvgStdn/100 mm2
Controls
DP1278.23156.0910
G2109.44149.8010
O2053.45148.7810
PH2059.61160.6010
PH 151943.71159.7110
PH 201824.46176.9110
PL1030.84193.8410
Y2267.45154.3510
Male Figurines
OMB11432.18627.8910−1433.73836.3771.00
OMB21498.16543.77101543.35620.94100.8630−1294.62885.3170.88
OME11337.68445.37101377.32415.00100.8369−1539.68670.3860.25
OMM1956.71358.01101285.77274.6630.0913−1244.23405.0070.69
OMM21021.30392.66101442.12310.3930.0536−1057.10643.0370.56
OMM3538.49127.58101116.26210.3130.0000−1110.90328.0671.81
OMM41541.13524.3810−1278.22821.5271.25
OMP11007.18417.93101311.50375.36100.0867−1372.91699.077none
Female Figurines
OWB11453.69547.4410−1416.61665.5272.13
OWM1996.44408.84101607.26297.6850.0010−1221.96539.2270.75
OWM21198.41324.0910−1546.36529.2970.94
OWP11114.86358.25101522.24300.3180.0087−1451.32440.4371.50
OWP21049.77383.66101453.00309.6950.0867−1555.51483.6570.88
Table 4. Homogeneity of the matrix of specimens (average proportions of the standard deviation of an ROI in relation to the calculated average Hounsfield unit of the ROI. Specimens without edge matrix omitted. n = number of density samples taken.
Main MatrixEdge Matrix
SampleAvgStdnAvgStdnp
Male Figurines
DP12.013.9210
G7.110.4110
O7.271.7410
PH7.931.5910
PH 158.553.5310
PH 209.842.2010
PL16.792.3010
Y6.811.5410
Male Figurines
OMB239.986.201036.867.35100.3186
OME133.947.261033.084.20100.7483
OMM138.557.521022.852.8780.0001
OMM238.597.341021.812.2930.0001
OMM323.662.301018.851.9930.0264
OMP141.156.871028.772.68100.0002
Female Figurines
OWM141.869.631018.222.1150.0000
OWP132.387.941020.103.9580.0008
OWP236.697.971021.794.6350.0006
Table 5. Volumetric and density data of the figurines. Volume and average Hounsfield Units as calculated by Vitrea software.
CodeVolumeAverage HUWeight
OMB1279.76 mL1714.3 +/− 303.1408.3 g
OMB2259.61 mL1886.1 +/− 333.1400.3 g
OME1280.51 mL1636.2 +/− 264.5402.4 g
OMM1220.91 mL1173.8 +/− 243.3262.9 g
OMM2229.31 mL1288.9 +/− 240.9285.9 g
OMM3219.59 mL604.1 +/− 138.5259.5 g
OMM4243.69 mL1857.4 +/−336.9376.3 g
OMP1237.00 mL1408.2 +/− 281.7312.3 g
OWB1204.36 mL1811.8 +/− 339.9308.4 g
OWM1206.95 mL1273.1 +/− 229.6258.2 g
OWM2206.09 mL1412.7 +/− 236.7269.2 g
OWP1202.17 mL1370.5 +/− 241.3260.6 g
OWP2204.41 mL1315.7 +/− 227.4258.7 g
Disclaimer/Publisher’s Note: The statements, opinions and data contained in all publications are solely those of the individual author(s) and contributor(s) and not of MDPI and/or the editor(s). MDPI and/or the editor(s) disclaim responsibility for any injury to people or property resulting from any ideas, methods, instructions or products referred to in the content.