

Investigation of Egyptian Blue on a Fragmentary Egyptian Head Using ER-FTIR Spectroscopy and VIL Imaging

Abstract
:1. Introduction
2. Materials and Methods
2.1. FTIR Spectroscopy
2.2. Optical Microscopy
2.3. Imaging Techniques
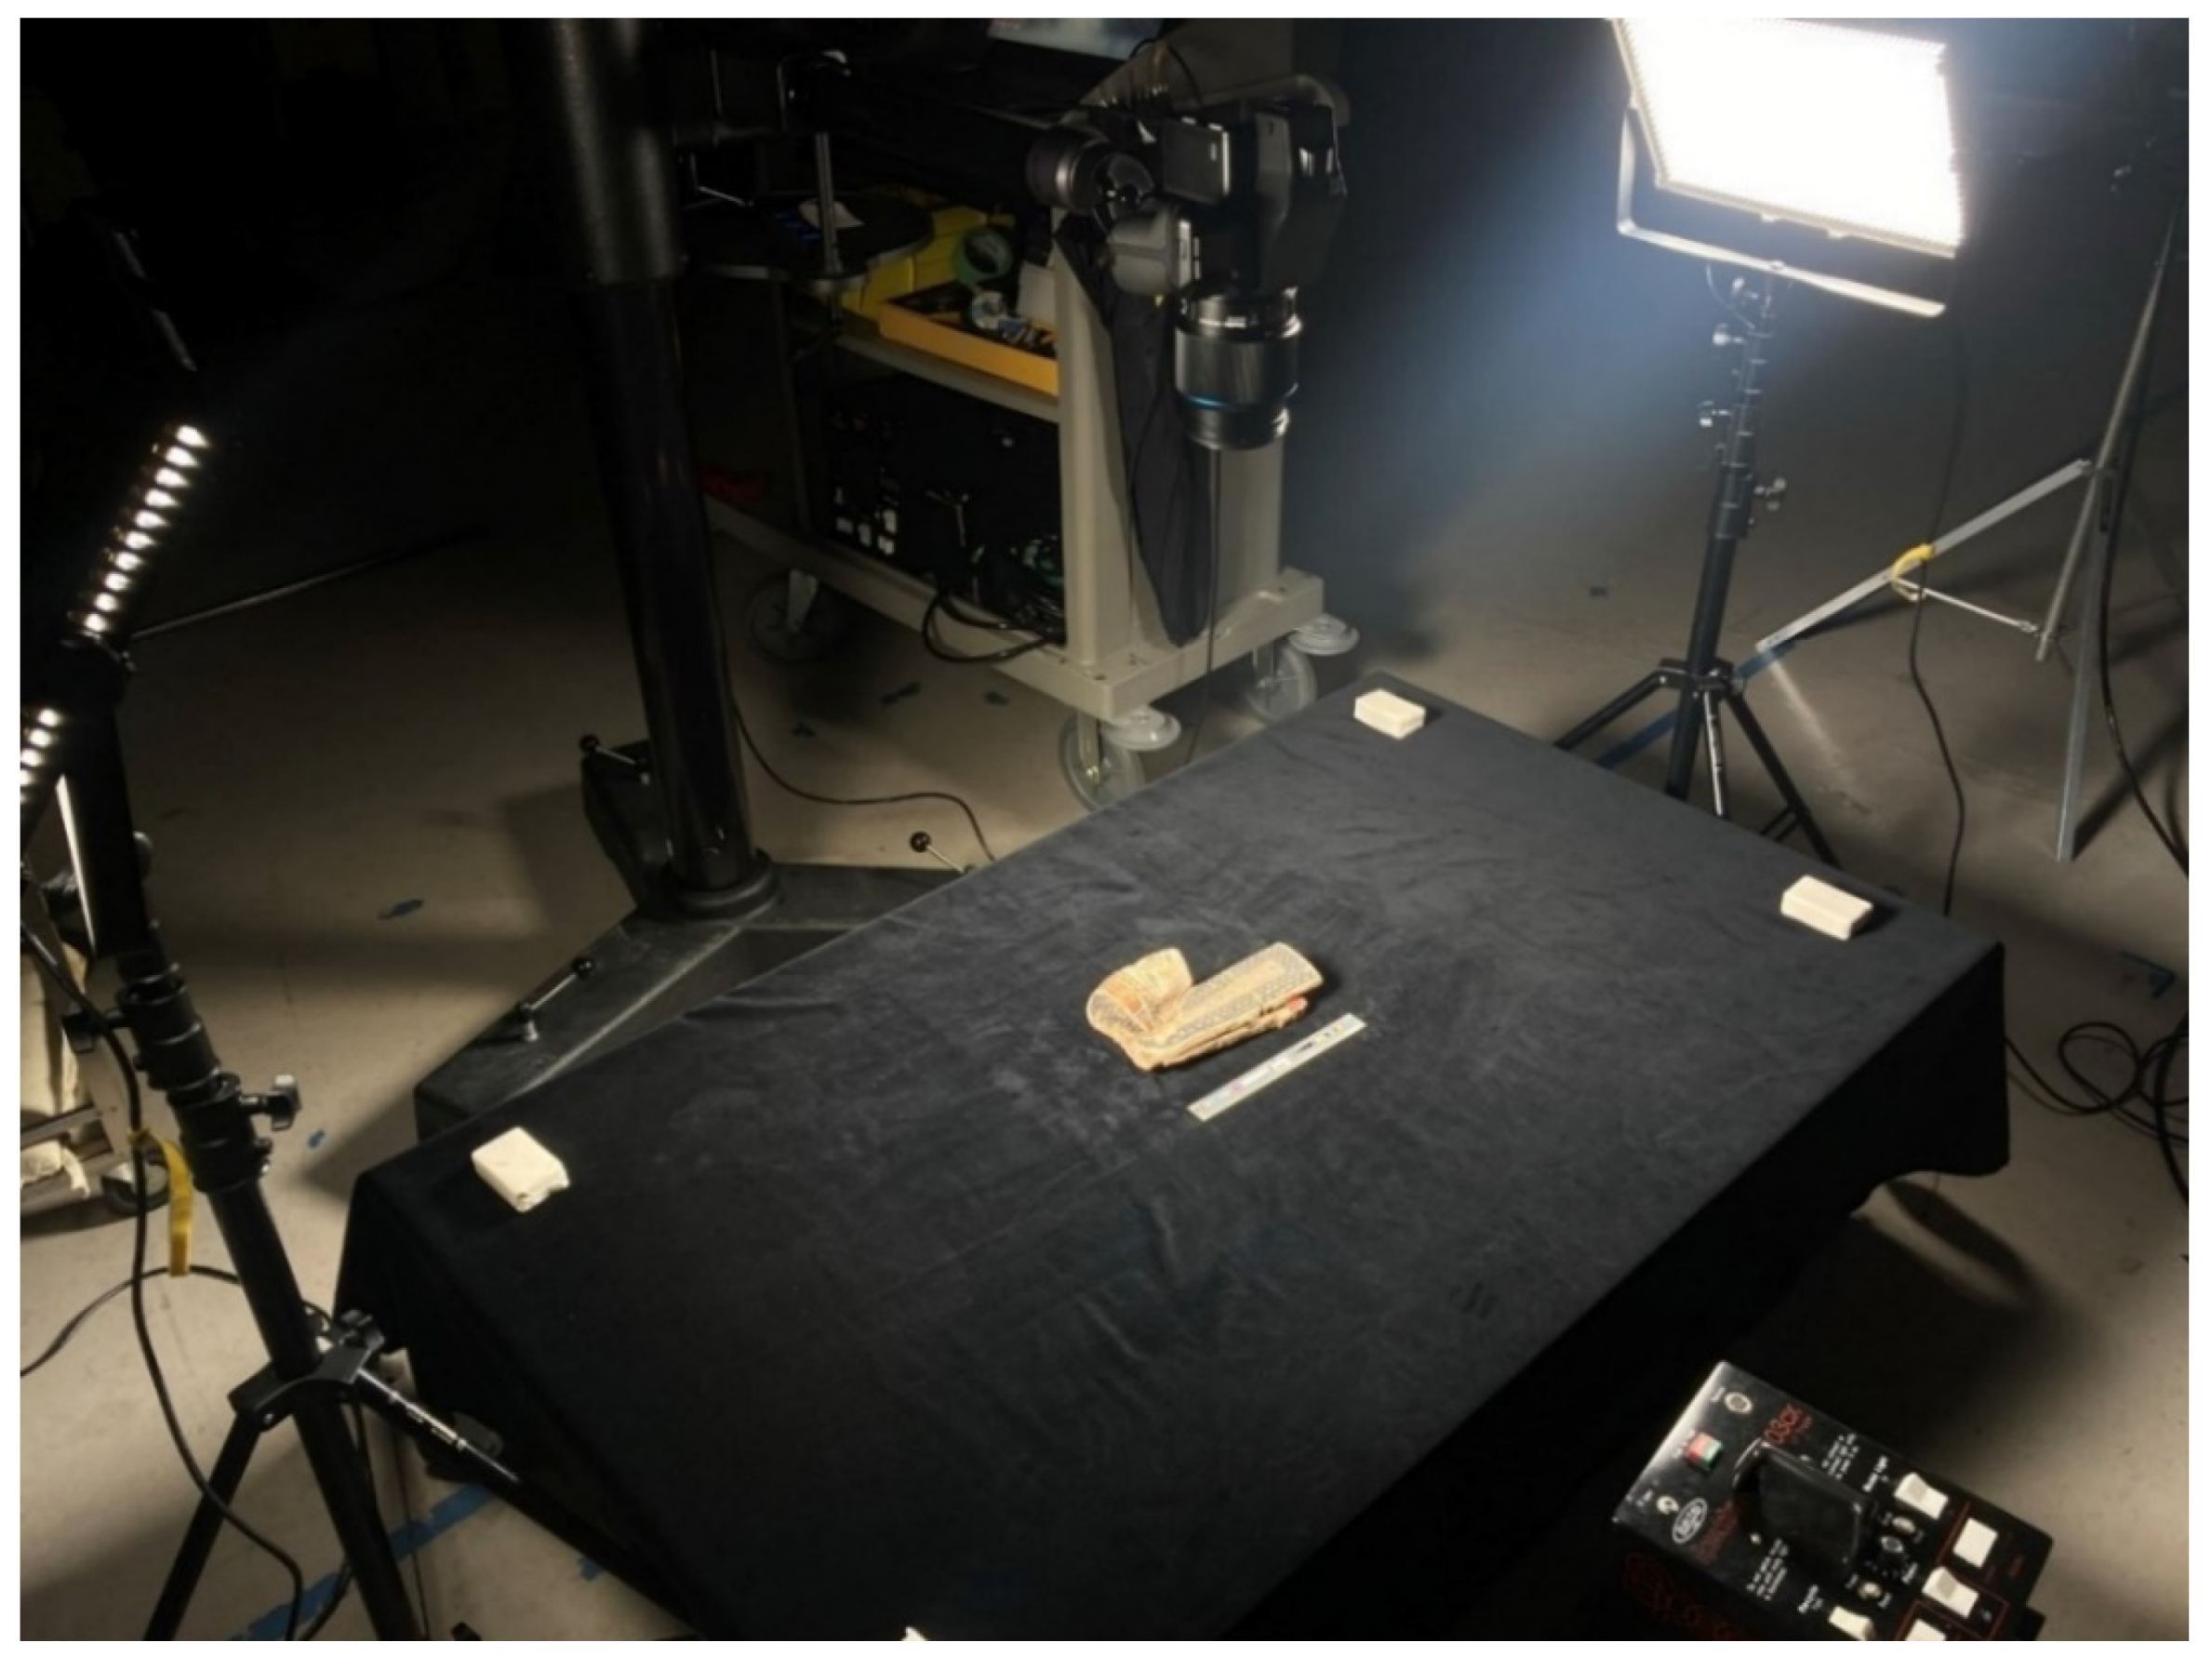
2.3.1. Set-Up
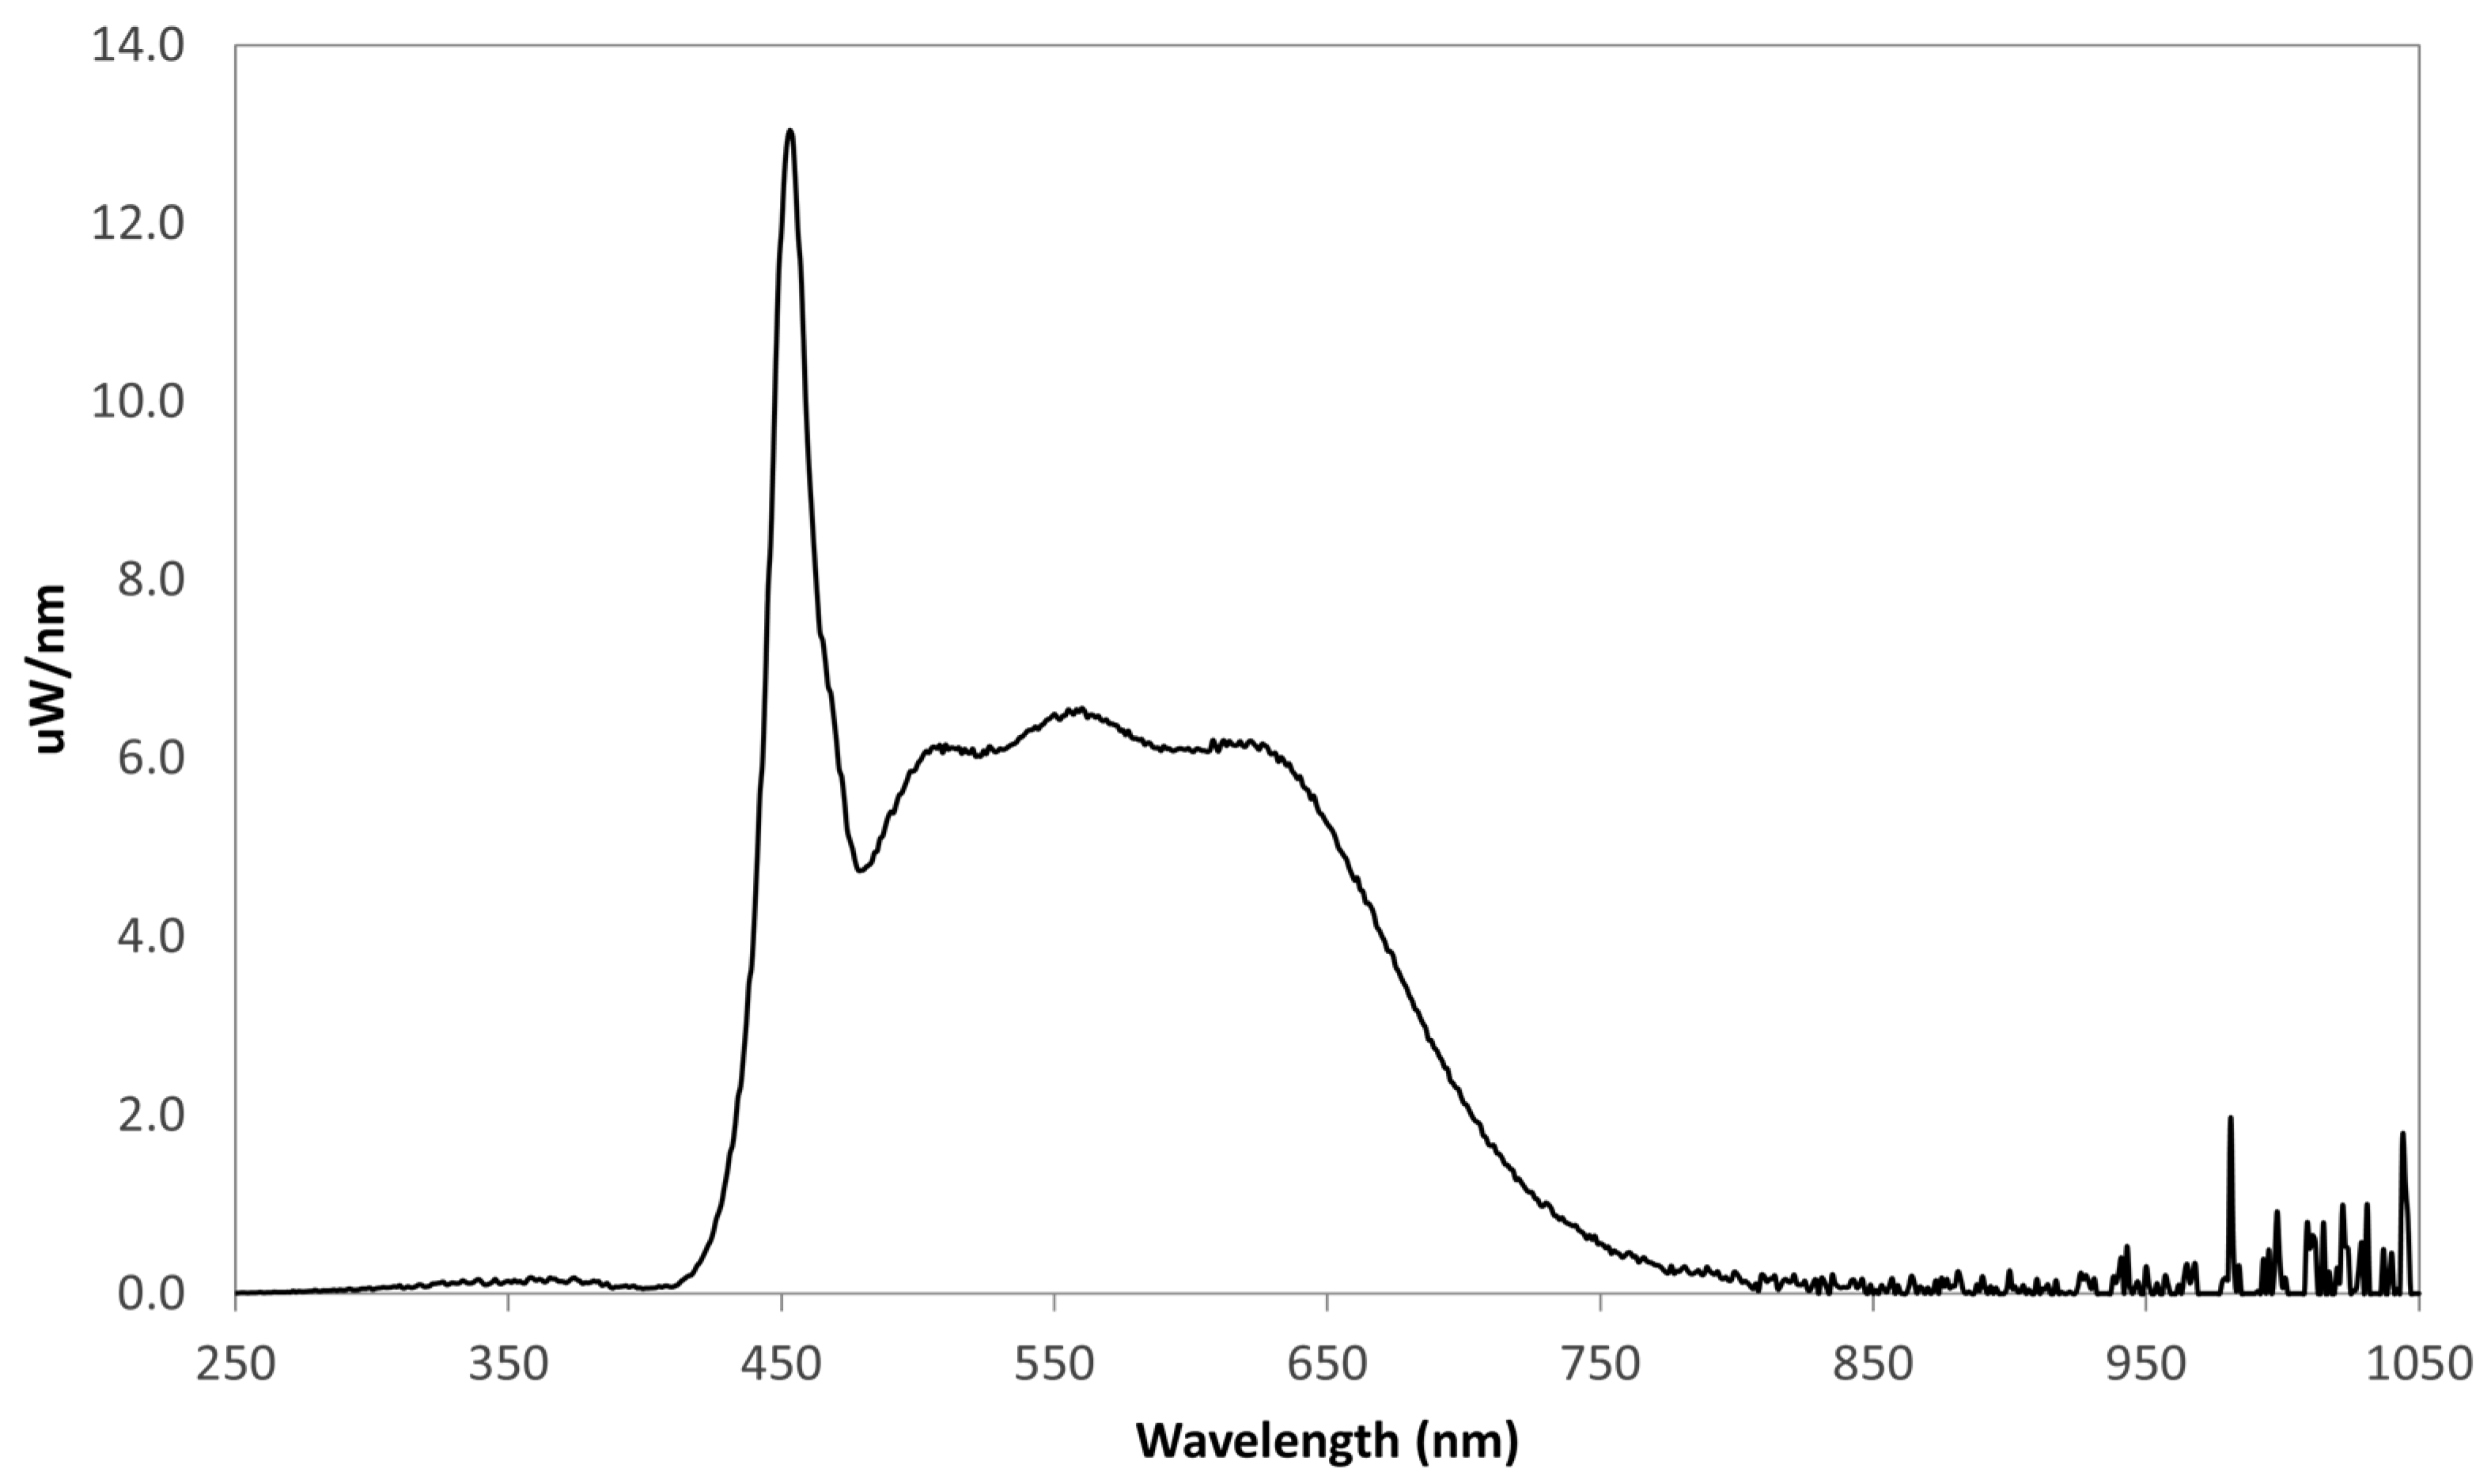
2.3.2. Visible Light (VIS) Imaging
2.3.3. Visible-induced Infrared Luminescence (VIL) Imaging
2.3.4. Focus Stacking
2.3.5. Image Processing
3. Results
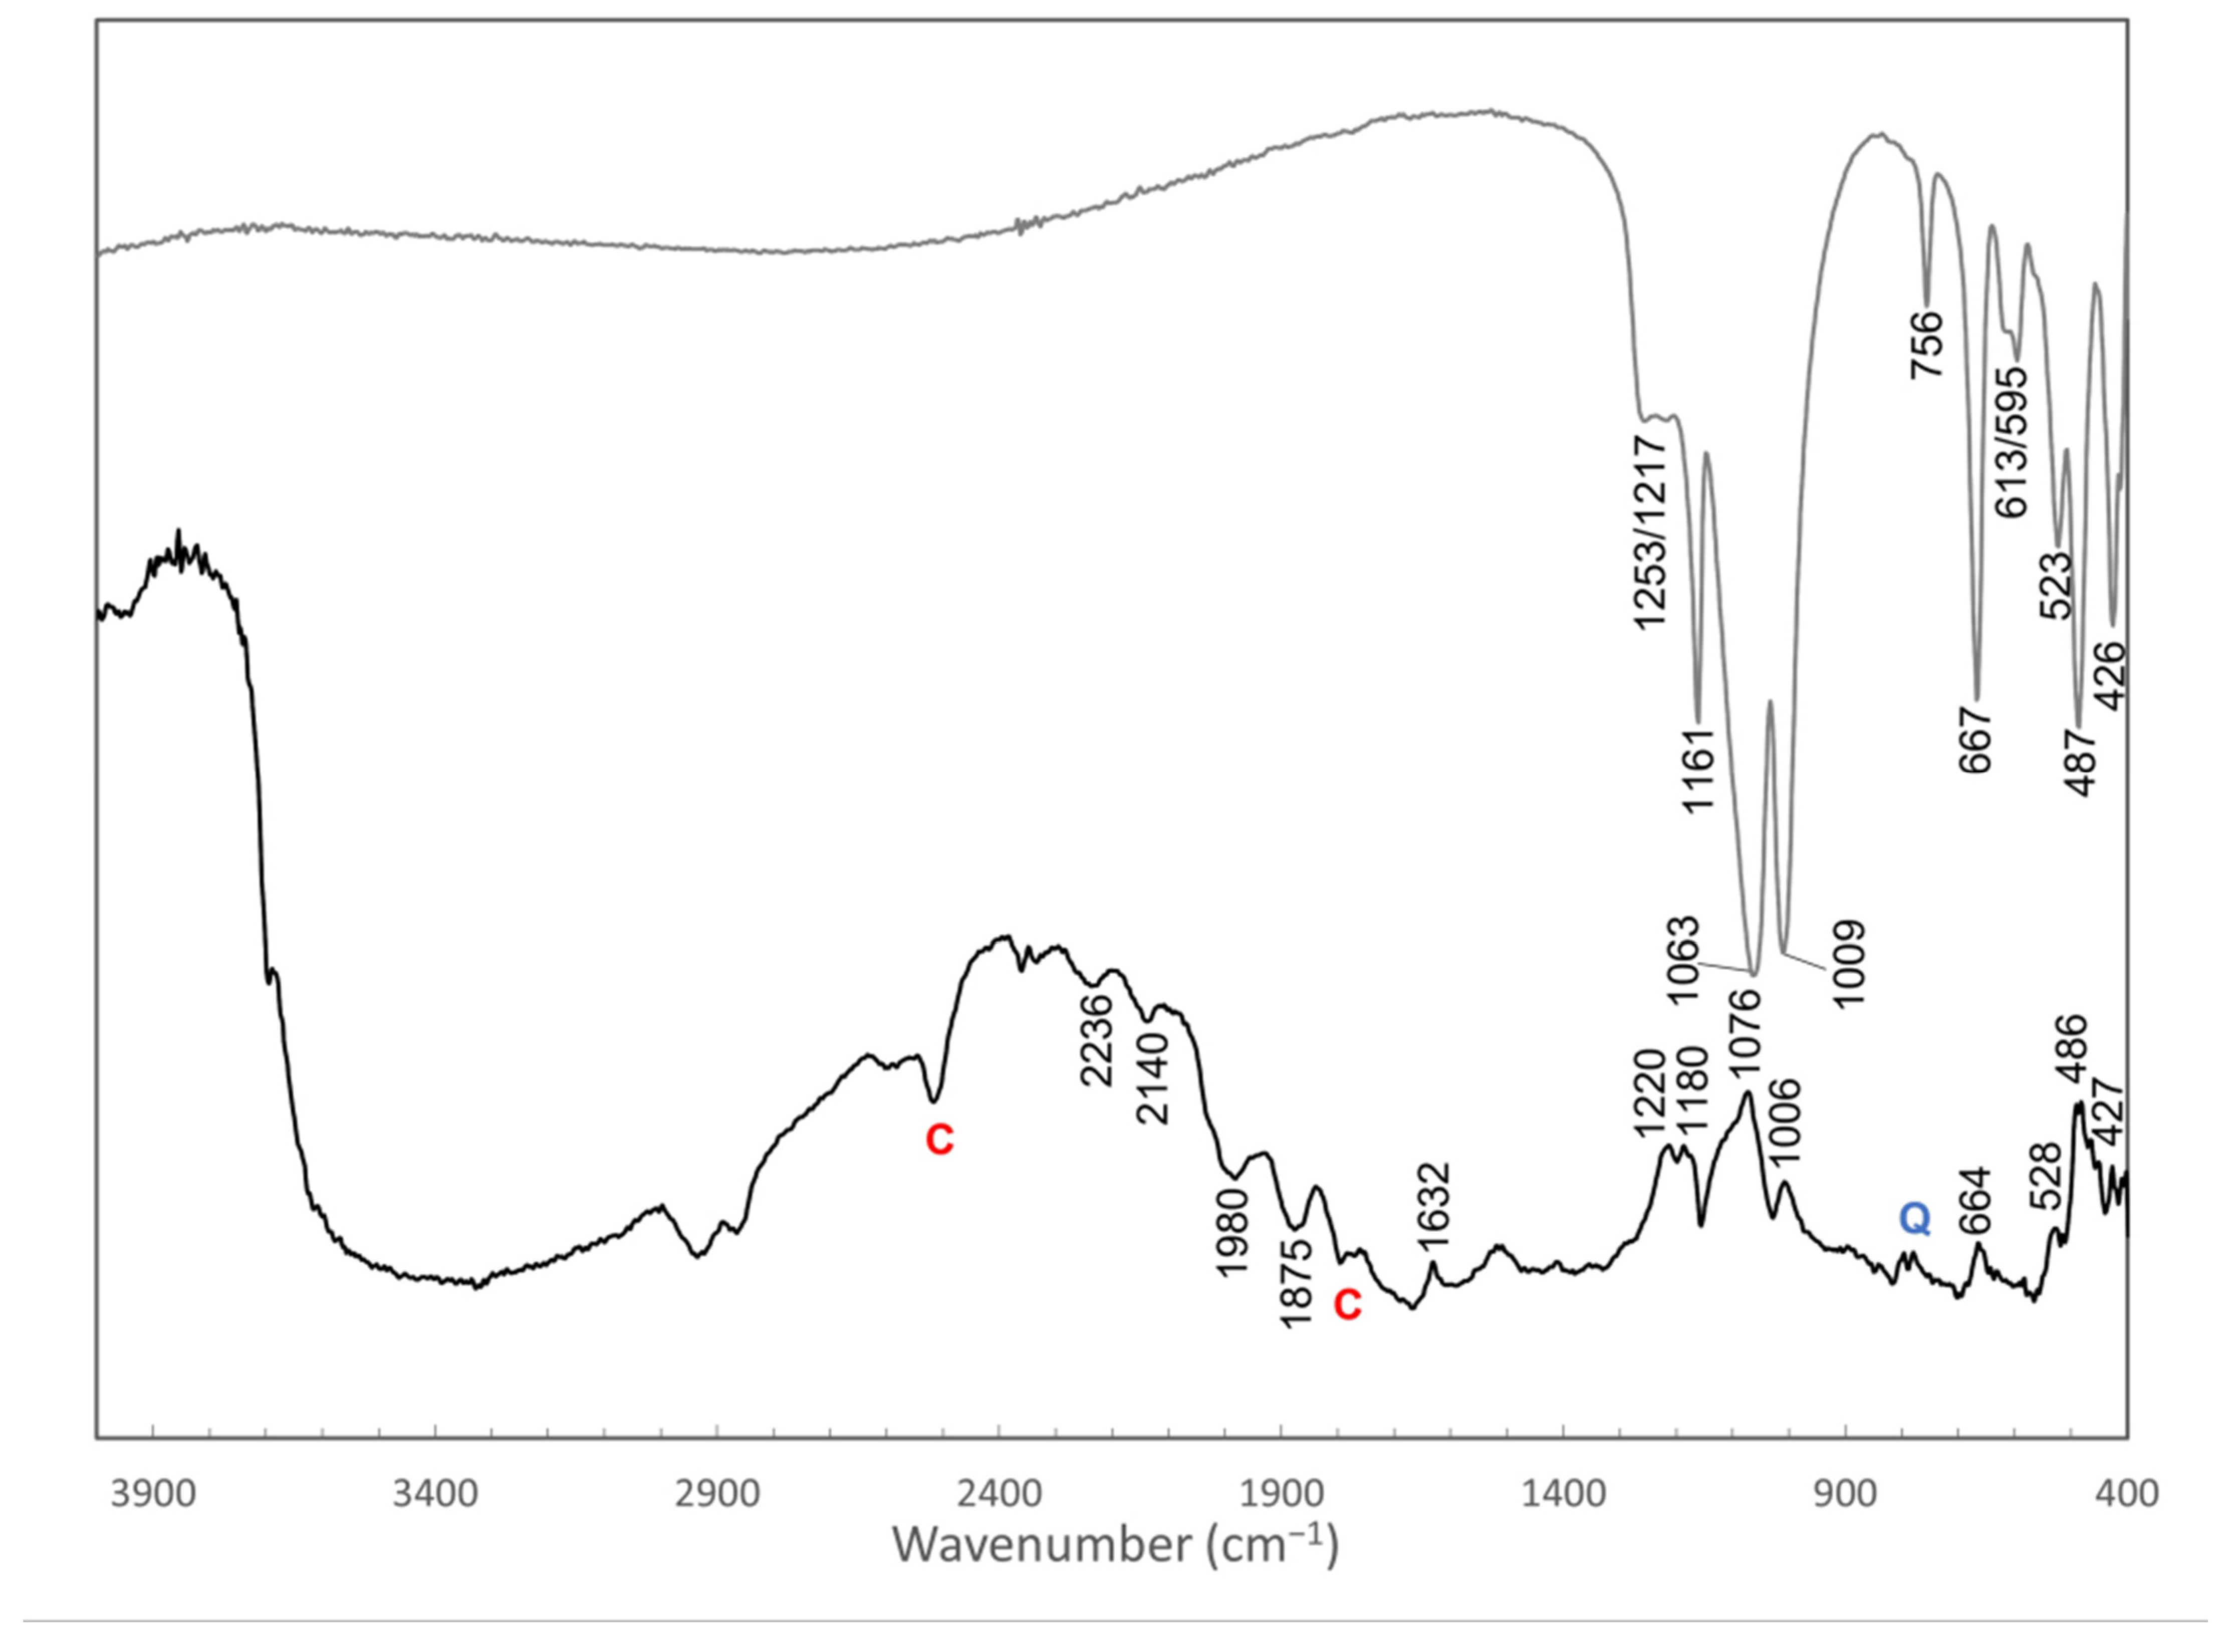
3.1. Analysis
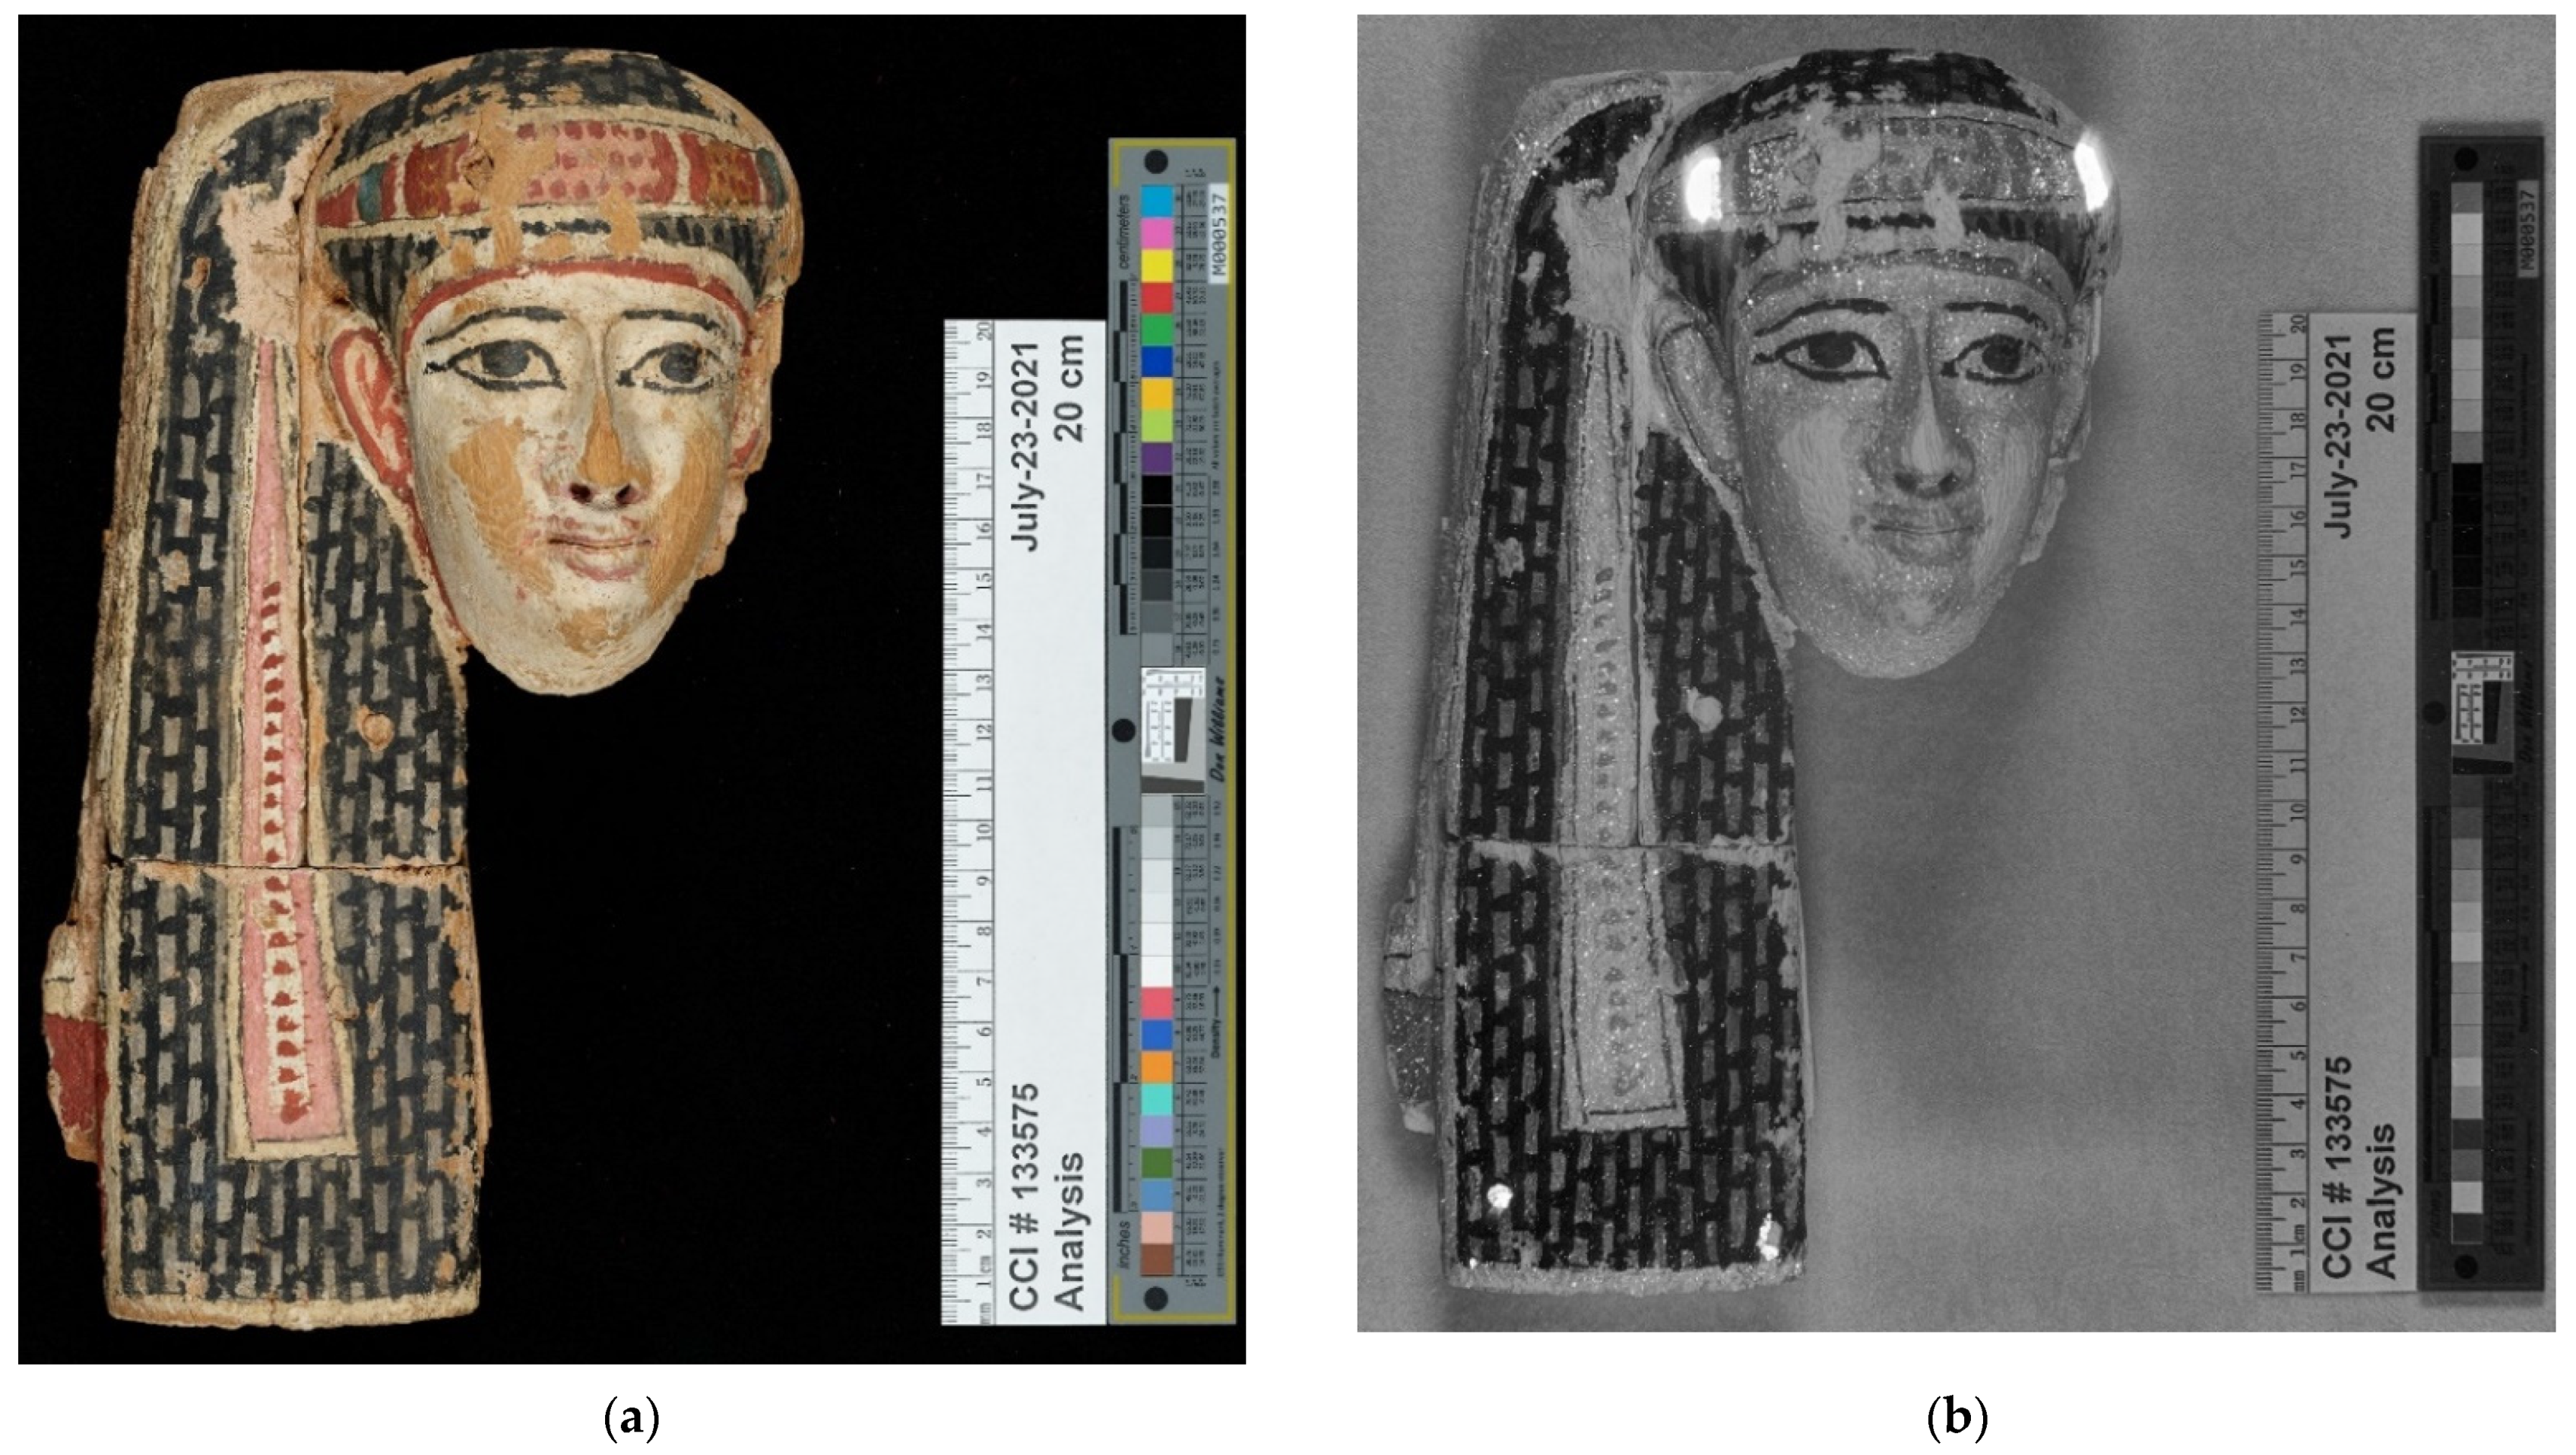
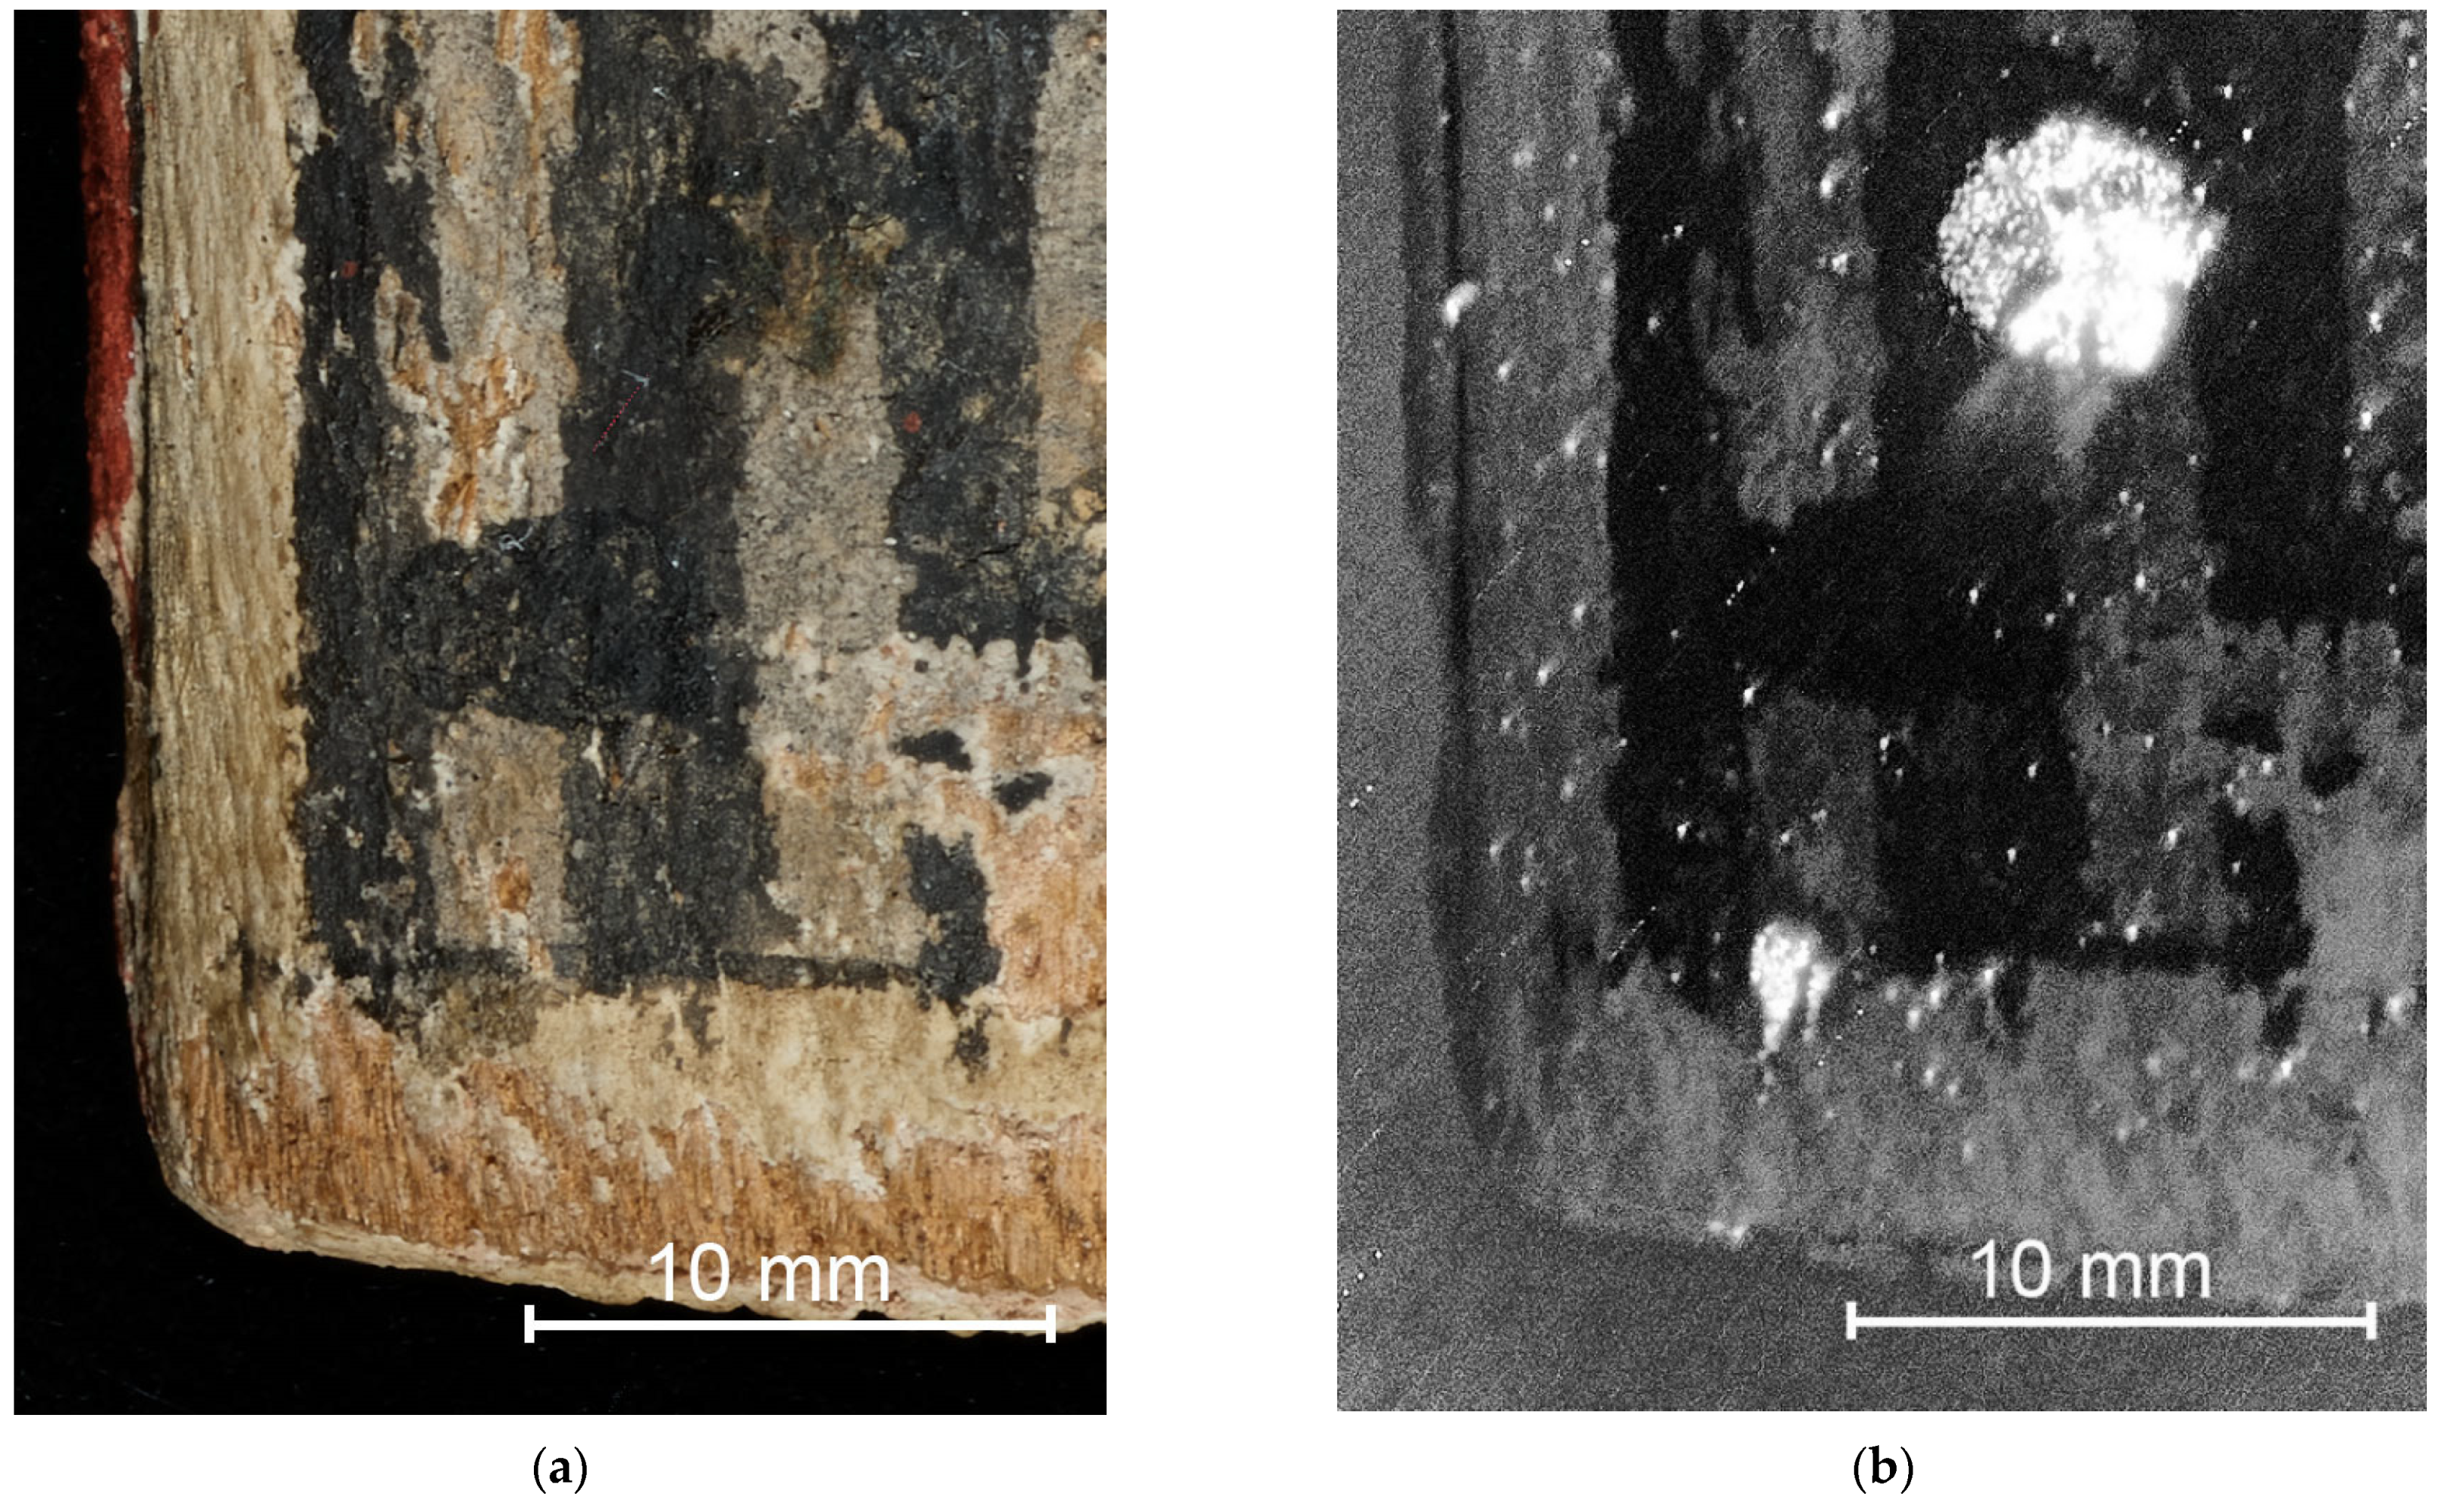
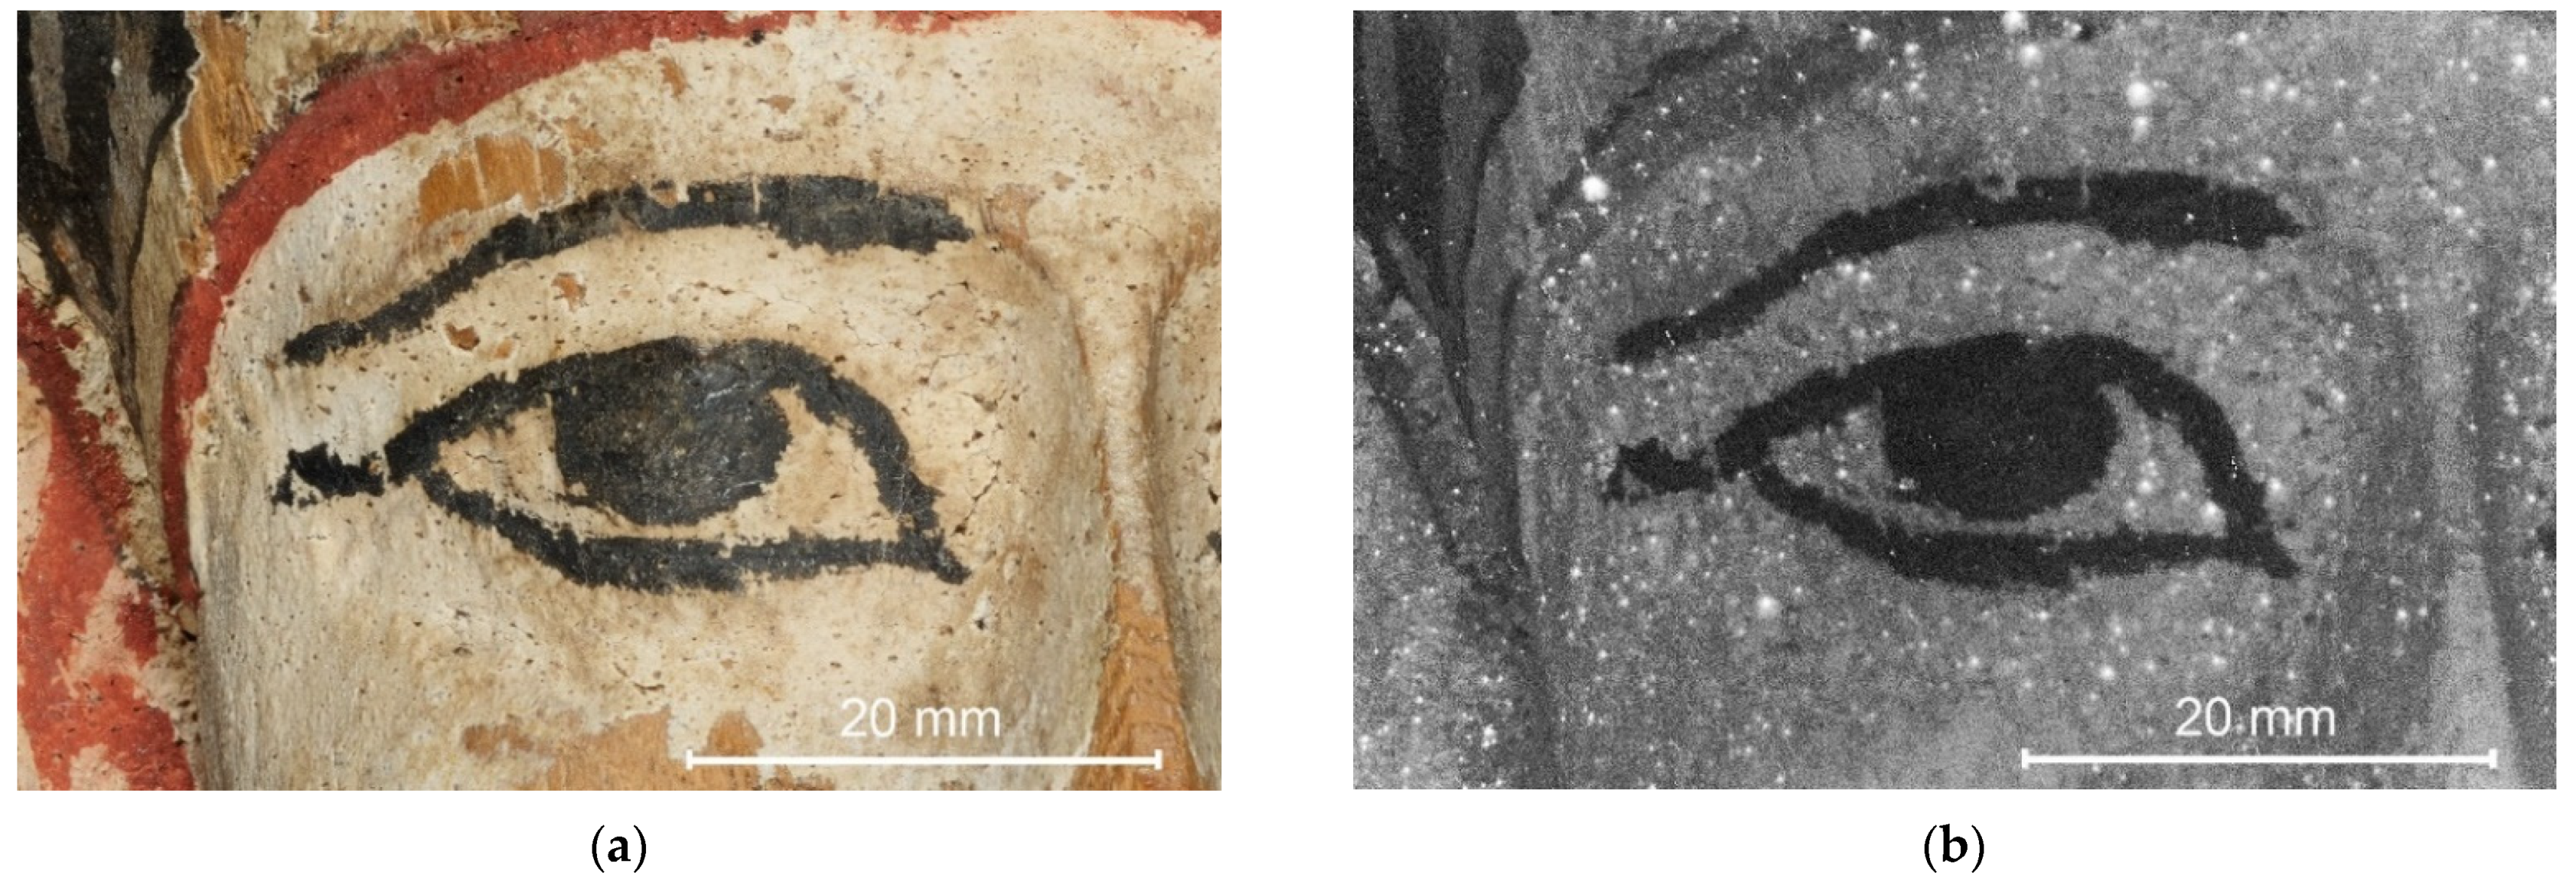
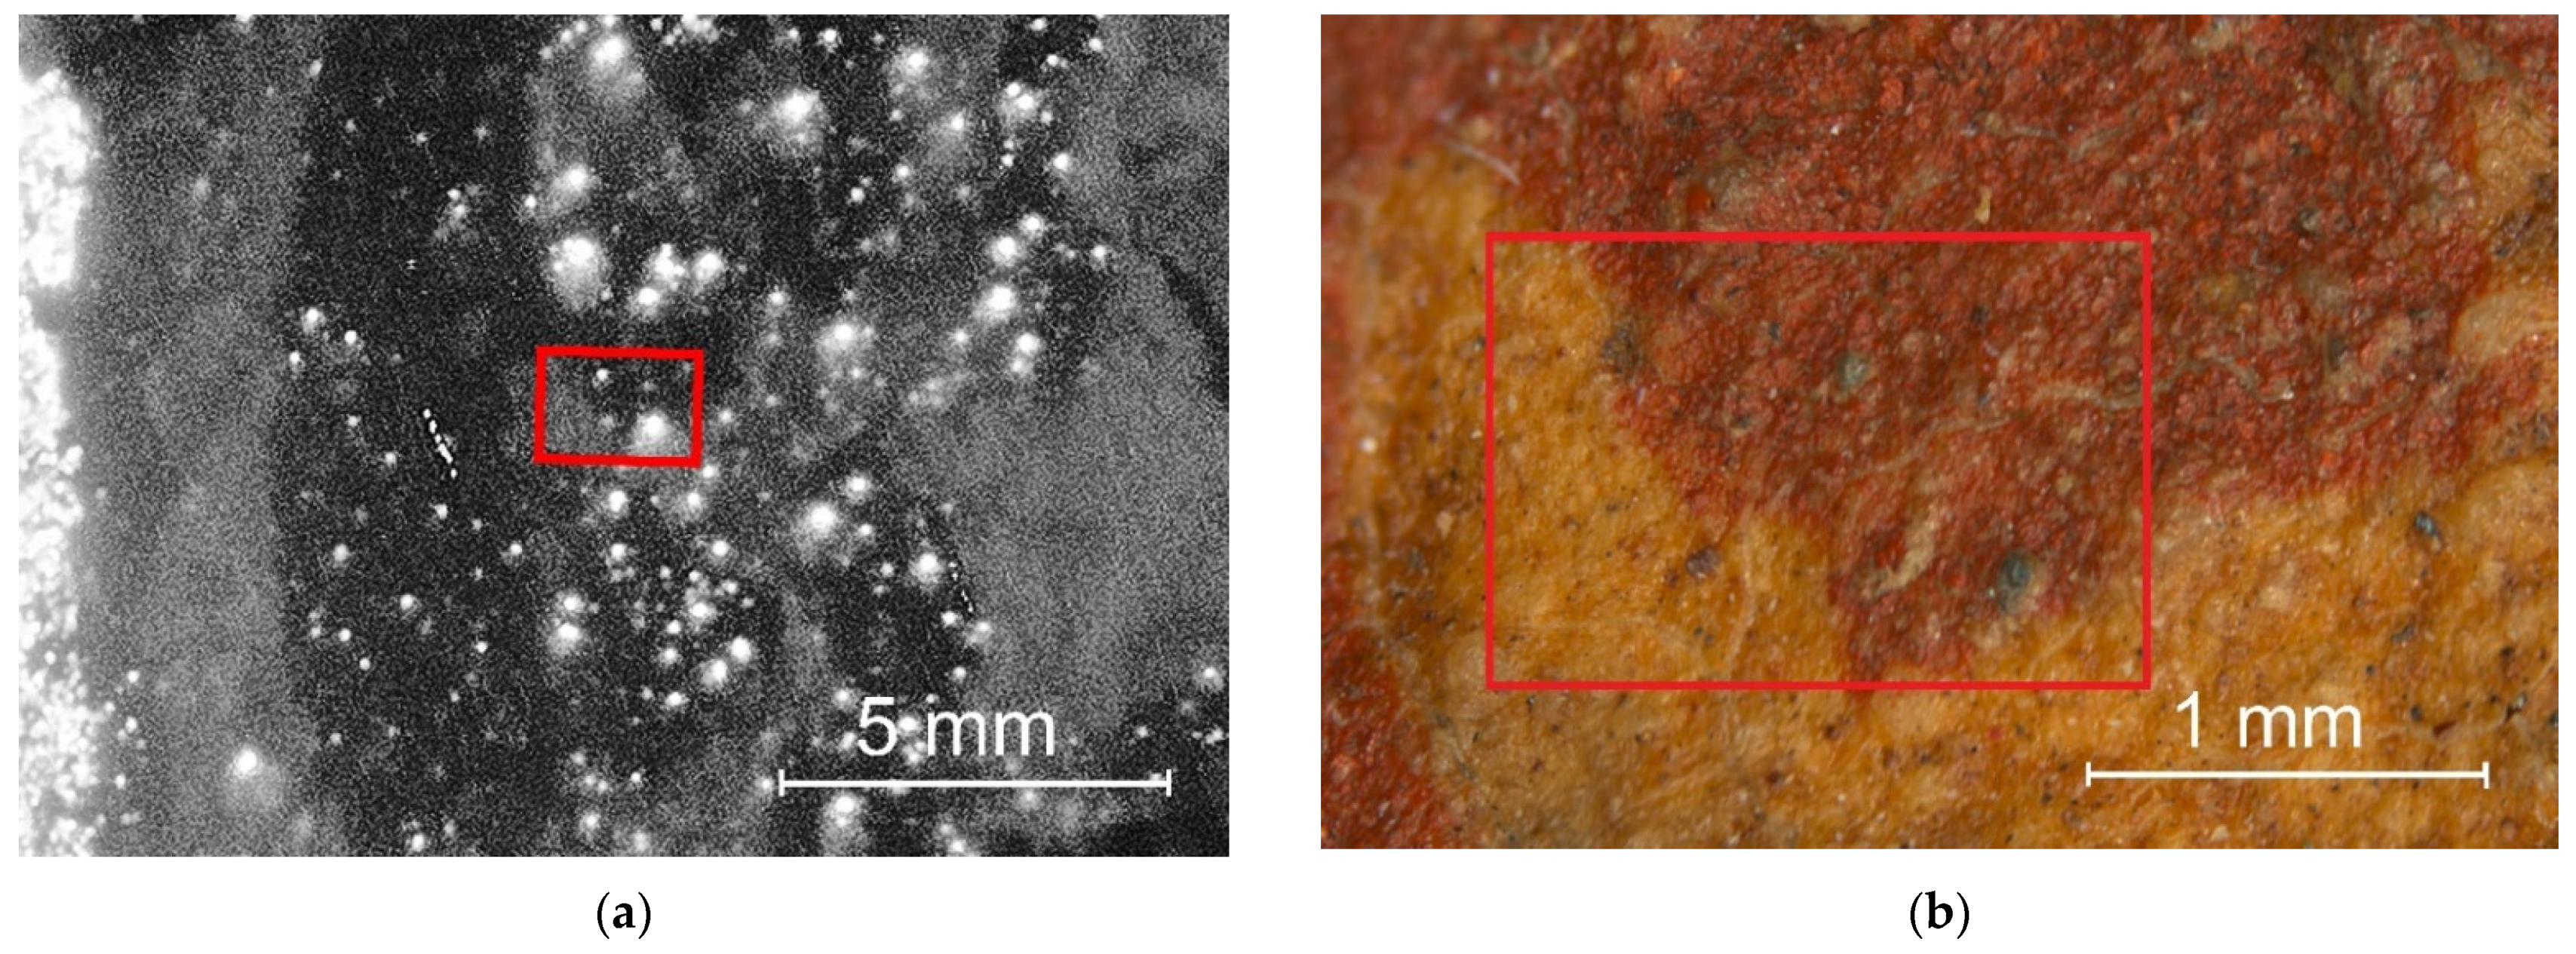
3.2. Imaging
4. Discussion
5. Conclusions
Supplementary Materials
Author Contributions
Funding
Data Availability Statement
Acknowledgments
Conflicts of Interest
References
- Warren, S.; (Canadian Museum of History, Gatineau, QC, Canada). Personal communication, 2022.
- Rosi, F.; Burnstock, A.; Van den Berg, K.J.; Miliani, C.; Brunetti, B.G.; Sgamellotti, A. A Non-Invasive XRF Study Supported by Multivariate Statistical Analysis and Reflectance FTIR to Assess the Composition of Modern Painting Materials. Spectrochim. Acta Part A 2009, 71, 1655–1662. [Google Scholar] [CrossRef]
- Miliani, C.; Rosi, F.; Brunetti, B.G.; Sgamellotti, A. In situ noninvasive study of artworks: The MOLAB multitechnique approach. Acc. Chem. Res. 2010, 43, 728–738. [Google Scholar] [CrossRef] [PubMed]
- Brunetti, B.; Miliani, C.; Rosi, F.; Doherty, B.; Monico, L.; Romani, A.; Sgamellotti, A. Non-Invasive Investigations of Paintings by Portable Instrumentation: The MOLAB Experience. Top. Curr. Chem. 2016, 374, 10. [Google Scholar] [CrossRef] [PubMed] [Green Version]
- Nevin, A.; Doherty, T. The Noninvasive Analysis of Painted Surfaces: Scientific Impact and Conservation Practice; Smithsonian Institution Scholarly Press: Washington, DC, USA, 2016. [Google Scholar]
- Giorgi, L.; Nevin, A.; Nodari, L.; Comelli, D.; Alberti, R.; Gironda, M.; Mosca, S.; Zendri, E.; Piccolo, M.; Izzo, F.C. In-Situ Technical Study of Modern Paintings Part 1: The Evolution of Artistic Materials and Painting Techniques in Ten Paintings from 1889 to 1940 by Alessandro Milesi (1856–1945). Spectrochim. Acta Part A 2019, 219, 530–538. [Google Scholar] [CrossRef]
- Williams, R.S. On-site non-destructive MID-IR spectroscopy of plastics in museum objects using a portable FTIR spectrometer with fiber optic probe. MRS Online Proc. Lib. 1996, 462, 25–30. [Google Scholar] [CrossRef]
- Doherty, B.; Daveri, A.; Clementi, C.; Romani, S.; Bioletti, S.; Brunetti, B.; Sgamelloti, A.; Miliani, C. The Book of Kells: A non-invasive MOLAB investigation by complementary spectroscopic techniques. Spectrochim. Acta Part A 2013, 115, 330–336. [Google Scholar] [CrossRef] [PubMed]
- Buti, D.; Rosi, F.; Brunetti, B.G.; Miliani, C. In-situ identification of copper-based green pigments on paintings and manuscripts by reflection FTIR. Anal. Bioanal. Chem. 2013, 205, 2699–2711. [Google Scholar] [CrossRef] [PubMed]
- Saviello, D.; Toniolo, L.; Goidanich, S.; Casadio, F. Non-invasive identification of plastic materials in museum collections with portable FTIR reflectance spectroscopy: Reference database and practical applications. Microchem. J. 2016, 124, 868–877. [Google Scholar] [CrossRef]
- Bell, J.; Nell, P.; Stuart, B. Non-invasive identification of polymers in cultural heritage collections: Evaluation, optimisation and application of portable FTIR (ATR and external reflectance) spectroscopy to three-dimensional polymer-based objects. Herit. Sci. 2019, 7, 95. [Google Scholar] [CrossRef]
- Invernizzi, C.; Rovetta, T.; Licchelli, M.; Malagodi, M. Mid and near-infrared reflection spectral database of natural organic materials in the cultural heritage field. Int. J. Anal. Chem. 2018, 2018, 7823248. [Google Scholar] [CrossRef]
- Rosi, F.; Daveri, A.; Doherty, B.; Nazzareni, S.; Brunnetti, B.G.; Sgamellotti, A.; Miliani, C. On the use of overtone and combination bands for the analysis of the CaSO4-H2O system by mid-infrared reflection spectroscopy. Appl. Microsc. 2010, 64, 956–963. [Google Scholar] [CrossRef] [PubMed]
- Miliani, C.; Rosi, F.; Daveri, A.; Brunetti, B.G. Reflection infrared spectroscopy for the non-invasive in situ study of artists’ pigments. Appl. Phys. A 2012, 106, 295–307. [Google Scholar] [CrossRef]
- Lee, L.; Quirke, S. Painting Materials. In Ancient Egyptian Materials and Technology; Nicholson, P.T., Shaw, I., Eds.; Cambridge University Press: Cambridge, MA, USA, 2000; pp. 104–120. [Google Scholar]
- Colinart, S. Analysis of Inorganic Yellow Colour in Ancient Egyptian Painting. In Colour and Painting in Ancient Egypt; Davies, W.V., Ed.; The British Museum Press: London, UK, 2001; pp. 1–4. [Google Scholar]
- Scott, D.A. A review of ancient Egyptian pigments and cosmetics. Stud. Conserv. 2016, 61, 185–202. [Google Scholar] [CrossRef]
- Siddall, R. Mineral pigments in archaeology: Their analysis and the range of available materials. Minerals 2018, 8, 201. [Google Scholar] [CrossRef] [Green Version]
- Riederer, J. Egyptian Blue. In Artists’ Pigments: A Handbook of Their History and Characteristics; West FitzHugh, E., Ed.; National Gallery of Art: Washington, DC, USA, 1997; Volume 3, pp. 183–202. [Google Scholar]
- Hatton, G.D.; Shortland, A.J.; Tite, M.S. The production technology of Egyptian blue and green frits from the Second millenium BC Egypt and Mesopotamia. J. Archaeol. Sci. 2008, 35, 1591–1604. [Google Scholar] [CrossRef]
- Nicola, M.; Seymour, M.M.; Aceto, M.; Priola, E.; Gobetto, R.; Masic, A. Late production of Egyptian blue: Synthesis from brass and its characteristics. Archaeol. Anthropol. Sci. 2019, 11, 5377–5392. [Google Scholar] [CrossRef]
- Ajò, D.; Chiari, D.; De Zuane, F.; Favaro, M.L.; Bertolini, M. Photoluminescence of some blue natural pigments and related synthetic materials. In Proceedings of the Art’96 5th International Conference on Non-destructive Testing, Microanalytical Methods and Environmental Evaluation for Study and Conservation of Works of Art, Budapest, Hugary, 14 June 1996; pp. 33–46. [Google Scholar]
- Pozza, G.; Ajò, D.; Chiari, D.; De Zuane, F.; Favaro, M. Photoluminescence of the inorganic pigments Egyptian blue, Han blue and Han purple. J. Cult. Herit. 2000, 1, 393–398. [Google Scholar] [CrossRef]
- Accorsi, G.; Verri, G.; Bolognesi, M.; Armaroli, N.; Clementi, C.; Miliani, C.; Romani, A. The exceptional near-infrared luminescence properties of cuprorivaite (Egyptian blue). Chem. Commun. 2009, 23, 3392–3394. [Google Scholar] [CrossRef]
- Verri, G. The spatially resolved characterization of Egyptian blue, Han blue and Han purple by photo-induced luminescence digital imaging. Anal. Bioanal. Chem. 2009, 394, 1011–1021. [Google Scholar] [CrossRef]
- Verri, G. The application of visible-induced luminescence imaging to the examination of museum objects. SPIE Proc. 2009, 7391. [Google Scholar] [CrossRef]
- Verri, G.; Saunders, D.; Ambers, J.; Sweek, T. Digital mapping of Egyptian blue: Conservation implications. Stud. Conserv. 2010, 55 (Suppl. S2), 220–224. [Google Scholar] [CrossRef]
- Linn, R.; Cline, E.H.; Yasur-Landau, A. The advantages of visible induced luminescence technique for the investigation of Aegean-style wall painting: A case study from Tel Kabri, Israel. In Tracing Technoscapes. The Production of Bronze Age Wall Paintings in the Eastern Mediterranean; Becker, J., Jungfleisch, J., von Rüden, C., Eds.; Sidestone Press: Leiden, The Netherlands, 2017; pp. 101–116. [Google Scholar]
- Kakoulli, I.; Radpour, R.; Lin, Y.; Svoboda, M.; Fischer, C. Application of forensic photography for the detection and mapping of Egyptian blue and madder lake in Hellenistic polychrome terracottas based on their photophysical properties. Dyes Pigm. 2017, 136, 104–115. [Google Scholar] [CrossRef]
- Dyer, J.; Sotiropoulou, S. A technical step forward in the integration of visible-induced luminescence imaging methods for the study of ancient polychromy. Herit. Sci. 2017, 5, 24. [Google Scholar] [CrossRef] [Green Version]
- Abdrabou, A.; Abdalla, M.; Islam, A.; Shaheen, I.A.; Kamal, H.M. Investigation of an Ancient Egyptian polychrome wooden statuette by imaging and spectroscopy. Int. J. Conserv. Sci. 2018, 9, 39–54. Available online: https://ijcs.ro/public/IJCS-18-04_Abdrabou.pdf.
- Abdrabou, A.; Abdallah, M.; Sultan, G.; Mostafa, M.; Bayoumi, H.; Magdy, R.; Abd El Kader, M.; Hamza, N.; Mamdouh, D.; Elsayed, H.; et al. Tutankhamun’s polychrome wooden shawabtis: Preliminary investigation for pigments and gilding characterization and indirect dating of previous restorations by the combined use of imaging and spectroscopic techniques. Open Archaeol. 2022, 8, 30–54. [Google Scholar] [CrossRef]
- Masic, A.; Nicola, M. NIR Luminescence and composition of Egyptian blue as markers in archaeometric evaluations. Microsc. Microanal. 2021, 27, 3004–3006. [Google Scholar] [CrossRef]
- Seymour, L.M.; Nicola, M.; Kessler, M.I.; Yost, C.L.; Bazzacco, A.; Marello, A.; Ferraris, E.; Gobetto, R.; Masic, A. On the production of ancient Egyptian blue: Multi-modal characterization and micron-scale luminescence mapping. PLoS ONE. 2020, 15, e0242549. [Google Scholar] [CrossRef]
- Hedeaard, S.B.; Brøns, C.; Drug, I.; Saulins, P.; Bercu, C.; Jakovlev, A.; Kjær, L. Multispectral Photogrammetry: 3D models highlighting traces of paint on ancient sculptures. In CEUR Workshop Proceedings 2364, Proceedings of the Digital Humanities in the Nordic Countries 4th Conference, Copenhagen, Denmark, 5–8 March 2019; Navarretta, C., Agirrezabal, M., Maegaard, B., Eds.; University of Copenhagen: Copenhagen, Denmark, 2019; Volume 17, pp. 181–189. Available online: https://ceur-ws.org/Vol-2364/17_paper.pdf (accessed on 10 January 2023).
- Frey, F.; Heller, D.; Kushel, D.; Vitale., G. The AIC Guide to Digital Photography and Conservation Documentation, 2nd ed.; Warda, J., Ed.; American Institute for Conservation: Washington, DC, USA, 2011; pp. 130–148. [Google Scholar]
- Wiseman, G.; (Canadian Conservation Institute, Ottawa, ON, Canada); Tse, S.; (Canadian Conservation Institute, Ottawa, ON, Canada). Effectiveness of LED & CuSO4 Filtered Flash for Visible-Induced Infrared Luminescence Imaging. (CCI# 130665). 2018; (Unpublished internal report). [Google Scholar]
- Heywood, A. The Use of Huntite as a White Pigment in Ancient Egypt. In Colour and Painting in Ancient Egypt; Davies, W.V., Ed.; The British Museum Press: London, UK, 2001; pp. 5–9. [Google Scholar]
- Barnes, S.S.; (Canadian Conservation Institute, Ottawa, ON, Canada); Helwig, K.; (Canadian Conservation Institute, Ottawa, ON, Canada). Non-invasive FTIR and Raman spectroscopy of select Egyptian objects, (CCI# 132665, CSD# 5719). 2022; (Unpublished internal report). [Google Scholar]
- Straus Center for Conservation, Harvard University Art Museums. IMP0005, Egyptian blue, PB31; Price, B.A., Pretzel, B., Lomax, S., Eds.; Infrared and Raman Users Group Spectral Database; Infrared and Raman Users Group, 2007. [Google Scholar]
- Philadelphia Museum of Art. IMP00090, Egyptian Blue, PB31; Price, B.A., Pretzel, B., Lomax, S., Eds.; Infrared and Raman Users Group Spectral Database; Infrared and Raman Users Group, 2007. [Google Scholar]
- Philadelphia Museum of Art. IMP00100, Pompei Bleu; Price, B.A., Pretzel, B., Lomax, S., Eds.; Infrared and Raman Users Group Spectral Database; Infrared and Raman Users Group, 2007. [Google Scholar]

| Image Type | Exposure | Imaging Spectrum | Filter | # of Images in Focus Stack |
|---|---|---|---|---|
| Visible light | f11, 1/13 s, 50 ISO | 400–700 nm | UV/IR Bandpass | 19 |
| Visible-induced infrared luminescence | f11, 1/60 s, 400 ISO | 790–940 nm | 87C | 20 |
| Colour | Location | Compounds Identified |
|---|---|---|
| off-white white white (possible trace black) 1 | preparation layer, exposed edge, proper right side | gypsum, calcite |
| face, forehead | calcite | |
| headpiece, proper right side | calcite | |
| white red | headpiece, proper right side | calcite |
| headpiece, forehead, proper right side | kaolin, calcite (minor) | |
| red (with trace white) 1 pink yellow (with trace red) 1 blue | headpiece, proper right side | calcite, kaolin (minor) |
| headpiece, proper right side | calcite, kaolin, | |
| headpiece, forehead, proper left side | calcite, kaolin | |
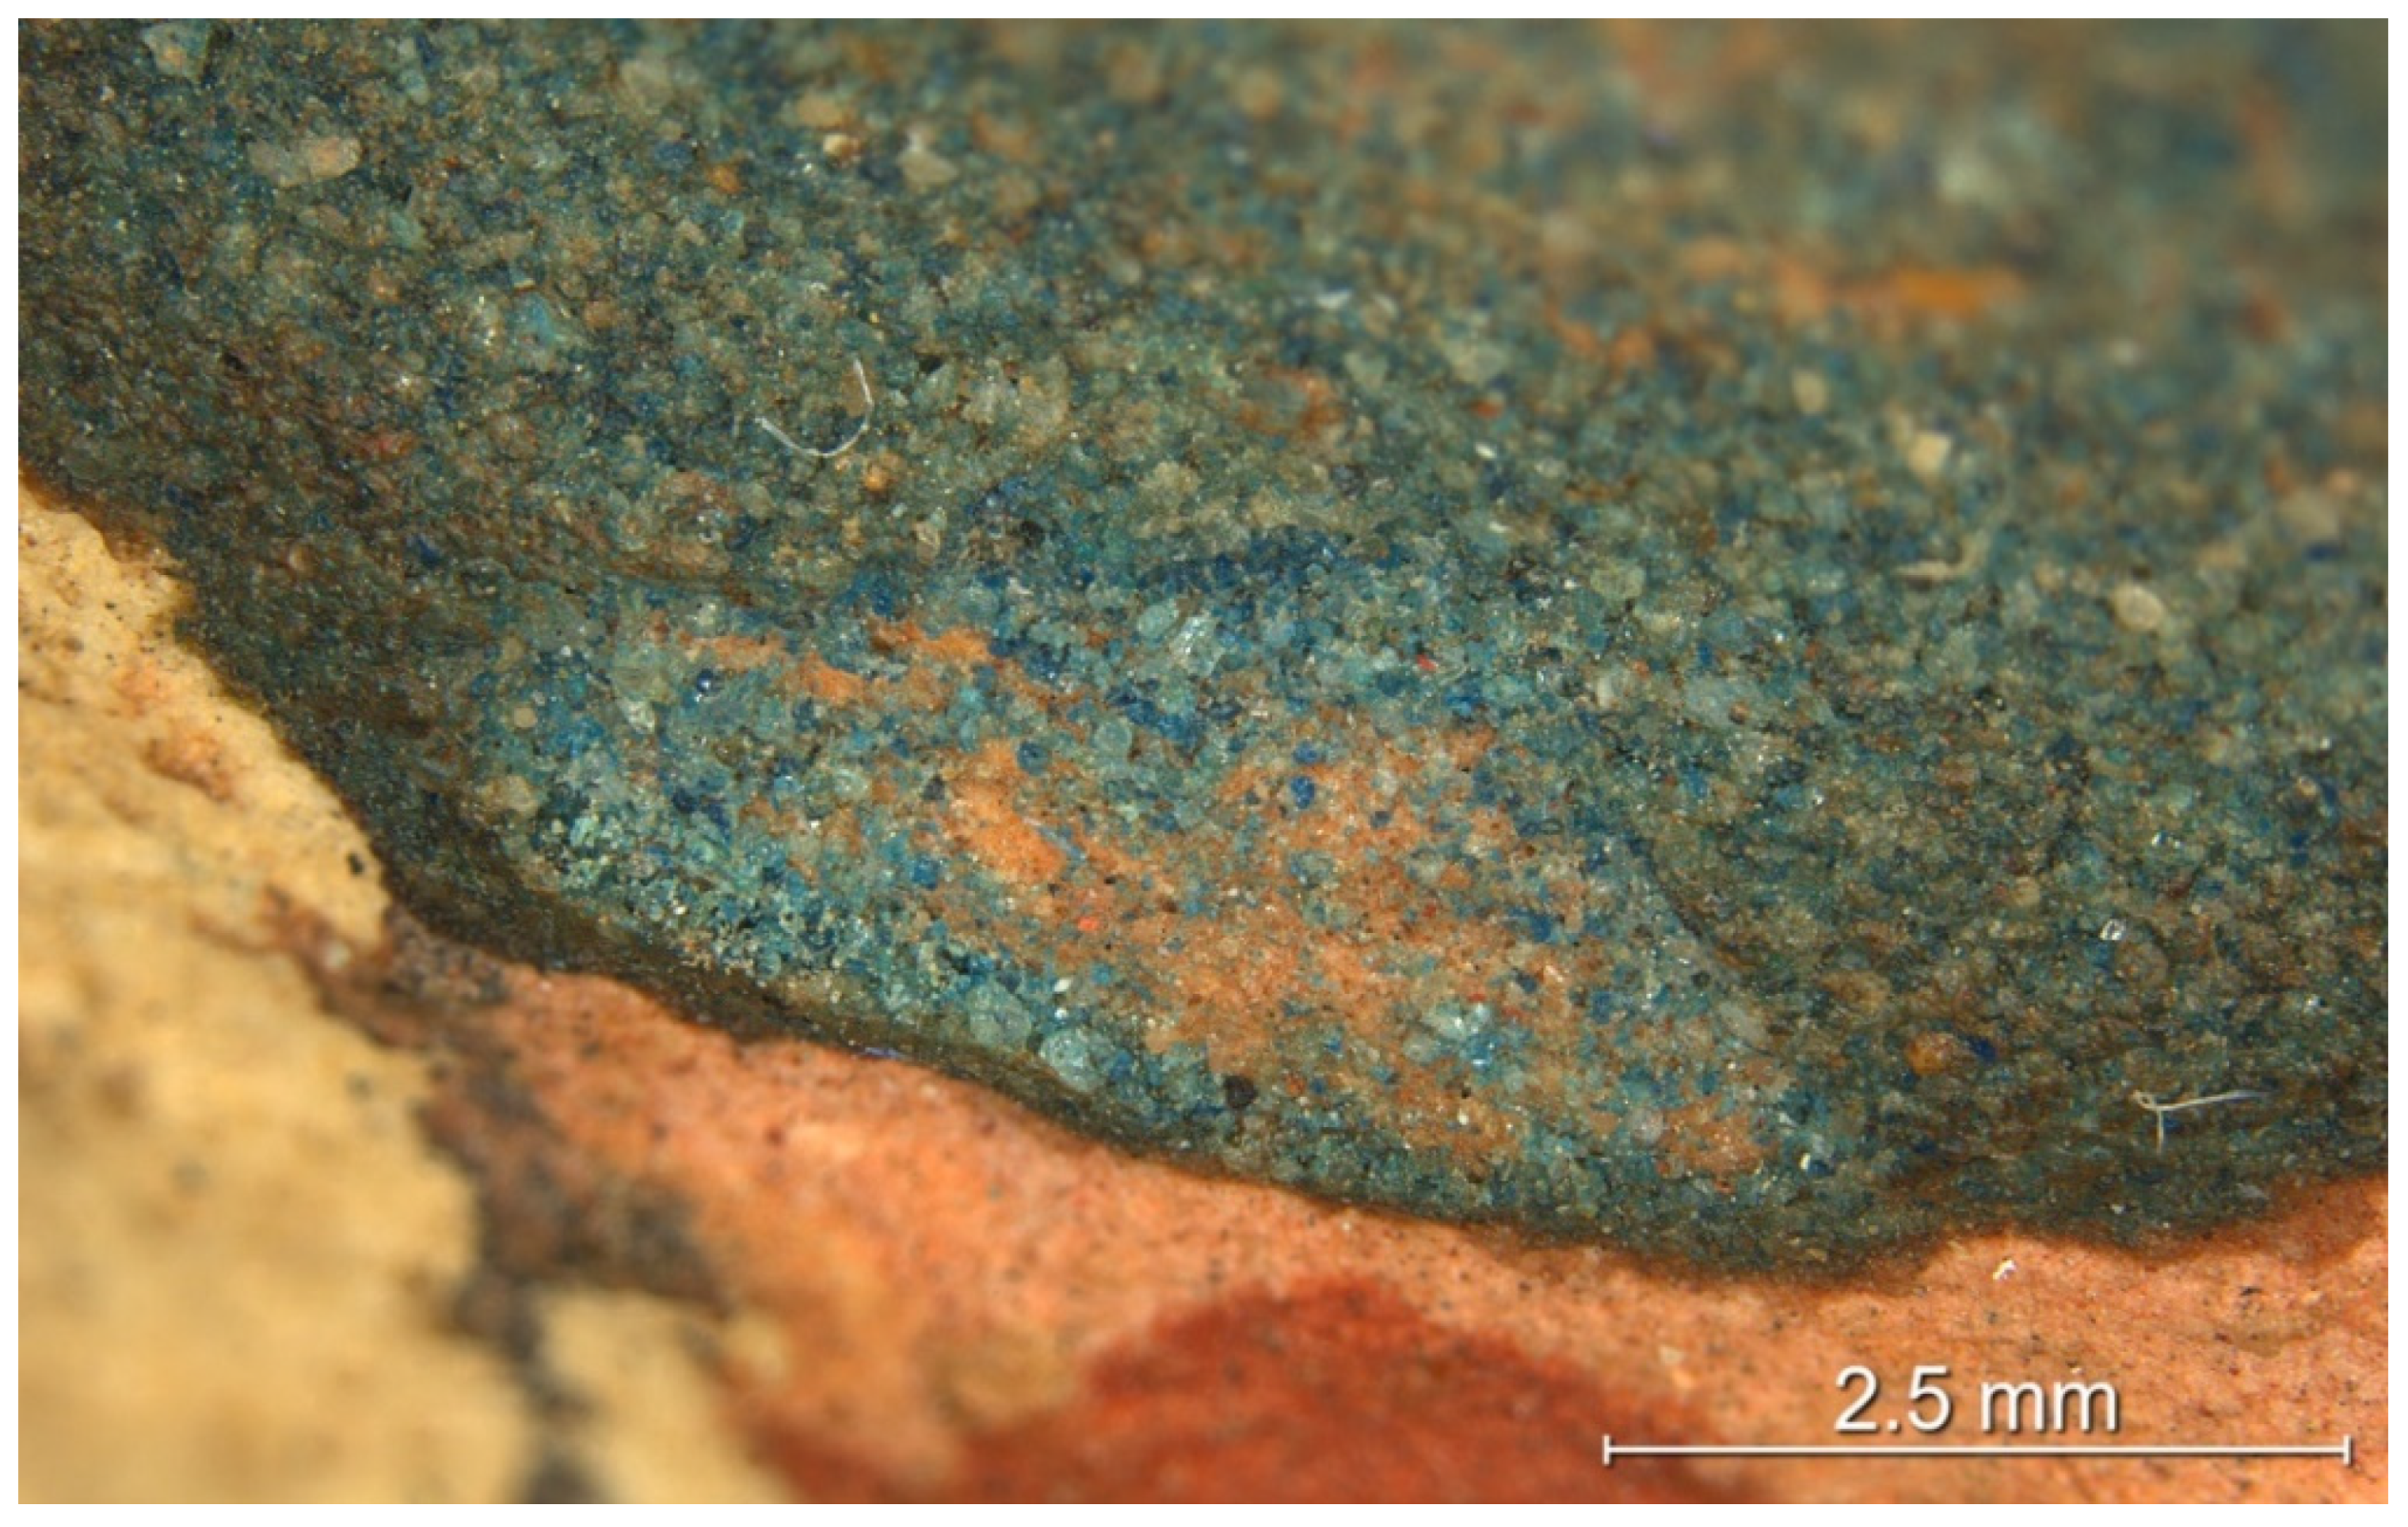
| headpiece, proper right temple | Egyptian blue, quartz | |
| black grey (thin black over white) | headpiece, proper right side, thin layer over white | calcite (trace) |
| headpiece, proper right side, thin layer over white | calcite |
Disclaimer/Publisher’s Note: The statements, opinions and data contained in all publications are solely those of the individual author(s) and contributor(s) and not of MDPI and/or the editor(s). MDPI and/or the editor(s) disclaim responsibility for any injury to people or property resulting from any ideas, methods, instructions or products referred to in the content. |
© 2023 Government of Canada, Canadian Conservation Institute. Submitted for possible open access publication under the terms and conditions of the Creative Commons Attribution (CC BY) license (https://creativecommons.org/licenses/by/4.0/).
Share and Cite
Wiseman, G.; Barnes, S.; Helwig, K. Investigation of Egyptian Blue on a Fragmentary Egyptian Head Using ER-FTIR Spectroscopy and VIL Imaging. Heritage 2023, 6, 993-1006. https://doi.org/10.3390/heritage6020056
Wiseman G, Barnes S, Helwig K. Investigation of Egyptian Blue on a Fragmentary Egyptian Head Using ER-FTIR Spectroscopy and VIL Imaging. Heritage. 2023; 6(2):993-1006. https://doi.org/10.3390/heritage6020056
Chicago/Turabian StyleWiseman, Germain, Stephanie Barnes, and Kate Helwig. 2023. "Investigation of Egyptian Blue on a Fragmentary Egyptian Head Using ER-FTIR Spectroscopy and VIL Imaging" Heritage 6, no. 2: 993-1006. https://doi.org/10.3390/heritage6020056