
Comparative Study of Architectural Bricks from Khorsabad and Susa Sites: Characterization of Black Glazes

 , ,
, ,
Abstract
:1. Introduction
2. Materials and Methods
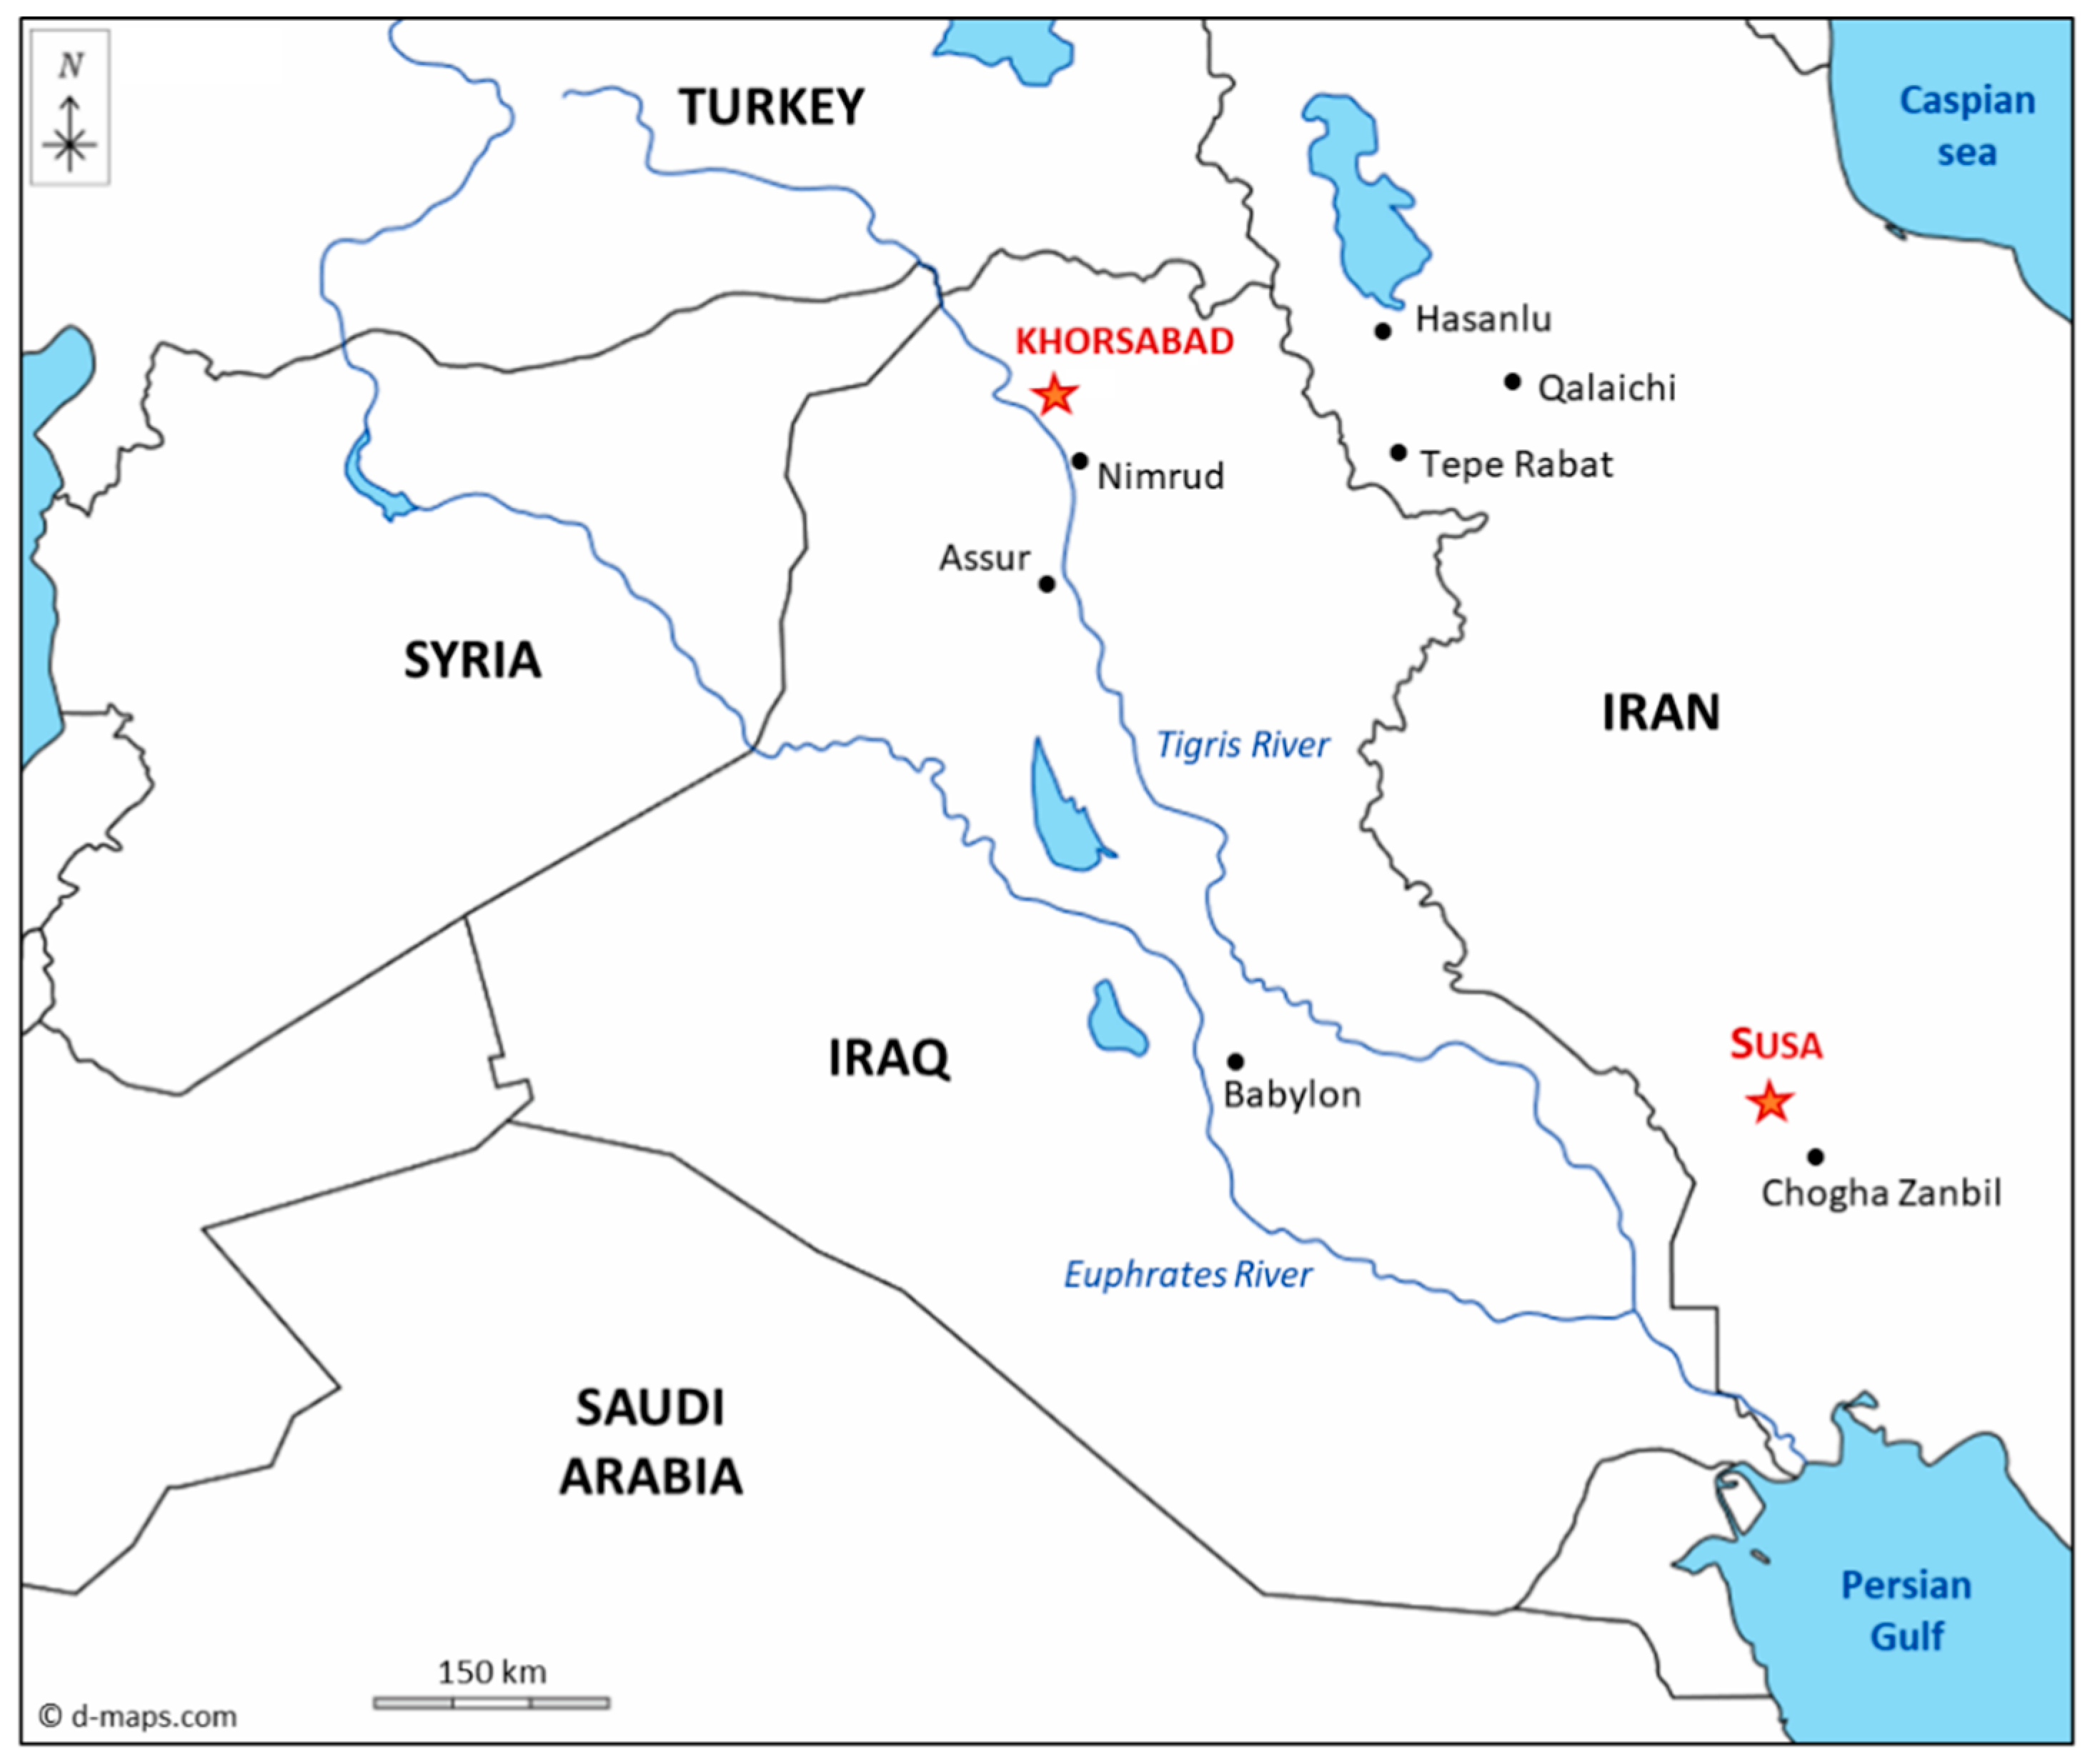
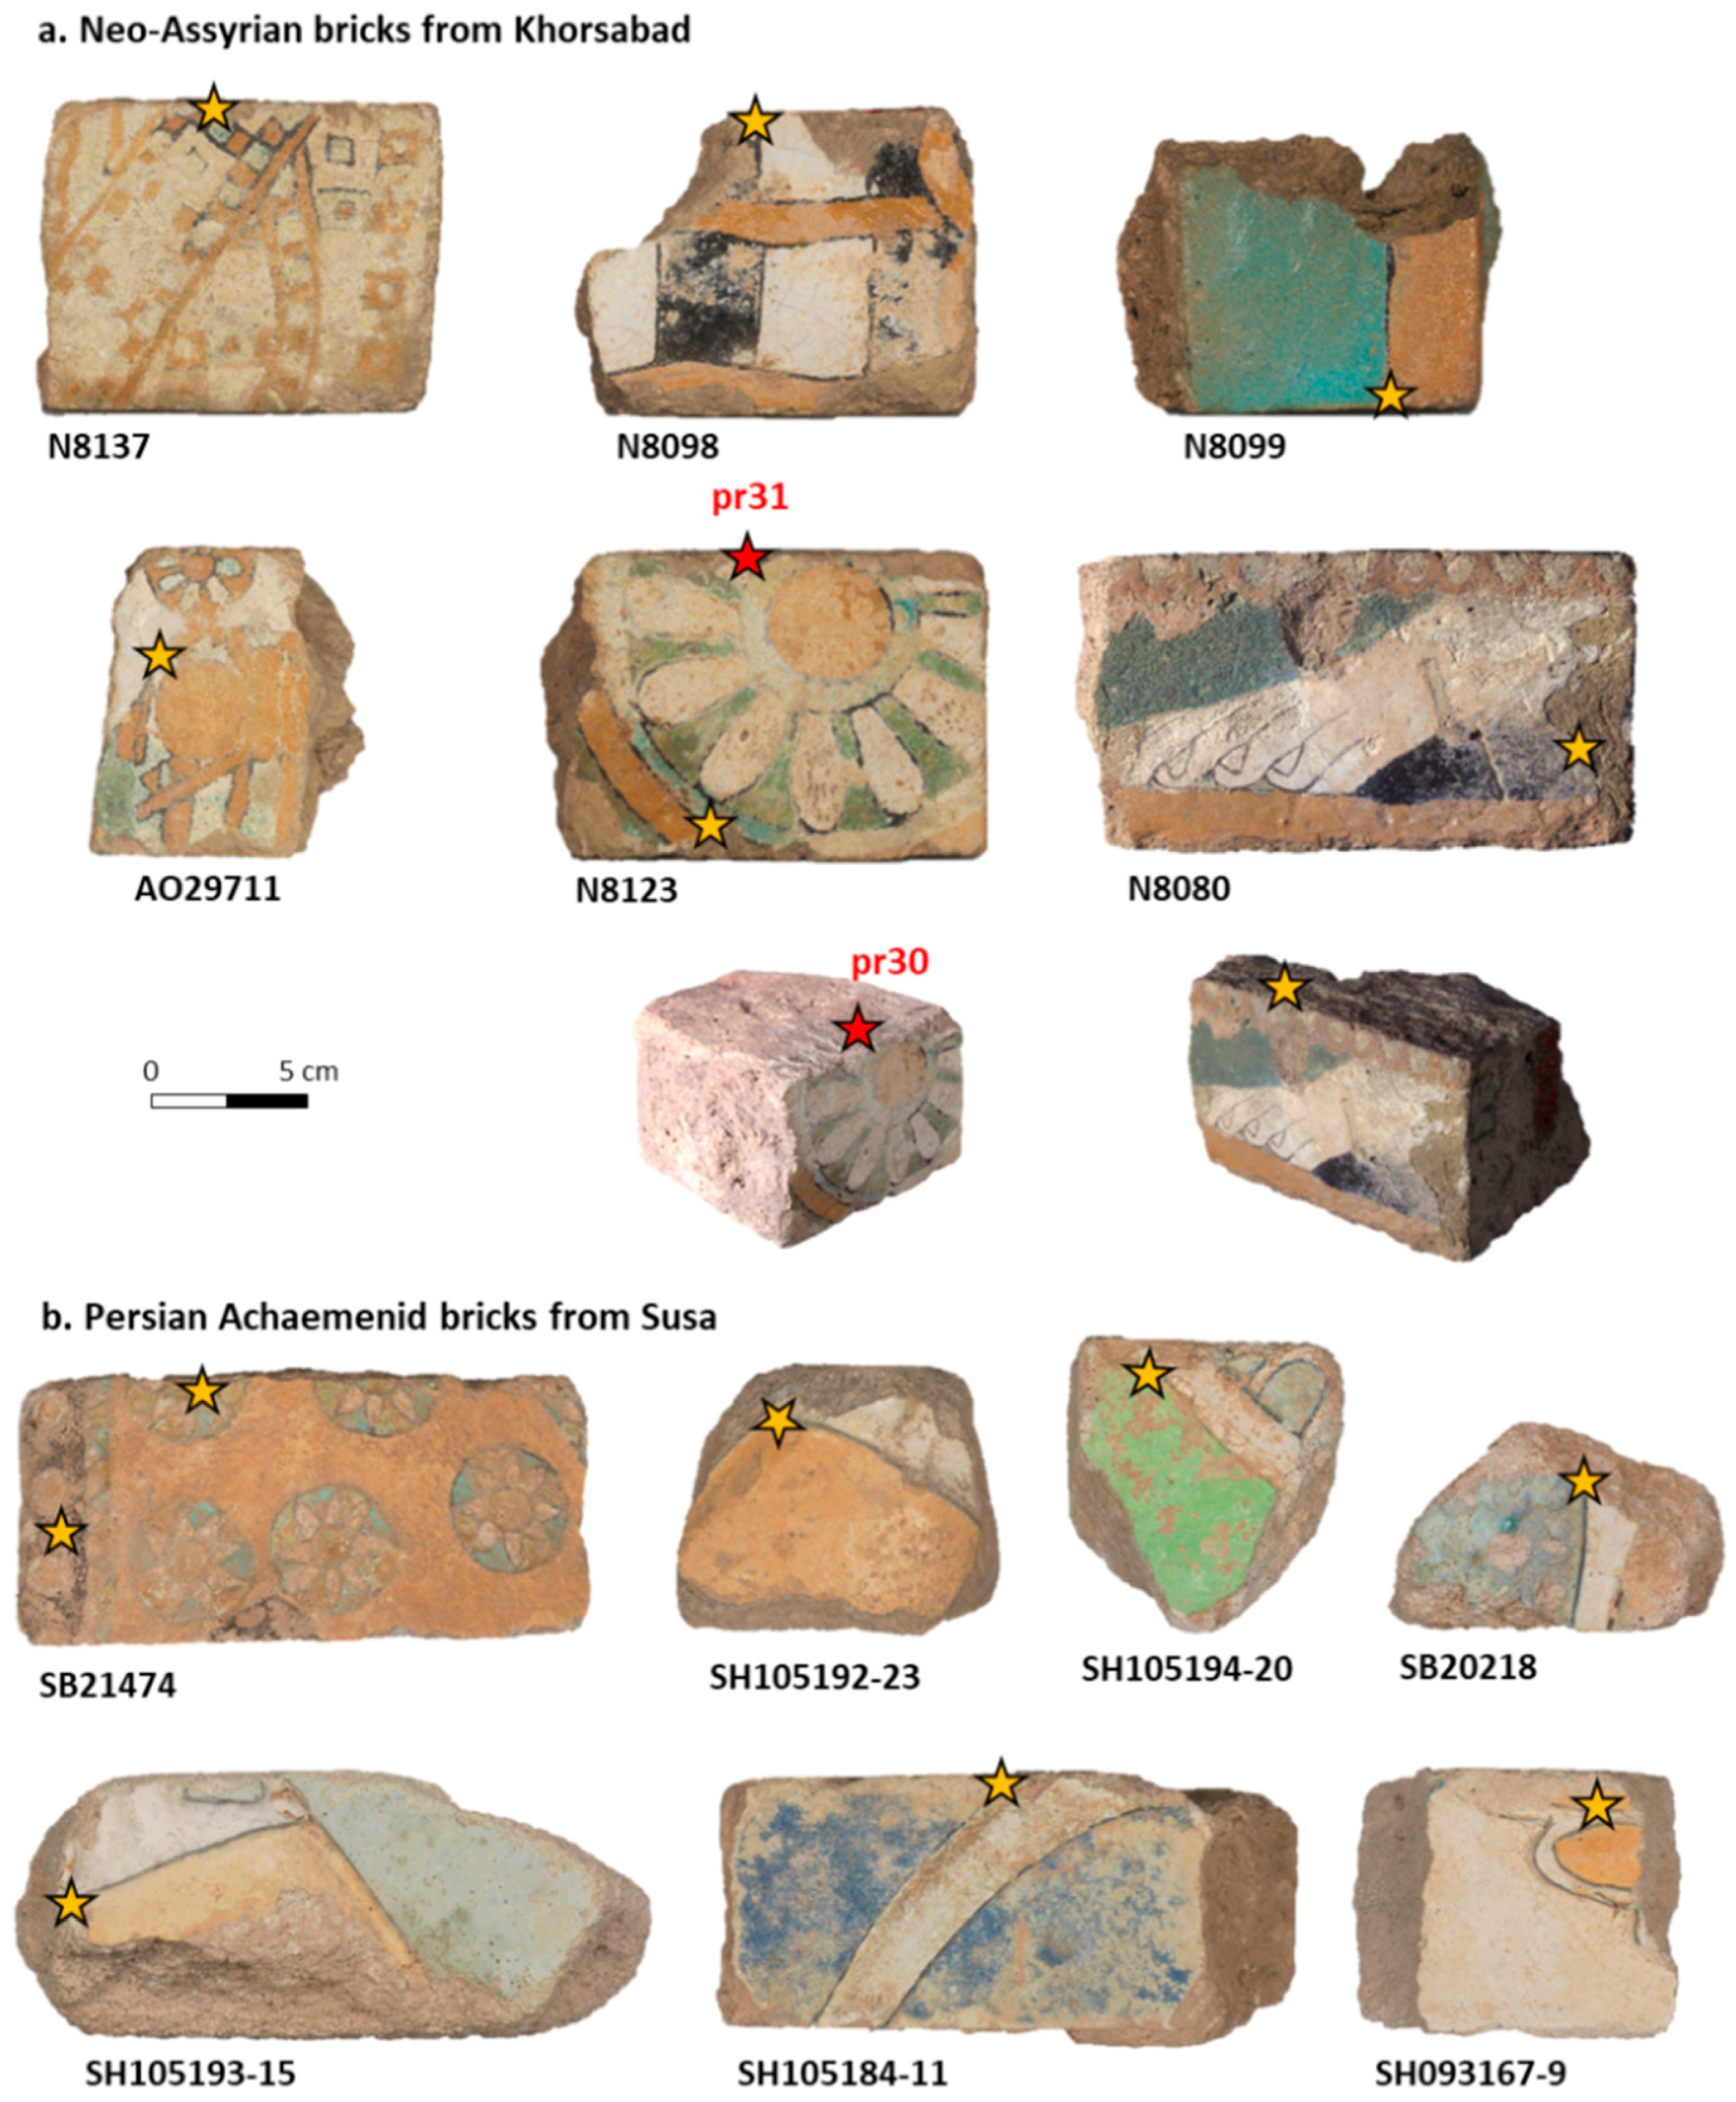
2.1. Archaeological Bricks
2.2. Analytical Techniques
2.2.1. Scanning Electron Microscopy–Energy-Dispersive X-ray Spectroscopy (SEM-EDS)
2.2.2. Raman Microspectroscopy (µ-Raman)
2.2.3. High-Resolution Synchrotron X-ray Diffraction (SXRD)
3. Results
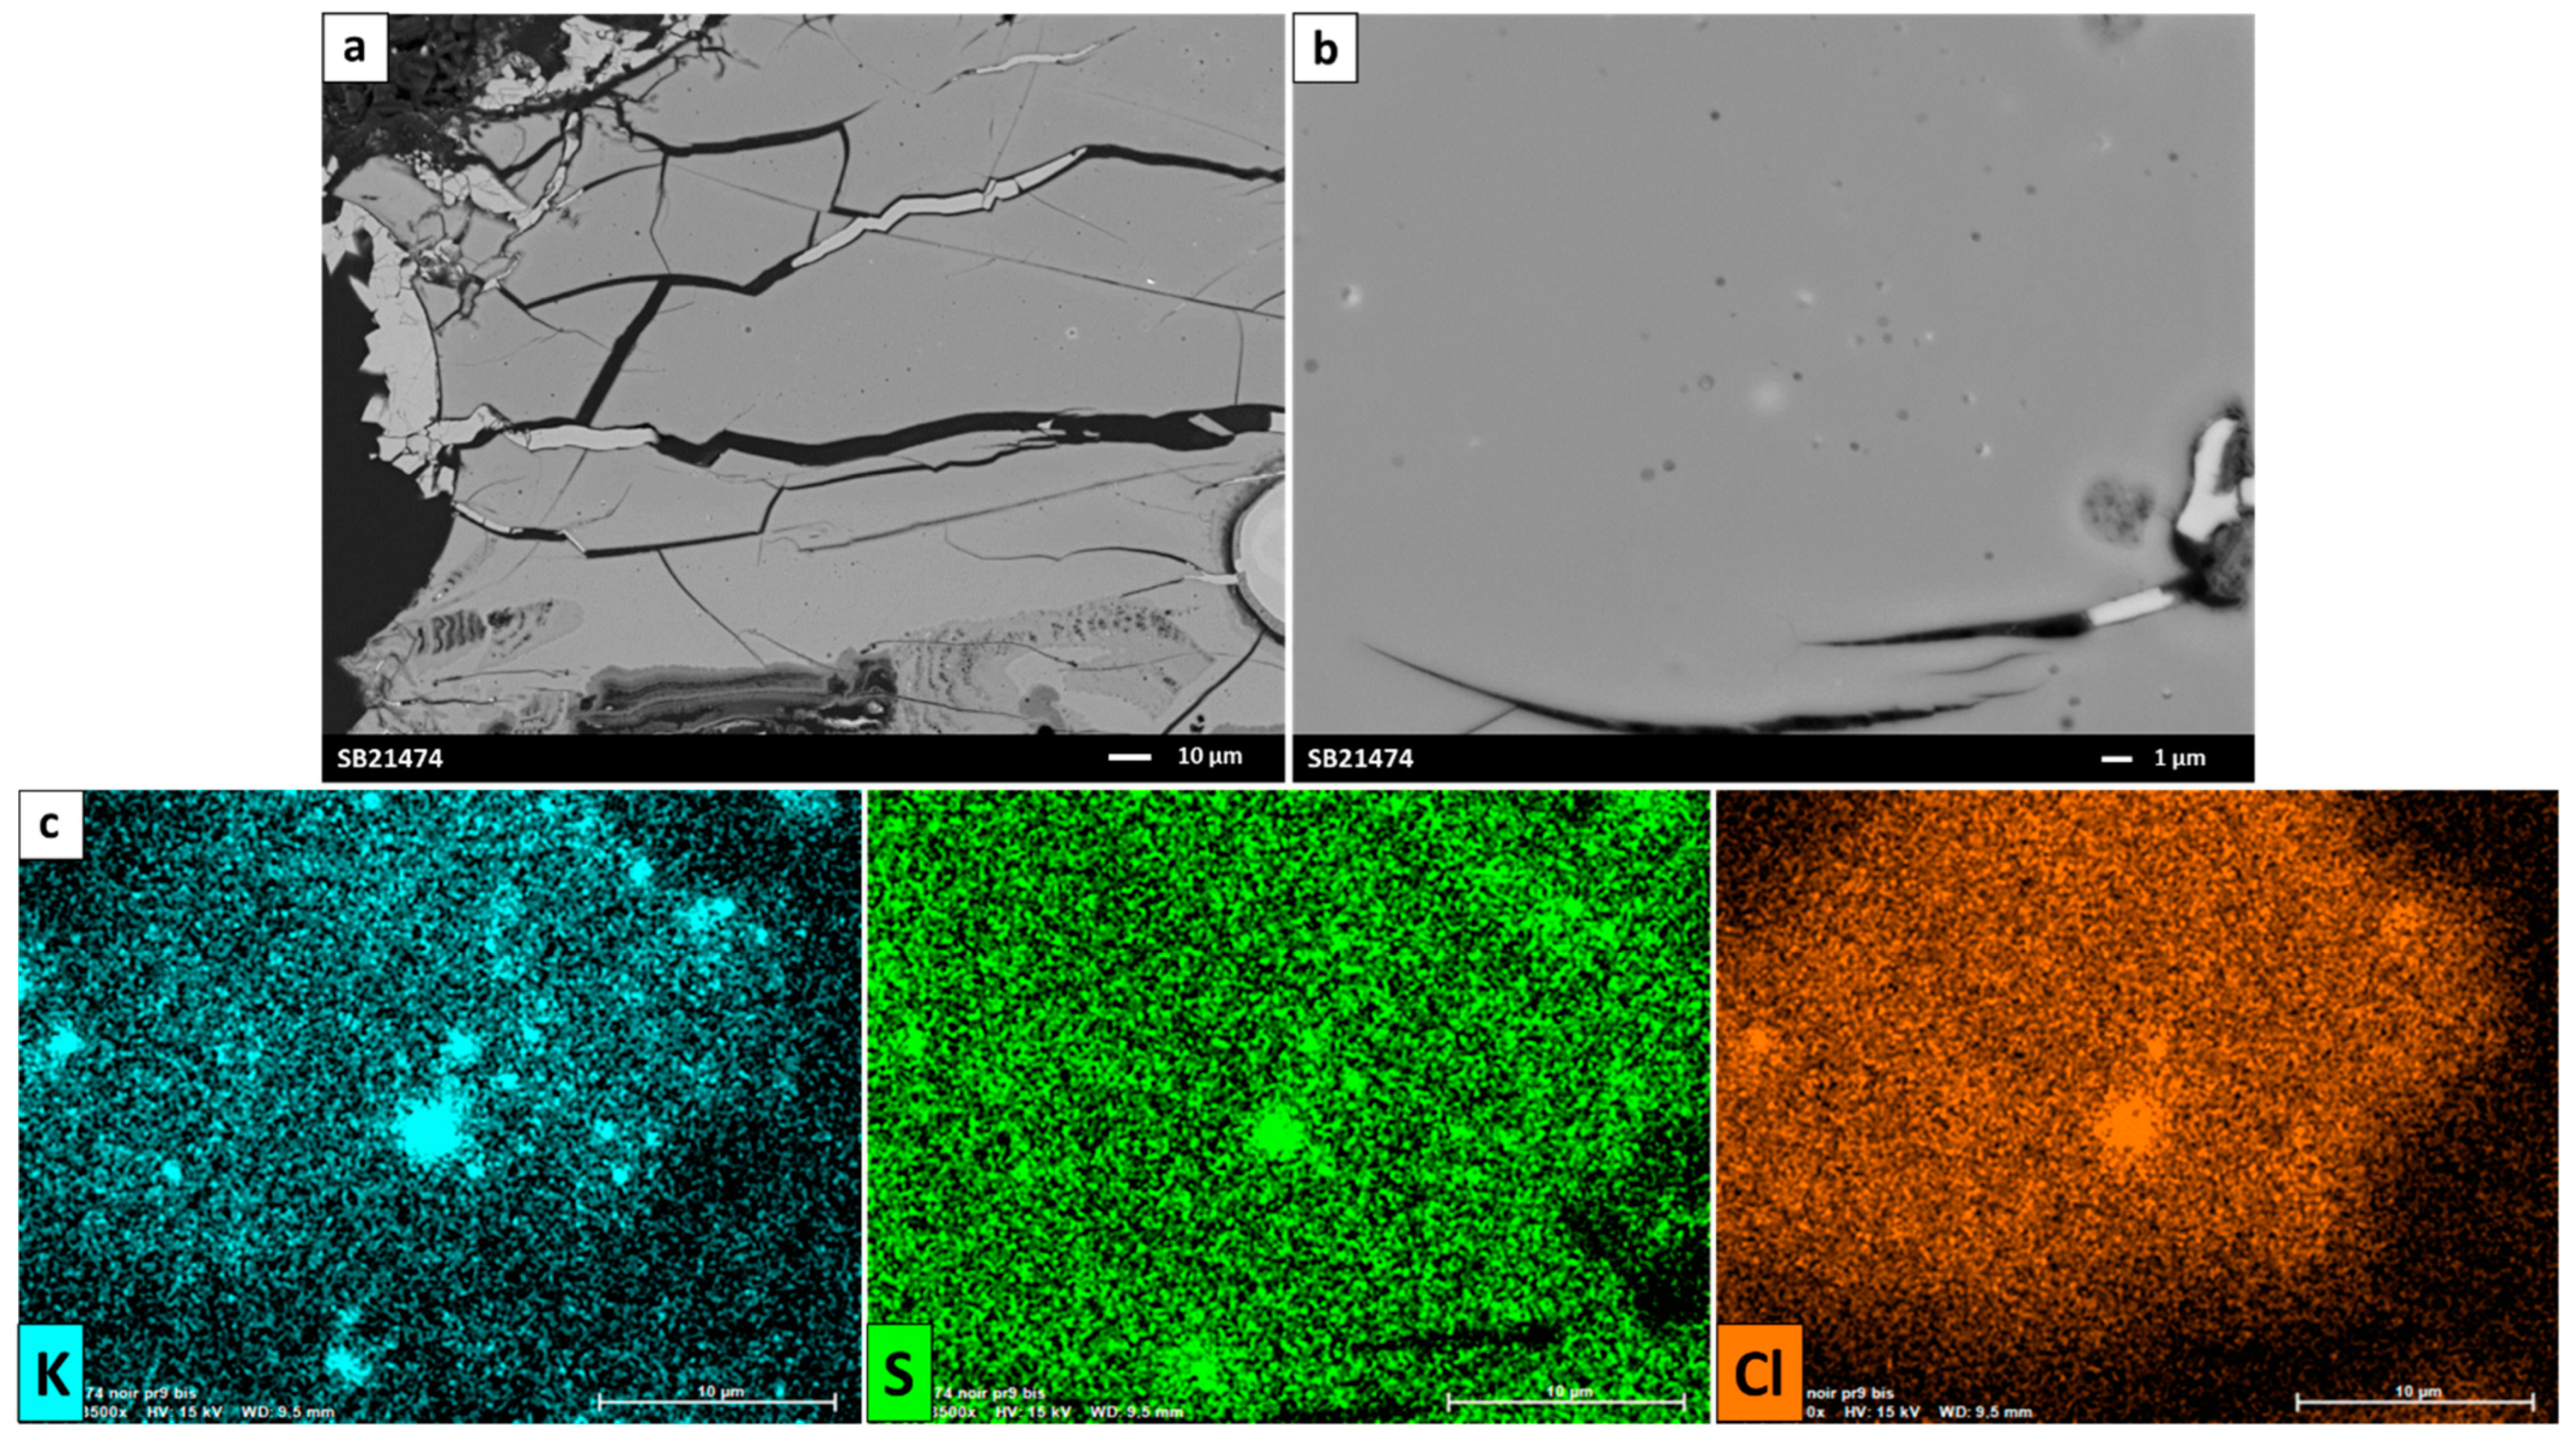
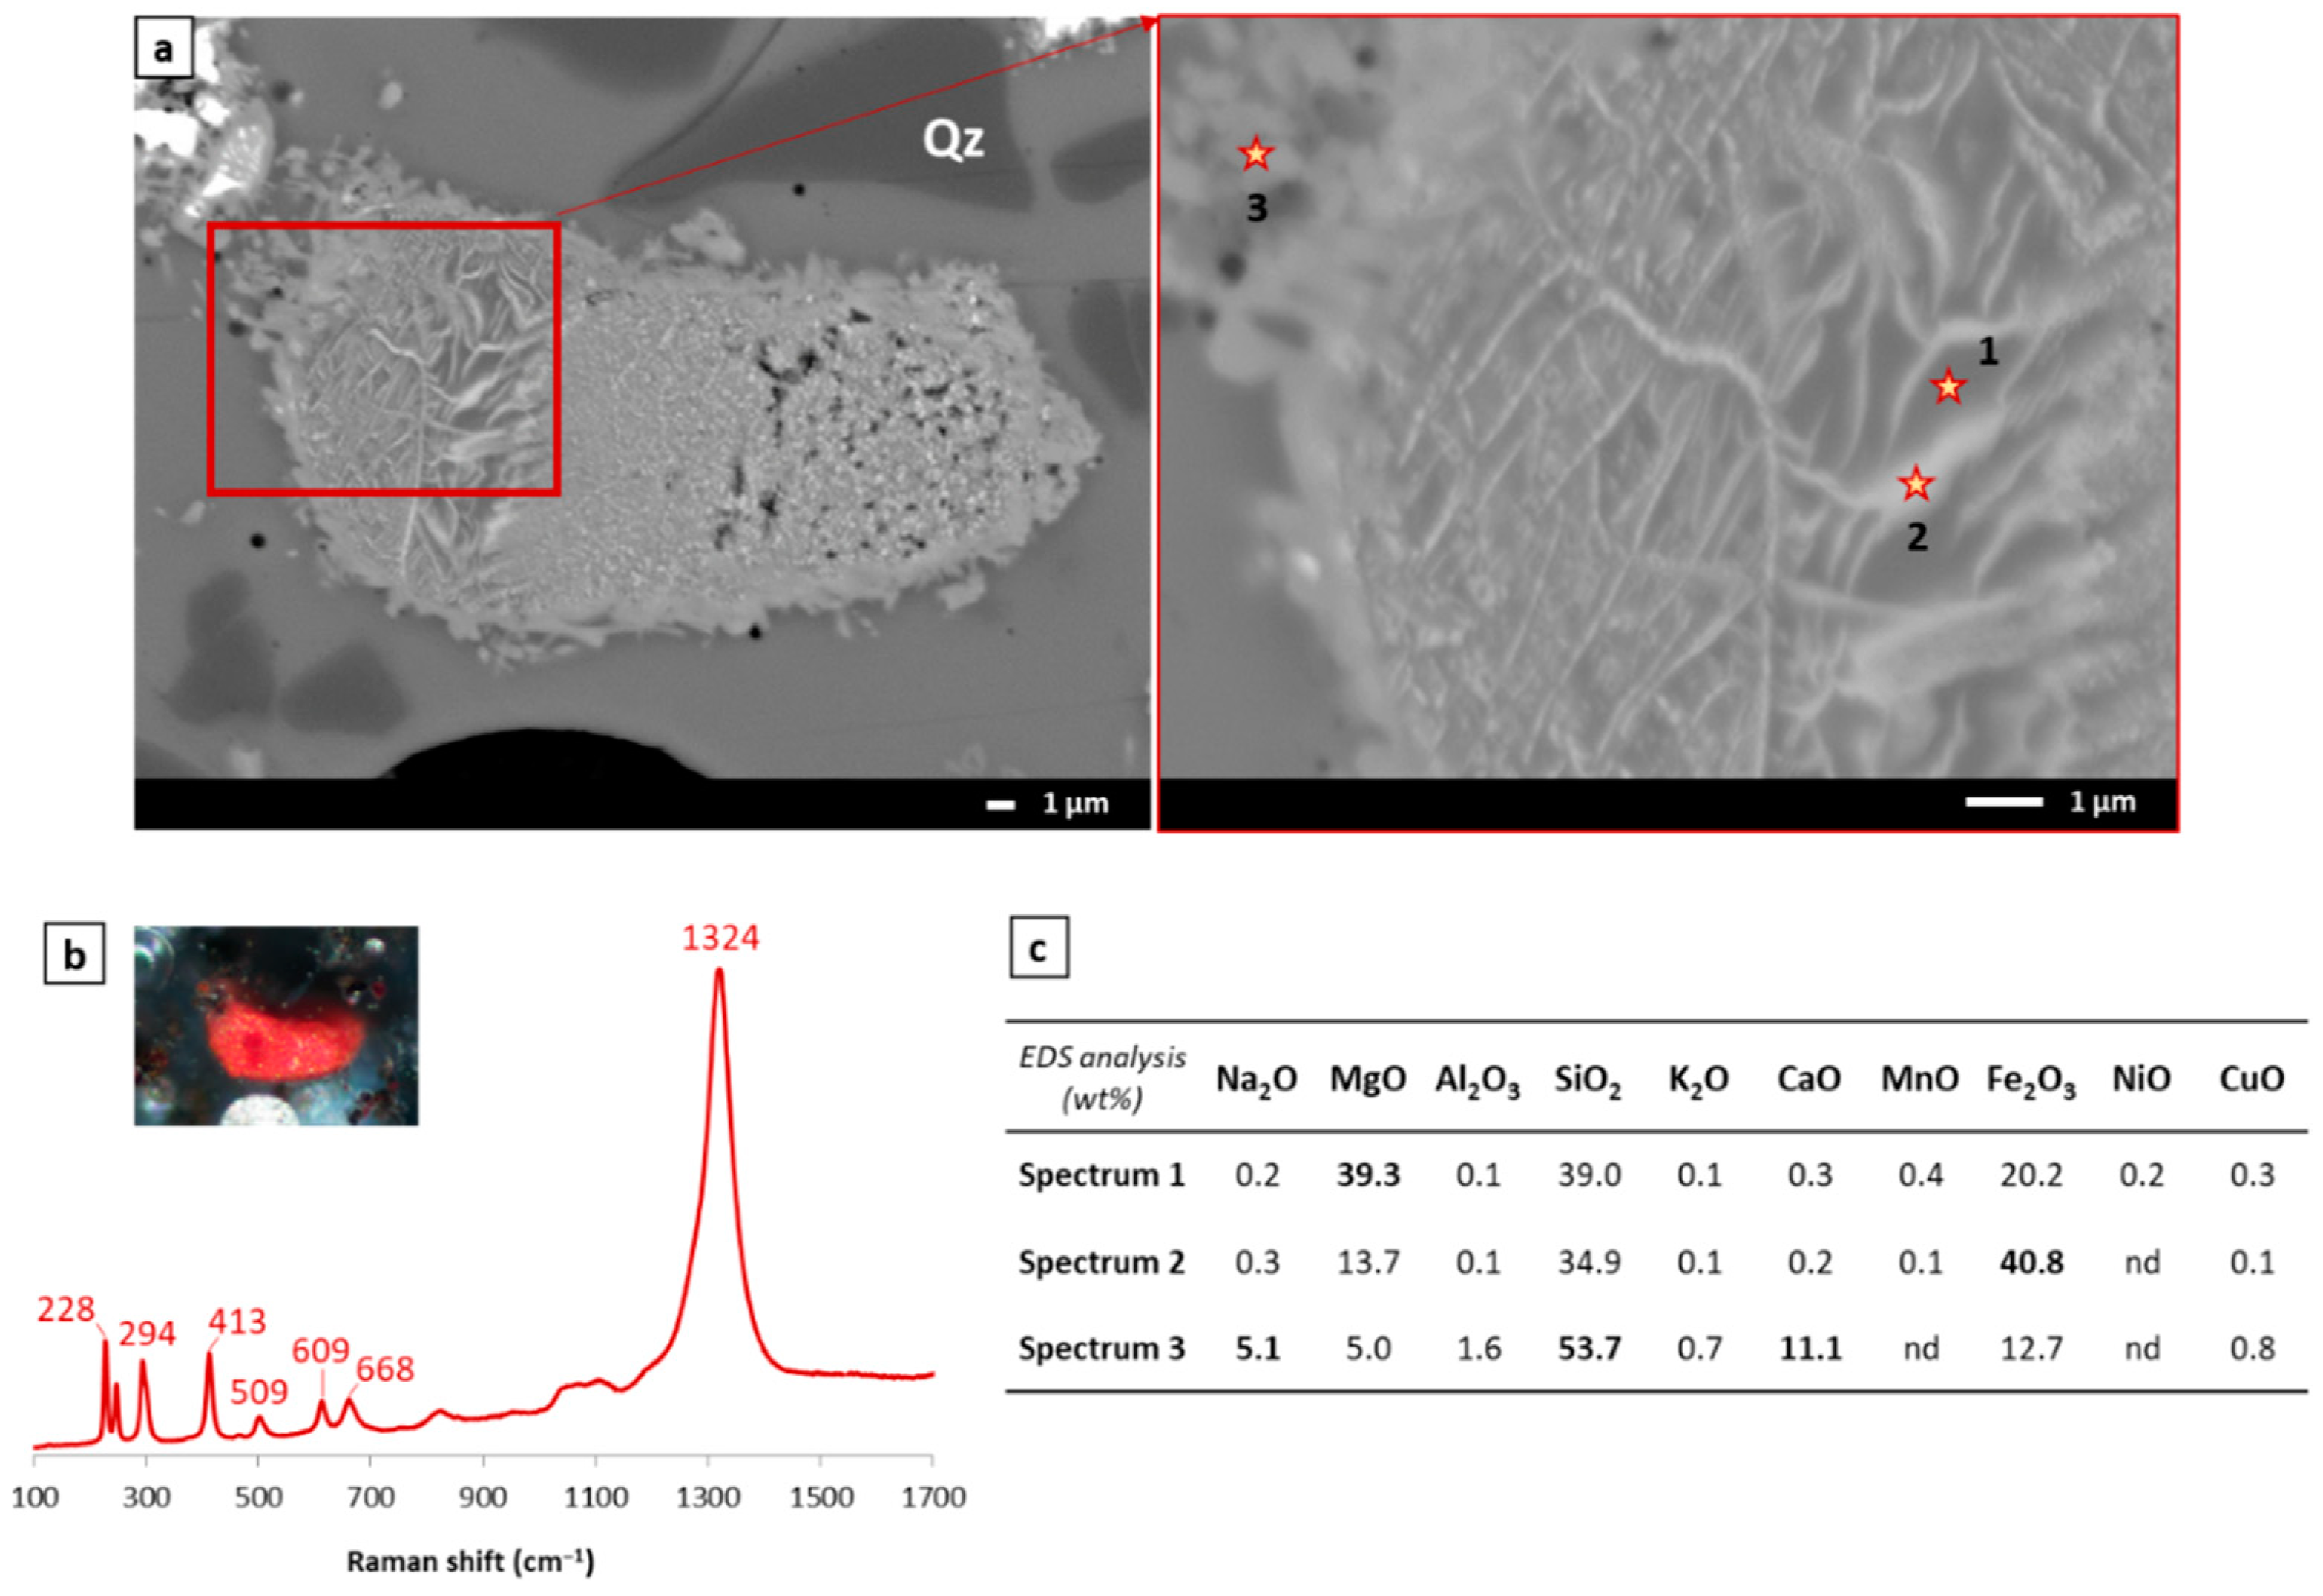
3.1. Susa Glazes

| SiO2 | Al2O3 | Na2O | K2O | CaO | MgO | Fe2O3 | CuO | MnO | TiO2 | CoO | ZnO | SO3 | Cl | |
|---|---|---|---|---|---|---|---|---|---|---|---|---|---|---|
| Flat glaze (n = 1) | 89.0 (0.1) | 0.4 (0.1) | 0.3 (0.1) | 0.7 (0.2) | 2.8 (0.4) | 0.4 (0.1) | 0.5 (0.1) | nd | 3.0 (0.1) | nd | nd | nd | 1.3 (0.1) | 1.6 (0.1) |
| Separating glazes (n = 3) | 69.4 (1.4) | 2.7 (0.6) | 12.8 (0.6) | 2.3 (0.3) | 3.6 (0.7) | 2.0 (0.3) | 4.5 (1.4) | 1.4 (1.0) | <LOQ | 0.2 (0.1) | 0.5 (0.6) | <LOQ | 0.4 (0.1) | 0.4 (0.2) |
| Ancient Mesopotamian glasses [24] | 62.8 | 0.5 | 15.9 | 2.3 | 6.4 | 4.3 | 0.2 | - | - | - | - | - | 0.2 | 0.8 |
3.2. Khorsabad Glazes
3.2.1. Study of Black Glazes Not Close to Yellow Glazes
3.2.2. Study of Black Glazes Close to a Yellow Glaze
4. Discussion and Contextualization of the Production Techniques of the Black Glazed Bricks in the Middle East
| Location | Period | Type of Glaze | Coloring Element | Nature of Colored Crystalline Phases | Other Phases Present | Chemical Composition of the Glass Matrix | Published Paper |
|---|---|---|---|---|---|---|---|
| Susa | Neo-Elamite (1000–539 BC) | Separating glaze | Fe | Hematite | Quartz | - | [6] |
| Khorsabad | Neo-Assyrian (900–610 BC) | Separating glaze + colored field | Copper sulfide nanoparticles + chromophore Fe3+-S2− | - | Soda–lime matrix | [5] | |
| Nimrud | Neo-Assyrian (900–610 BC) | Colored field | Mn, Fe | Mn2O3, Mn3O4, Mn(IV)1−2xMn(III)2xO2−x | - | - | [38] |
| Nimrud | Neo-Assyrian (900–610 BC) | - | Mn (+Fe) | - | - | Soda–lime matrix | [39] |
| Tepe Rabat | 8th–7th BC | Separating glaze | Fe, Cu | Hematite | Lead antimonate | - | [3] |
| Babylon | Neo-Babylonian (626–539 BC) | Separating glaze + colored field | Copper sulfide nanoparticles + chromophore Fe3+-S2− | - | Soda–lime matrix | [5] | |
| Persepolis | Persian Achaemenid (539–330 BC) | Separating glaze | Co, Cu, Fe | Hematite, magnetite | Quartz | - | [3] |
| Persepolis | Persian Achaemenid (539–330 BC) | Separating glaze | Fe, Cu | Fayalite coated iron oxide, copper-bearing Mg-silicate | Quartz, calcite | - | [17] |
| Persepolis | Persian Achaemenid (539–330 BC) | Separating glaze (grayish) | Fe, Cu | - | - | - | [36] |
| Susa | Persian Achaemenid (539–330 BC) | Separating glaze | Fe, Cu | Hematite, magnetite | - | Alkali matrix | [4] |
| Susa | Persian Achaemenid (539–330 BC) | Separating glaze | Fe, Cu | - | Quartz | Alkali matrix | [35] |
5. Conclusions and Future Works
Supplementary Materials
Author Contributions
Funding
Data Availability Statement
Acknowledgments
Conflicts of Interest
References
- Holakooei, P. Scientific Research on the Iron Age Glazes from Iran and Iraq: Past and Future. In Glazed Brick Decoration in the Ancient Near East: Proceedings of a Workshop at the 11th International Congress of the Archaeology of the Ancient Near East (Munich) in April 2018; Fügert, A., Gries, H., Eds.; Archaeopress Archaeology; Archaeopress Publishing Ltd.: Oxford, UK, 2020; pp. 16–28. ISBN 978-1-78969-605-9. [Google Scholar]
- Fügert, A.; Gries, H. ‘I Had Baked Bricks Glazed in Lapis Lazuli Color’1–A Brief History of Glazed Bricks in the Ancient Near East. In Glazed Brick Decoration in the Ancient Near East: Proceedings of a Workshop at the 11th International Congress of the Archaeology of the Ancient Near East (Munich) in April 2018; Fügert, A., Gries, H., Eds.; Archaeopress Archaeology; Archaeopress Publishing Ltd.: Oxford, UK, 2020; pp. 1–15. ISBN 978-1-78969-605-9. [Google Scholar]
- Holakooei, P.; Ahmadi, M.; Volpe, L.; Vaccaro, C. Early Opacifiers In The Glaze Industry Of First Millennium bc Persia: Persepolis And Tepe Rabat: Early Opacifiers in First Millennium BC Persia. Archaeometry 2017, 59, 239–254. [Google Scholar] [CrossRef]
- Holakooei, P. A Multi-Spectroscopic Approach to the Characterization of Early Glaze Opacifiers: Studies on an Achaemenid Glazed Brick Found at Susa, South-Western Iran (Mid-First Millennium BC). Spectrochim. Acta Part A Mol. Biomol. Spectrosc. 2013, 116, 49–56. [Google Scholar] [CrossRef] [PubMed]
- Alloteau, F.; Majérus, O.; Gerony, F.; Bouquillon, A.; Doublet, C.; Gries, H.; Fügert, A.; Thomas, A.; Wallez, G. Microscopic-Scale Examination of the Black and Orange–Yellow Colours of Architectural Glazes from Aššur, Khorsabad and Babylon in Ancient Mesopotamia. Minerals 2022, 12, 311. [Google Scholar] [CrossRef]
- Holakooei, P. A Technological Study of the Elamite Polychrome Glazed Bricks at Susa, South-Western Iran: Elamite Polychrome Glazed Bricks at Susa, South-Western Iran. Archaeometry 2014, 56, 764–783. [Google Scholar] [CrossRef]
- McCarthy, J.; Paynter, S.; Tite, M.S.; Shortland, A.J. Production of glazed pottery and brickwork in the near east. In Production Technology of Faience and Related Early Vitreous Materials; Oxford University School of Archaeology: Oxford, UK, 2008; pp. 187–198. [Google Scholar]
- Amadori, M.L.; Matin, E.; Poldi, G.; Mengacci, V.; Arduini, J.; Callieri, P.; Askari Chaverdi, A.; Holakooei, P. Archaeometric Research on Decorated Bricks of Tol-e Ajori Monumental Gate (6th Century BC), Fars, Iran: New Insight into the Glazes. J. Cult. Herit. 2023, 60, 63–71. [Google Scholar] [CrossRef]
- Thomas, A. Glazed Bricks by the Dozens: A Khorsabad Jigsaw Reassembled at the Louvre. In Glazed Brick Decoration in the Ancient Near East: Proceedings of a Workshop at the 11th International Congress of the Archaeology of the Ancient Near East (Munich) in April 2018; Fügert, A., Gries, H., Eds.; Archaeopress Archaeology; Archaeopress Publishing Ltd.: Oxford, UK, 2020; pp. 48–84. ISBN 978-1-78969-605-9. [Google Scholar]
- Thomas, A. Un puzzle en briques émaillées de Khorsabad. Rev. D’assyriologie Et D’archéologie Orient. 2020, 114, 103–158. [Google Scholar] [CrossRef]
- Caubet, A.; Kaczmarczyk, A. Les briques glaçurées du palais de Darius. Technè 1998, 7, 23–26. [Google Scholar]
- Caubet, A. Achaemenid Brick Decoration. In The Royal City of Susa: Ancient Near Eastern Treasures in the Louvre; Harper, P.O., Aruz, J., Tallon, F., Eds.; Metropolitan Museum of Art, Distributed by H.N. Abrams: New York, NY, USA, 1992; pp. 223–241. ISBN 978-0-87099-651-1. [Google Scholar]
- Caubet, A. De l’Égypte à Suse, à propos de faïences perses achéménides. Monum. Et Mémoires De La Fond. Eugène Piot 2009, 88, 5–27. [Google Scholar] [CrossRef]
- Shebanova, O.N.; Lazor, P. Raman Study of Magnetite (Fe3O4): Laser-Induced Thermal Effects and Oxidation. J. Raman Spectrosc. 2003, 34, 845–852. [Google Scholar] [CrossRef]
- Cotte, M.; Gonzalez, V.; Vanmeert, F.; Monico, L.; Dejoie, C.; Burghammer, M.; Huder, L.; de Nolf, W.; Fisher, S.; Fazlic, I.; et al. The “Historical Materials BAG”: A New Facilitated Access to Synchrotron X-Ray Diffraction Analyses for Cultural Heritage Materials at the European Synchrotron Radiation Facility. Molecules 2022, 27, 1997. [Google Scholar] [CrossRef]
- Cotte, M.; Dollman, K.; Fernandez, V.; Gonzalez, V.; Vanmeert, F.; Monico, L.; Dejoie, C.; Burghammer, M.; Huder, L.; Fisher, S.; et al. New Opportunities Offered by the ESRF to the Cultural and Natural Heritage Communities. Synchrotron Radiat. News 2022, 35, 3–9. [Google Scholar] [CrossRef]
- Raith, M.M.; Abdali, N.; Yule, P.A. Petrochemical Attributes of Glazed Architectural Elements from Middle-Elamite to Achaemenid Excavation Sites in Iran. Archaeol. Anthropol. Sci. 2022, 14, 182. [Google Scholar] [CrossRef]
- Tanimoto, S.; Rehren, T. Interactions between Silicate and Salt Melts in LBA Glassmaking. J. Archaeol. Sci. 2008, 35, 2566–2573. [Google Scholar] [CrossRef]
- Bontemps, G. Guide du Verrier: Traité Historique et Pratique de la Fabrication des Verres, Cristaux, Vitraux; Librairie du Dictionnaire des Arts et Manufactures: Paris, France, 1868. [Google Scholar]
- Turner, W.E.S. Studies in Ancient Glasses and Glassmaking Processes. Part V. Raw Materials and Melting Processes. J. Soc. Glass Technol. 1956, 40, 277–300. [Google Scholar]
- Stapleton, C.P.; Swanson, S.S. Batch Material Processing and Glassmaking Technology of 9th Century B.C. Artifacts Excavated from the Site of Hasanlu, Northwest Iran. MRS Proc. 2002, 712, II7.4. [Google Scholar] [CrossRef]
- Tite, M.S.; Shortland, A.; Maniatis, Y.; Kavoussanaki, D.; Harris, S.A. The Composition of the Soda-Rich and Mixed Alkali Plant Ashes Used in the Production of Glass. J. Archaeol. Sci. 2006, 33, 1284–1292. [Google Scholar] [CrossRef]
- Möncke, D.; Papageorgiou, M.; Winterstein-Beckmann, A.; Zacharias, N. Roman Glasses Coloured by Dissolved Transition Metal Ions: Redox-Reactions, Optical Spectroscopy and Ligand Field Theory. J. Archaeol. Sci. 2014, 46, 23–36. [Google Scholar] [CrossRef]
- Shortland, A.J.; Eremin, K. The Analysis of Second Millennium Glass from Egypt and Mesopotamia, Part 1: New WDS Analyses. Archaeometry 2006, 48, 581–603. [Google Scholar] [CrossRef]
- Liu, Z.; Pandelaers, L.; Blanpain, B.; Guo, M. Viscosity of Heterogeneous Silicate Melts: A Review. Met. Mater. Trans. B 2018, 49, 2469–2486. [Google Scholar] [CrossRef]
- Sharma, S.K.; Angel, S.M.; Ghosh, M.; Hubble, H.W.; Lucey, P.G. Remote Pulsed Laser Raman Spectroscopy System for Mineral Analysis on Planetary Surfaces to 66 Meters. Appl. Spectrosc. 2002, 56, 699–705. [Google Scholar] [CrossRef]
- Mineralogical Data on Hematite (Fe2O3), RRUFF ID: R050300. Available online: https://rruff.info/hematite/display=default/R050300 (accessed on 27 December 2021).
- Gualtieri, A.F.; Gemmi, M.; Dapiaggi, M. Phase Transformations and Reaction Kinetics during the Temperature-Induced Oxidation of Natural Olivine. Am. Mineral. 2003, 88, 1560–1574. [Google Scholar] [CrossRef]
- Wang, T.; Zhu, T.; Brunet, M.; Deshayes, C.; Sciau, P. Raman Study of Yuan Qinghua Porcelain: The Highlighting of Dendritic CoFe2O4 Crystals in Blue Decorations. J. Raman Spectrosc. 2017, 48, 267–270. [Google Scholar] [CrossRef]
- Abe, Y.; Harimoto, R.; Kikugawa, T.; Yazawa, K.; Nishisaka, A.; Kawai, N.; Yoshimura, S.; Nakai, I. Transition in the Use of Cobalt-Blue Colorant in the New Kingdom of Egypt. J. Archaeol. Sci. 2012, 39, 1793–1808. [Google Scholar] [CrossRef]
- Mameli, V.; Musinu, A.; Ardu, A.; Ennas, G.; Peddis, D.; Niznansky, D.; Sangregorio, C.; Innocenti, C.; Thanh, N.T.K.; Cannas, C. Studying the Effect of Zn-Substitution on the Magnetic and Hyperthermic Properties of Cobalt Ferrite Nanoparticles. Nanoscale 2016, 8, 10124–10137. [Google Scholar] [CrossRef] [PubMed]
- Kamta Tedjieukeng, H.M.; Tsobnang, P.K.; Fomekong, R.L.; Etape, E.P.; Joy, P.A.; Delcorte, A.; Lambi, J.N. Structural Characterization and Magnetic Properties of Undoped and Copper-Doped Cobalt Ferrite Nanoparticles Prepared by the Octanoate Coprecipitation Route at Very Low Dopant Concentrations. RSC Adv. 2018, 8, 38621–38630. [Google Scholar] [CrossRef]
- Ziwa, G.; Crane, R.; Hudson-Edwards, K.A. Geochemistry, Mineralogy and Microbiology of Cobalt in Mining-Affected Environments. Minerals 2020, 11, 22. [Google Scholar] [CrossRef]
- Ghirshman, R. Tchoga Zanbil (Dur-Untash). La Ziggurat; Mémoires de la Délégation archéologique en Iran. Mission de Susiane; P. Geuthner: Paris, France, 1966; Volume XXIX. [Google Scholar]
- Razmjou, S.; Tite, M.S.; Shortland, A.J.; Jung, M.; Hauptman, A. Glazed Bricks in the Achaemenid Period. In Persiens Antike Pracht; Stoellner, T., Slotta, R., Vatandoust, R., Eds.; Deutsches Bergbau-Museum: Bochum, Germany, 2004; pp. 382–393. [Google Scholar]
- Aloiz, E.; Douglas, J.G.; Nagel, A. Painted Plaster and Glazed Brick Fragments from Achaemenid Pasargadae and Persepolis, Iran. Herit. Sci. 2016, 4, 3. [Google Scholar] [CrossRef]
- Gratuze, B.; Pactat, I.; Schibille, N. Changes in the Signature of Cobalt Colorants in Late Antique and Early Islamic Glass Production. Minerals 2018, 8, 225. [Google Scholar] [CrossRef]
- Holakooei, P.; Soldi, S.; de Lapérouse, J.-F.; Carò, F. Glaze Composition of the Iron Age Glazed Ceramics from Nimrud, Hasanlu and Borsippa Preserved at The Metropolitan Museum of Art. J. Archaeol. Sci. Rep. 2017, 16, 224–232. [Google Scholar] [CrossRef]
- Freestone, I.C. Technical Examination of Neo-Assyrian Glazed Wall Plaques. Iraq 1991, 53, 55. [Google Scholar] [CrossRef]
- Molera, J.; Coll, J.; Labrador, A.; Pradell, T. Manganese Brown Decorations in 10th to 18th Century Spanish Tin Glazed Ceramics. Appl. Clay Sci. 2013, 82, 86–90. [Google Scholar] [CrossRef]
- Peix Visiedo, J.; Madrid i Fernández, M.; Buxeda i Garrigós, J. The Case of Black and Green Tin Glazed Pottery from Barcelona between 13th and 14th Century: Analysing Its Production and Its Decorations. J. Archaeol. Sci. Rep. 2021, 38, 103100. [Google Scholar] [CrossRef]
- Ting, C.; Lichtenberger, A.; Raja, R. The Technology and Production of Glazed Ceramics from Middle Islamic Jerash, Jordan. Archaeometry 2019, 61, 1296–1312. [Google Scholar] [CrossRef]
- Freestone, I.C.; Stapleton, C.P. Composition, technology and production of coloured glasses from Roman mosaic vessels. In Glass of the Roman World; Bayley, J., Freestone, I., Jackson, C., Eds.; Oxbow Books: Oxford, UK, 2015; pp. 61–76. ISBN 978-1-78925-339-9. [Google Scholar]
- Kirk, S. The Vitreous Materials from the 2nd Millennium BC City of Nuzi: Their Preservation, Technology and Distribution. Ph.D. Thesis, Cranfield University, Cranfield, UK, 2009. [Google Scholar]
- Mason, R.B.; Tite, M.S. The Beginnings of Tin-Opacification of Pottery Glazes. Archaeometry 1997, 39, 41–58. [Google Scholar] [CrossRef]
- Tesfaye, F.; Taskinen, P. Phase Equilibria and Thermodynamics of the System Zn-As-Cu-Pb-S at Temperatures Below 1173 K; SCIENCE + TECHNOLOGY; Aalto University Publication: Helsinki, Finland, 2011; ISBN 978-952-60-4126-1. [Google Scholar]
- Johto, H.; Taskinen, P. Phase Stabilities and Thermodynamic Assessment of the System Cu–Pb–S. Miner. Eng. 2013, 42, 68–75. [Google Scholar] [CrossRef]
- De Ryck, I.; Adriaens, A.; Adams, F. An Overview of Mesopotamian Bronze Metallurgy during the 3rd Millennium BC. J. Cult. Herit. 2005, 6, 261–268. [Google Scholar] [CrossRef]
- Schwartz, M.; Hollander, D. Annealing, Distilling, Reheating and Recycling: Bitumen Processing in the Ancient Near East. Paleo 2000, 26, 83–91. [Google Scholar] [CrossRef]
- Connan, J. Le Bitume dans l’Antiquité; Editions Errance: Arles, France, 2012; ISBN 978-2-87772-504-0. [Google Scholar]
- Arletti, R.; Ciarallo, A.; Quartieri, S.; Sabatino, G.; Vezzalini, G. Archaeometric Analyses of Game Counters from Pompeii. Geol. Soc. Lond. Spec. Publ. 2006, 257, 175–186. [Google Scholar] [CrossRef]
- Andreescu-Treadgold, I.; Henderson, J. Glass from the Mosaics on the West Wall of Torcello’s Basilica. Arte Mediev. 2006, 5, 87–140. [Google Scholar]
- van der Werf, I.; Mangone, A.; Giannossa, L.C.; Traini, A.; Laviano, R.; Coralini, A.; Sabbatini, L. Archaeometric Investigation of Roman Tesserae from Herculaneum (Italy) by the Combined Use of Complementary Micro-Destructive Analytical Techniques. J. Archaeol. Sci. 2009, 36, 2625–2634. [Google Scholar] [CrossRef]
- Santagostino Barbone, A.; Gliozzo, E.; D’Acapito, F.; Memmi Turbanti, I.; Turchiano, M.; Volpe, G. The Sectilia Panels of Faragola (Ascoli Satriano, Southern Italy): A Multi-Analytical Study of the Red, Orange and Yellow Glass Slabs. Archaeometry 2008, 50, 451–473. [Google Scholar] [CrossRef]
- Yuan, M.; Bonet, J.; Cotte, M.; Schibille, N.; Gratuze, B.; Pradell, T. The Role of Sulphur in the Early Production of Copper Red Stained Glass. Ceram. Int. 2023, 49, 18602–18613. [Google Scholar] [CrossRef]


| SiO2 | Al2O3 | Na2O | K2O | CaO | MgO | Fe2O3 | CuO | TiO2 | Sb2O3 | PbO | SO3 | Cl | |
|---|---|---|---|---|---|---|---|---|---|---|---|---|---|
| N8123 pr30 | 70.2 (0.3) | 1.9 (0.5) | 15.8 (0.2) | 3.1 (0.1) | 4.5 (0.1) | 2.6 (0.1) | 0.7 (0.3) | 0.2 (0.1) | 0.1 (0.1) | nd | nd | 0.8 (0.1) | 0.1 (0.1) |
| N8123 pr31 | 71.3 (1.0) | 1.6 (0.3) | 14.0 (0.4) | 3.5 (0.1) | 5.6 (0.2) | 2.6 (0.1) | 0.5 (0.1) | 0.3 (0.2) | <LOQ | nd | nd | 0.4 (0.1) | 0.4 (0.1) |
| Glass matrix of black glazes close to yellow color (n = 4) | 71.7 (2.5) | 1.4 (0.6) | 13.5 (0.2) | 3.3 (0.2) | 4.6 (0.4) | 2.4 (0.3) | 0.9 (0.6) | 0.1 (0.1) | 0.2 (0.3) | 0.4 (0.5) | 0.9 (1.0) | 0.7 (0.1) | 0.2 (0.1) |
Disclaimer/Publisher’s Note: The statements, opinions and data contained in all publications are solely those of the individual author(s) and contributor(s) and not of MDPI and/or the editor(s). MDPI and/or the editor(s) disclaim responsibility for any injury to people or property resulting from any ideas, methods, instructions or products referred to in the content. |
© 2023 by the authors. Licensee MDPI, Basel, Switzerland. This article is an open access article distributed under the terms and conditions of the Creative Commons Attribution (CC BY) license (https://creativecommons.org/licenses/by/4.0/).
Share and Cite
Beauvoit, E.; Bouquillon, A.; Majérus, O.; Caurant, D.; Cuny, J.; Thomas, A. Comparative Study of Architectural Bricks from Khorsabad and Susa Sites: Characterization of Black Glazes. Heritage 2023, 6, 6291-6310. https://doi.org/10.3390/heritage6090329
Beauvoit E, Bouquillon A, Majérus O, Caurant D, Cuny J, Thomas A. Comparative Study of Architectural Bricks from Khorsabad and Susa Sites: Characterization of Black Glazes. Heritage. 2023; 6(9):6291-6310. https://doi.org/10.3390/heritage6090329
Chicago/Turabian StyleBeauvoit, Emmie, Anne Bouquillon, Odile Majérus, Daniel Caurant, Julien Cuny, and Ariane Thomas. 2023. "Comparative Study of Architectural Bricks from Khorsabad and Susa Sites: Characterization of Black Glazes" Heritage 6, no. 9: 6291-6310. https://doi.org/10.3390/heritage6090329