Article

The Miskolc Method: Modelling the Evolution of a Natural City with Recursive Algorithms Using Simulated Morphogenesis

Department of Civil Engineering, Faculty of Engineering, University of Debrecen, 4028 Debrecen, Hungary
Heritage 2024, 7(10), 5865-5906; https://doi.org/10.3390/heritage7100276
Submission received: 20 August 2024 / Revised: 29 September 2024 / Accepted: 17 October 2024 / Published: 19 October 2024
(This article belongs to the Section Architectural Heritage)

Abstract

:
This article explores the application of procedural design methods in urban morphology, drawing inspiration from the innovative work of the Architectural Workshop of Miskolc in Hungary during the late 20th century. This study presents a generative approach termed “Simulated Morphogenesis” (or the “Miskolc Method”), which models organic city growth by analysing historical urban tissues and applying recursive algorithms to simulate natural urban development. The method leverages advanced generative tools, such as Rhinoceros 3D and Grasshopper, to model the step-by-step growth of Central European cities, with a particular focus on Miskolc. By incorporating controlled randomness into the algorithmic processes, the method captures the complexity of organic urban growth while maintaining structured development. The Miskolc Method emphasizes the importance of continuity and context, allowing for the “healing” of urban fabric discontinuities or the generation of new urban structures. This article demonstrates how this approach, while rooted in geometrical analysis, offers a valuable foundation for preliminary urban planning. The findings are relevant for understanding the morphogenesis of cities and provide a flexible framework applicable to various urban contexts globally.

1. Introduction

In contemporary urban design, generative and parametric (procedural) methods are gaining increasing prominence [1]. This procedural shift has largely been facilitated by the advent and widespread adoption of advanced software. However, even before the personal computer era, there were authors and groups whose ideas not only anticipated this shift but also laid a rich foundation for contemporary procedural methods. While a comprehensive overview of these figures is beyond the scope of this paper, some notable examples include Bernard Rudofsky [2], Nicholas Negroponte and the Architecture Machine Group at MIT [3], Bill Hillier and the Space Syntax Lab at UCL [4], and Christopher Alexander and his colleagues.
The aforementioned groups are internationally renowned, and their influence remains significant today. In Hungary, between 1977 and 1989, the Architectural Workshop of Miskolc operated, employing methods that could also hold great relevance for today’s procedural approaches. Since the group is relatively unknown outside Hungary, this article aims to briefly highlight the innovative aspects of their work and how their ideas can be directly applied to contemporary procedural methods.
Even within Hungary, the group remains relatively unknown. This is due to a rather interesting paradox: they did not seek to immortalise themselves with monuments nor did they align around a monolithic ideology. In many ways, their methods and ideas were ahead of their time. Their architectural approach was characterised by a strong sense of contextuality rather than grand, singular architectural gestures. Csaba Bodonyi, the group’s leader, articulated their philosophy in his autobiography, which can be seen as a concise program for the group: “I view the building from the perspective of the settlement, and not vice versa. I consider architectural individualism to be harmful and something to avoid. I believe in architectural context. I accept that the settlement is immortal, and the buildings within it are replaceable elements” [5] (p. 31).
The research presented in this paper aims to develop a procedural method based on the principles of the Architectural Workshop of Miskolc, while simultaneously leveraging contemporary generative software and the latest advancements in urban morphology. This generative method, which begins with an analysis of existing structures, has been termed “Simulated Morphogenesis”, or, in reference to the Miskolc Workshop, the “Miskolc Method”. The case studies presented in this paper use the city of Miskolc as a basis, but a key feature of the method is its applicability to any city, provided the appropriate morphological analyses are conducted.
Given the complete absence of the work of the Miskolc Workshop in international literature, this paper necessarily includes numerous quotations from members of the workshop to offer readers a firsthand understanding of their work and principles. These quotations have been translated into English by the author of this paper.

1.1. A Historical Context: Hungary and Miskolc in the 1970s

After World War II, Hungary became part of the Eastern Bloc, adopting a communist political system. This meant that the private sector virtually ceased to exist, leading to the centralization of construction and architecture [6]. Alongside this came the dual tasks of post-war reconstruction and modernization. The population grew, and forced industrialization resulted in significant large-scale industrial investments, causing urban populations to expand rapidly. One consequence of this was a severe housing shortage. The government had to address this issue, and in 1964, it opted for the mass production of prefabricated reinforced concrete panel buildings. From the late 1960s onwards, vast panel housing estates were built, often requiring the complete demolition of older neighbourhoods. Within a few decades, the landscape of Hungarian cities had changed irreversibly [7].
Architecturally, these large-panel housing estates loosely followed the principles of modernist urbanism, which were rooted in the work of Le Corbusier [8]. Previous urban fabrics were completely erased, and historical contexts were entirely disregarded in favour of free-standing, flat-roofed ribbon and point blocks. The strict functional separation of urban quarters was also applied: single-function residential neighbourhoods were created, where services—such as shops and educational facilities—were centralised in low-rise, flat-roofed buildings. The rigid hierarchy of traffic was another modernist feature, with multi-lane freeways for through traffic and service roads between the concrete panel buildings, often built without sidewalks, replacing multifunctional urban streets.
András Ferkai emphasises that the political decision to adopt “primitive Soviet large-panel prefabrication factories” was made against the will of the architects. According to him, the result of this choice was impersonal, rigid residential blocks that failed to integrate into urban life [9].
These negative trends were especially pronounced in Miskolc. After World War II, due to forced industrialisation, the city’s population tripled to 180,000 by 1970 [10]. Starting in 1968, over a span of fifteen years, massive prefabricated large-panel housing estates were constructed across various parts of the city using uniform concrete blocks. These developments occurred at the foot of the picturesque Bükk Mountains, in the immediate vicinity of the medieval Diósgyőr royal castle, in the so-called connecting district between Miskolc and Diósgyőr, on the orchards of Avas Hill, and even near the city centre, where parts of the historic old town were erased [11].
The greatest destruction took place near the city centre, where an entire historic district, Gordon, was demolished to make way for the Vörösmarty housing estate. Even the original street layout was completely eliminated [12]. As Csaba Bodonyi noted, “In many places, the past of the settlement was demolished. And what’s even sadder, it wasn’t just replaceable houses but entire urban structures and street networks that were eliminated. Houses can be replaced, but streets are essential. For example, in the Vörösmarty housing estate, the old streets disappeared, and new ones were not created. Yet, there was once a dense fabric of small streets here. It’s not the houses we should regret, but the structures” [13] (p. 27) (Figure 1).
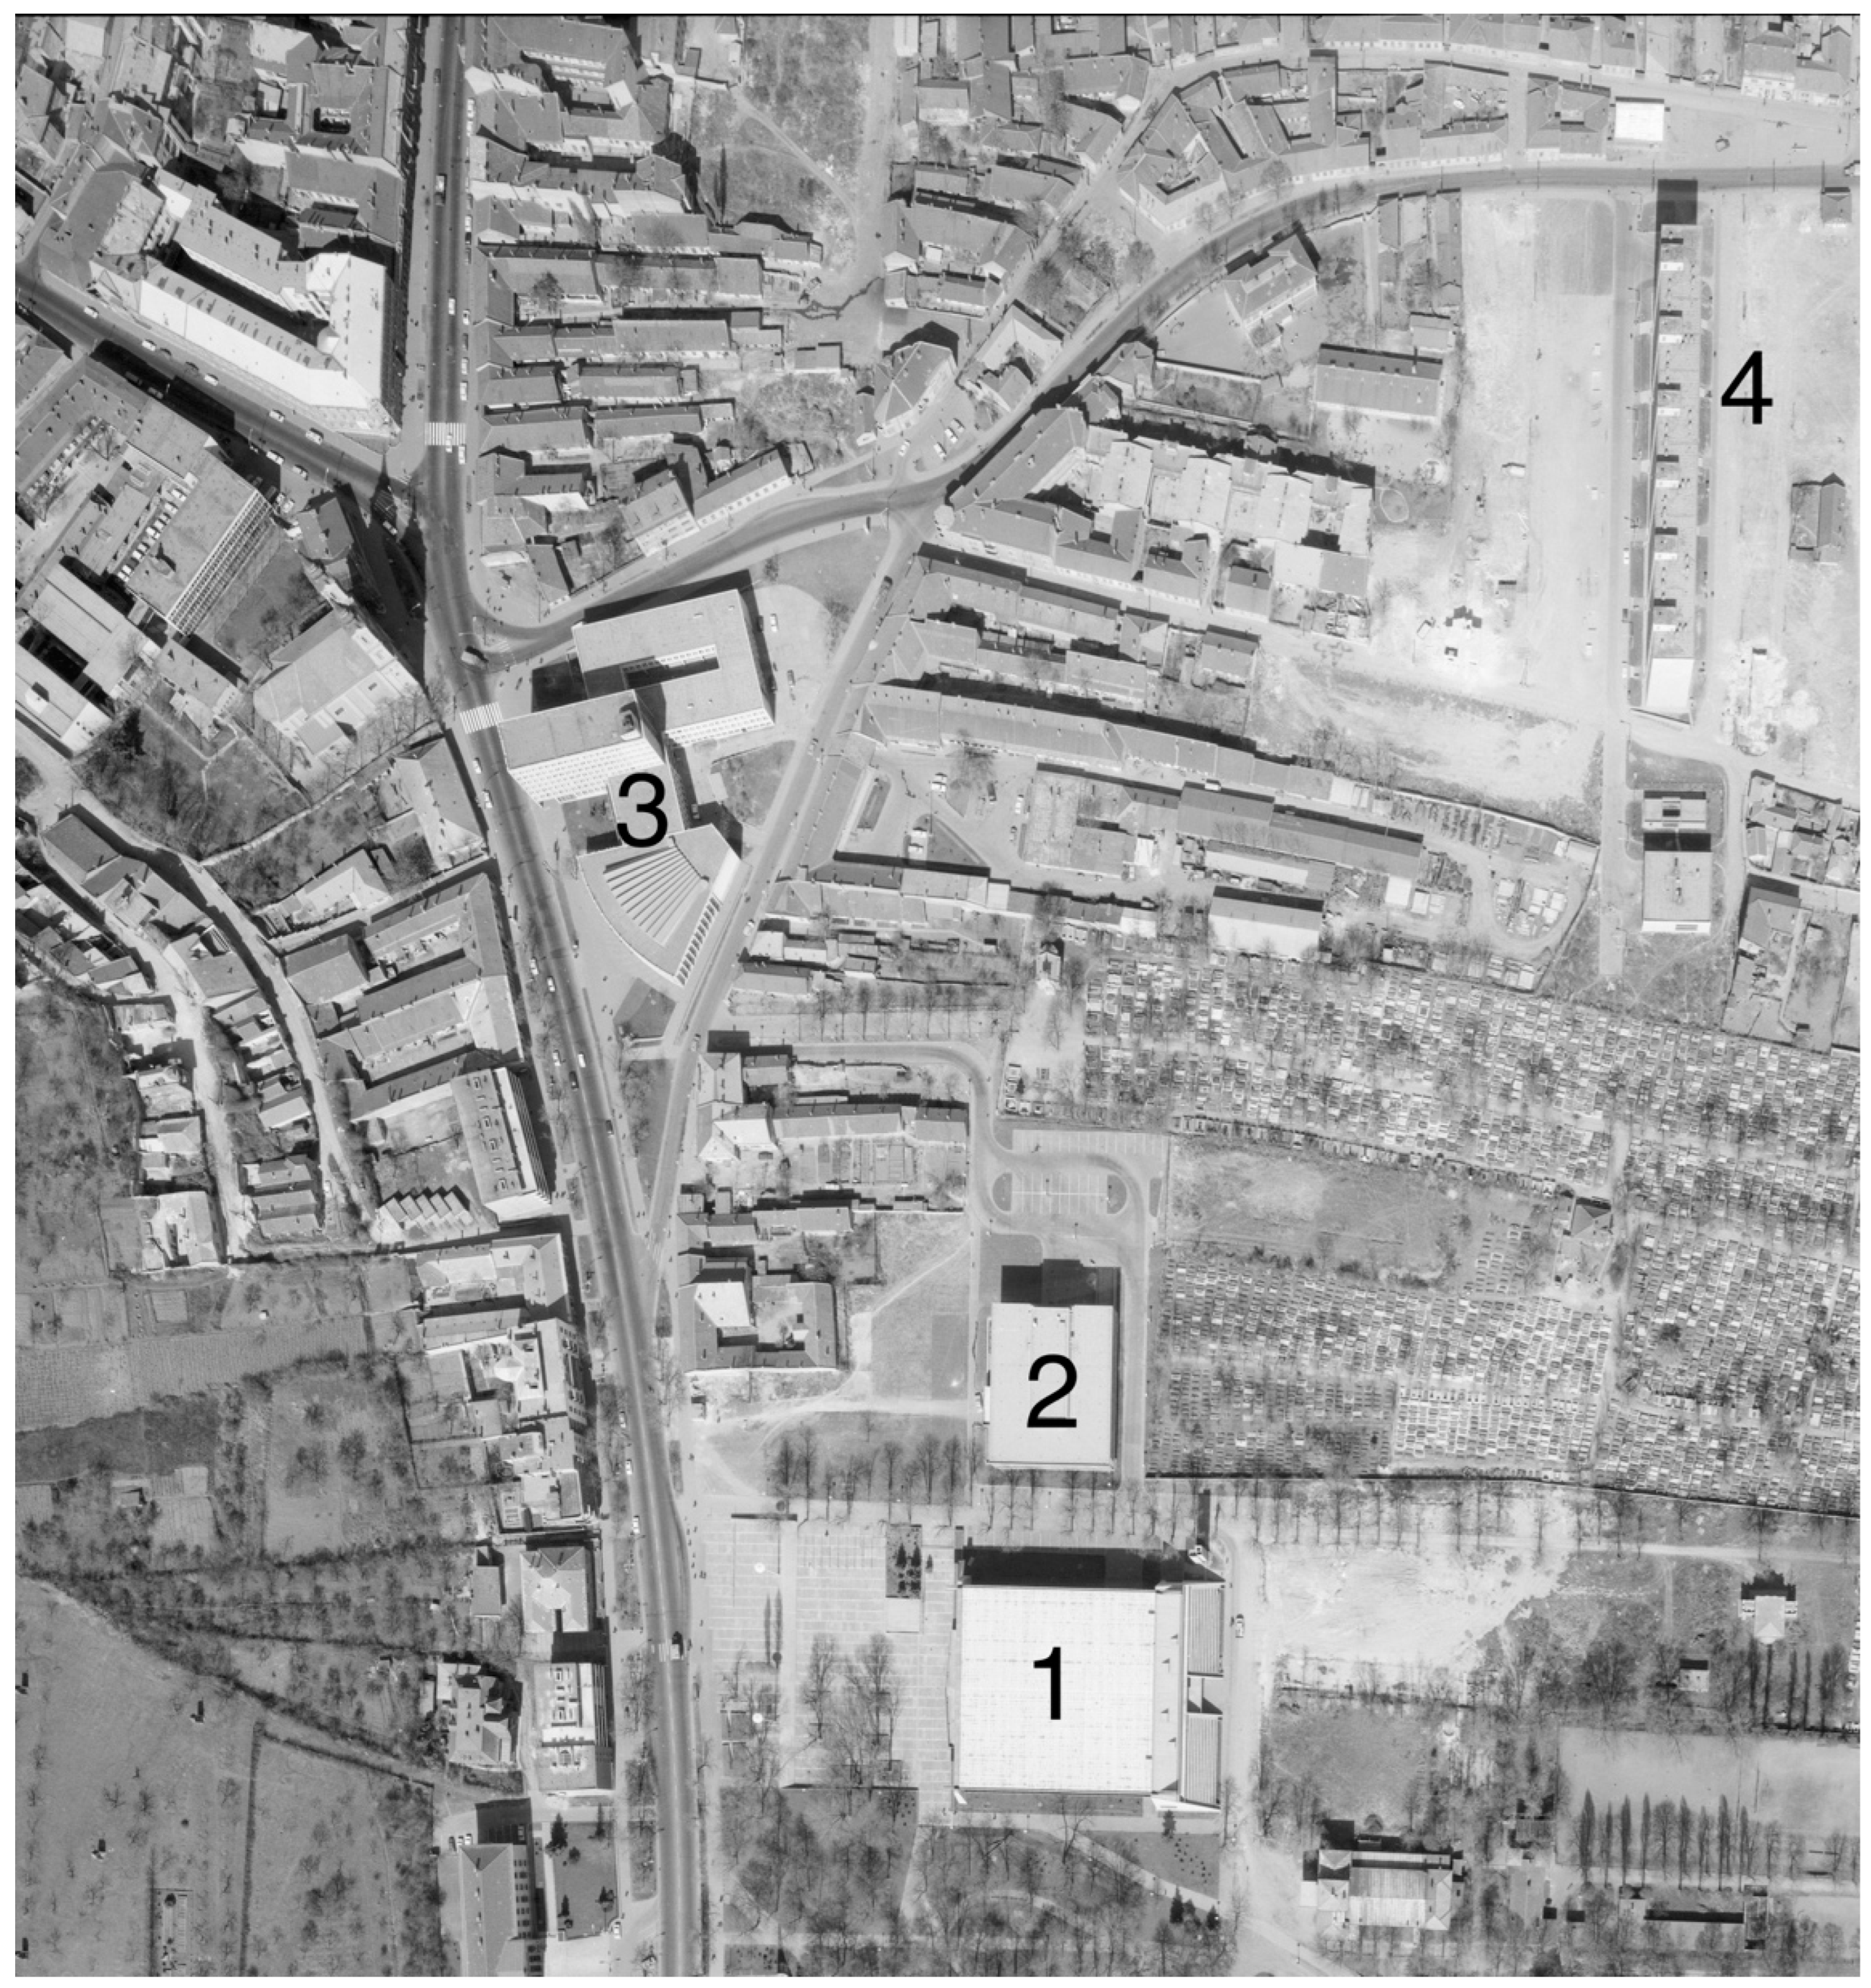
In addition to the large, mass-produced prefabricated housing estates, the city also saw the construction of high-quality modernist public buildings during this period. However, while these buildings may be of high quality as individual structures, they are free-standing and do not reflect the surrounding dense historical urban fabric in terms of size, shape, height, or geometry. Some were even built at the expense of the existing urban fabric, with not only buildings but also the organic plot structure being completely erased (Figure 2 and Figure 3). In general, Csaba Bodonyi’s observation about the architecture of the 1970s applies to these buildings: “The architecture of the 1970s (as a misguided branch of the modern movement) strives to create isolated individual buildings based on isolated individual philosophies” [14] (p. 024).
The regional state-owned planning company operating in the city, Északterv (Northplan, Zsigmondy u. 2, 3527 Miskolc, Hungary), covered three northern counties of Hungary. At its peak, the company had 500 employees, with its tasks determined from above in a strict and centralized corporate structure [15]. By the 1970s, the company was struggling with a shortage of professionals.
The Architectural Workshop of Miskolc began its operations in this context in 1979. A group of young architects, freshly graduated from the Technical University of Budapest, moved to the city at the invitation of Északterv and Miskolc’s leaders. They began working under the guidance of two established architects at the company, Csaba Bodonyi and István Ferencz.

1.2. Overview of the Work of the Architectural Workshop of Miskolc

The members of the Miskolc Workshop, with varying degrees of intensity and some fluctuation, included the following architects (in addition to the two masters): János Golda, Katalin Gergely, Zoltán Horváth, Attila Kosdi, Zoltán Klie, János Máté, Tamás Noll, Ágnes Novák, Attila Pirity, Benő Taba, Ágnes Thoma, István Sári, László Szőke, Mihály Rudolf, Pál Farkas, Emőke Lautner, Mária Lohrmann, László Rostás, and József Viszlai [16] (p. 5).
The Workshop’s novel and unique approach was rooted in viewing architecture as a process. They worked to achieve their goals within the strict limitations of the era, using the prefabricated technology that was mandated by the communist regime.
A significant precedent for this process-oriented approach was Csaba Bodonyi’s unrealized design from 1973 for new building wings (apartments for actors and workshops) for the Miskolc National Theatre. Reflecting on this design in 2023, Bodonyi shared the following thoughts with the author of this article: “As a young architect in 1967, and later in the early 1970s during my postgraduate studies, I realized the dominant and defining role of the site, context, and urban fabric—far more important than any sterile concept. Our buildings must be rooted in their surroundings. Only then can we truly continue what our predecessors have built—organically, with a fresh perspective, but always seamlessly connected” [17] (p. 35).
In the following sections, excerpts from interviews and contemporary writings will primarily present the methods of the Miskolc Workshop in their own words. These quotations are essential for understanding this research, as these thoughts have never before been published in English. The ideas are organized around two main themes: (a) how to understand a given situation and why this is important; and (b) how to respond or intervene in a manner that is not disruptive but rather improves (heals) and continues the existing situation (a process-based approach). László Szőke’s statements succinctly and programmatically illustrate this approach [14] (pp. 47–48):
“[…] we must emphasize the importance of understanding and comprehension, as this form of intervention is, in many ways, similar to the work of doctors. They introduce something into the body, hoping it will not be rejected and will instead improve or prolong life. […] It is only much later that we should reveal what we aim to change in the existing situation. […] In both space and time (though we see through a glass, darkly), we may have a chance to find the appropriate scale for our intervention—proportionate to these dimensions.
There are two approaches: one boldly hides behind its grand ideas and demands their imposition on the world. The other seeks to join the temporal process within space and the spatial process within time. It strives to understand why and what was created and built in a particular place, and how this can be continued today—knowing that the only final state in the process is death, and not even that is absolute.”
It is not difficult to identify “approach one” in the prefabricated large-panel housing estates and the modernist public buildings that disregard their surroundings, as discussed earlier. Szőke’s analysis of the Hadas district in the town of Mezőkövesd provides an illustration of the process and method of understanding. The caption accompanying the series of drawings reads: “Mezőkövesd, interpretation of the two-lot settlement type […]. The drawings of the buildings depict the nearly uniform density (similar to saturated gases), the block drawings show the internal arrangement within the large families, and the drawings of the block clusters highlight the key directions toward the outer courtyards, fields, and pastures” (Figure 4).
Similar to the Gordon district in Miskolc, this area was slated for complete demolition. One of the Miskolc Workshop’s significant achievements was their success in preserving it, creating a development plan that met modern technical and legal standards while maintaining the district’s distinctive, archaic urban tissue (Figure 5).
This process-oriented, understanding-based approach was not limited to large-scale urban projects. Tamás Noll describes it in an interview [14] (p. 089):
“To find the ‘lines of force’ in the urban fabric on which one can build, developing an architectural response from it, or to identify the specific logic of the program and overlay it on this fabric. The creation that results from these two is like a birth. It is not in our heads but actually develops over time.”
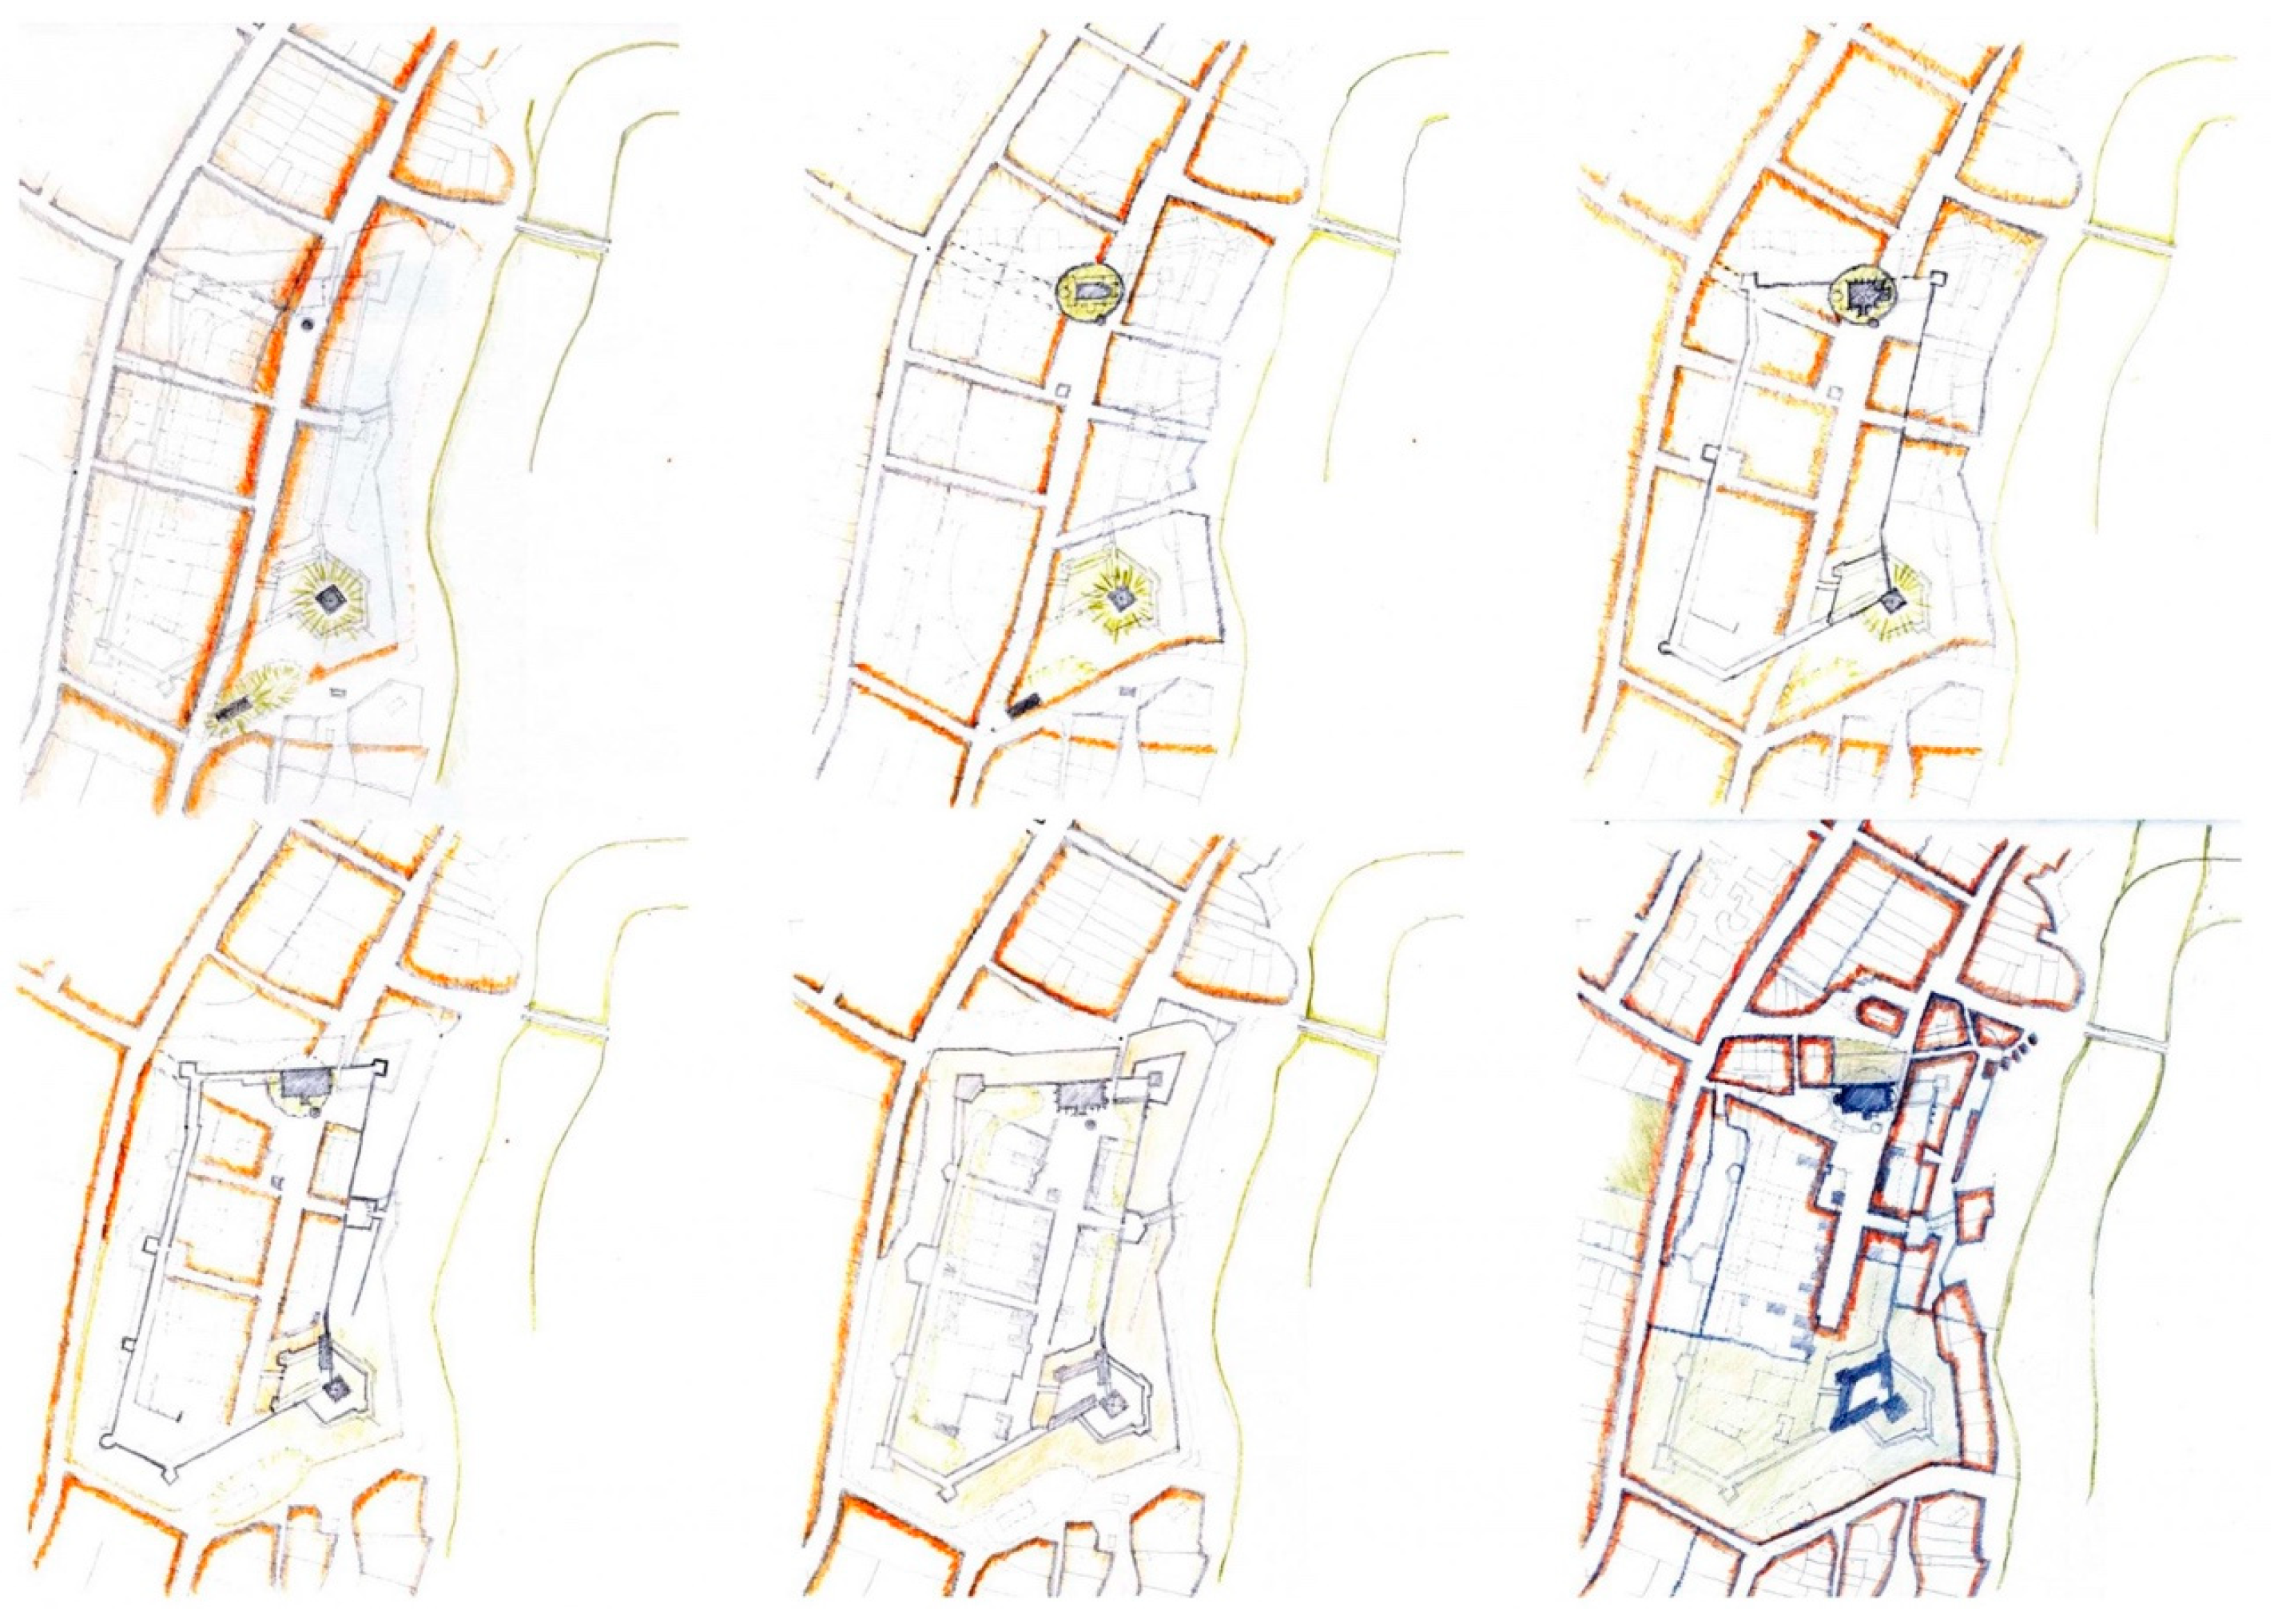
Time, once again, emerges as a crucial factor, as no process can be fully understood or modelled without accounting for its passage. Analysing the passage of time (in the case of past urban development) and then simulating it (when creating new plans) was a central part of their method. One example of the former is László Szőke’s work deciphering the medieval and early modern development of the town of Sárospatak (Figure 6). An example of the latter is their contribution to the 1981 Warsaw Confrontations (Warszawskie Konfrontacje), an international competition and architectural event.
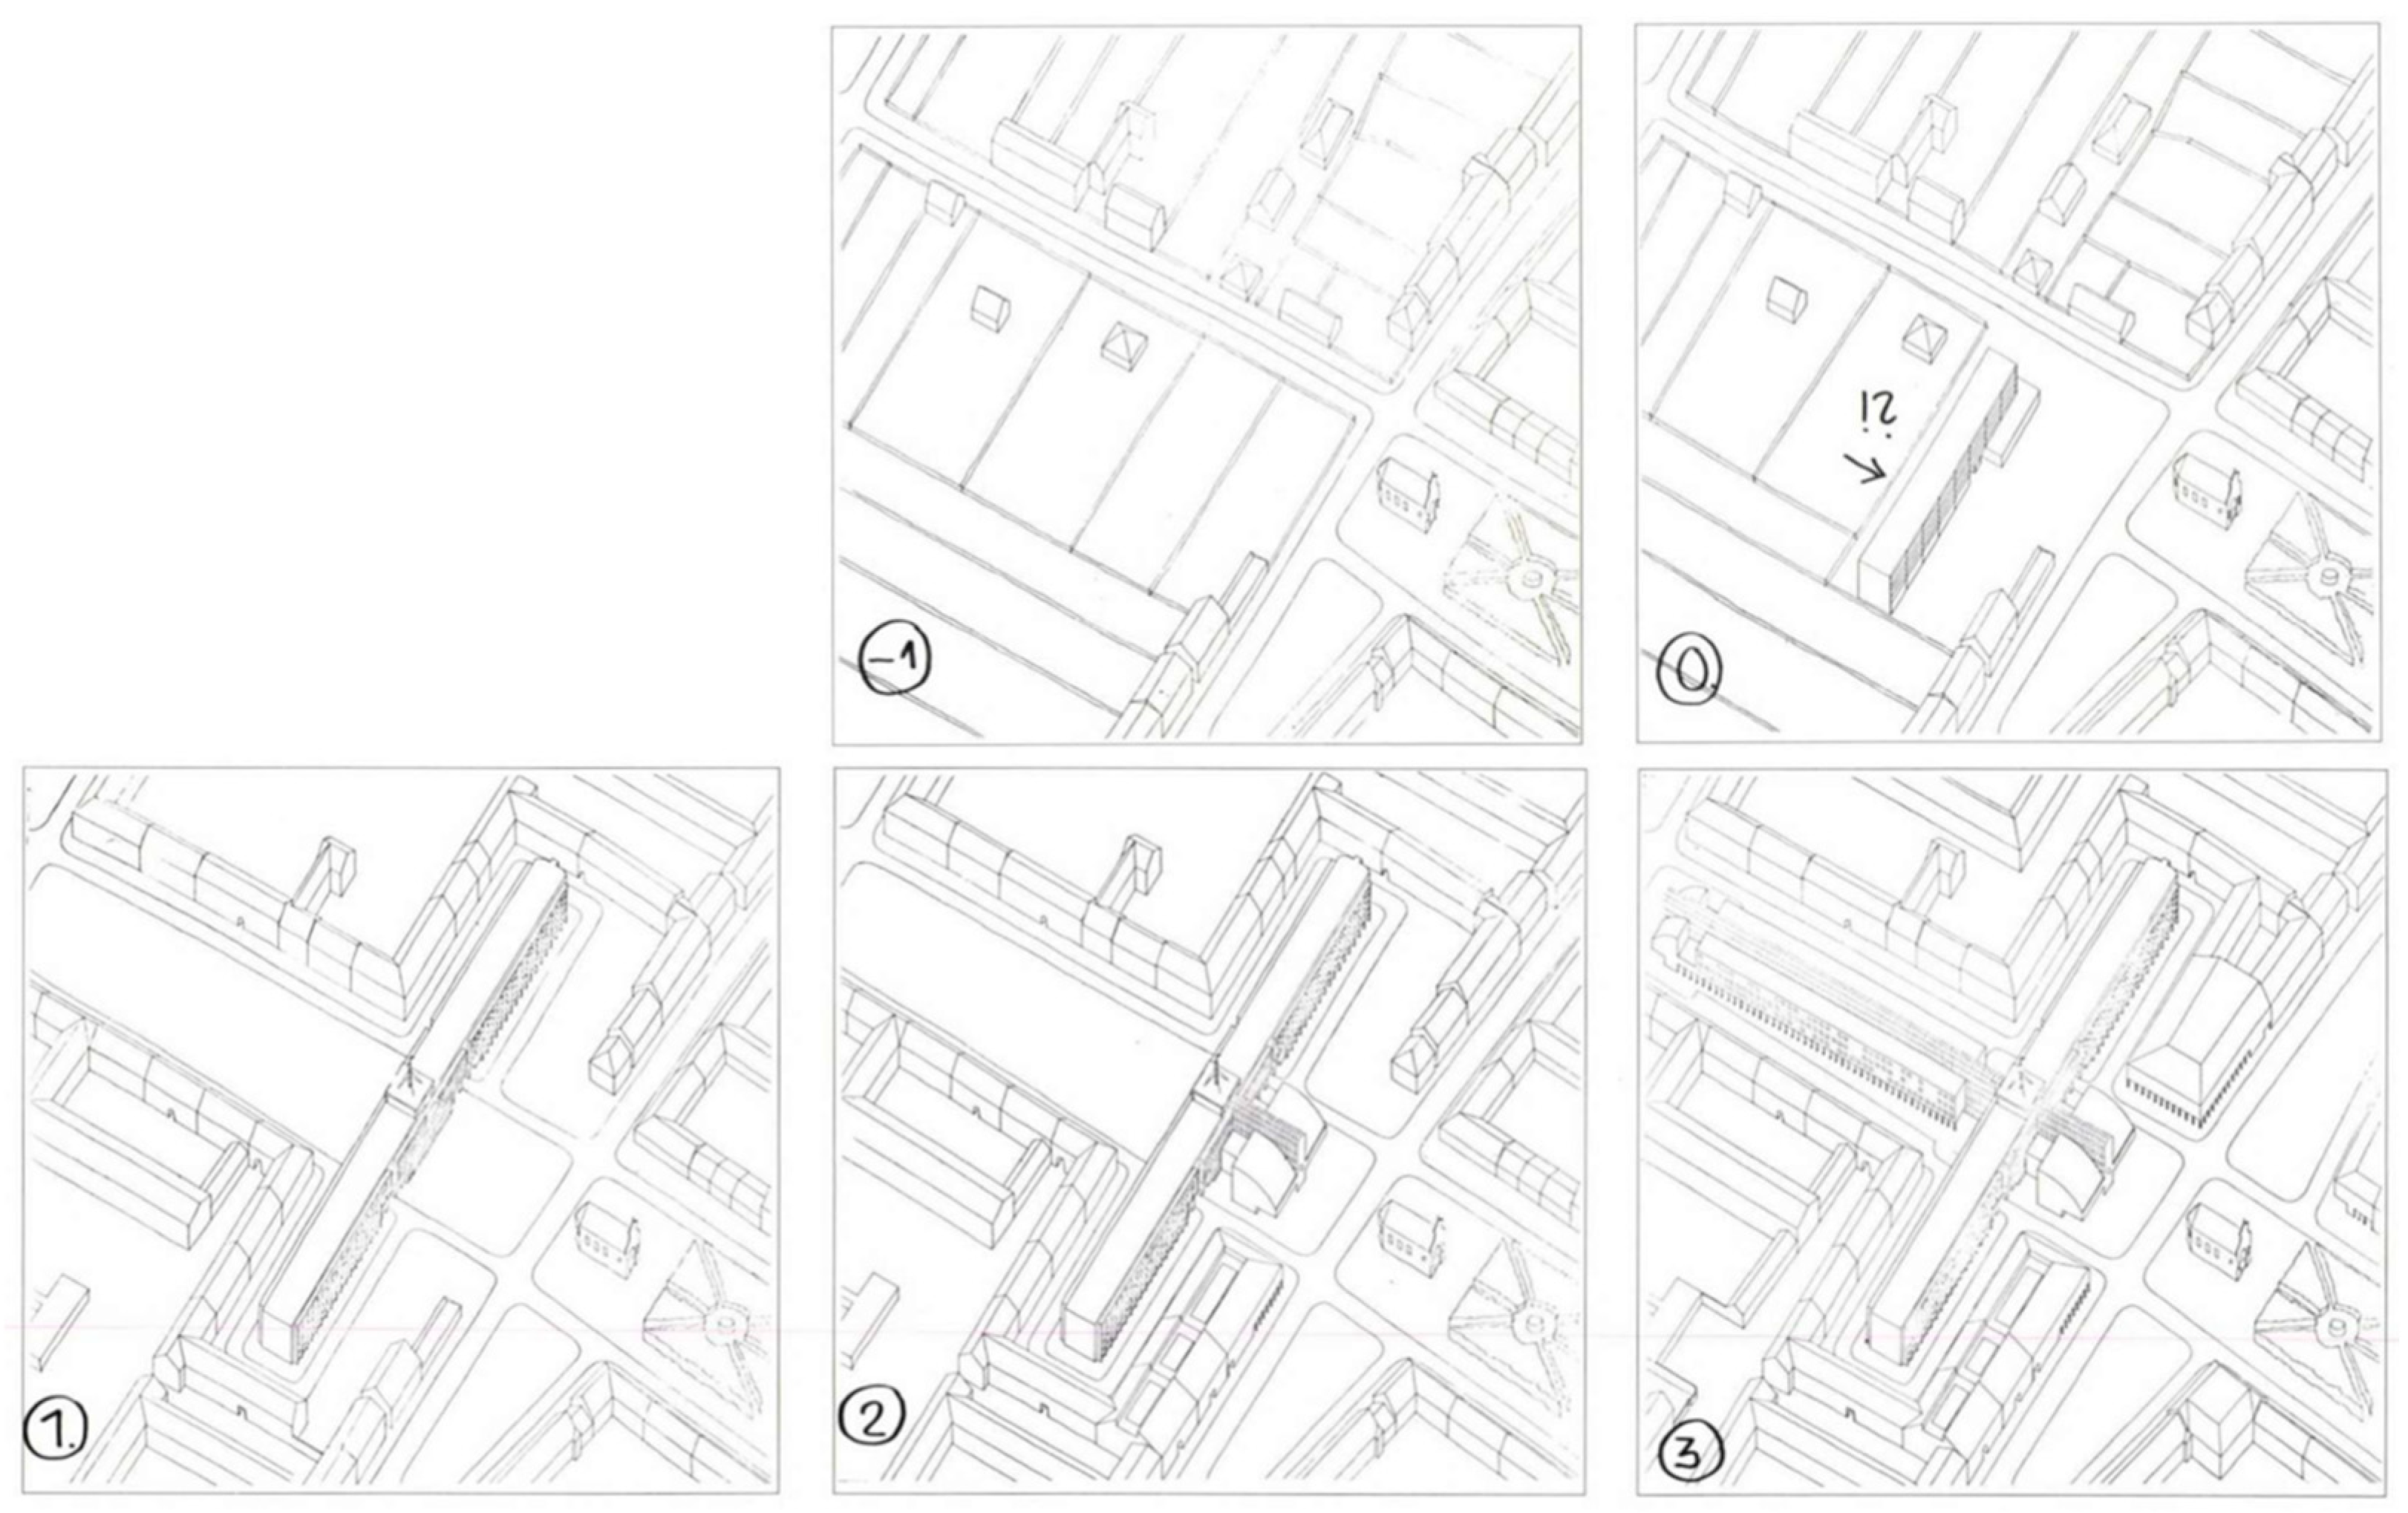
The subject of the Warsaw Confrontations was a development plan for Góra Kalwaria, a small town near Warsaw, Poland. In the town centre, a five-story, flat-roofed strip building had been erected earlier, completely disregarding the historical fabric and cutting off one of the town’s main axes. The Miskolc group sought to turn this situation into a positive one. They created a series of drawings simulating the process over time: starting with step −1, when the strip building did not yet exist, moving to step 0, which represents the current state, and finally steps 1, 2, and 3, which show how a town centre can gradually evolve from this situation. These steps follow the existing morphology while densifying the area and creating new urban spaces and public buildings (Figure 7).
Csaba Bodonyi’s description for the competition can be seen as a kind of creed for the group. It consists of two sets of 15 points: the first summarizes how they are “heretics”, and the second outlines what they believe in. The most relevant points for the current research are as follows [14] (pp. 045–046):
  • In what ways are we “heretics”?
    […]
    We do not believe in any theoretical approach, in any “ideal state” (ideal city, etc.).
    We do not believe in developments that fail to improve the existing state or that separate the development action from the real process.
    We do not believe that real processes develop optimally on their own, spontaneously, without planning or control.
    […]
  • What do we believe in, and what are the basic principles of our design method?
    […]
    We believe in design and development methods that allow for continuous feedback, which can be updated at any time but are not necessarily spectacular. This dynamic development model is something we seek to learn from nature. In nature, there is constant but dynamic balance, as contradictions are resolved through immediate feedback, preventing the accumulation of unresolved tensions.
    […]
    We develop the logic of growth and the implementation of development-oriented interventions uniquely, based on a careful analysis of the situation. We only insist on our method, which evolves through the tasks at hand (method > theory).
    […]
An important question is how their principles and methods align with international trends. Some elements of their approach to settlements relate to the American critique of modernism from the 1960s, especially the works of Kevin Lynch [19], Jane Jacobs [20], and Christopher Alexander [21]. The typological elements of land use in the Warsaw Confrontation competition (intersection, line, field) [22] (p. 22) strongly echo Lynch’s elements that define the image of settlements (Nodes, Edges, Paths, Districts) [19] (pp. 46–78).
However, the Miskolc Workshop’s approach to settlements and urban planning is most closely aligned with the ideas and methodology of Christopher Alexander. Although Alexander is mentioned only twice in the monograph and interviews discussing the workshop’s work, once by Csaba Bodonyi and once by János Golda [14] (pp. 11, 93), it is unclear to what extent this was a conscious influence or if their ideas developed independently but convergently.
In his 1979 book, The Timeless Way of Building, Alexander argues that the large-scale order of a city can emerge through purely incremental, piecemeal actions [23] (p. 496). As we have seen, this is a key concept for the Miskolc Workshop and is reflected in their work for the Warsaw Confrontation. The series of drawings that demonstrate the healing of the strip building’s disruptive effects on the town’s structure (Figure 7) is an example of Alexander’s “process of repair”. simulating natural growth and gradual development—an idea the workshop members emphasize repeatedly.
Alexander’s urban design methods crystallized fully in his 1987 book, A New Theory of Urban Design, published six years after the Warsaw Confrontation and just a year before the Miskolc Workshop disbanded. In this book, Alexander elaborates on the concept of “wholeness”. “When we look at the most beautiful towns and cities from the past, we are always impressed by a feeling that they are somehow organic. This feeling of “organicness”, is not a vague feeling of relationship with biological forms. It is not an analogy. It is instead, an accurate vision of a specific structural quality which these old towns had … and have. Namely: Each of these towns grew as a whole, under its own laws of wholeness. […] Thus, in our view, it is the process above all which is responsible for wholeness” [24] (pp. 2–3). Similar thoughts on the importance of process and open-endedness were also expressed by the members of the Miskolc Workshop, as discussed earlier. In this book, Alexander presents a case study demonstrating his urban design principles [24] (pp. 45–49), which closely parallels the Miskolc Workshop’s competition material from six years earlier, particularly in its focus on simulating gradual growth. This also highlights that the Miskolc Workshop was intellectually in step with the world’s leading urban theorists at the time.

2. Materials and Methods

2.1. The Method: Simulated Morphogenesis (“Miskolc Method”)

The generative method used in the research is called Simulated Morphogenesis. Its steps are as follows:
  • Investigating the formation and evolution of the area based on historical maps and its current condition.
  • Quantitative analysis of the current urban fabric using methods of urban morphology, including map analysis and fieldwork, to describe the characteristic urban tissue types.
  • Simulating earlier urban growth and the formation of characteristic urban tissue types in multiple incremental steps, applying generative algorithms and incorporating randomness.
  • Using the resulting algorithms to either (a) heal urban fabric discontinuities with the appropriate organic tissue type or (b) generate new urban fabric for empty areas, simulating organic growth.
This method draws heavily on the approach of the Miskolc Workshop, particularly in the following aspects:
  • Urban planning is conceived as an open-ended but controllable process.
  • The method is based on an analytical understanding of how urban fabrics form and develop.
  • The focus is on continuity, with growth proceeding step-by-step, while time is considered a key factor.
From a procedural standpoint, a crucial question is what can be used as input for generative algorithms. In Simulated Morphogenesis, the analysis of existing cities serves as the input, for which the examination of urban morphology and pattern recognition are essential.
Bill Hillier and Julienne Hanson’s concept of the “inverted genotype” is particularly useful for this method. The relationship between a single algorithm and the numerous geometries it generates is analogous to the relationship between genotype and phenotype in biology: a single genotype can produce multiple phenotypes that are similar but not identical. Although no such genotype exists in actual cities, similarities between cities or neighbourhoods can be observed. Hillier and Hanson describe these regularities as encoded by an inverted genotype [4] (p. 44). This genotype can be extracted through analysis and used as input for Simulated Morphogenesis to create structures that share key similarities with the original but are not identical [25].
In terms of pattern recognition and the description of urban morphology in a Central European context, Éva Lovra’s 2019 book, Városok az Osztrák-Magyar Monarchiában (Towns in Austria-Hungary), is important [26]. Lovra’s work distils cities to their basic fabric, identifies dominant urban tissue types, and defines characteristic types through diagrams and descriptions. These can then be quantified and used for generative algorithms. Since the algorithms in this study are based on Miskolc, a typical Central European city, Lovra’s fabric catalogue can be directly utilized. In other cases, similar works must be identified, or a comparable cataloguing process must be undertaken.
Intuitive pattern recognition is crucial for identifying different tissue types, as real-world embodiments of these types are never identical. Mario Carpo explains that “human intelligence recognizes an invisible generative structure shared by two visibly different forms” [27]. The challenge is creating a generative algorithm for this structure. The tissues generated by such algorithms form a non-standard series, and it is important that the generated “city” possesses a structure rather than a mere order. Hillier differentiates between order and structure, arguing that planned cities exhibit order, while organic ones possess structure—a “powerful spatial patterning” [28] (p. 235).
Random number generators play a significant role in these algorithms, reflecting the role of contingencies in the evolution of natural cities. Otto Wagner articulated this concept in 1912—long before the science of urban morphology—though with a pejorative tone: “On the extreme periphery of a great city private boundaries, paths, water courses, small differences of level, a tree, even a manure pile, may determine the later location of particular structures. These in turn influence the position of roads, squares, etc., so that at last out of these chance beginning the permanent plan of the city grows up” [29] (p. 491).
Although it is impossible to incorporate all contingencies into an algorithmic model, randomness can be introduced through random number generators. Hillier also emphasizes the importance of randomness in morphogenetic models: “morphogenesis in such systems requires, it seems, the co-presence of randomness and rules restricting that randomness” [28] (p. 243).
However, the process cannot be entirely random; it must be controlled, even within generative algorithms. As Csaba Bodonyi wrote in 1981, “We don’t believe that real processes develop optimally on their own, spontaneously, without planning or control” [14] (p. 45). Similarly, Alexander, in A New Theory of Urban Design (1987), explains that although the process is open-ended and design occurs step by step, there must always be a guiding vision at every intermediate stage [24] (p. 30).
Mathematically speaking, four key factors are crucial for simulating the morphogenesis of natural cities:
  • Semilattice nature;
  • Recursiveness;
  • Open-endedness;
  • Time as a key factor.
Christopher Alexander introduced the concept of a semilattice in 1965 [21], demonstrating the distinction between artificial and natural cities using a simple mathematical model. According to Alexander, artificial cities follow a tree structure, where each element has one parent. In contrast, natural cities are modelled as a semilattice, where an element can be associated with multiple parents, resulting in a much more complex system of relationships. This allows for overlaps and a far greater number of potential variations (Figure 8).
The essence of a recursive definition is that the same description is repeated multiple times, across multiple hierarchical levels, seemingly embedded within itself. In this system, elements at a lower level inherit their input parameters from higher-level elements and pass their output to lower-level elements. When any instance of the description is modified, all other instances are also affected. Fractals are a classic example of recursive definitions. The fractal nature of cities is an emerging and vibrant field of urban science [31] (pp. 21–144).
In open-ended systems, both the procedure and its parameters can be dynamically extended or modified to generate different geometries. Altering relationships between elements in a semilattice significantly affects the final result. Similarly, in a recursive system, changing a single element transforms the entire system. The system can also be expanded at any time with existing outputs serving as inputs for new elements, either in a semilattice or a recursive manner—or most commonly, a combination of both. A natural city is never truly finished, which sets it apart from the “ideal” planned cities of the Renaissance and Modernism.
In this research, two related case studies were developed to model and test these ideas. The first case study involved the simulated morphogenesis of a “generic” Central European town. The key inspirations for this simulation were the principles of the Miskolc Workshop, the simulation presented in Alexander’s A Vision of a Living World [32] (p. 360), and Hillier and Hanson’s ideas about how spatial structures can emerge without central agency [4] (p. 36). For this study, the growth of Miskolc served as a guiding vision.
The second case study sought to adapt the algorithm to a specific location. It is important to emphasize that the result is not a master plan but rather an experiment that can serve as a foundation for a preliminary master plan.

2.2. The Material: Evolution and Morphology of MISKOLC

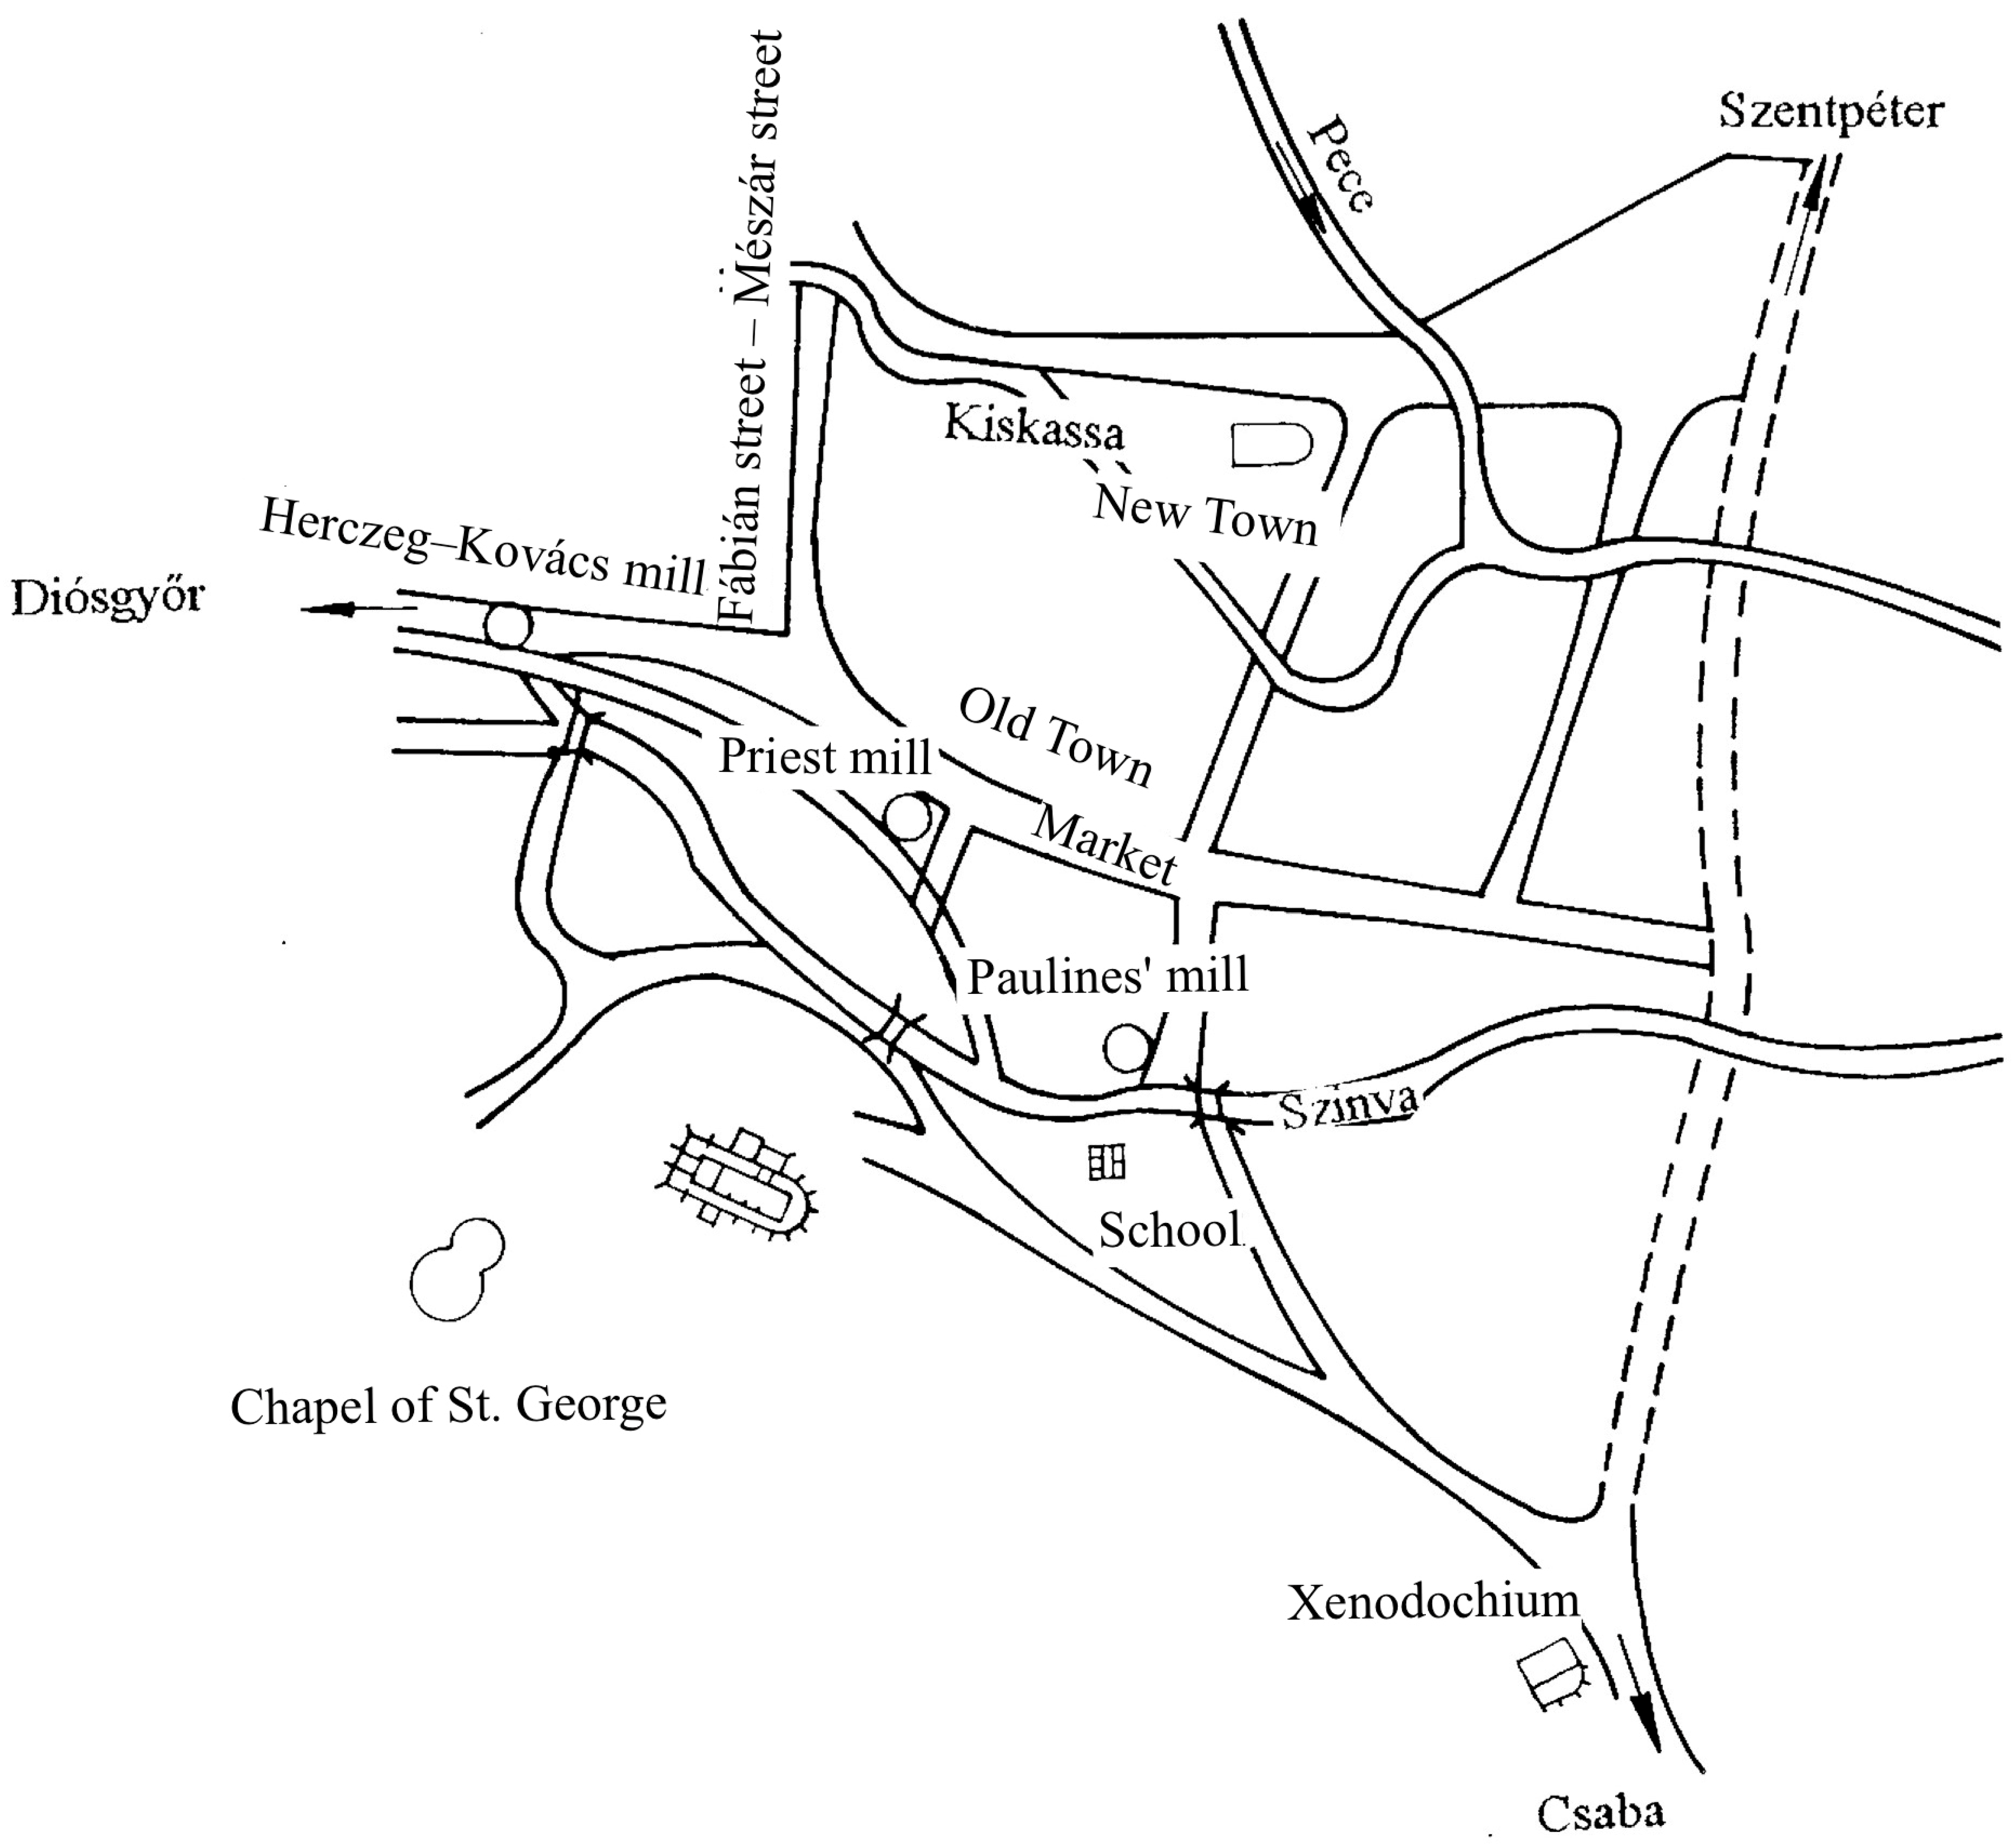
Miskolc was founded in the 13th century and was granted oppidum (market town) status by Louis I, King of Hungary, in 1365. No contemporary maps of the town from the Middle Ages exist, but Éva Gyulai reconstructed Miskolc’s medieval topography based on written sources [33] (Figure 9). Her research shows that the medieval city largely coincides with today’s city centre. Major streets and squares, like Széchenyi Street (formerly Piac or Market Street) and Town Hall Square, had precursors in the medieval period. By the 15th century, the city was divided into the Old Town around Széchenyi Street and the New Town near today’s Deák Square, whose distinct triangular shape also dates to the Middle Ages. These old squares developed irregularly through the process of street widening, and each city part had its own parish church.
The oldest relatively precise map of Miskolc was drawn by Ferenc Reidl in 1781 (Figure 10) [34] (pp. 34–35). This map details the inner areas, including plots and buildings, making it suitable for morphological analysis. The urban fabric at the time was quite simple. The backbone of the street network is the slightly curved main street that runs parallel to the Szinva stream. The morphology is irregular, with elongated rectangular plots surrounding most streets, which are mostly curved. In many cases, the sides of the streets are not parallel, and the rear of the plots often face either a stream or an open area. The houses are rectangular, set perpendicular to the street, and positioned on the side borders of the plots. At the intersection that could be considered the city’s geometric origin (at the corner of today’s Széchenyi Street and Kossuth Lajos Street), larger L-shaped houses overlook the junction. Several public buildings are also visible, primarily clustered around squares: to the south, the Church of Mindszent and the xenodochium; to the north, the Minorite Church with its monastery and the County Hall on today’s City Hall Square.
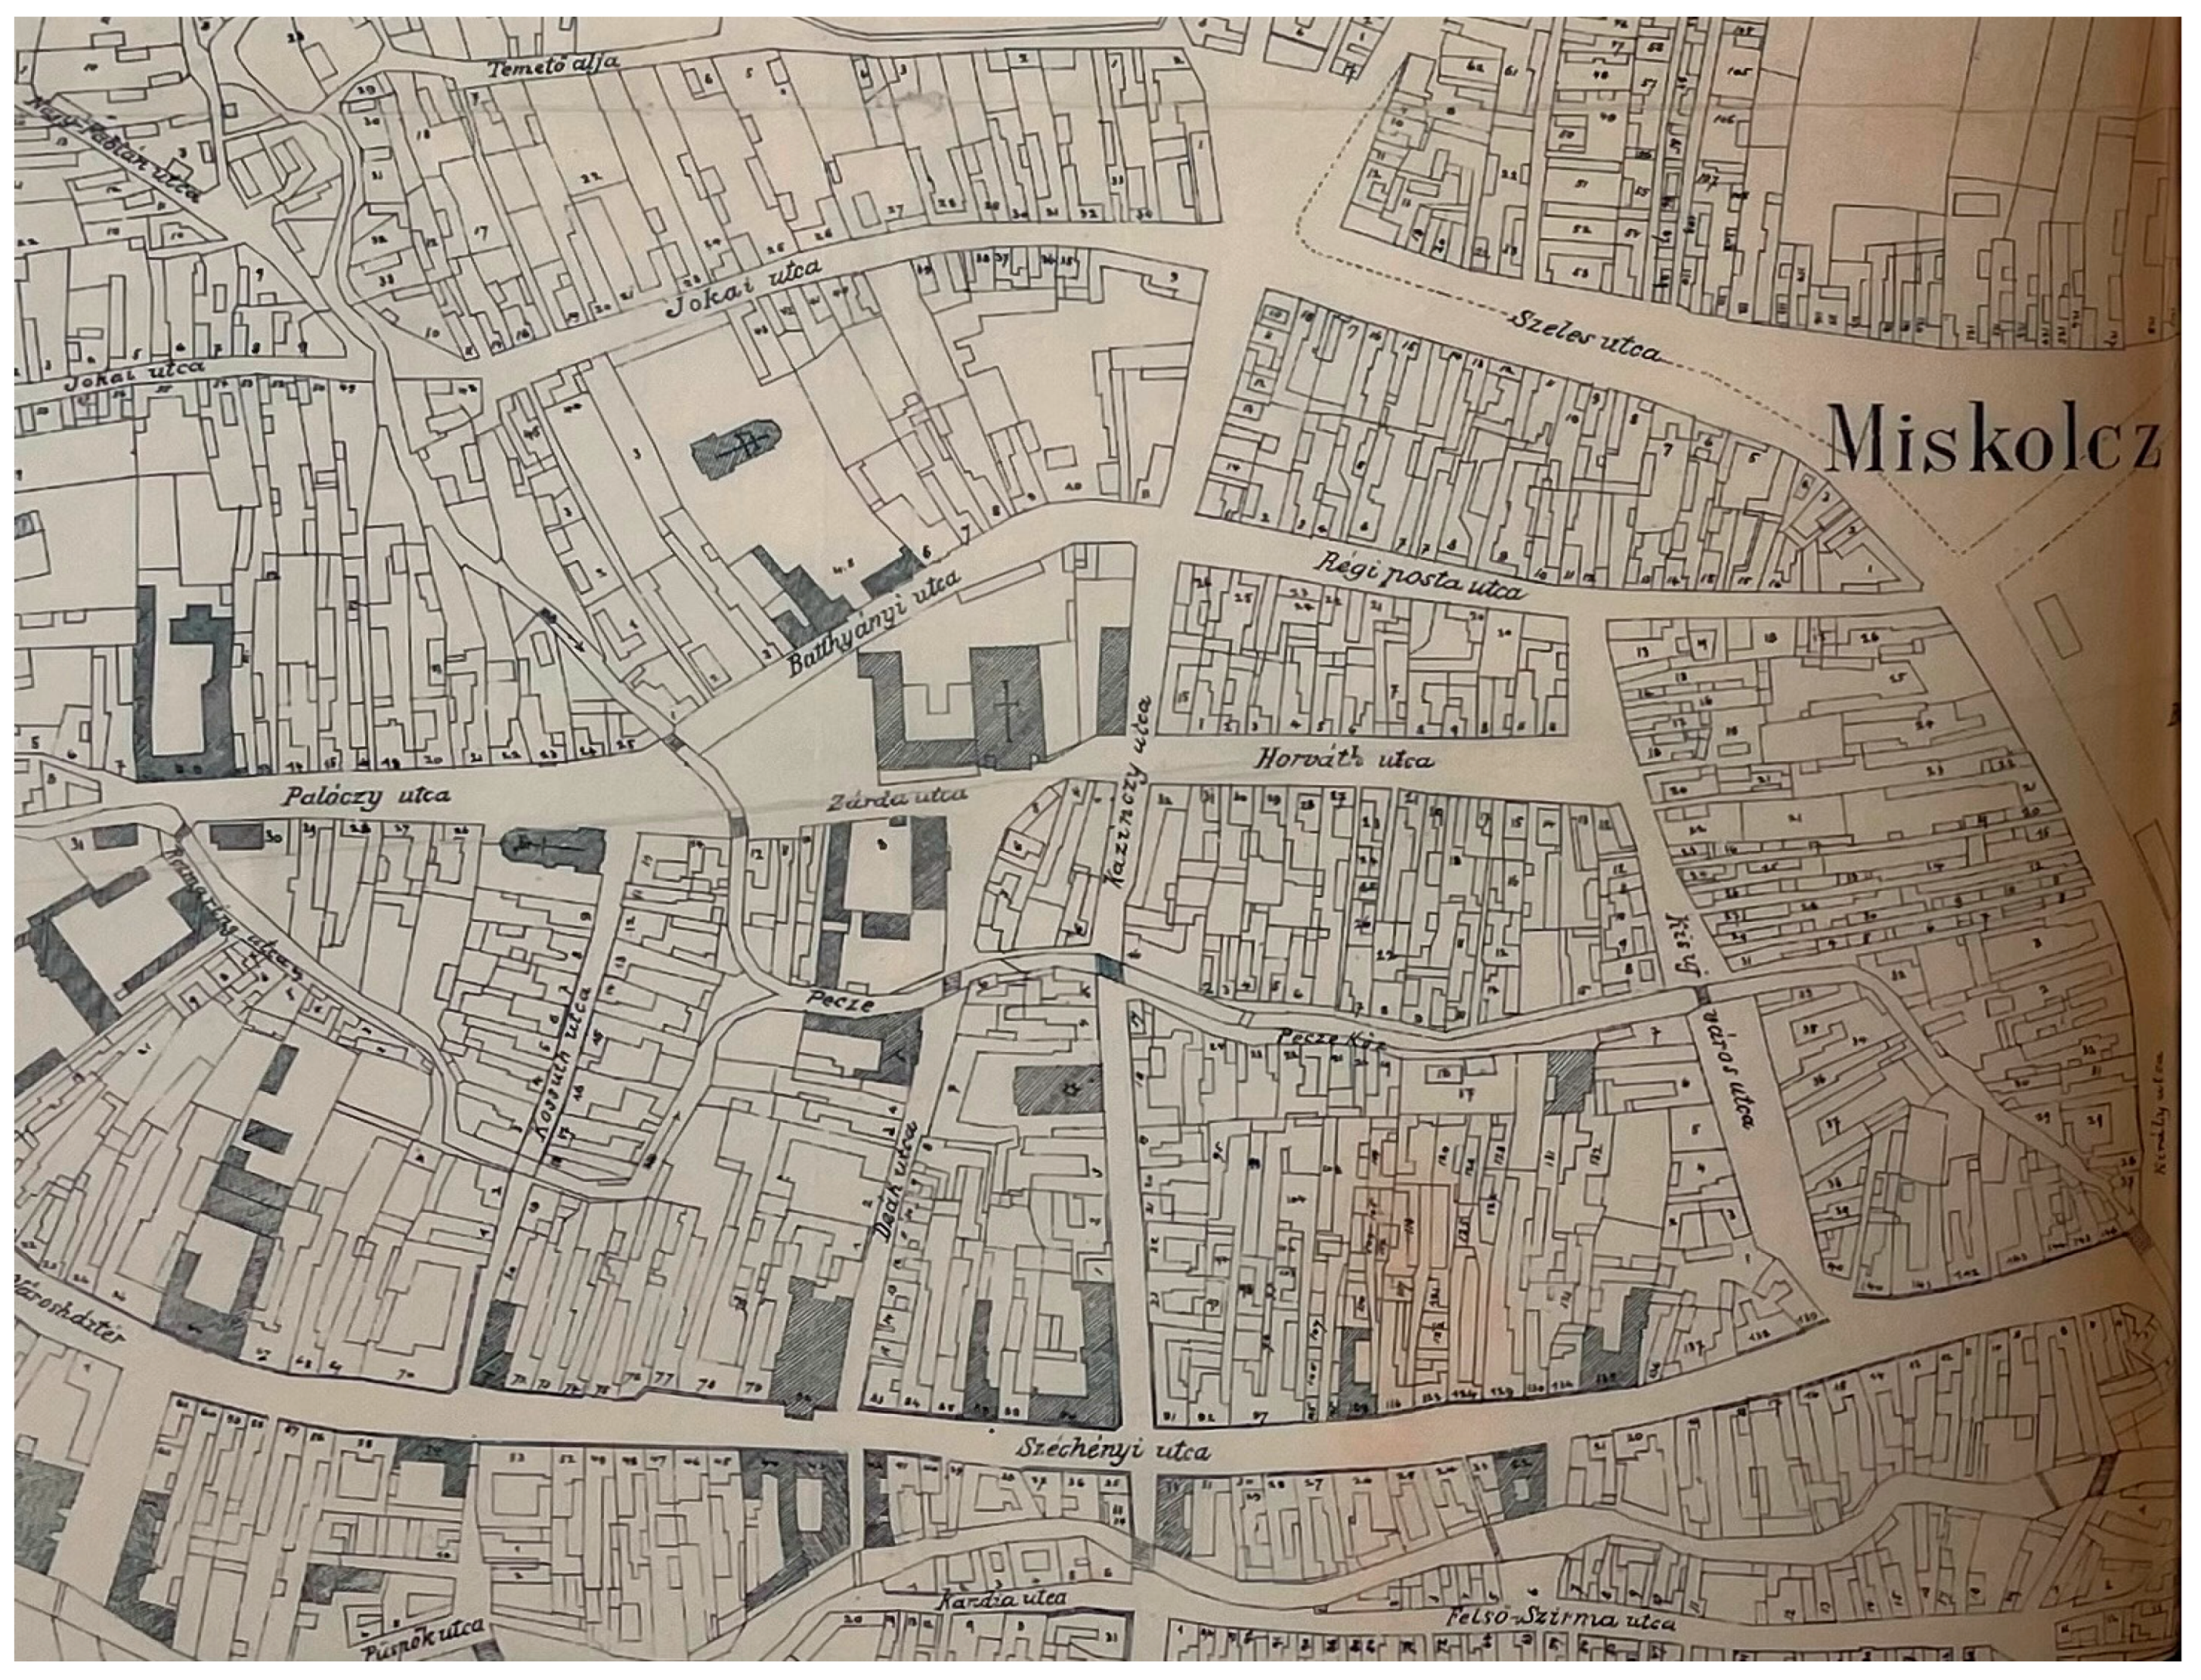
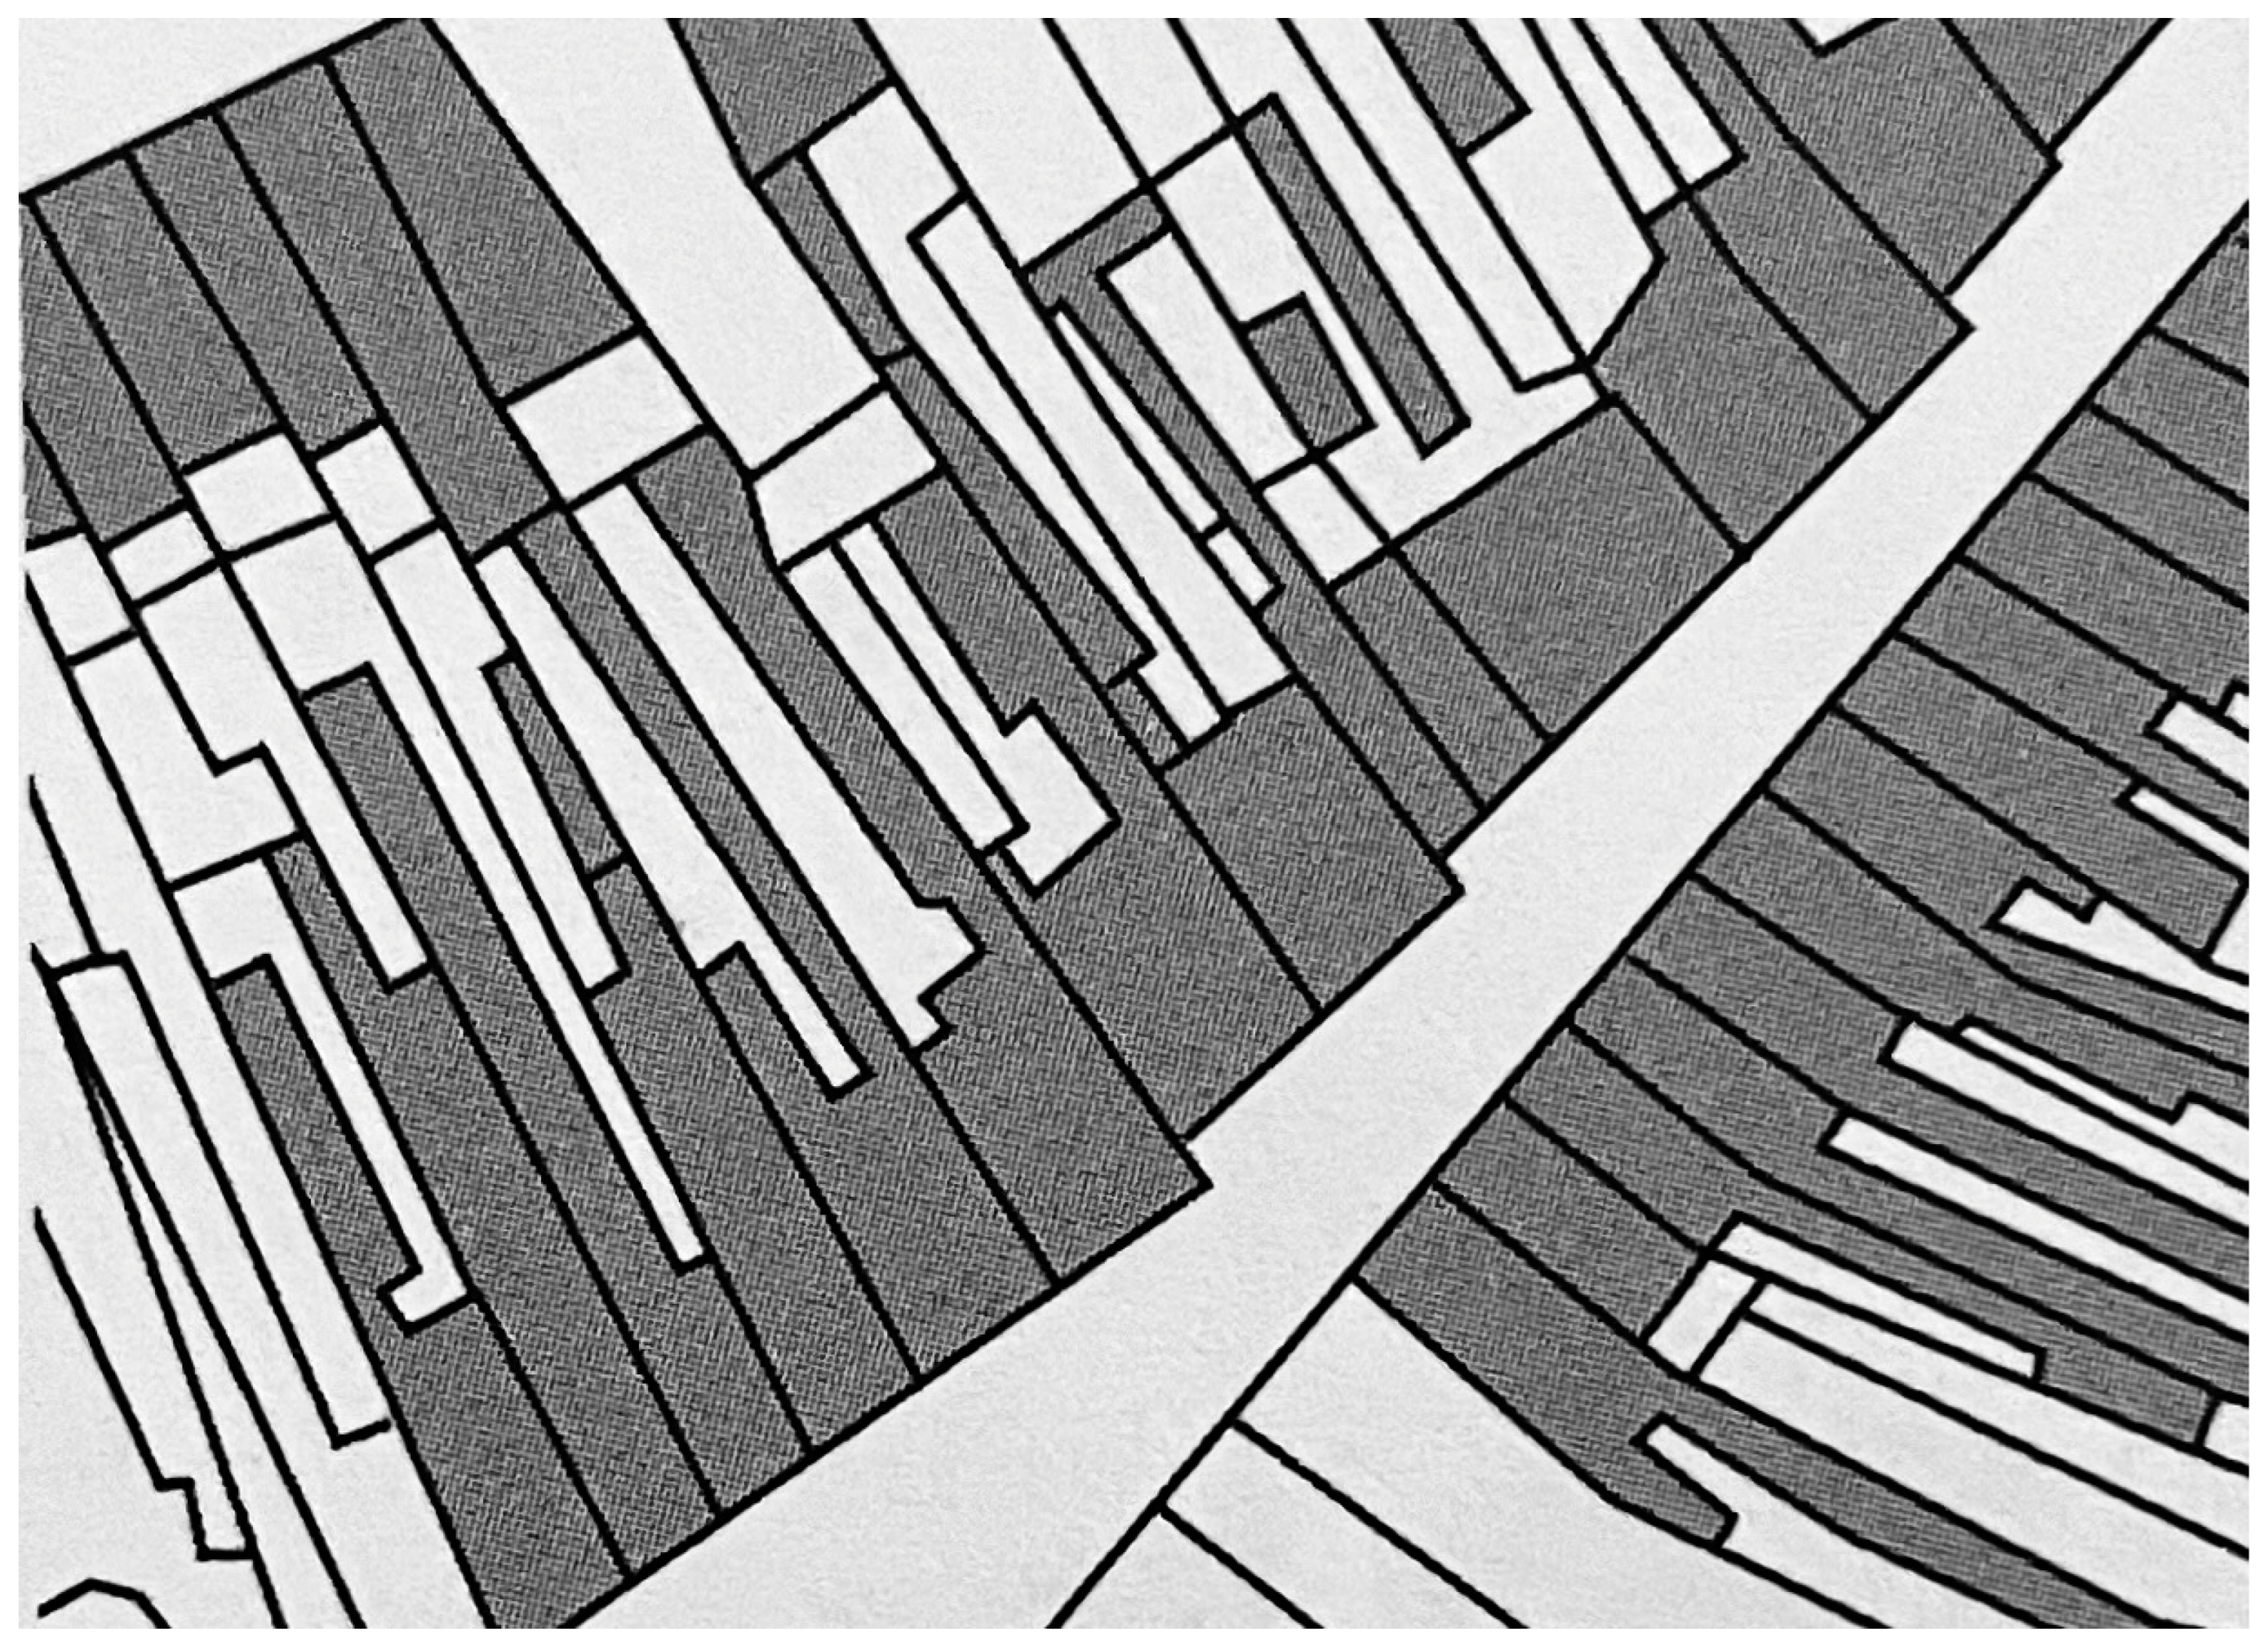
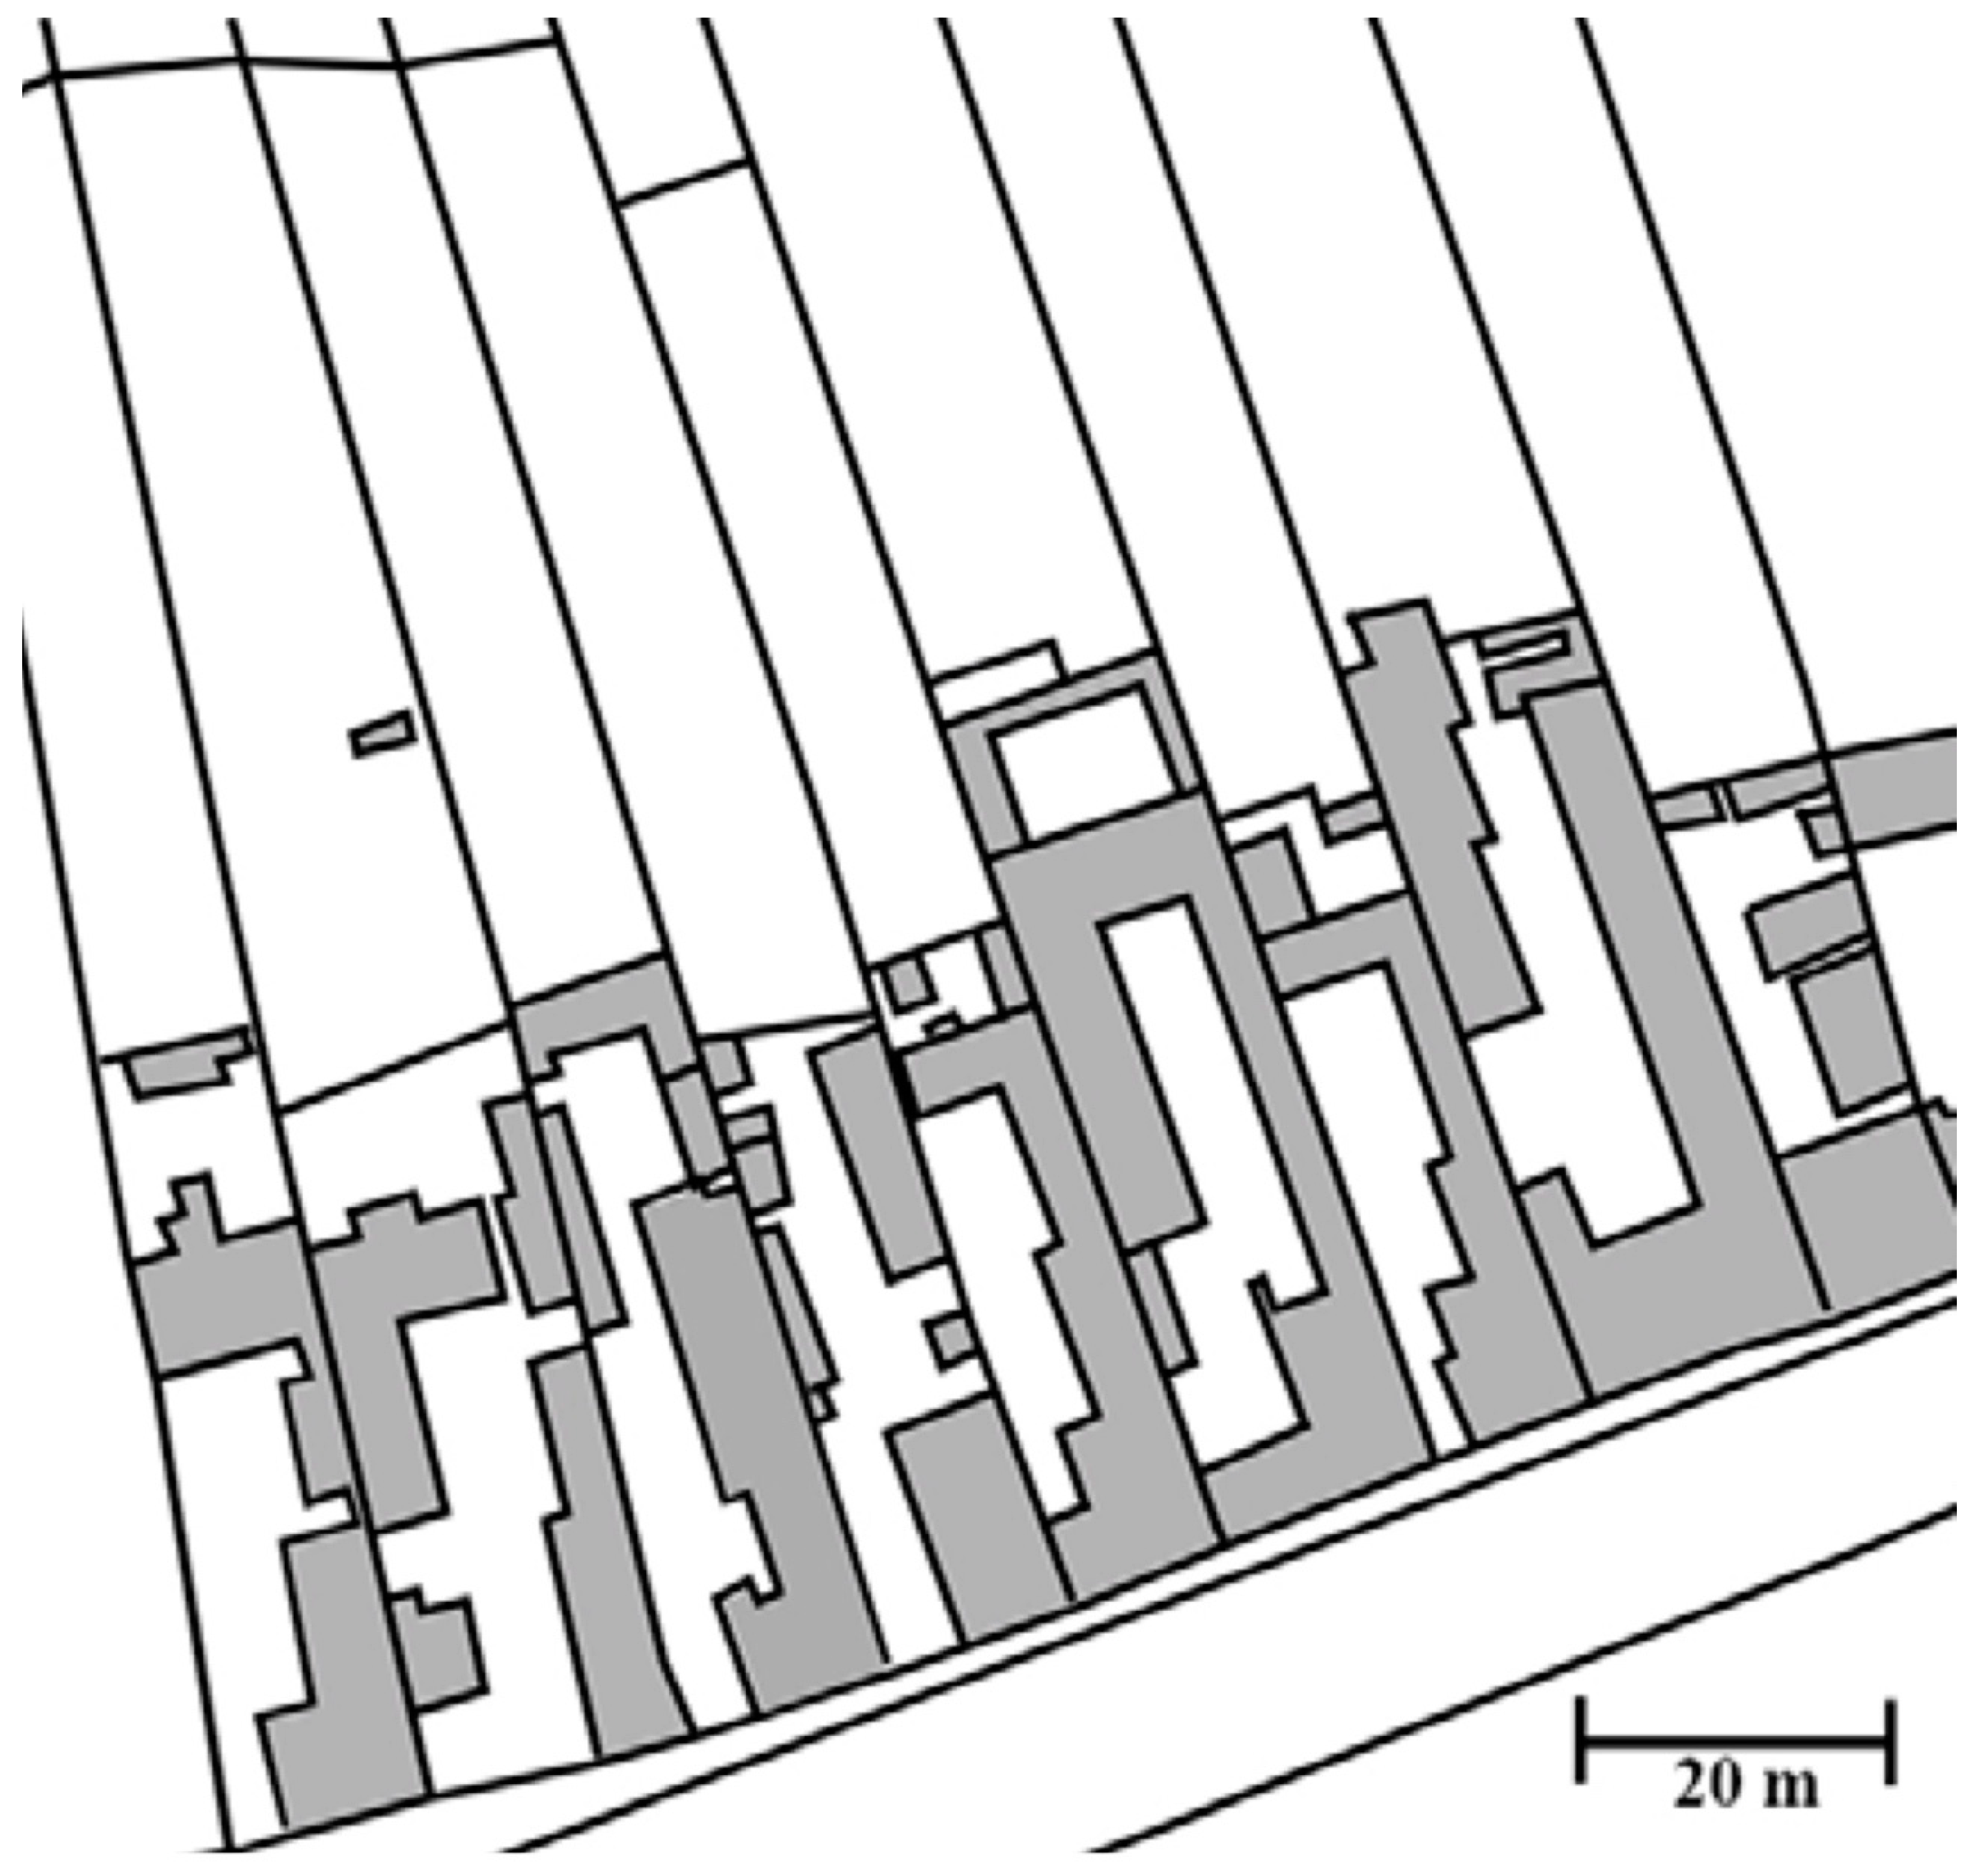
The map from the royal cadastral survey, dated 1892–1894 [34] (pp. 66–67), shows that the city’s street network remained largely irregular and organic, as did the plot structure, except for a few newer areas (Figure 11). By this time, the density in the inner parts was high, with the fragmented plot structure of the wine-house areas clearly visible on the northern and southern hillsides. These wine-house areas, with small buildings often filling entire plots, exhibit Balkan influences. This can be traced back to the Ottoman period when many migrants from the Balkans, primarily from Moschopolis (now Moscopole, Albania) and Kastoria (now Greece), moved to Miskolc. Over the centuries, they played a major role in the city’s international wine trade [35]. The inner parts of Miskolc correspond mostly to fabrics (Aa) and (Ac) from Lovra’s catalogue, as described in [26] p. 199, [36] p. 210 (Figure 12 and Figure 13):
“(Aa)—central: Regular, elongated rectangular plots, typically with closed row construction, with a row of houses aligned with the line of the street. The plots are almost completely filled with U- or L-shaped buildings, the depth of which is a multiple of the width of the facades (minimum three times). There is no unbuilt part of the plot (gardens) connected to the plots, except for the yard belonging to the main part of the plot.”
“(Ac): Elongated rectangular plots with regular geometry, dynamics of the plot series are rhythmical/regular: width of the plots and the placement of the buildings are almost identical. The property consists of the main building and some additional buildings (outbuildings), that partially surround the inner courtyard. The buildings are adjusted to the line of the street, coherent free space is between the street line and the development in unbroken rows. The unbroken row of building is disrupted by open courtyards. Yards could be divided into two parts depending on the location (front and back yards): the two sections are separated by buildings and fence.”
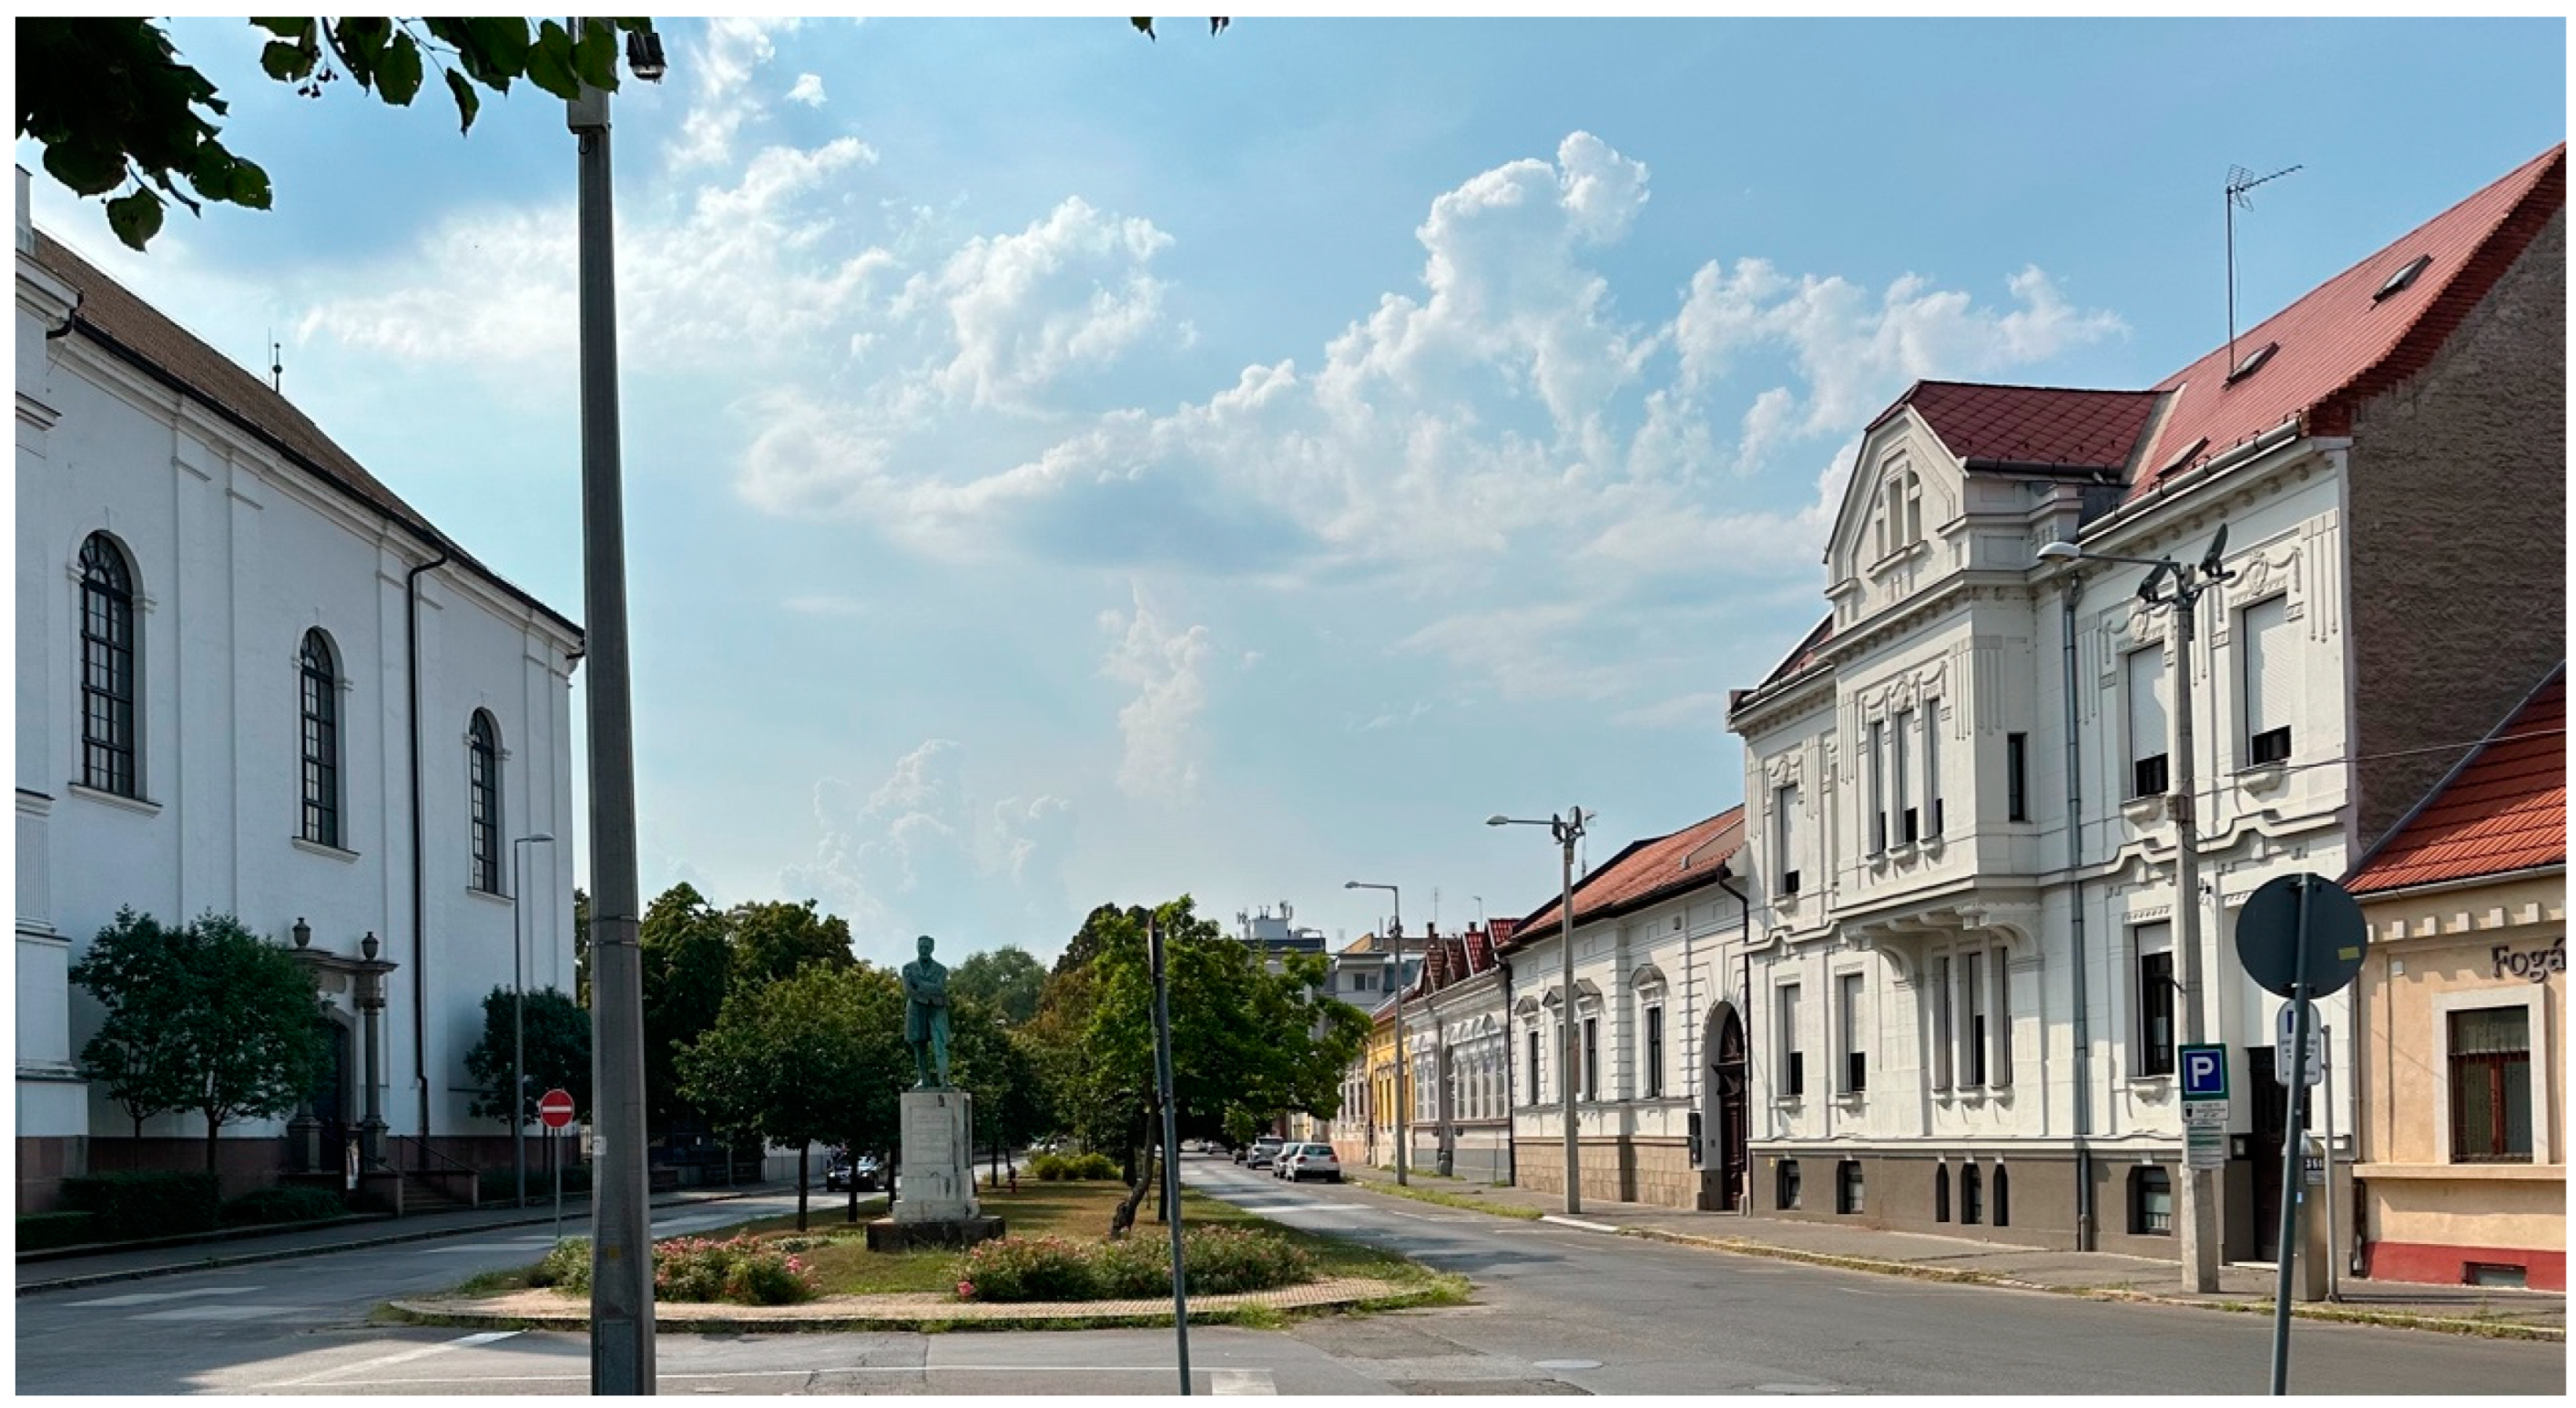
The historic centre of Miskolc has largely retained its organic, evolved character, even though the current buildings are newer than the original plot layouts. In many areas, an archaic quality remains: the streets often feature non-parallel sides, and they widen or narrow in irregular patterns. A notable example is Palóczy Street (Figure 14), which widens to form the main square of the medieval New Town (today’s Deák Square). Another example is one of the city’s oldest streets—today’s Rákóczi Street (Figure 15). The central square, Town Hall Square, was similarly formed by the widening of Széchenyi Street, the main thoroughfare (Figure 16).
Additionally, the street lines are irregularly fragmented, and the lot widths show variation within certain limits. Building heights in the historic centre also vary, adding to the organic character of the urban fabric. The roof shapes are primarily gable roofs with ridges parallel to the street along the front-facing wings, while the courtyard wings tend to feature half-gable roofs. Notably, the courtyard wings are lower than the street-facing sections of the buildings (Figure 17).

3. Results: Modelling the Evolution of a Natural City

Before discussing the following case studies, it is important to stress that the main outcome of this research is the Simulated Morphogenesis method itself. The results presented below serve to demonstrate this method in action, using Miskolc as a base. With the appropriate analyses, the method can be applied to other areas as well.
For the generative modelling, version 8 of Rhinoceros 3D by McNeel was used, specifically leveraging the Grasshopper parametric interface (version 1), which is integrated into Rhinoceros. The standard version of Rhinoceros was employed without any external plugins. In the Grasshopper interface, 3D modelling essentially functions as a data stream, where operations and transformations are performed on input data through so-called components. Visually, data and components appear as boxes, and their connections are represented by wires. Components have inputs (left side) and outputs (right side). Procedural modelling of an organic city is a complex task, and while this article does not have the space to describe and illustrate each step in detail, the focus is placed on the overall logic of the process. Screenshots from Grasshopper serve to illustrate the general workflow rather than provide a step-by-step guide.

3.1. Simulated Morphogenesis of a Generic Central European Town

Although a “generic” town does not truly exist, the term is used here to indicate that this case study is not about the evolution of an actual settlement. Instead, it involves the simulated morphogenesis of a “town” morphologically similar to Central European towns, using the simplest geometric methods.
Growth is modelled by aggregating plots into plot series and then sequentially connecting new plot series to existing ones. The experiment models five main steps (increments), where the inputs for the newly generated plot groups are defined through individual considerations (process control). Since all from-to values were randomized between predefined thresholds, each increment was generated in multiple versions. Differences are minor in the first step but become significant by the fifth.
In each increment, two processes occur simultaneously in different locations: (1) new plot series appear on the periphery, logically connected to existing ones, and formed with the simplest tissue, and (2) existing blocks (plot series) undergo densification, becoming one level denser in structure.
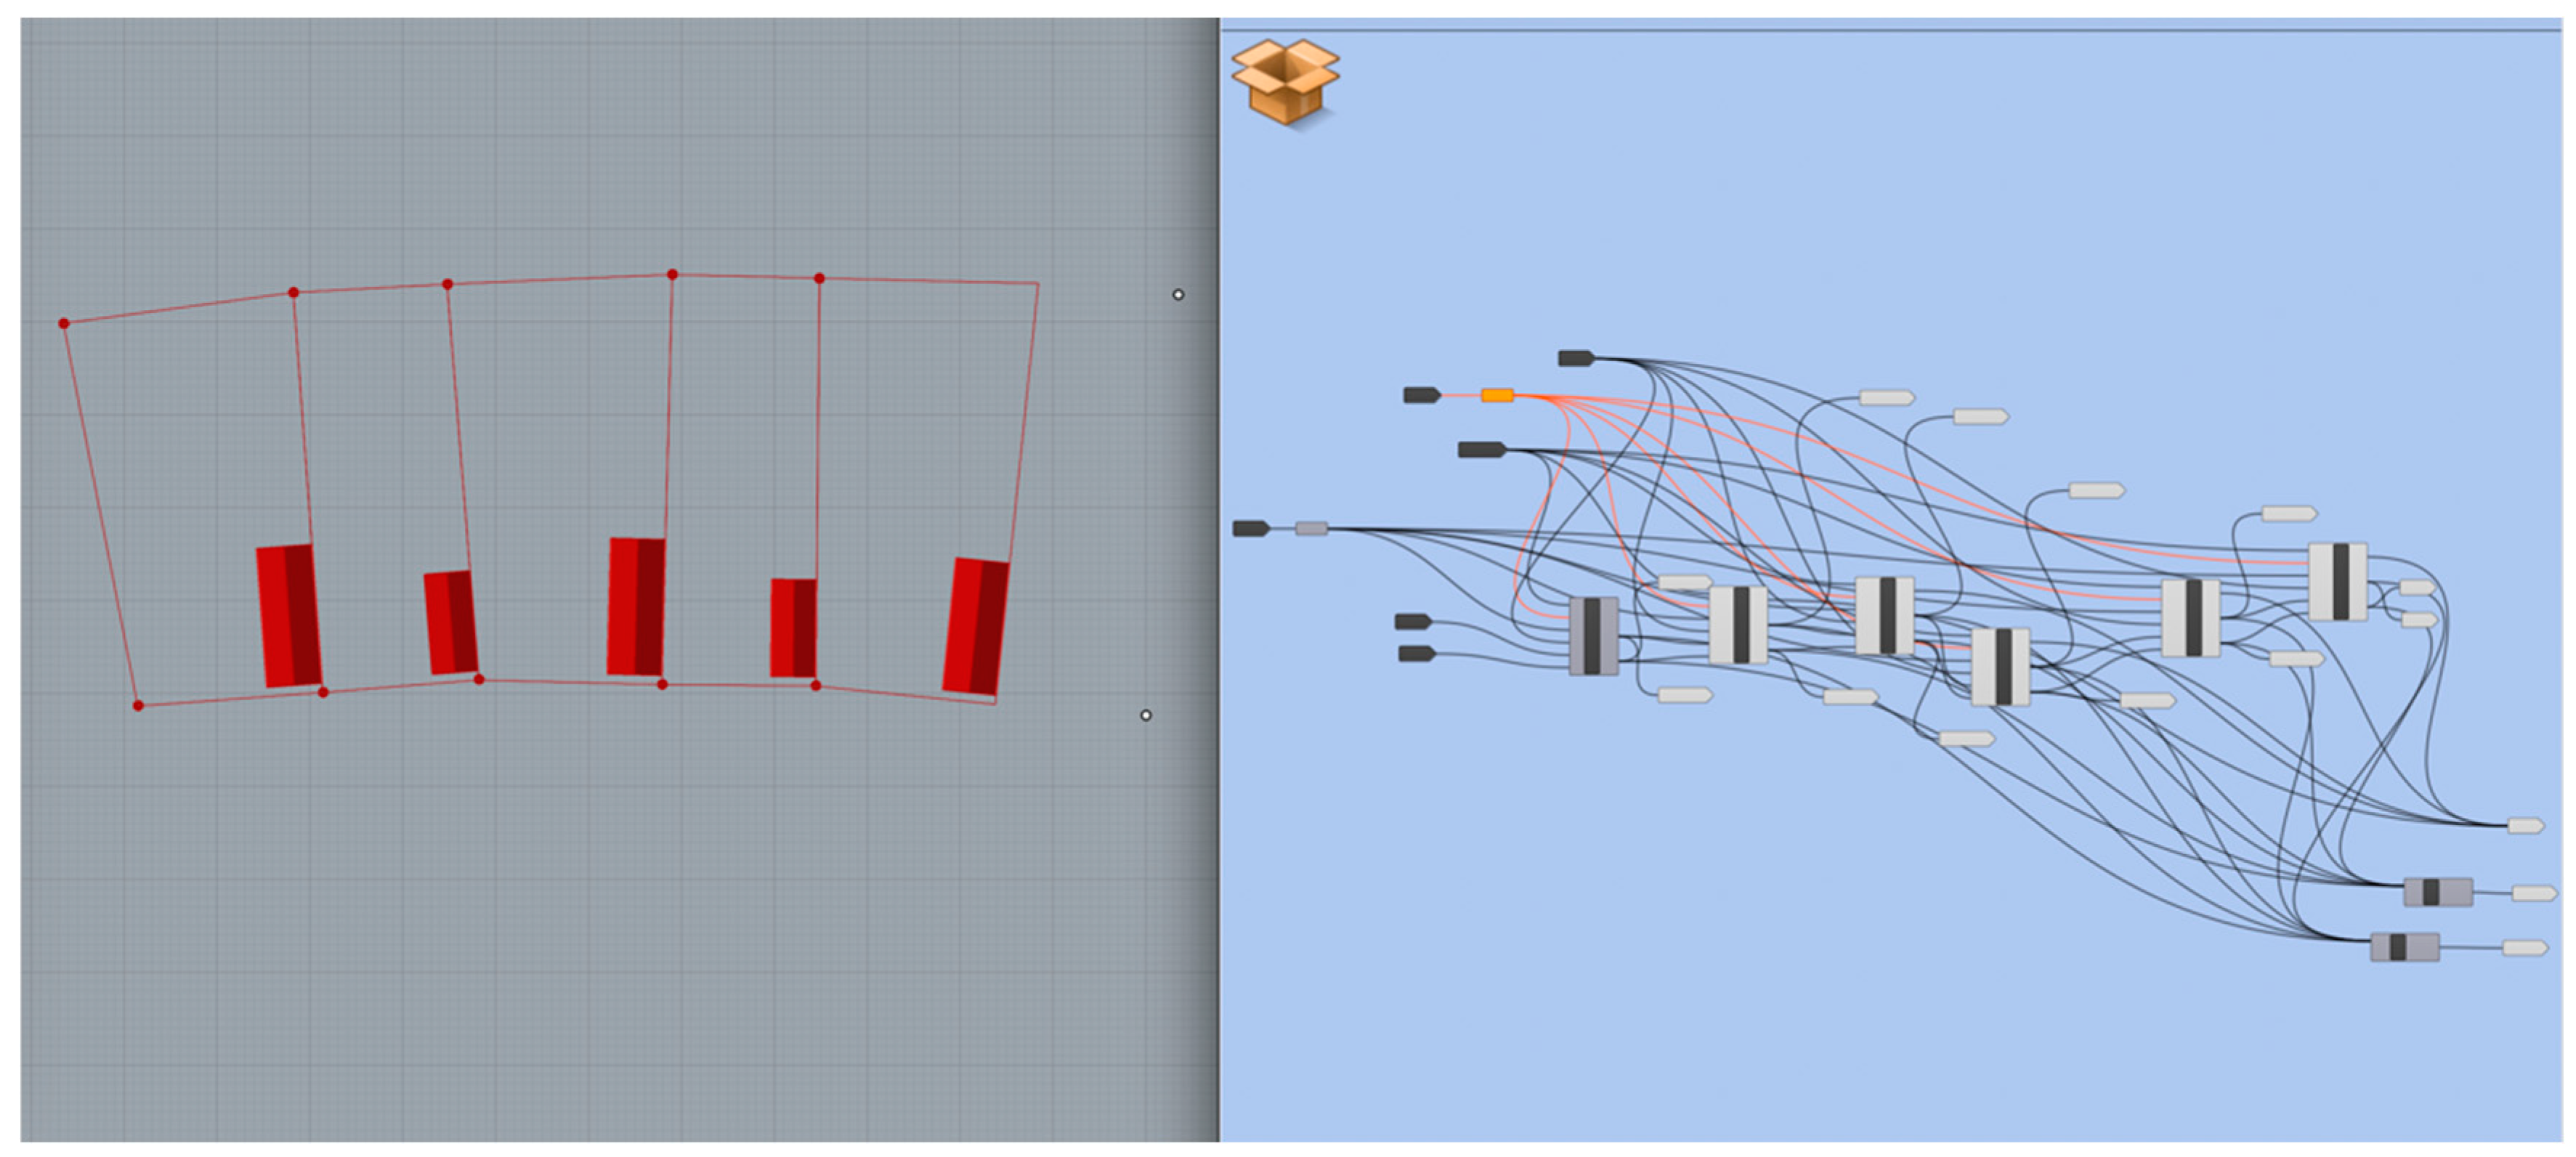
The algorithm used is multi-level and recursive. Recursive descriptions can be implemented in Grasshopper using so-called clusters. A cluster is essentially a sub-algorithm that can be used repeatedly within an algorithm. The same processes occur inside the cluster, but with varying inputs and outputs. Multiple inputs and outputs can be defined for clusters, and the outputs can serve as inputs for the next instance of the cluster (recursive logic) or for another cluster (semilattice nature). Naturally, the generated geometry is highly dependent on the clusters’ input parameters.
Clusters can also be embedded in “larger” clusters, which enables the modelling of various hierarchical morphological levels—potentially at any number of levels. According to urban morphology principles, the lowest hierarchical level of the model is the plot with its building, which is defined within a single Grasshopper cluster. Plots are assembled into plot series, and these plot series are also defined as clusters, embedding instances of the plot cluster within them. While there is only one type of plot cluster, three types of plot series clusters were defined: one consisting of three plots, one of five, and one of nine. The plot cluster description remains the same within each of them. Numerically defined values within the algorithm were derived from Lovra’s catalogue descriptions and historical maps of Miskolc.
Each hierarchical level contains several random number generators. Grasshopper uses “semi-random” generators, meaning that changing their seed number produces a new set of random numbers, but the same seed always generates the same set.

3.1.1. The Plot

The initial plot shape is a simple rectangle, defined by two points that establish the longer side of the rectangle. For the first generated plots, these points are defined manually, while for subsequent plots, they are inherited from existing geometry (often, but not always, from neighbouring plots). These two points also determine the X-axis of the local coordinate system for the plot and the buildings on it. A variable controls whether the plot is generated in a positive or negative direction along the local Y-axis. The plot’s width is determined by a random generator, with threshold values between 14 and 20 m (i.e., the plot will be at least 14 m wide and at most 20 m wide). Because the plots in the base tissue are slightly irregular, the back corner opposite the starting edge is shifted randomly in both the local X and Y directions. The random generator’s thresholds are between −2 and 2 m for the local X direction and between −5 and 5 m for the local Y direction. This simple geometric solution not only introduces irregularity but also produces the desired organic curve of the street lines and serves as a foundation for creating new open spaces and squares (Figure 18).
Initially, each plot contains a simple rectangular building with a gable roof, placed on the side border defined by the two input points, with its ridge perpendicular to the street (as on the 1781 map). The house is positioned 1 m away from the street front, creating a small front garden. The width, depth, eaves height, and ridge height are generated by random generators, with the following threshold values (in meters)—width: 4 to 6; depth: 8 to 16; eaves height: 3 to 4.5; and ridge height: 3 to 4.5 (above the top cornice).
At certain stages of growth, houses become L-shaped. In this case, a street wing perpendicular to the original wing is generated, also with a gable roof. The dimensions for this wing are as follows.
  • width: 8–10 m.
  • depth: 6–8 m.
  • eaves height: 1 m higher than the eaves height of the wing perpendicular to the street.
  • ridge height: 3 to 4.5 m (above the cornice).

3.1.2. Plot Series

Plot series are created by connecting multiple plots in a row. Each element in the series inherits its input from the previous one: the section opposite the house of the previous plot becomes the side facing the house for the next plot. Since the plots are not perfectly rectangular, the street side of a plot series develops an organic curve or undulation, akin to the historic centre of Miskolc and other organic settlements. As mentioned earlier, plot series were defined in clusters of 3, 5, and 9 plots. While reality is more diverse, the goal was to achieve variety and complexity with minimal resources.
The series containing five plots is unique because six plots are generated, but the first element does not physically appear. Instead, a “void” the size of the first plot is created, offering an opportunity to break urban blocks and open new streets. The cluster generating the plot series requires two points as input, just like the individual plots. These points become the starting points of the first plot, and the cluster can pass the two side points of the last plot to the next plot series cluster (Figure 19).

3.1.3. Interaction of Plot Series

As previously mentioned, plot series need two points for input, but these points do not necessarily have to be the two endpoints of another plot series. A new plot series can grow from any two rear points of an existing series, or in the case of a five-plot cluster (where a void is created), even from any two front points. Additionally, a new plot series may inherit its input points from two different plot series (one point from each).
This flexibility in input design is the key to the algorithm’s semilattice-like nature: plot blocks have no defined hierarchy and can inherit starting points from various sources.
Since growth begins with individual plots and then progresses to plot series, the two sides of a street are often not parallel, similar to organic cities and the city centre of Miskolc. However, cases where the two street sides converge and cross each other should be avoided, as this does not occur in reality. To prevent this, a solution is embedded within the plot cluster. If the front line of a plot intersects the line formed by offsetting the opposite street by a predetermined value (typically 6–8 m), the plot boundary at that point is generated perpendicular to the offset curve. This ensures that the street front of the next plot will also be perpendicular, thus creating a broken street front line. This simple geometric solution results in organic plot structures resembling real-world conditions.
On the other hand, if the two sides of a street become too far apart, new squares may be created (like Deák Square or Town Hall Square in Miskolc), or a new series of plots may begin in the widened space. To achieve this, a sub-algorithm measures the street’s width in specific locations. If it exceeds a predetermined value, two new points are created at fixed distances from the street’s sides, serving as starting points for a new plot series.
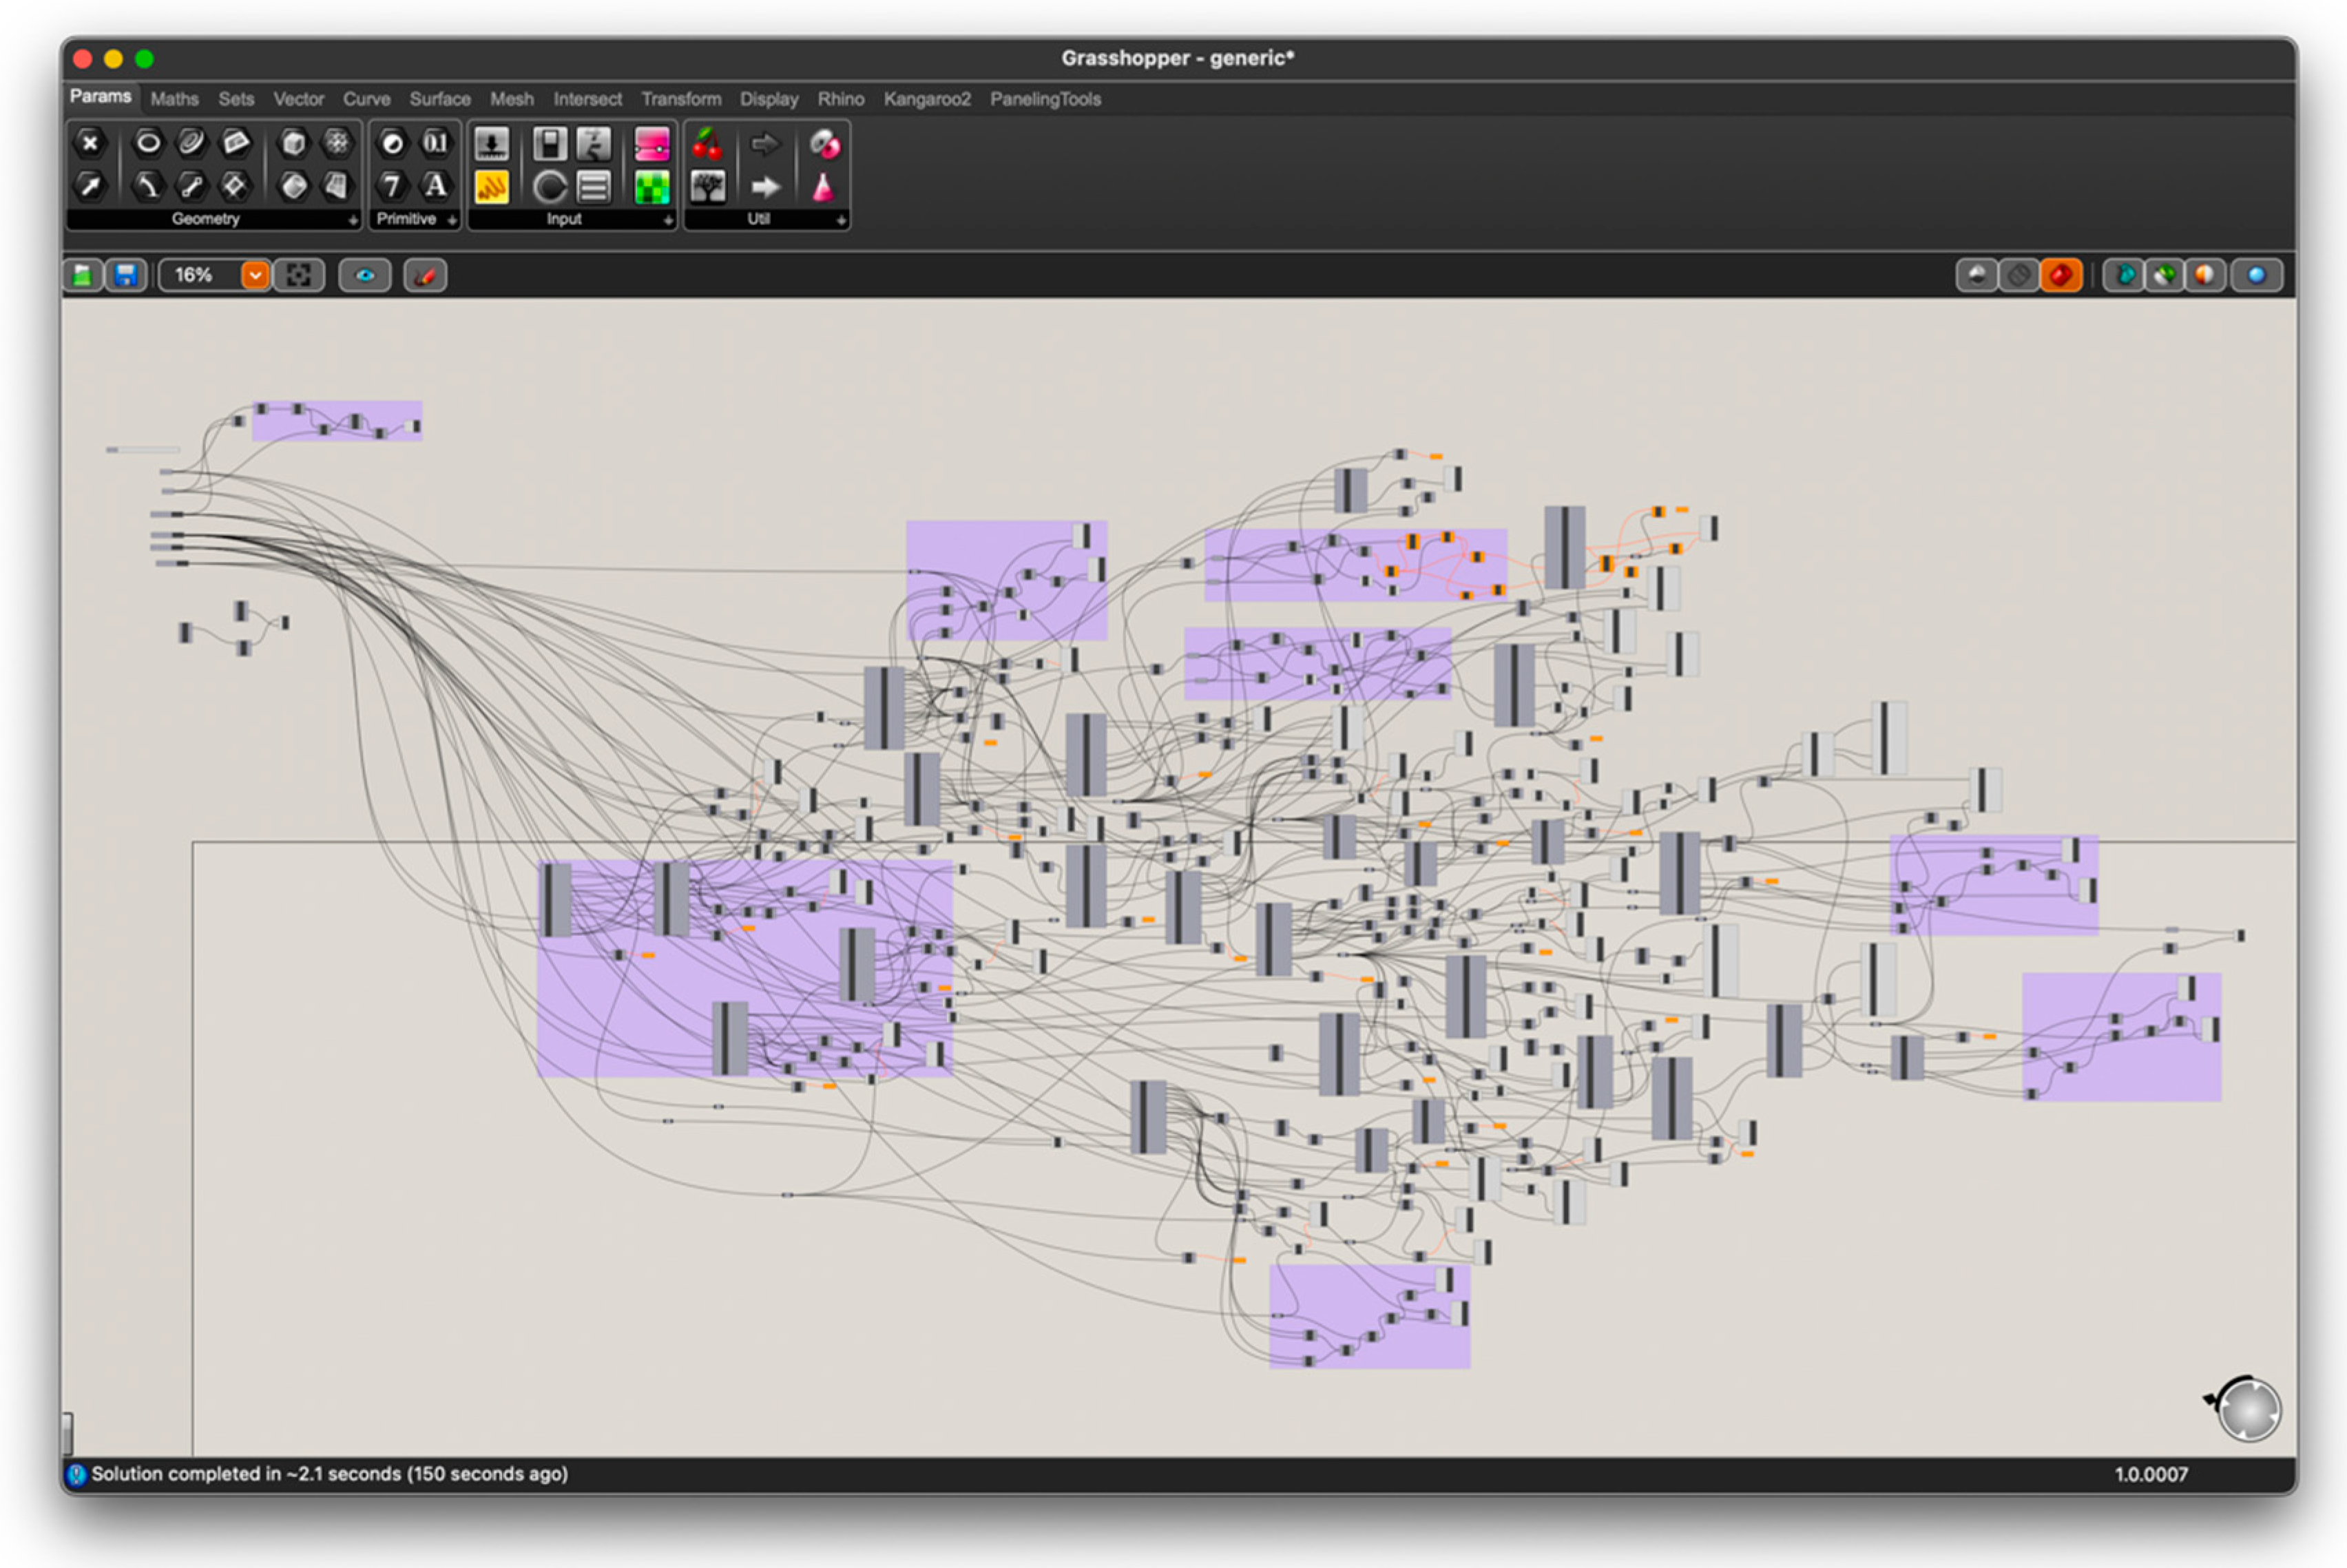
Since every plot and plot series inherits its inputs from other elements (except the initial plots), the result is a fully interconnected, semilattice-like structure. If an element is changed early in the morphogenesis, the alteration propagates through the entire model, transforming it (Figure 20).

3.1.4. Subcentres and Public Buildings

During the city’s growth, larger open areas sometimes appear in certain versions. These may develop into central squares or sub-centres. The most important centre is where the entire growth begins, treated as the town’s main square. In the second increment, a church appears in this square (increments are explained in detail later). In some versions, another square appears near the main one, where the solution described above for measuring square width was applied. When the square exceeds a certain size, a town hall appears, with its orientation depending on the square’s width.
As an organic city develops, additional sub-centres often emerge. In medieval and early modern urban growth, mendicant orders’ monasteries frequently established such centres (e.g., Mátyás Square in Szeged, Hungary, or Dominican Square in Košice, Slovakia). In Miskolc, an example is Deák Square in the former New Town with the second parish church of the town. The model includes a predefined space for a sub-centre where a small church appears.
The emergence of sub-centres creates the possibility of a fractal-like city. However, this model does not achieve that level of complexity. In a fully developed fractal model, the densest tissue surrounds the main centre, while tissues become progressively less dense around sub-centres and further from the main centre. In the current model, four levels of tissue density are defined, but due to the open-ended nature, this can be expanded.

3.1.5. Urban Tissue Types

In a real city, even a smaller one, various types of urban tissues can be distinguished. This simplified model contains only two tissue types, each with a variation, which proves sufficient to create significant variety.

Keyboard-Tissue

The basis for the first type of urban tissue is the 1781 map of Miskolc, discussed earlier (Figure 10). This type includes a simple series of plots where rectangular houses are positioned along the side borders, and the back of the plots faces public land rather than other plots. Due to the random geometric solutions applied at the plot level, the street frontages are irregular, and the plots are slightly asymmetrical. The name “keyboard tissue” comes from the resemblance of the pattern formed by the plots and their houses to the black and white keys of a piano (Figure 19).

Denser Version of the Keyboard Tissue

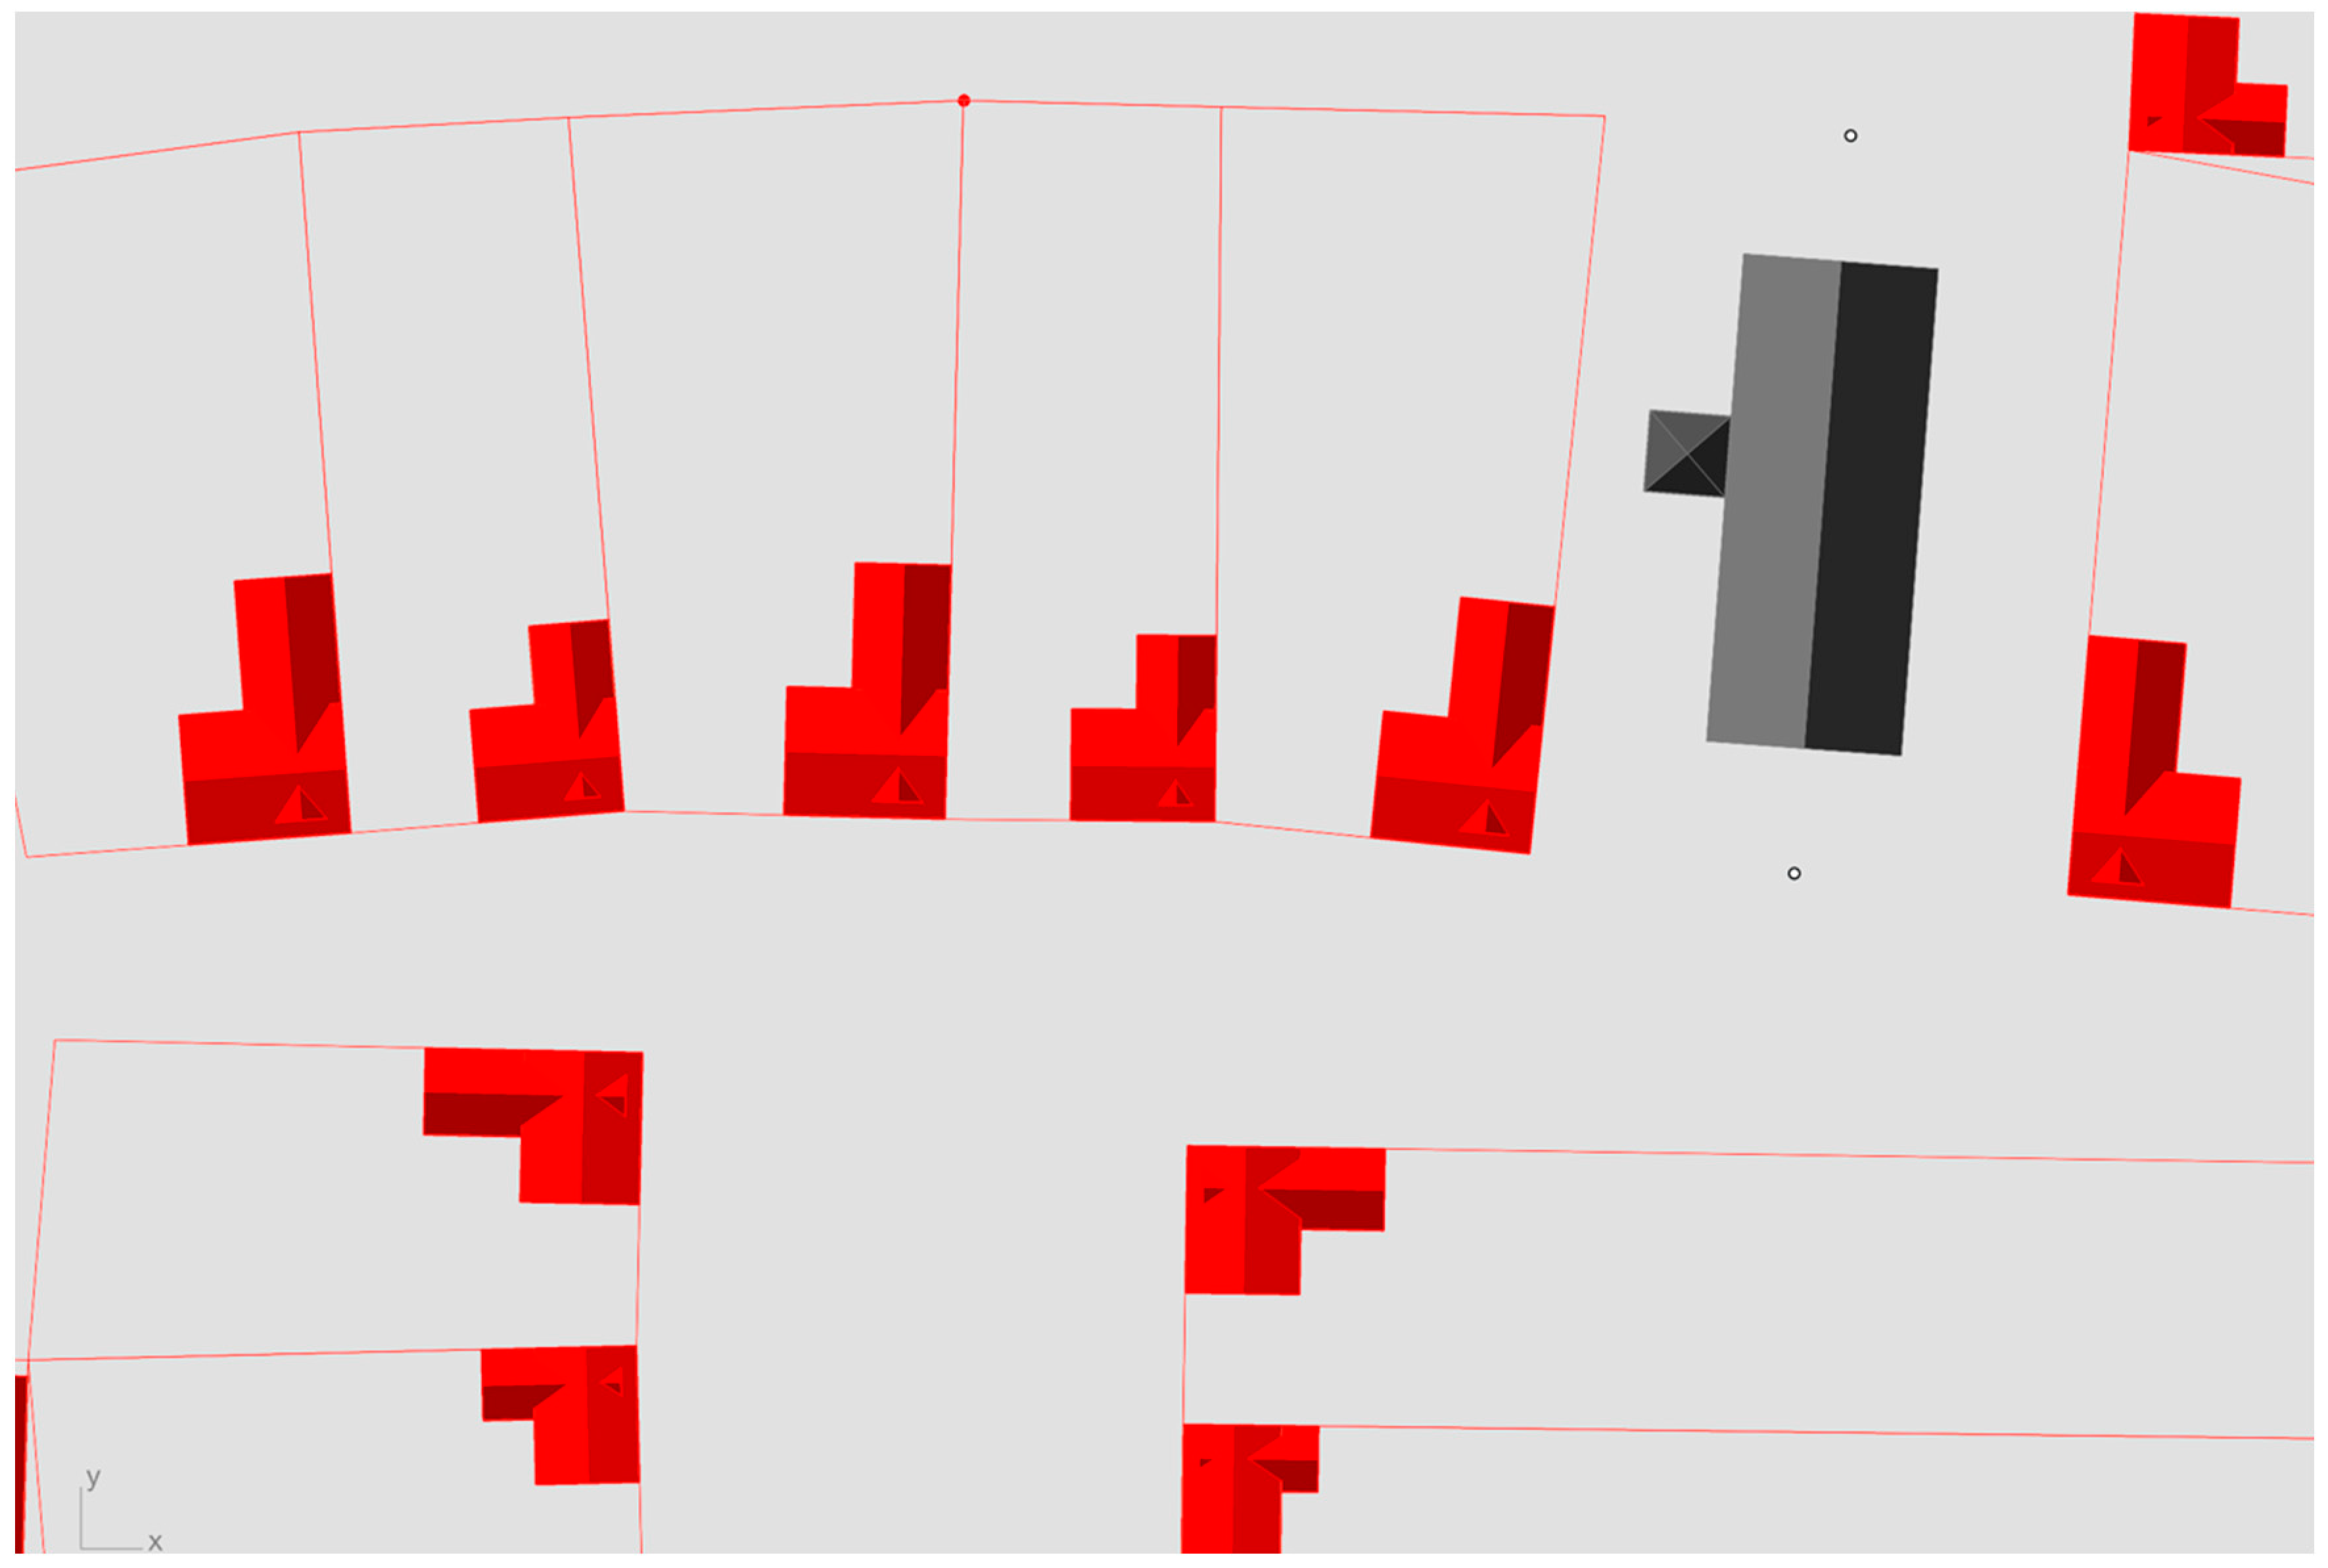
This version differs from the basic keyboard tissue by introducing a building wing on the street front, resulting in L-shaped houses. The width of the houses does not span the entire width of the street front (Figure 21).

Ac-Tissue

In this case study, the next stage of urban growth involves a more complex, organic urban fabric, found not only in Miskolc (the model city) but also in other pre-1867 cities within the Kingdom of Hungary. This fabric is one of the 22 types of urban tissues before 1867 identified by Éva Lovra and is labelled (Ac) in her book (pp. 199–201). Its description is provided in the earlier section discussing Miskolc (Figure 13).
In this phase of urban growth, the base unit is no longer the individual plot but the urban block, which comprises multiple plots and is surrounded by public spaces. This approach simulates occasional plot boundary rearrangements and allows for the generation of perimeter blocks, where buildings face both the front and back streets. The numeric values derived from Lovra’s descriptions and related diagrams are discussed in detail in [25]. In the algorithm, all the values are randomized within the specified ranges.
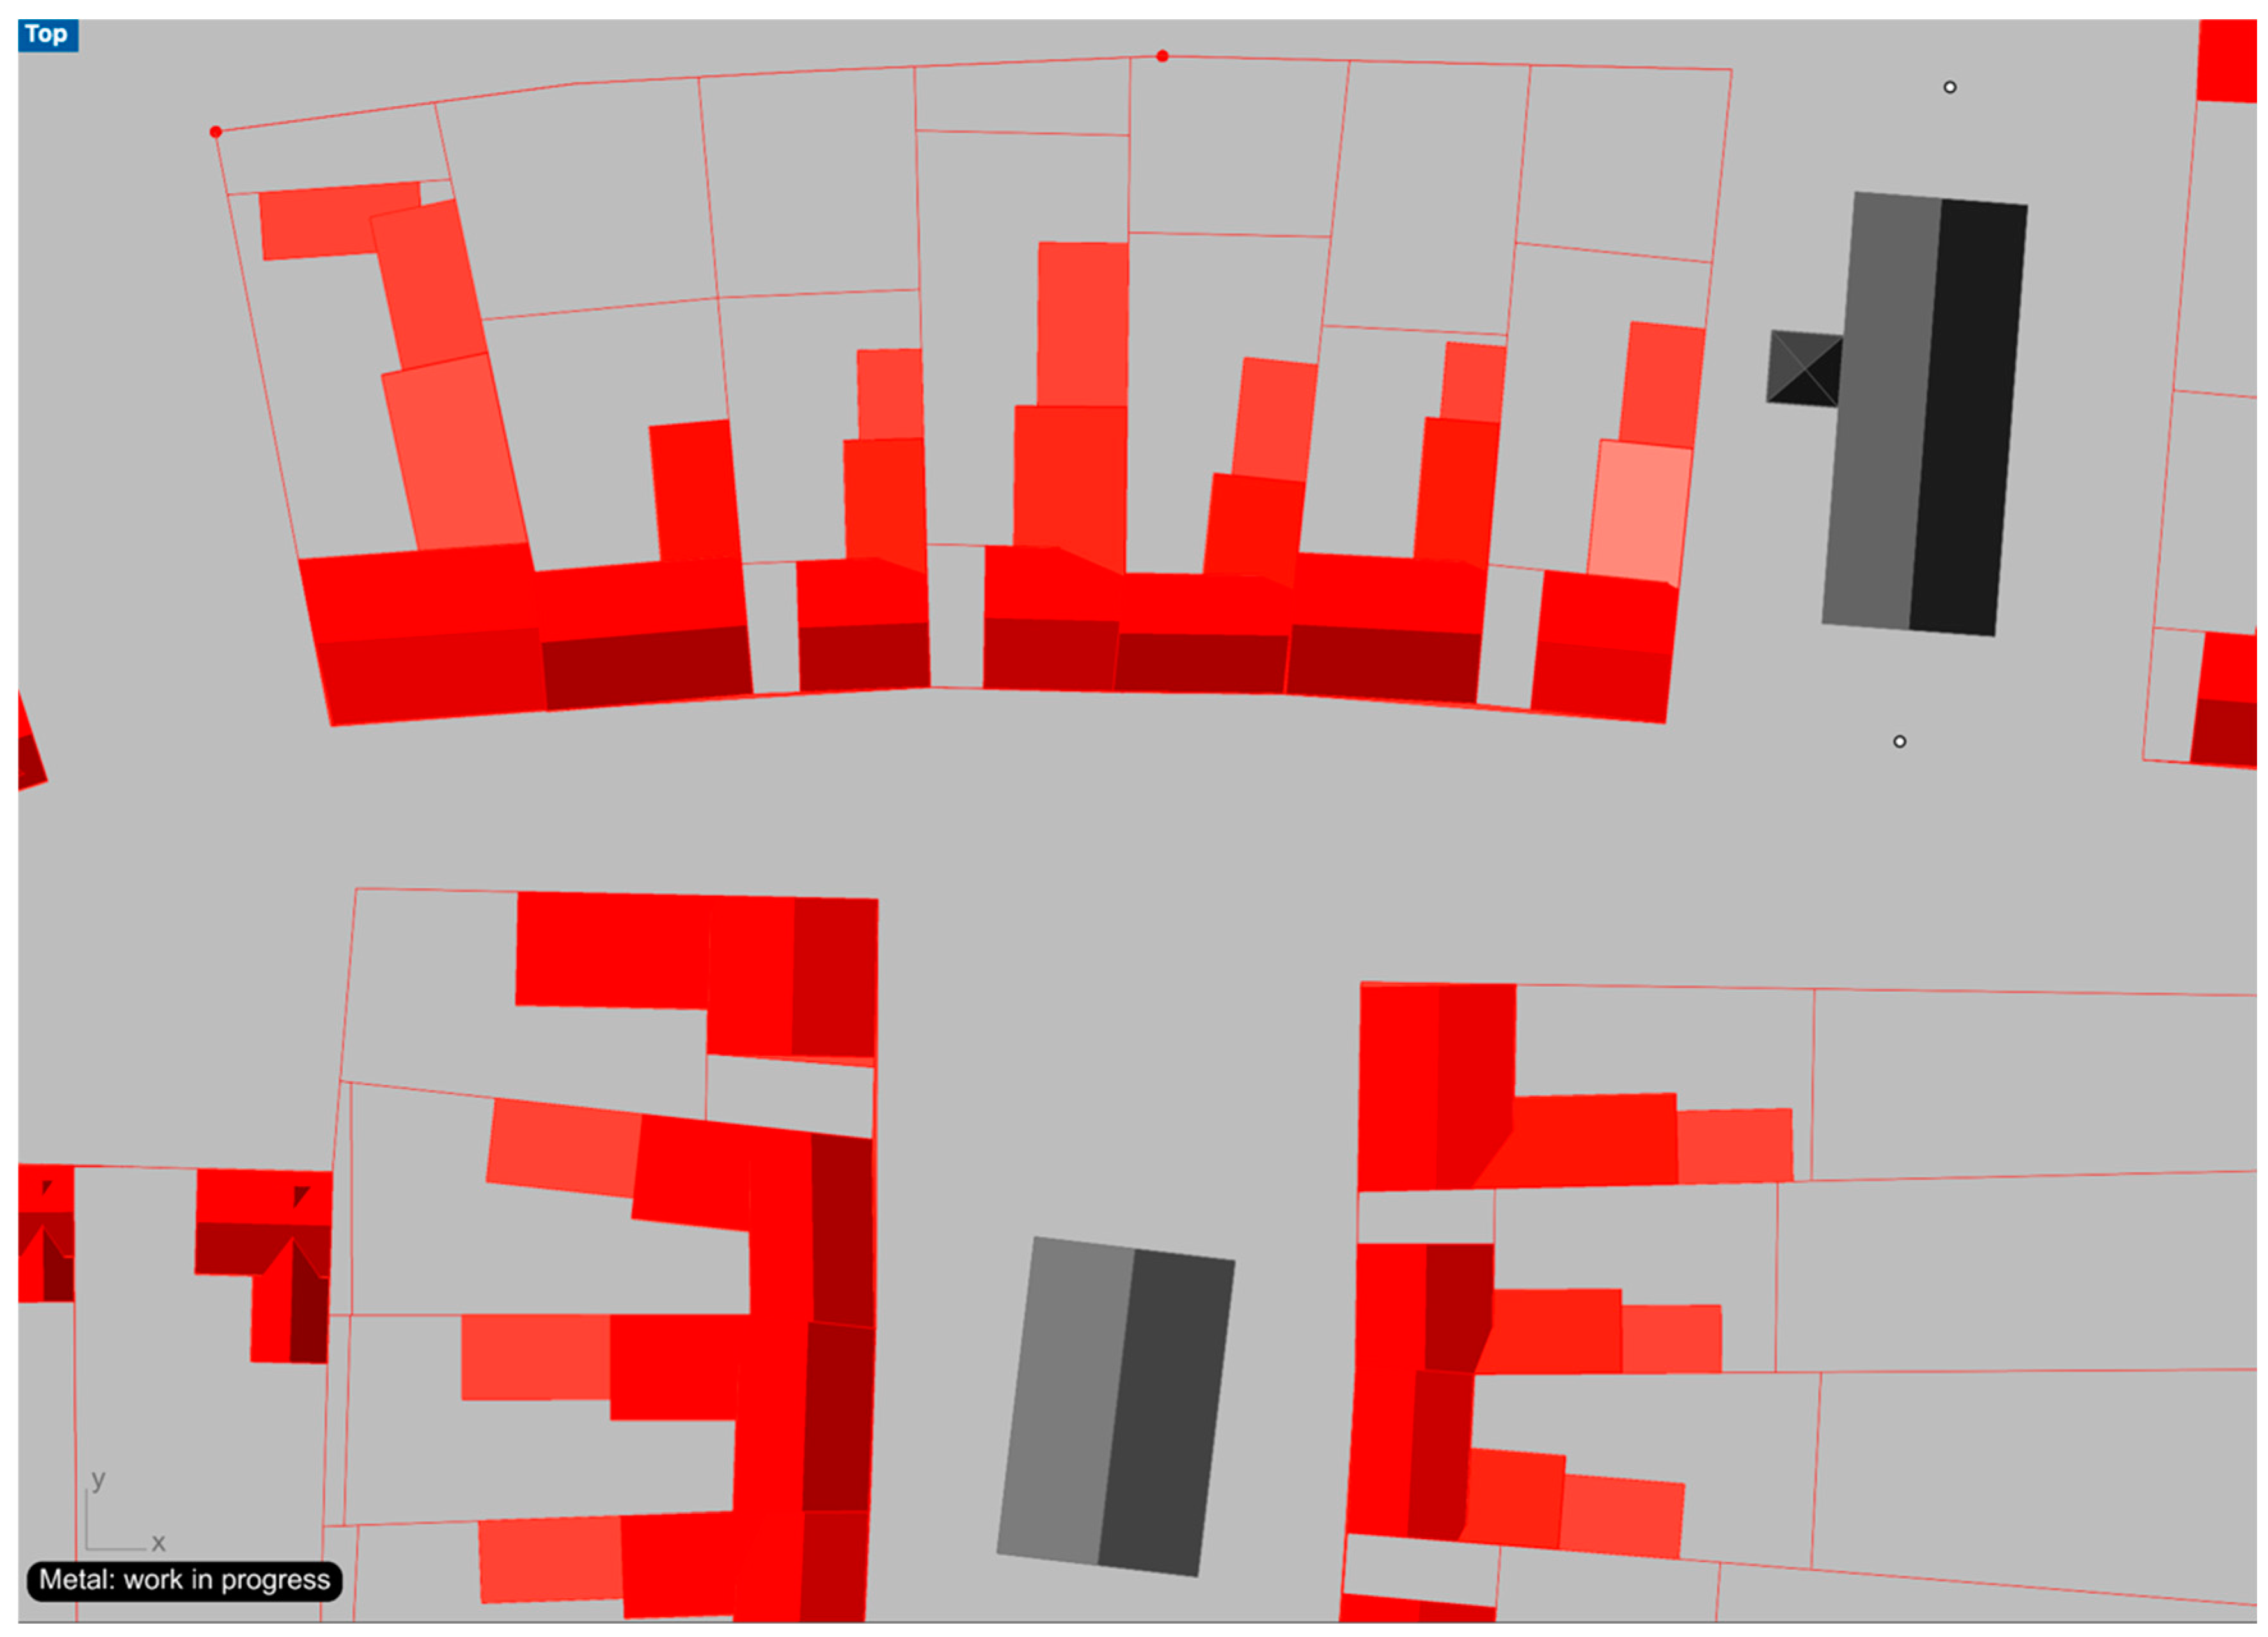
The L-shaped main building appears on every plot, but its dimensions vary. For side buildings, the algorithm generates a random sequence of building lengths and checks whether there is sufficient space available. A building is only generated if space permits. Additionally, 20% of the generated side buildings are randomly deleted to achieve the desired plot density. The same logic applies to outbuildings located at the rear of the plots; they are generated based on available space, and 90% of them are deleted to reflect realistic density levels (Figure 22).

Ac-Dense Tissue

This tissue represents the next increment of urban growth. It corresponds, though not completely, to Lovra’s (Aa) tissue described earlier in the Miskolc chapter (Figure 12). In the algorithm, this dense tissue is derived directly from the (Ac) tissue, with several key differences. In the (Ac-dense) tissue, the back plots disappear, along with occasional outbuildings at the rear of the plots. Buildings also become larger in both floor area and height. Unlike (Ac), the dense tissue places buildings on all sides of the block. The corner plots feature turning wings that always face the street, and these wings have gable roofs, as opposed to the mono-pitched roofs seen on courtyard wings within the block interior.
Due to limited space, the algorithm for generating courtyard wings first measures the available area and uses this as the upper threshold value for the random generator that determines the length of the courtyard wings (Figure 23).

3.1.6. Incremental Steps of the Growth

The model defines five phases of growth, which are sufficient to illustrate how a settlement nucleus, initially comprising only a few groups of houses, develops into a small town. The growth process can, of course, be extended further by defining additional plot series, as the process is open-ended. Each growth phase (or increment) is triggered by simple Boolean true-false switches. These switches are connected to each cluster and activate specific code sequences within the respective cluster.

First (Initial) Increment

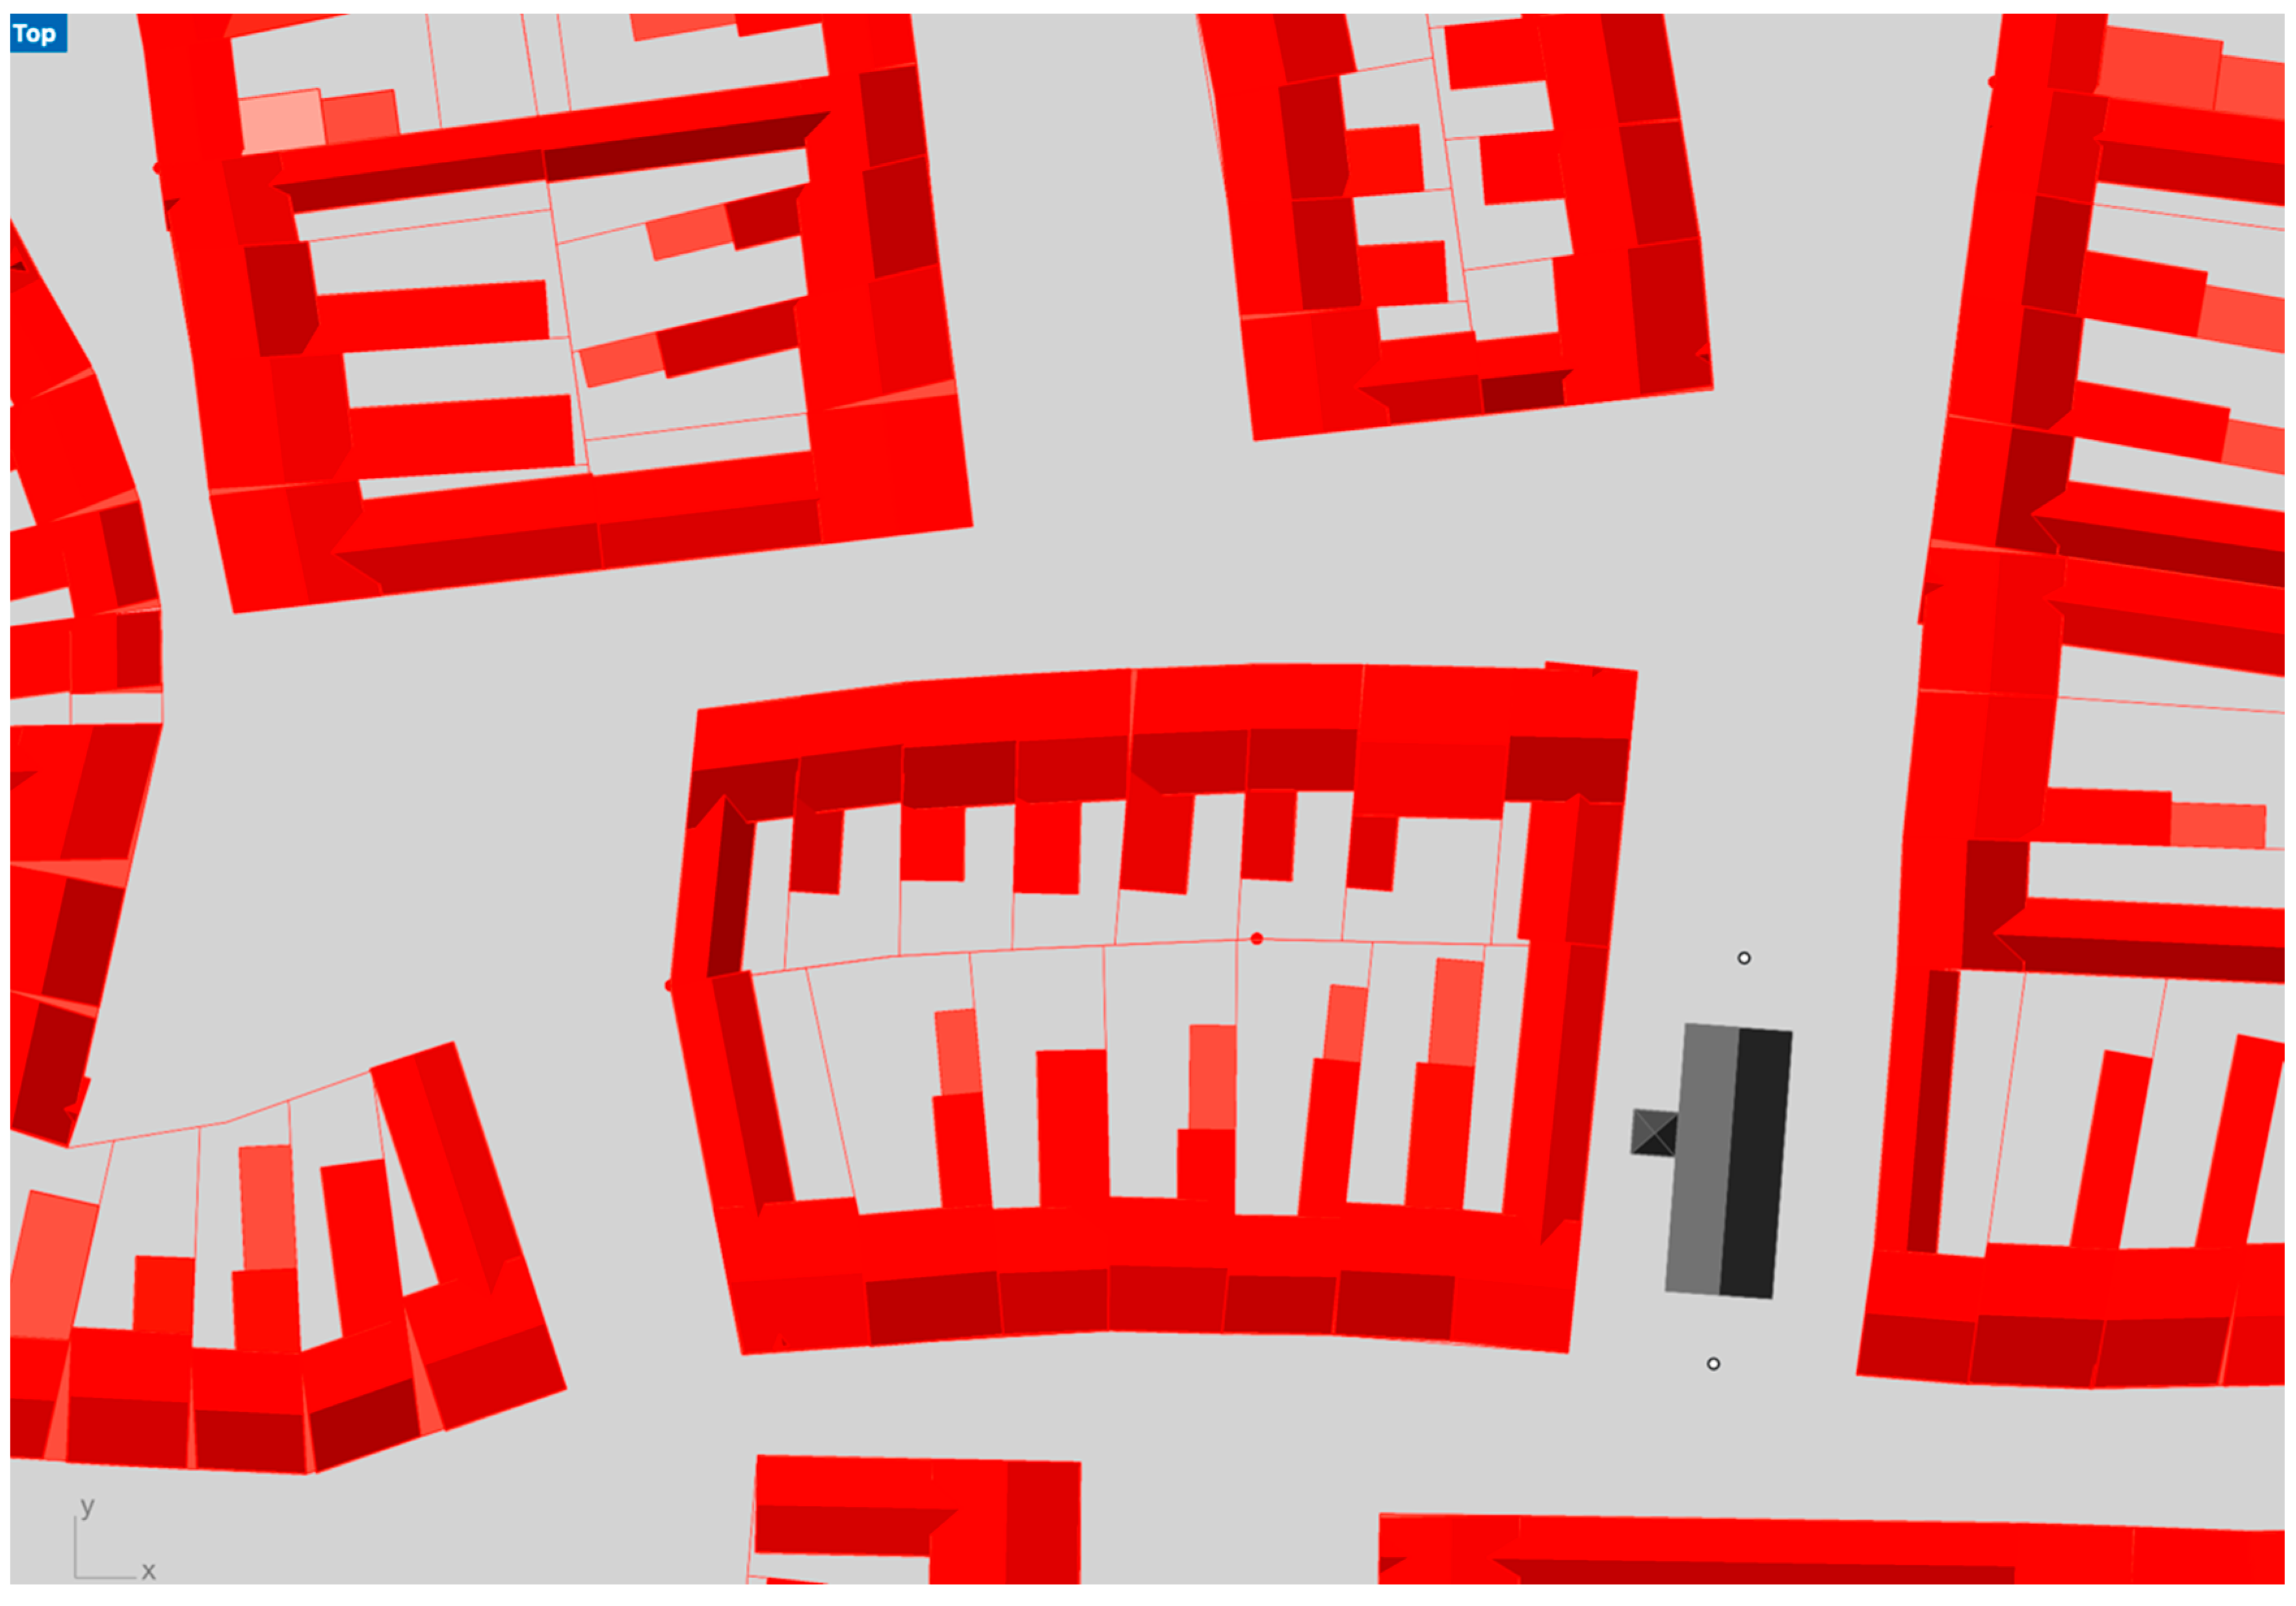
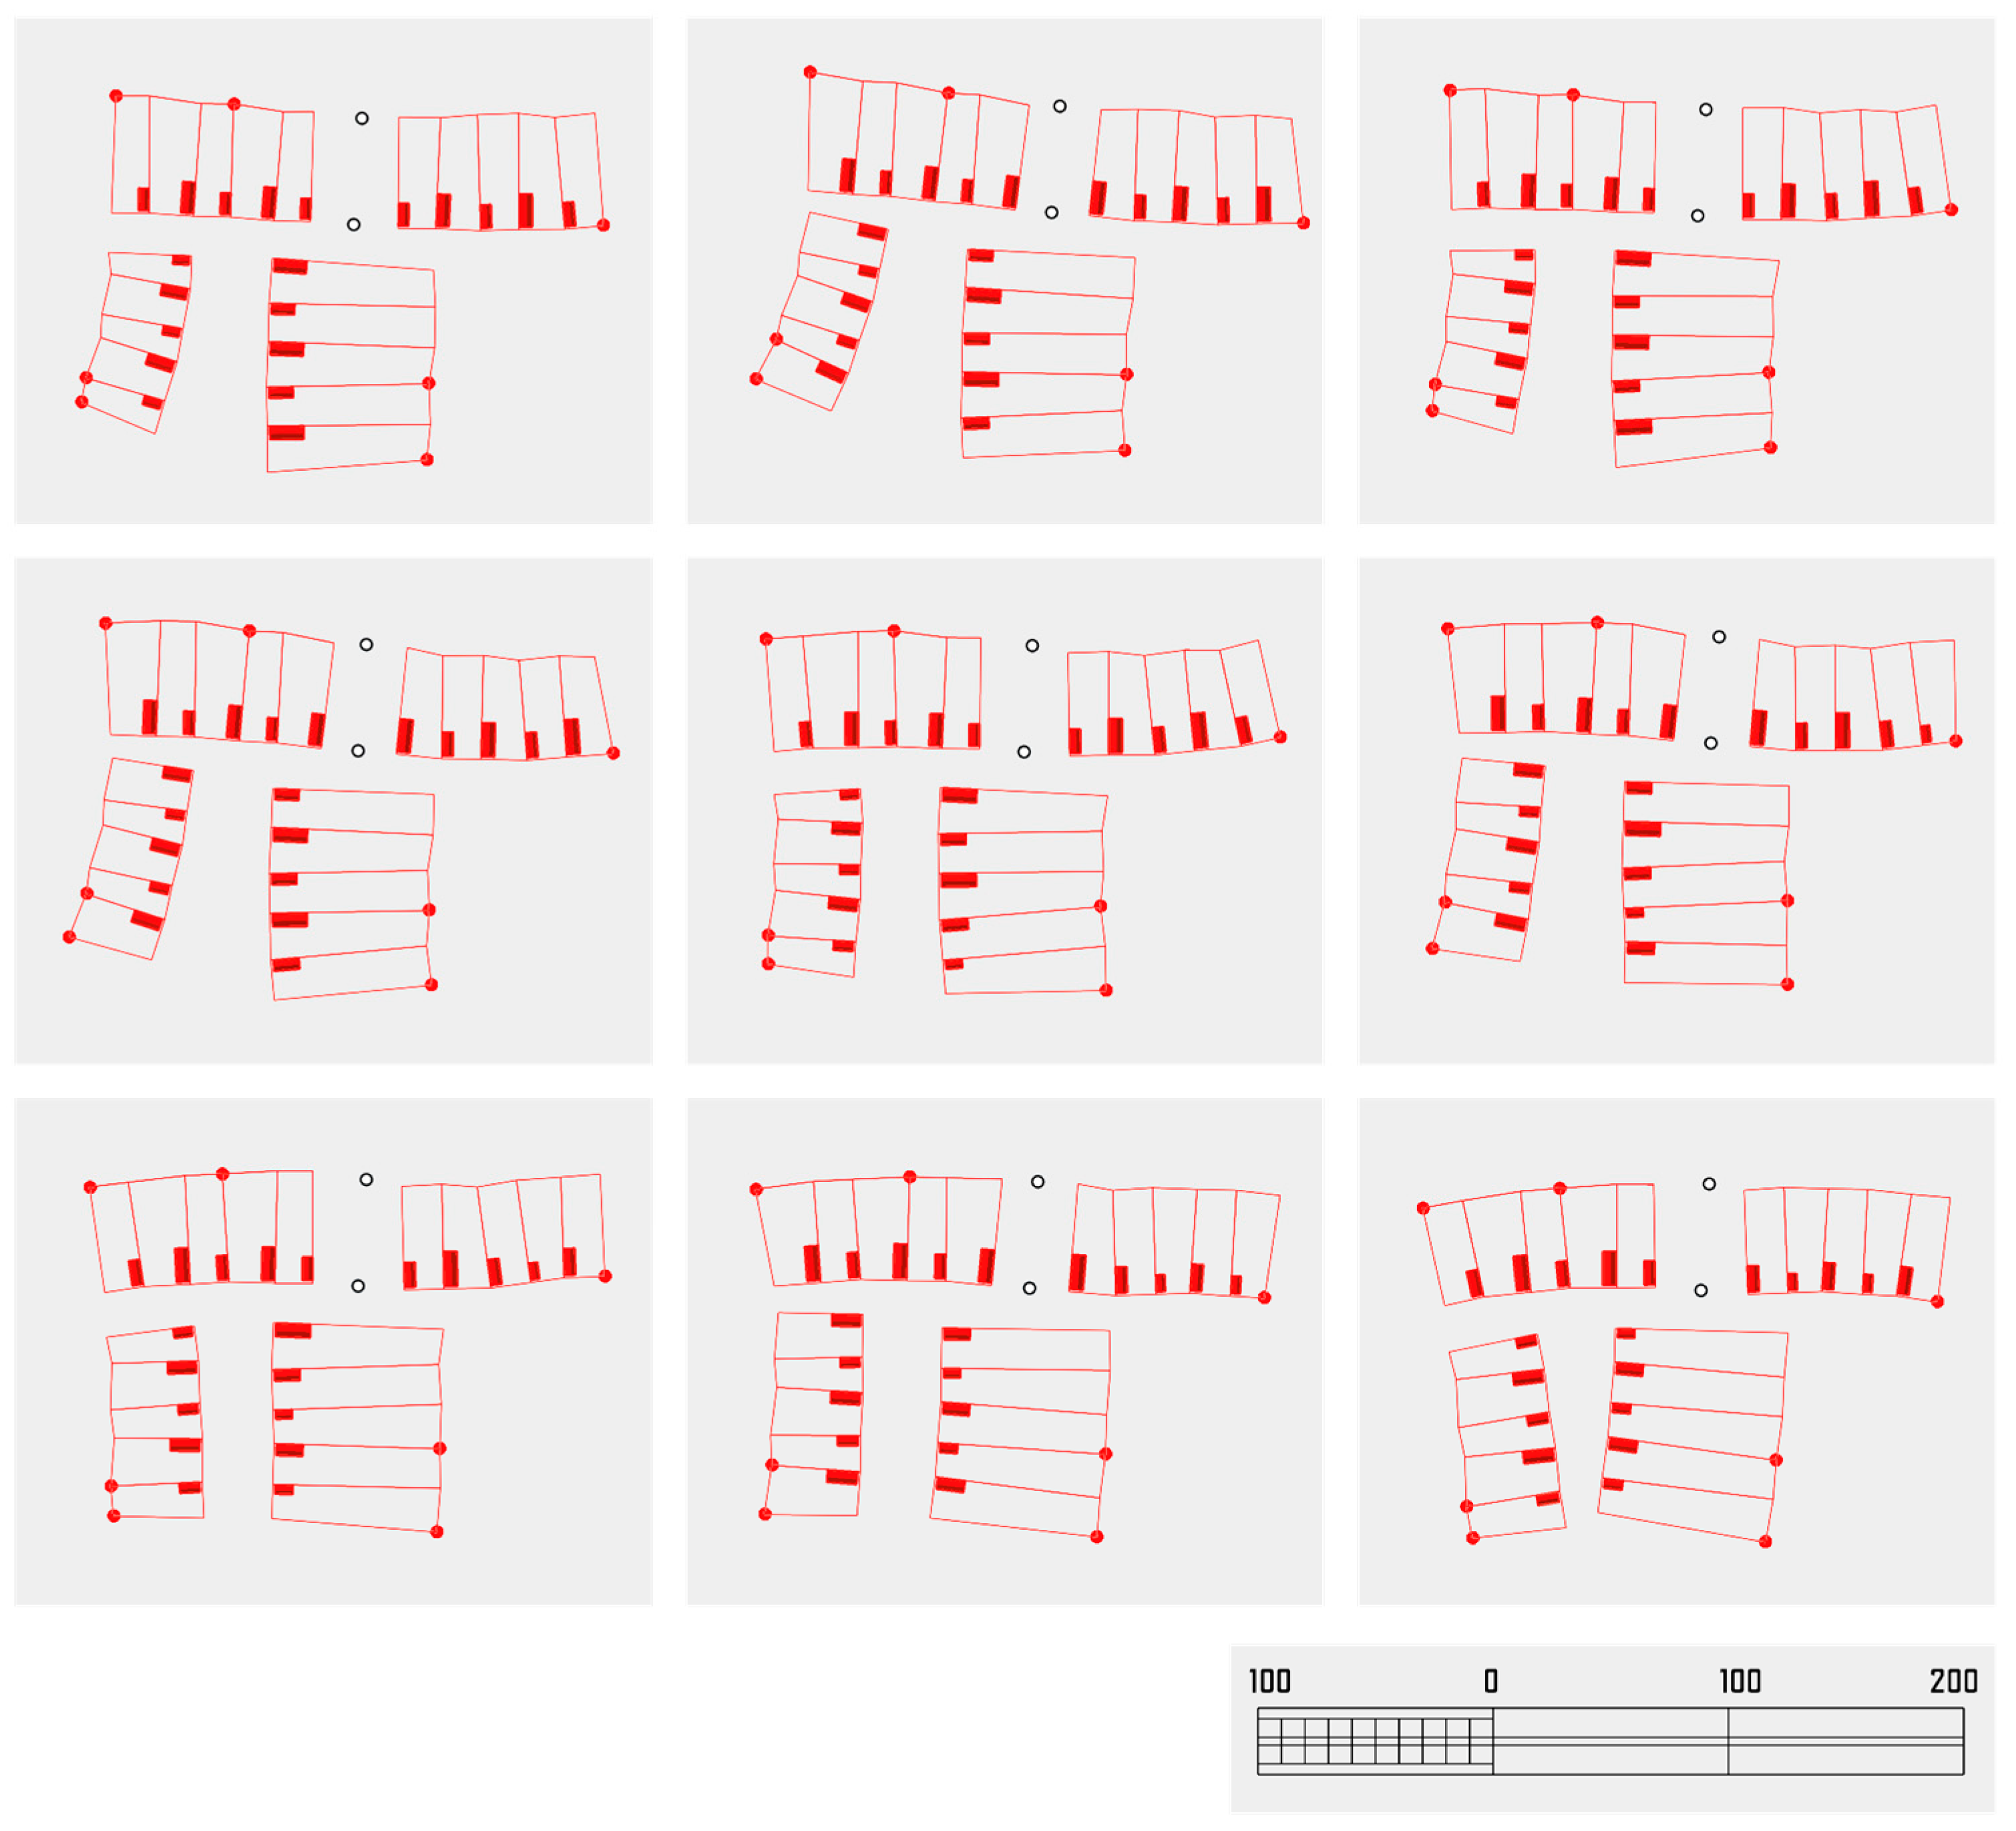
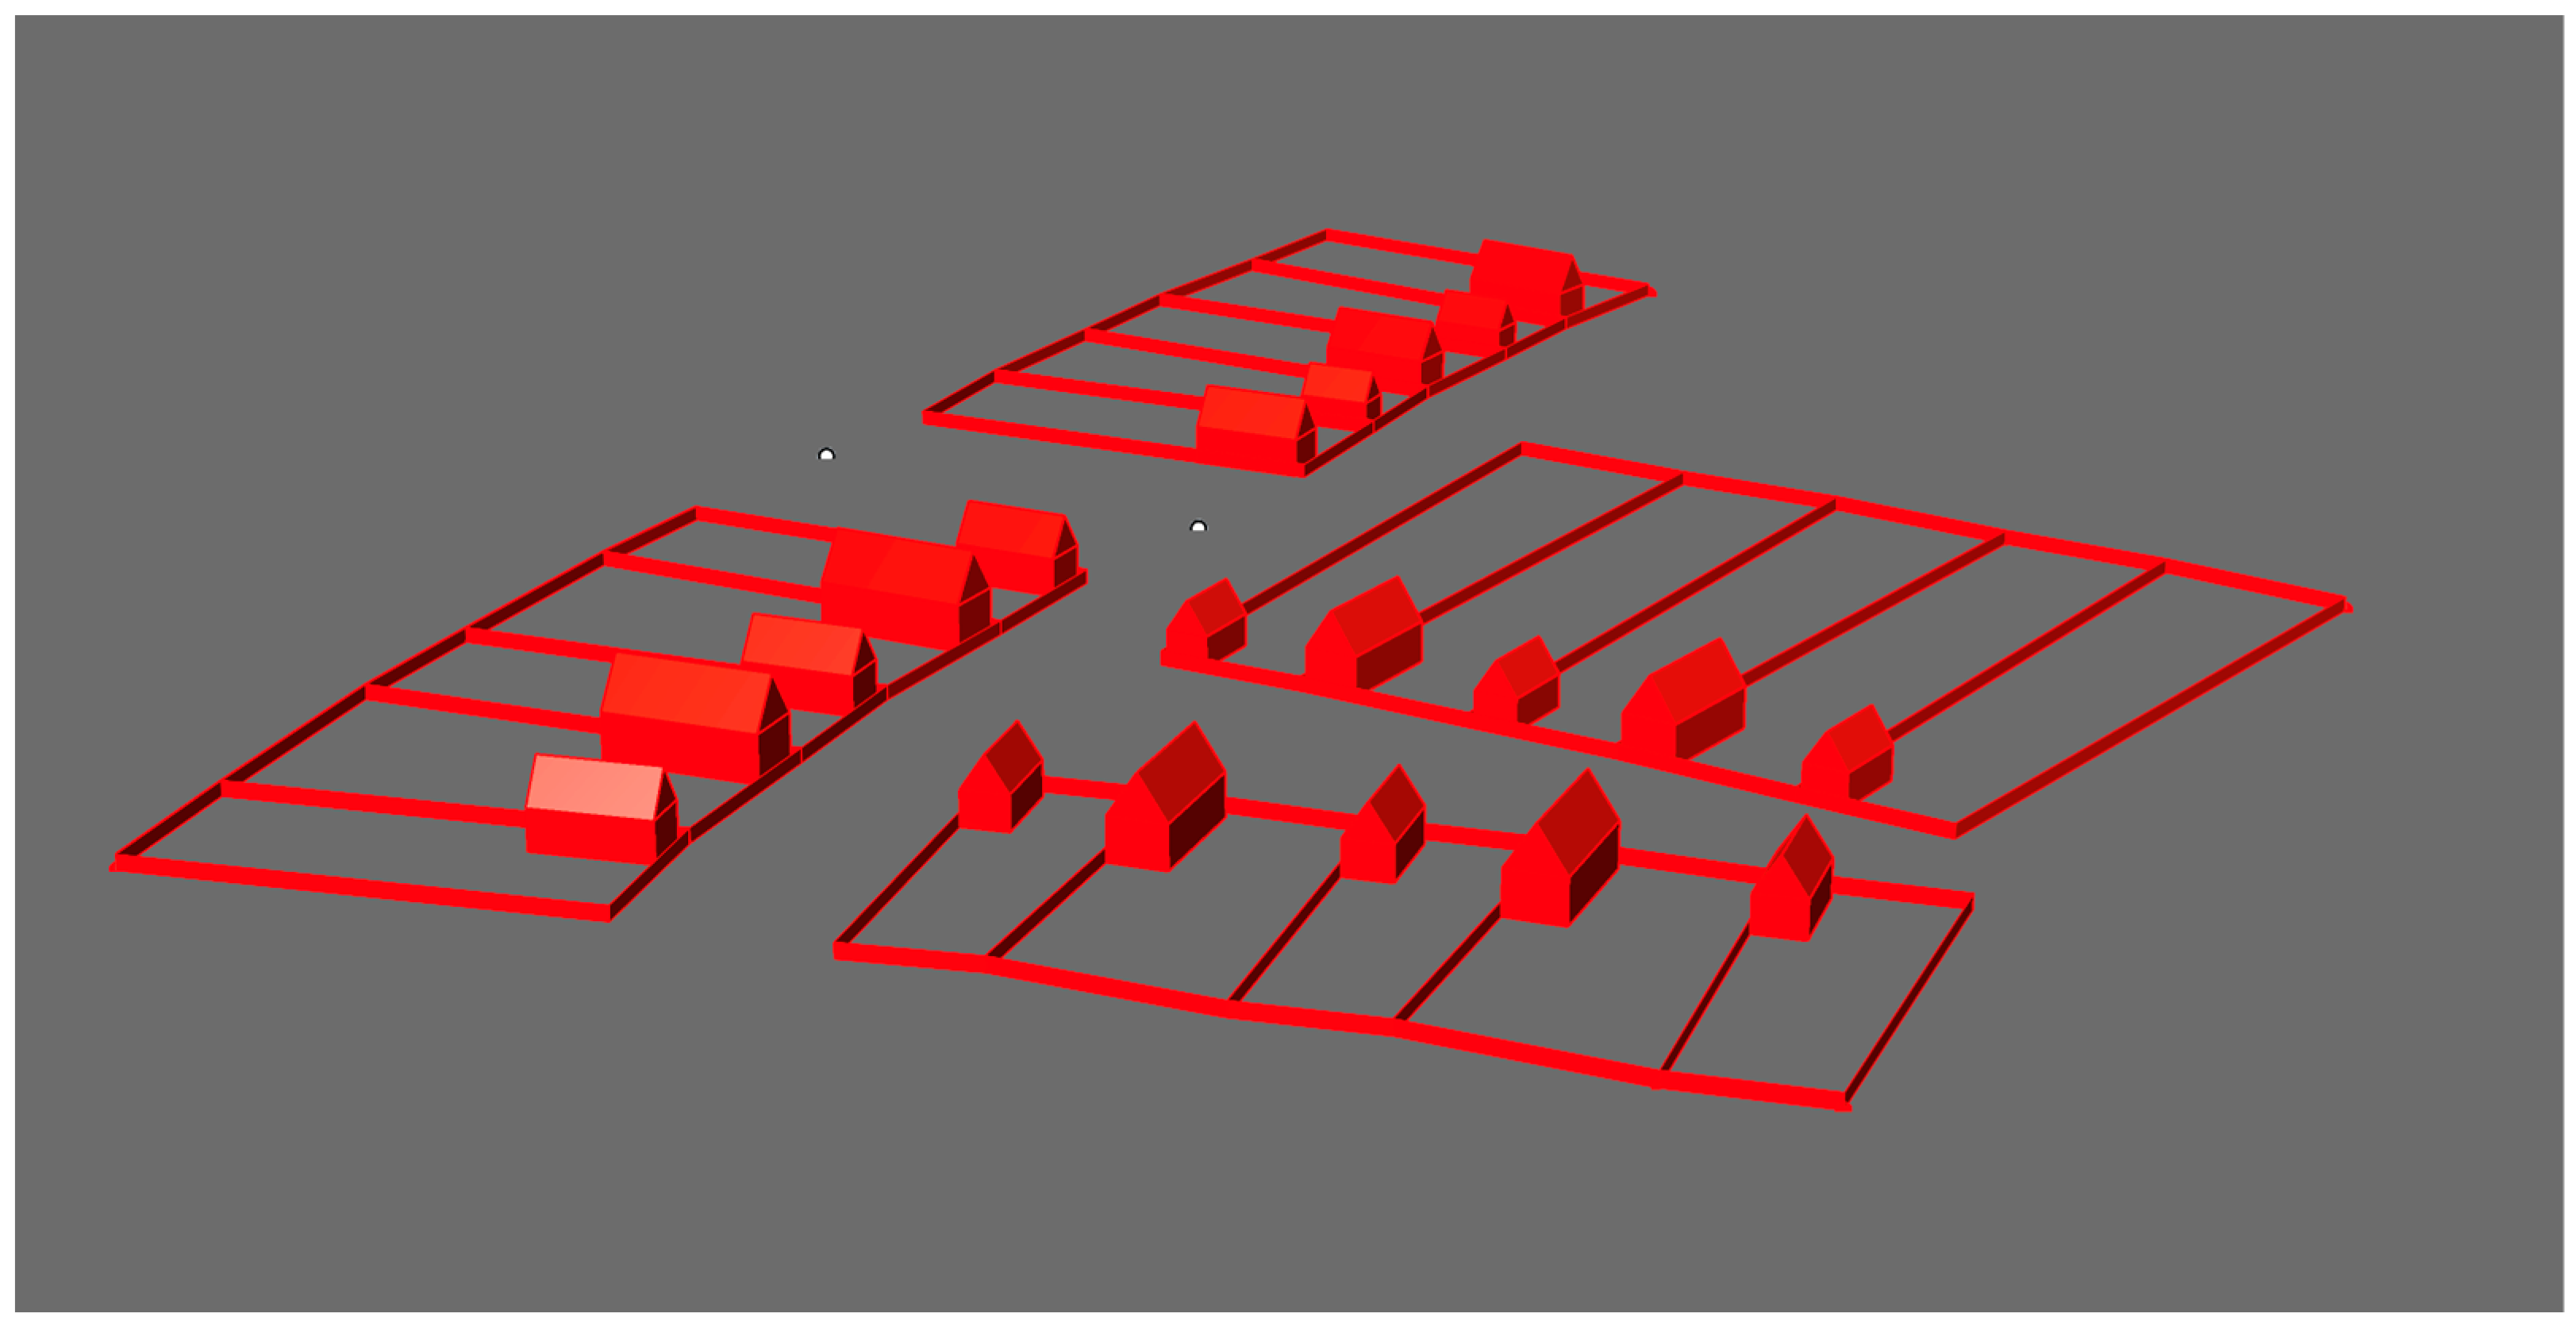
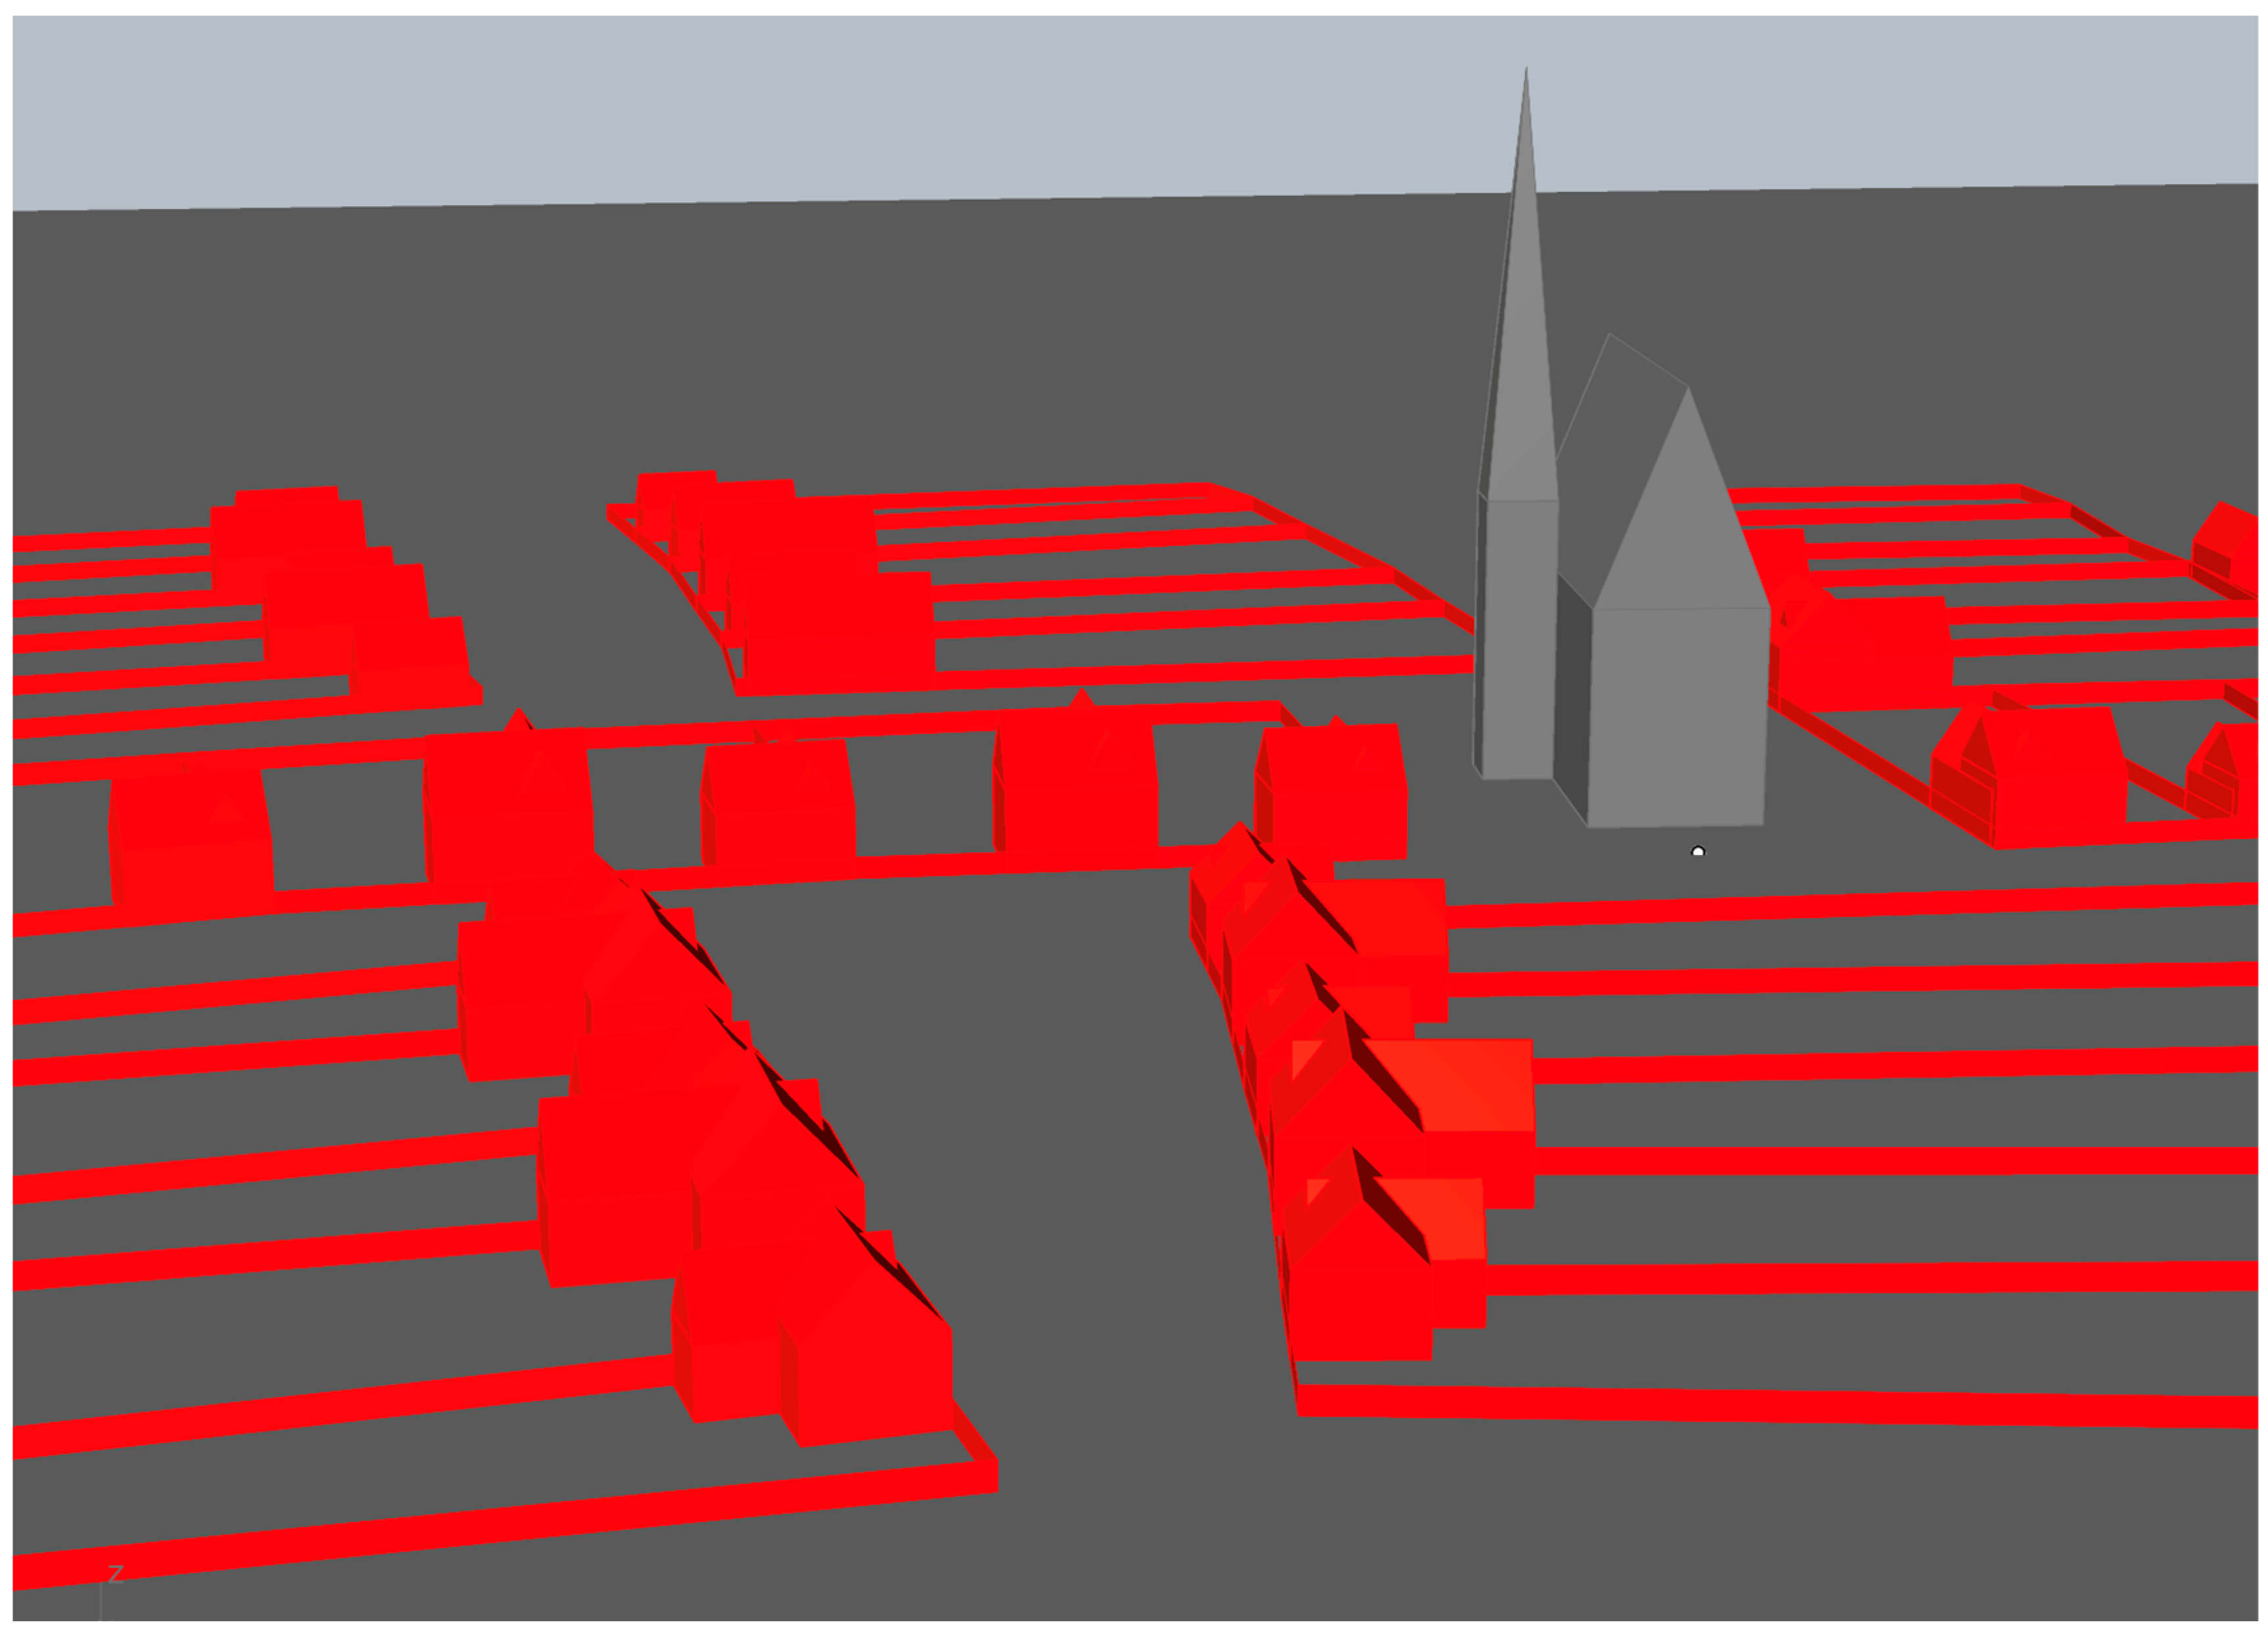
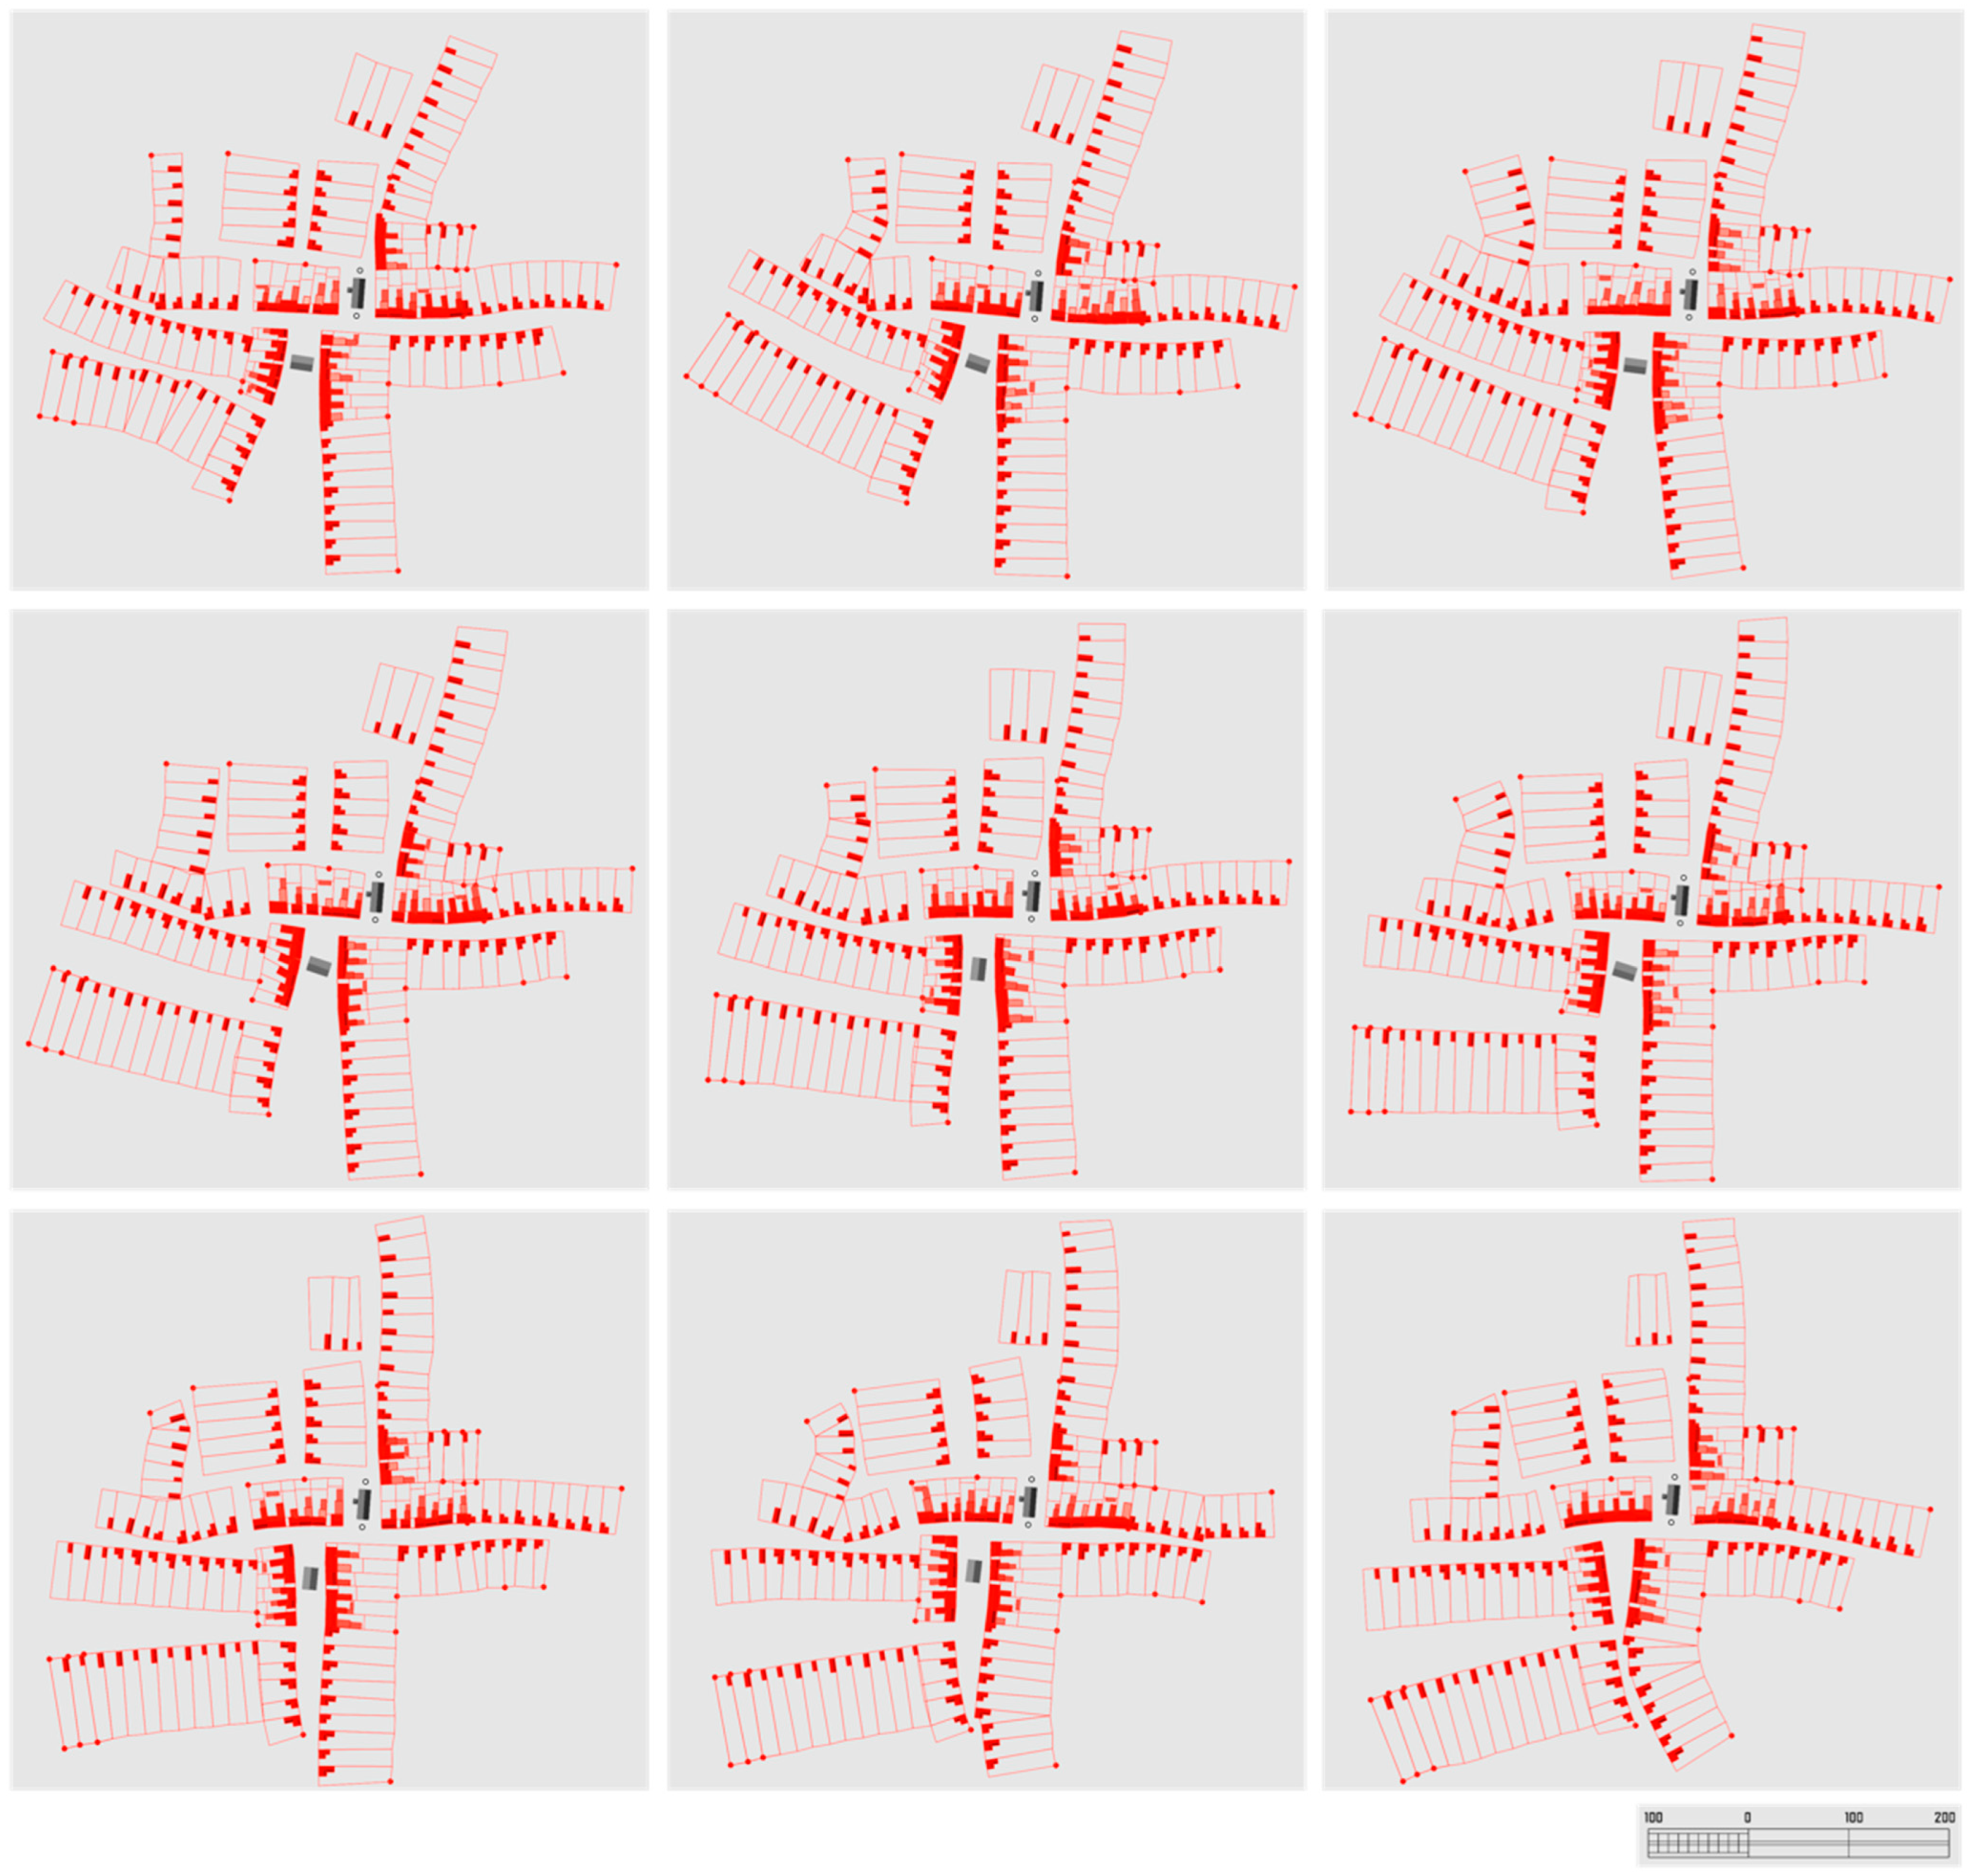
At this stage, the settlement consists of only four plot series, each containing five plots. The input for the first two plot series is the same pair of manually defined points. One plot series extends in the negative direction of the global X-axis, while the other extends in the positive direction. Since each cluster consists of five plots, there is initially an empty space followed by the series of plots on both the left and right of the point pair considered as the origin. Among the remaining two plot series, the input for one is derived from the fifth and seventh points in front of the block located to the left of the origin, while the input for the other comes from the second point in front of the block to the left of the origin and the second point in front of the block to the right of the origin (Figure 24 and Figure 25).

Second Increment

In the second growth phase, significantly more plot series emerge. These inherit their inputs from the plot series of the first phase and from each other in a manner similar to the process previously described. A church now appears at the origin, and several (irregular) streets have formed. In the plot series already established during the previous phase, the buildings evolve into L-shaped structures. Despite these developments, the overall appearance remains rural, resembling a village (Figure 26 and Figure 27).

Third Increment

In the third phase, new plot series continue to appear, as previously described, and some existing buildings adopt an L-shaped configuration. Additionally, the Lovra (Ac) tissue emerges in the inner parts of the settlement. At this stage, however, the back sides of the plots remain open to the street, and the sides of the plot series do not form enclosed spaces. In some variations, a new square forms near the church, on which a town hall appears depending on the scenario. The settlement centre begins to take on a more urban character (Figure 28 and Figure 29).

Fourth Increment

As the growth continues, the looser tissue expands at the peripheries, while the centre becomes denser. More keyboard tissues transform into (Ac) tissues, and Ac-dense tissue begins to appear around the church. The most central block becomes a fully closed perimeter block, expanding by incorporating some plots from neighbouring blocks. A new street is also created at this stage. In some variations, a new square forms, where a small chapel is constructed, contingent on certain conditions being met (Figure 30 and Figure 31).

Fifth Increment

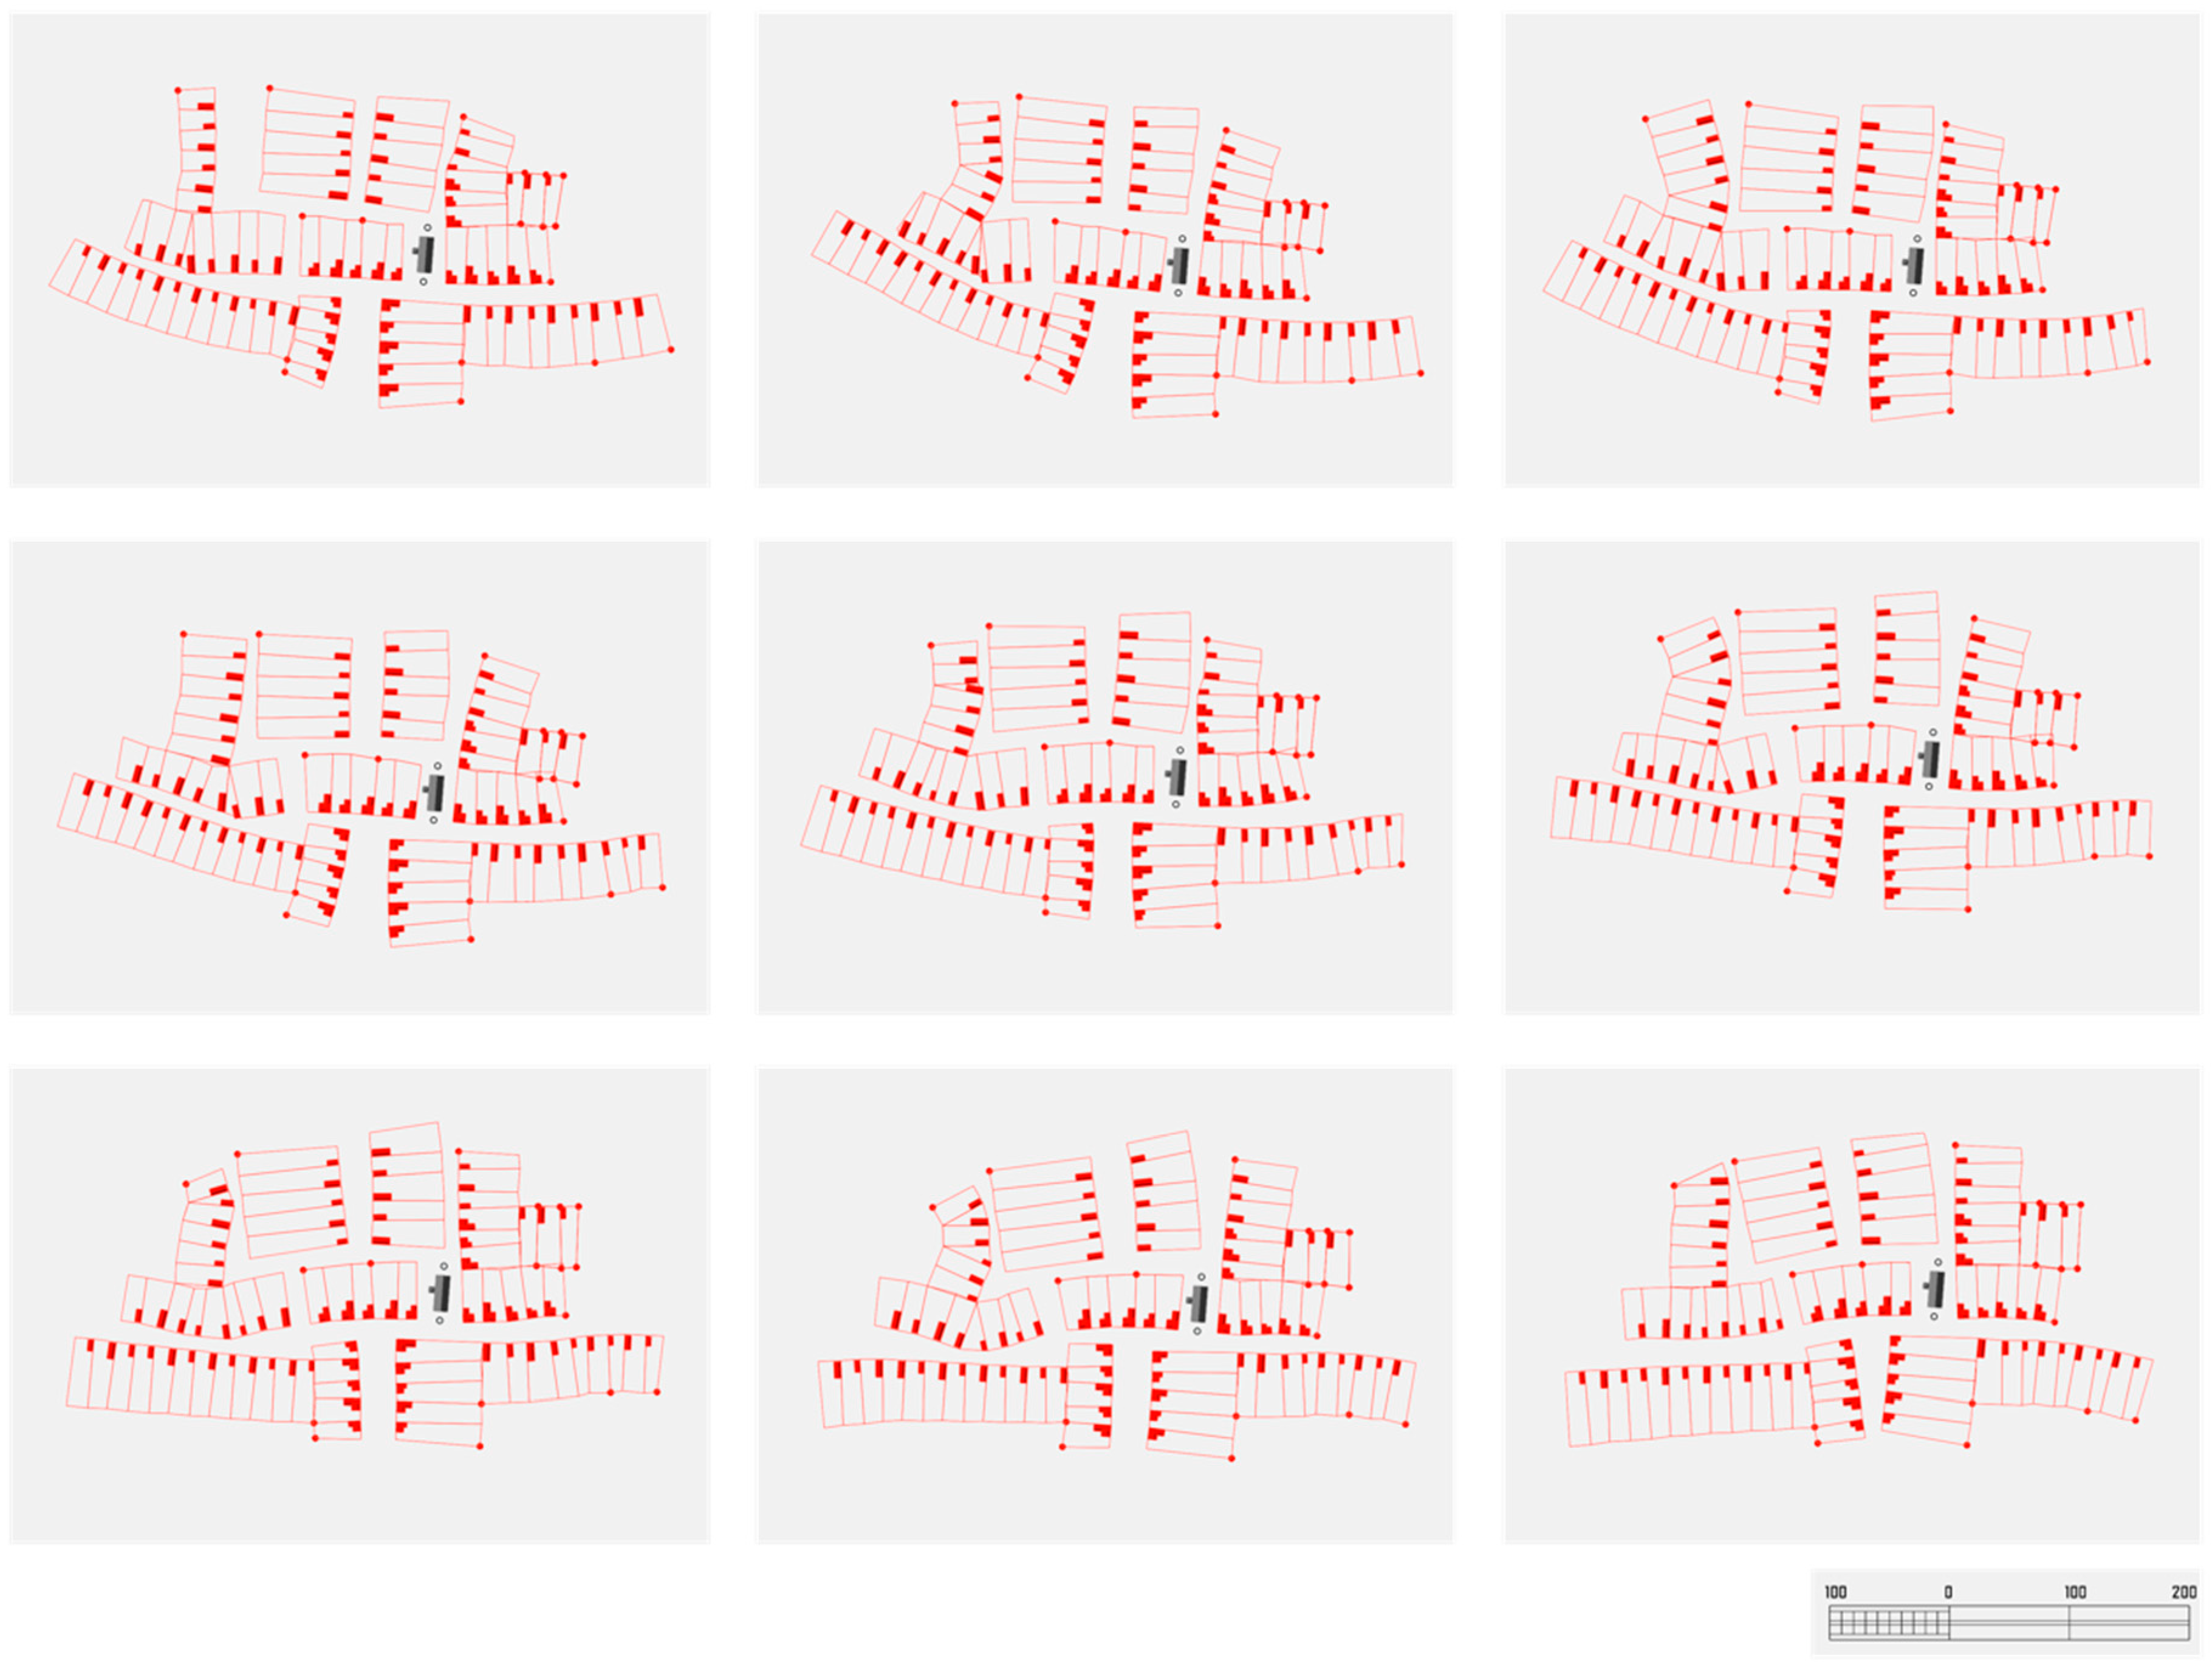
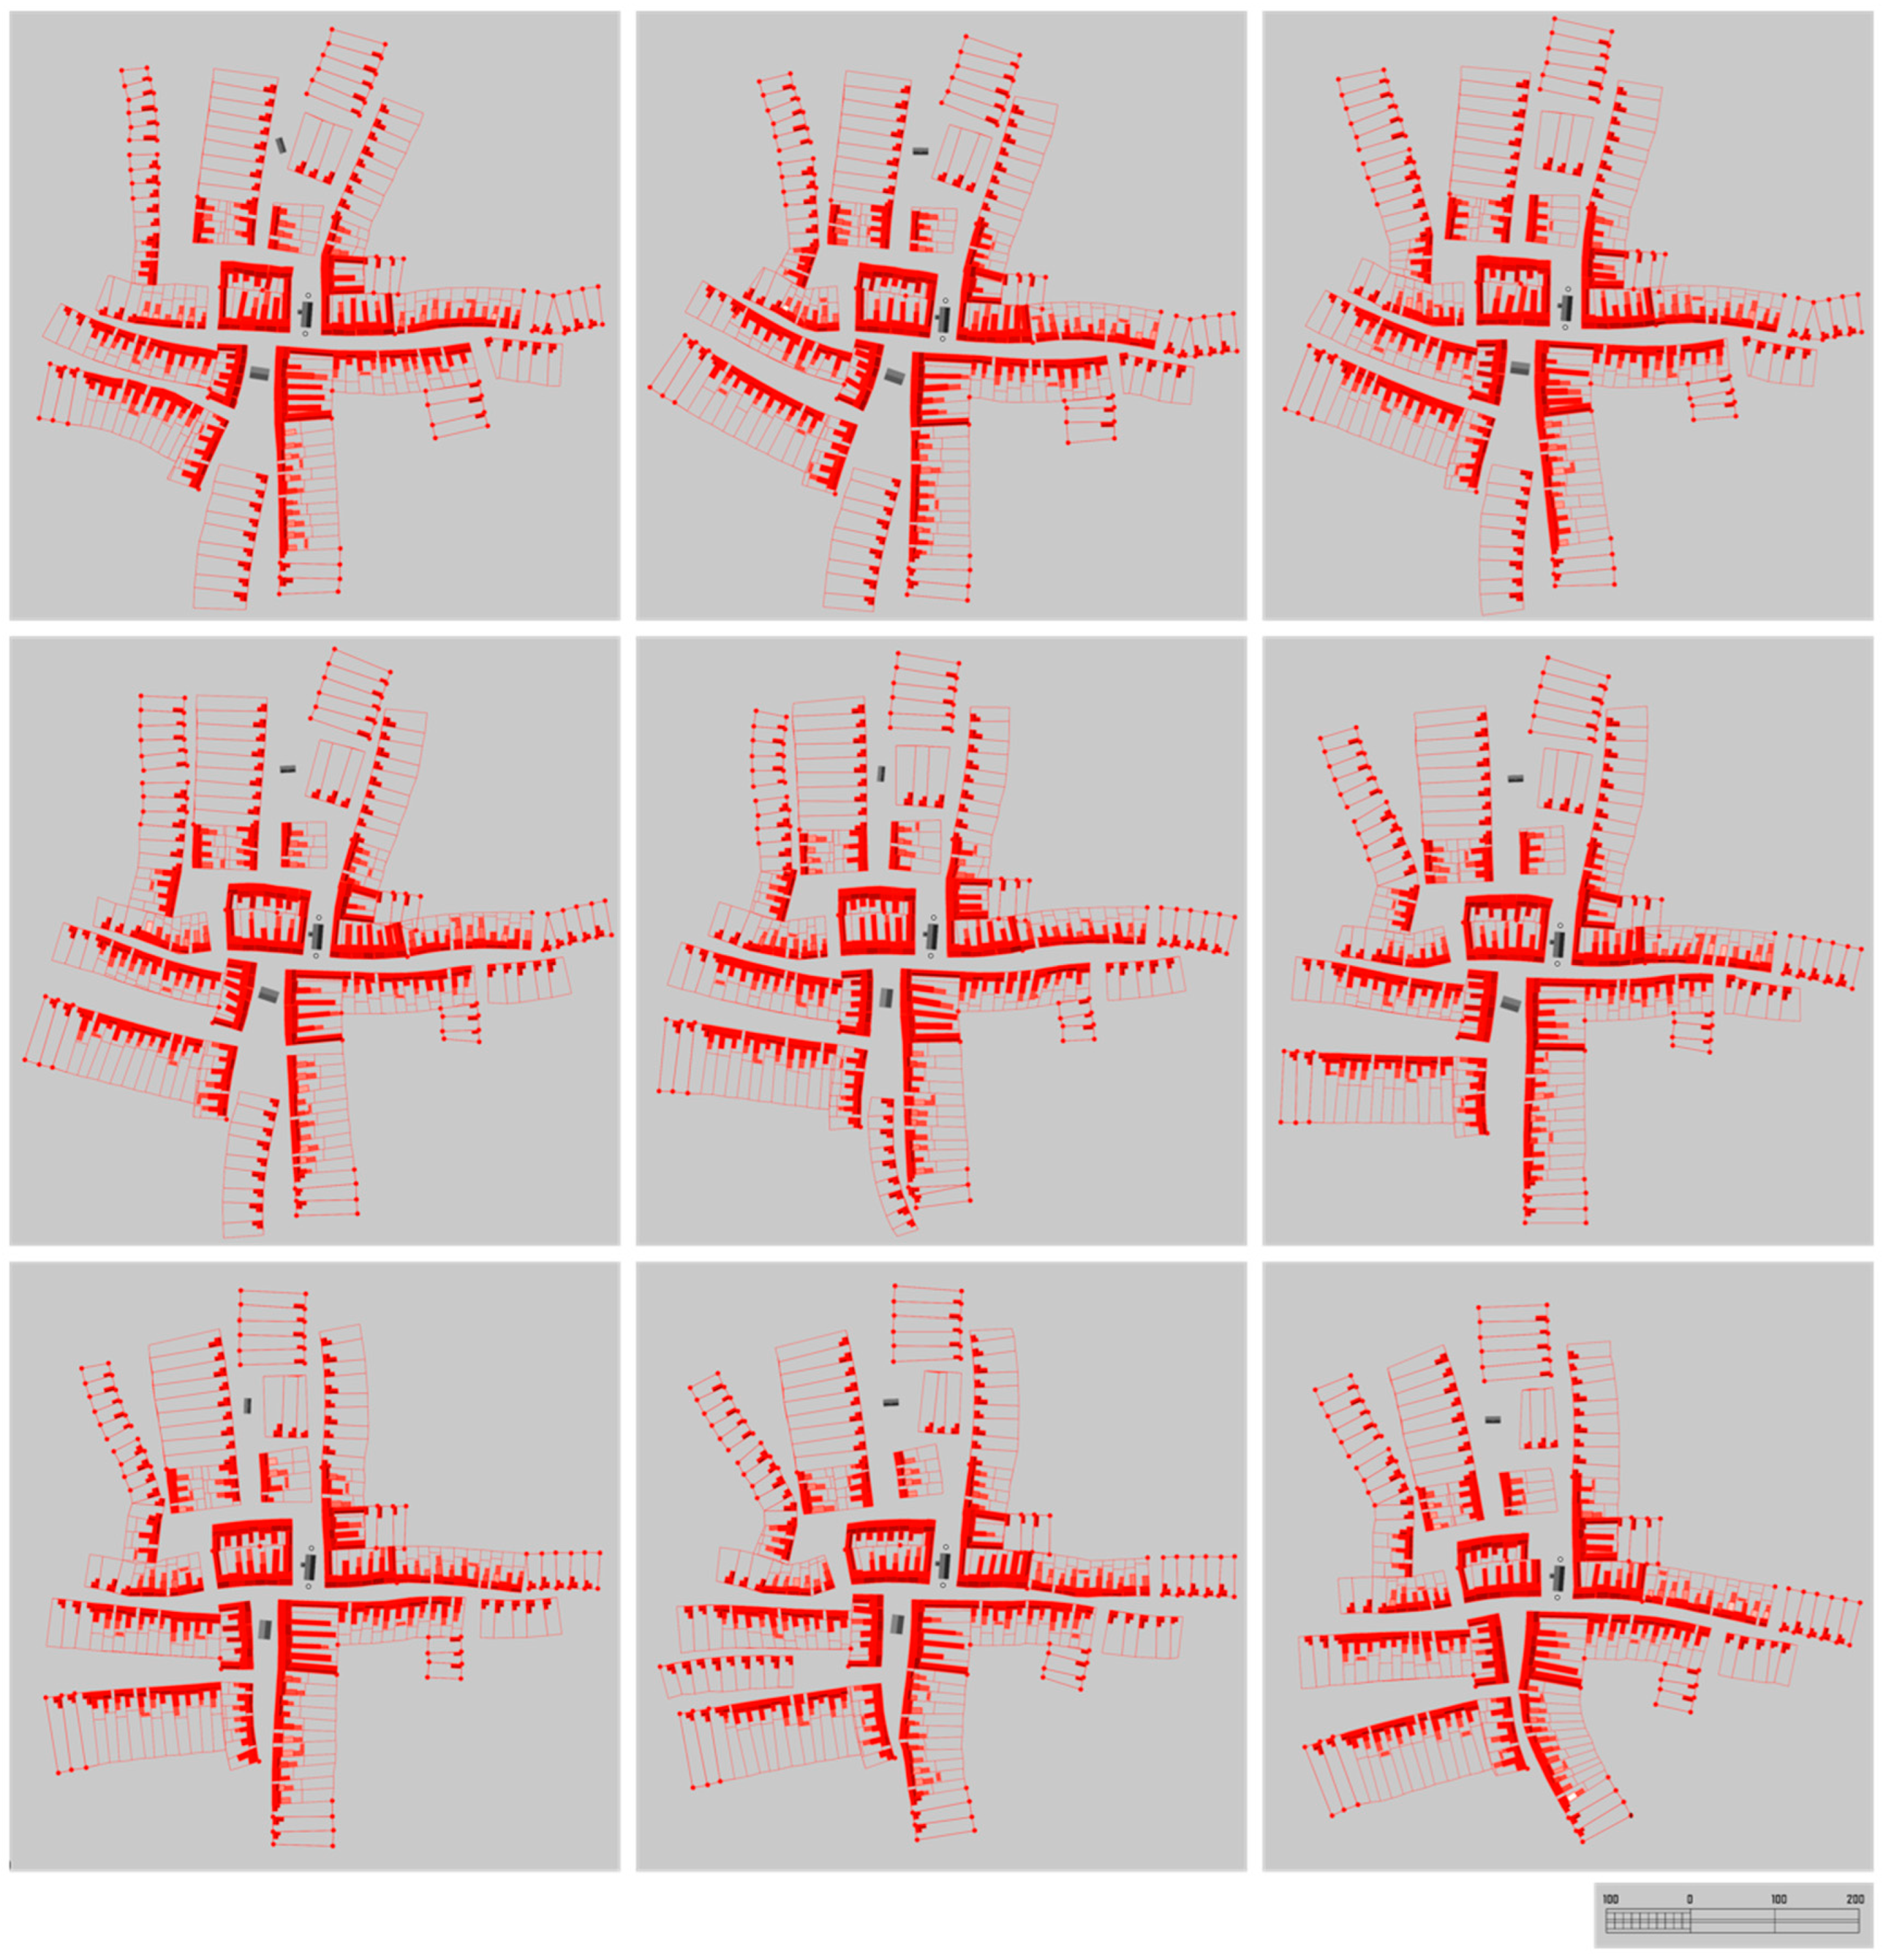
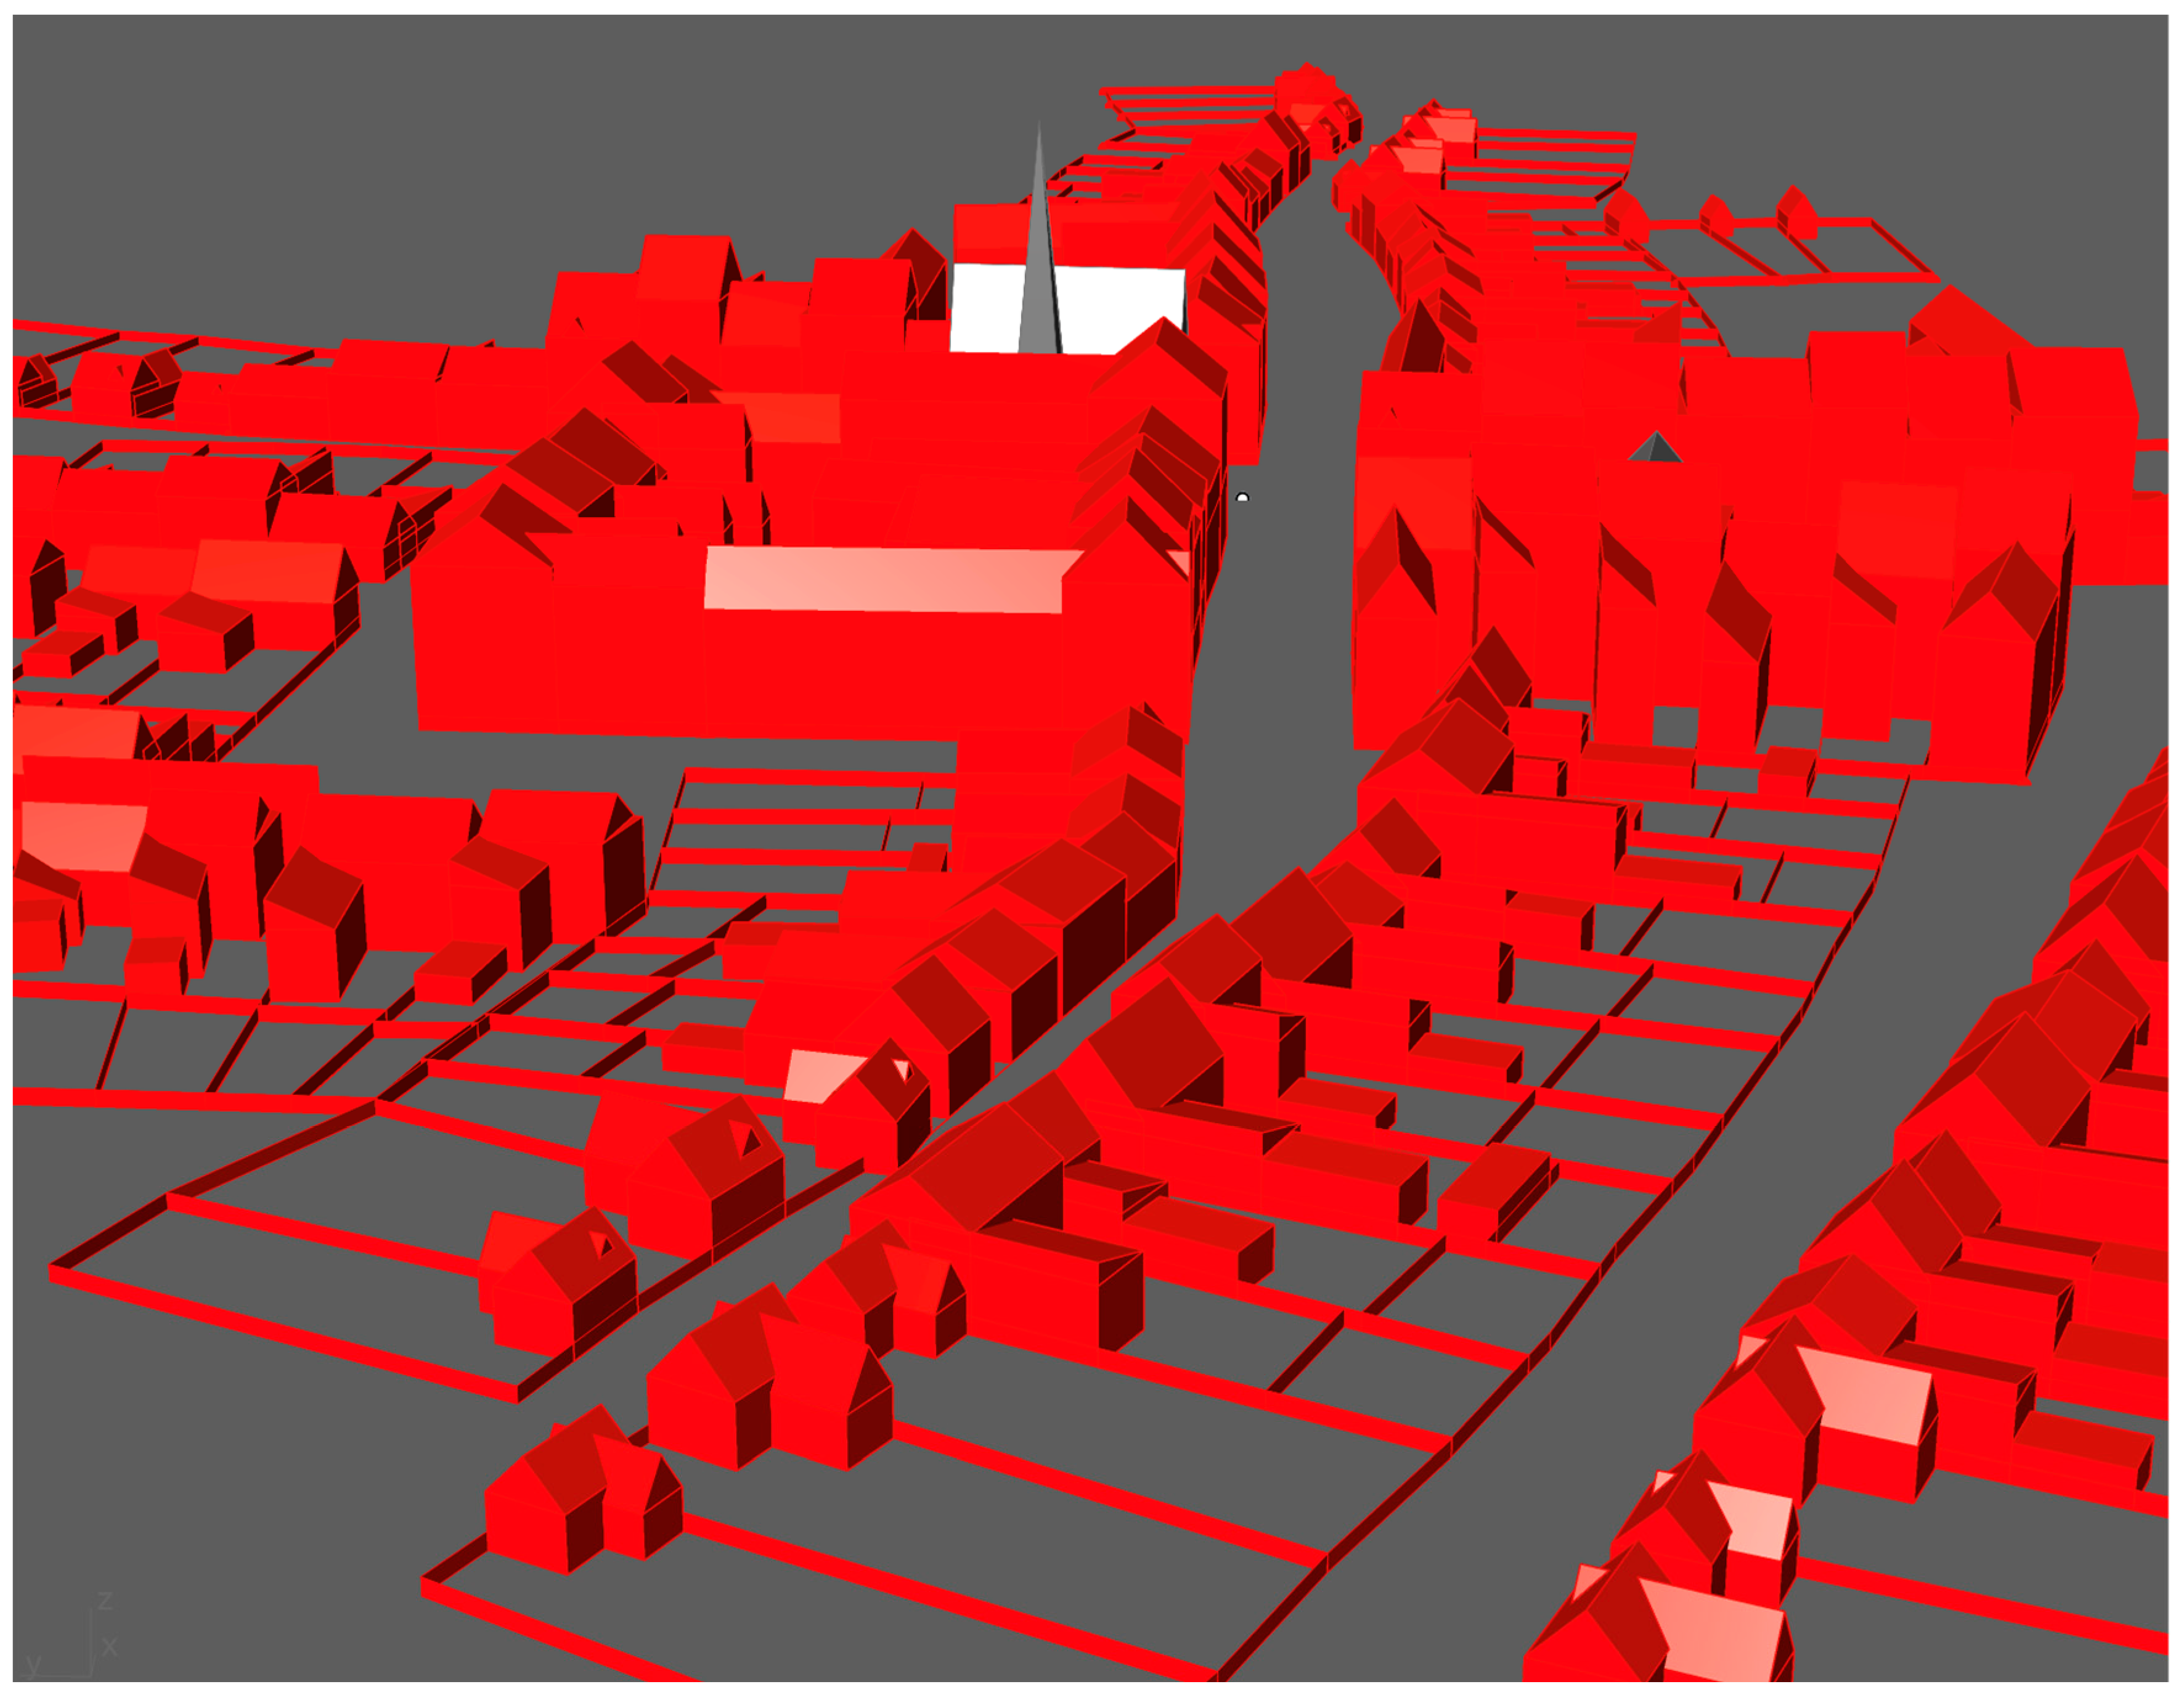
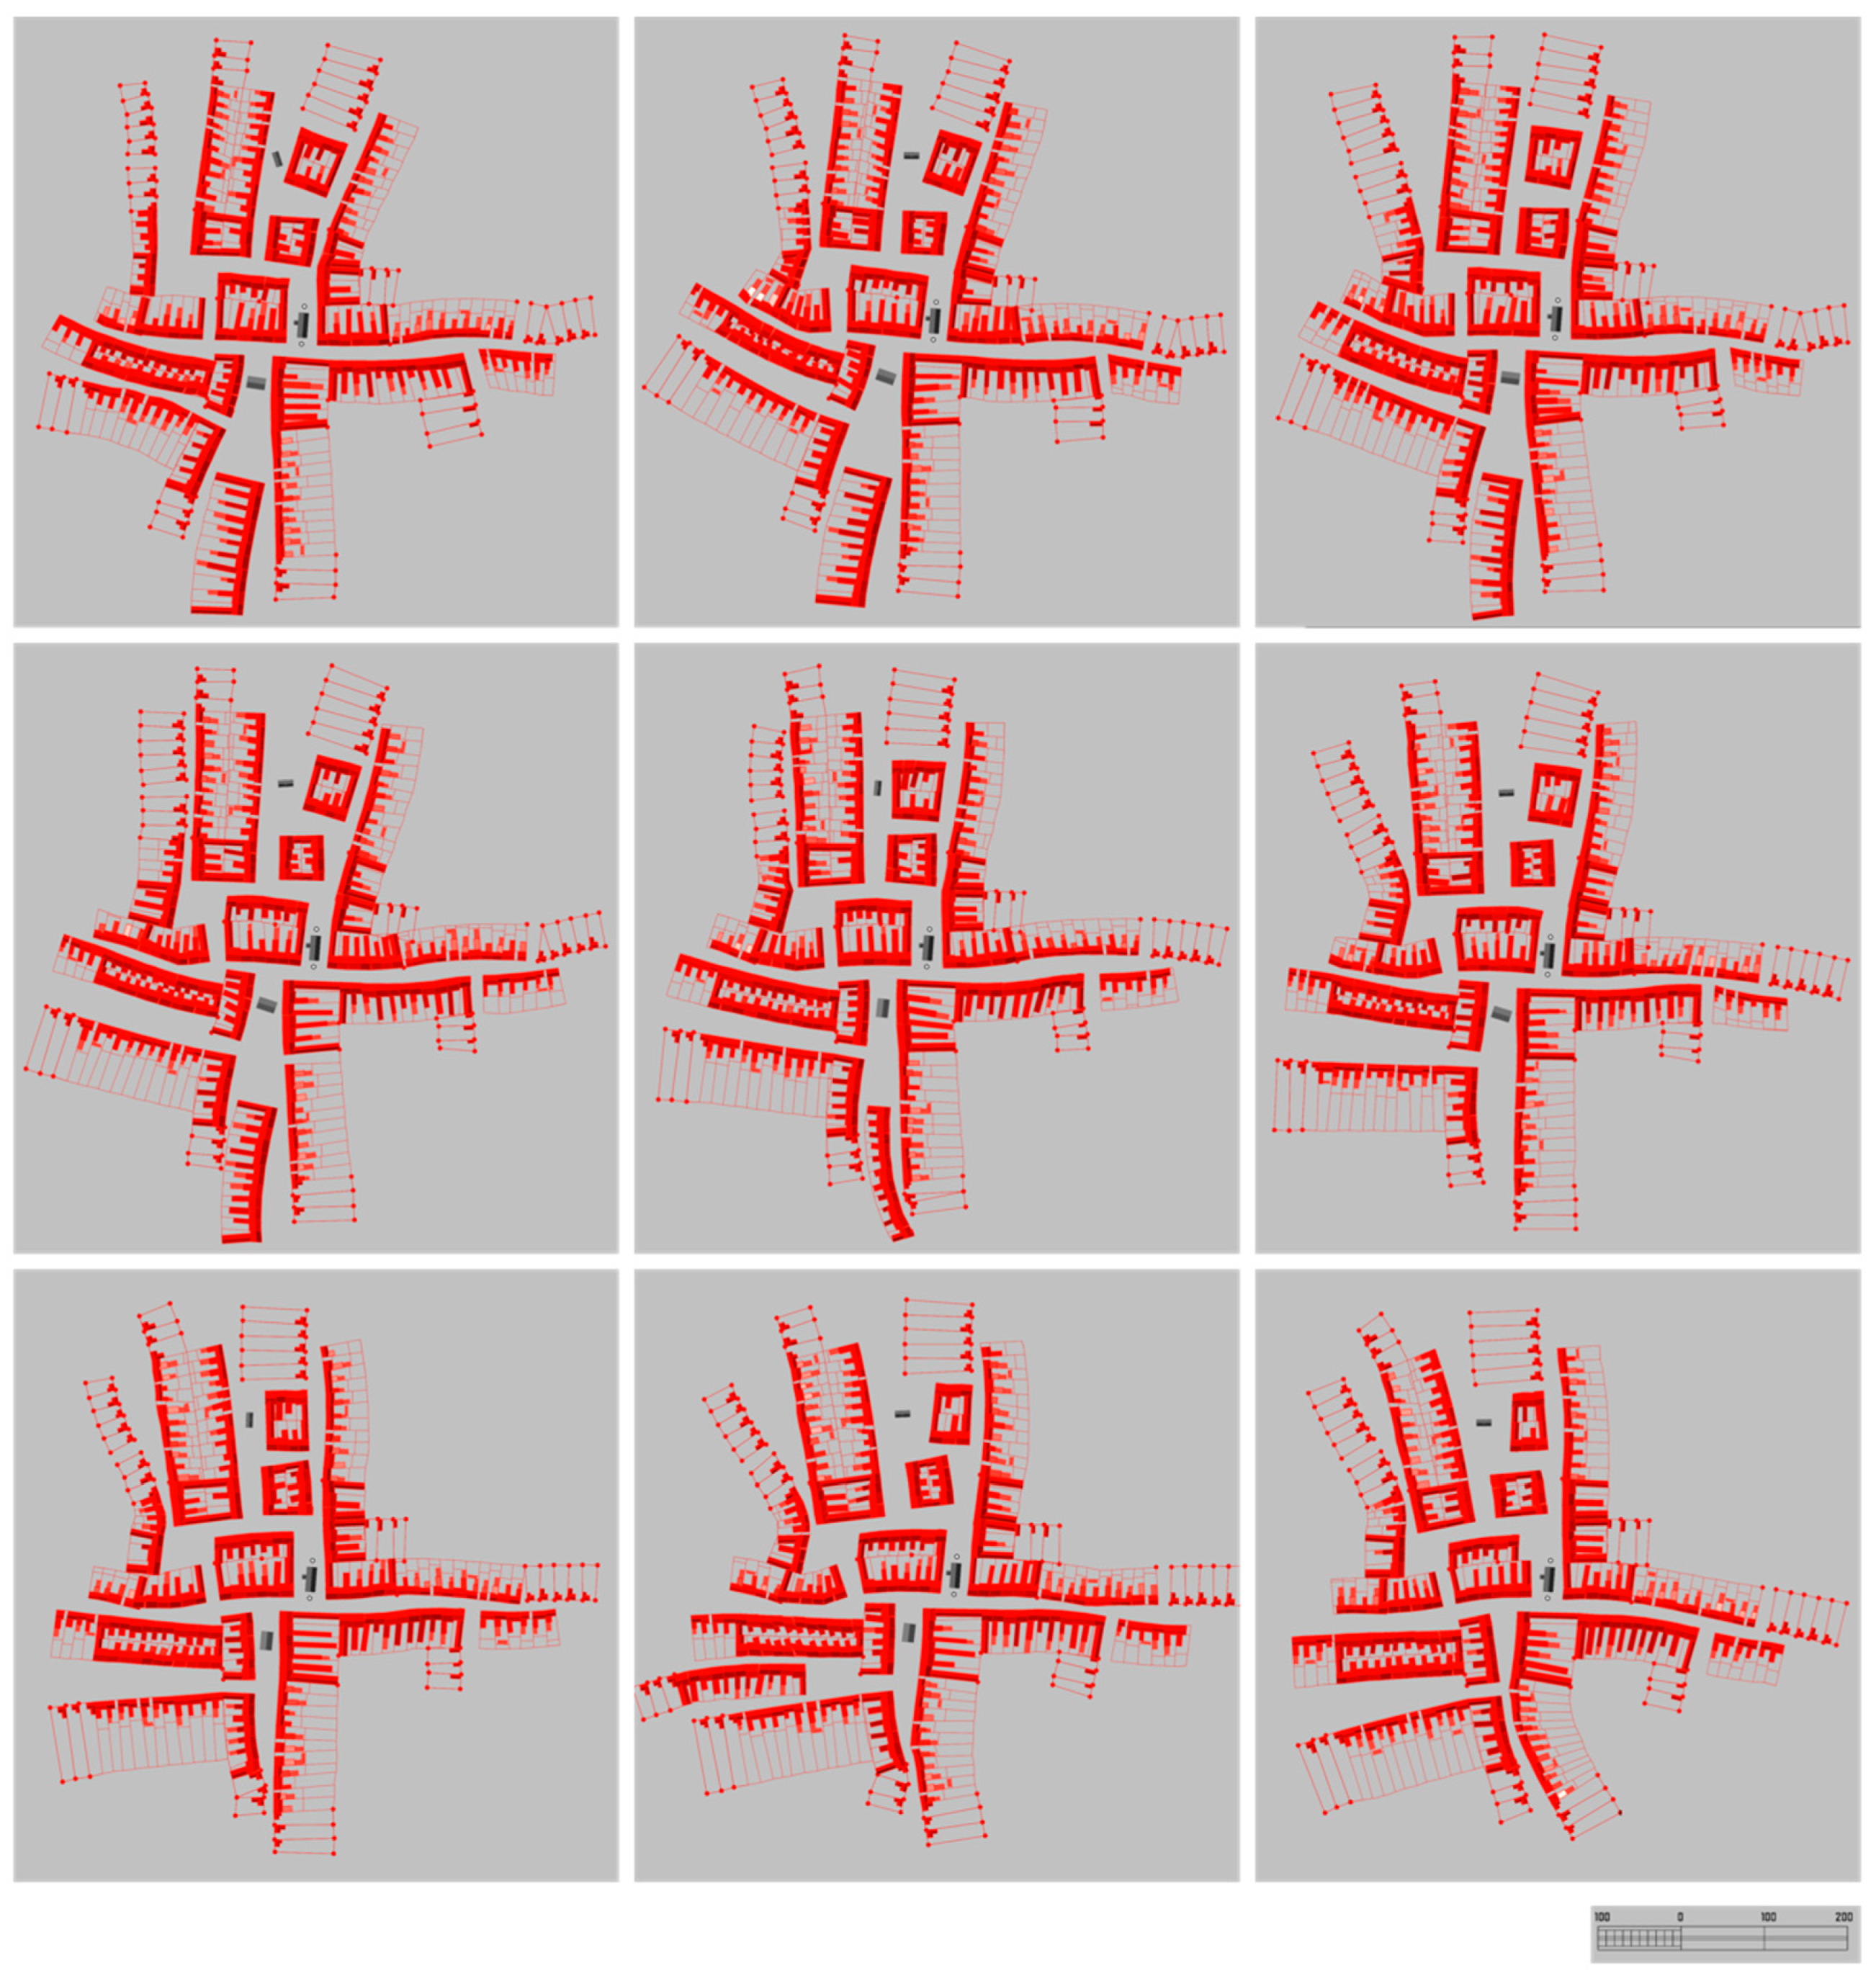
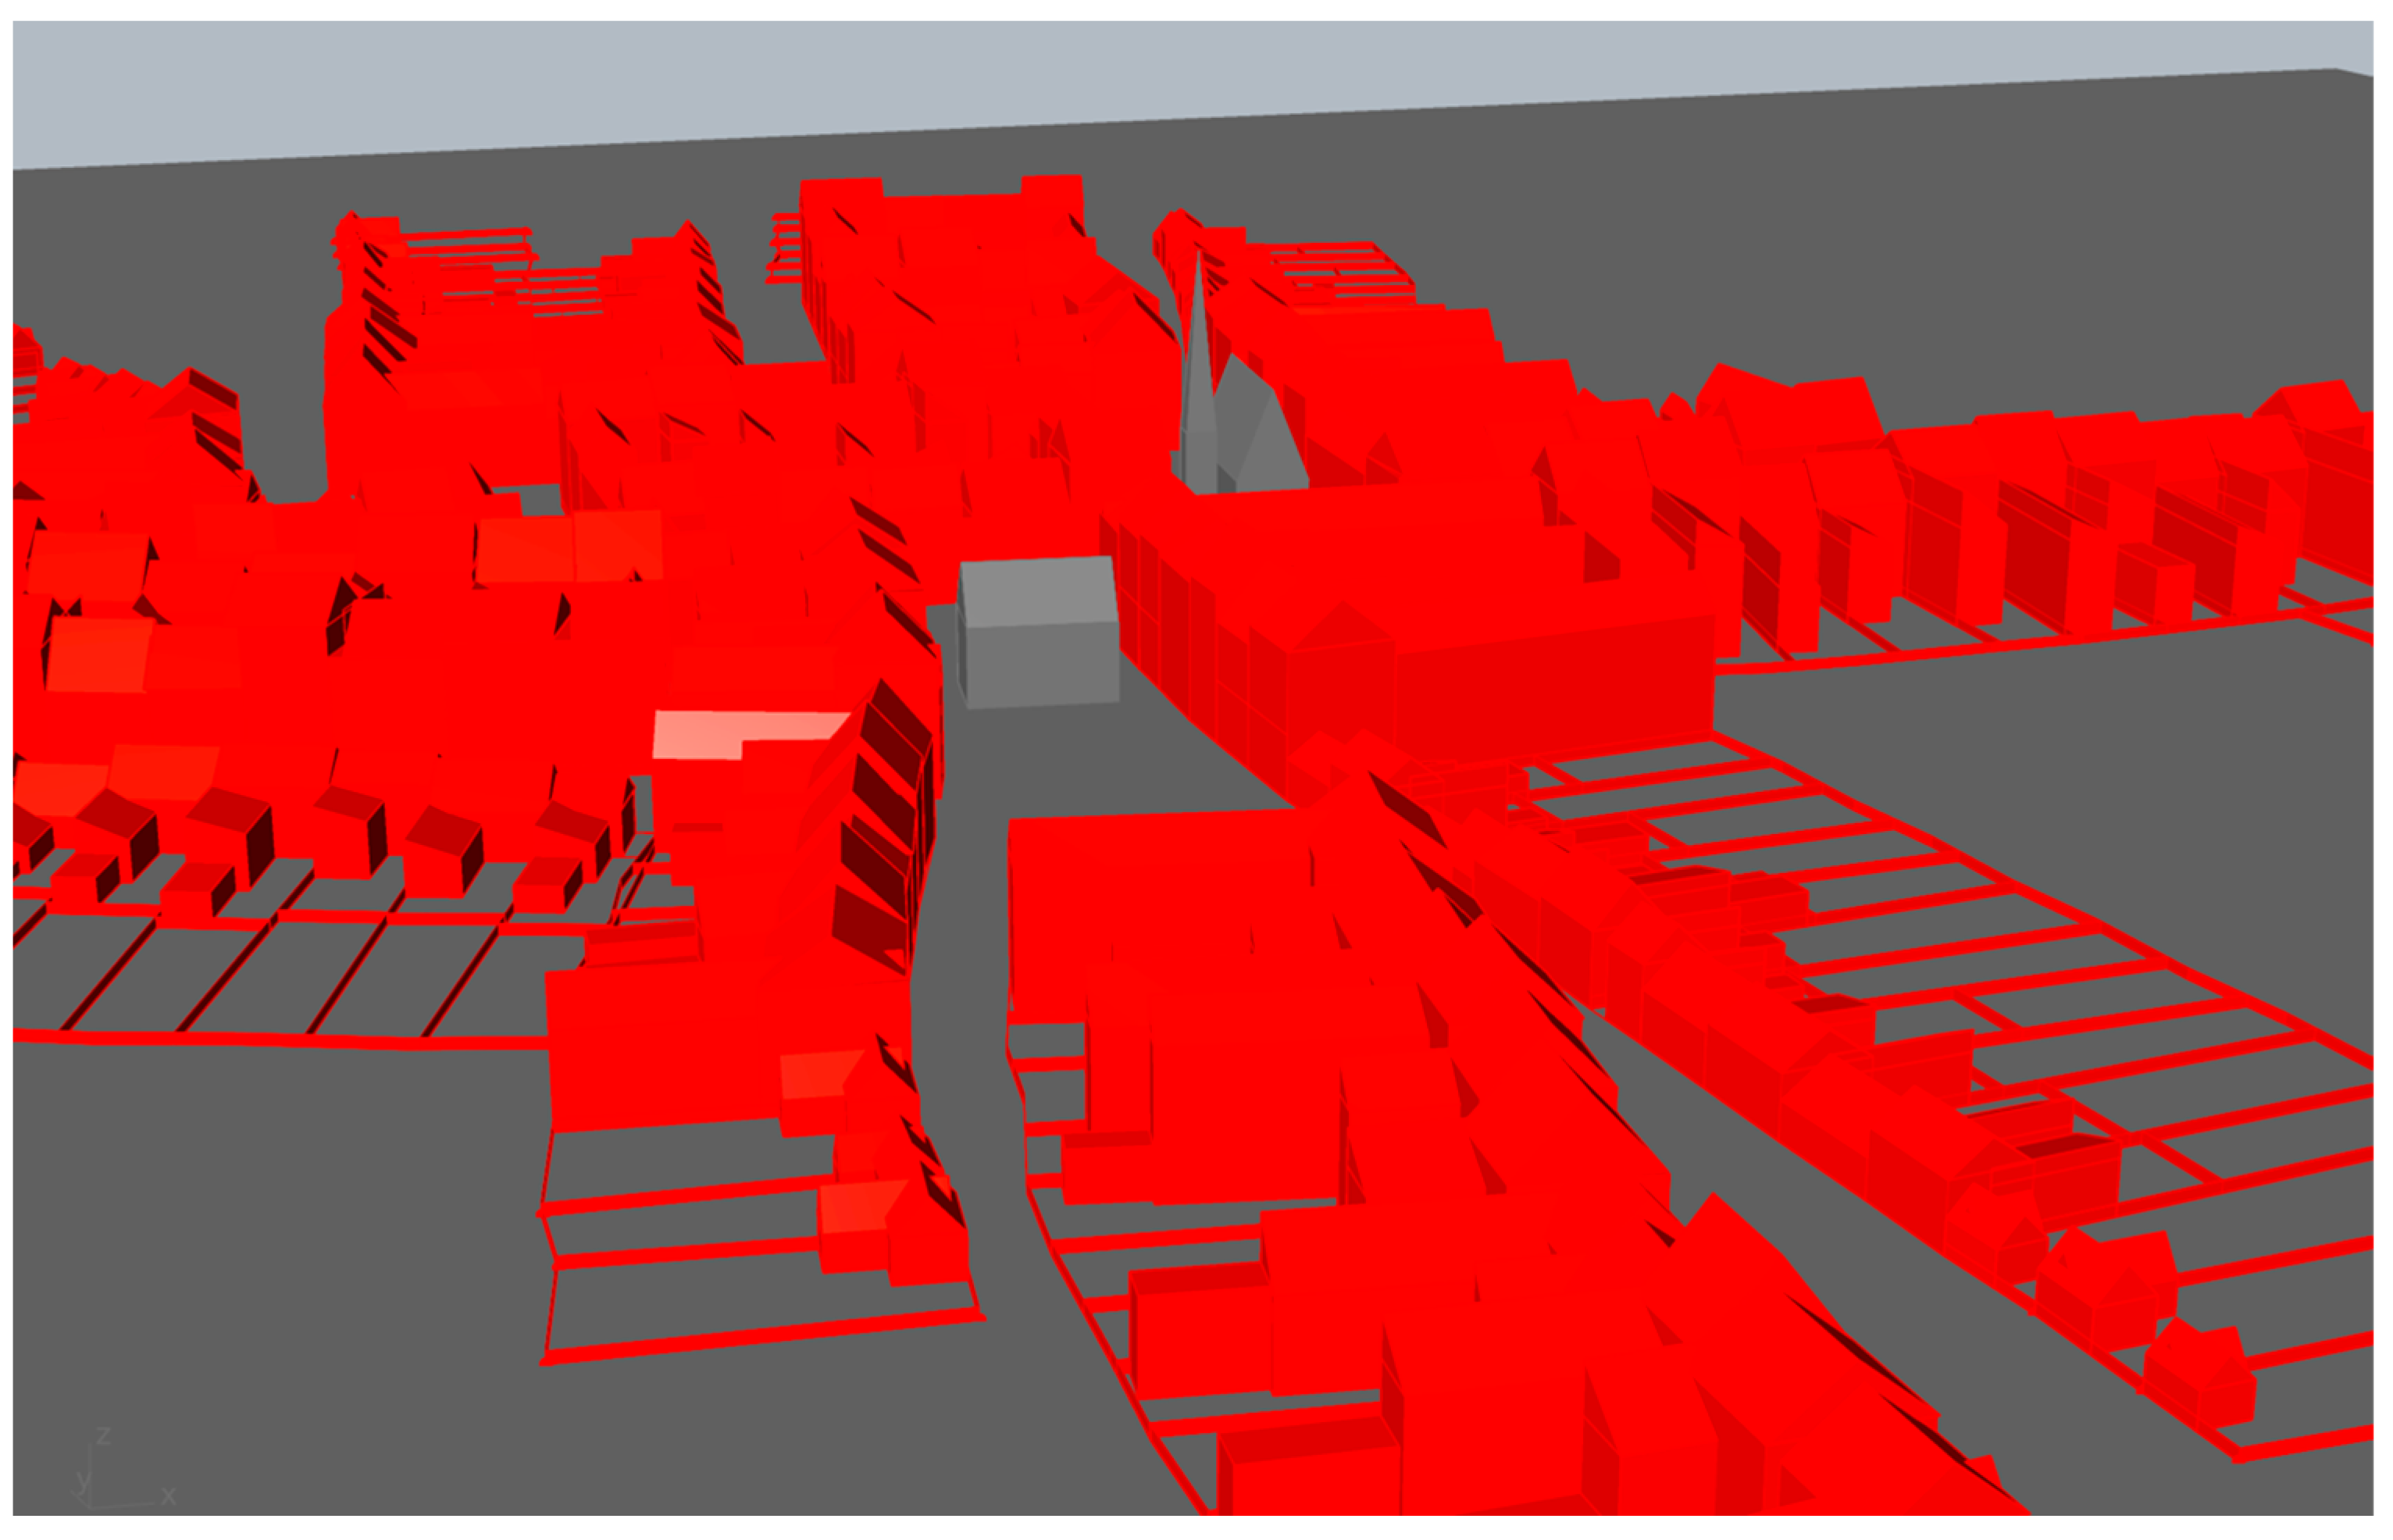
In this phase, the processes initiated earlier continue: (Ac)-blocks become Ac-dense and close into perimeter blocks, while additional keyboard tissues transform into (Ac) tissues. Outward expansion slows, and the settlement matures into a small town, characterised by a network of streets lined with mostly continuous rows of buildings and enclosed squares (Figure 32 and Figure 33).
In Figure 34, the five increments are displayed in 3D, side by side, within the same version and viewed from the same angle.

3.2. Validation of the Algorithm on a Real Site

This chapter is an experiment demonstrating whether the generic algorithm described above can be applied to a real urban location, which, in this case, also features sloping terrain. The result is a structure that could serve as the basis for a real preliminary master plan.
The chosen experimental area is Hangman’s Hill (Akasztó-bérc) in Miskolc. This is the last undeveloped area close to the city centre, located approximately 1 km north of the main street (Figure 35).
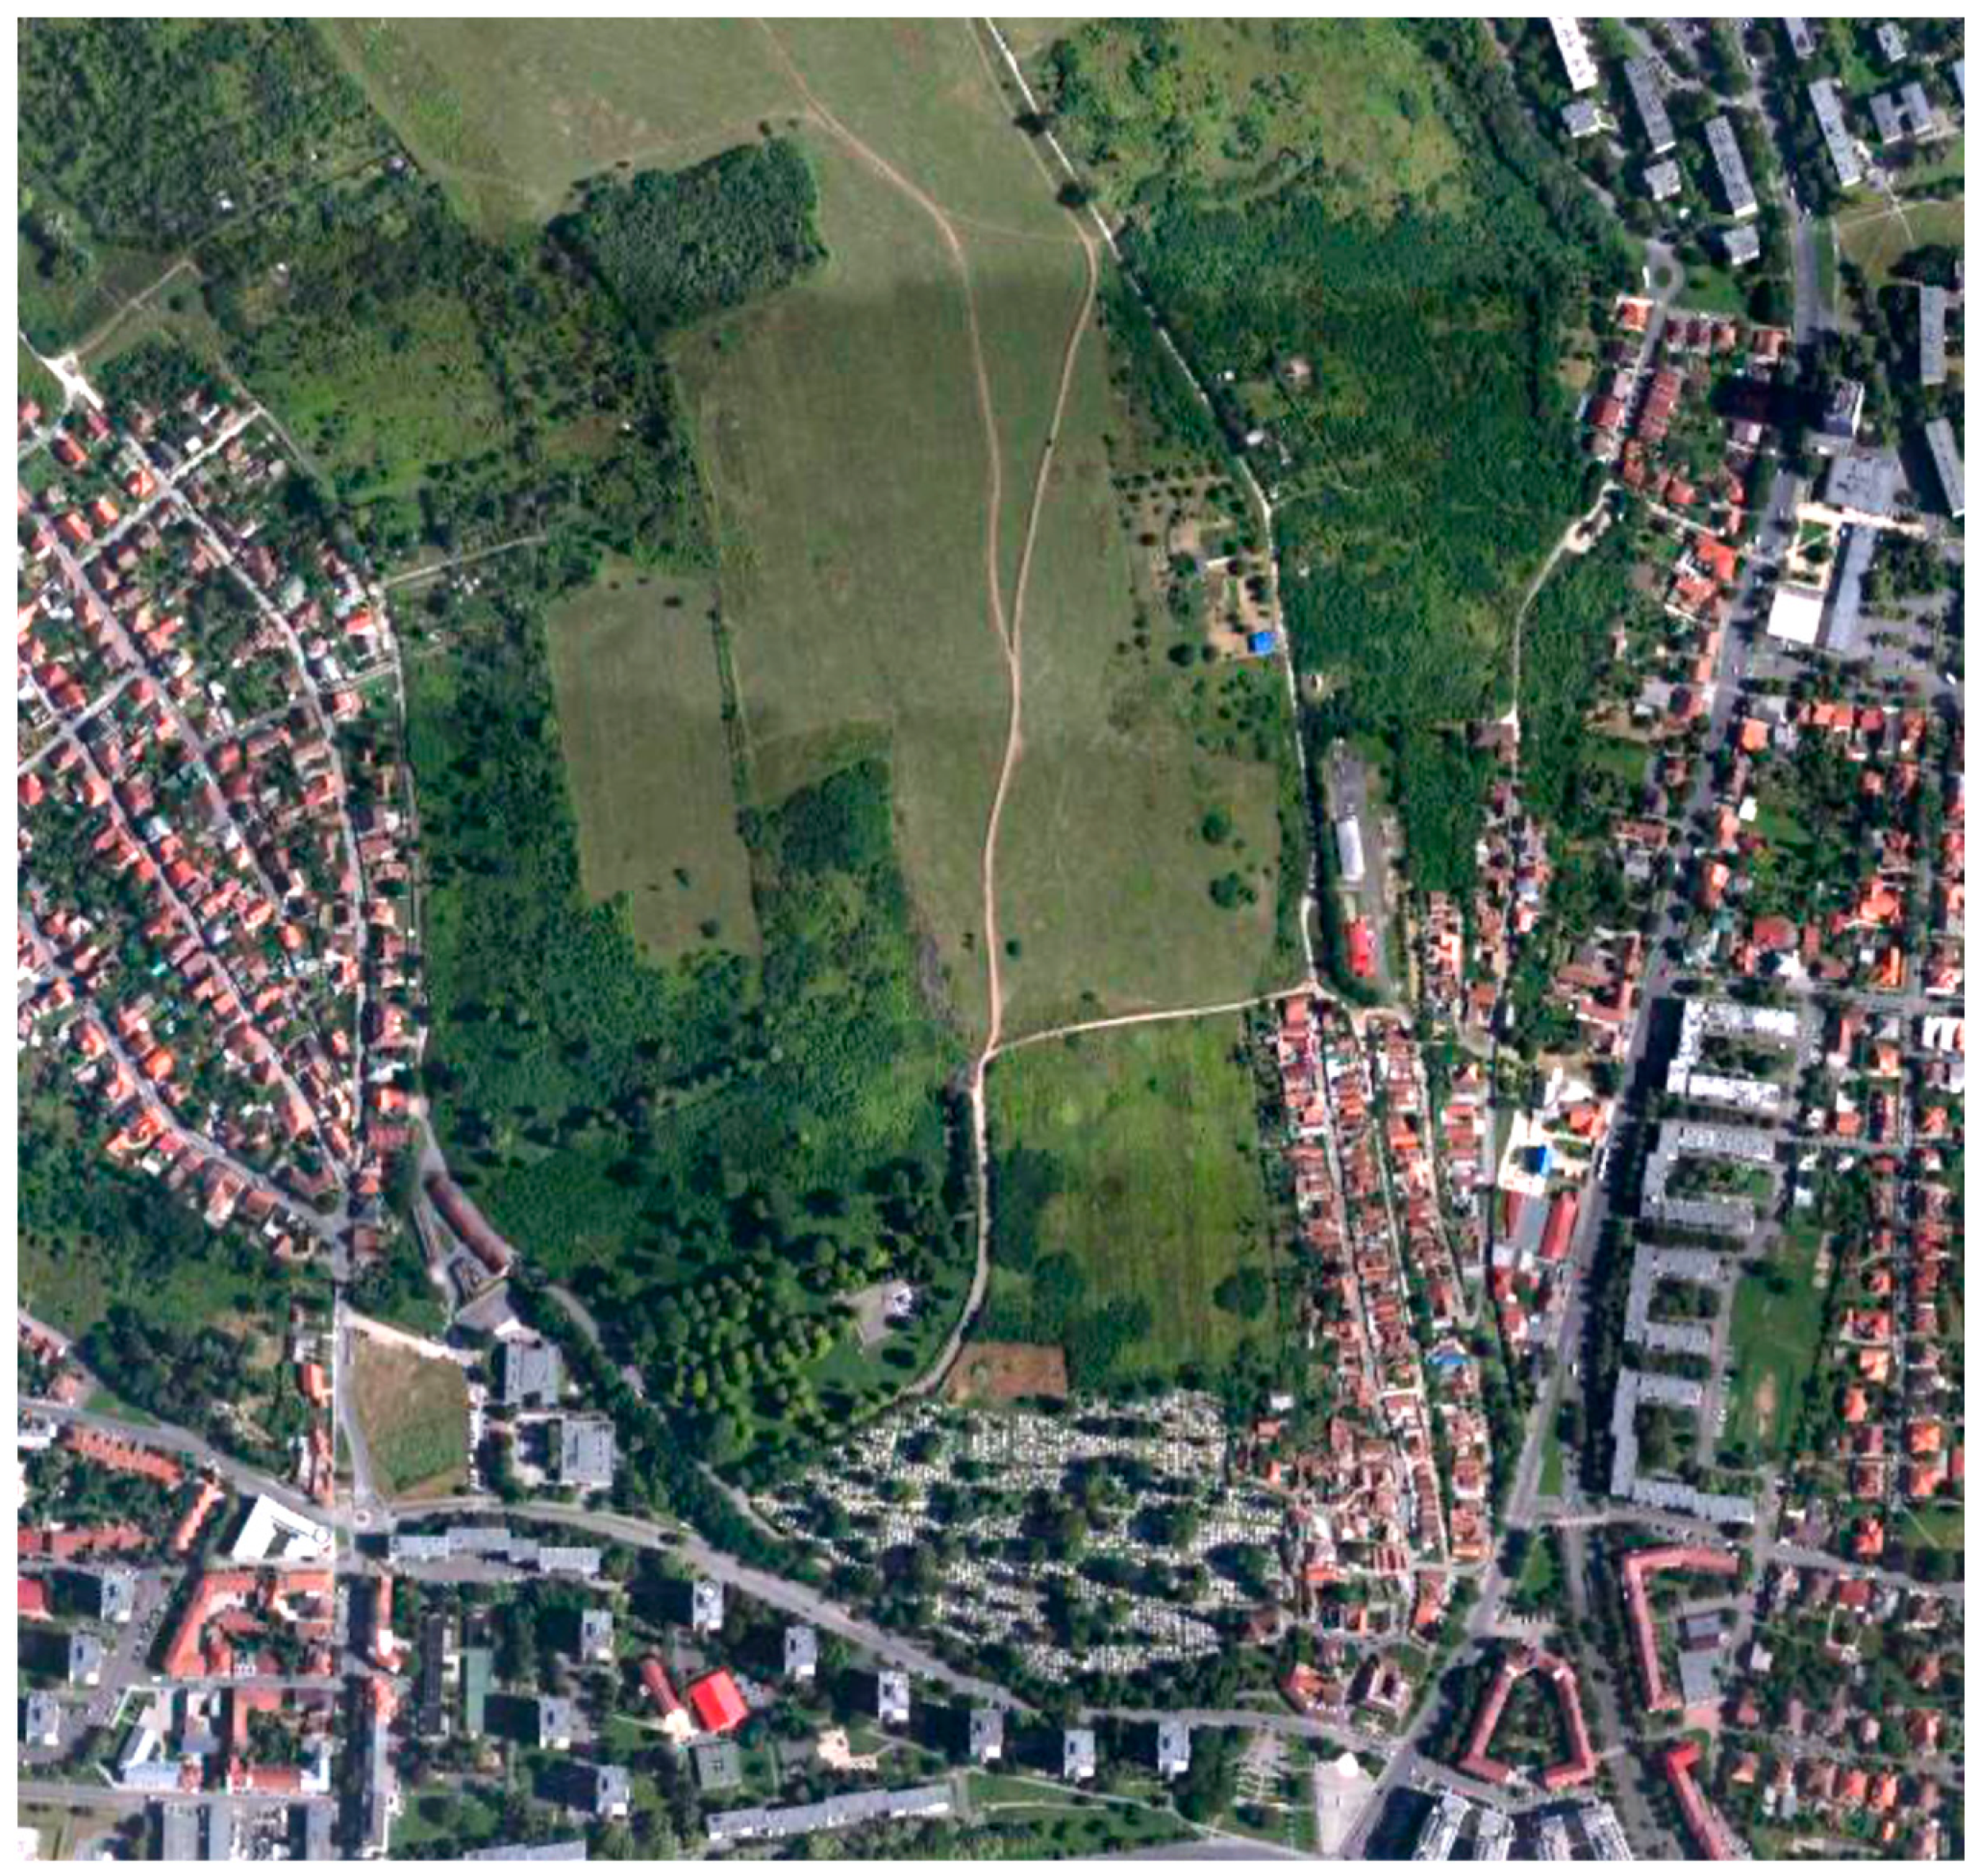
To the south of this area are two cemeteries, followed by a smaller housing estate consisting of high-rise prefabricated buildings. Further south lies the city centre, characterised by (Ac) and (Aa) tissue types. To the east is a relatively dense but fragmented and segregated zone of low-rise buildings, bordered by a major, heavily trafficked road. To the west is a residential area of detached houses, while to the north is the settlement’s boundary—an undeveloped area (Figure 36).
In comparison to the generic experiment, one simplification is that the algorithm in this case includes only one type of cluster with five plots. The distance between the plot series and the input points is defined individually for each plot series (process control). Where the distance is zero, the plot series are directly connected to one another, allowing for arrays of 10 or 15 plots. When the distance is not zero, a new street opens between the plot series.
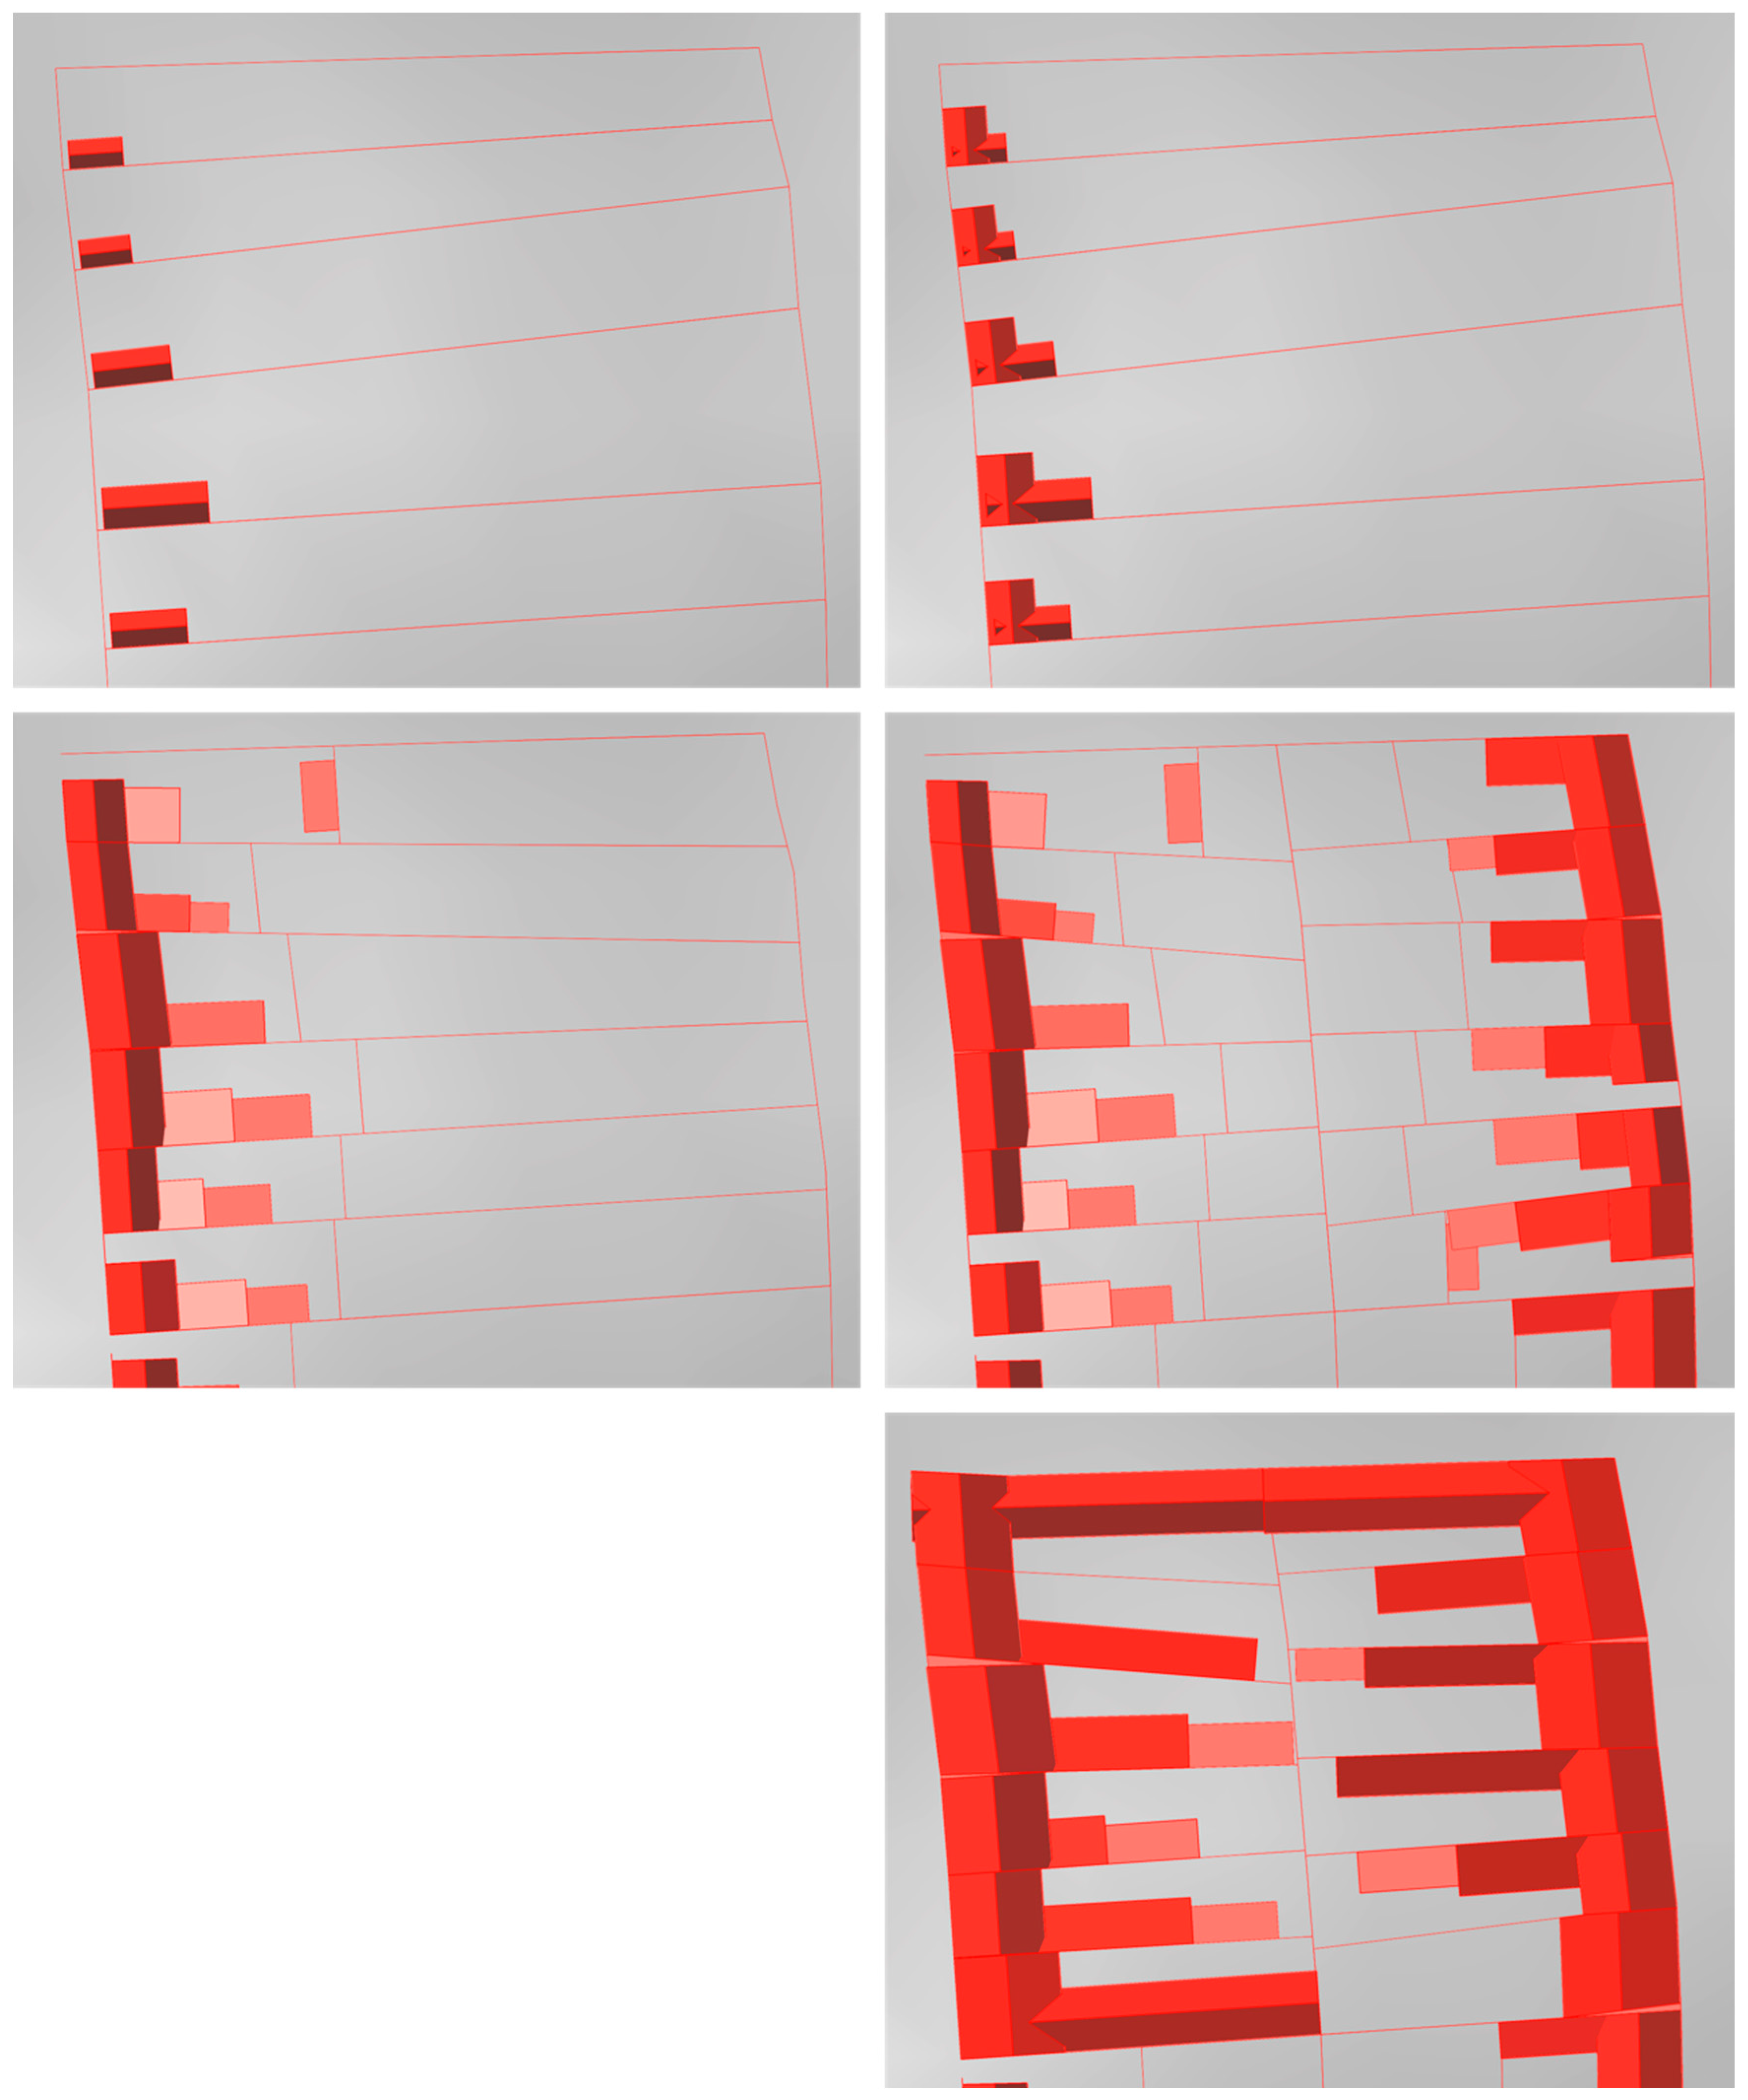
This single cluster incorporates all tissue types, which are activated as needed: the keyboard, keyboard-dense, Lovra-Ac, Lovra-Ac with buildings on both sides, and Ac-dense. Consequently, the entire area is composed of multiple instances of one single interconnected cluster (Figure 37).
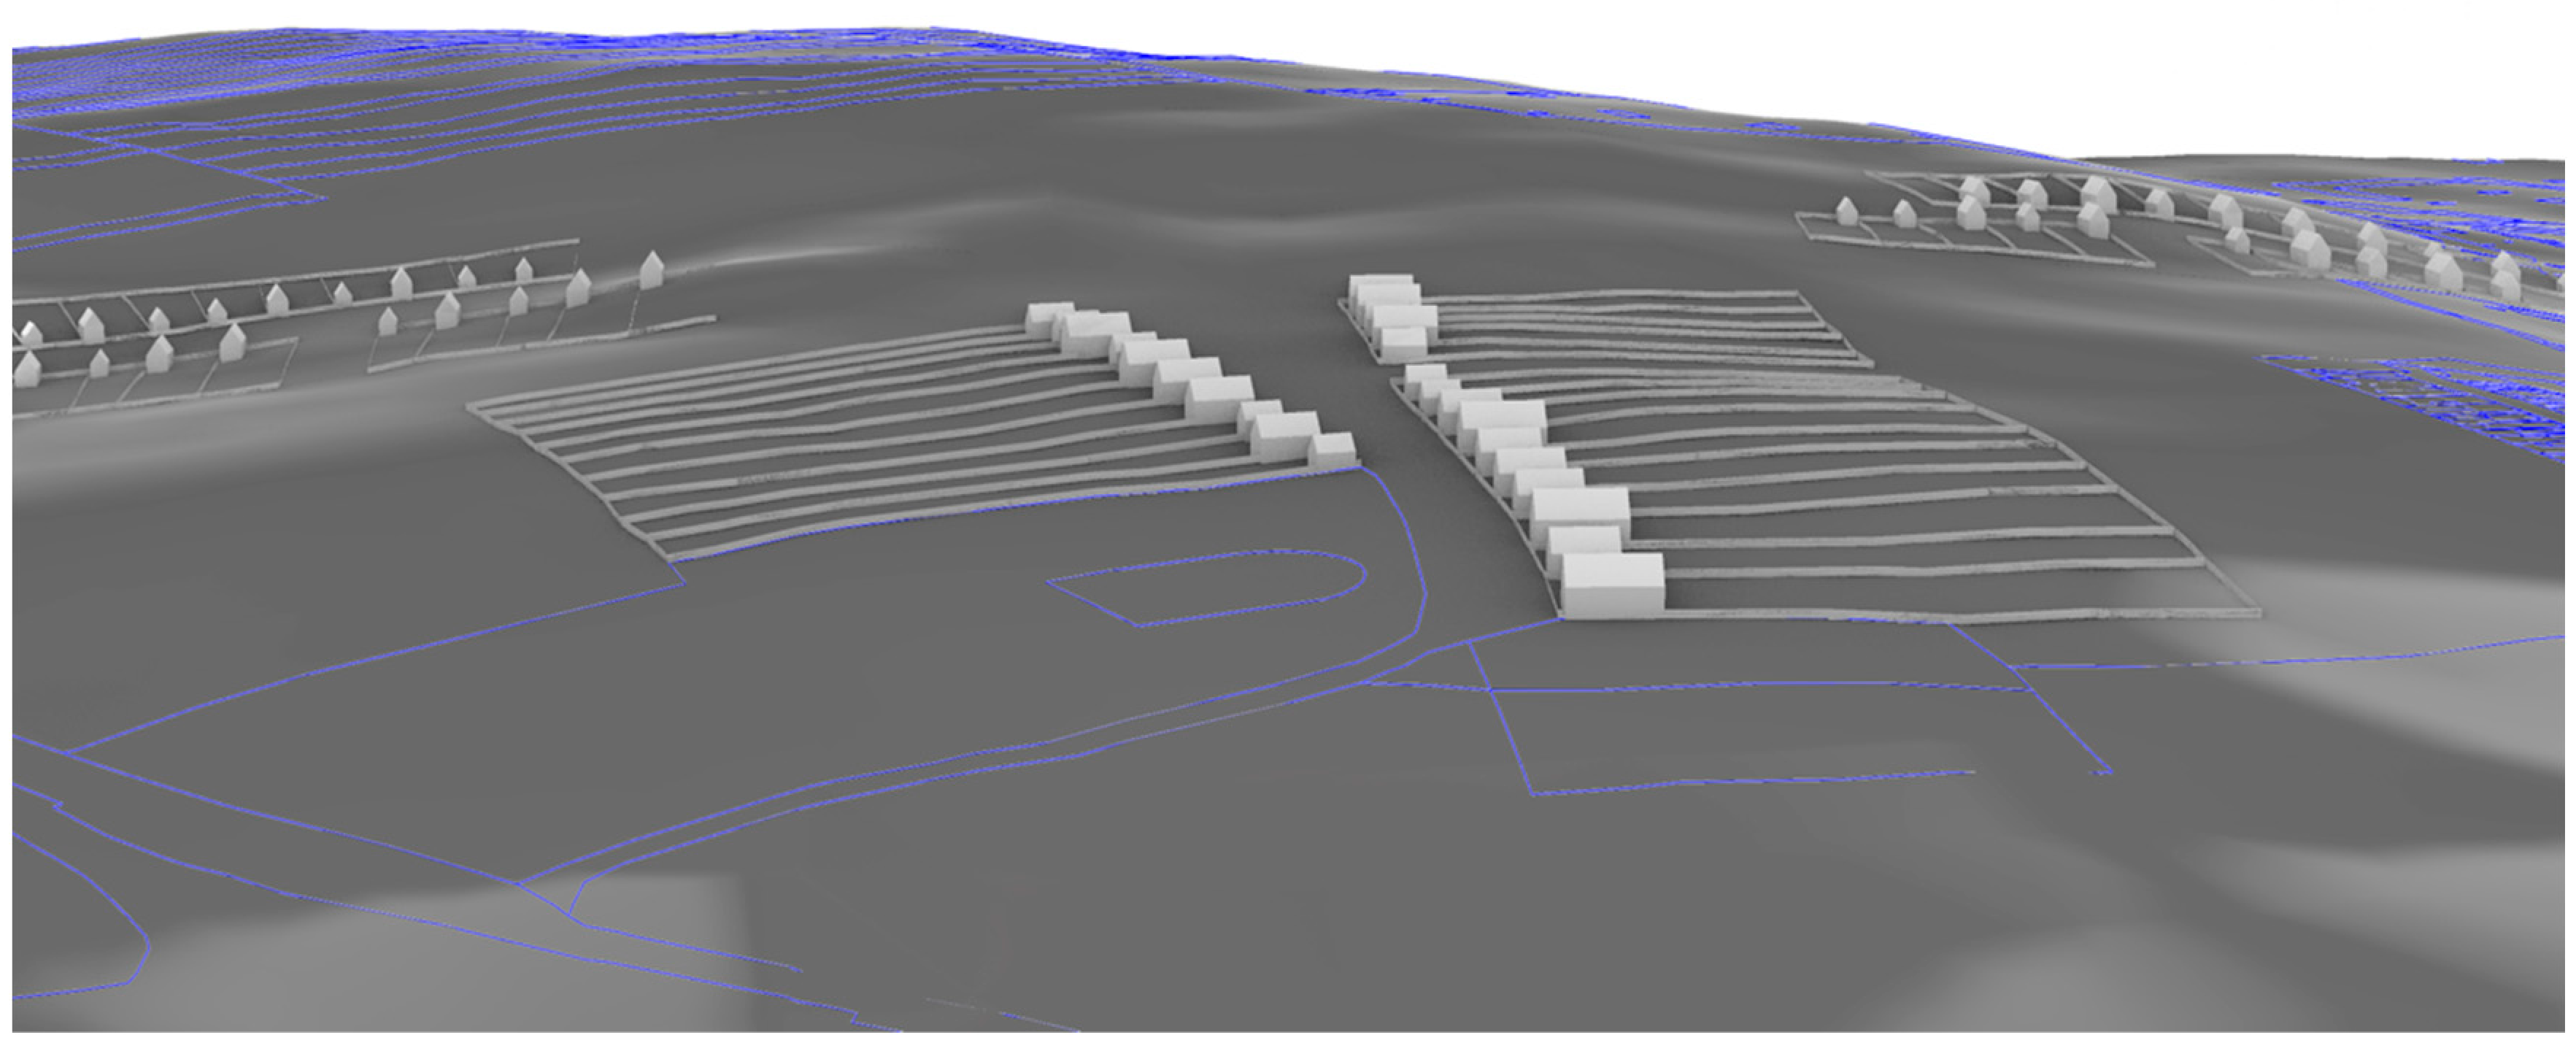
Another distinction from the generic model is that this version follows the natural terrain. The area’s topography was downloaded from the OpenStreetMap database using Blender’s QuickOSM plugin, then imported as a mesh into Rhinoceros, and defined as an input element in Grasshopper. In this way, the algorithm first generates the plot structure and buildings on a flat plane (the zero plane), then projects this structure onto the surface of the mesh, and extrudes the resulting polylines in the Z direction (to create fences). For buildings, a straight line extends in the Z direction from the centre of gravity of the building contours, and the algorithm raises the building to the point where these lines intersect with the terrain. The buildings include footings, which, as in real life, are partially below and partially above the terrain.
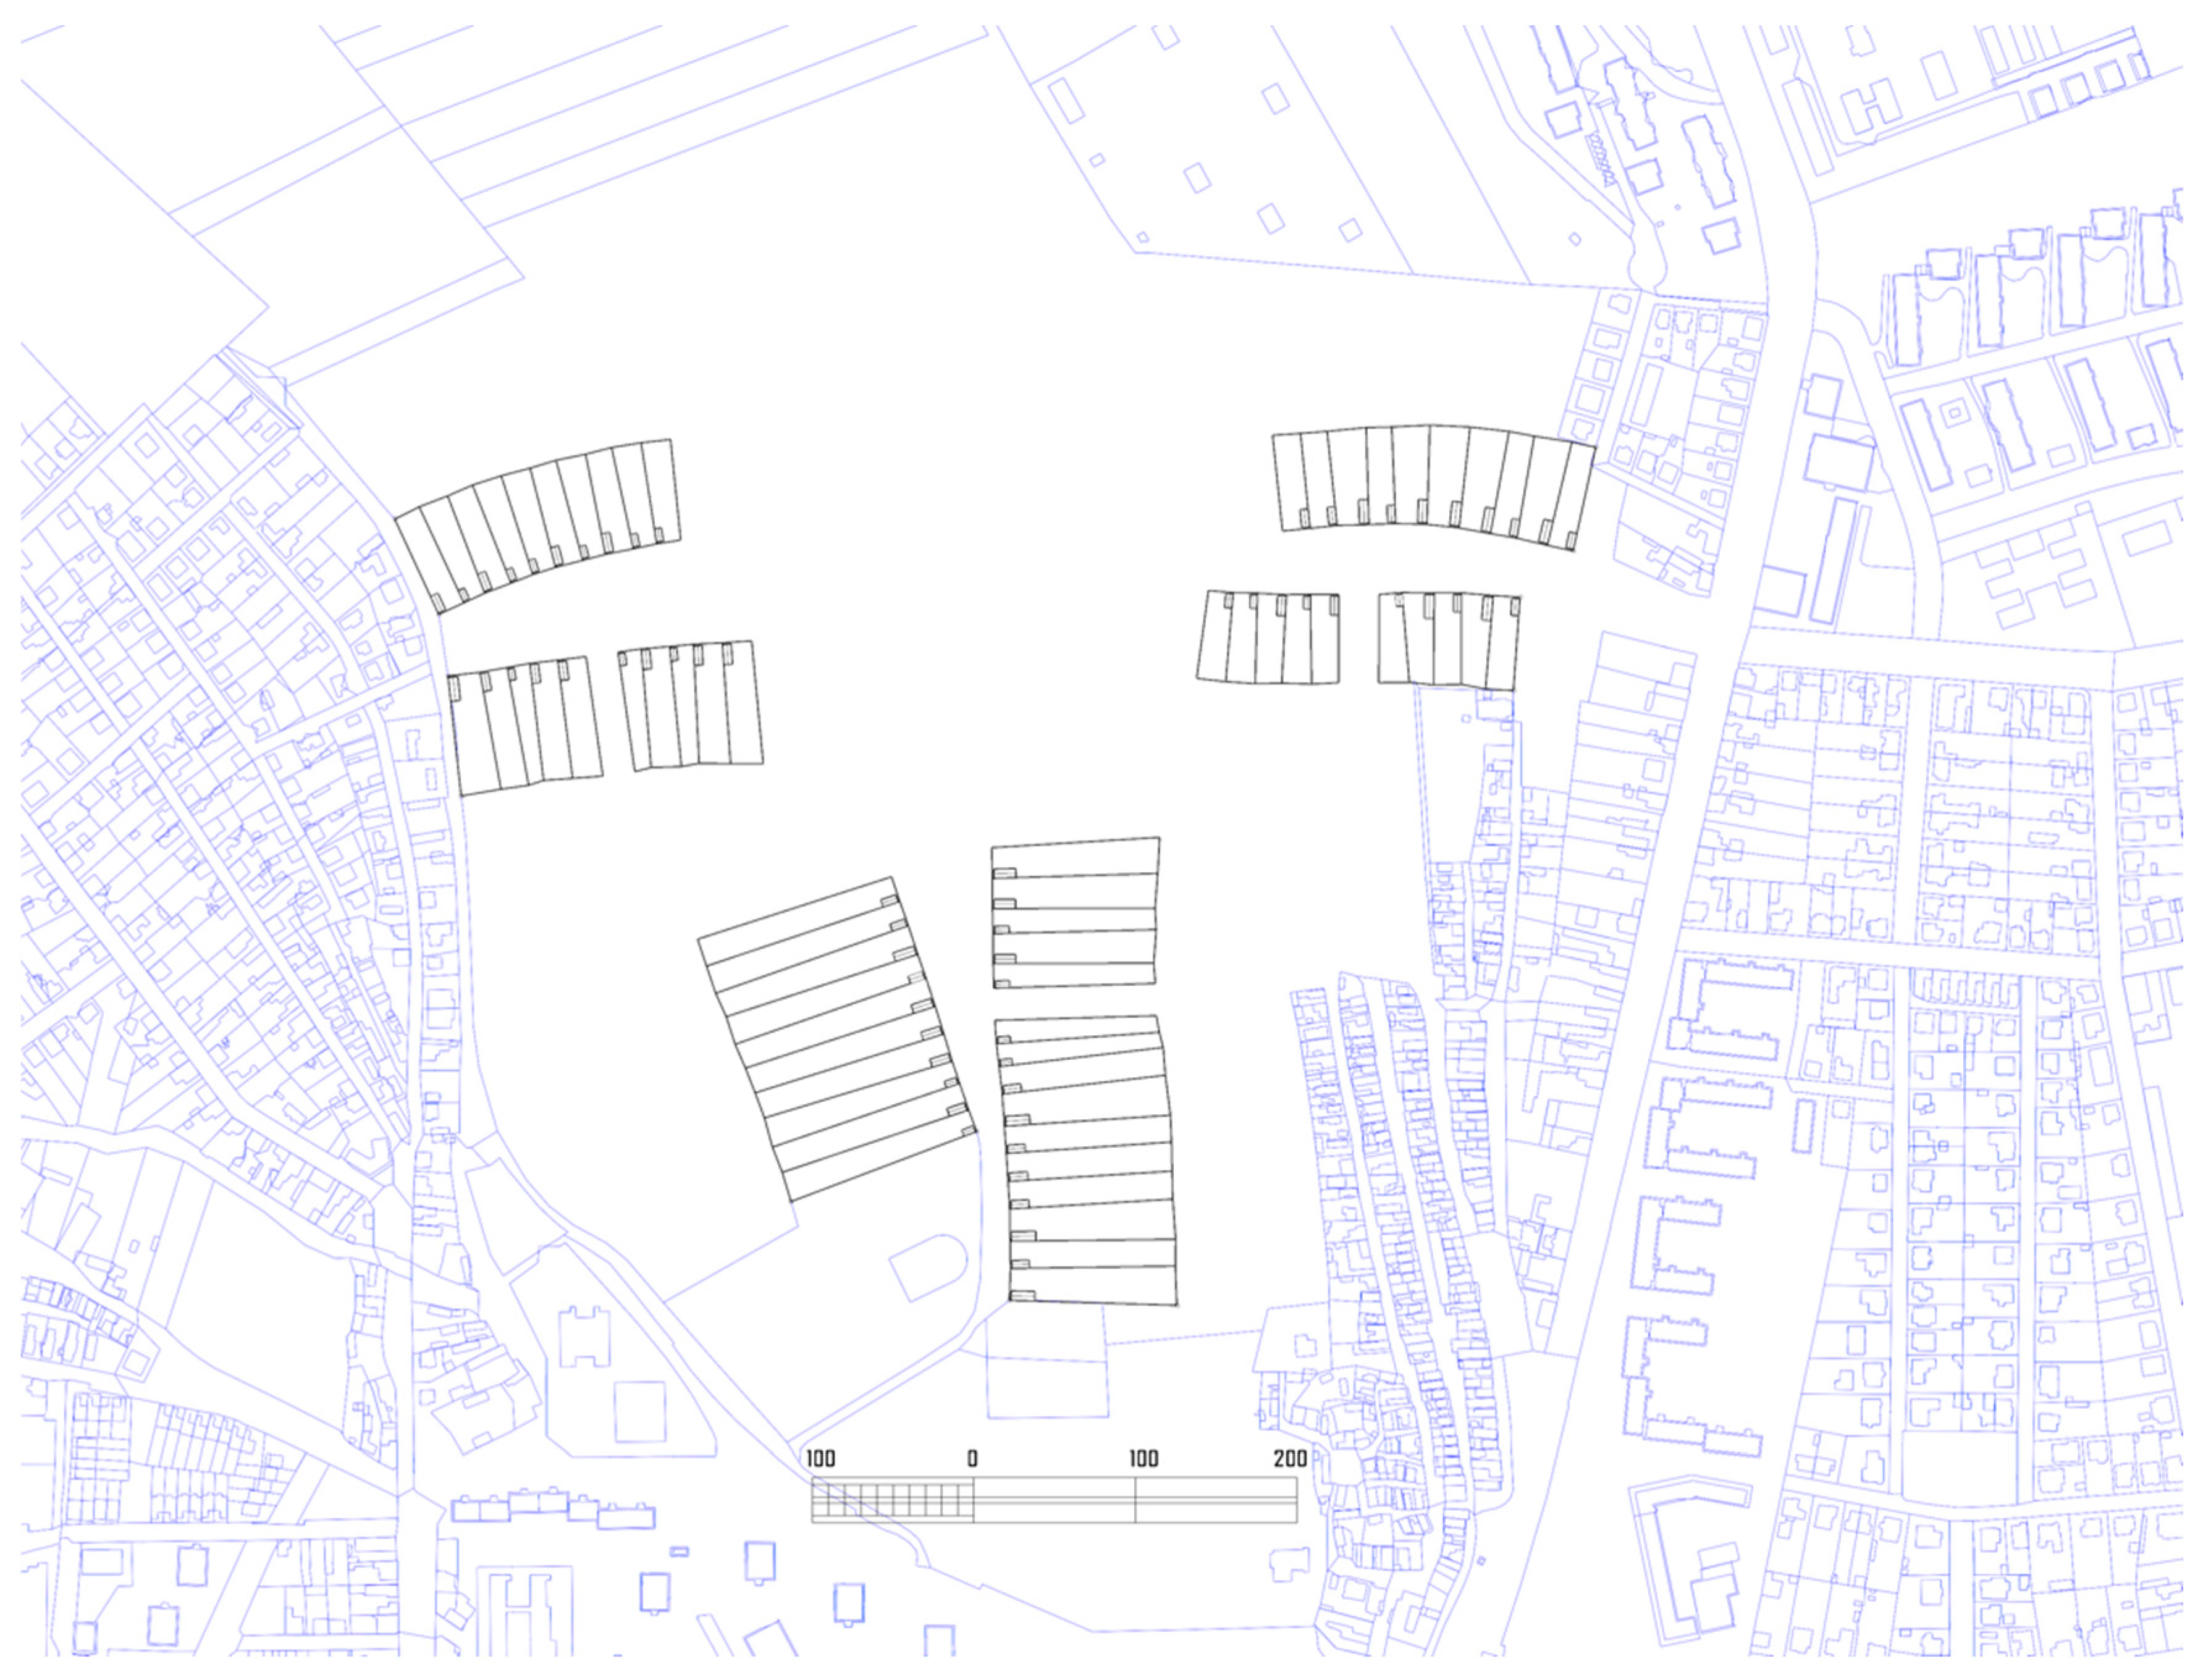
As in the previous chapter, the growth is generated in five increments but only in one version. In the first step, the initial plot series appear with the simplest keyboard tissue, following the existing streets connected to the borders of the area. The entry points are as follows:
  • in the south, an unnamed street between the Heroes’ Cemetery and the Plank Cemetery (Deszkatemető);
  • in the east, the continuation of Leventevezér Street;
  • in the west, Pilis street.
A conceptual difference from the generic model is that, due to the specific conditions, growth here does not start from the centre and radiate outward but instead begins at the edges and moves inward. As a result, the earliest plot series do not become denser immediately; rather, densification begins when the multidirectional growth converges in the centre. This allows for a subtle, gradual transition from the surrounding low-density areas to the relatively dense new sub-centre.
In a manner similar to the historical development of Miskolc discussed earlier, the buildings in the initial plot series are situated only on one side of the street frontage, with the ends of the plots facing public spaces. A key step in densification occurs when buildings begin to appear on the rear side of certain plot series, naturally leading to a reorganisation of the plot system. In this model, this step always occurs within the (Ac) tissue, and further densification, characterised by (Ac-dense) tissue, takes place only in blocks where buildings are already present on both the front and rear sides. This is followed by the (Ac-dense) tissue enclosing the lateral sides of the plots, thereby creating closed perimeter blocks.
Although the structure grows organically, each increment is punctuated by a designer’s decision regarding the input for the next step. Particular emphasis is placed on identifying emerging spaces that could become urban squares or public parks. In contrast to the freestanding public buildings in the generic model, public institutions in this model are not predefined; they can be located in buildings surrounding the main square or other squares. This approach reflects how public buildings are typically integrated into residential areas in organic cities, such as Miskolc, where mixed-use is common: public functions can and do occupy the ground floors of residential buildings. The model does not specify which buildings serve as public institutions, leaving this task to a subsequent phase of development planning.

3.2.1. First Increment

In the first increment, a few plot series emerge, connecting the area via the aforementioned streets. The urban layout is very basic, employing the simplest tissue type—the “keyboard” (Figure 38 and Figure 39).

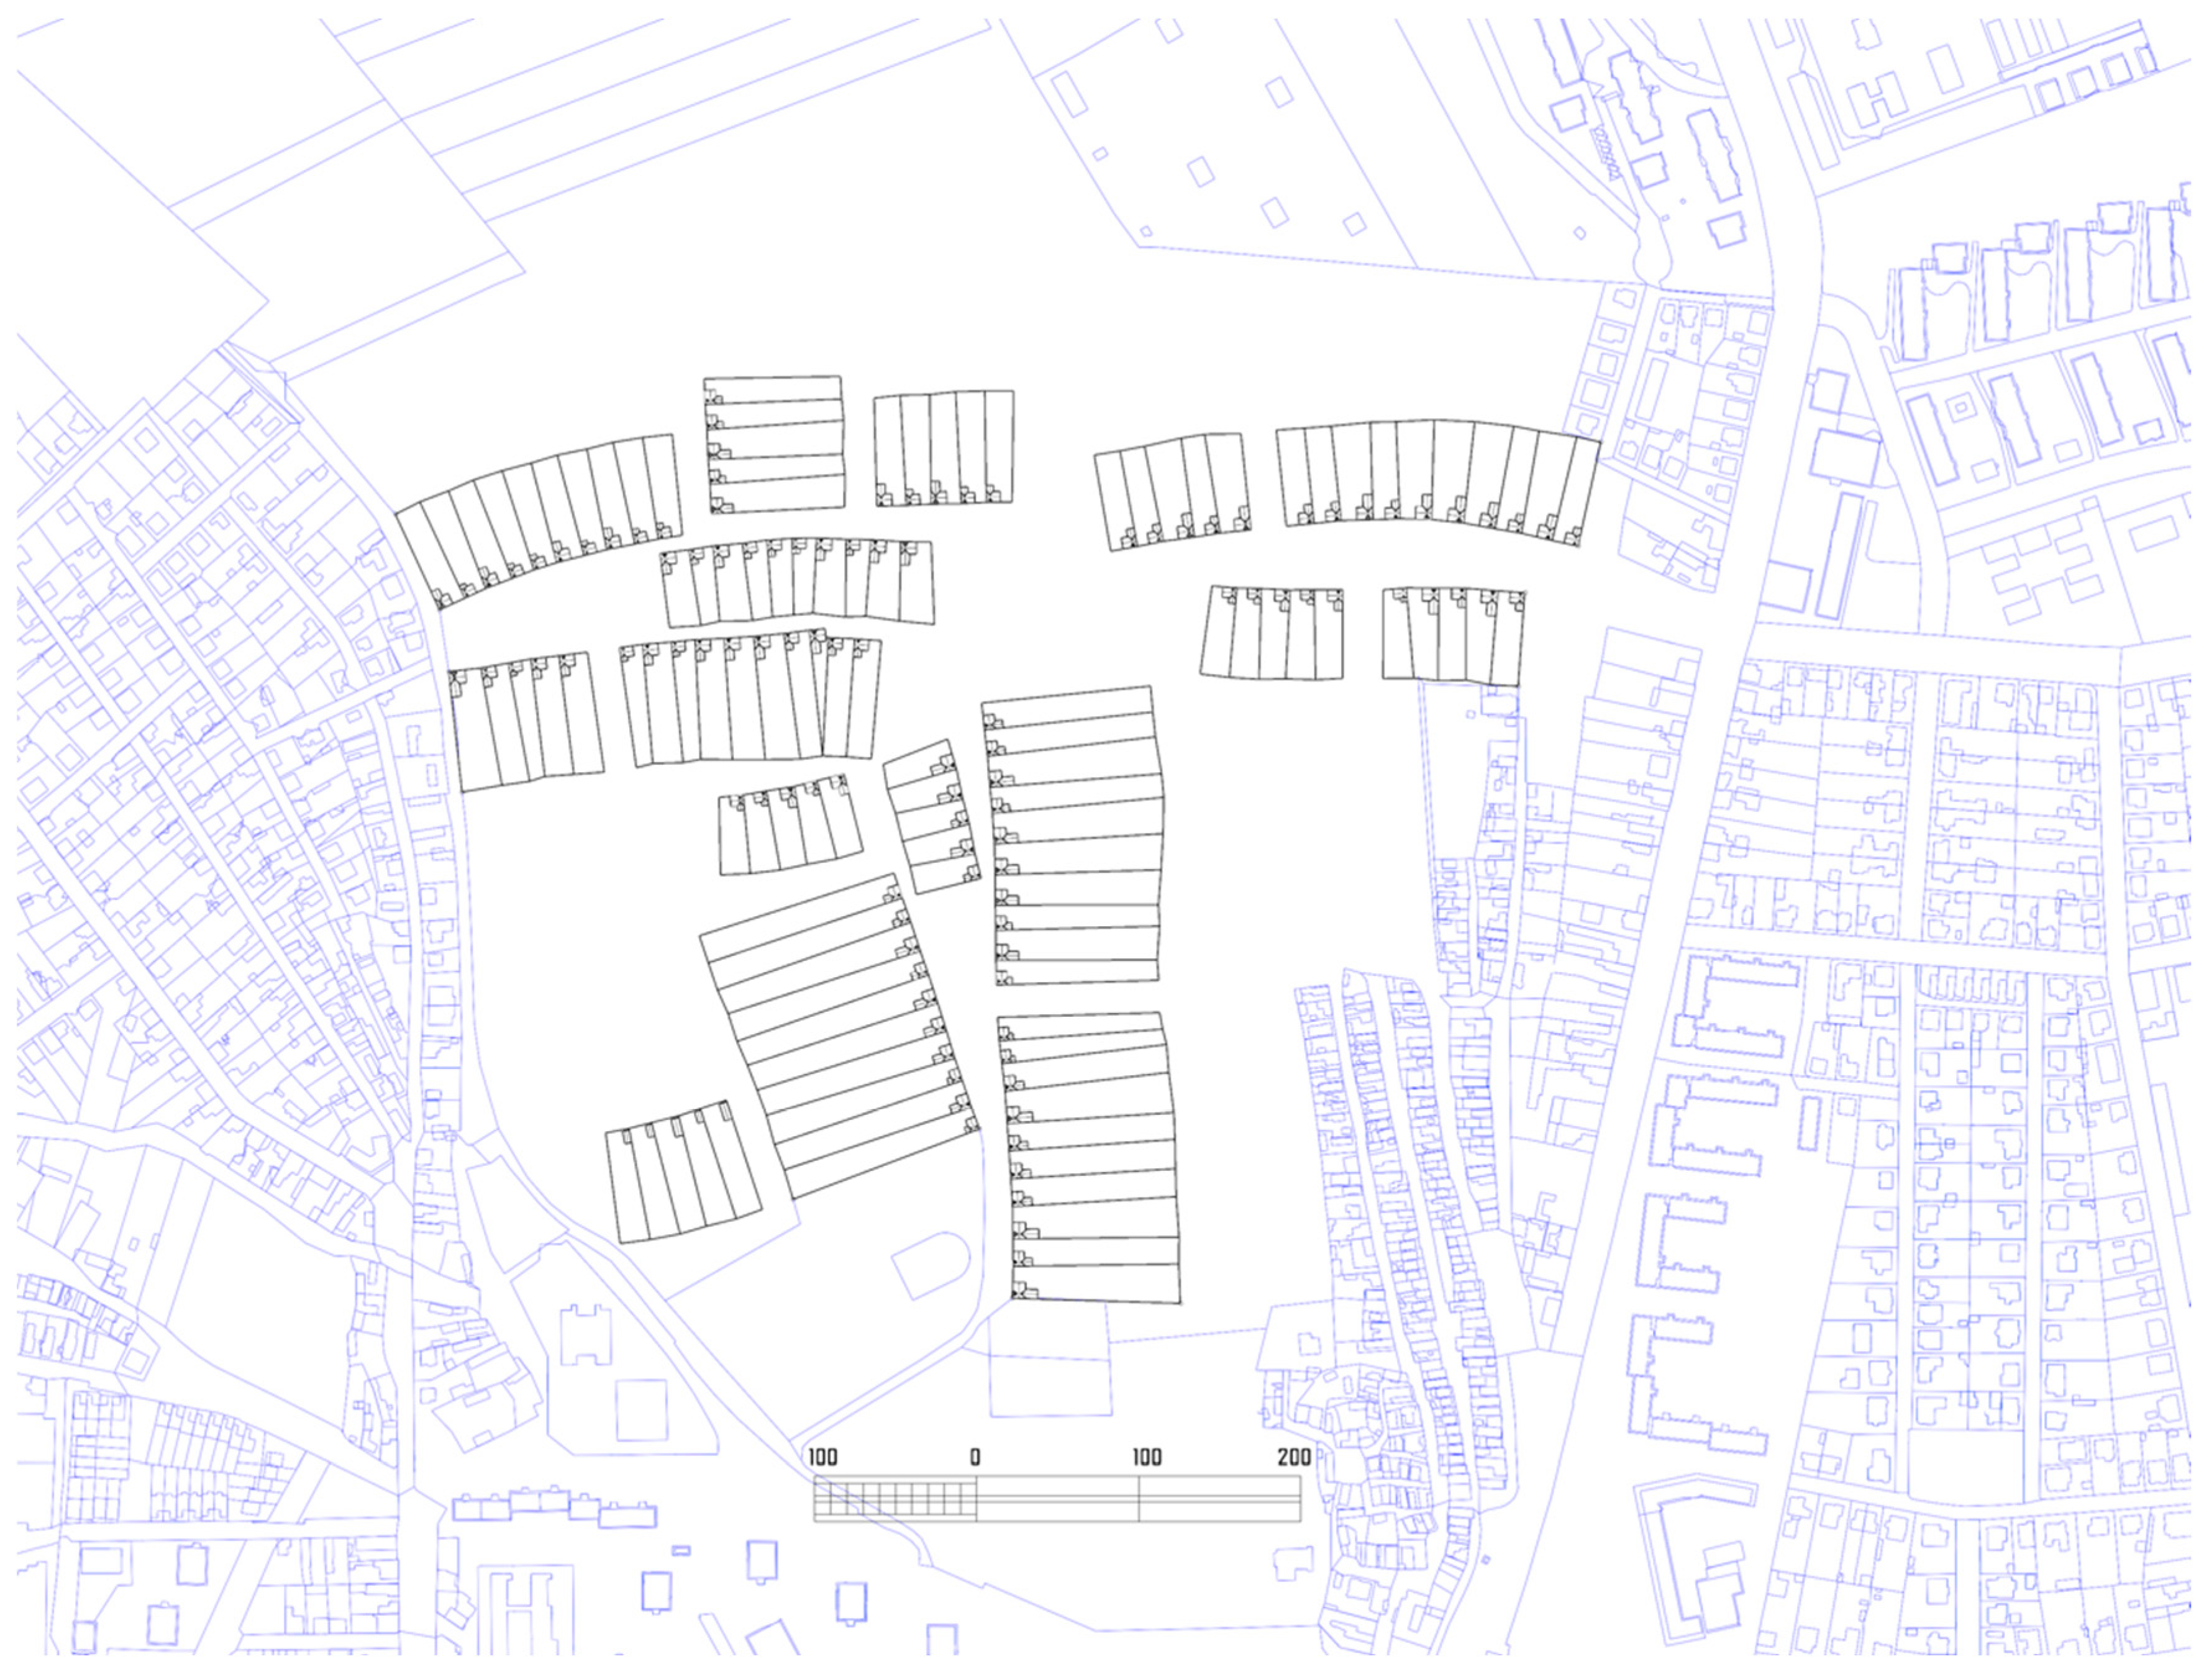
3.2.2. Second Increment

In the second increment, the plot series originating from three sides converge in the middle, forming the nucleus of a main square. On some plot series, the front wings of buildings appear, indicating a denser version of the keyboard tissue (Figure 40 and Figure 41).

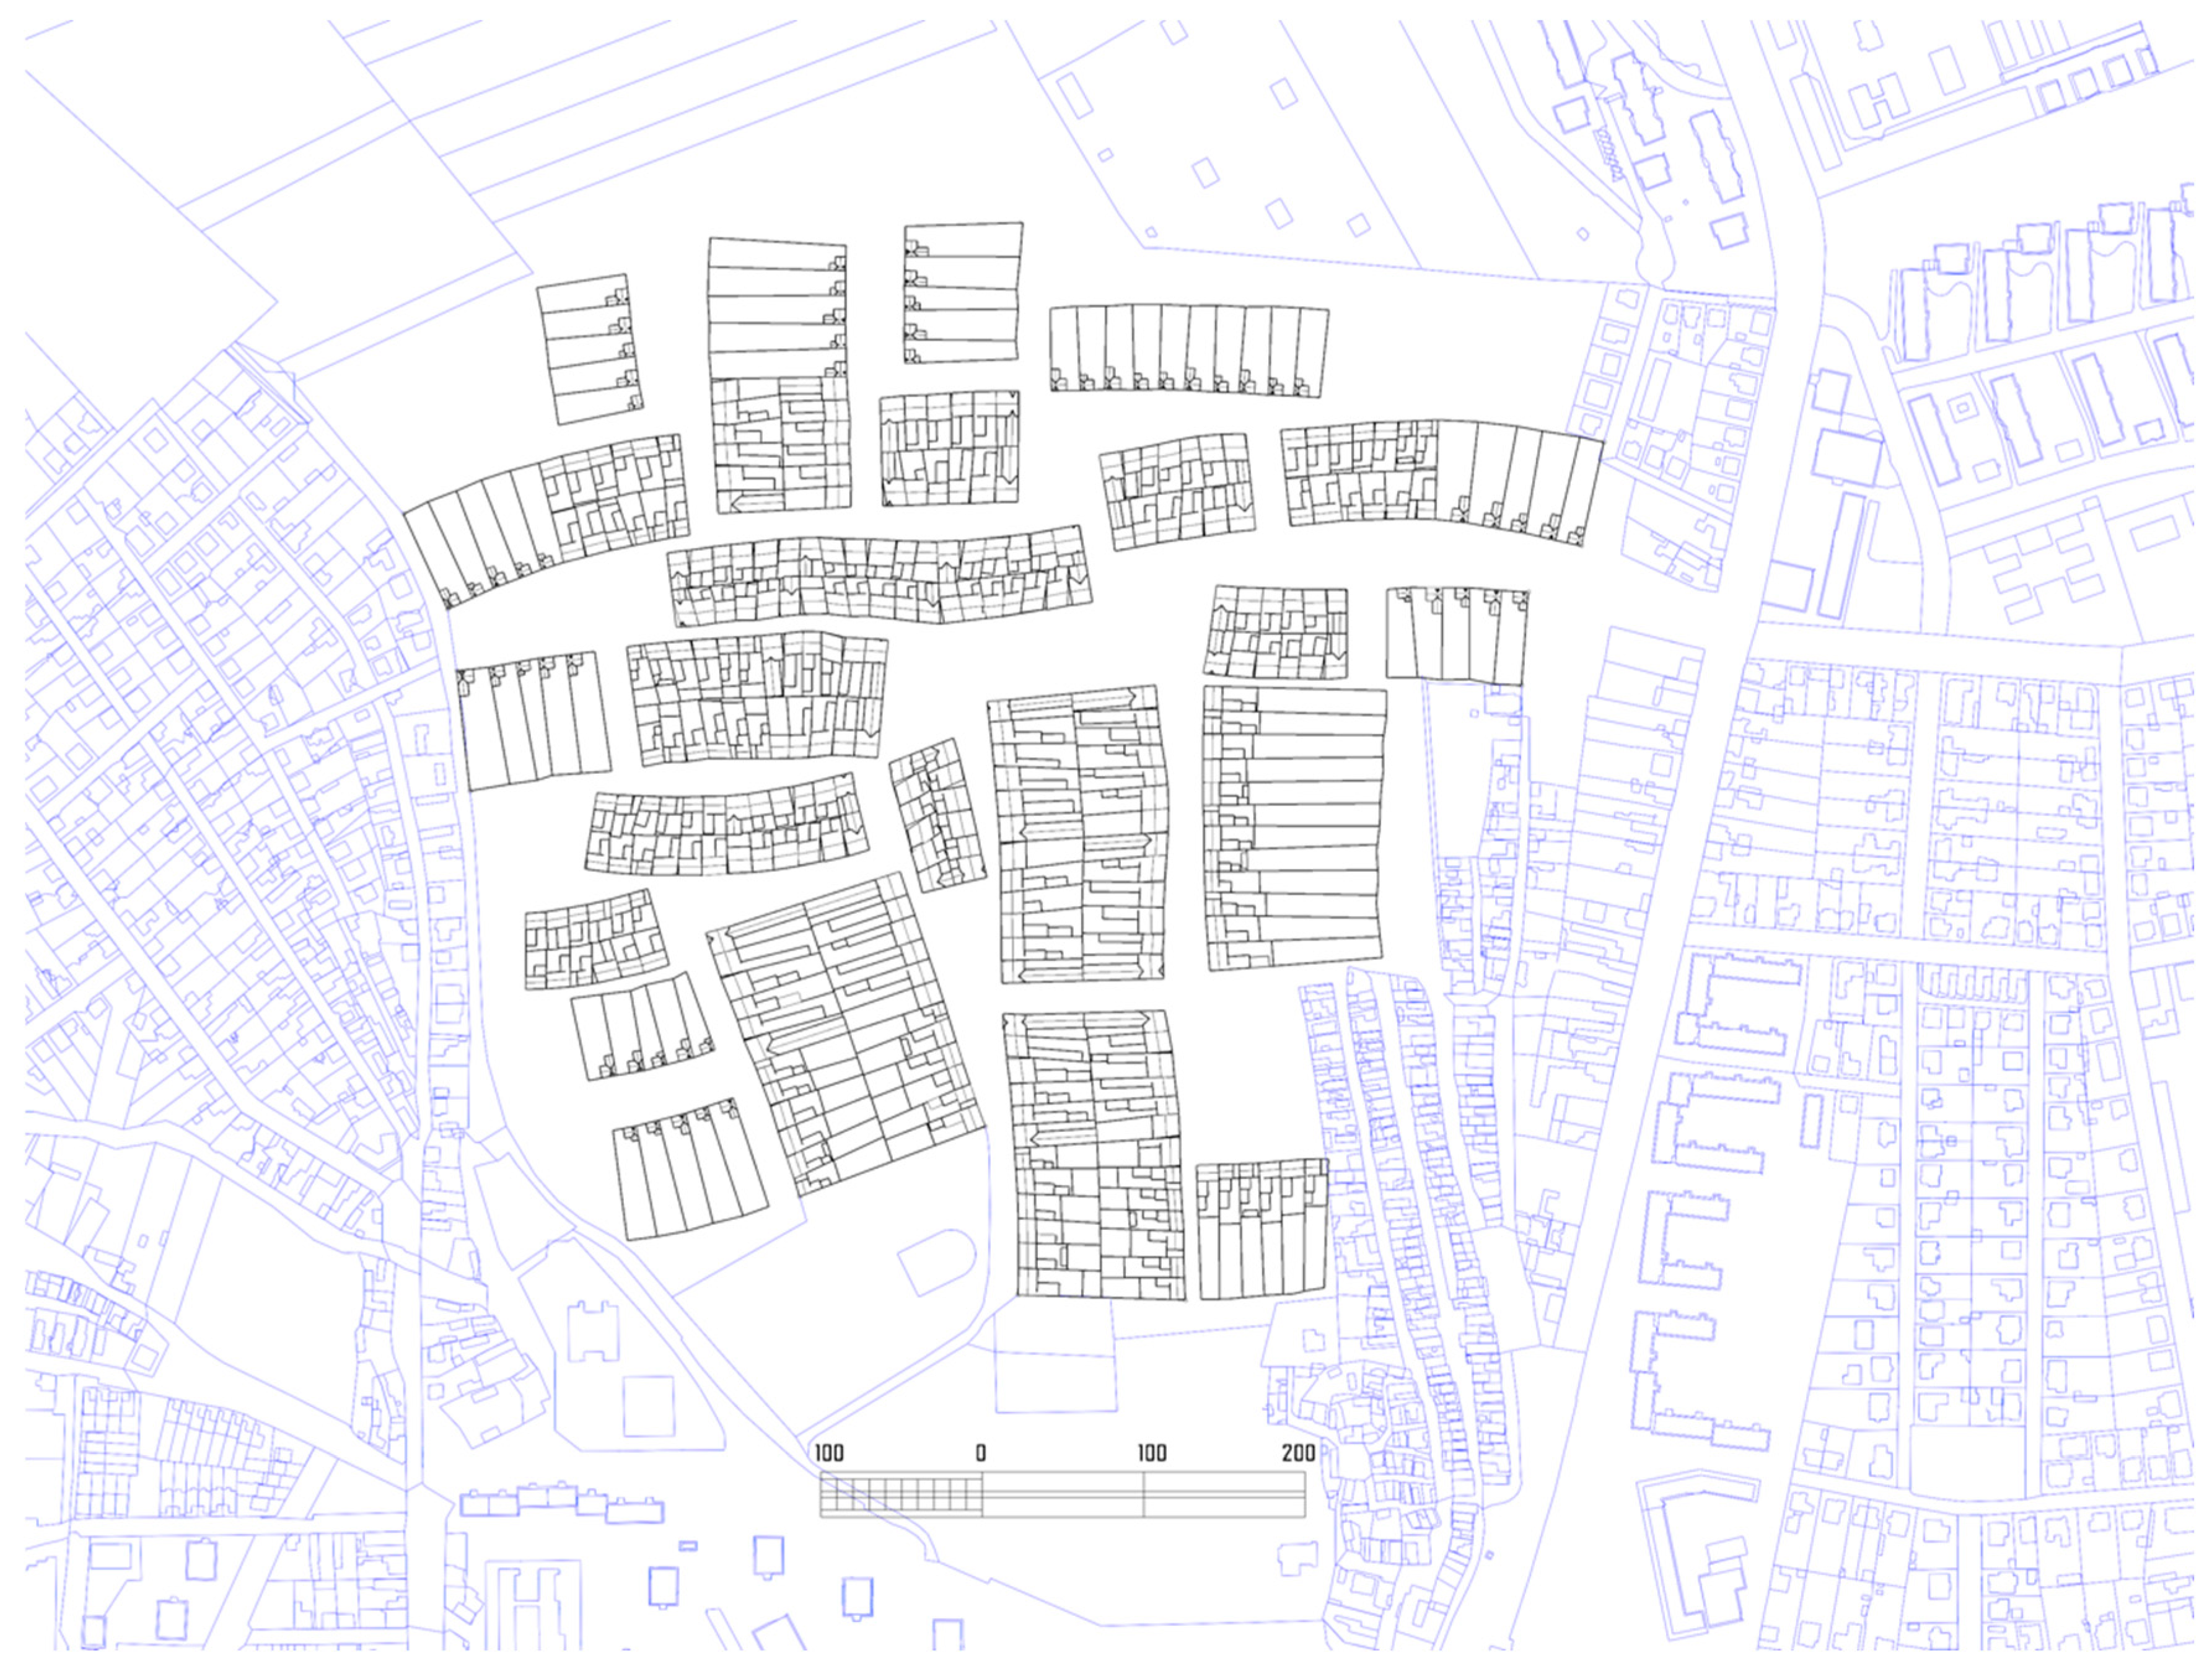
3.2.3. Third Increment

In the third increment, new blocks emerge, but more significantly, the centre of the new neighbourhood begins to take shape. The main square becomes clearly visible, and the blocks surrounding it start to densify (tissue: Lovra-Ac). The buildings in each block still face only one street. Smaller squares, or sub-centres, also begin to form (Figure 42 and Figure 43).

3.2.4. Fourth Increment

In the fourth increment, additional plot series emerge on the periphery. Meanwhile, densification continues in the centre, with buildings appearing at the rear of the blocks. The development reaches the boundaries of the area, leaving some open (green) spaces on the outskirts of the new district (Figure 44 and Figure 45).

3.2.5. Fifth Increment

In the fifth increment, no new plot series are created, but the central area continues to densify (tissue: Lovra-Ac-dense) with closed perimeter blocks forming. The periphery remains less dense. The (irregular) main square is fully enclosed, as are some smaller squares. The densest area is surrounded by less dense blocks (tissue: Lovra-Ac), followed by the more loosely organised housing of the keyboard tissue interspersed with green spaces (Figure 46 and Figure 47).

4. Discussion

The procedural modelling of cities and urban development is currently a highly significant topic. This is evidenced by the fact that prominent professional conferences, such as the Space Syntax Symposium, have dedicated special sub-sections to the subject for several years [37]. Moreover, at the leading urban morphology conference, the International Seminar on Urban Form, presentations addressing this topic have increased year by year [38,39]. Several research groups are actively exploring this field (e.g., Genesis Lab: https://genesis-lab.dev; SkylineEngine: https://ggg.udg.edu/skylineEngine; Cornell Environmental Systems Lab: https://es.aap.cornell.edu) (all accessed on 18 October 2024); and companies are offering these services commercially.
To mention a few generative experiments, Bellomo and Terna conducted time-sensitive simulation modelling [40], while at the mesoscopic scale, Raimbault introduced a generative model of urban growth [41]. The method presented in this article is perhaps most closely aligned with the Shape Grammar approach, particularly in its reliance on the morphological analysis of existing urban fabrics and its focus on the urban block as the fundamental unit [42].

5. Conclusions

The generative experiments demonstrated that with appropriate analyses and by following and supplementing the principles of the Miskolc Workshop, it is possible to develop algorithms that generate structures resembling the selected urban fabric. These case studies have shown how the evolution of an organic city can be modelled and how the algorithms can be used to generate preliminary urban layout plans for real locations. Although the city of Miskolc was used as a template, the result of the first case study is not Miskolc itself but rather a generic Central European city, similar to other cities where these tissue types are found. The algorithms also incorporate controlled randomness to model organic urban development and morphogenesis. The tissues described in this article originate from Central European cities, but the method is equally applicable to modelling organic tissues worldwide, following appropriate analyses and descriptions of the urban tissues in question. Thus, the method can be applied to any organic city globally, provided the relevant morphological characteristics and tissue types have been analysed and described [43].
The main limitation of the presented method lies in its reliance on the physical form of settlements and their elements, as is typical in the science of urban morphology, making it inherently geometrical in nature. The formation and evolution of plots, as well as the shapes and forms of buildings, result from geometric processes. The buildings themselves appear without detail, represented only by their bounding forms, akin to a low-resolution model. Therefore, the generated urban fabric serves merely as a starting point, requiring manual refinement and modifications in the subsequent phase to create a viable development plan.
A key question is the role AI might play in this method. Current generative AIs operate as black boxes, producing results based on prompts without revealing the underlying process. In contrast, the Simulated Morphogenesis method aims to model and understand the process itself. In this context, AI could assist in the initial analytical step. It is conceivable that a well-trained pattern recognition algorithm could identify, catalogue, and describe characteristic urban fabrics in a given area based on a map or aerial photograph, although this remains a future prospect.
Another potential advancement could involve incorporating additional input parameters, such as building orientation for sunlight, the provision of adequate green spaces beyond a certain number of plots, or the introduction of various public functions once a specific number of plots is reached. Moreover, the model presented in this article follows topography but does not respond to it. An input parameter worth implementing could be slope gradients, ensuring that streets with a slope exceeding a certain degree are not generated.
Although not included in the presented model, experimental attempts during the research aimed to integrate Space Syntax measures [25]. In such cases, the street network is generated first, based on appropriate integration values, rather than being formed through the aggregation of plots and plot blocks. The advantage of this approach is that it allows the integration pattern of the area to be fine-tuned. However, it poses greater challenges in incorporating time as a factor, which is why it was ultimately excluded from the method, which focuses on step-by-step growth.
Another potential improvement, mentioned earlier in this article, would be to reinforce the fractal nature of the generated city in larger-scale urban experiments by algorithmizing various hierarchically organised urban tissues and establishing sub-centres or even sub-sub-centres. In such cases, distance from the centre could serve as an input parameter, with certain urban tissue types, such as lower-density suburban tissues, only appearing further from the city centre.

Funding

The publication of this article was funded by the University of Debrecen.

Data Availability Statement

Not available.

Conflicts of Interest

The authors declare no conflicts of interest.

References

  1. Jiang, F.; Ma, J.; Webster, C.J.; Chiaradia, A.J.; Zhou, Y.; Zhao, Z.; Zhang, X. Generative urban design: A systematic review on problem formulation, design generation, and decision-making. Prog. Plan. 2024, 180, 100795. [Google Scholar] [CrossRef]
  2. Rudofsky, B. Architecture Without Architects, an Introduction to Nonpedigreed Architecture; The Museum of Modern Art: New York, NY, USA, 1964. [Google Scholar]
  3. Negroponte, N. The Architecture Machine: Toward a More Human Environment; MIT Press: Cambridge, MA, USA, 1973. [Google Scholar]
  4. Hillier, B.; Hanson, J. The Social Logic of Space; Cambridge University Press: Cambridge, MA, USA; New York, NY, USA; Melbourne, Australia; Madrid, Spain; Cape Town, South Africa; Singapore; São Paulo, Brazil, 1984. [Google Scholar]
  5. Bodonyi, C.S. Bodonyi Csaba; Vallomások… Architectura; Kijárat Kiadó: Budapest, Hungary, 2006. [Google Scholar]
  6. Vámossy, F. Építészet a társadalmi rendszerváltás idején 1945–1949. In A 20. Század Magyar Építészete, 1902–2002: Örökségünk Értékei; Tarsoly Kiadó: Budapest, Hungary, 2016; pp. 187–218. [Google Scholar]
  7. Prakfalvi, E. A huszadik század második fele. In Magyar építészet a Szecessziótól Napjainkig; Hollósi, N., Ed.; Magyar építészet; Kossuth Kiadó: Budapest, Hungary, 2004; pp. 94–179. [Google Scholar]
  8. Panerai, P.; Castex, J.; Depaule, J.-C. Le Corbusier and the Cité Radieuse. In Urban Forms. The Death and Life of the Urban Block; Routledge: London, UK; New York, NY, USA, 2004; pp. 114–123. [Google Scholar]
  9. Ferkai, A. Hungarian Architecture in the Postwar Years. In The Architecture of Historic Hungary; Wiebenson, D., Sisa, J., Lővei, P., Eds.; MIT Press: Cambridge, MA, USA, 1998; pp. 277–297. [Google Scholar]
  10. Hajdú, I. Miskolc kiépülése a 20. században. A Herman Ottó Múzeum Évkönyve 2018, LVII, 69–85. [Google Scholar]
  11. Kapusi, K. Panelházas lakótelepek Miskolcon. A Herman Ottó Múzeum Évkönyve 2012, LI, 153–162. [Google Scholar]
  12. Bereczki, Z. Városi térhasználat a miskolci Vörösmarty lakótelepen és az egykoron a helyén állott Gordon városrészben. Acta Med. Sociol. 2022, 13, 219–249. [Google Scholar] [CrossRef]
  13. Hajdú, I.; Nagy, S. (Eds.) Új város épül. Miskolc 1945–1975; Miskolci Galéria Városi Művészeti Múzeum: Miskolc, Hungary, 2010. [Google Scholar]
  14. Sulyok, M.; Bán, A. A Miskolci Építész Műhely; Terc Kft.: Budapest, Hungary, 2022. [Google Scholar]
  15. Sulyok, M. Az Északterv. In A Miskolci Építész Műhely; Terc Kft.: Budapest, Hungary, 2022; pp. 27–29. [Google Scholar]
  16. Bodonyi, C.S. Bevezetés az ÉSZAKTERV-nél működő Miskolci Építész Műhely munkáiba. Magy. Építőművészet 1988, LXXIX, 4–5. [Google Scholar]
  17. Bodonyi, C.S.; Bereczki, Z. Rekonstrukció és térteremtés: A bicentenáriumát ünneplő Miskolci Nemzeti Színház városépítészeti léptékű rekonstrukciója (1991–1997). Dűlő 2023, 33–47. [Google Scholar]
  18. Bodonyi, C.S. Varsói Konfrontációk. Magy. Építőművészet 1988, LXXIX, 58–59. [Google Scholar]
  19. Lynch, K. The Image of the City; The MIT Press: Cambridge, MA, USA, 1960. [Google Scholar]
  20. Jacobs, J. The Death and Life of Great American Cities; Random House: New York, NY, USA, 1961. [Google Scholar]
  21. Alexander, C. A City is Not a Tree. Archit. Forum 1965, 122, 58–61, 58–62. [Google Scholar]
  22. Sulyok, M. Bodonyi Csaba Építészete; MMA Kiadó: Budapest, Hungary, 2019. [Google Scholar]
  23. Alexander, C. The Timeless Way of Building; Oxford University Press: New York, NY, USA, 1979. [Google Scholar]
  24. Alexander, C.; Neis, H.; Anninou, A.; King, I. A New Theory of Urban Design; Oxford University Press: Oxford, UK; New York, NY, USA, 1987. [Google Scholar]
  25. Bereczki, Z. The procedural turn: Artificial morphogenesis in urban design. In Proceedings of the 13th International Space Syntax Symposium, Bergen, Norway, 20–24 June 2022; van Nes, A., de Koning, R.E., Eds.; Department of Civil Engineering, Western Norway University of Applied Sciences: Bergen, Norway, 2022; pp. 429:1–429:17. [Google Scholar]
  26. Lovra, É. Városok az Osztrák-Magyar Monarchiában. Városszövet-és Várostipológia 1867–1918; Terc: Budapest, Hungary, 2019. [Google Scholar]
  27. Carpo, M. Pattern Recognition. In Metamorph. Catalogue of the 9th International Biennale d’Architettura; Forster, K.W., Ed.; Marsilio, Rizzoli International: Venice, Italy; New York, NY, USA, 2004; Volume 3, pp. 44–58. [Google Scholar]
  28. Hillier, B. Space Is the Machine: A Configurational Theory of Architecture; Cambridge University Press: Cambridge, MA, USA, 1996; ISBN 9781511697767. [Google Scholar]
  29. Wagner, O. The Development of a Great City. Together with an appreciation of the Author by A.D.F. Hamlin. Archit. Rec. 1912, 31, 485–500. [Google Scholar]
  30. Alexander, C. A City is Not a Tree; 50th Anniversary; Sustasis Press: Portland, OR, USA, 2015. [Google Scholar]
  31. D’Acci, L. (Ed.) The Mathematics of Urban Morphology; Springer: Cham, Switzerland, 2019. [Google Scholar]
  32. Alexander, C. A Vision of a Living World; The Nature of Order; The Center for Environmental Structure: Berkeley, CA, USA, 2005. [Google Scholar]
  33. Gyulai, É. Miskolc Középkori Topográfiája. In Miskolc. Története I. A kezdetektől 1526-ig; Kubinyi, A., Ed.; Borsod-Abaúj-Zemplén Megyei Levéltár, Herman Ottó Múzeum: Miskolc, Hungary, 1996; pp. 175–253. [Google Scholar]
  34. Papp, F.; Somorjai, L.; Tóth, A. (Eds.) Miskolc Régi Térképeken; Miskolc Megyei Jogú Város: Miskolc, Hungary, 2015. [Google Scholar]
  35. Bereczki, Z. Borház, mint interfész. In A miskolci Avas, Ahogyan mi Szeretjük; Hajdú, I., Jakab, M.A., Eds.; Herman Ottó Múzeum, Miskolciak az Avasért Közhasznú Alapítvány: Miskolc, Hungary, 2022; pp. 179–192. [Google Scholar]
  36. Lovra, É. Urban Tissue Typology and Urban Typology (1868–1918). Special Cases: Zagreb and Rijeka. Prostor 2016, 24, 202–215. [Google Scholar] [CrossRef] [PubMed]
  37. Nes, A.; Remco, E. (Eds.) Proceedings 13th International Space Syntax Symposium; Department of Civil Engineering, Western Norway University of Applied Sciences: Bergen, Norway, 2022. [Google Scholar]
  38. Djokić, V. (Ed.) Praxis of Urban Morphology: Book of Abstracts; Xxx Conference of the International Seminar on Urban Form; University of Belgrade, Faculty of Architecture: Belgrade, Serbia, 2023. [Google Scholar]
  39. Kantarek, A. (Ed.) Conference Proceedings; XXIX International Seminar on Urban Form; Lodz University of Technology Press: Lodz, Poland, 2022. [Google Scholar]
  40. Bellomo, N.; Terna, P. On the Complex Interaction Between Mathematics and Urban Morphology. In The Mathematics of Urban Morphology; D’Acci, L., Ed.; Springer: Cham, Switzerland, 2019; pp. 315–333. [Google Scholar]
  41. Raimbailt, J. An Urban Morphogenesis Model Capturing Interactions Between Networks and Territories. In The Mathemathics of Urban Morphology; D’Acci, L., Ed.; Springer: Cham, Switzerland, 2019; pp. 383–409. [Google Scholar]
  42. Wang, X.; Song, Y.; Tang, P. Generative urban design using shape grammar and block morphological analysis. Front. Archit. Res. 2020, 9, 914–924. [Google Scholar] [CrossRef]
  43. Lovra, É.; Bereczki, Z. Integrated urban morphological method as input for artificial morphogenesis. In Conference Proceedings–Part II, In Proceedings of the XXX Conference of the International Seminar on Urban Form (ISUF2023) Praxis of Urban Morphology, Belgrade, Serbia, 4–9 September 2023; Djokić, V., Djordjević, A., Pešić, M., Milojević, M., Milovanović, A., Eds.; University of Belgrade: Belgrade, Serbia, 2023; pp. 860–870. [Google Scholar]
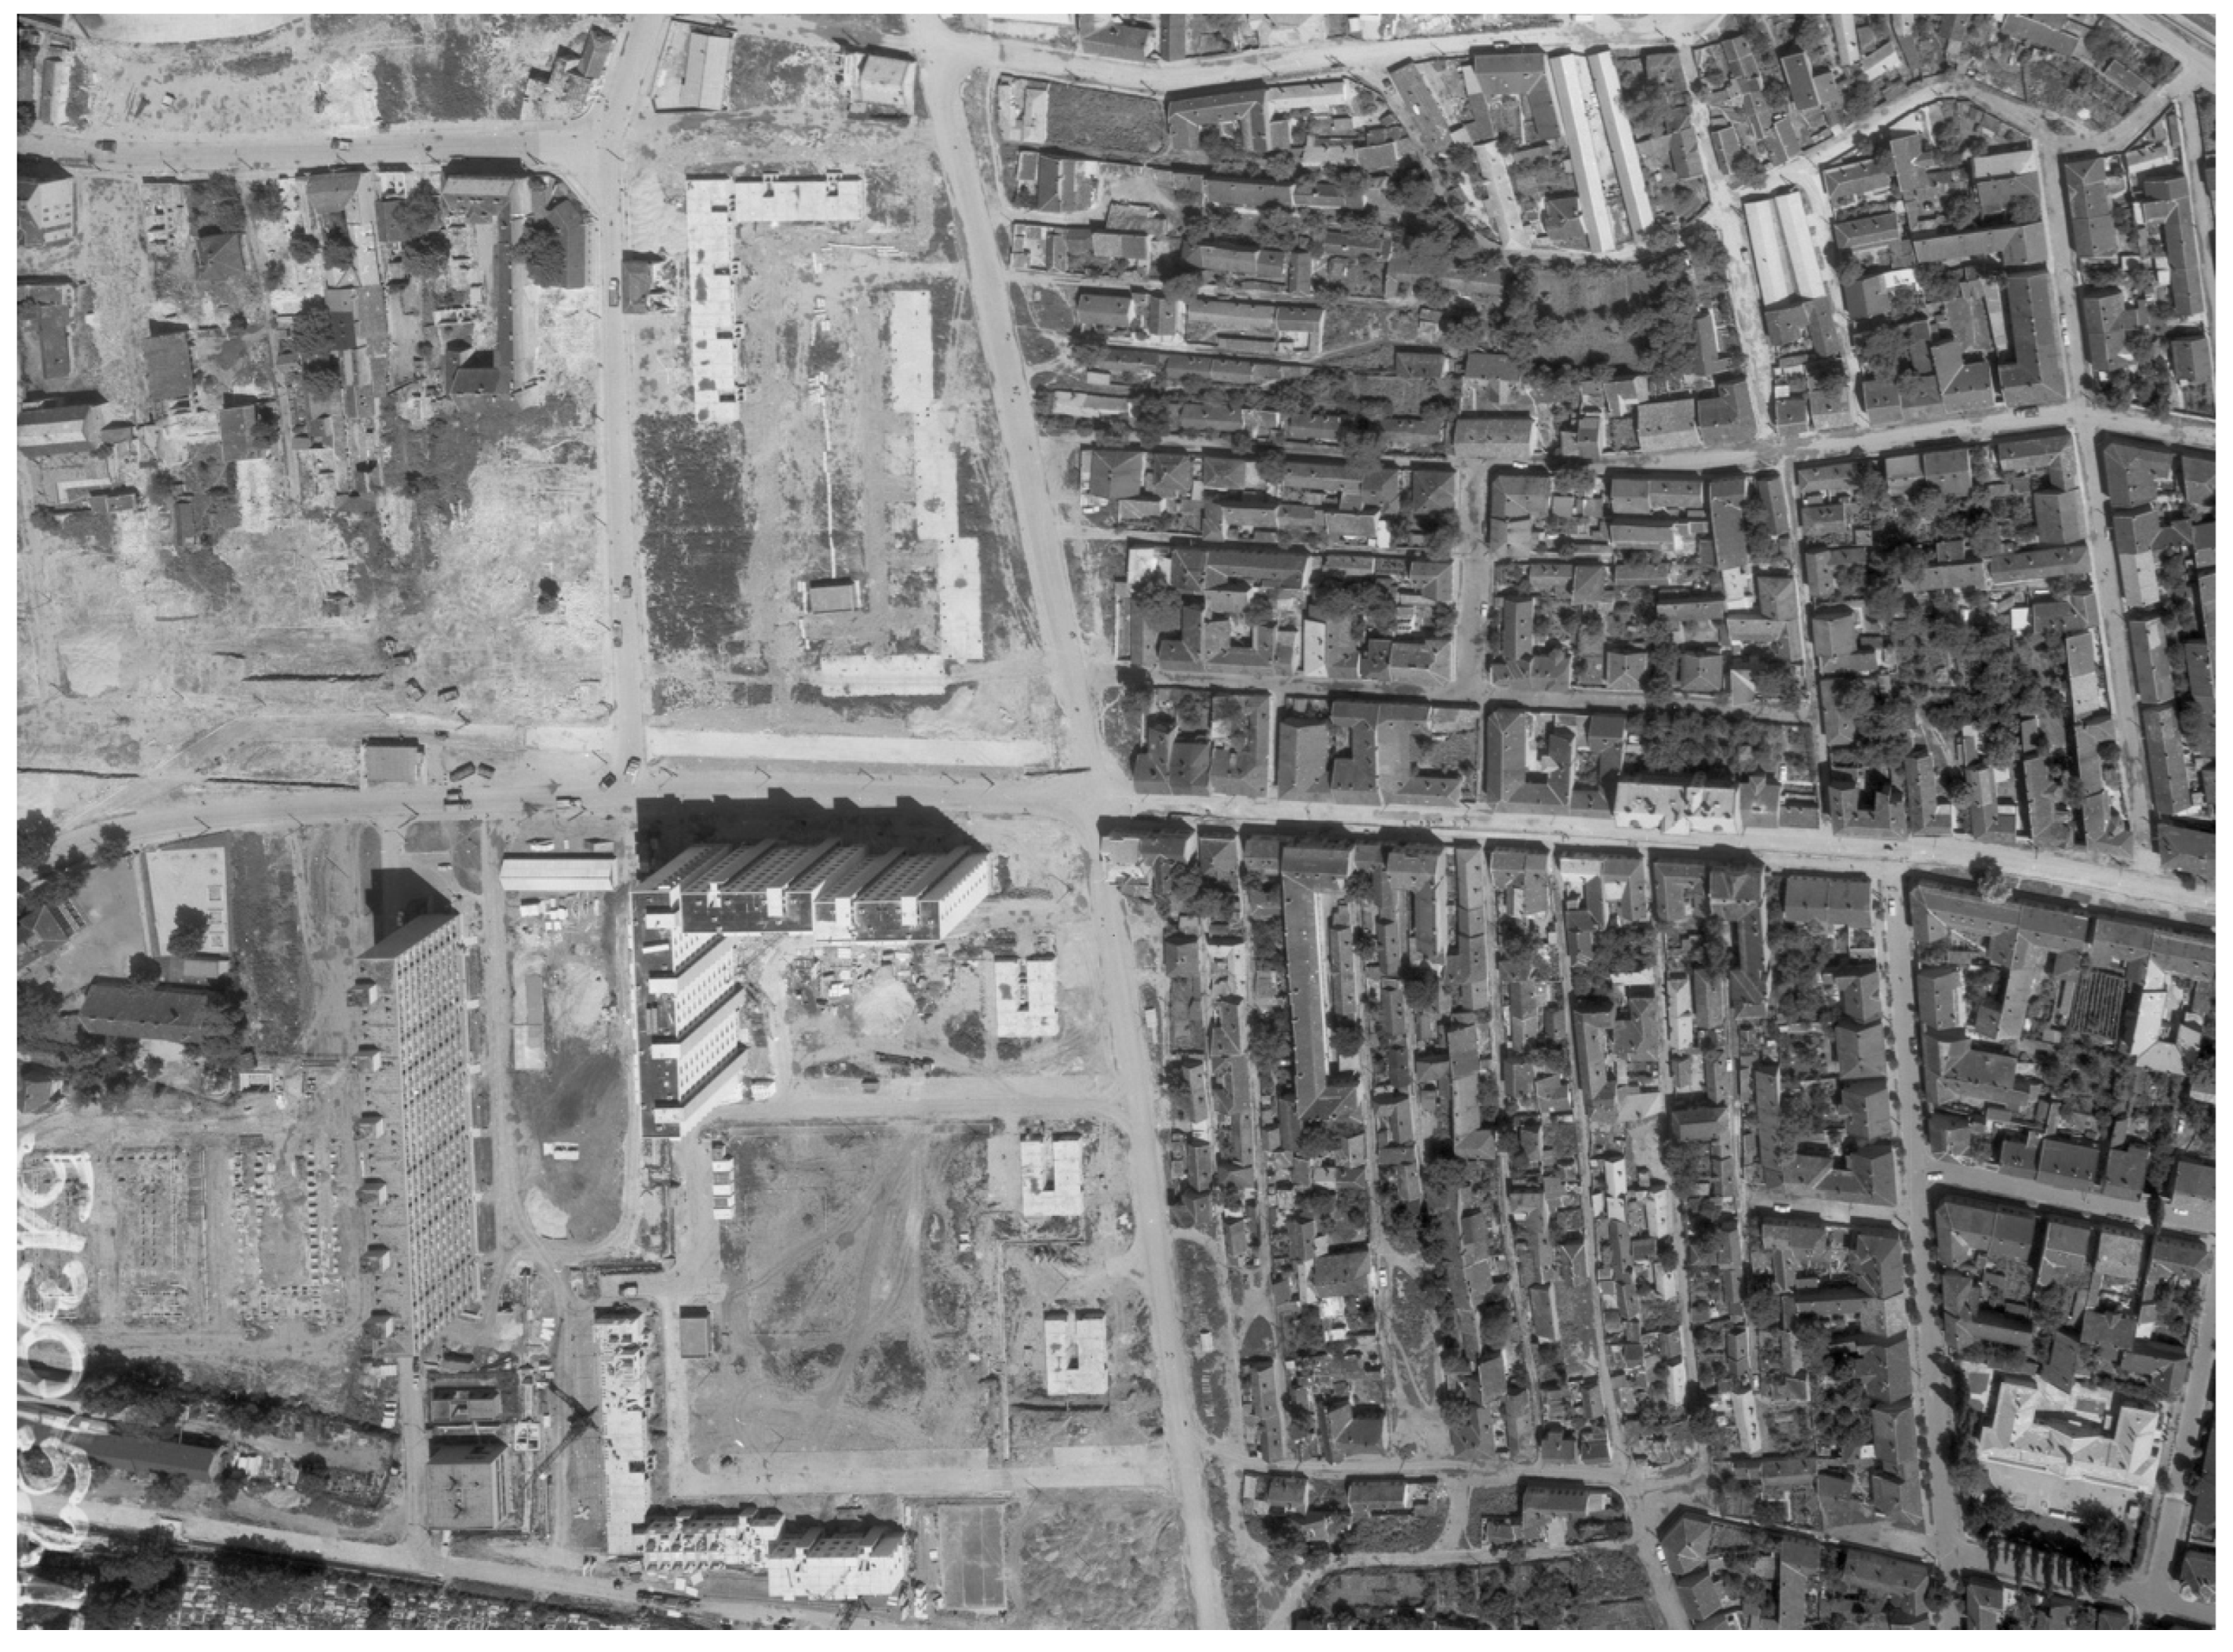
Figure 1. Demolition of the Gordon district and construction of the Vörösmarty housing estate. The aerial photograph shows the original, archaic, organic urban fabric on the right. On the left, it has already been erased, and some of the uniform concrete block houses of the new housing estate are already standing. Source: fentrol.hu—Lechner Nonprofit Kft.
Heritage 07 00276 g001
Figure 2. Aerial photograph of the city sports hall (1), county library (2), labour union headquarters (3), and their surroundings in 1973. The remains of the original urban fabric can be seen in the top left corner of the image; almost the entire area was similar before the construction of these buildings. One of Miskolc’s first prefabricated large-panel buildings can be seen in the upper right corner of the image (4). Source: fentrol.hu—Lechner Nonprofit Kft., numbers by author.
Heritage 07 00276 g002
Figure 3. Right: city sports hall (1968–1970, István Horváth, József Szabó, László Thury); left: county library (1972, János Dézsi). Source: author’s photo, 2024.
Heritage 07 00276 g003
Figure 4. Mezőkövesd, Hadas district—analysis by László Szőke. Captions: left column, top to bottom—current clusters of blocks, current blocks, current buildings; right column, up to down—current plots and streets, suggested corrections of plots, suggested corrections of streets. Source: https://ybldij.hu/dijazottak-2021-szoke-laszlo (accessed on 18 October 2024).
Heritage 07 00276 g004
Figure 5. Mezőkövesd, Hadas district, aerial photo, 2024. Source: Google Maps.
Heritage 07 00276 g005
Figure 6. László Szőke: The deciphered development history of the central area of Sárospatak before and after the construction of the Perényi-Rákóczi castle. Source: https://ybldij.hu/dijazottak-2021-szoke-laszlo (accessed on 18 October 2024).
Heritage 07 00276 g006
Figure 7. Competition plan for the centre of Góra Kalwaria, Poland, simulating gradual, step-by-step development. The numbers indicate the stages of the process; the disturbing building is marked with an arrow on stage 0. Source: [18].
Heritage 07 00276 g007
Figure 8. Tree and semilattice based on Alexander. The numbers indicate individual elements, the multi-digit strings indicate sets containing the elements with given numbers. Source: [30] (pp. 6–7).
Heritage 07 00276 g008
Figure 9. Reconstruction of the medieval topography of Miskolc by Éva Gyulai. Texts translated to English by the Author. Source: [33] Figure 29.
Heritage 07 00276 g009
Figure 10. Reindl Ferenc’s map of Miskolc from 1781. Source: [34] (pp. 34–35).
Heritage 07 00276 g010
Figure 11. The centre of Miskolc on the map of the royal cadastral survey from 1892 to 1894. Source: [34] (p. 66).
Heritage 07 00276 g011
Figure 12. The (Aa) tissue type of the Lovra catalogue. Source: [26] (p. 199).
Heritage 07 00276 g012
Figure 13. The (Ac) tissue type of the Lovra catalogue. Source: [26] (p. 199).
Heritage 07 00276 g013
Figure 14. The widening Palóczy street, forming the main square of the medieval New Town. Source: author’s photo, 2024.
Heritage 07 00276 g014
Figure 15. The widening Rákóczi street. Source: author’s photo, 2024.
Heritage 07 00276 g015
Figure 16. The widening of the main (Széchenyi) street at the Town Hall square. Source: author’s photo, 2024.
Heritage 07 00276 g016
Figure 17. Back courtyard on Széchenyi street. Source: author’s photo, 2024.
Heritage 07 00276 g017
Figure 18. The plot and the data flow of the algorithm that generates it. Inputs are on the left with wires extending from their right side, while the outputs of the cluster are on the right with wires extending from their left side. Parts that are only activated in later increments (e.g., the street wing) are highlighted in orange. Source: author’s work.
Heritage 07 00276 g018
Figure 19. A plot series and the data flow of the algorithm that generates it. The larger boxes represent plot-clusters, and their contents are displayed in the previous figure. They inherit each other’s outputs as shown. Source: author’s work.
Heritage 07 00276 g019
Figure 20. The data flow of the entire town. The larger boxes are clusters of plot series. To improve visibility, many wires are hidden, but the interconnectivity is still apparent. Source: author’s work.
Heritage 07 00276 g020
Figure 21. Denser version of the keyboard tissue: L-shaped buildings. Source: author’s work.
Heritage 07 00276 g021
Figure 22. Lovra-Ac tissue type generated by algorithm. Source: author’s work.
Heritage 07 00276 g022
Figure 23. Ac-dense tissue type generated by algorithm. Source: author’s work.
Heritage 07 00276 g023
Figure 24. Nine variations of the first increment. Scale on the image is in metres. Source: author’s work.
Heritage 07 00276 g024
Figure 25. One variation of the first increment; 3D view. Source: author’s work.
Heritage 07 00276 g025
Figure 26. Nine variations of the second increment. Scale on the image is in metres. Source: author’s work.
Heritage 07 00276 g026
Figure 27. One variation of the second increment; 3D view. Source: author’s work.
Heritage 07 00276 g027
Figure 28. Nine variations of the third increment. Scale on the image is in metres. Source: author’s work.
Heritage 07 00276 g028
Figure 29. One variation of the third increment; 3D view. Source: author’s work.
Heritage 07 00276 g029
Figure 30. Nine variations of the fourth increment. Scale on the image is in metres. Source: author’s work.
Heritage 07 00276 g030
Figure 31. One variation of the fourth increment; 3D view. Source: author’s work.
Heritage 07 00276 g031
Figure 32. Nine variations of the fifth increment. Scale on the image is in metres. Source: author’s work.
Heritage 07 00276 g032
Figure 33. One variation of the fifth increment; 3D view. Source: author’s work.
Heritage 07 00276 g033
Figure 34. The five increments in 3D side by side. Source: author’s work.
Heritage 07 00276 g034
Figure 35. The city centre of Miskolc in 1953, looking to the south. In the background, Hangman’s hill can be seen. Source: Fortepan, Bernhardt Ágnes.
Heritage 07 00276 g035
Figure 36. The area (Hangman’s hill) in 2023 on aerial photograph. Source: Google Maps.
Heritage 07 00276 g036
Figure 37. Five possible steps of densification shown on the example of one single urban block, which is a cluster in Grasshopper. Source: author’s work.
Heritage 07 00276 g037
Figure 38. First increment of the growth, top view. Blue: existing plots and buildings; black: new (generated) plots and buildings. Source: author’s work.
Heritage 07 00276 g038
Figure 39. First increment of the growth; 3D view. Source: author’s work.
Heritage 07 00276 g039
Figure 40. Second increment of the growth, top view. Blue: existing plots and buildings; black: new (generated) plots and buildings. Source: author’s work.
Heritage 07 00276 g040
Figure 41. Second increment of the growth; 3D view. Source: author’s work.
Heritage 07 00276 g041
Figure 42. Third increment of the growth, top view. Blue: existing plots and buildings; black: new (generated) plots and buildings. Source: author’s work.
Heritage 07 00276 g042
Figure 43. Third increment of the growth; 3D view. Source: author’s work.
Heritage 07 00276 g043
Figure 44. Fourth increment of the growth, top view. Blue: existing plots and buildings; black: new (generated) plots and buildings. Source: author’s work.
Heritage 07 00276 g044
Figure 45. Fourth increment of the growth; 3D view. Source: author’s work.
Heritage 07 00276 g045
Figure 46. Fifth increment of the growth, top view. Blue: existing plots and buildings; black: new (generated) plots and buildings. Source: author’s work.
Heritage 07 00276 g046
Figure 47. Fifth increment of the growth; 3D view. Source: author’s work.
Heritage 07 00276 g047
Disclaimer/Publisher’s Note: The statements, opinions and data contained in all publications are solely those of the individual author(s) and contributor(s) and not of MDPI and/or the editor(s). MDPI and/or the editor(s) disclaim responsibility for any injury to people or property resulting from any ideas, methods, instructions or products referred to in the content.