Article

Scan-to-BIM Process and Architectural Conservation: Towards an Effective Tool for the Thematic Mapping of Decay and Alteration Phenomena

by
Manuela Aricò
1,
Claudia Ferro
1,
Marcello La Guardia
2,
Mauro Lo Brutto
1,*,
Germana Taranto
1 and
Gaspare Massimo Ventimiglia
3
1
Department of Engineering, University of Palermo, 90128 Palermo, Italy
2
Department of Engineering, University of Messina, 98158 Messina, Italy
3
Department of Architecture, University of Palermo, 90128 Palermo, Italy
*
Author to whom correspondence should be addressed.
Heritage 2024, 7(11), 6257-6281; https://doi.org/10.3390/heritage7110294
Submission received: 19 September 2024 / Revised: 1 November 2024 / Accepted: 4 November 2024 / Published: 6 November 2024
(This article belongs to the Section Digital Heritage)

Abstract

:
Ancient monumental complexes need continuous analysis and monitoring operations to preserve a good conservation status. For this reason, the analysis of decay and alteration phenomena represents one of the main activities for their preservation. At the same time, the diffusion of Heritage Building Information Modelling (HBIM) methodology opens new scenarios for the management of Architectural Heritage. The paper describes the workflow based on a Scan-to-BIM approach for the generation of a decay map in an HBIM model. The workflow was applied to a significant case study, the church of “Santa Maria della Grotta” in Marsala (Italy). This church, partially excavated in a sandstone bank, is part of a larger heritage site consisting of a series of hypogea and a Punic necropolis dating back more than a thousand years. The Scan-to-BIM process, relying on an integrated survey combining mobile laser scanning and photogrammetric technologies, enabled the achievement of a complete 3D parametric model of the monument and, altogether, a detailed decay map in a BIM environment. The mapping process focused on the production of thematic maps of perimetral walls according to an abacus of decays implemented in a BIM system, useful for the analysis and conservation of the church. The work demonstrates how the Scan-to-BIM process is an efficient approach for 3D data collection and how it could facilitate the identification and mapping of pathogenic phenomena. Furthermore, the inclusion of this kind of information in the BIM model represents an effective tool for the maintenance and restoration of built heritage.

1. Introduction

In the last decades, above all in European countries, the management of Architectural Heritage had a great advantage from the adoption of the capabilities offered by the Building Information Modelling (BIM) standards; they indeed are indisputably useful for generating parametric 3D models and for acquiring and archiving essential information for restoration and conservation procedures [1,2]. When a BIM-based digitalization is applied to Architectural Heritage for preservation purposes, this methodology is named Historical or Heritage BIM (HBIM), according to [3], who first defined it.
HBIM is a system that embodies the generation of an object-oriented digital model and a powerful information database, where the architectural items are replicated in their geometric and semantic characteristics, according to their as-built conditions and their artistic, historical, and constructive typologies; furthermore, at the same time, they are also enriched by computational and informative contents [4,5]. HBIM facilitates the management and representation of diversified data, which can be retrieved and updated anytime. If the BIM process either manages the entire lifecycle of new buildings from design to decommission (as-designed) or the maintenance of existing structures (as-built), the HBIM process (even in the context of as-built) plans potentially endless maintenance for cultural heritage assets where the deep knowledge of the existing asset represents the starting point of the process [6,7]. For this reason, HBIM models should contain all the relevant information for the scheduled maintenance and restoration projects and should enable any additional analysis on the artifacts, from multitemporal visualization and construction hypotheses to stratigraphic investigations [8,9,10]. Since HBIM methodology embraces and addresses cultural heritage values, due to its intrinsic documentary connotation, the information involved in HBIM models must be accurately collected, structured, managed, and stored [11]. Furthermore, the possibilities offered by HBIM in cultural heritage management can be extended as well to historical or archeological valuable infrastructures [12,13].
According to Murphy’s definition [3], in an HBIM process, parametric objects must be mapped onto the point clouds originated from on-site acquired data; this approach is called Scan-to-BIM [14]. Nowadays, Scan-to-BIM relies on the integration of photogrammetry and laser scanning technologies for documenting the genuine as-built conditions of a cultural site as the starting point of the whole documentation process [15]. Laser scanning and photogrammetry are currently the most accurate, reliable, fast, efficient, non-invasive, and cost-effective methods for capturing the real surfaces of the assets, producing point clouds as a reference and ensuring the maximum geometric accuracy for the following digitization [16,17,18,19]. Laser scanners are powerful tools to detect the geometry of the building, even if the quality of texture acquired through these devices is not good enough to adequately represent the surface features and peculiarities [20]. For this reason, photogrammetry is also often used to capture high-detailed photographic texture for 3D models [21] or high-resolution orthophotos for thematic mapping [22]. The integration of laser scanning and photogrammetry improves the quality of input data and strengthens the next parametric modelling phase. Recent studies have proven that feasible multi-source integrated surveys are almost mandatory for data acquisition in cultural heritage sites, as the adoption of a single method cannot be exhaustive to convey their complexity [23].

1.1. The Current State of the Art of Decay Mapping in HBIM

The conservation and restoration of built heritage frequently face the onset of multiple deadlocks, mainly due to the lack or the loss of information about historical assets, geometric representation, and restorations over time. The same issues often need to be considered when drawing up the scheduled maintenance program for historic architecture. Traditional archival research and bidimensional documentation of the existing buildings have been proven to be time-consuming and incomplete methods, whilst built heritage management needs reliable, strategic, and structured tools and processes for documenting and handling the complexity of historical assets [24].
The HBIM process could enable many types of thematic analyses and mappings which can be undertaken for the maintenance of the artifacts, for example, of construction materials, structural failures, restoration techniques, as well as forms of degradation. In particular, the elaboration of decay mappings is a fundamental predictive tool to decide the urgency of an intervention in the architectural heritage asset. Some researchers are pushing forward the necessity of integrating these mappings into the semantic contents of a Scan-to-BIM process. In this field of research, several methods were performed. One of these was pursued through filled regions outlining the contours of decays [25]. This approach facilitates the delivery of thematic maps; however, it is not queryable about quantities (i.e., perimeter and area) and costs. In the case of timber structures, some researchers developed an HBIM multitemporal analysis model for conserving and maintaining the monument [26]. The geometric description of decays provided other more suitable approaches: ultra-thin layers like sort of films to be overlapped onto the modelled surfaces which link the information as semantic parameters [27]; graphic data used to identify the state of conservation of the materials and the detailed description of the interventions [28]; database connection used to point out structural issues and priority areas of interventions or further nondestructive investigations [29]. An advanced version proposes the possibility of converting the mapping into adaptive families to apply on building façades, associating each traced decay and intervention information with the corresponding ID code; but, in this method, extraction of useful data is not enabled yet [30]. Del Pozzo et al. [31] suggest the joint use of generic or adaptive models and project parameters for punctual information, applied to single masonry ashlars which compose the wall to be analysed. Further experiments regard stratigraphic representations of the walls starting from orthophotos, which the corresponding associated decays have been traced onto. In this case, information has been added to an independent database, external to the BIM authoring environment [32]. Other researchers insist on overcoming the logic of 2D mapping and start to treat the map as a 3D entity [33]. Current derivations are based on the use of Artificial Intelligence (AI) [34] or Visual Programming Languages (VPL) [35] to overcome the notorious BIM environments’ flaws in handling free-hand contours, enabling a more performant representation and expanding the database conveniently.

1.2. Research Motivation and Research Aims

The overview of the state of the art on decay mapping in HBIM environments highlighted several aspects which require more in-depth experimentation. First, the actual framework of BIM software does not host proper families of objects dedicated to decay mapping or to other specific aspects of architectural conservation. This weakness led many researchers to experiment with ad hoc solutions to fill this gap which can partially solve the problem for proper case studies. Furthermore, the development of these ad hoc solutions often limits their application to single parts of the building or reduces the management of the degradation mapping process to a 2D graphical visualization only, without the possibility of associating a database where all the decay information can be reported and stored. The lack of standard approaches is therefore one of the major problems in this field. For this reason, the development of new applications which could re-elaborate approaches already tested or propose new solutions represents an important step for achieving a shared standardization of the process.
The present work tries to fill these gaps by proposing a decay mapping approach which enables decay mapping over the 3D BIM model, employing ad hoc families and a specific abacus created inside the BIM environment. Within the scope of this research experience, among the specialist glossaries of the forms of decay of stone materials, the one proposed by ICOMOS (International Council on Monuments and Sites) was preferred. The work pursues a Scan-to-BIM-based approach for the digitization and the thematic mapping of decay phenomena of the ancient church of “Santa Maria della Grotta” in Marsala (Italy), marked by its late Baroque appearance. The church is placed inside an archaeological site historically stratified from the Punic foundation of the town until the mediaeval age and has a very particular structure located inside artificial caves dug into a sandstone bank. The uniqueness of the monumental complex represented a relevant challenge in terms of Scan-to-BIM application. At the same time, the monument’s placement needed the adoption of monitoring methodologies to preserve the state of the architecture.
The work aimed to deliver a complete and exhaustive data acquisition of the church and, above all, to obtain its 3D parametric model in a BIM environment to be further integrated with the thematic decay mapping of the internal and external surfaces. Since BIM software tools are not comprehensive of families that adequately represent both the architectural peculiarities and the degradation of historical buildings, the work explores the possibility of creating proper parametric families for rendering the as-built structure of the church as well as mapping altogether the degradation of the main planar surfaces. In this way, the decay mapping can be managed in 3D, enabling the analysis between the internal and external surfaces. The extension of the decay mapping on both sides of the walls allowed for evaluating how much the degradation phenomena altered the same structures in different ways due to the variable conditions affecting their external and internal faces and enabled an immediate understanding of the decay all over the model. The families of decay phenomena were designed with strict reference to the ICOMOS glossary, to use a common standard approach as a reference. In this way, the information related to preventive conservation was stored in the BIM database which can be queried and updated at all times. The HBIM database can therefore be considered as a helpful tool for all the actors involved in the architectural heritage restoration process, enabling eventual intervention plans.
The paper is organized as follows: Section 2 introduces and describes the case study with its historical and architectural notes; Section 3 includes the adopted workflow for the digitization process, with a focus on data acquisition, modelling and decay mapping; discussion and results are reported in Section 4; concluding remarks offered by this approach and follow-ups and possible future implementation of the workflow are defined in Section 5.

2. The Case Study of the Church of “Santa Maria della Grotta” in Marsala (Italy)

The Church of “Santa Maria della Grotta” is part of a wider thousand-year-old complex in the present-day town of Marsala (Italy) (Figure 1). The church has a very unusual location as it is partially excavated in an area which had been used first as a necropolis in the 4th century B.C. by the Punics and then as a latomia between the end of the 2nd and 3rd centuries C.E. by the Romans. Since the 5th century, the area served for funerary purposes again for Paleo-Christian and Jew communities, as proved by recessed arched (arcosolia) tombs decorated with frescoes and furnished with appliances, typical of that period, carved at different levels.
In 1097, a coenobitic community of Greek Orthodox monks settled inside the pre-existing hypogea, which were just altered and turned into the first core of the current church, dedicated to the Virgin Mary and named “Santa Maria della Grotta” (Saint Mary of the Cave). In the 15th century, for unknown reasons, the church remained without monks and was then administered by the Diocese of Palermo until 1555. Afterwards, its custody was given to the Jesuits who managed it until 1860. In 1712, after relevant decay phenomena due to the strong humidity in the hypogea, the church was renovated and enlarged and took on its current appearance characterized by a late Baroque style [36].
Over the years the church has undergone progressive degradation, culminating in some partial collapses caused by an earthquake in 1968. Due to this event, the church was declared unsafe and closed permanently. Currently, the church and the entire surrounding complex fall within the areas of competence of the Archaeological Park of the Lilibeo-Marsala. Despite having made the environment safe, the site is normally closed to the public and the structure of the church suffers from the lack of adequate restoration and maintenance.
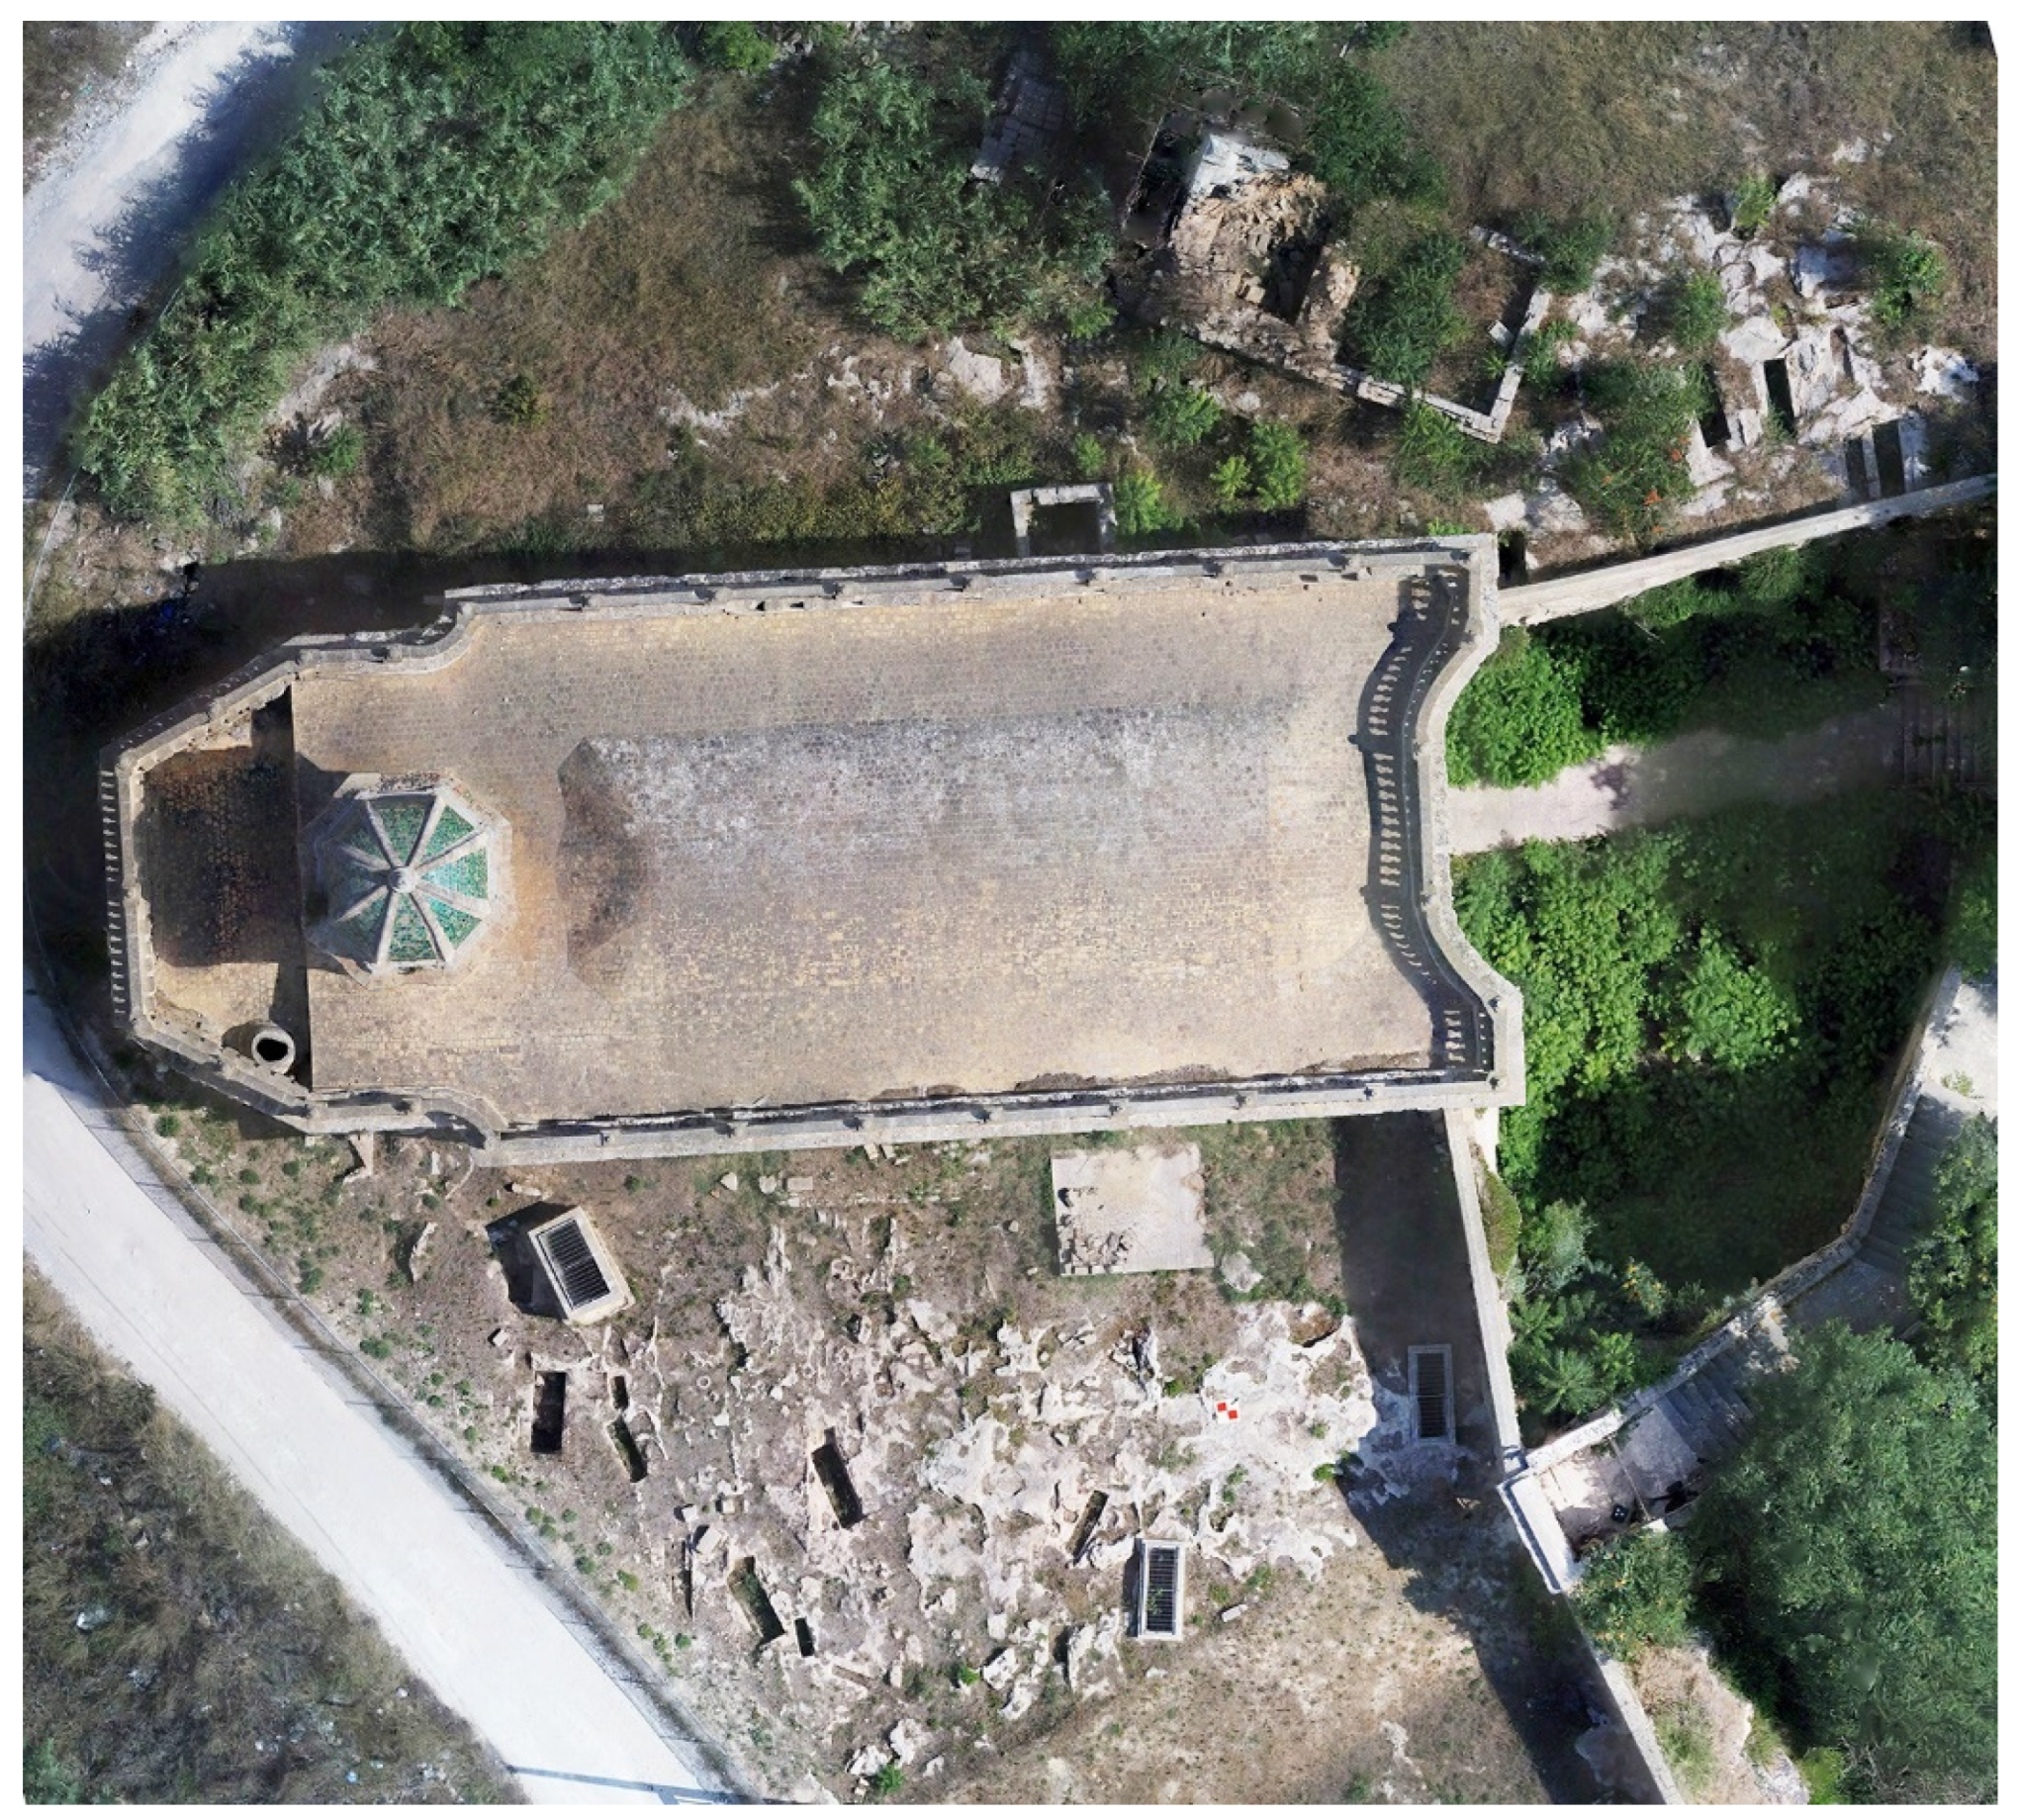
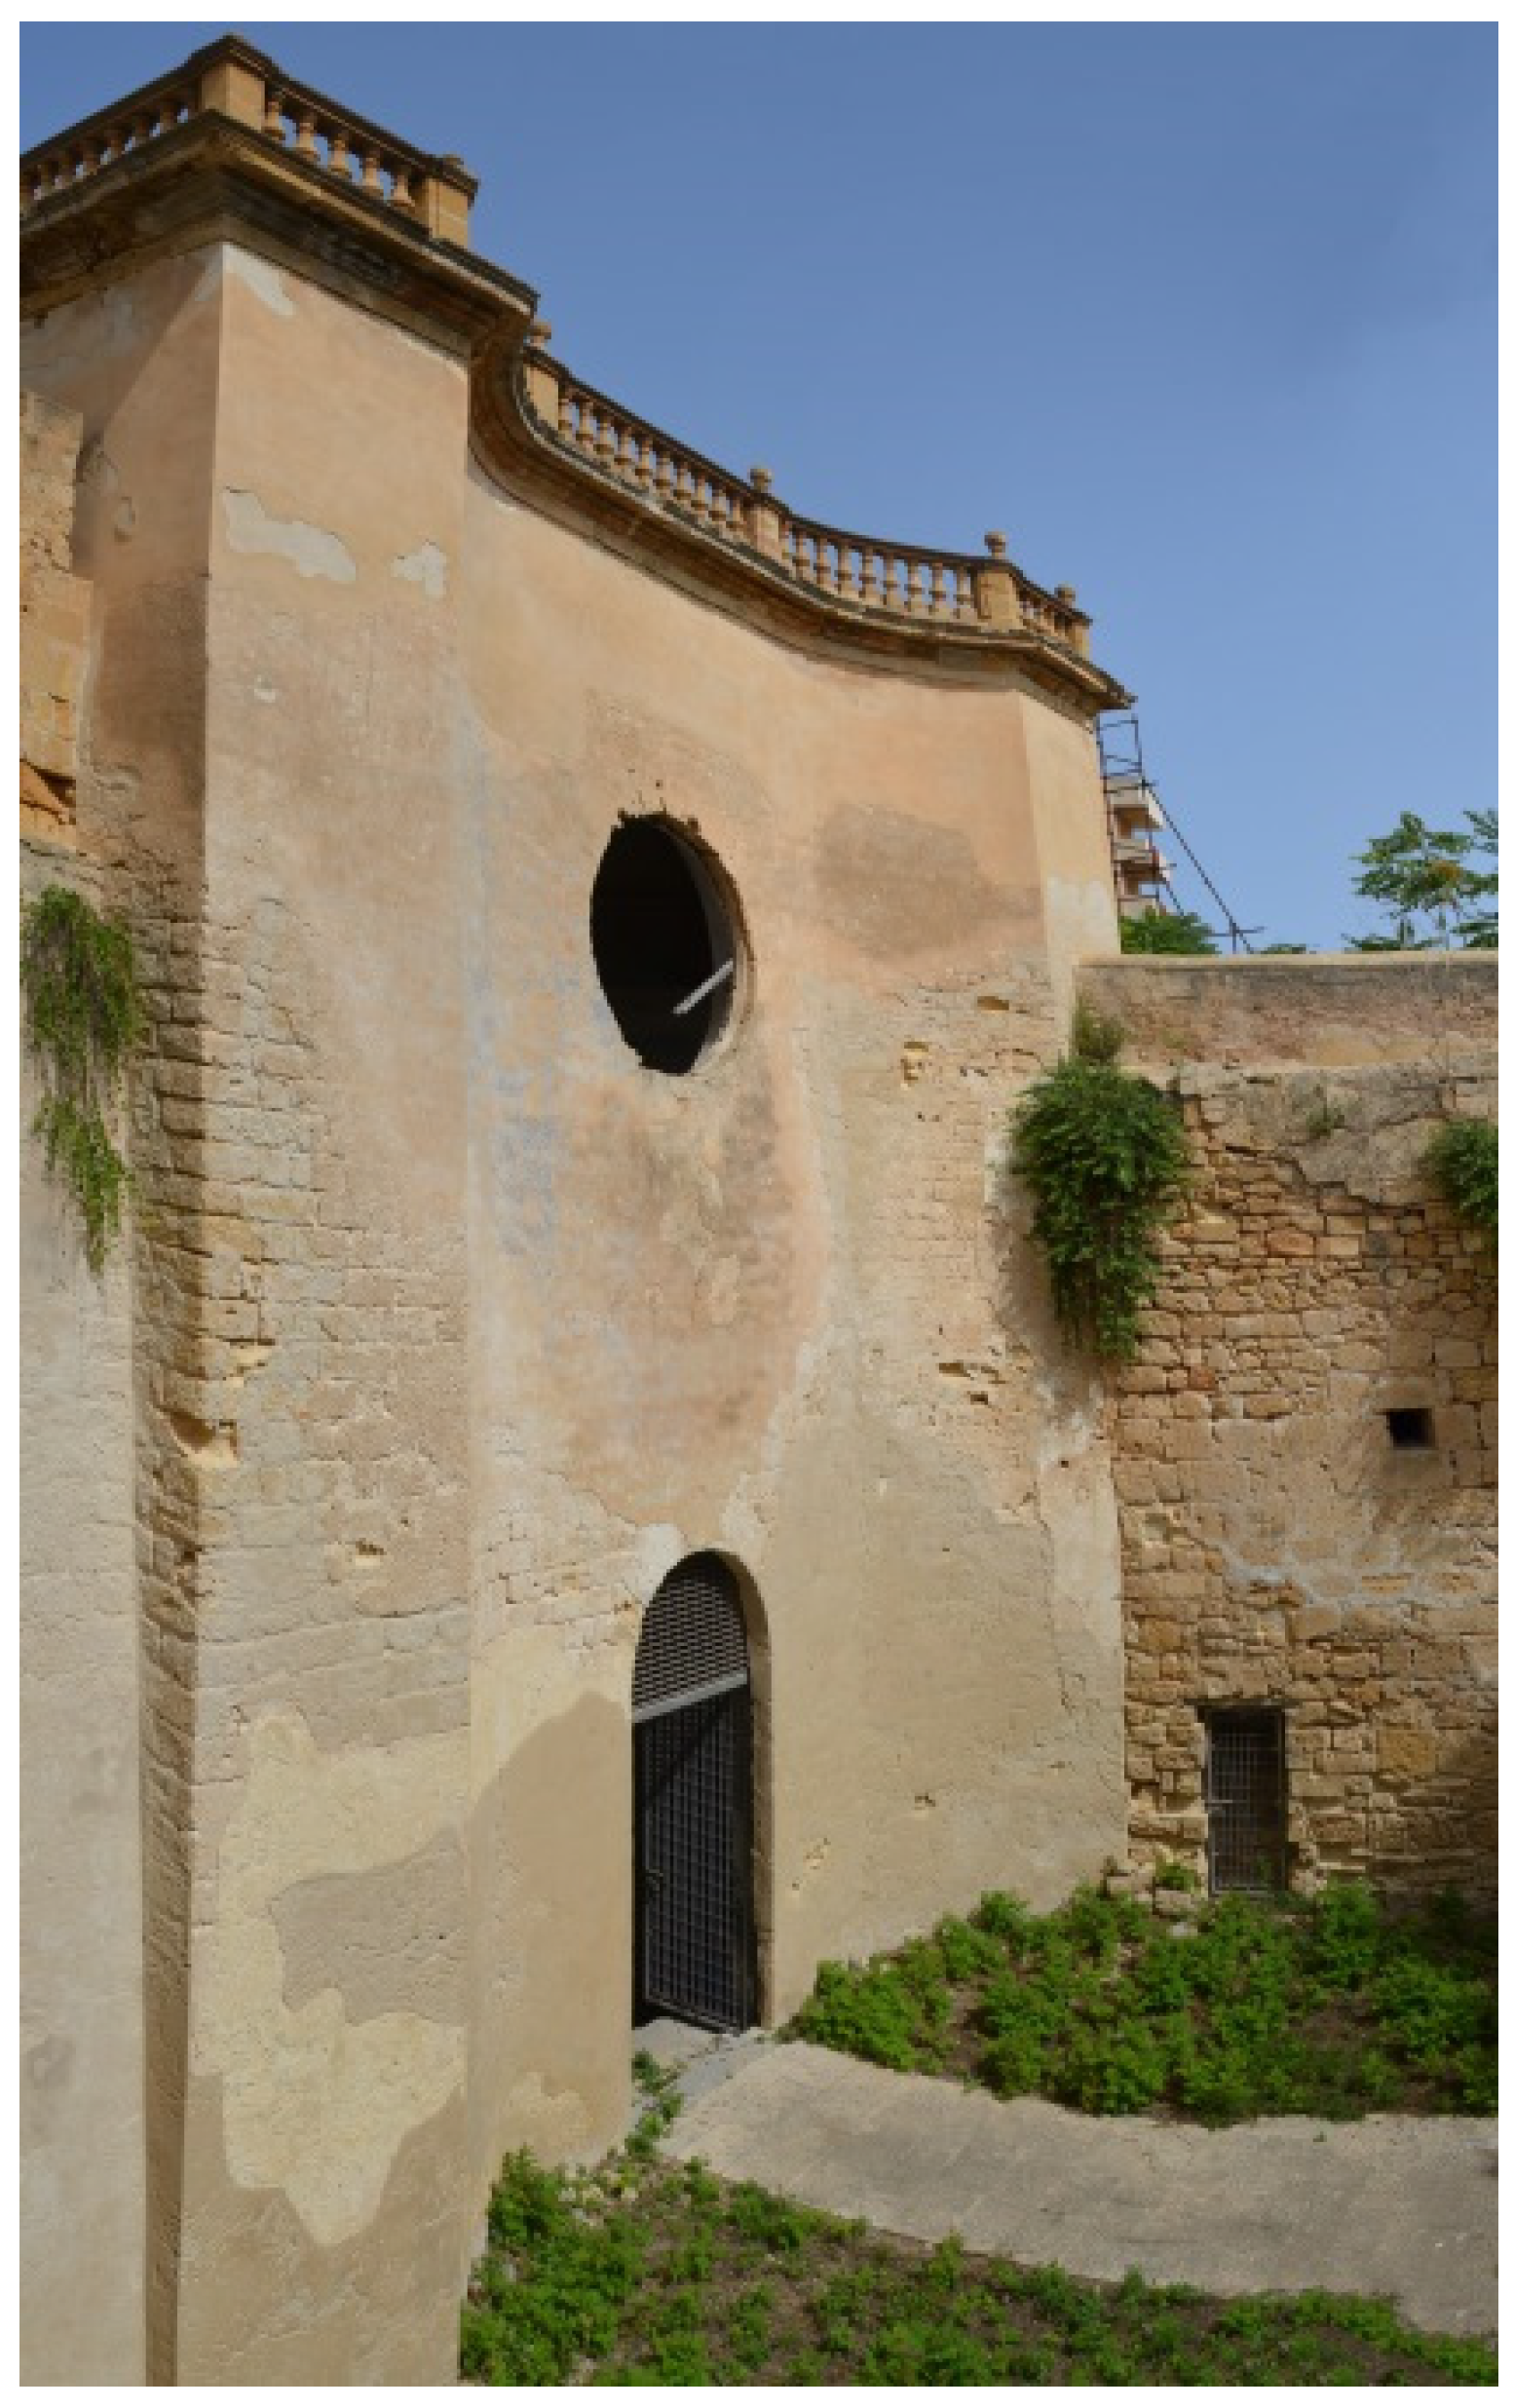
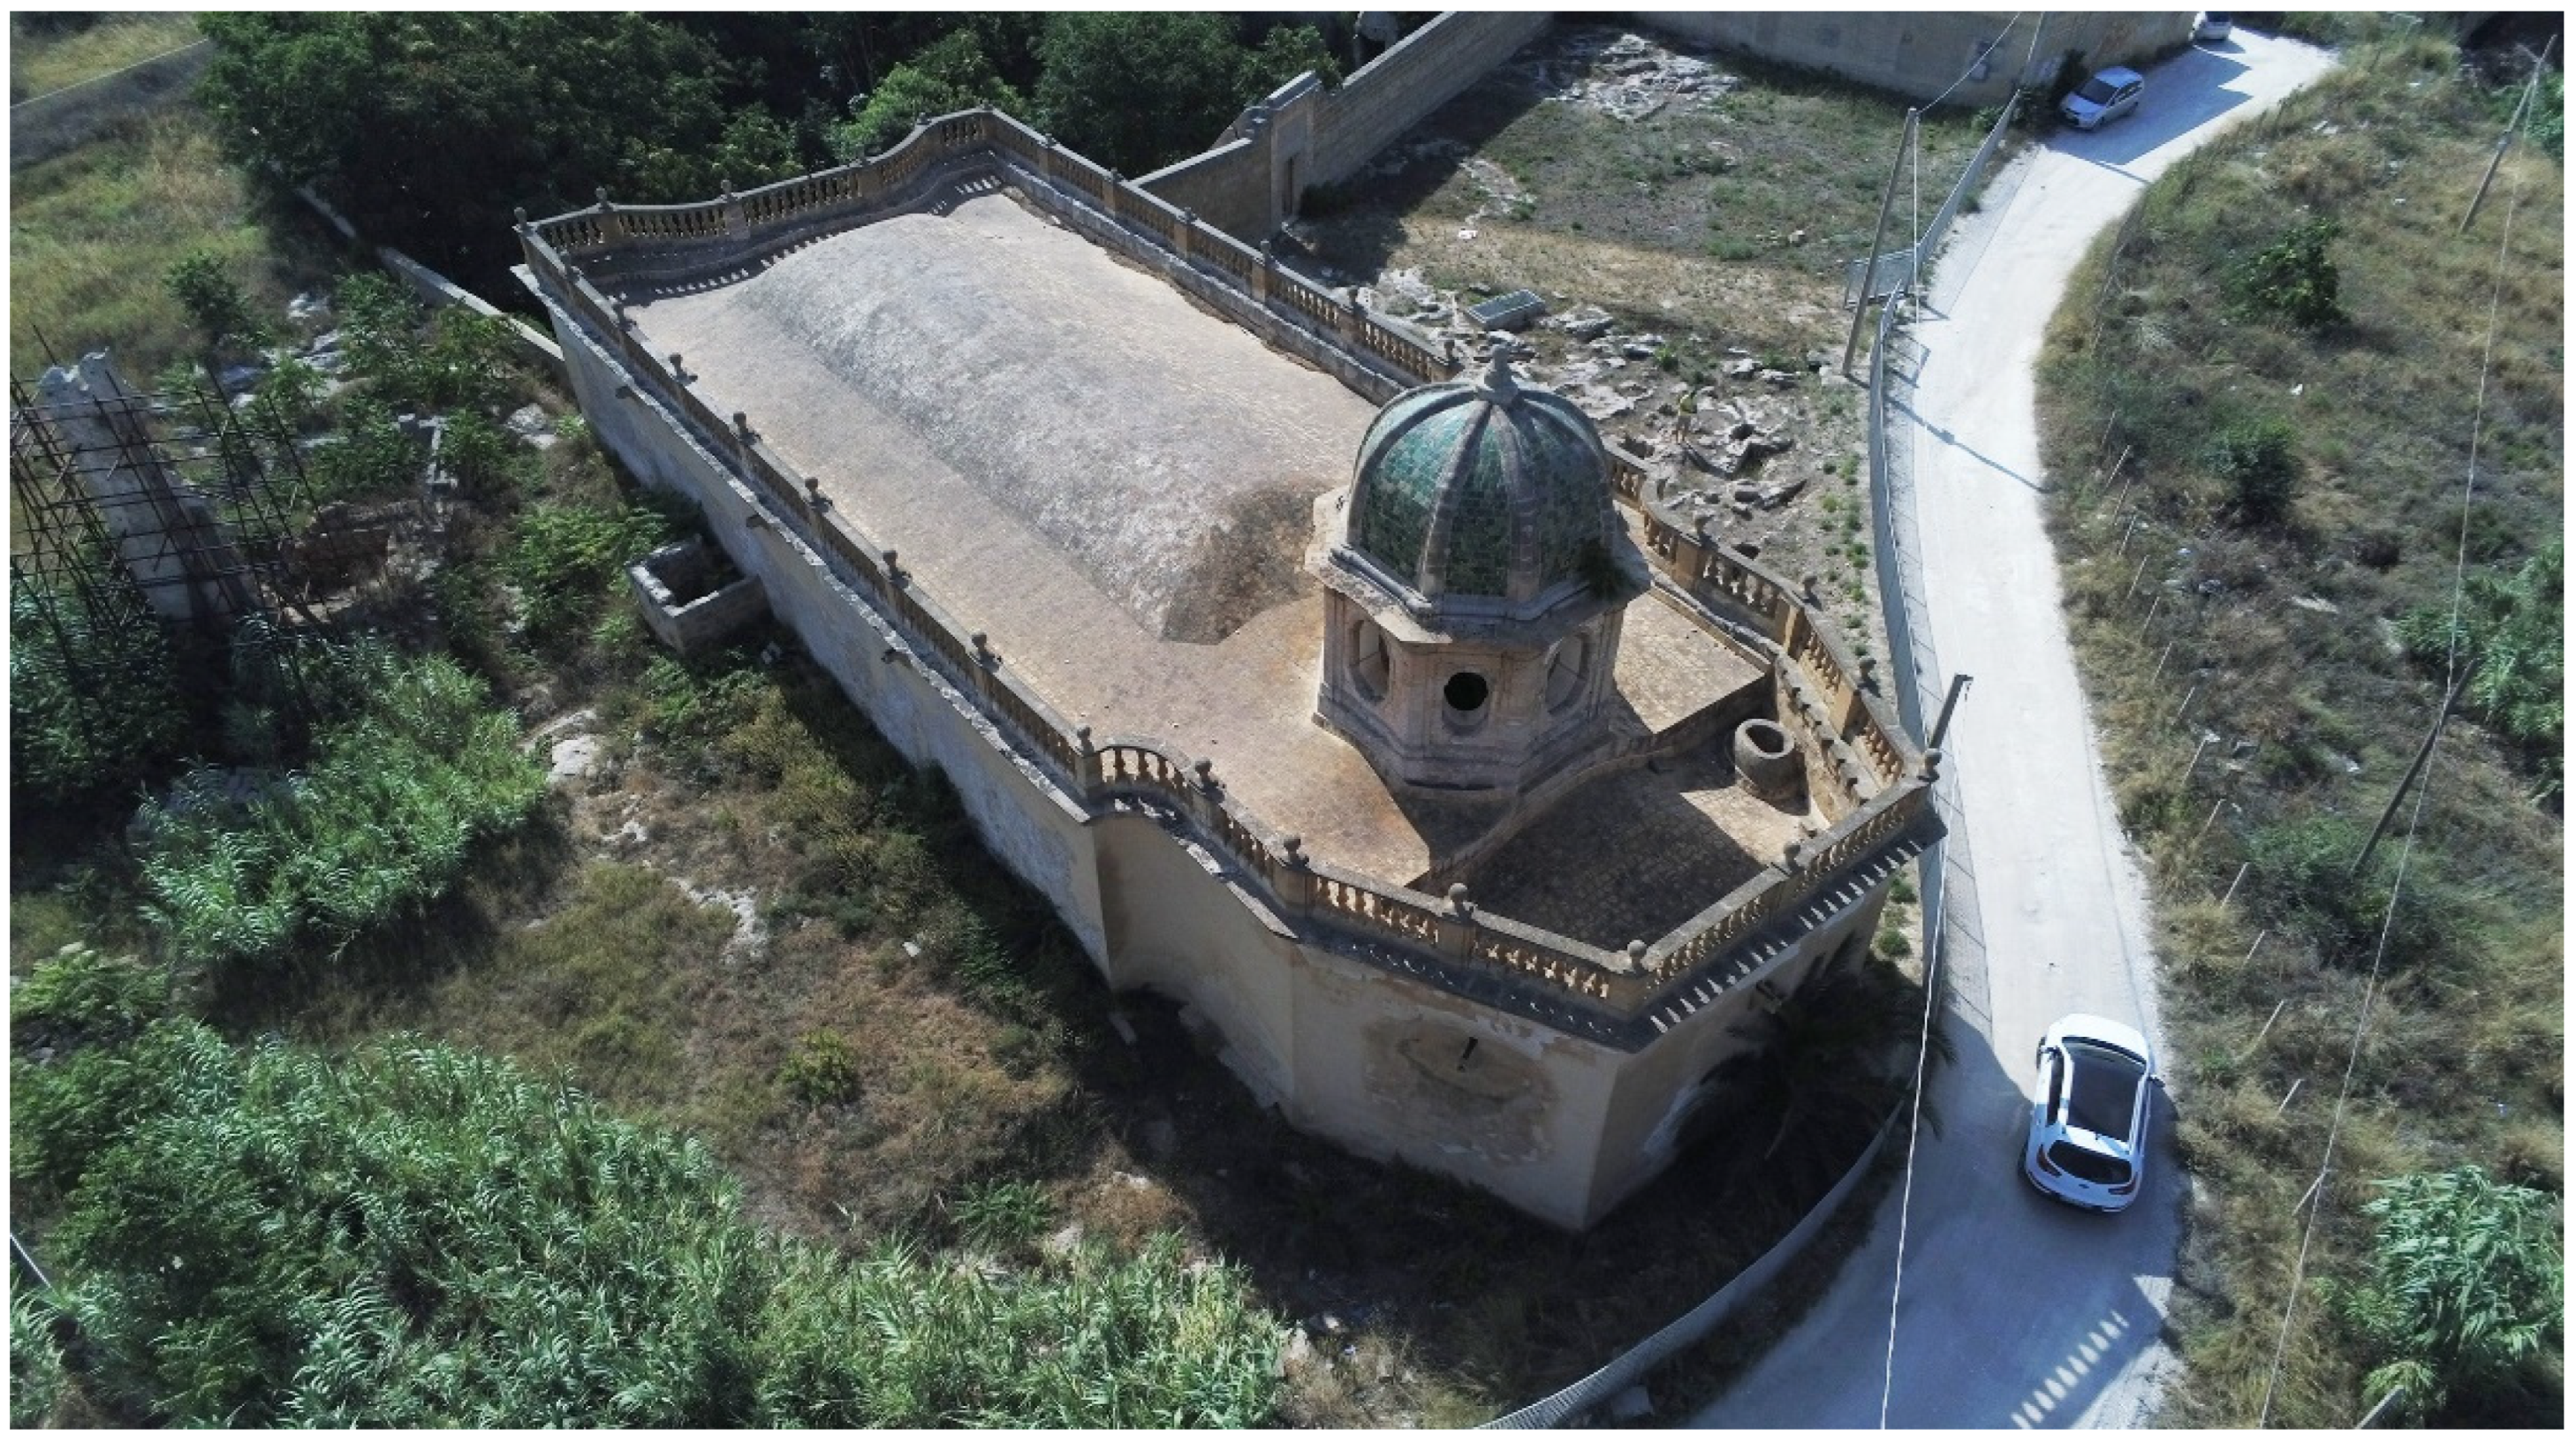
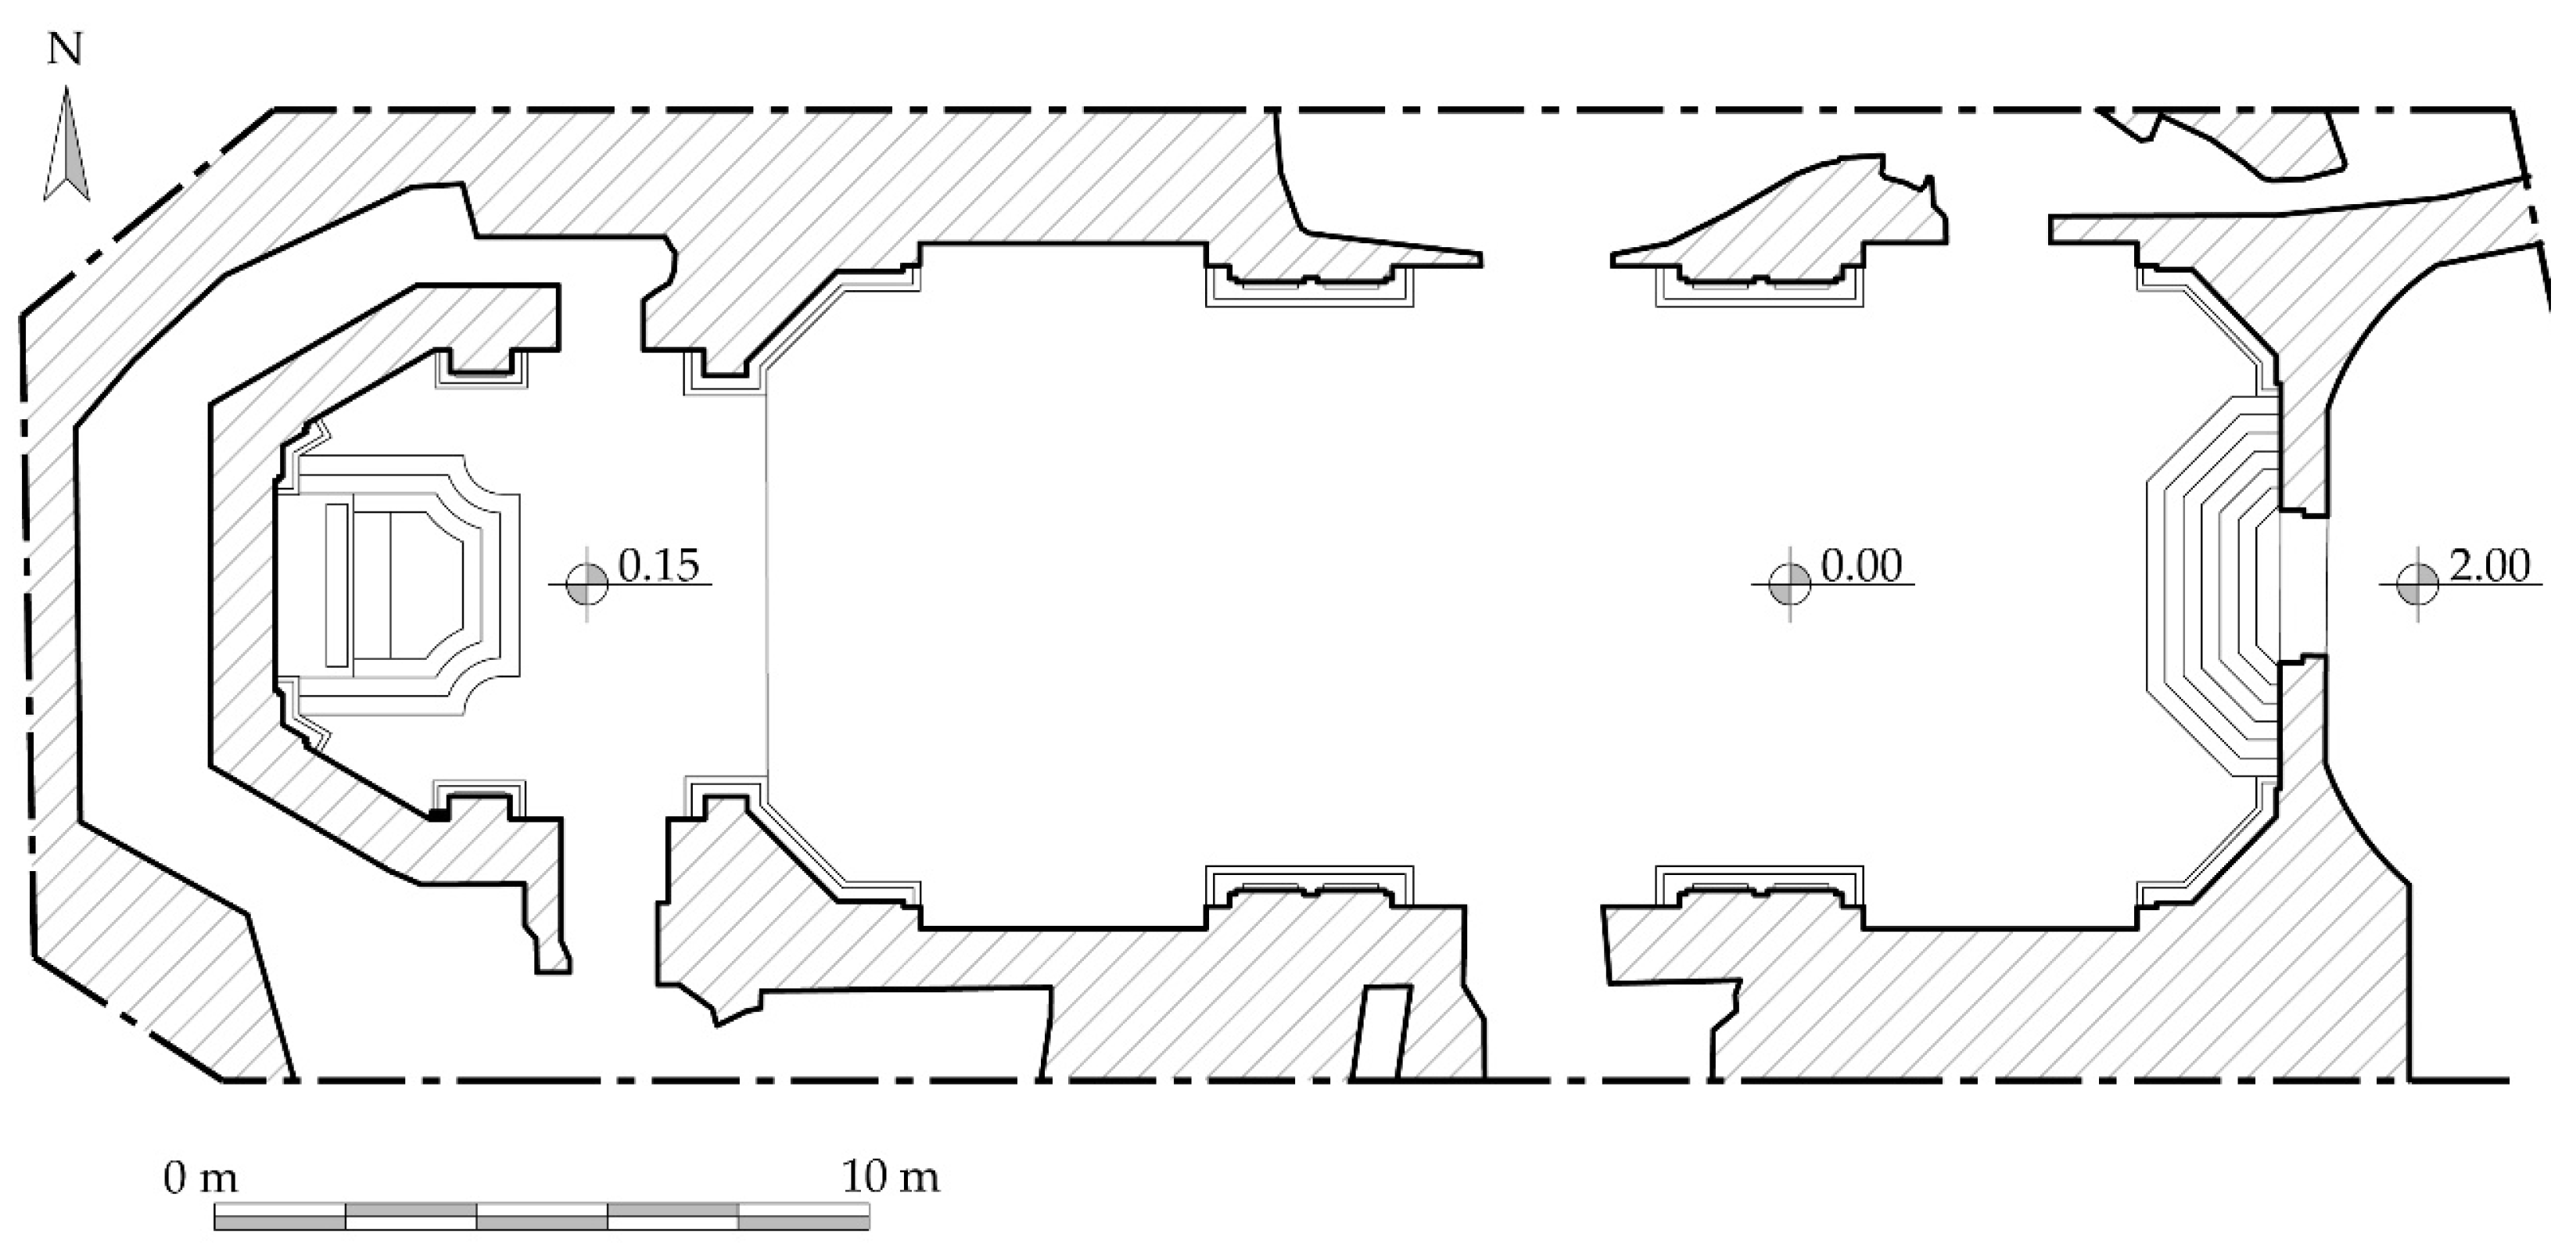
The current building, which is approximately 31 m long and 10 m wide, runs across the pre-existing Punic necropolis and caves in a transversal direction and expands the original core of the previous medieval church (Figure 2). The church is reachable from the upper churchyard in the necropolis through a four-ramped stairway, carved on a bank of sandstone, to a 9 m lower open basement into the latomie, and has a simple façade recessed in its centre with no evident embellishments (Figure 3). The entrance door was surmounted by a circular rosette and the partially detached plaster on the façade reveals the underlying sandstone ashlars. The main front is ended by a gracious parapet running along the whole perimeter of the building, where the roofing is flat. The central part of the covering instead reveals the profile of the ceiling below. A green tile hemispherical dome on sandstone ribs completes the sheltering system, which is the only part of the church springing from the upper ground level (Figure 4).
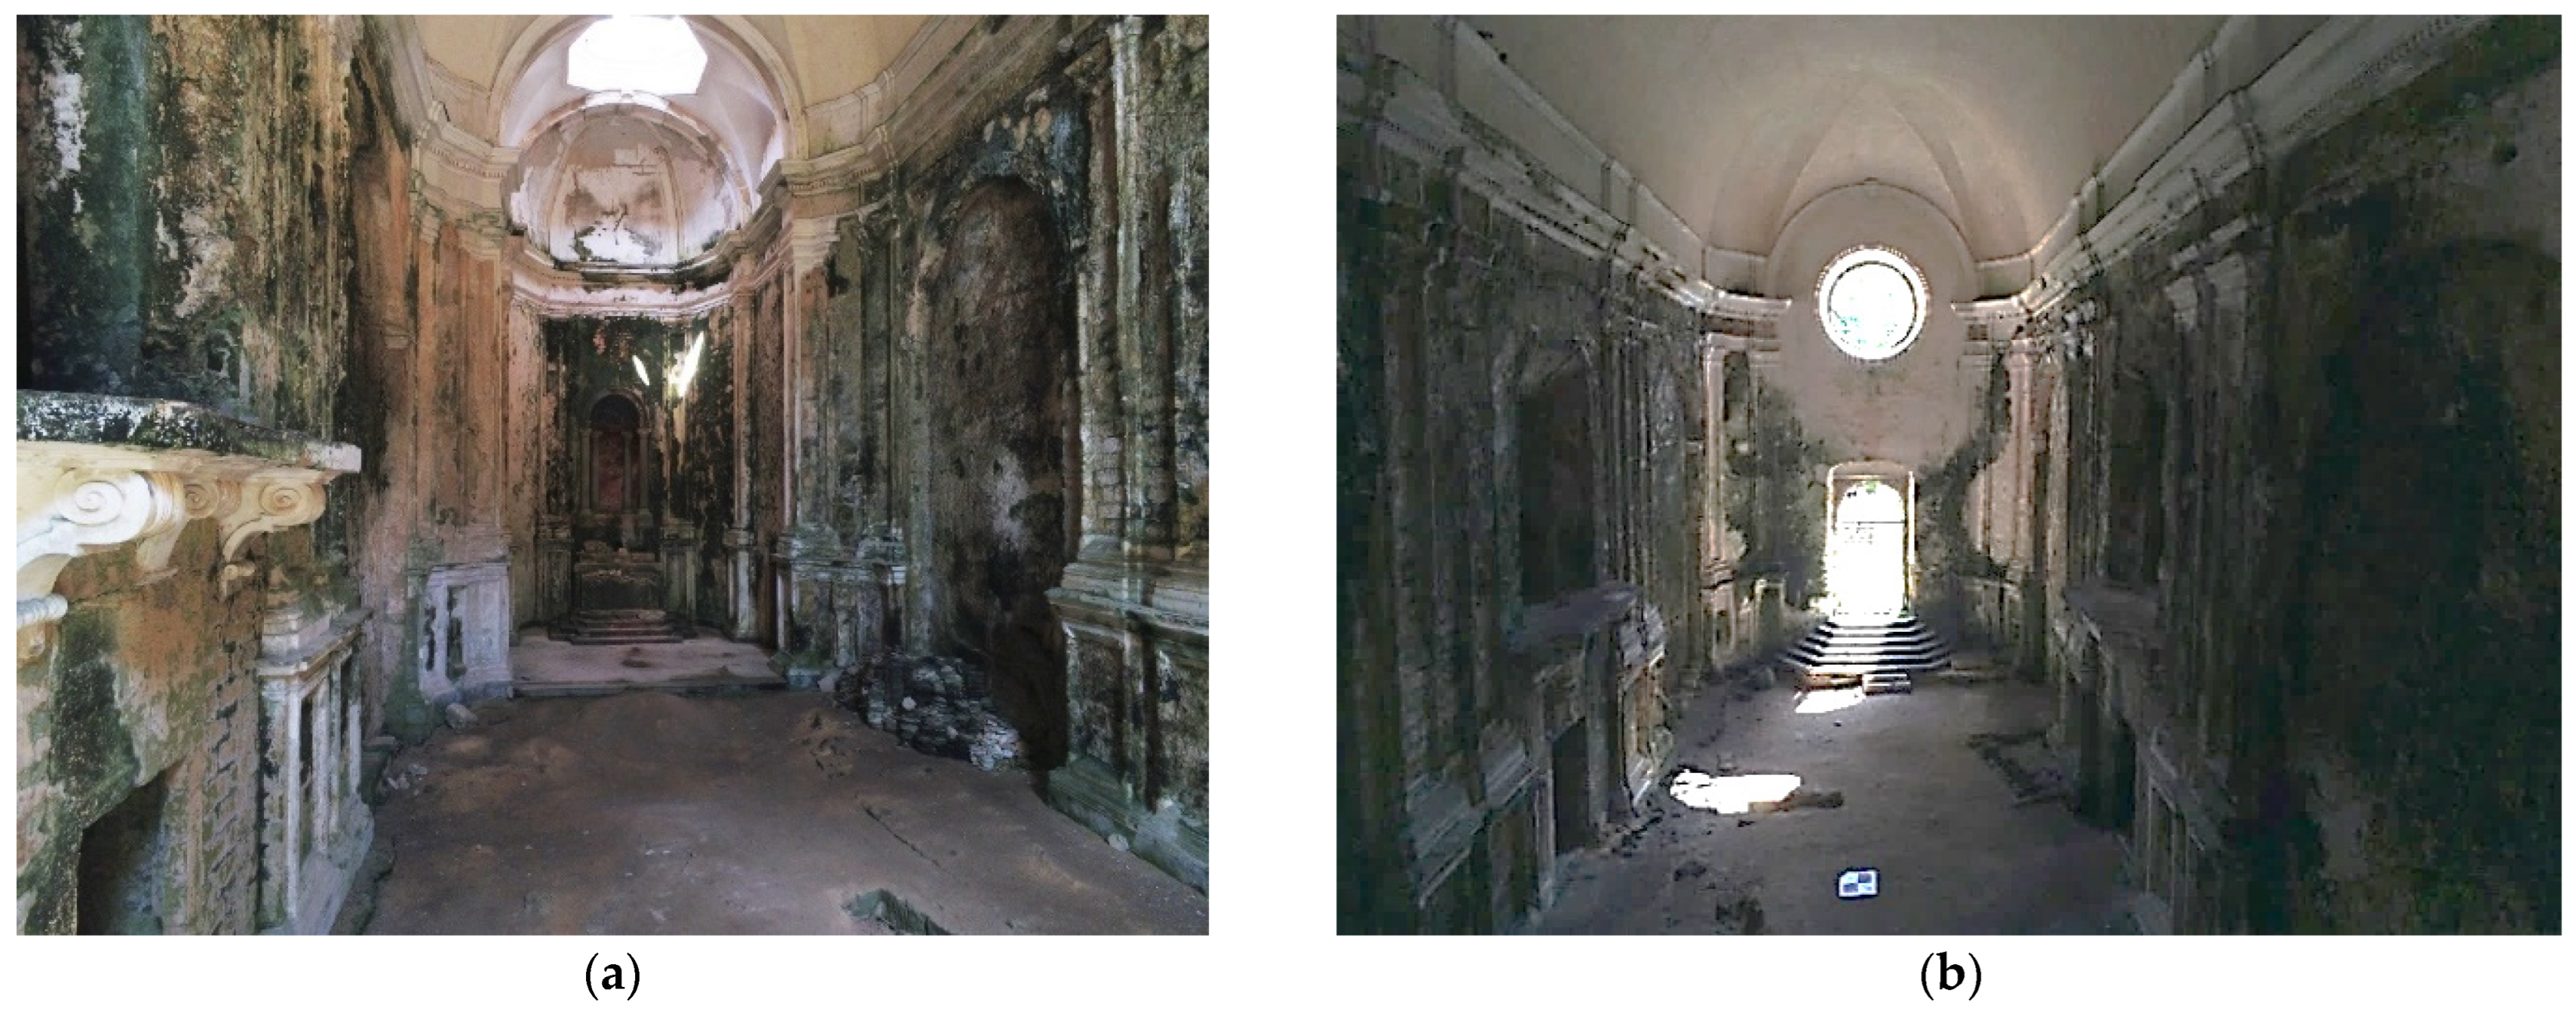
The interior of the church, which is 2 m lower than the ground level of the entrance, is accessible by a few polygonal steps and is made by a single nave, a squared presbytery, and an ending polygonal apse, with a regular perimeter and few characterizing elements (Figure 5). These include four recessed arched chapels (two for each long wall), two symmetrical balconies of the upper galleries supported by decorated brackets, a giant order of Tuscan pillars protruding from the walls and corners, framing the arches and supporting a continuous moulding along the entire perimeter of the building. In the apse, which is slightly higher and narrower than the aisle, there is a simple altar in marble and alabaster and a niche framed by four composite columns. Six openings (two on each long wall and another two in the apse area) give access to the underground rooms, connected by passageways (Figure 6).
The false ceilings in cane wattles and plaster daub are made of different typologies in the three main spaces: a boat vault covers the aisle, a simple barrel vault with lateral lunettes rises on the presbytery, lighted by an octagonal lantern, whilst a cap dome is placed above the apse.
The whole internal surfaces show an evident state of degradation, attributable to the lack of maintenance and the strong humidity linked to its specific underground conformation. In fact, the contact between the walls of the church and the sandstone bank led the monument to a constant presence of humidity along the vertical surfaces of the building.

3. Methodology and Tools

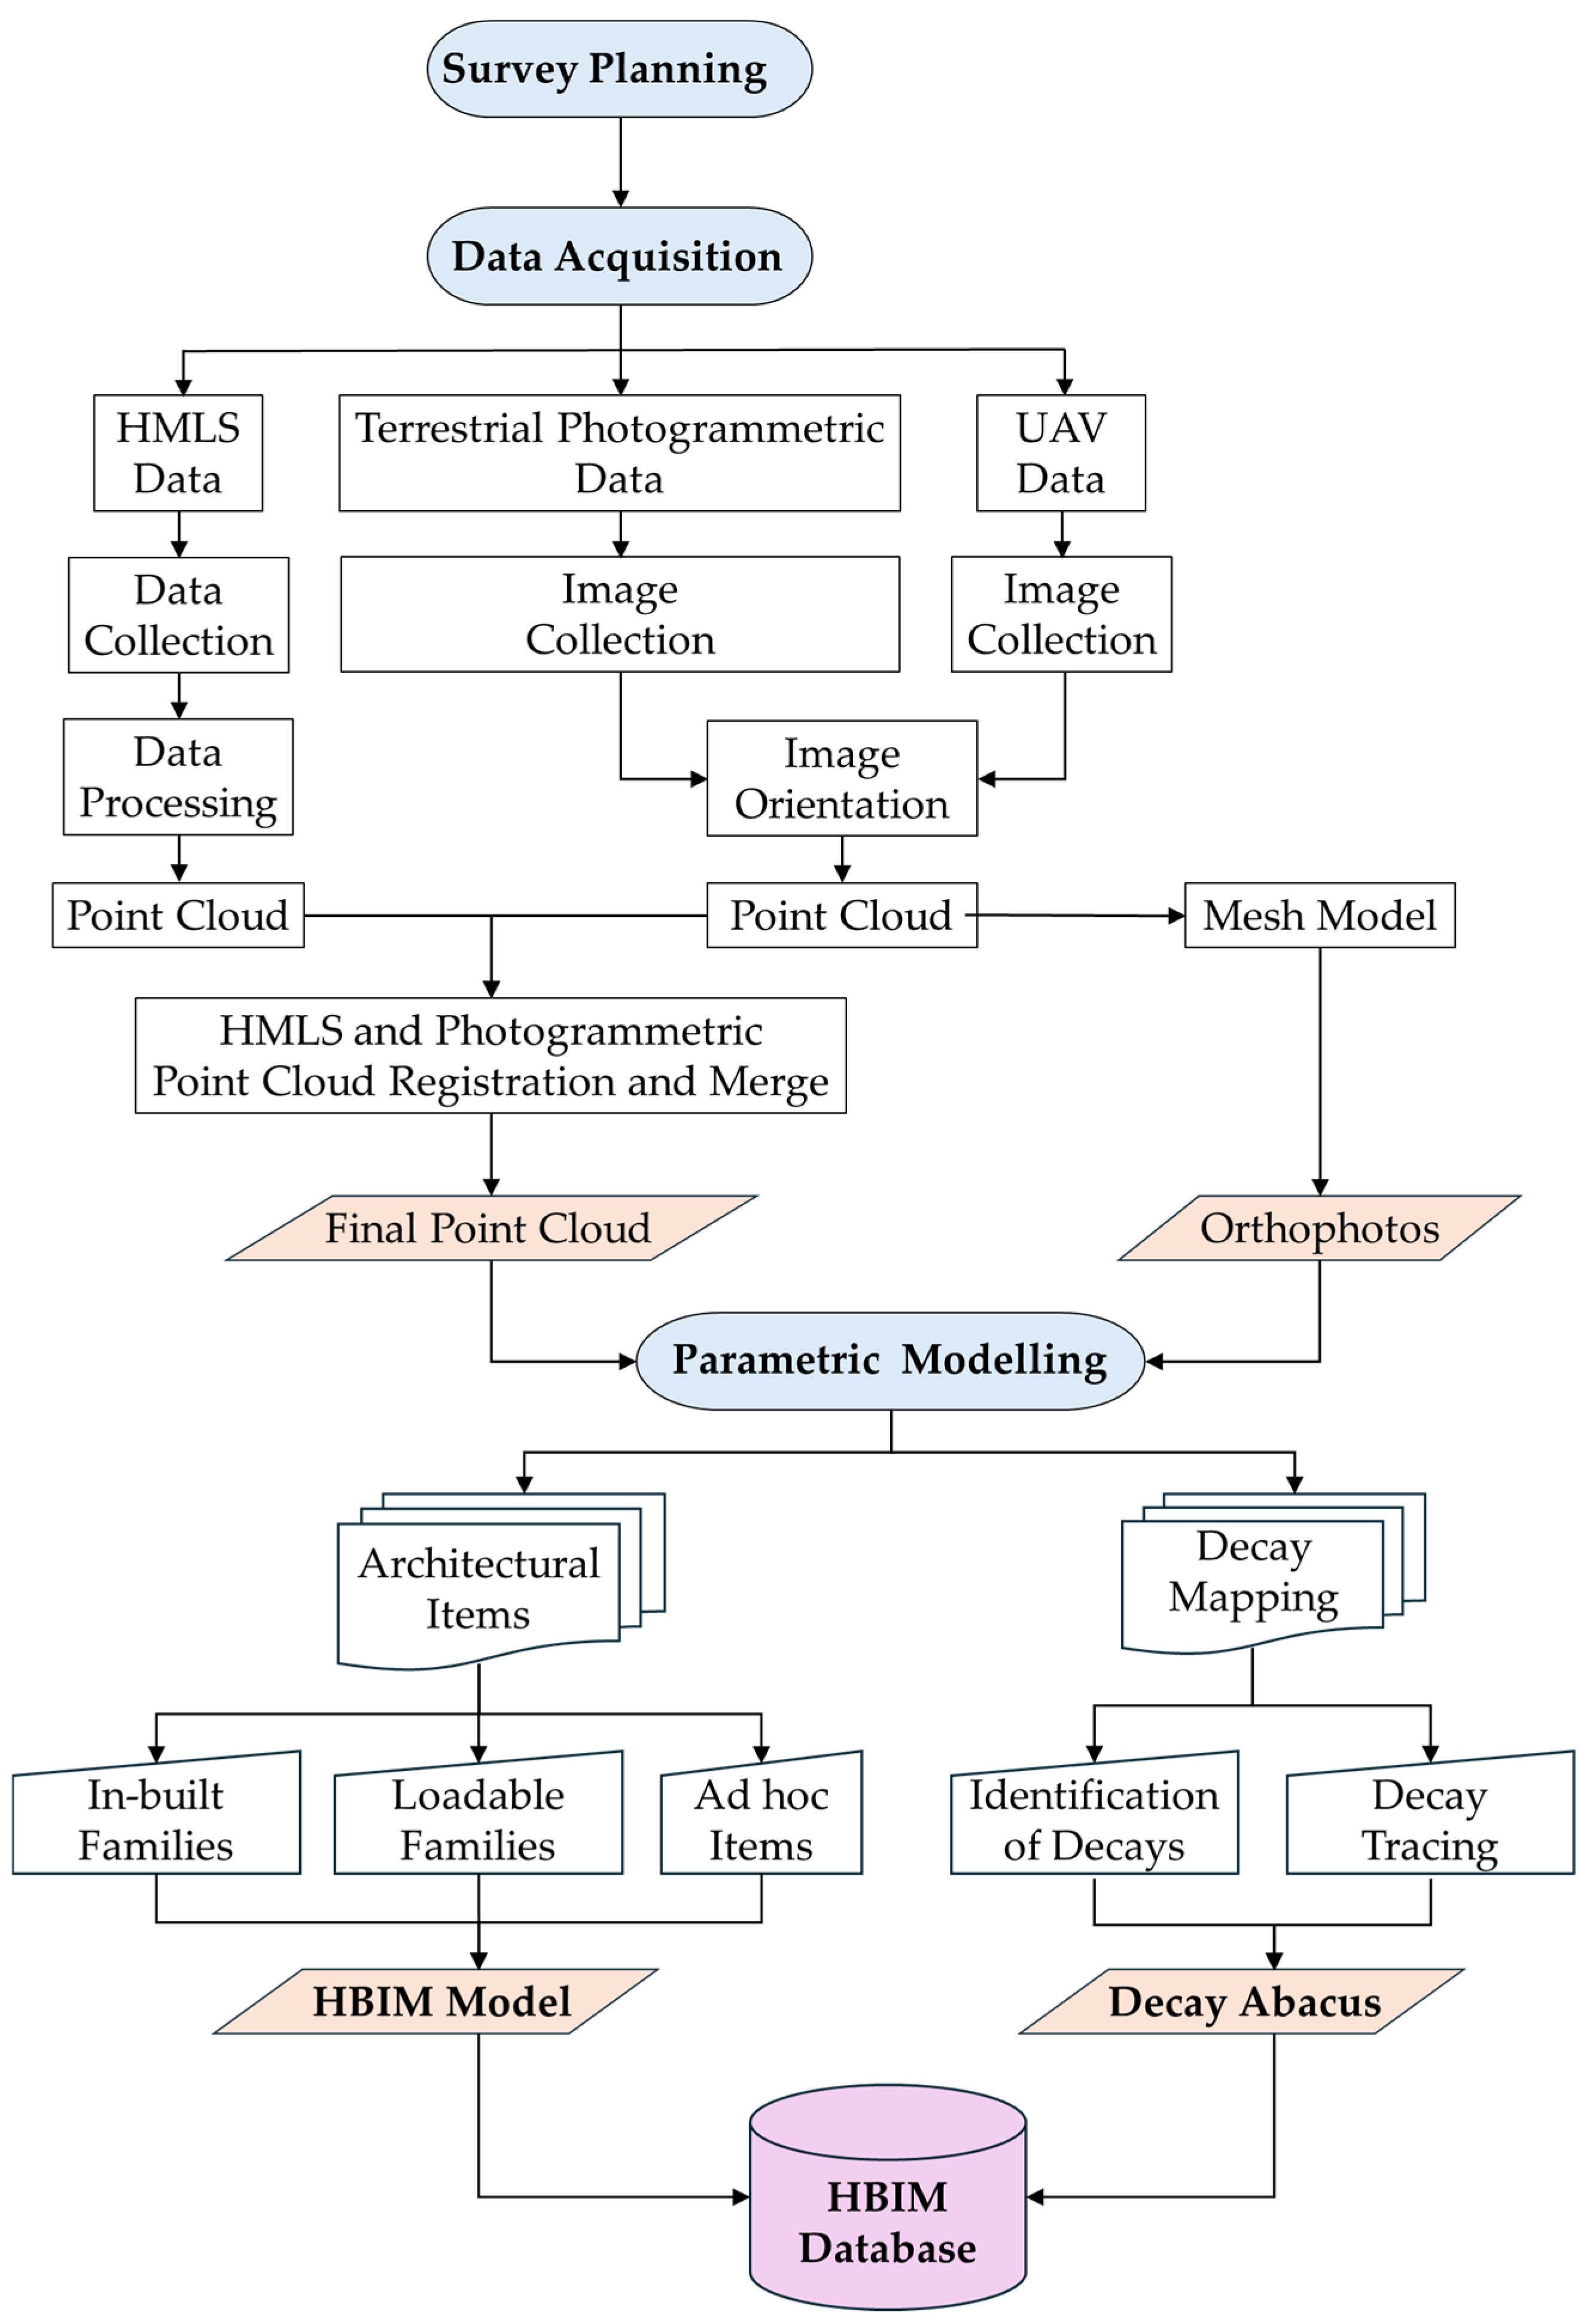
The digitization of the monumental complex needed the design of an operative workflow for the management and the coordination between the single phases of the work. Since the 3D data were also used for other research activities [37], a detailed 3D survey (integrating laser scanning technology and photogrammetry) was planned to acquire a complete documentation of the site in its as-is conditions, analyzing the relationship among its different parts. Before the survey, it was essential to identify any critical issues and the preferable approach to obtain the best result in the acquisition phase. After the survey operations, the geospatial dataset was processed to obtain a complete 3D model of the whole church, necessary to obtain the geometric information to be used as a reference for the construction of the HBIM model. After that, the modelling process enabled the achievement of the parametric model of the monument. Finally, the decay maps were generated over the main surfaces of the HBIM model, based on an analysis of the degradations of the building. The whole workflow has been reported in the flow chart in Figure 7.

3.1. The 3D Survey

Given the peculiar morphology of the area, especially for the interior of the church and the hypogea, with many narrow and confined spaces difficult to capture, a Handheld Mobile Laser Scanner (HMLS) was adopted as an efficient and cost-effective solution for the fast and dynamic acquisition of the whole complex. The laser scanner survey was carried out with a GeoSLAM Zeb Horizon RT HMLS. This system uses Lidar-based Simultaneous Localization and Mapping (SLAM) algorithms to produce a point cloud of the environment and to estimate the device position on the move. GeoSLAM Zeb Horizon RT has an acquisition rate up to 300,000 points per second, a maximum range of 100 m, a vertical angular resolution of 2°, and a horizontal angular resolution of 0.2°. Moreover, it has a relative accuracy up to 6 mm (when processing data in GeoSLAM Connect) and can produce colourised point clouds if it is equipped with the Zeb Vision system. During the acquisition, the device is monitored by a smartphone or tablet to check the path and the captured data in real-time.
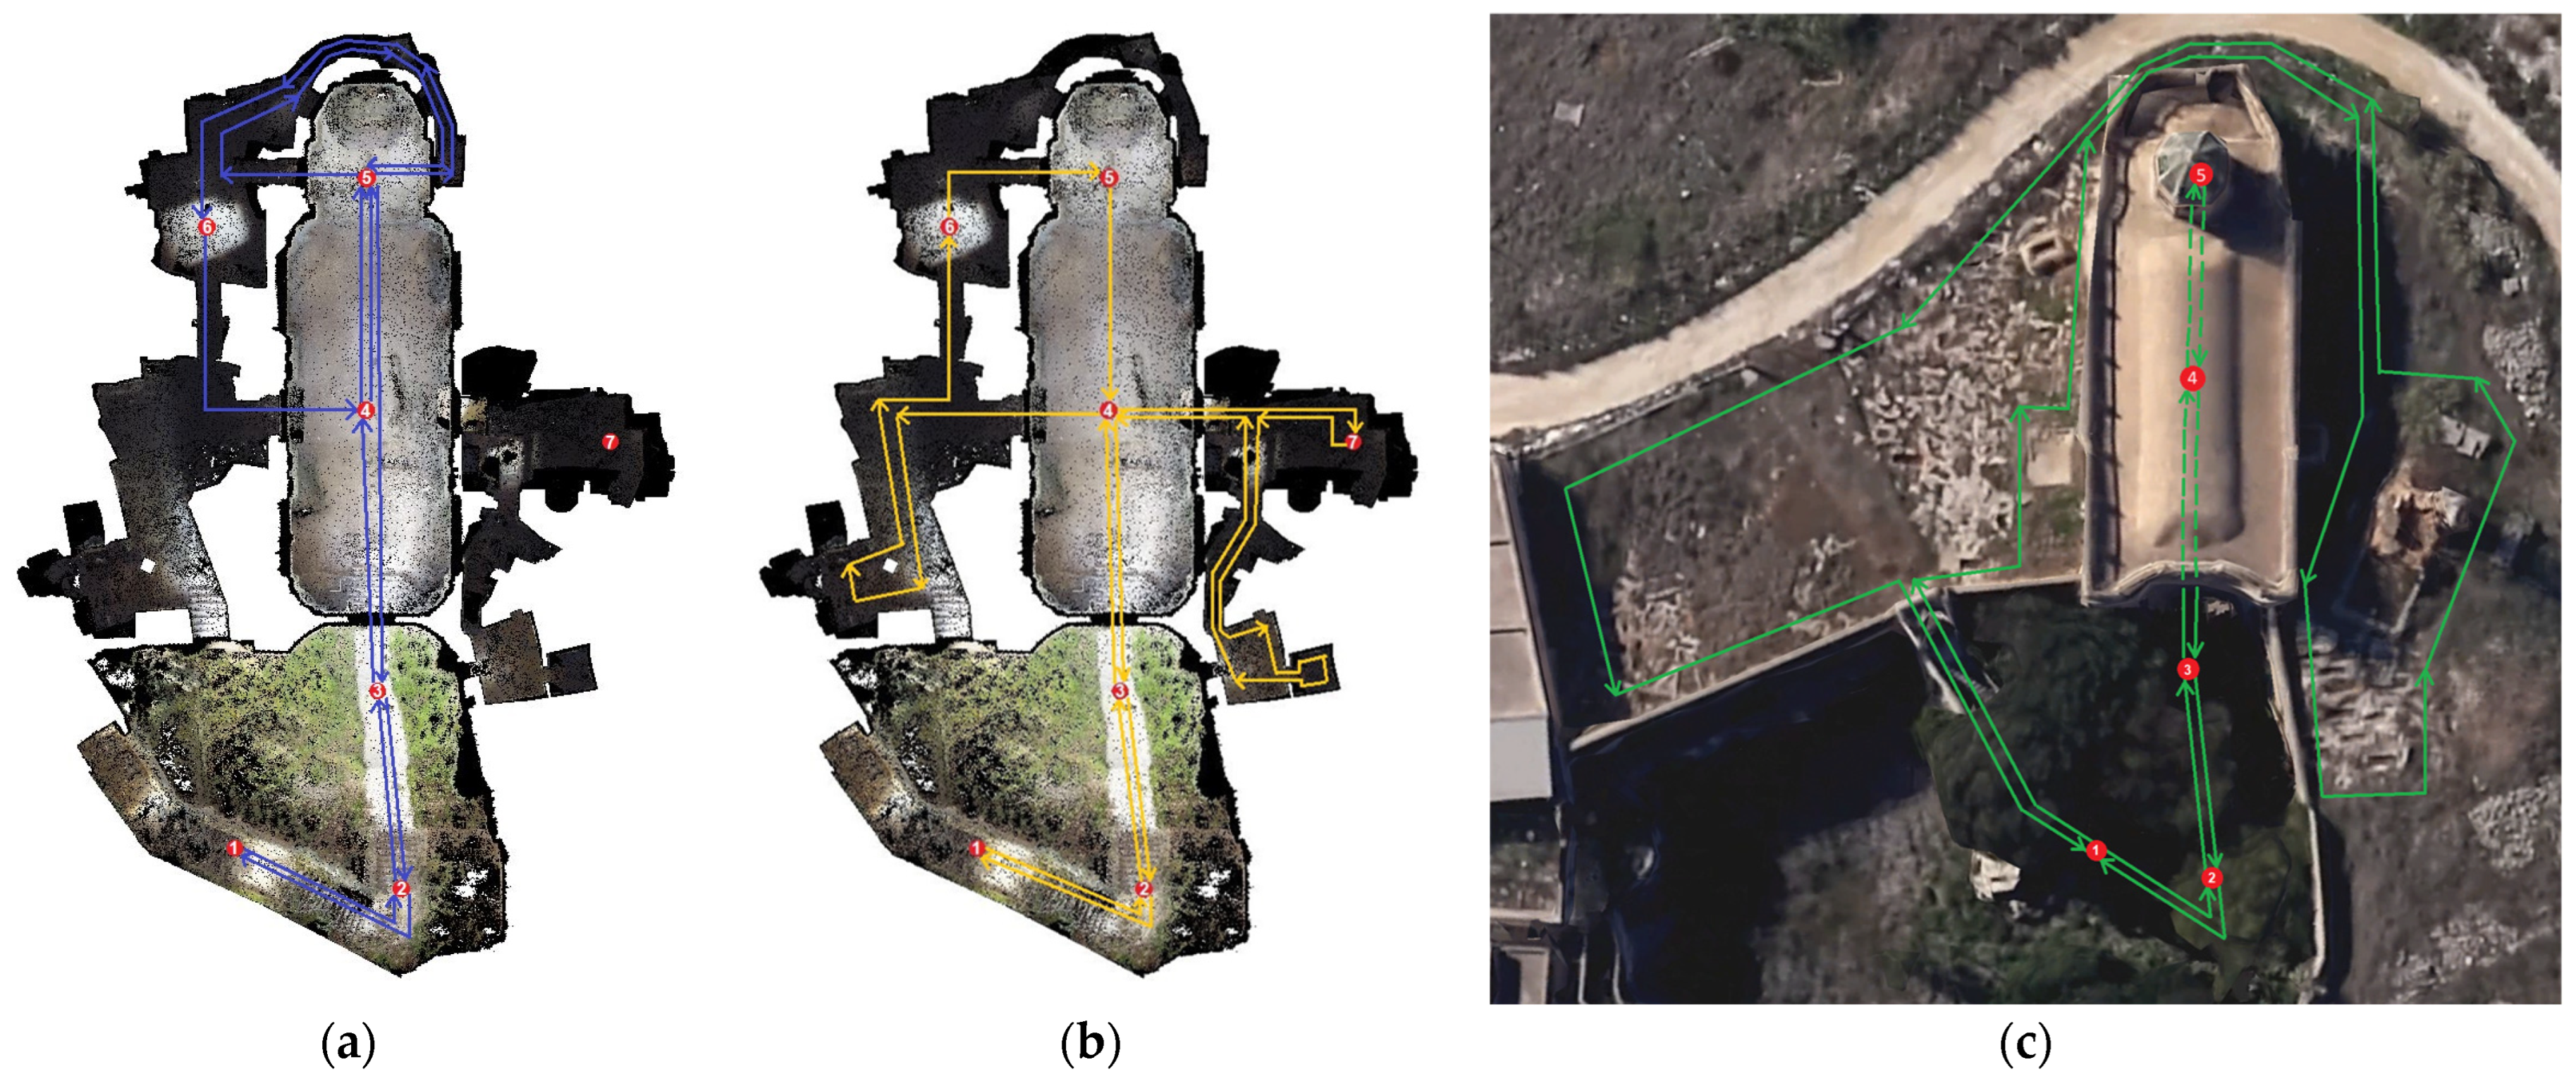
The paths of acquisition were properly designed to ensure uniform coverage of the surfaces without any gaps or discontinuity. In particular, three main closed trajectories were planned, taking care that they have common parts in the acquisition to check and improve the registration process if necessary (Figure 8). For the alignment of the scans, seven reference points were arranged along the paths, and were measured by stopping the device for a time sufficient to register their coordinates (just 10 s). One of these points was chosen as the starting and ending point for all the paths.
The photogrammetric survey with both aerial and terrestrial approaches was aimed at acquiring the parts of the complex that were inaccessible or unreachable by the HMLS (such as the roof of the church), and to generate high-resolution orthophotos of the main walls of the church to be used for decay mapping.
The aerial survey was performed with a Parrot Anafi drone, carrying out different flights over both the external area and the internal environments in the main nave of the church.
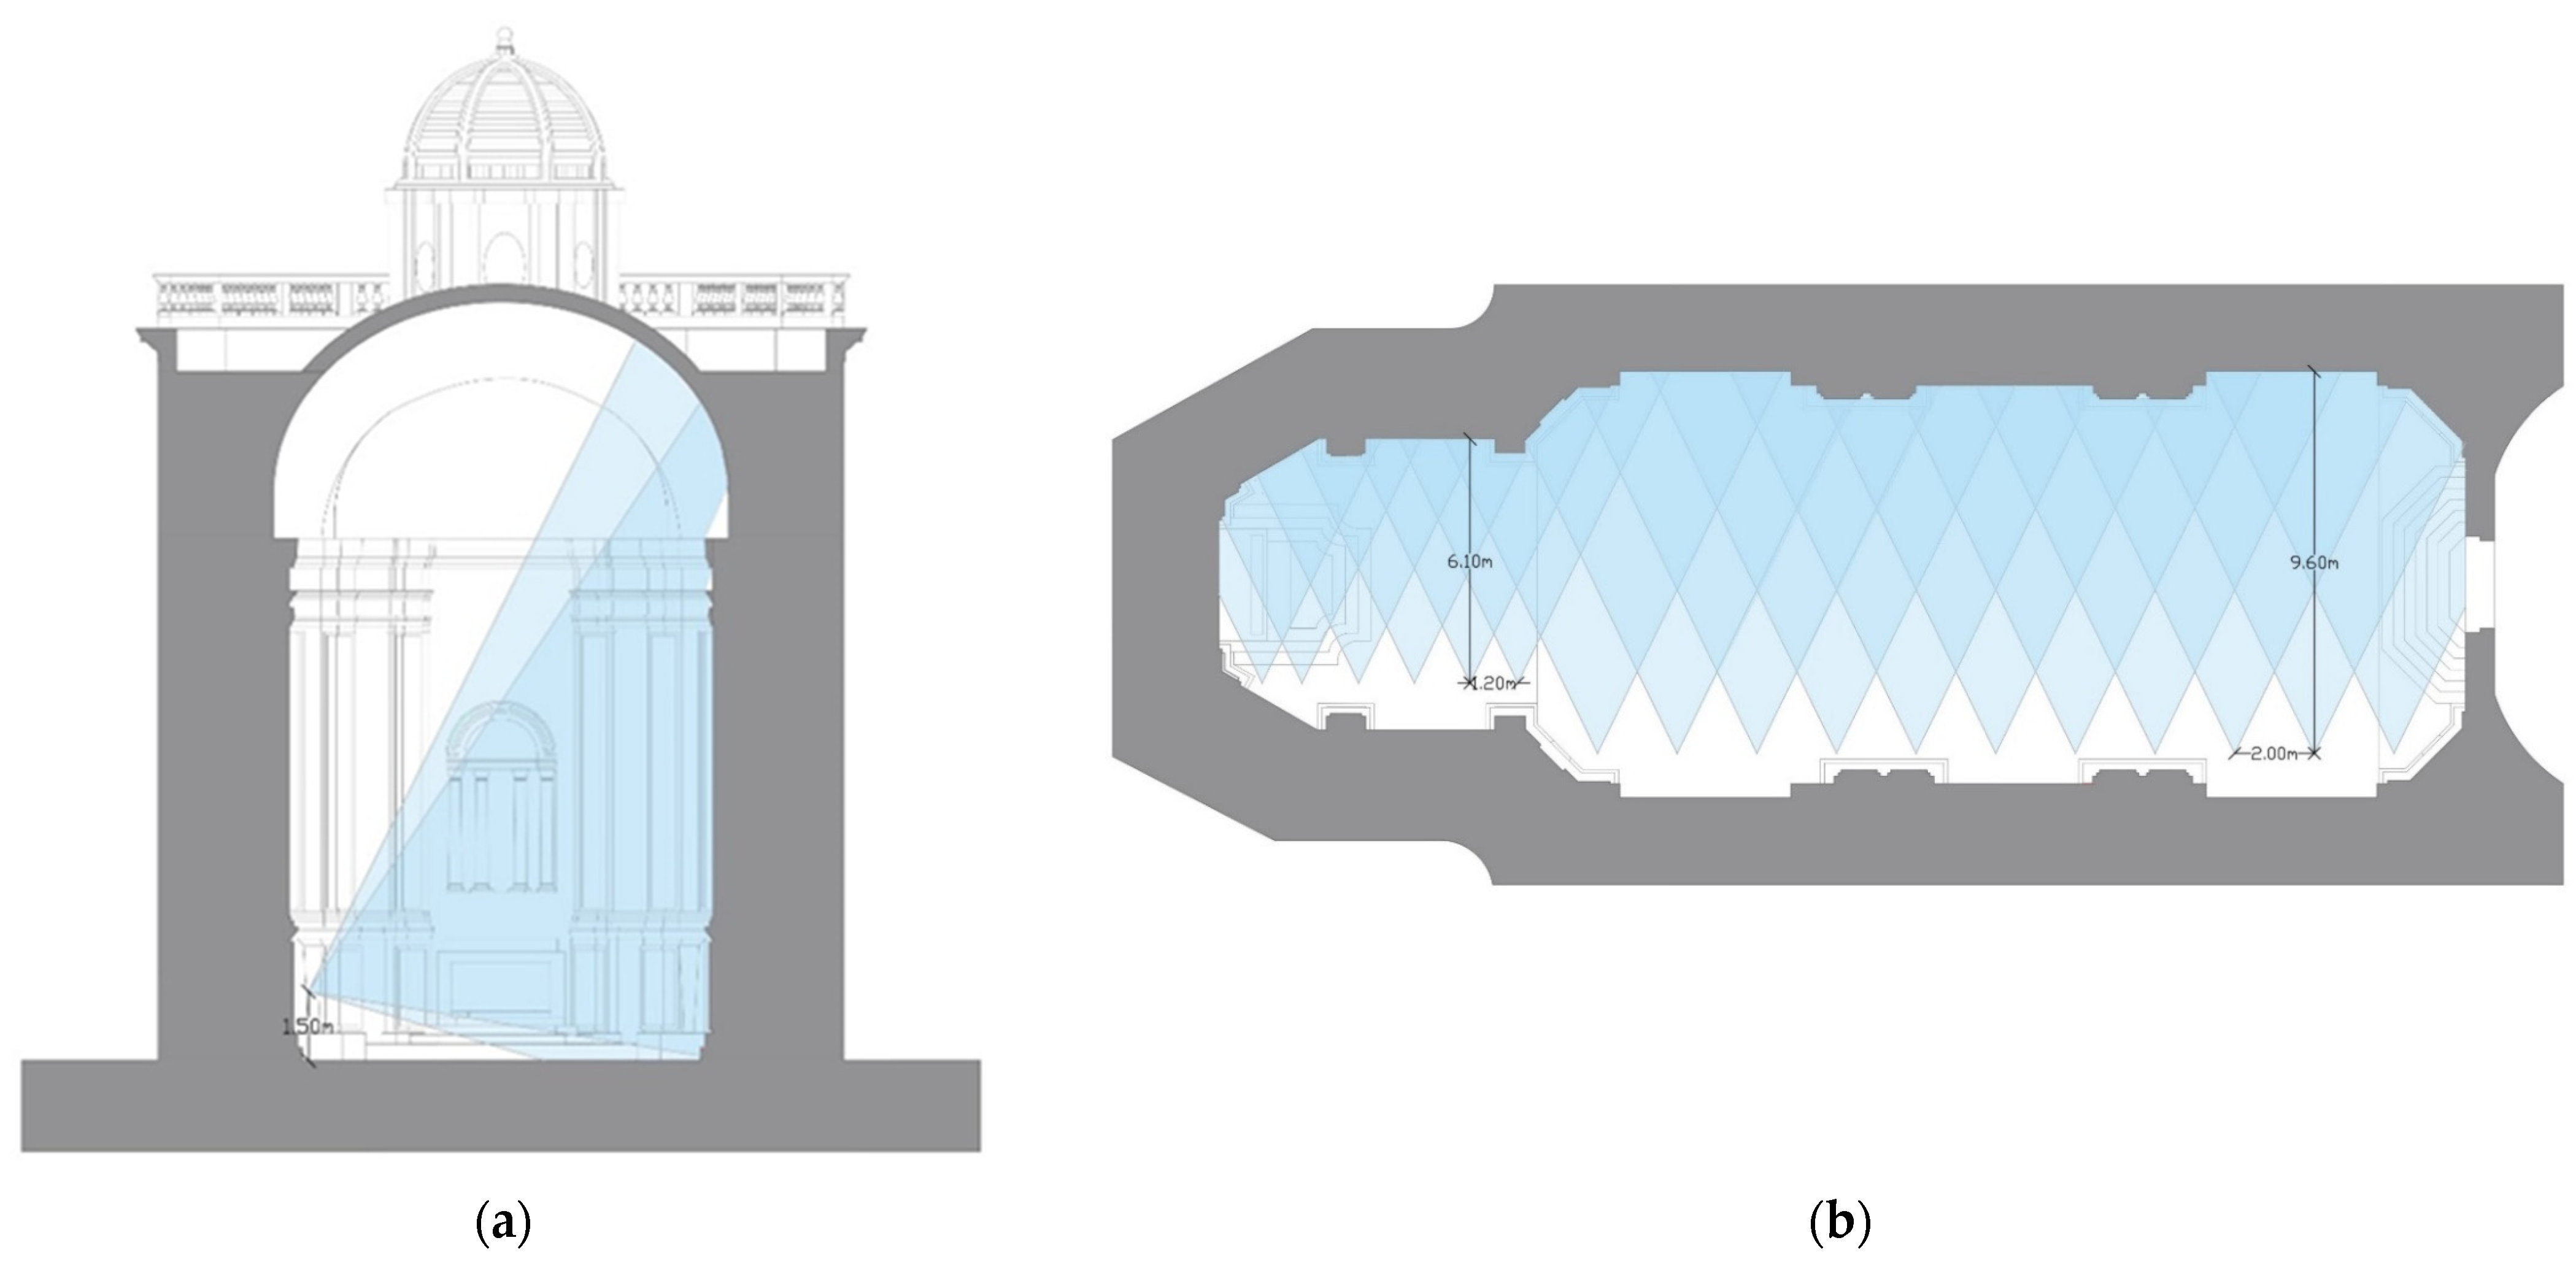
The flights of the external parts were carried out in an automated way through a nadiral acquisition for the Punic necropolis and its surrounding area, while convergent flights were performed for the roof, the dome, and the external walls of the church. The survey of the interior of the church was instead carried out with a very irregular flight executed in manual mode, trying to capture above all the highest and most inaccessible parts of the church. The photogrammetric survey of the interior was also integrated by a terrestrial acquisition carried out with a Sony α6000 mirrorless camera. This acquisition focused only on the two longitudinal main walls and comprised two stereoscopic strips parallel to each wall, with two different camera tiltings (Figure 9).

3.2. Processing of the Acquired Data

The outputs of the HMLS survey consisted of three different point clouds, post-processed by the GeoSLAM Connect software. The points distributed on the paths were taken as a reference and addressed the correct first alignment of the point clouds. A further improvement of the registration was made via an automatic cloud-to-cloud procedure using the common part of all the point clouds (the main nave of the church). The final point cloud of the entire complex, obtained by merging the point clouds, was characterized by about 360 million points with an average resolution of about 4 mm; this initial dataset was manually segmented using the Interactive Segmentation tool in CloudCompare software ver. 2.13.1 and limited only to the structure of the church, where the hypogea and the necropolis were stripped off, obtaining a cluster of about 186 million points. Since this point cloud was still difficult to handle for modelling, the Spatial Subsample tool of CloudCompare software was used for sampling the point cloud with a minimum distance between points of 8 mm; this process reduced the number of points to about 80 million.
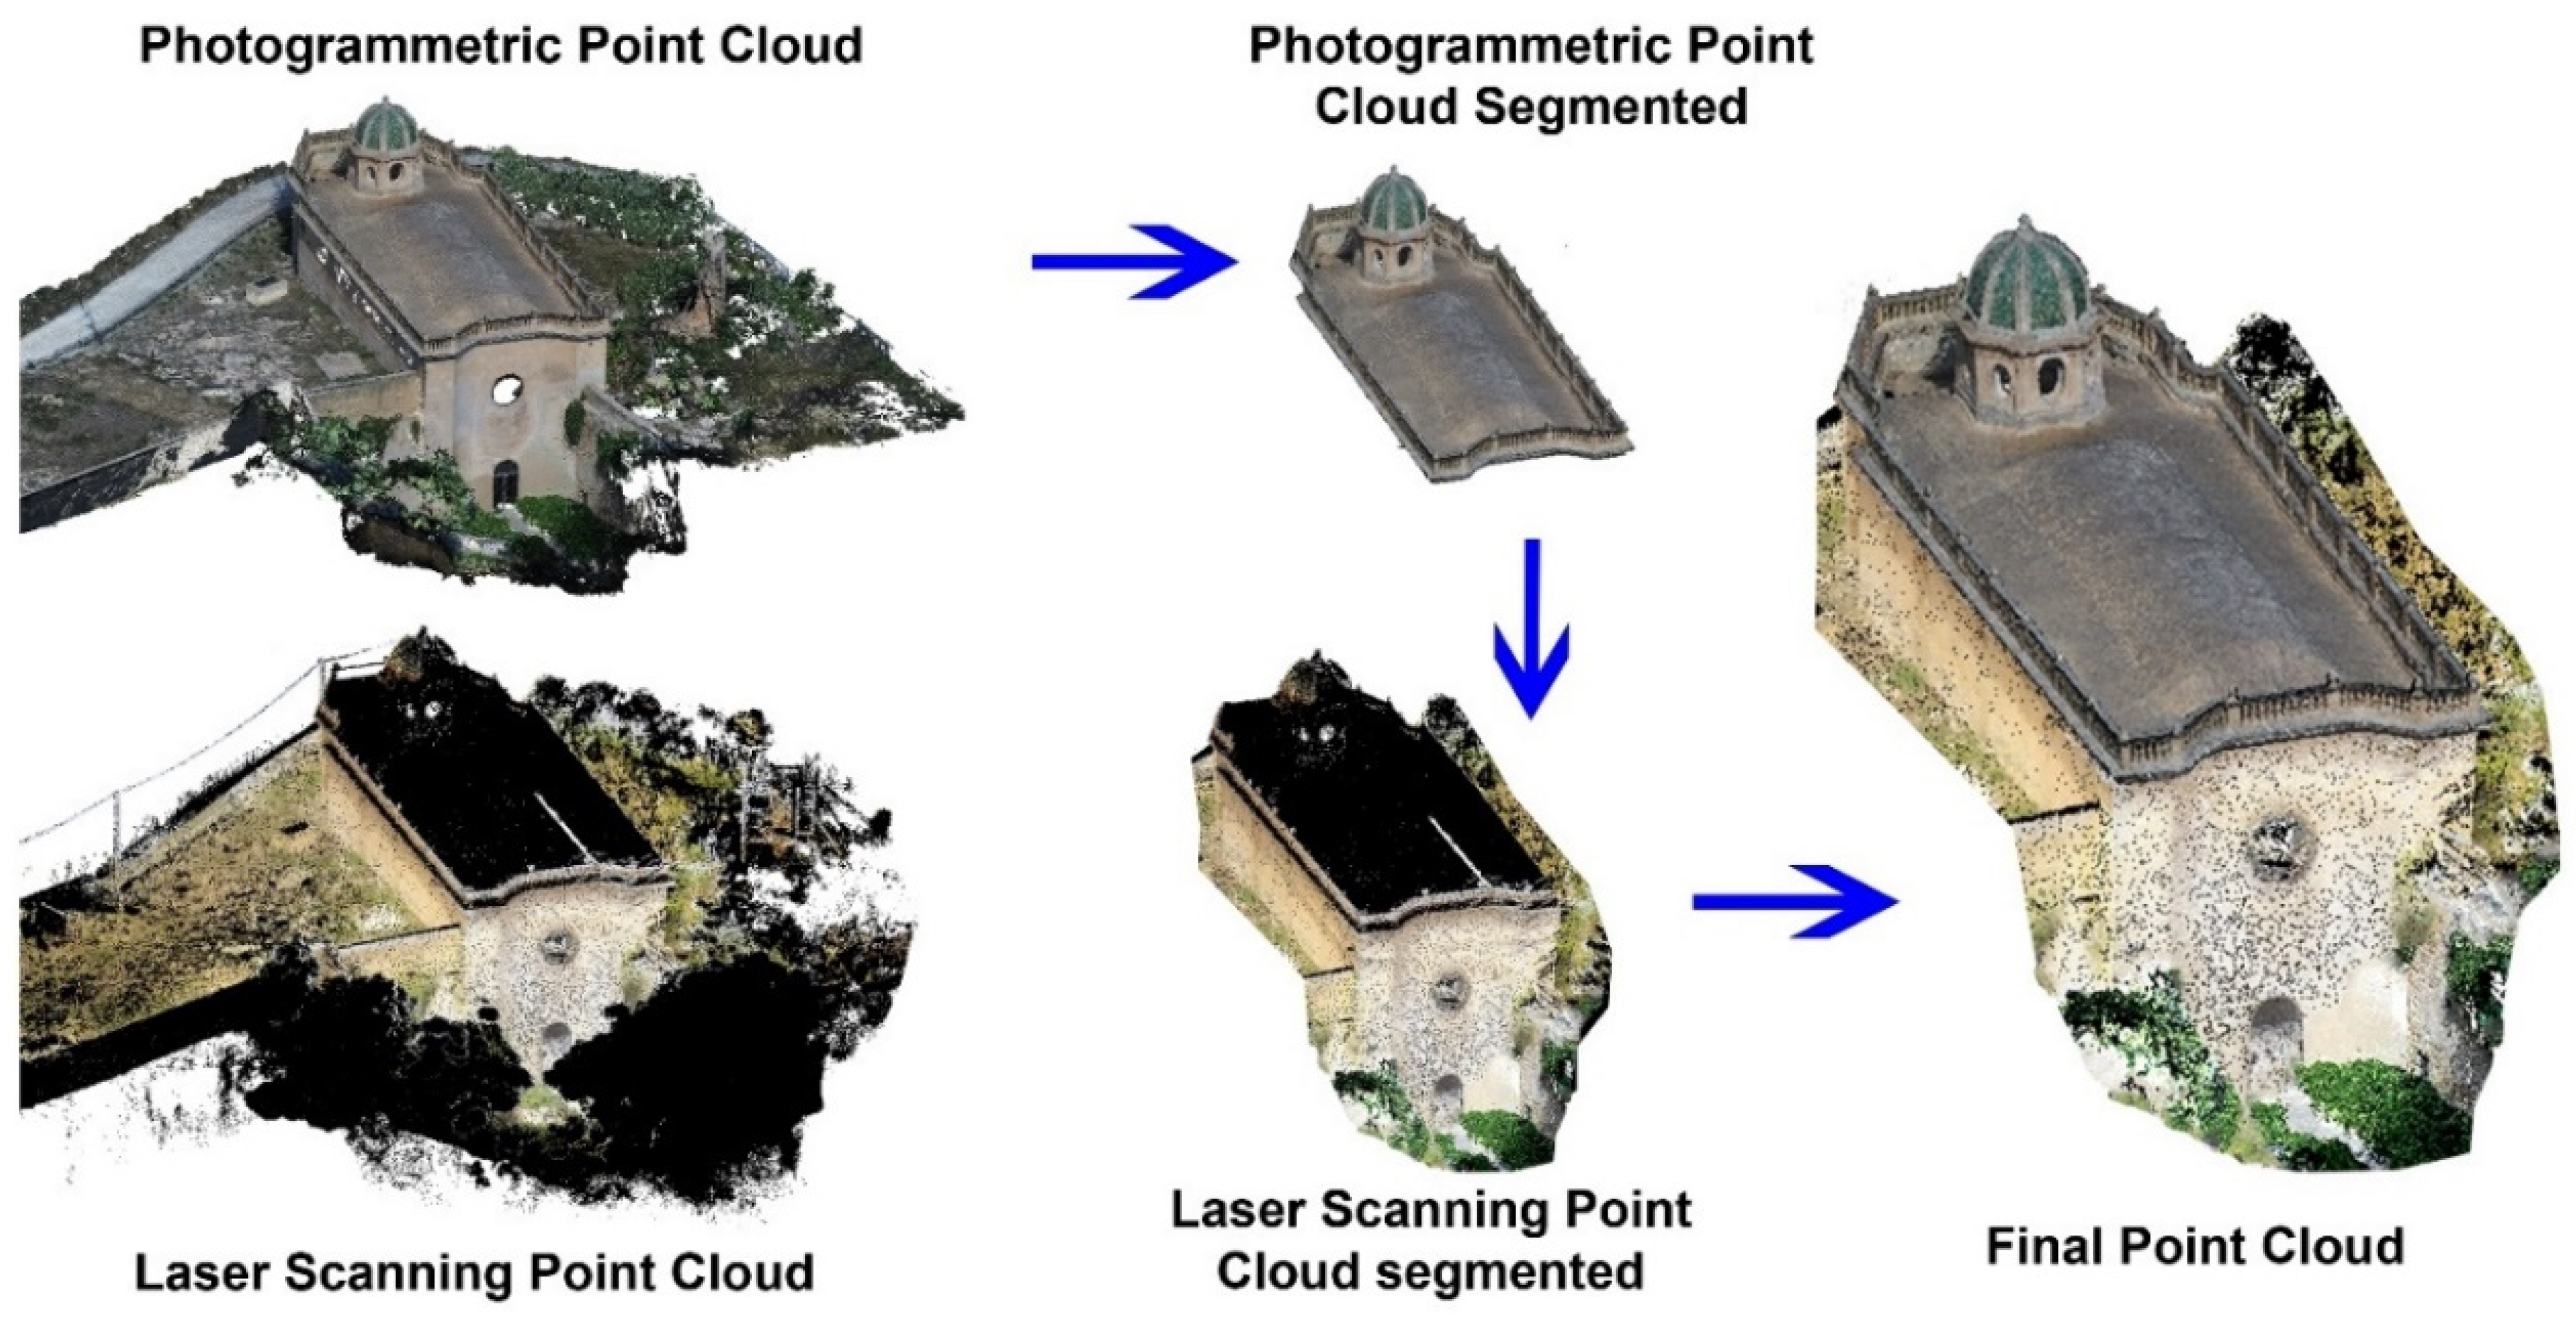
The photogrammetric processing was managed through Agisoft Metashape ver. 2.1.2 software. The outdoor photo acquisitions from the drone were used to acquire the point cloud of the external area of the church. The process was performed through the software’s standard and well-known workflow based on Structure from Motion (SfM) algorithms (loading data, aligning images, optimizing cameras, building point cloud), integrating some ground control points measured with a total station to solve the bundle adjustment procedure of the optimization step. The process delivered a 40 million-point cloud of the external parts of the church. This dataset was aligned to the laser scanner point cloud by a cloud-to-cloud registration process. Considering the redundancy of information between the laser scanner and the photogrammetric data acquired on the common surfaces, discarding the photogrammetric data of the church facades and retaining only the points of the church roof (not acquired via laser scanner) was deemed appropriate. Therefore, the photogrammetric point cloud was segmented with a manual process, also using the Interactive Segmentation tool in CloudCompare software in this case, to obtain the part of the data needed to complete the point cloud of the church. The part of the retained roof was finally merged with the laser scanner 3D dataset to obtain the complete point cloud of the church to use for the parametric modelling in the BIM environment (Figure 10). The local reference system was imposed with the X-axis along the main façade and the Y-axis along the long side of the church to simplify the subsequent modeling phase in BIM; to fit this requirement, the point cloud was roto-translated in CloudCompare.
The analysis of the decay was carried out based on the texture information provided by the orthophotos of the external and internal main walls of the church. Considering the main external walls of the church, the orthophotos were obtained from the photogrammetric process that involved the external area of the church.
Instead, the orthophotos of the internal walls of the church were obtained with a photogrammetric project (using SfM elaboration) in Agisoft Metashape ver. 2.1.2 software that involved different indoor acquisitions. A unique project was created integrating aerial indoor image acquisitions from an Unmanned Aerial Vehicle (UAV) with terrestrial indoor image acquisitions. Overall, four orthophotos were produced for the two long sides of the nave of the church: two for the external and internal parts of the right side, and two for the external and internal parts of the left side (Figure 11). These products were necessary to conduct a detailed analysis regarding the state of degradation of the interior of the church.

3.3. The Parametric Modelling

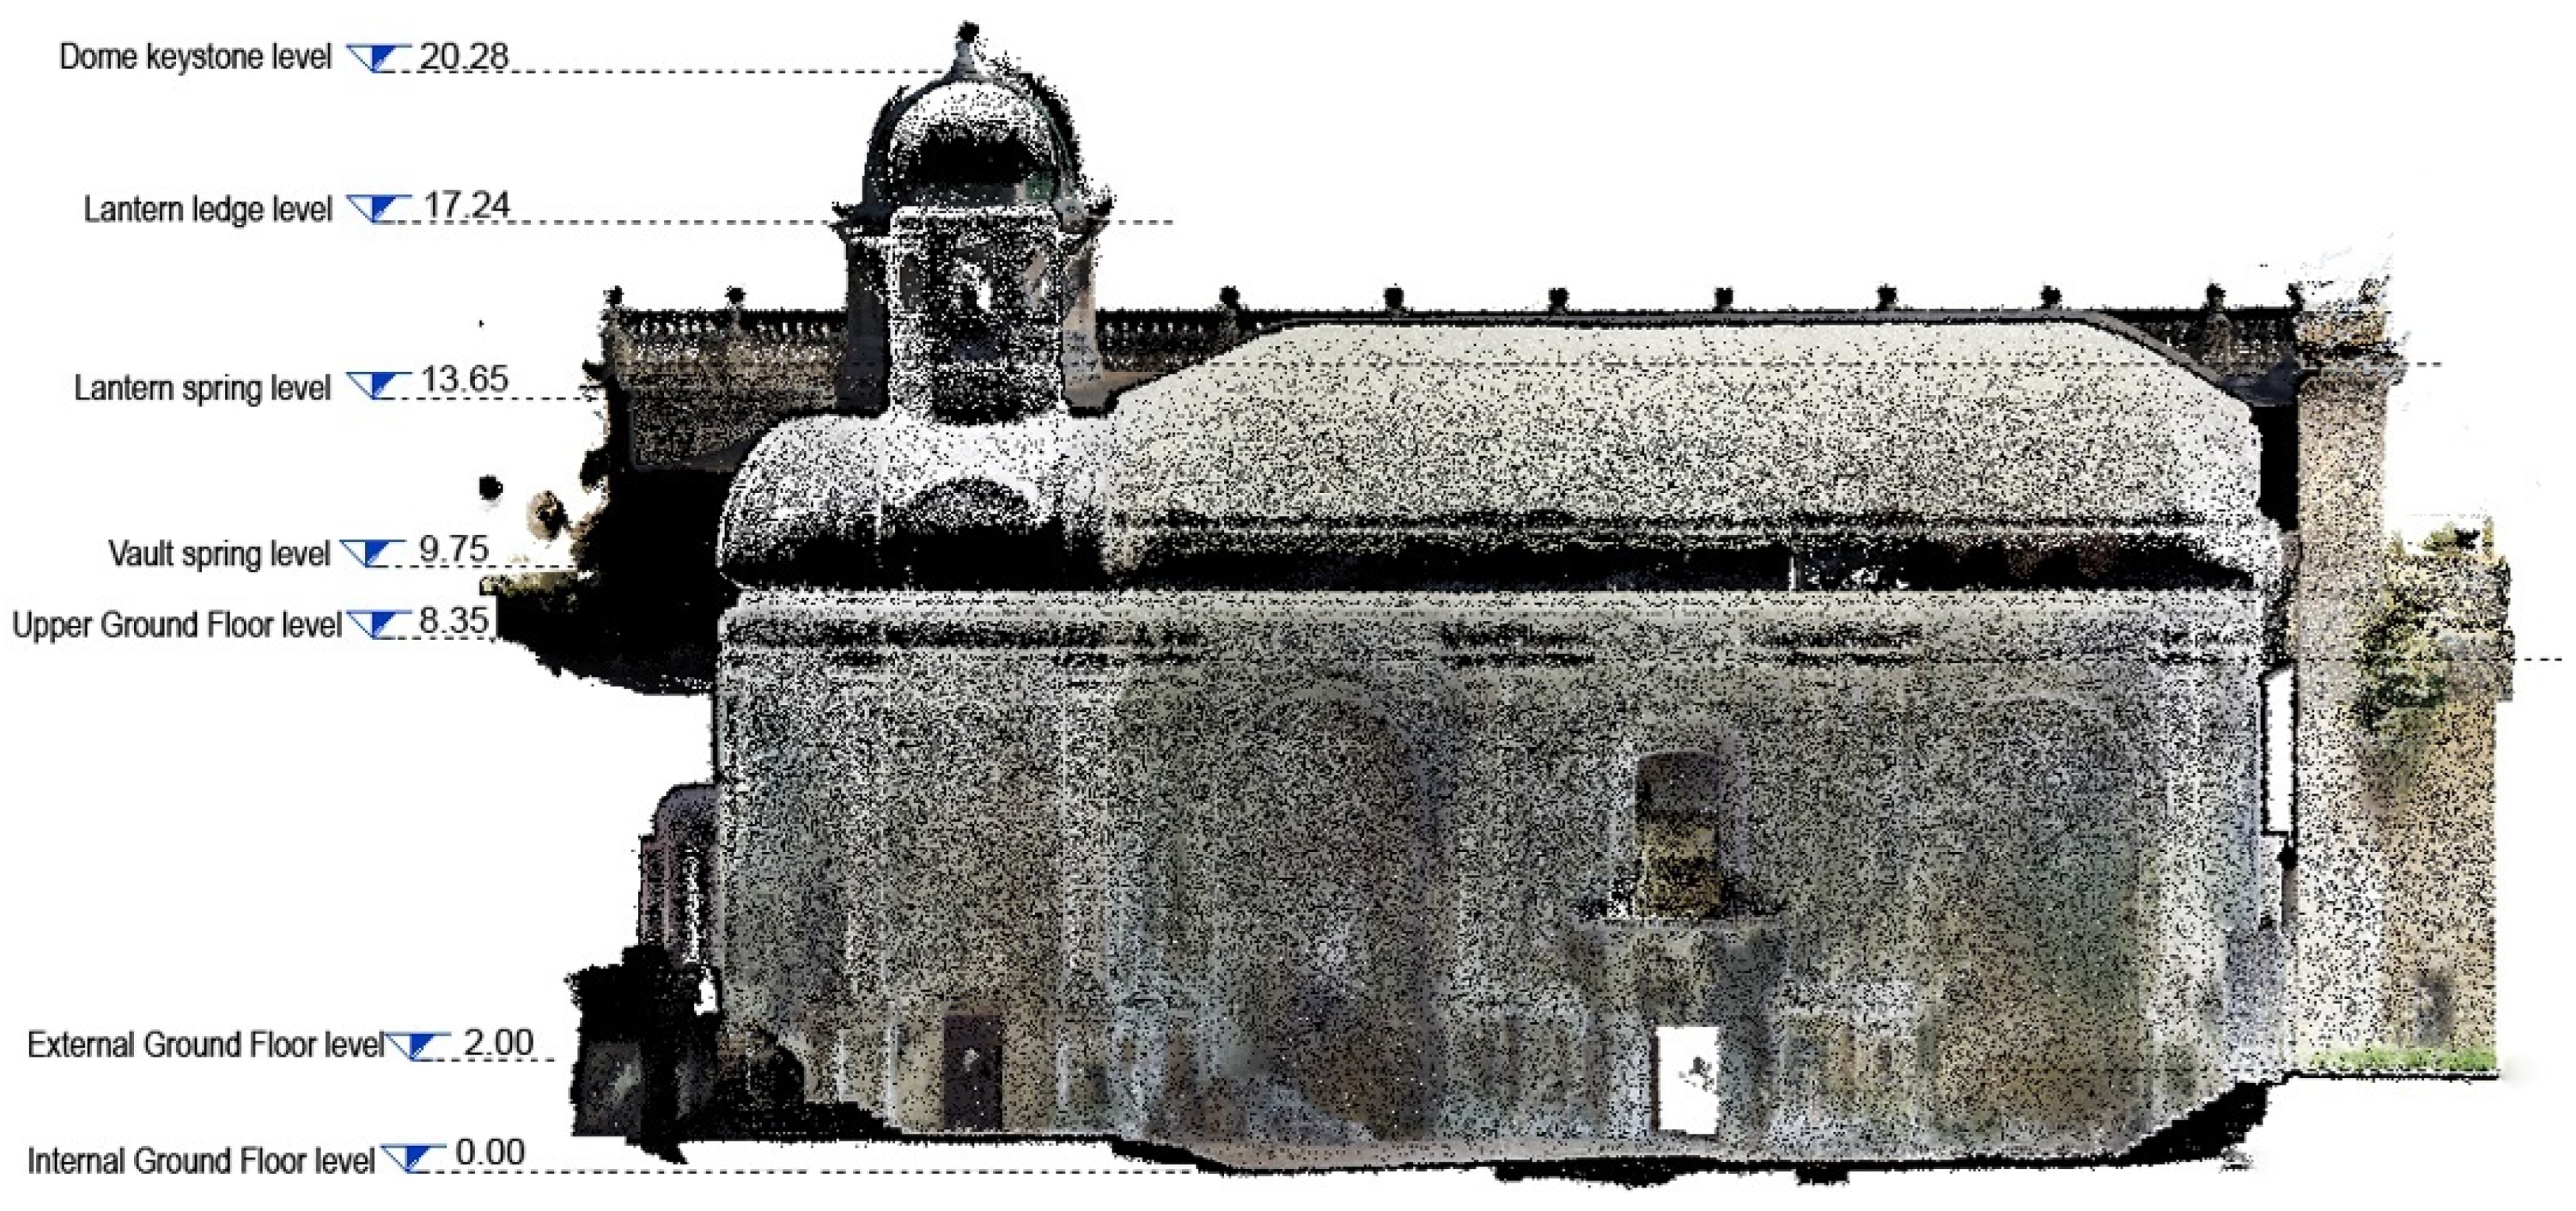
The survey provided the necessary geometric data for the 3D parametric modelling and thematic mapping of decay in a BIM environment. Autodesk Revit ver. 2023 software was chosen for this stage of the work. The modelling phase was divided into several steps. The point cloud from the integrated surveys was first imported into the software, blocked in its position, and used as a geometrical reference for BIM modelling operations [38]. After the definition of the main reference planes such as levels and significant sections (i.e., internal and external ground floors, the roof springing, the dome extrados, axial cross and longitudinal sections on different spans of the church, etc.) (Figure 12), a system of views was created for the identification of the architectural system and the correct spatial insertion of the parametric items.
The proper modelling phase started with the decomposition of the structure into simpler architectural elements. All these items were modelled with manual procedures according to the tools available from the BIM environment provided by the Revit software, such as the in-built system families, the loadable families, and the “in-place” families; these categories enabled parametric modelling in a top-down approach, from the simplest items to the ones that needed more attention.
Given our case study, the analysis of the point cloud from the reference levels suggested the correct strategy to be adopted for the 3D parametric modelling of each architectural element.
The in-built families, groups of elements controlled by the type and instance parameters, enabled the digitization of walls, floors, and balconies in their geometric features and constraints, following the respective outlines revealed by the point cloud in plans and sections (Figure 13).
For instance, the point cloud plan view revealed the presence of double-shelled vertical walls with a constant thickness not visible during survey operations. In this case, the walls were modelled according to their actual outline following the path delineated by the point cloud. Considering the modelling of the floors, the different floorings in the main nave and the presbytery area were shaped following the perimeter suggested by the trace of the point cloud. The same operation was followed for the two balconies of the galleries. Although these in-built families offer the possibility to start the modelling phase, the HBIM process, unlike conventional BIM, does not allow a universal execution plan but needs to be implemented ad hoc according to site-specific variables [39].
The 3D digitization of the other architectural features in the building, characterized by both a structural and decorative function and appearance, required more flexible, non-standard solutions. In this phase, it was necessary to schematize the geometric information in a parametric object and, at the same time, to consider the complexity of the geometric representation, trying to find the true balance between the level of accuracy and the level of simplification [40,41]. Furthermore, since the 3D modelling was aimed at decay mapping, it was necessary to decompose the monument according to the final aim of its 3D digitization [42]. All the architectural items, especially the repetitive decorative components not modellable using default families, were generated using external loadable families.
Regardless of the BIM modelling process based on external loadable families, it starts with the generation of a parametric profile extracted from the point cloud, and the next customization of the shape according to the geometric features. Once the profile is defined, Boolean operations allow the items to be shaped as solids or voids. The parametric nature of these objects allows the geometries to be customized according to the shapes of the real structure. Thanks to their peculiar adaptability, loadable families are the most valid solution for satisfying any customization requirement, especially for irregular elements affected by potential deviations.
In our case study, samples of loadable families inside the monument were used to model elements that contribute to characterizing the architectural style of the church. This was the case for the moldings framing the fascia on the top walls, the pillars protruding from the walls’ plane, and the rose window.
The fascia was generated using a wall profile inside the software, drawing and extruding its shape along the whole perimeter of the church (Figure 14).
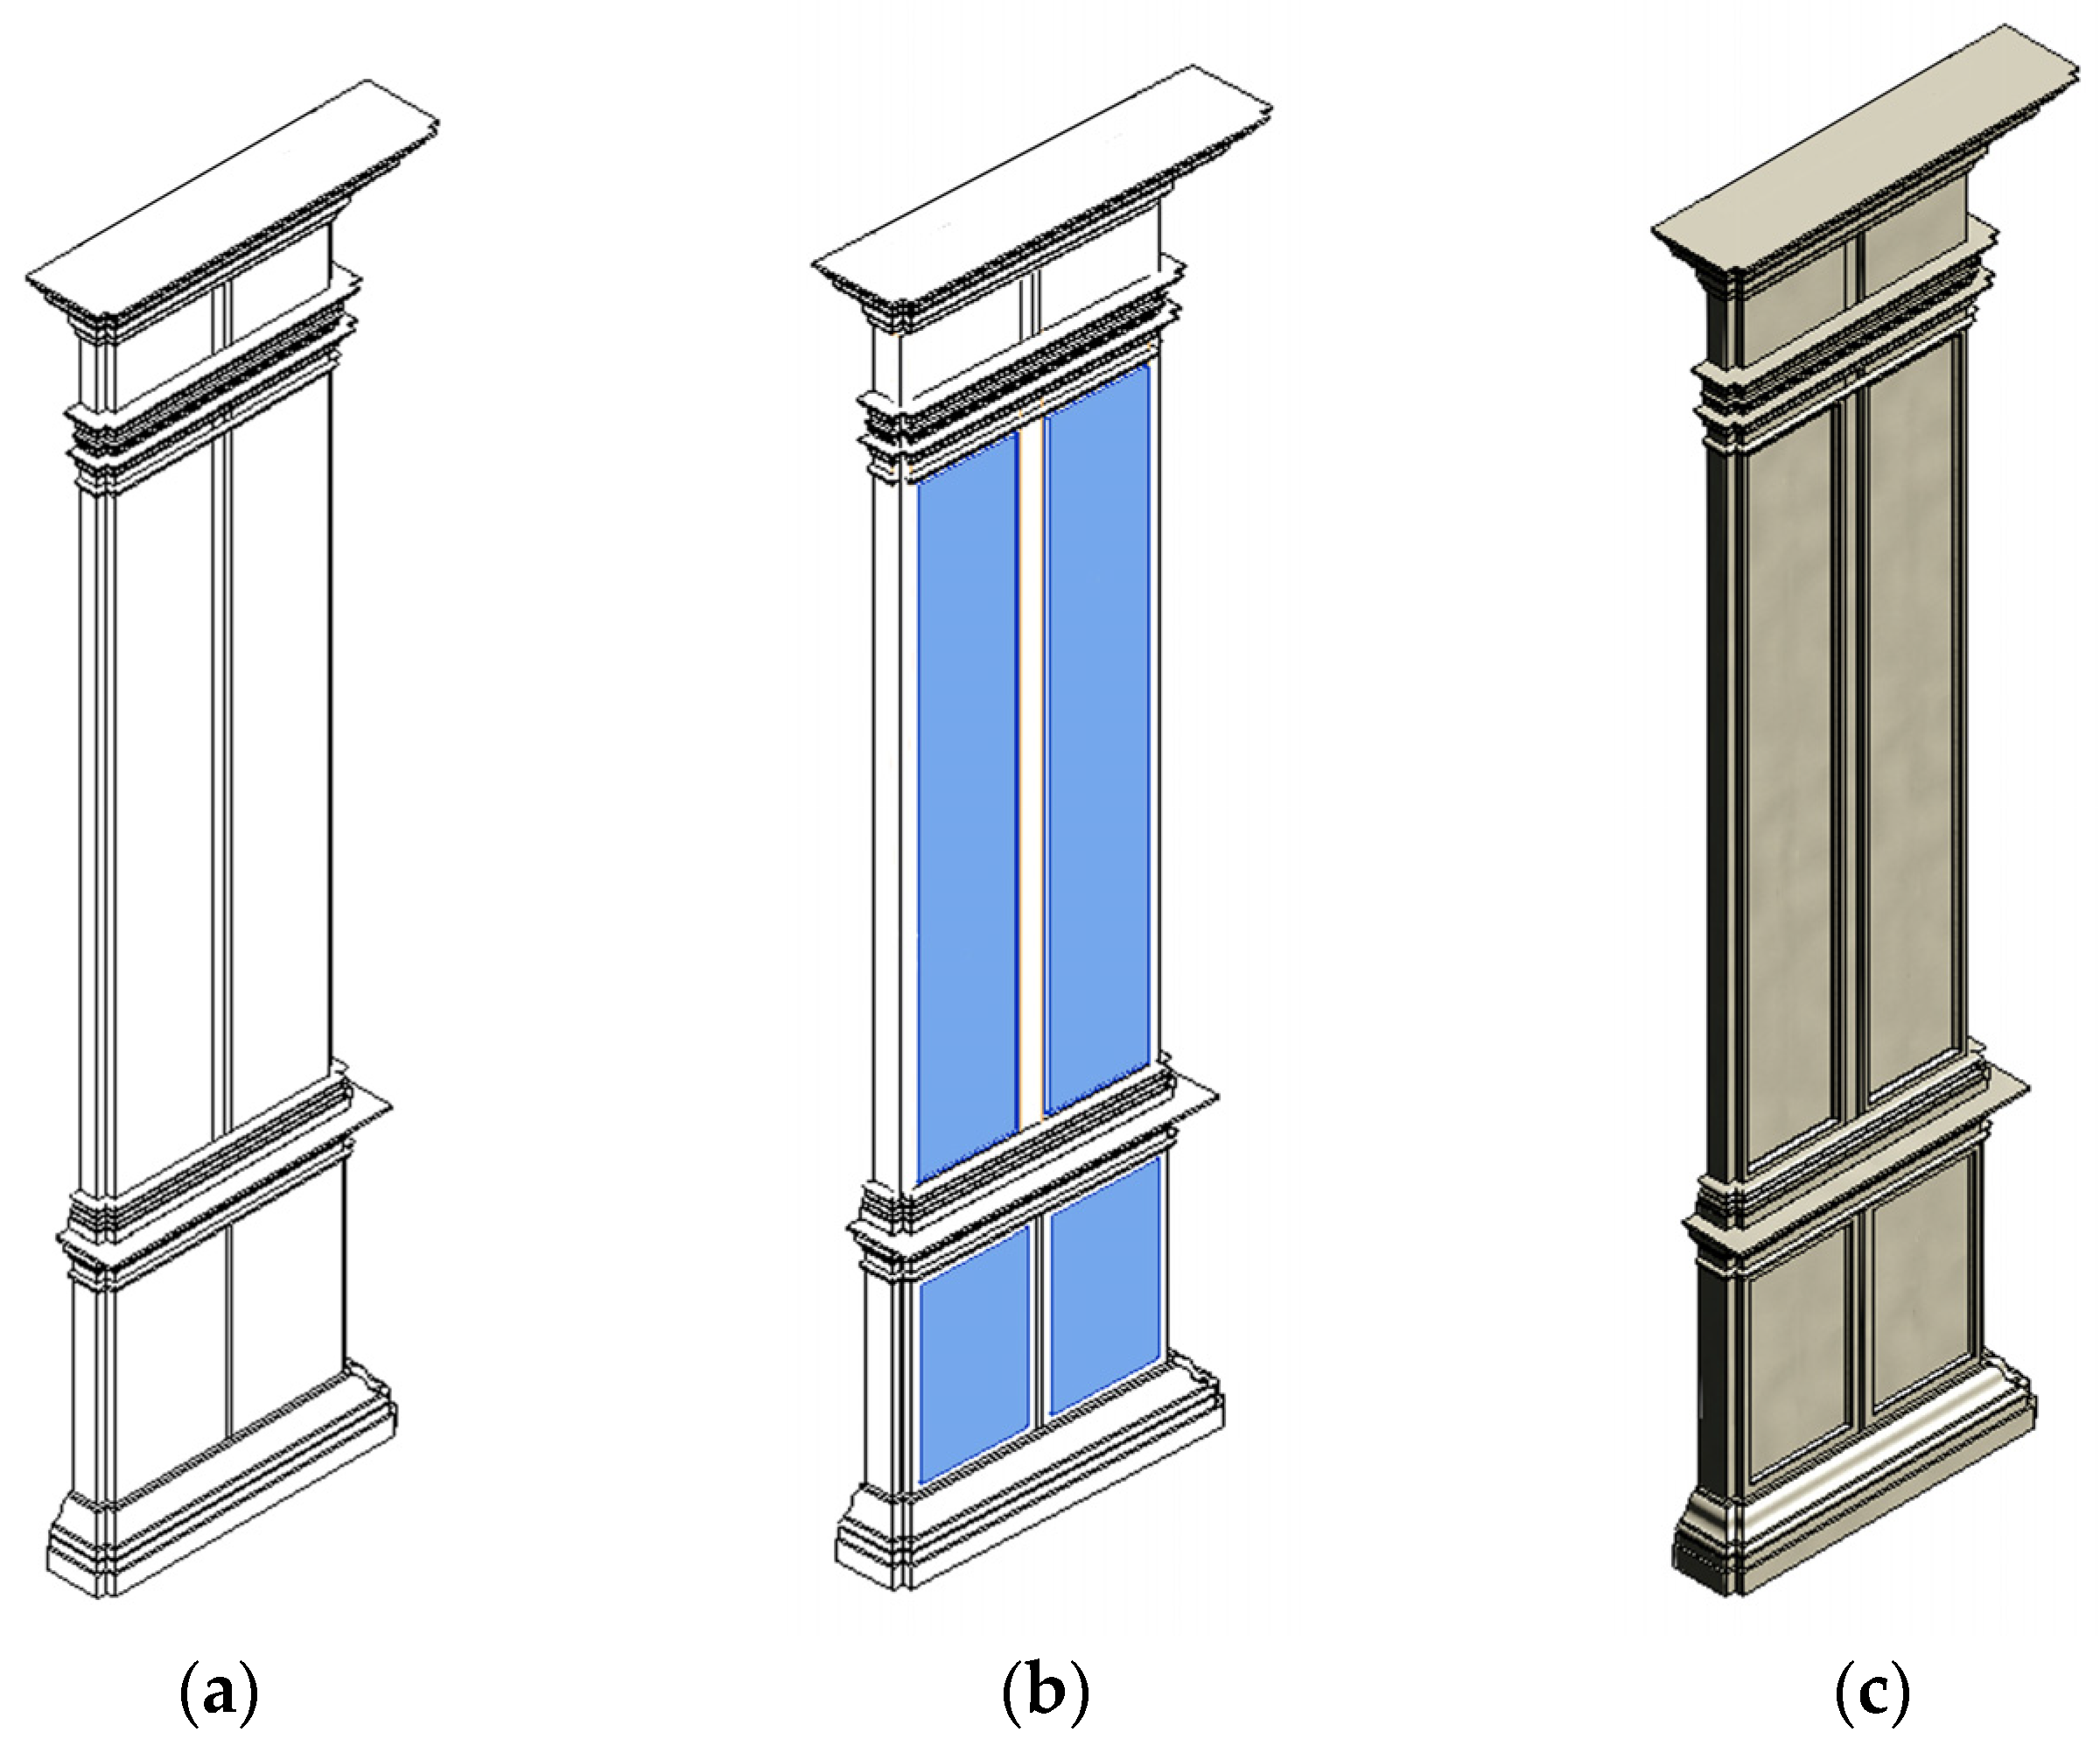
The pillars located inside the monuments represented three categories of the Tuscanic giant order: single pillars, doubled pillars, and angular ones. The modelling of the three categories followed the same framework, based on a combination of Boolean operations to shape their moldings and recessed profiles. For descriptive purposes, only the sample of the double pillars has been reported here. For easier modelling, the pillars were divided into two parts according to their length. Figure 15 shows the rendition of the pedestals. However, the method used for the shaft was pretty much similar. At the end of this process, the obtained model for this type of column is shown in Figure 16.
The rose window was made by two concentric circumferences of dissimilar diameters on the façade and the counter façade. The window was modelled by subtracting a void cylindrical extrusion from the interested wall. Once the void cylinder was obtained, its external face was splayed on a wider diameter. Then, the annular moulding all around was finally obtained and added to the window as a solid revolution of a closed profile on a 360° angle (Figure 17).
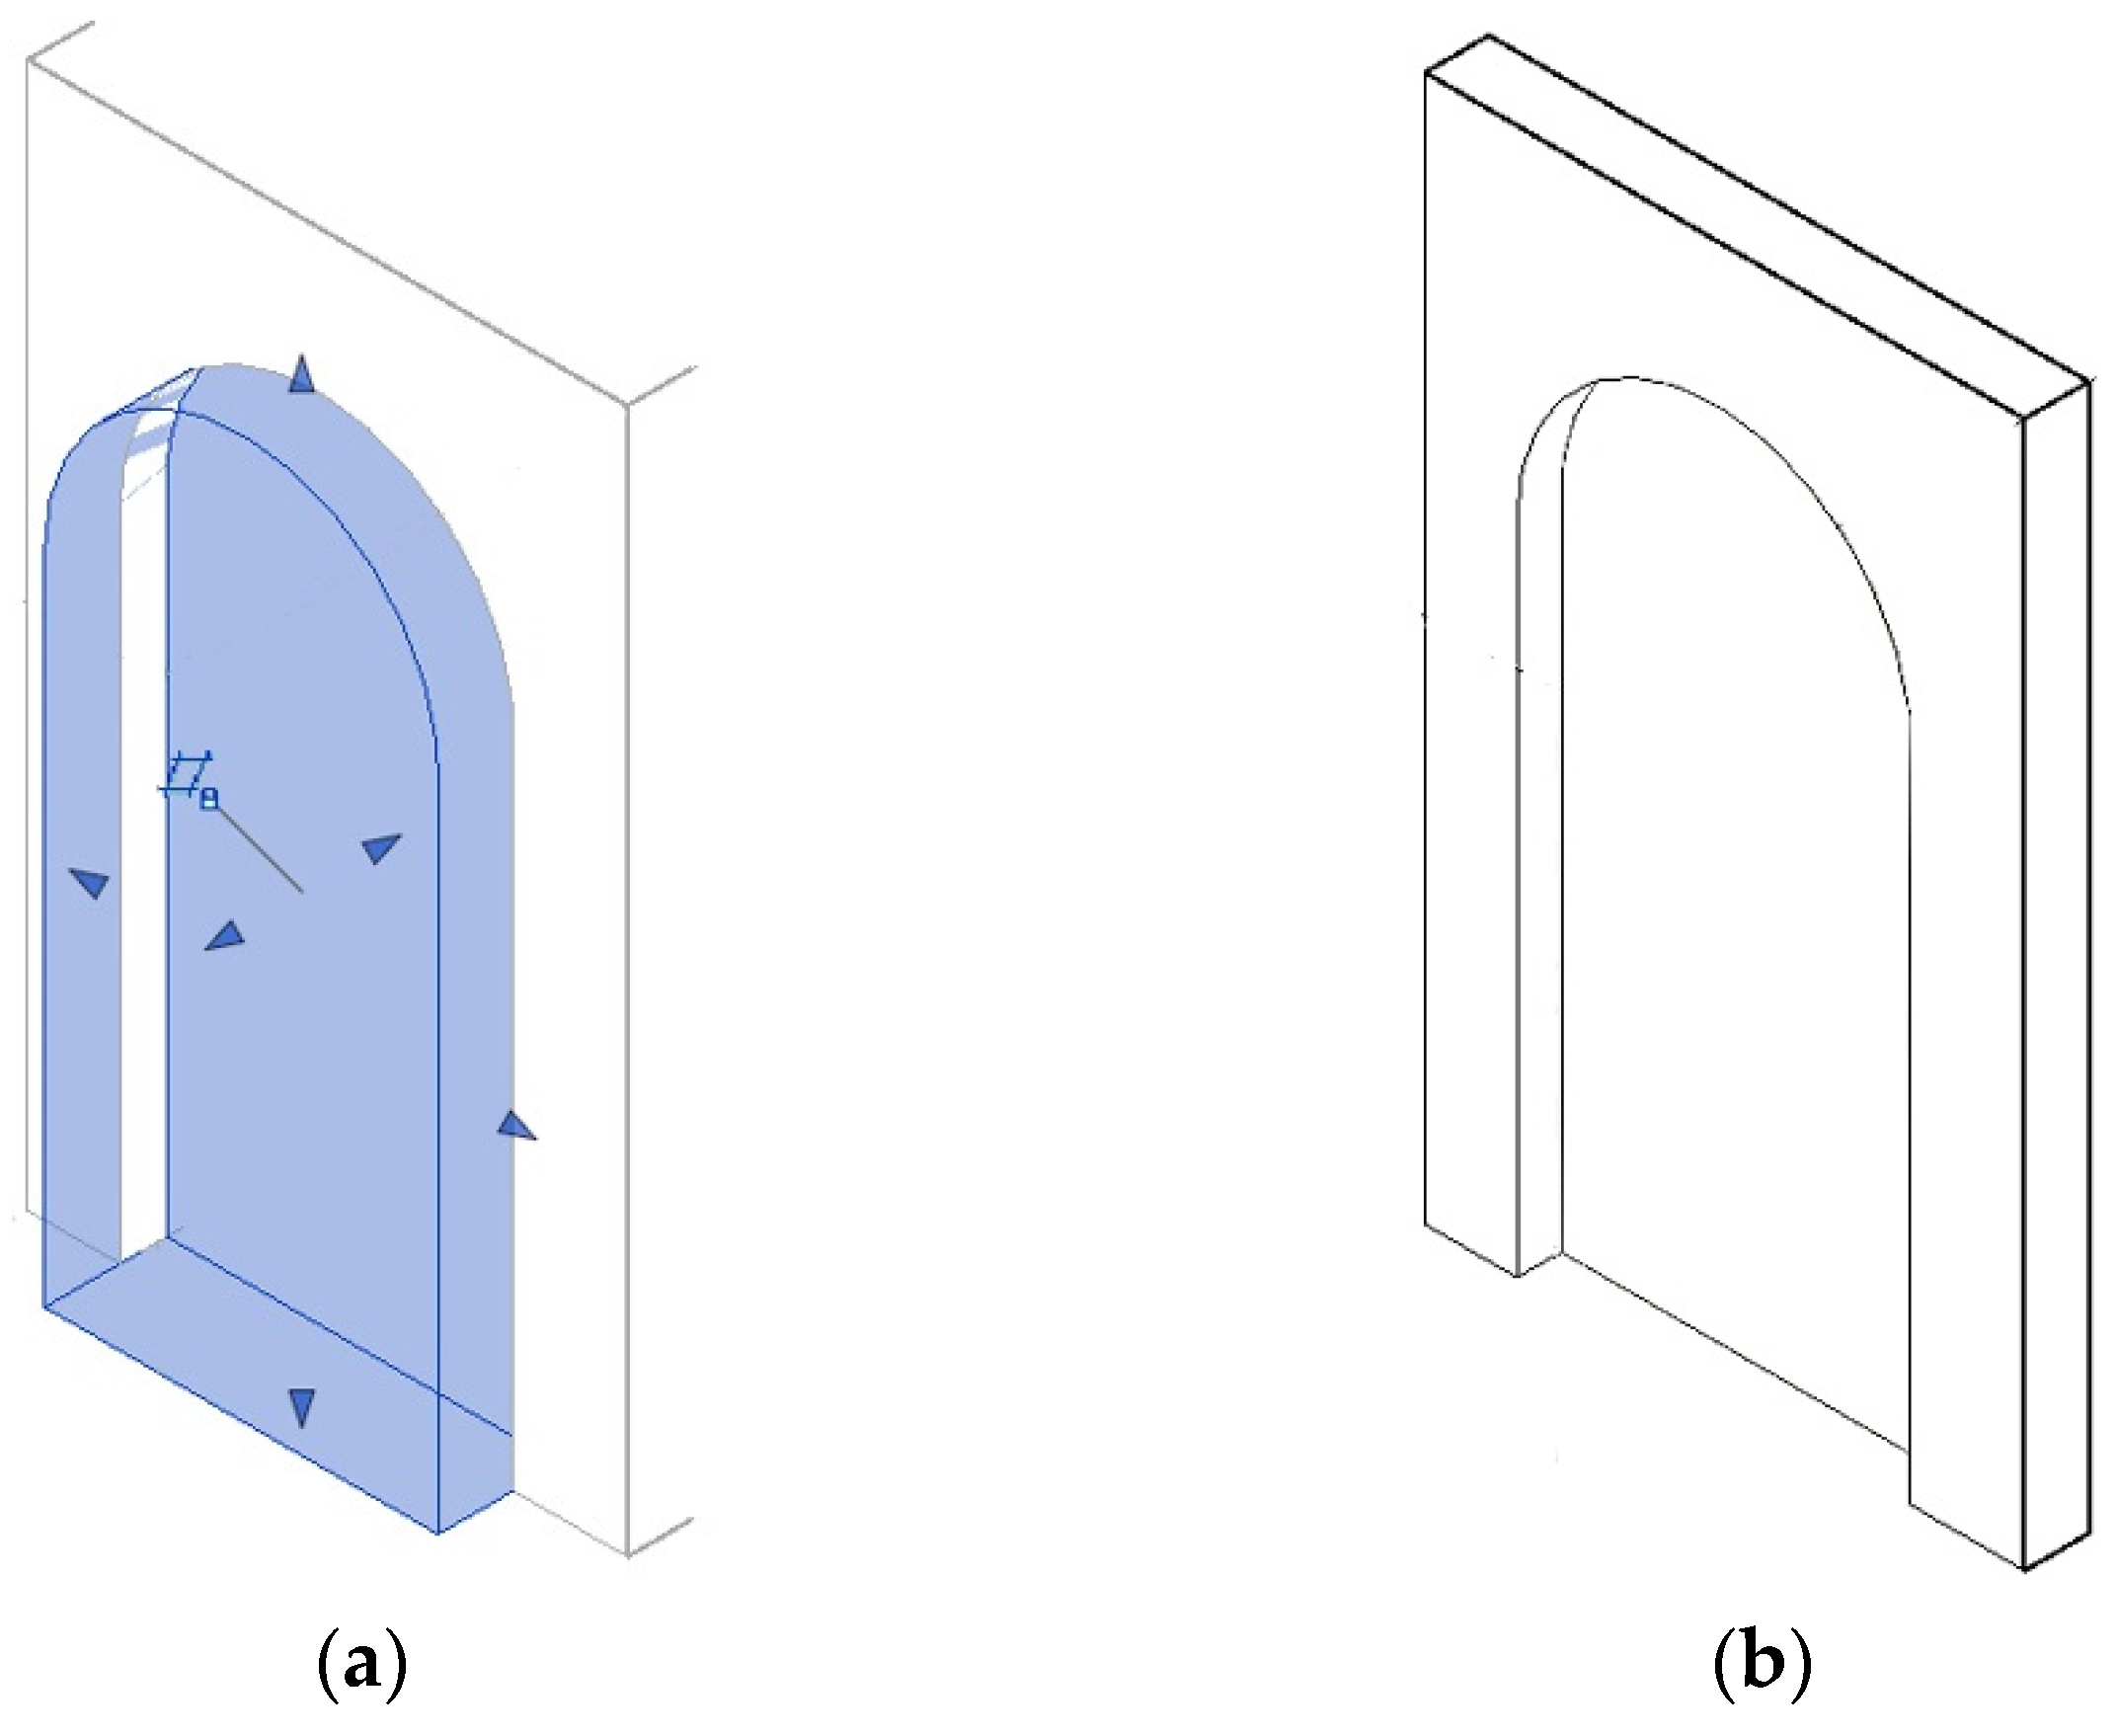
Another modelling solution for the creation of new families of architectural elements was to build “in-place” families locally inside the project. This solution was simpler, but differently from the creation of loadable families, it did not allow the use of the families outside the project. In our work, “in-place” families were adopted for the modelling of the recessed chapels and the openings. They were considered as void entities extruded according to their contours along the respective thicknesses and then subtracted from the walls (Figure 18). The same strategy was adopted for the modelling of the door gates, characterized by different profiles on their internal and external faces.
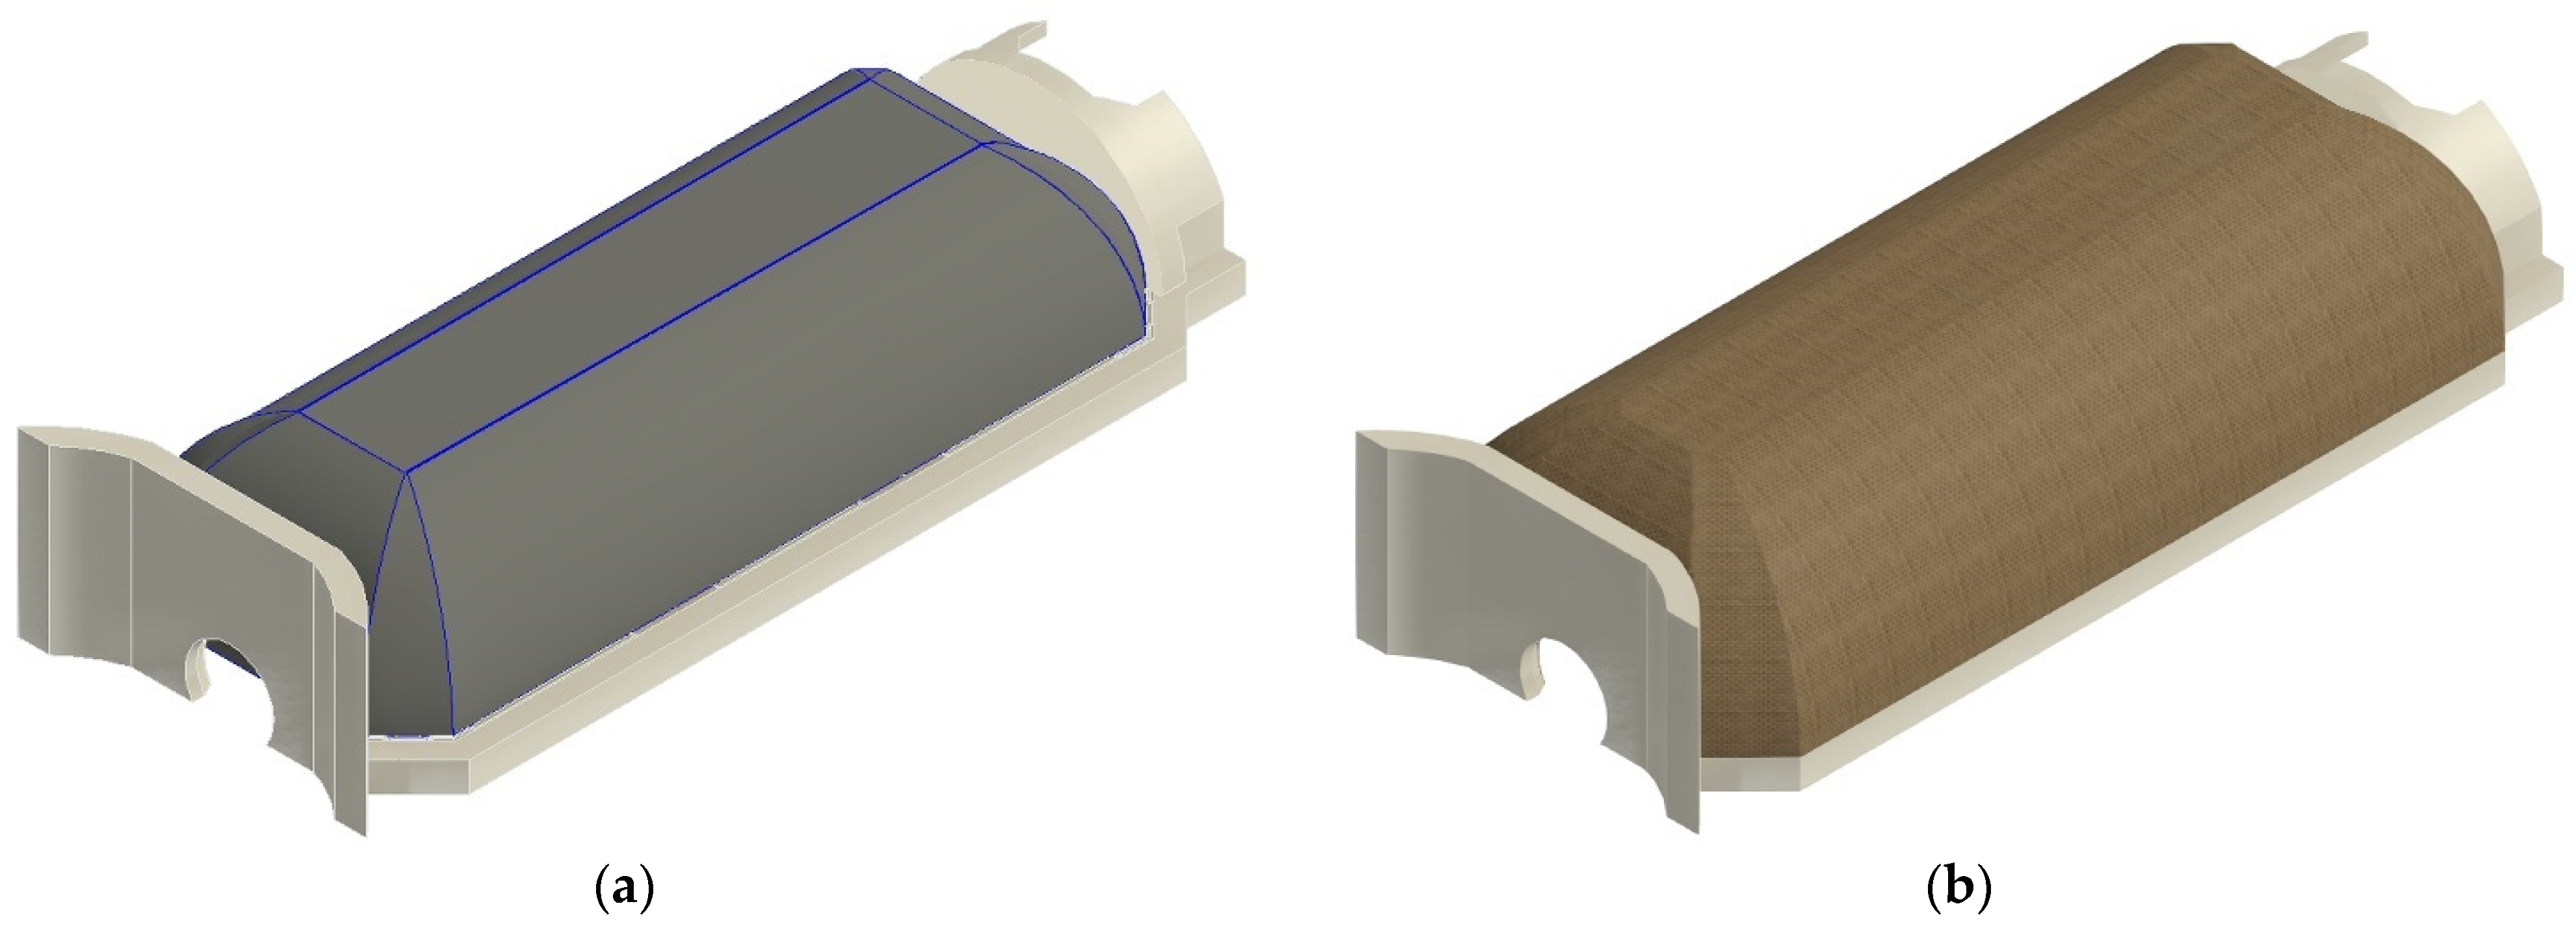
The process for modelling the vaults was the most challenging, highlighting the limitations of the BIM methodology application to historic buildings. The considered coverings were the boat vault with lunettes on the main aisle, the barrel vault, and the cap dome on the presbytery. They were treated as parametric masses, combining different Boolean operations. The overhead octagonal lantern was extruded as a void inside the ceiling thickness. The shape of the masses was defined through an extrusion guided by a reference path, sweep, and revolution, following the geometrical reference of the point cloud (Figure 19).
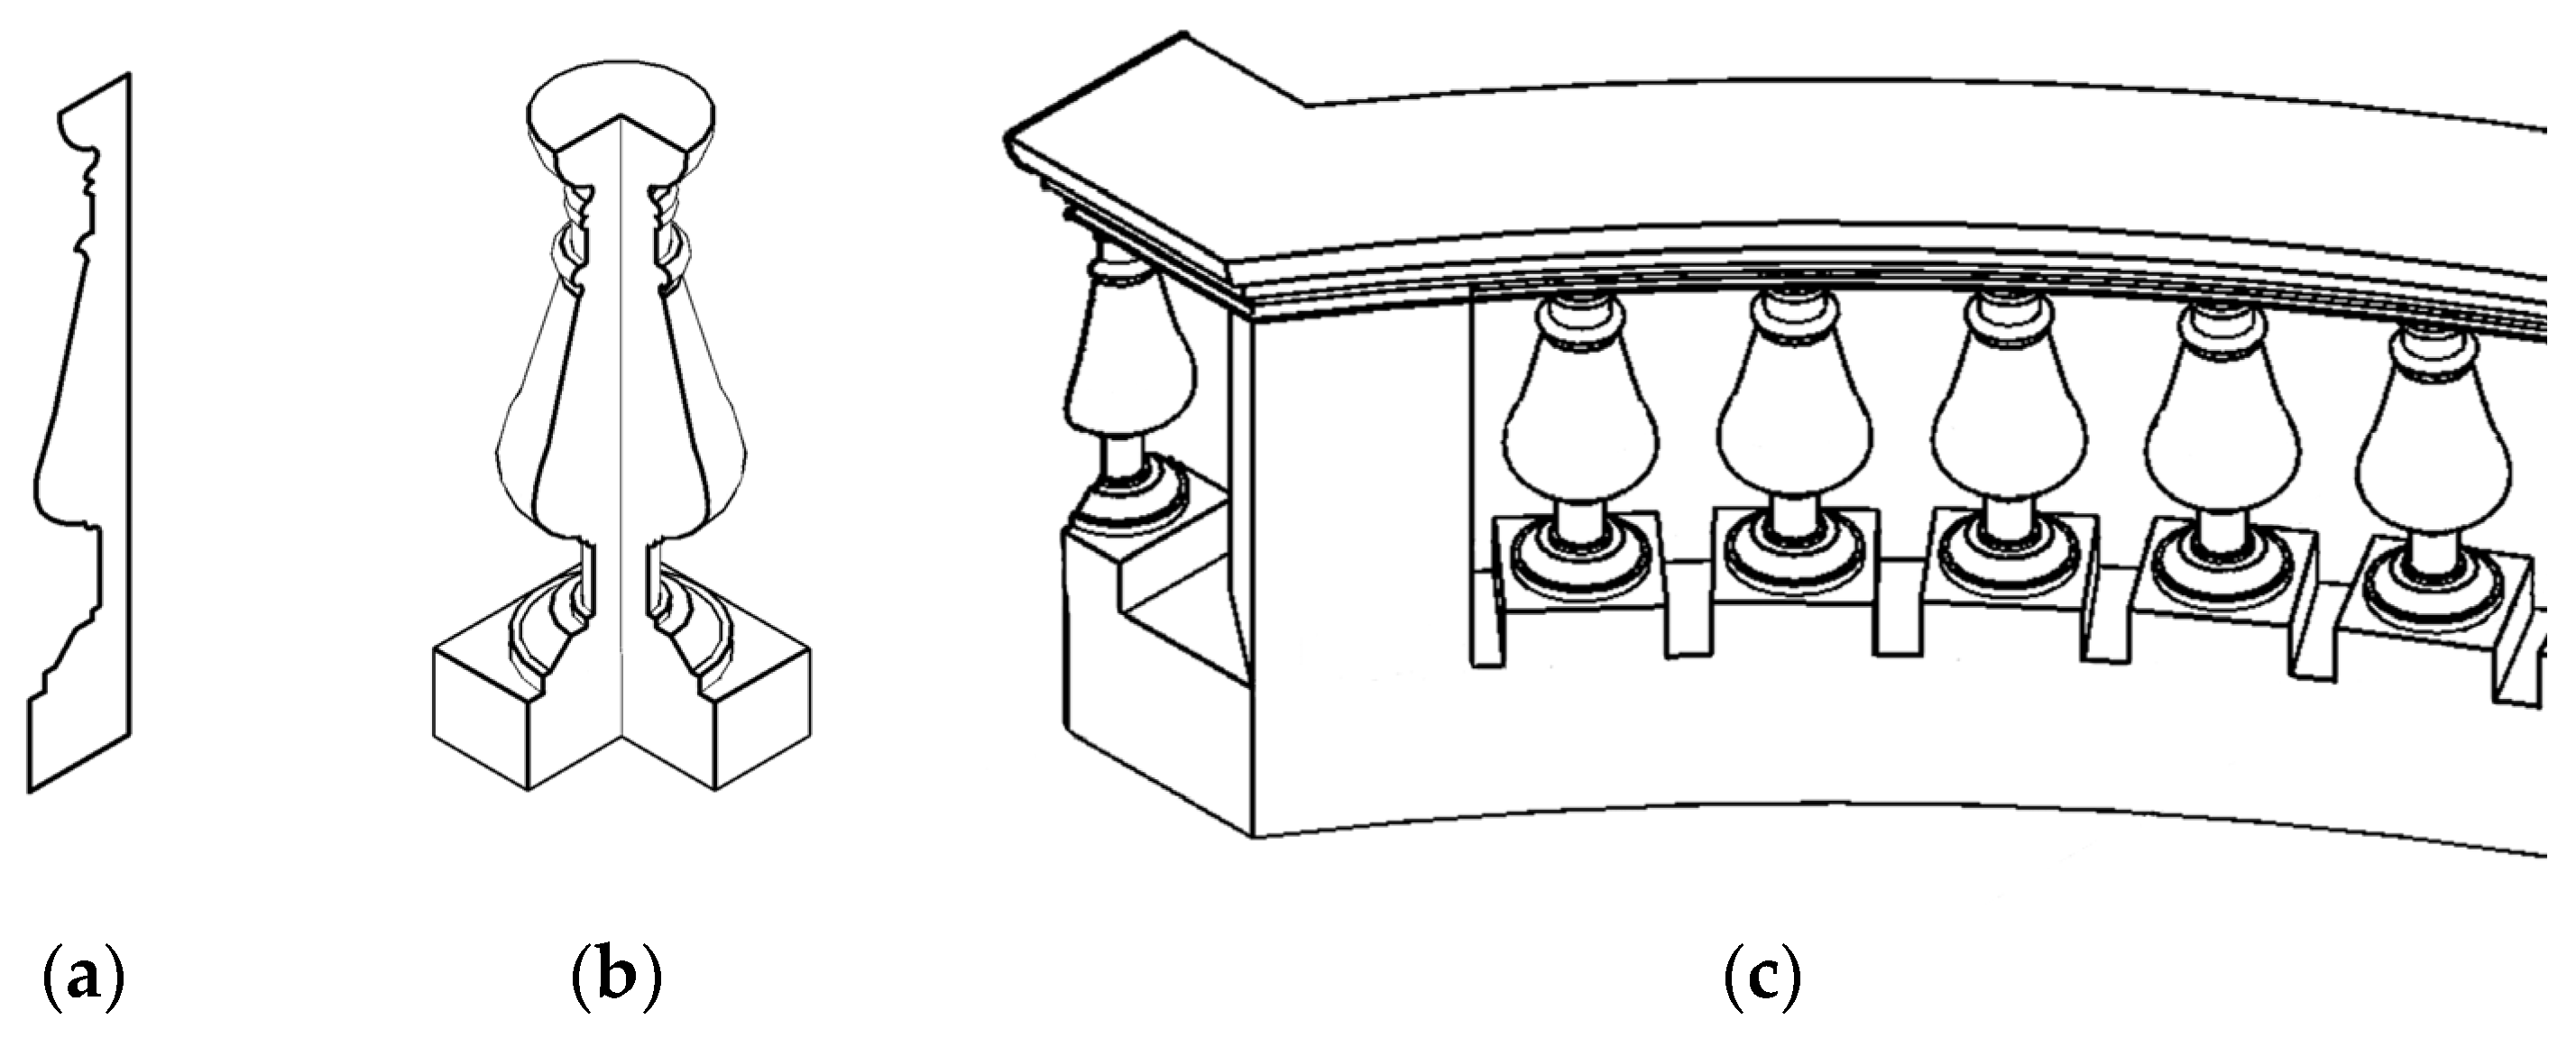
The parapet on top of the roof was modelled based on two families of objects created externally: the upright components and the profiled stringers. The first one was shaped through the “General Model” template of the software, while the second one through the “Profile” template. Once a single upright was generated and the relevant parameters such as the center-to-center step, the number, the offset from the long axis, and the height were set, the stringers followed around the whole perimeter of the building (Figure 20).
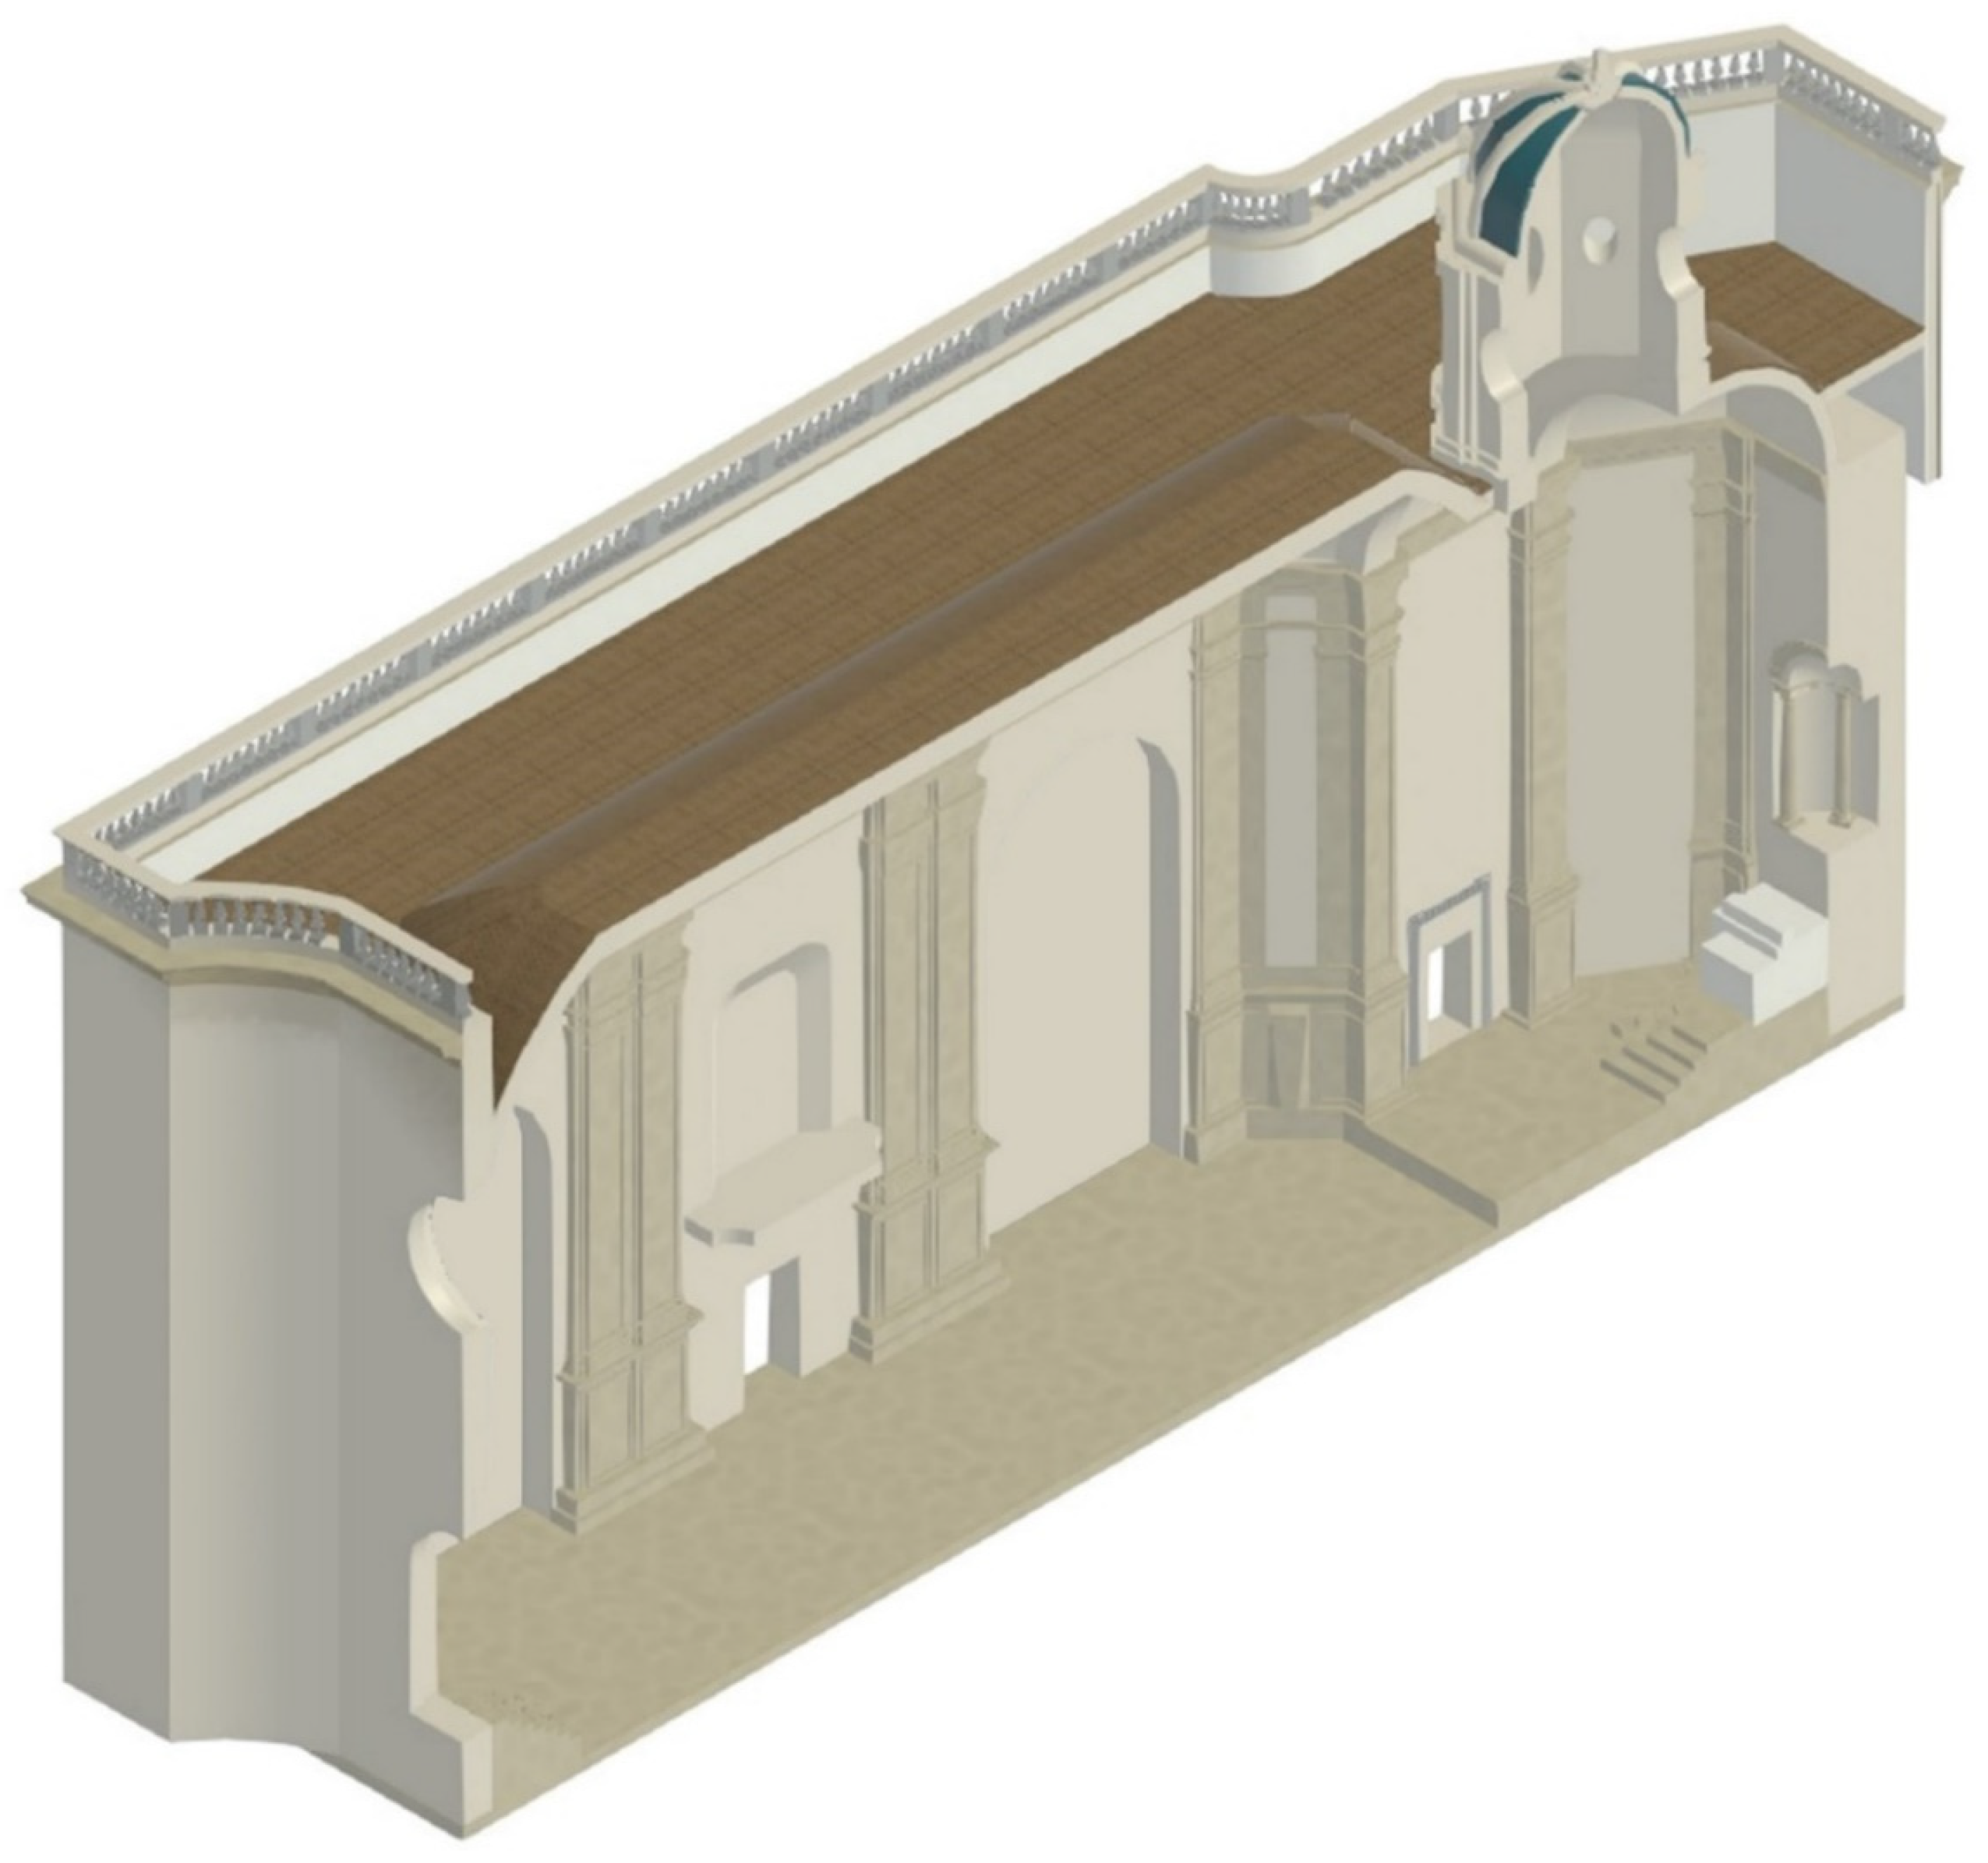
At the end of the parametric modelling, the approach was conceived as an integration of different procedures, adopting different combinations of families of objects (in-built, loadable, and “in-place families”), according to the nature of the architectural elements to model. The strategy adopted for modelling all the single architectural items through a top-down approach allowed the final as-built digitization of the whole church, which is one of the main results of this work. The parametric modelling allowed the 3D representation of the monument, showing the architectural style that characterizes the building (Figure 21). The 3D representation was then the base for the integration of the information regarding the degradation phenomena. In general, the adopted strategy can be considered as a reference for the generation of a 3D representation useful for conservation and monitoring operations inside the BIM environment.

3.4. Decay and Alteration Phenomena Identification and Mapping in HBIM

The analysis of the state of conservation and the related graphic representation are central aspects in every procedure of maintenance, restoration, conservation, and reuse of architectural heritage, which today are among the most relevant issues for the scientific community and government authorities. This type of analysis can be used to highlight various aspects, some useful for the interpretation and knowledge of the asset, such as the identification of historical stratifications, and others necessary for its maintenance, such as the description of forms of physical, chemical, or biological degradation and/or structural imbalance. This highlights the need to measure and document buildings rigorously, without giving up the possibility of obtaining an as-is digitization, both from a morphological and material point of view.
The central core of an architectural conservation project is made up of a system of thematic mapping related in particular to materials, forms of alteration and degradation, structural failures or crack patterns, and restoration techniques [43,44]. The phase of identifying the forms of degradation represents a fundamental in-depth study to guide the development of subsequent thematic maps, and the use of specialist glossaries, such as the ICOMOS glossary, is now a consolidated practice at an international level [45,46]. In addition, these specialized graphic elaborations can be referred to the results of non-destructive diagnostic investigations or laboratory tests, to the stratigraphic studies of architectural surfaces or to other possible cognitive insights. In fact, the integration of innovative non-destructive techniques into a digitization process offers a major contribution to the conservation of built cultural heritage [47].
For these reasons, the experimental applications regarding the parametric modeling of built heritage, as the Scan-to-BIM method carried out in this research, play a fundamental role in evaluating the potential of applications to historical architectures, offering an operational address for the optimization of the related procedures and software [48].
The parametric 3D model of the church of “Santa Maria della Grotta” was obtained to digitize the actual condition of the building and to store additional information about the decay phenomena of the surfaces and their treatment in BIM. The research was oriented towards the possibility of directly identifying the decay phenomena on the parametric model in the HBIM environment, through the creation of specific parametric families.
In reference to the placement of the monument, as described in previous sections, only a limited part of the presbytery and the nave of the church partially emerges above the ground; the rest of the church and the other internal parts were underground and were created by carving the sandstone material. In these circumstances, when analyzing the state of conservation of the monument, the limited circulation of natural air and the microclimatic condition due to the uniqueness of the site have favored the development of forms of alteration and degradation caused by interaction with humidity, both from the surface outcropping and condensation. The state of conservation of the underground parts of the church, directly connected with the various paths carved into the rock, was obviously marked by an anomalous presence of humidity and extensive biological colonization on the internal surfaces.
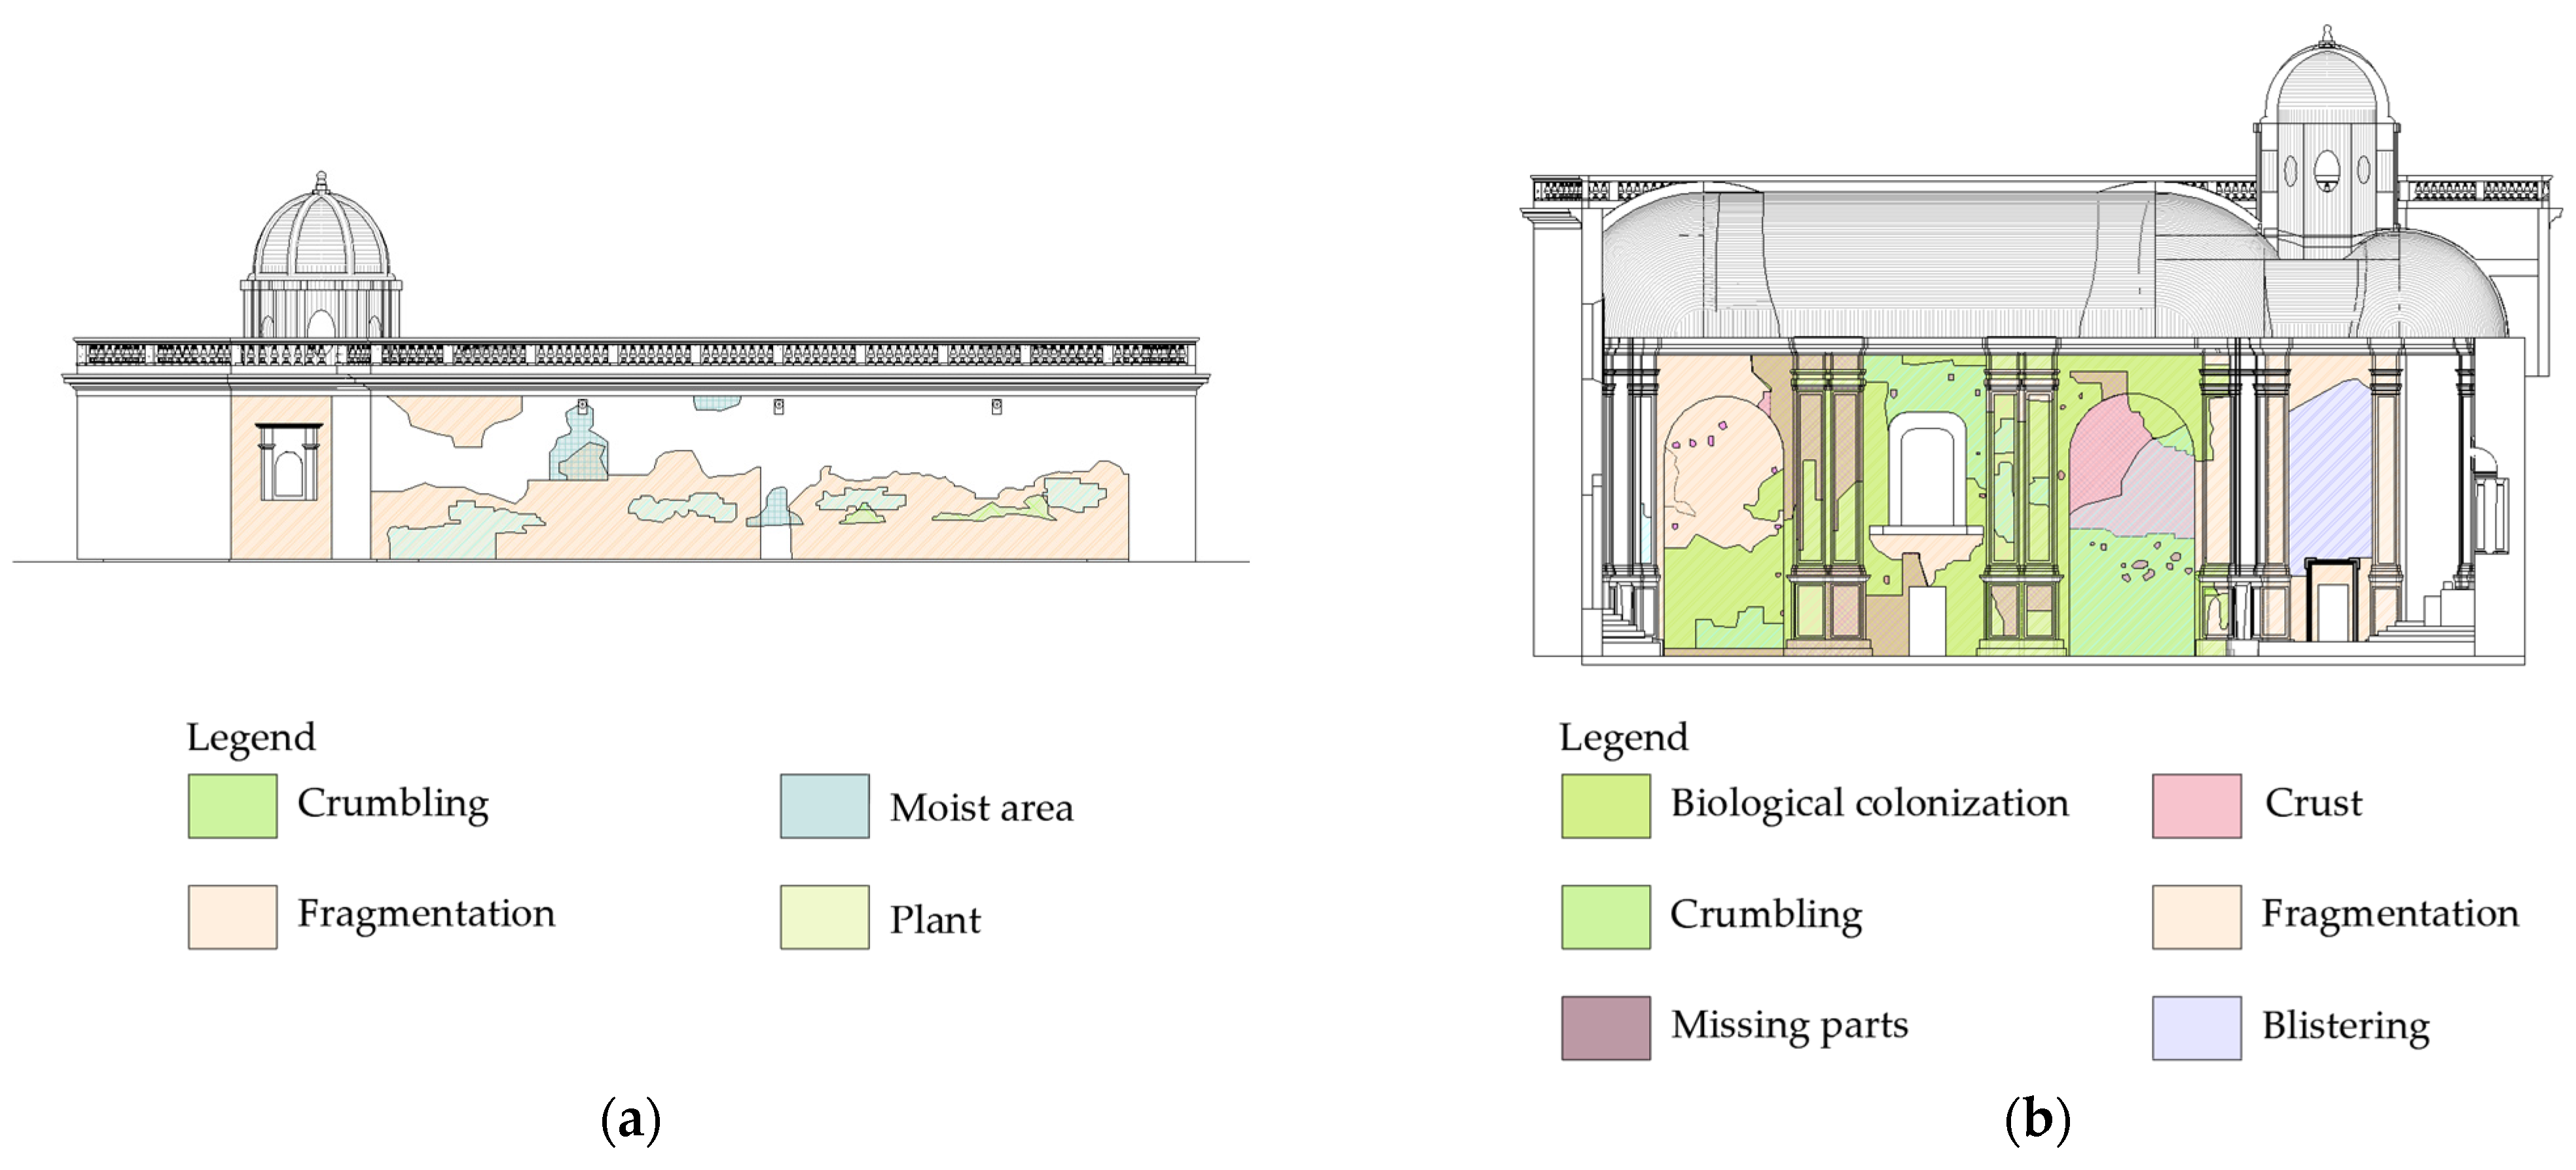
Considering the creation of the objects that identify the degradation inside the BIM environment, the decays were mapped according to the ICOMOS glossary, assigning to each degradation a distinctive color and pattern to enable immediate visual recognition and classification of the different anomalies. The map of decay was implemented considering the indoor and outdoor main walls of the church. The indoor environment was affected by biological colonization, blistering, crumbling, crust, missing parts and fragmentations. The outdoor surfaces of the church were affected by blistering, crumbing, moist areas, and biological colonization.
According to the ICOMOS glossary, biological colonization, defined as a “colonization of the stone by plants and microorganisms such as bacteria, cyanobacteria, algae, fungi and lichen (symbioses of the latter three)”, was manifested inside the church in multiple conformations, both those typical of the biological patina and the thicker ones of the encrustation. While the biological patina developed with a modest thickness, the biological encrustations colonized such vast surfaces that also interacted negatively with the ancient internal wall paintings. Even considering biological colonization, the outdoor walls were rich in plants probably grown due to the presence of dirt and some cracks in which seeds transported by the wind were deposited.
The blistering, defined as “separated, air-filled, raised hemispherical elevations on the face of stone resulting from the detachment of an outer stone layer” appeared to extend to the entire surface of the wall below the cornice in the indoor environment. The degradation can presumably be attributed to the presence of capillary rise and the absence of prolonged maintenance in time. The phenomenon is also present in the outdoor walls over extensive parts of the plaster and is attributable to the presence of water from capillary rising and to action prolonged over time by atmospheric agents.
The crumbling, defined as the “detachment of aggregates of grains from the substrate”, is limited to some areas of the indoor walls and is attributable to the action of biological organisms penetrating into the pores of the stone, causing erosion. The proliferation of such organisms is linked to the presence of humidity and damp, deriving from capillary rise, as well as a lack of prolonged maintenance over time. The phenomenon also affected several areas of the outdoor walls, particularly the cornice and the elements of the parapet. This is due to their greater exposure to wind and rain.
The crust, defined as “a coherent accumulation of materials on the surface”, is present in areas extended across the indoor wall surface. Its onset can occur mainly due to the action of biological agents such as mosses, lichens, algae, and bacteria that grow on stone surfaces.
The missing parts, defined as “empty space, obviously located in the place of some formerly existing stone part” regarded the loss of parts (without artistic relevance) due to decohesion of the materials in the indoor surfaces.
The fragmentation, defined as “the complete or partial breaking up of a stone, into portions of variable dimensions that are irregular in form, thickness and volume”, can be observed on the indoor wall surface corresponding to the apse. The separation of the superficial scales is attributable to the presence of humidity and dissolution of the salts contained in the water, as well as the action of freeze and thaw cycles. The daily temperature variations may cause temperature changes that cause thermal stress within the stone material.
The presence of moist areas, defined as “darkening (lower hue) of a surface due to dampness”, was observable in the form of dark spots on the outdoor surfaces in proximity to and in the areas below the downpipes. It was attributable to incorrect disposal of rainwater.
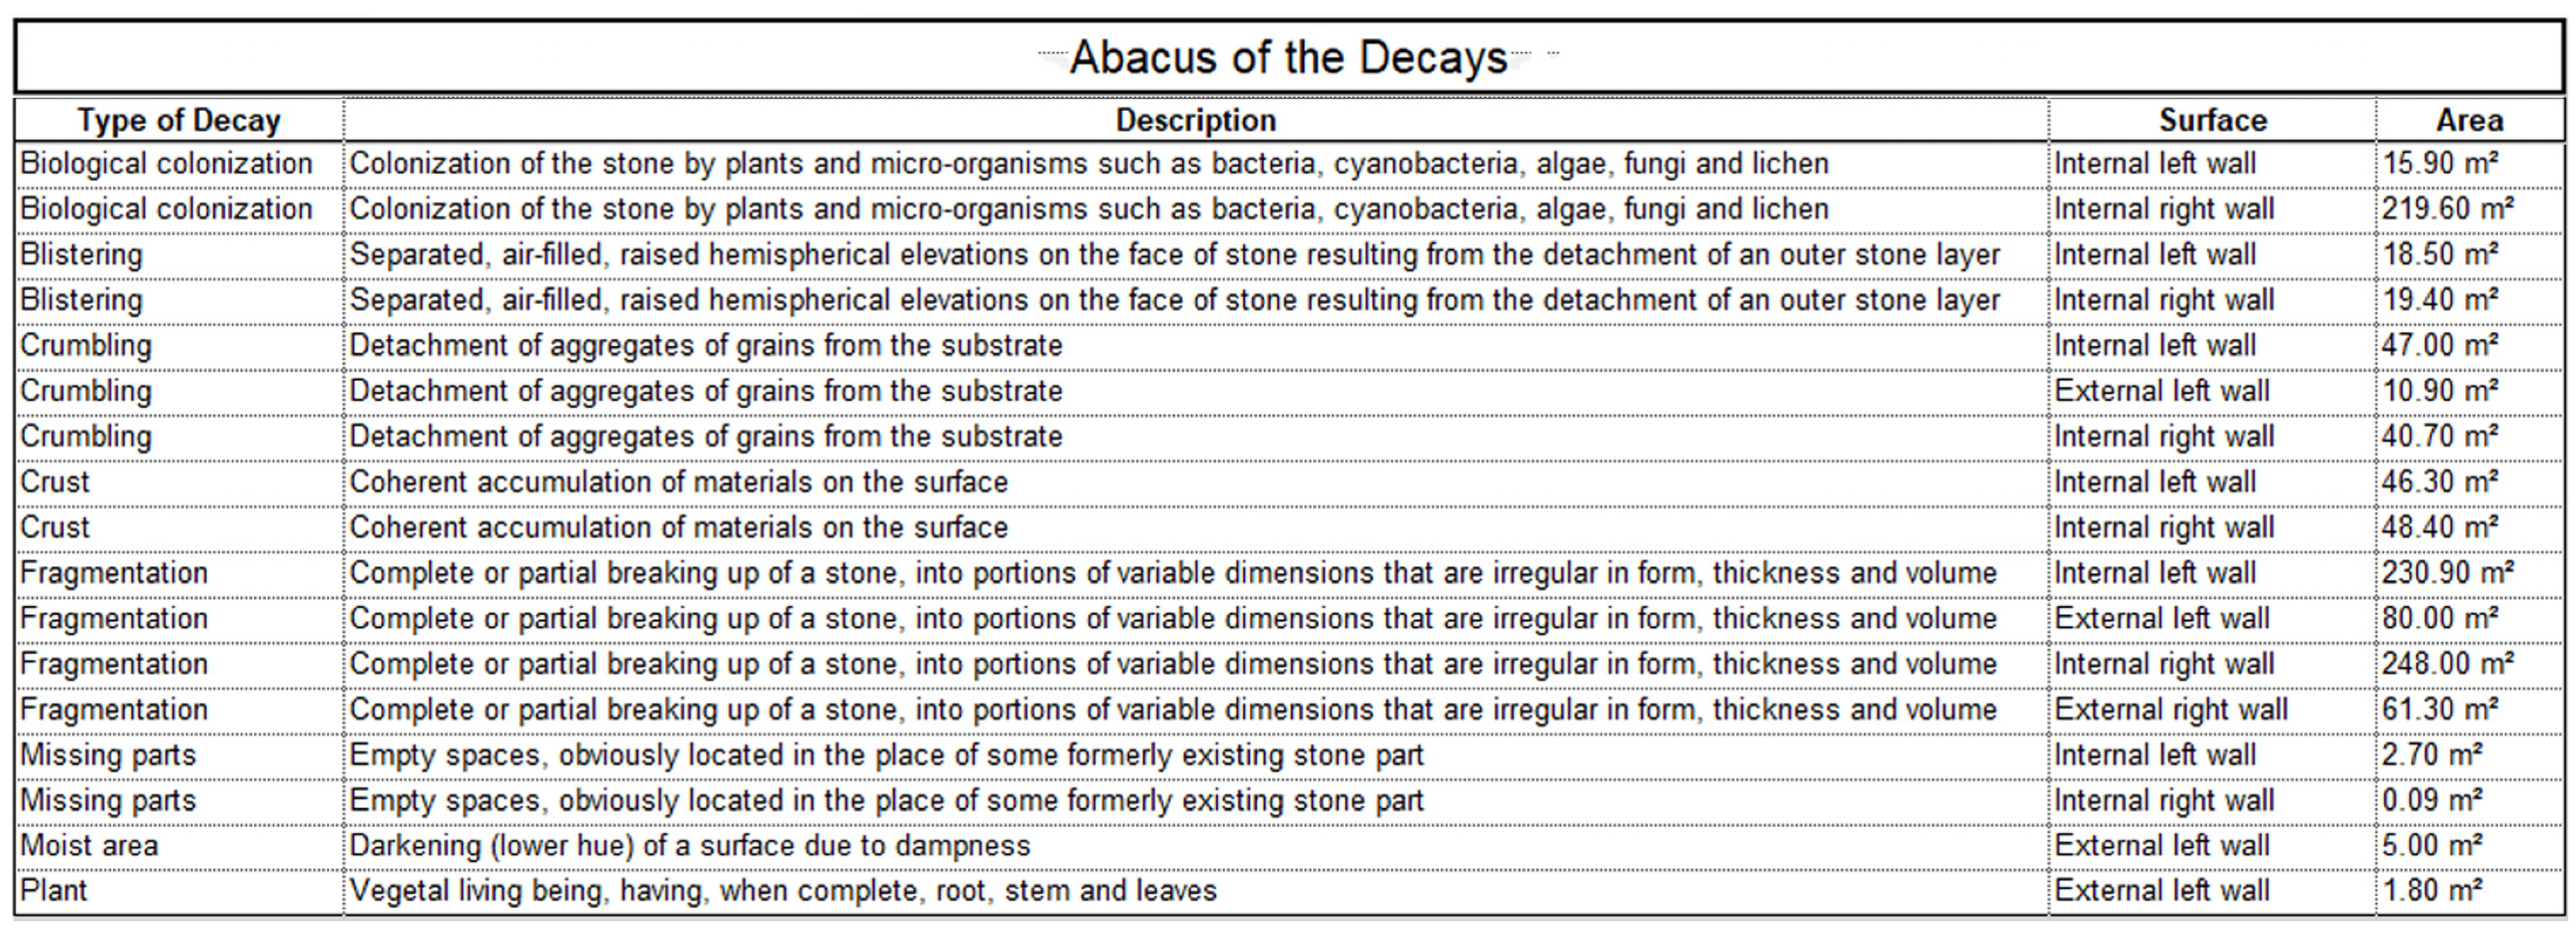
Once all the decays in the indoor and outdoor surfaces of the church were identified, the maps of decays were implemented into the BIM software. The description of the degradations was used to create the abacus of decays into the HBIM model database (Figure 22). Each shape of decay was identified by indicating the type of alteration, an overall description of decay, the corresponding location, and its extension. In this way, the HBIM database was able to provide a complete analysis of the degradations of the interior and exterior surfaces of the church. This abacus is an important working tool as it can be retrieved and updated at all times according to the scope of the work. It could also be used for future in-depth investigation and more complete analysis and, eventually, expanded through schedules with different classes (i.e., the actions needed, detailed procedural descriptions, products to be used, costs for interventions, etc.) or enriched with images, technical sheets, or even tutorials explaining the most cutting-edge intervention techniques [12]. This would enable an overall reference framework to be provided for initiating and planning restoration projects, thus contributing to the conservation of the Built Heritage and sharing awareness of its assets. In addition, it can significantly support the economic estimation phase of restoration or maintenance interventions, which is fundamental for each subsequent phase of financing the works and starting the operational intervention site.
As previously highlighted, the identification of the decays inside the church was carried out for the internal and external walls to obtain complete documentation and to reach the 3D representation of decay phenomena; the analysis was performed using the high-resolution orthophotos of the wall. The orthophotos were imported into Revit software and overlapped with the corresponding surfaces to create a mapping texture. The decays have been parametrically traced according to their actual shape starting from the 2D visualization (Figure 23).
The use of parametric families of objects allowed us to generate the 3D volumes of the decay based on the 2D shapes by extruding the elements with a tiny thickness to form a sort of film adhering to the surface of the walls. In this way, it was possible to create a complete parametric map inside the 3D BIM environment regarding the state of decay of the perimeter walls of the church (Figure 24). These decay maps, traced on both the internal and external faces of the walls, enable overall comprehension and at the same time a visual comparison of the degradation phenomena affecting those structures.

4. Discussion and Results

The research results involved in this experience focused interest on the integration of different solutions for the 3D documentation of historic environments characterized by complex morphology and on the study of Scan-to-BIM methods aimed at conservation and restoration of historical architecture. The focused research fields represent very actual and original topics currently internationally underway [39,49]. Furthermore, the need for developing effective HBIM systems has now been widely accepted and involves computer developers and researchers in many countries [50].
The Scan-to-BIM approach implemented in this case study was aimed at a 3D representation of decay phenomena affecting an existing asset, remarkably useful for the conservation and maintenance of buildings of historical value. The ancient church of “Santa Maria della Grotta”, revised in a late Baroque style, had low external walls springing from the upper ground level and the façade intentionally left bare, with no embellishment except for the topping parapet and the lantern.
The mapping of the decay was pursued within a multidisciplinary workflow that started from an integrated survey of the site and led to an object-oriented digital model comprehensive of the description of the degradations detected on the surfaces.
The application of HBIM methodology on the thematic degradation mapping optimized the employment of survey acquisitions. Through the adoption of this strategy, the thematic mapping exploited the quality of orthophotos generated by the photogrammetric survey to allow the analysis of the decays in a 3D context.
The application of parametric objects representing the decay into the HBIM model offers specialists the possibility to calculate the areas of interest, helping the maintenance process of the structure with the possibility to forecast and estimate the costs of possible restoration interventions. Furthermore, the 3D representation of decays in the internal and external walls of the main nave in BIM environment allows the observation of possible correspondence between internal and external states of degradation, improving awareness of the state of the building (Figure 25).
The digital model hosts all the acquired documentation and can be repeatedly expandable, retrievable, and updatable over time, with no risk of losing track of past configurations. This method can be very useful if adopted in periodic monitoring activity of the church, with a constant update of the state of degradation in the HBIM model. In this way, it is possible to optimize the maintenance strategy obtaining precious information regarding the times and costs of possible interventions. Adopting this solution, the 3D HBIM model became the main reference of information for all the institutions interested in its management and the basis to support any decision-making processes on that historical asset. All the metadata regarding the church can be stored in the future by updating each corresponding item in the HBIM model to guarantee its maximum adherence to the collected information.
The employment of BIM methodology enabled the monitoring, updating, and keeping under control of the potential advancement of pathogen phenomena; indeed, the evolution over time of the external façade decays, how much they expanded, and how serious they are going to be is constantly monitored. Identification codes may be given to mapped decays, together with other semantic peculiarities such as causes, the affected material, the partial or total cost of intervention, etc., enabling easier conservation plan activities.
The abacus of degradation forms could be expanded with new keys to host data about the geometrical extension of each decay, its causes and descriptions, and its location whether on the internal or external surface, up to integrating the specific intervention techniques to treat the degradation and the related costs. These parameters can be continuously retrieved and updated, helping to monitor the evolution of anomalies and degradation phenomena over time, and delivering a complete reference framework for any maintenance and restoration purposes.
Although the application of Scan-to-BIM methodology for decay mapping opens new possibilities for the conservation and maintenance of historical buildings, this research highlighted some challenges in the process. For instance, sometimes issues about overlapping parts could interest the surfaces of the monument. In fact, in the walls, it was possible to find situations in which two or more types of degradation were identified in the same portion of the architectural surface; in this case, since all decay phenomena must be stored in the project for conservation purposes, two or more overlapping parametric families should be reported. Another factor to be sorted in the future, which represents a challenge, is the impossibility of applying the mapping of the decay as a property of architectural and structural BIM elements. In fact, in the adopted solution, the decay phenomena were represented as parametric objects applied only to planar surfaces located over the architectural elements. Future implementation of the research can consider the description of the state of health of the material directly on architectural elements. This implementation can concretely enrich the semantic information of the monument, allowing, also, the extension of the decay analysis to elements with curved surfaces.

5. Conclusions

The methodological activities described in this research endorse a Scan-to-BIM approach as an effective, supportive tool for all the professionals involved in conservation, preservation, and restoration projects thanks to its feasible architectural heritage information management system sharable into collaborative platforms.
The work carried out outlined useful proposals both for the implementation of a Scan-to-BIM workflow from data acquisition to the final model and moreover for the implementation of the semantic data regarding the state of degradation of the structure.
The study proves how an integrated, multi-source survey combining mobile laser scanning and aerial and terrestrial photogrammetry can effectively support the development of accurate 3D reconstruction of monumental architectures made of complex and articulated parts as in this case study. Moreover, this work shows how different 3D modeling strategies are useful for the development of an HBIM model of a monumental complex, with a particular focus on the integration of ad hoc loadable families of objects containing the thematic mapping of decay phenomena observable on the surface of a historic building. This approach provided a specific BIM methodology for the decay mapping of historical buildings 3D delivering its exhaustive representation on the main walls in relation to the complex morphology of the church. In this way, the 3D decay mapping on both the internal and external faces of the main nave was represented in a BIM environment. This representation endorses the identification of possible correspondence between the internal and external states of degradation and an immediate understanding of the degradation phenomena affecting simultaneously both sides of the same structure, improving awareness of the state of the building.
The use of ICOMOS glossary reference for the construction of the abacus of decays was aimed at implementing a standardized approach for the creation of the database of loadable families. The use of a common standard reference (as suggested by the original spirit of BIM process) delivered a twofold result: the expansion of the dataset of our case study (reporting extensions, causes, descriptions, and locations on ad hoc sheets and integrating restoration techniques, costs, or other specificities related to the management of the building), and the possibility for other specialists to replicate the same schema applicable to future case studies. The development of the HBIM model and its informative system enables cultural heritage professionals to explore the rendered structures from a macro to micro scale, with the possibility of queries, further analysis, and multitemporal visualization.
Overall, the research underscores the potential of integrating thematic mappings to Scan-to-BIM workflows for an improved understanding and management of cultural heritage sites, paving the way for future developments towards further simplification of the process and more advanced ways of data sharing in a collaborative platform.

Author Contributions

Conceptualization, M.A., M.L.G. and M.L.B.; methodology, M.A., M.L.G., M.L.B. and G.M.V.; 3D survey, M.A., C.F., M.L.B. and G.T.; 3D data processing, M.A., C.F., M.L.G., M.L.B. and G.T.; parametric modeling M.A., C.F. and G.T.; decay mapping, C.F., M.L.G., G.T. and G.M.V.; writing—original draft preparation, M.A., M.L.G. and M.L.B.; writing—review and editing, M.A., M.L.G., M.L.B. and G.M.V.; supervision, M.L.B. All authors have read and agreed to the published version of the manuscript.

Funding

This research received no external funding.

Data Availability Statement

Restrictions apply to the datasets. The datasets presented in this article are not readily available because they are part of an ongoing research project. Requests to access the datasets should be directed to the corresponding author.

Acknowledgments

The surveys are related to the project “The Archaeological Map of Lilybaeum”, which was conducted in partnership among the Department of Engineering and the Department of Cultures and Societies of the University of Palermo, the Institute for Archeology and Cultural History of the Ancient Mediterranean of the University of Hamburg, and the Archaeological Park of Lilibeo-Marsala. The authors would like to thank Microgeo srl, and in particular Carmen Zaami, for providing the GeoSLAM Zeb Horizon RT handheld mobile laser scanner and collaborating during the survey and Gianni Giordano for providing the UAV flight.

Conflicts of Interest

The authors declare no conflicts of interest.

References

  1. Pocobelli, D.P.; Boehm, J.; Bryan, P.; Still, J.; Grau-Bovè, J. BIM for heritage science: A review. Herit. Sci. 2018, 6, 30. [Google Scholar] [CrossRef]
  2. Lovell, L.J.; Davies, R.J.; Hunt, D.V.L. The application of Historic Building Information Modelling (HBIM) to Cultural Heritage: A review. Heritage 2023, 6, 6691–6717. [Google Scholar] [CrossRef]
  3. Murphy, M.; McGovern, E.; Pavia, S. Historic building information modelling (HBIM). Struct. Surv. 2009, 27, 311–327. [Google Scholar] [CrossRef]
  4. Volk, R.; Stengel, J.; Schultmann, J. Building Information Modelling (BIM) for existing buildings. Literature review and future needs. Autom. Constr. 2014, 38, 109–127. [Google Scholar] [CrossRef]
  5. Charlton, J.; Kelly, K.; Greenwood, D.; Moreton, L. The Complexities of Managing Historic Buildings with BIM. Eng. Constr. Archit. Manag. 2021, 28, 570–583. [Google Scholar] [CrossRef]
  6. Antonopoulou, S.; Bryan, P. BIM for Heritage: Developing a Historic Building Information Model; Historic England: Swindon, UK, 2017.
  7. Quattrini, R.; Pierdicca, R.; Morbidoni, C.; Malinverni, E.S. Conservation-oriented HBIM. The BIM explorer tool. Int. Arch. Photogramm. Remote Sens. Spatial Inf. Sci. 2017, 42, 275–281. [Google Scholar] [CrossRef]
  8. Brumana, R.; Georgopoulos, A.; Oreni, D.; Raimondi, A.; Bregianni, A. HBIM for Documentation, Dissemination and Management of Built Heritage. The Case Study of St. Maria in Scaria d’Intelvi. Int. J. Herit. Digit. Era 2013, 2, 433–451. [Google Scholar] [CrossRef]
  9. Brusaporci, S.; Ruggeri, G.; Maiezza, P.; Tata, A.; Trizio, I.; Giannangeli, A. AHBIM per l’analisi stratigrafica dell’architettura storica. Restauro Archeol. 2018, 26, 112–131. [Google Scholar] [CrossRef]
  10. Fazion, B.; Treccani, D.; Fregonese, L.; Lombardini, N. HBIM structural model to evaluate building evolution and construction hypotheses: Preliminary results. Int. Arch. Photogramm. Remote Sens. Spat. Inf. Sci. 2024, 48, 213–219. [Google Scholar] [CrossRef]
  11. López, F.J.; Lerones, P.M.; Llamas, J.; Gómez-García-Bermejo, J.; Zalama, E. A Review of Heritage Building Information Modeling (H-BIM). Multimodal Technol. Interact. 2018, 2, 21. [Google Scholar] [CrossRef]
  12. Conti, A.; Fiorini, L.; Massaro, R.; Santoni, C.; Tucci, G. HBIM for the preservation of a historic infrastructures: The Carlo III bridge of the Carolino Aqueduct. Appl. Geomat. 2020, 14, 41–51. [Google Scholar] [CrossRef]
  13. Biancardo, S.A.; Intignano, M.; Veropalumbo, R.; Martinelli, R.; Calvanese, V.; Autelitano, F.; Garilli, E.; Giuliani, F.; Dell’Acqua, G. BIM approach for stone pavements in Archaeological Sites: The case study of Vicolo dei Balconi of Pompeii. Transp. Res. Interdiscip. Perspect. 2023, 17, 100755. [Google Scholar] [CrossRef]
  14. Brumana, R.; Oreni, D.; Barazzetti, L.; Cuca, B.; Previtali, M.; Banfi, F. Survey and Scan to BIM Model for the Knowledge of Built Heritage and the Management of Conservation Activities. In Digital Transformation of the Design, Construction and Management Processes of the Built Environment; Daniotti, B., Gianinetto, M., Della Torre, S., Eds.; Springer: Cham, Switzerland, 2020; pp. 391–400. [Google Scholar] [CrossRef]
  15. Rocha, G.; Mateus, L.; Fernández, J.; Ferreira, V. A Scan-to-BIM Methodology Applied to Heritage Buildings. Heritage 2020, 3, 47–67. [Google Scholar] [CrossRef]
  16. Mateus, L.; Fernández, J.; Ferreira, V.; Oliveira, C.; Aguiar, J.; Gago, A.S.; Pacheco, P.; Pernão, J. Terrestrial laser scanning and digital photogrammetry for heritage conservation: Case study of the historical walls of Lagos, Portugal. Int. Arch. Photogramm. Remote Sens. Spat. Inf. Sci. 2019, 42, 843–847. [Google Scholar] [CrossRef]
  17. Pepe, M.; Costantino, D. UAV Photogrammetry and 3D Modelling of Complex Architecture for Maintenance Purposes: The Case Study of the Masonry Bridge on the Sele River, Italy. Period. Polytech. Civ. Eng. 2021, 65, 191–203. [Google Scholar] [CrossRef]
  18. Aricò, M.; Lo Brutto, M. From Scan-to-BIM to Heritage Building Information Modelling for ancient Arab-Norman church. Int. Arch. Photogramm. Remote Sens. Spat. Inf. Sci. 2022, 43, 761–768. [Google Scholar] [CrossRef]
  19. Vieira, M.M.; Ribeiro, G.; Paulo, R.; Bessa, M.; Sousa, F.R.; Moreira, E.; Mesquita, E. Strategy for HBIM implementation using high-resolution 3D architectural documentation based on laser scanning and photogrammetry of the José de Alencar theatre. Digit. Appl. Archaeol. Cult. Herit. 2023, 30, e00287. [Google Scholar] [CrossRef]
  20. Dostal, C.; Yamafune, K. Photogrammetric texture mapping: A method for increasing the fidelity of 3D models of cultural heritage materials. J. Archaeol. Sci. Rep. 2018, 18, 430–436. [Google Scholar] [CrossRef]
  21. Alshawabkeh, Y.; Baik, A. Integration of photogrammetry and laser scanning for enhancing scan-to-HBIM modeling of Al Ula heritage site. Herit. Sci. 2023, 11, 147. [Google Scholar] [CrossRef]
  22. Malinverni, E.S.; Pierdicca, R.; Sturari, M.; Colosi, F.; Orazi, R. Documentation and detection of colour changes of bas relieves using close-range photogrammetry. Int. Arch. Photogramm. Remote Sens. Spat. Inf. Sci. 2017, 42, 203–210. [Google Scholar] [CrossRef]
  23. Rinaudo, F.; Scolamiero, V. Comparison of multi-source data, integrated survey for complex architecture documentation. Int. Arch. Photogramm. Remote Sens. Spat. Inf. Sci. 2021, 46, 625–631. [Google Scholar] [CrossRef]
  24. Santagati, C.; Papacharalambous, D.; Sanfilippo, G.; Bakirtzis, N.; Laurini, C.; Hermon, S. HBIM approach for the knowledge and documentation of the St. John the Theologian cathedral in Nicosia (Cyprus). J. Archaeol. Sci. Rep. 2021, 36, 102804. [Google Scholar] [CrossRef]
  25. Chiabrando, F.; Lo Turco, M.; Rinaudo, F. Modelling the decay in a HBIM starting from 3D point clouds. A followed approach for Cultural Heritage knowledge. Int. Arch. Photogramm. Remote Sens. Spat. Inf. Sci. 2017, 42, 605–612. [Google Scholar] [CrossRef]
  26. Mol, A.; Cabaleiro, M.; Sousa, H.S.; Branco, J.M. HBIM for storing life-cycle data regarding decay and damage in existing timber structures. Autom. Constr. 2020, 117, 103262. [Google Scholar] [CrossRef]
  27. Croce, V.; Caroti, G.; Piemonte, A.; Bevilacqua, M.G. Geomatics for Cultural Heritage conservation: Integrated survey and 3D modelling. In Proceedings of the International Conference on Metrology for Archaeology and Cultural Heritage, MetroArchaeo, (IMEKO TC-4), Florence, Italy, 4 December 2019; pp. 217–276. [Google Scholar]
  28. Ferro, A.; Lo Brutto, M.; Ventimiglia, G.M. A Scan-to-BIM process for the monitoring and conservation of the Cultural Heritage: Integration of thematic information in a HBIM model. Int. Arch. Photogramm. Remote Sens. Spat. Inf. Sci. 2023, 48, 549–556. [Google Scholar] [CrossRef]
  29. Saricaoglu, T.; Saygi, G. Data-driven conservation actions of heritage places curated with HBIM. Virtual Archaeol. Rev. 2022, 13, 17–32. [Google Scholar] [CrossRef]
  30. Malinverni, E.S.; Mariano, F.; Di Stefano, F.; Petetta, L.; Onori, F. Modelling in HBIM to document materials decay by a thematic mapping to manage the Cultural Heritage: The case of “Chiesa della Pietà” in Fermo. Int. Arch. Photogramm. Remote Sens. Spat. Inf. Sci. 2019, 42, 777–784. [Google Scholar] [CrossRef]
  31. Del Pozzo, D.; Treccani, D.; Appolonia, L.; Adami, A.; Scala, B. HBIM and thematic mapping: Preliminary results. Int. Arch. Photogramm. Remote Sens. Spat. Inf. Sci. 2022, 46, 199–206. [Google Scholar] [CrossRef]
  32. Banfi, F.; Brumana, R.; Landi, A.G.; Previtali, M.; Roncoroni, F.; Stanga, C. Building archaeology informative modelling turned into 3D volume stratigraphy and extended reality time-lapse communication. Virtual Archaeol. Rev. 2022, 13, 1–21. [Google Scholar] [CrossRef]
  33. Guida, C.G.; Limongiello, M.; Lorusso, A.; Sanseverino, A. From 2D to BIM: Decay mapping projection via Visual Programming Script. Esempi Di Archit. 2021, 149–157. [Google Scholar]
  34. Lanzara, E.; Scandurra, S.; Musella, C.; Palomba, D.; di Luggo, A.; Asprone, D. Documentation of structural damage and material decay phenomena in H-BIM systems. Int. Arch. Photogramm. Remote Sens. Spat. Inf. Sci. 2021, 46, 375–382. [Google Scholar] [CrossRef]
  35. Croce, V.; Caroti, G.; Piemonte, A. Propagation of semantic information between orthophoto and 3D replica: A H-BIM system for the north transept of Pisa Cathedral. Geomat. Nat. Hazards Risk 2021, 12, 2225–2252. [Google Scholar] [CrossRef]
  36. Caruso, E. L’abbazia basiliana di Santa Maria della Grotta. In Federico e la Sicilia; Ediprint: Siracusa, Italy, 1995; pp. 239–245. [Google Scholar]
  37. Aricò, M.; Dardanelli, G.; La Guardia, M.; Lo Brutto, M. Three-Dimensional Documentation and Virtual Web Navigation System for the Indoor and Outdoor Exploration of a Complex Cultural Heritage Site. Electronics 2024, 13, 2833. [Google Scholar] [CrossRef]
  38. Radanovic, M.; Khoshelham, K.; Fraser, C. Geometric accuracy and semantic richness in heritage BIM: A review. Digit. Appl. Archaeol. Cult. Herit. 2020, 19, e00166. [Google Scholar] [CrossRef]
  39. Hamed, W.; El Antably, A. Knowledge-based HBIM for conservation: The case of Yahya al-Shabih mausoleum. Digit. Appl. Archaeol. Cult. Herit. 2023, 30, e00278. [Google Scholar] [CrossRef]
  40. Allegra, V.; Di Paola, F.; Lo Brutto, M.; Vinci, C. Scan-to-BIM for the management of Heritage Building: The case study of the Castle of Maredolce (Palermo, Italy). Int. Arch. Photogramm. Remote Sens. Spat. Inf. Sci. 2020, 43, 1355–1362. [Google Scholar] [CrossRef]
  41. Aricò, M.; Lo Brutto, M.; Maltese, A. A Scan-to-BIM approach for the management of two Arab-Norman churches in Palermo (Italy). Heritage 2023, 6, 1622–1644. [Google Scholar] [CrossRef]
  42. Scianna, A.; Gaglio, G.F.; La Guardia, M. HBIM data management in historical and archaeological buildings. Archeol. E Calc. 2020, 31, 231–252. [Google Scholar] [CrossRef]
  43. Donato, A.; Randazzo, L.; Ricca, M.; Rovella, N.; Collina, M.; Ruggieri, N.; Dodaro, F.; Costanzo, A.; Alberghina, M.F.; Schiavone, S. Decay Assessment of Stone-Built Cultural Heritage: The Case Study of the Cosenza Cathedral Façade (South Calabria, Italy). Remote Sens. 2021, 13, 3925. [Google Scholar] [CrossRef]
  44. Diz-Mellado, E.; Mascort-Albea, E.J.; Romero-Hernández, R.; Galán-Marín, C.; Rivera-Gómez, C.; Ruiz-Jaramillo, J.; Jaramillo-Morilla, A. Non-destructive testing and Finite Element Method integrated procedure for heritage diagnosis: The Seville Cathedral case study. J. Build. Eng. 2021, 37, 102134. [Google Scholar] [CrossRef]
  45. ICOMOS International Scientific Committee for Stone (ISCS). Illustrated Glossary on Stone Deterioration Patterns; Ateliers 30 Impression: Champigny sur Marne, France, 2008. [Google Scholar]
  46. Cameron, C. UNESCO and Cultural Heritage. In A Companion to Heritage Studies; Logan, W., Craith, M.N., Kockel, U., Eds.; John Wiley & Sons: Hoboken, NJ, USA, 2015. [Google Scholar]
  47. Moropoulou, A.; Labropoulos, K.C.; Delegou, E.T.; Karoglou, M.; Bakolas, A. Non-destructive techniques as a tool for the protection of built cultural heritage. Constr. Build. Mater. 2013, 48, 1222–1239. [Google Scholar] [CrossRef]
  48. Kadi, H.; Anouche, K. Knowledge-based parametric modeling for heritage interpretation and 3D reconstruction. Digit. Appl. Archaeol. Cult. Herit. 2020, 19, e00160. [Google Scholar] [CrossRef]
  49. Centarti, L.; Ferreyra, C.; Guida, C.G.; Limongiello, M.; Messina, B. Documentation and management of complex 3D morphologies through digital technology. Acta IMEKO 2024, 13, 1–7. [Google Scholar] [CrossRef]
  50. Penjor, T.; Banihashemi, S.; Hajirasouli, A.; Golzad, H. Heritage Building Information Modelling (HBIM) for Heritage Conservation: Framework of Challenges, Gaps, and Existing limitations of HBIM. Digit. Appl. Archaeol. Cult. Herit. 2024, 35, e00366. [Google Scholar] [CrossRef]
Figure 1. Location of the church of “Santa Maria della Grotta” (from OpenStreetMap©).
Heritage 07 00294 g001
Figure 2. Nadir picture of the “Santa Maria della Grotta” site and building.
Heritage 07 00294 g002
Figure 3. View of the main façade of the church of “Santa Maria della Grotta”.
Heritage 07 00294 g003
Figure 4. The green tile hemispherical dome of the church of “Santa Maria della Grotta”.
Heritage 07 00294 g004
Figure 5. Plan of the church.
Heritage 07 00294 g005
Figure 6. Interior of the church of “Santa Maria della Grotta”: (a) view towards the apse, (b) view towards the entrance. The decay and alteration phenomena are visible all over the walls.
Heritage 07 00294 g006
Figure 7. Scheme of the workflow.
Heritage 07 00294 g007
Figure 8. The three paths of the HMLS survey: (a) the southern hypogea path; (b) the northern hypogea path; (c) the exterior path. The red points indicate the reference point locations.
Heritage 07 00294 g008
Figure 9. Scheme of the terrestrial photogrammetric survey of the internal façades: (a) in section, (b) in plan.
Heritage 07 00294 g009
Figure 10. Laser scanner and photogrammetric point cloud steps for obtaining the final point cloud.
Heritage 07 00294 g010
Figure 11. Orthophotos of the external (a) and the internal (b) wall of the left side of the church.
Heritage 07 00294 g011
Figure 12. Main reference levels for parametric modelling.
Heritage 07 00294 g012
Figure 13. Model construction after the application of in-built system families.
Heritage 07 00294 g013
Figure 14. The modelling steps for the fascia on top of the nave: (a) extraction of the profile extraction, (b) generation of its path, (c) final extrusion.
Heritage 07 00294 g014
Figure 15. Different operations to obtain the pedestal of the double pillars and its mouldings: (a) extrusion of the main body, (b) generation of the lower moulding’s profile (c) its extrusion on a path, (d) generation of the upper moulding’s profile (e) extrusion on a path.
Heritage 07 00294 g015
Figure 16. The main parts of the pillars: (a) shaft and pedestal at the end of the extrusions, (b) the void extrusion on the shaft for carving its section, (c) a rendered model of the whole double pillars.
Heritage 07 00294 g016
Figure 17. The sequenced process to obtain the rose window: (a) the cylindrical void cutting the wall, (b) its splays on façade and counterfaçade, (c) the extrusion of the annular moulding on a circular path on the counterfaçade, (d) the rose window at the end.
Heritage 07 00294 g017
Figure 18. Local families for modelling the openings: (a) the cutting arched void, (b) the wall after the subtraction.
Heritage 07 00294 g018
Figure 19. The strategy followed for modelling the boat vault of the main nave: (a) the initial mass overimposed to supporting structures of the model, (b) the actual roof obtained from the command “Roof from mass” according to its constructive layers.
Heritage 07 00294 g019
Figure 20. The modelling process for the parapet: (a) the generative profile of the stringer, (b) the revolution of the profile on its vertical axis, (c) the alignment of the offset stringers along the top perimeter of the building.
Heritage 07 00294 g020
Figure 21. The isometric view of the model split across its long section, displayed in conventional texture.
Heritage 07 00294 g021
Figure 22. The abacus of decays from the HBIM model.
Heritage 07 00294 g022
Figure 23. An example of contour tracing: (a) detail of fragmentation on surface layer; (b) the parametric families created accordingly.
Heritage 07 00294 g023
Figure 24. Decay maps: (a) on the external wall; (b) on the internal wall.
Heritage 07 00294 g024
Figure 25. 3D view with the decay maps on both sides of the long walls in the BIM environment.
Heritage 07 00294 g025
Disclaimer/Publisher’s Note: The statements, opinions and data contained in all publications are solely those of the individual author(s) and contributor(s) and not of MDPI and/or the editor(s). MDPI and/or the editor(s) disclaim responsibility for any injury to people or property resulting from any ideas, methods, instructions or products referred to in the content.