
Safeguarding Our Heritage—The TRIQUETRA Project Approach


 ,
,  ,
,  ,
,  , , ,
, , ,  ,
,  , , , ,
  ,
,  ,
, 
Abstract
:1. Introduction
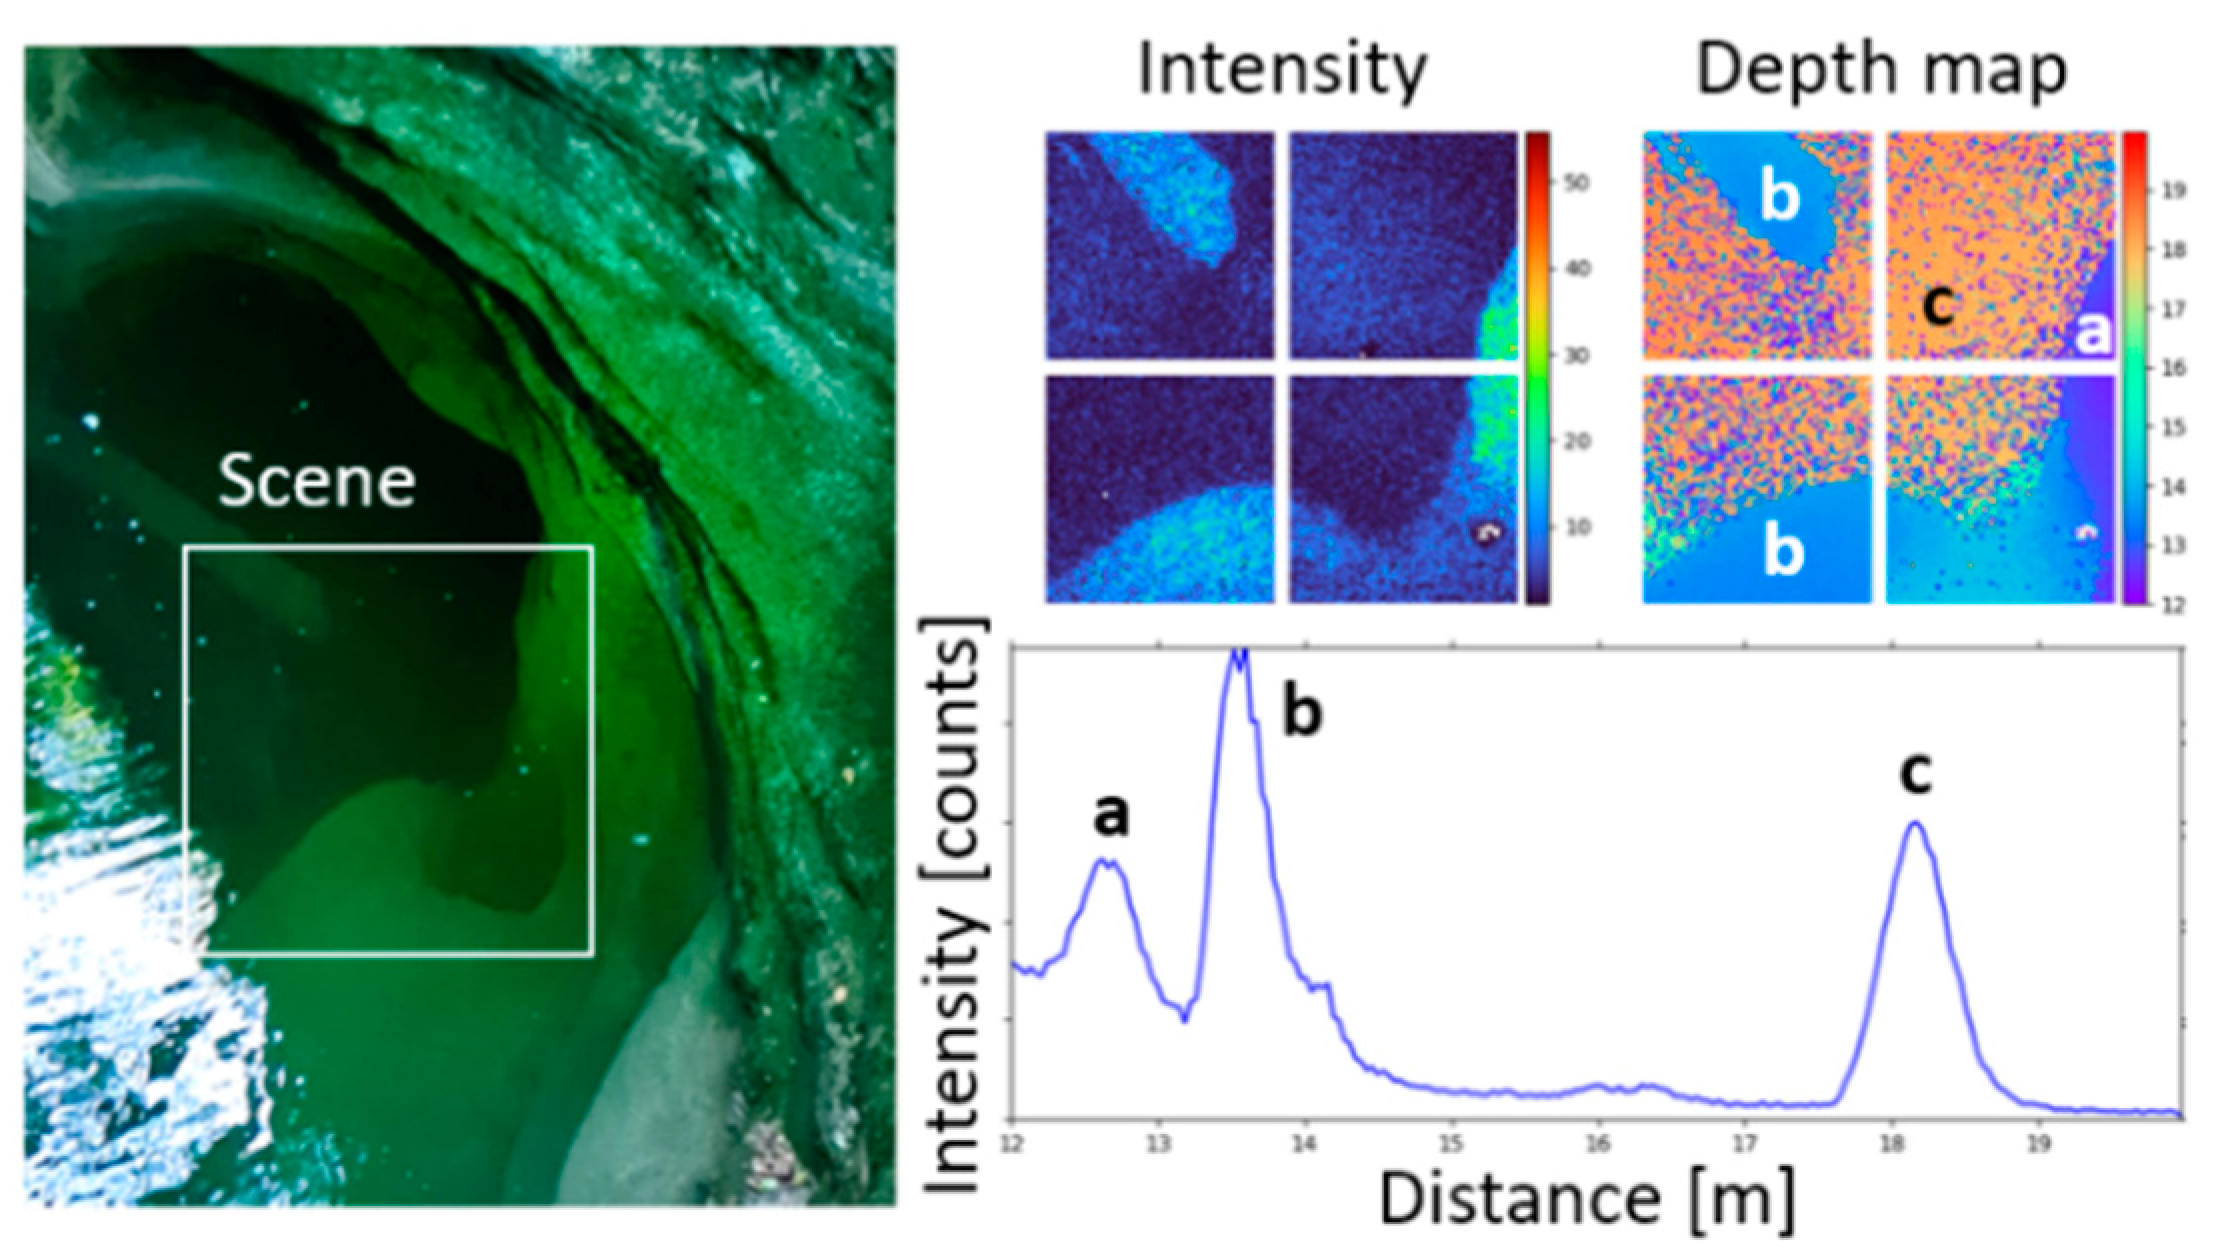
- assessing the precision of the flash LiDAR technology for 3D mapping of underwater CH sites and validating its applicability for erosion monitoring;
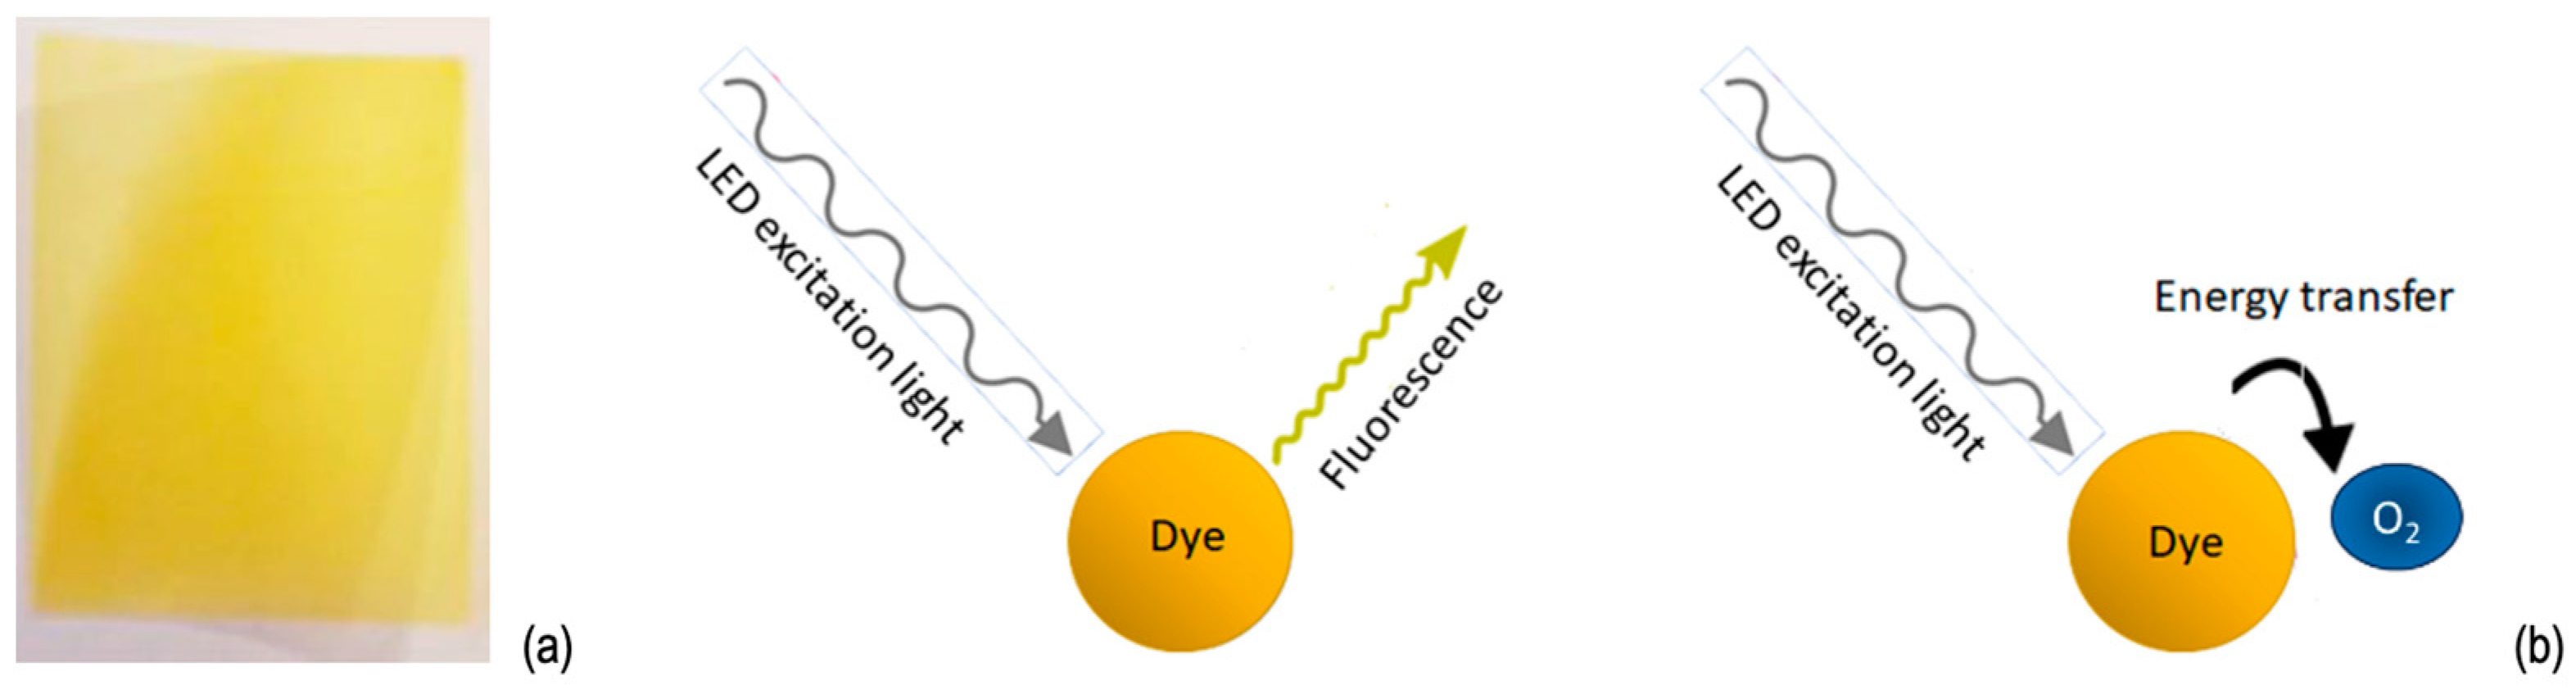
- developing a novel spectroscopic sensor for water quality monitoring near underwater CH sites;
- further increasing the accuracy of climatic models;
- developing models for risk quantification stemming from extreme water, ice, and snow events;
- developing models for calculating geohazard risks based on in-situ data for CH sites;
- developing models on structural damage risks on CH sites;
- assessing chemical and biological hazards on CH sites based on in-situ sensing;
- analyzing the need for and providing novel techniques for the application of remote sensing at CH sites;
- developing a platform that allows multi-hazard impact assessment and acts as an advanced DSS towards risk mitigation and CH site remediation.
2. Overview of TRIQUETRAs Methodology
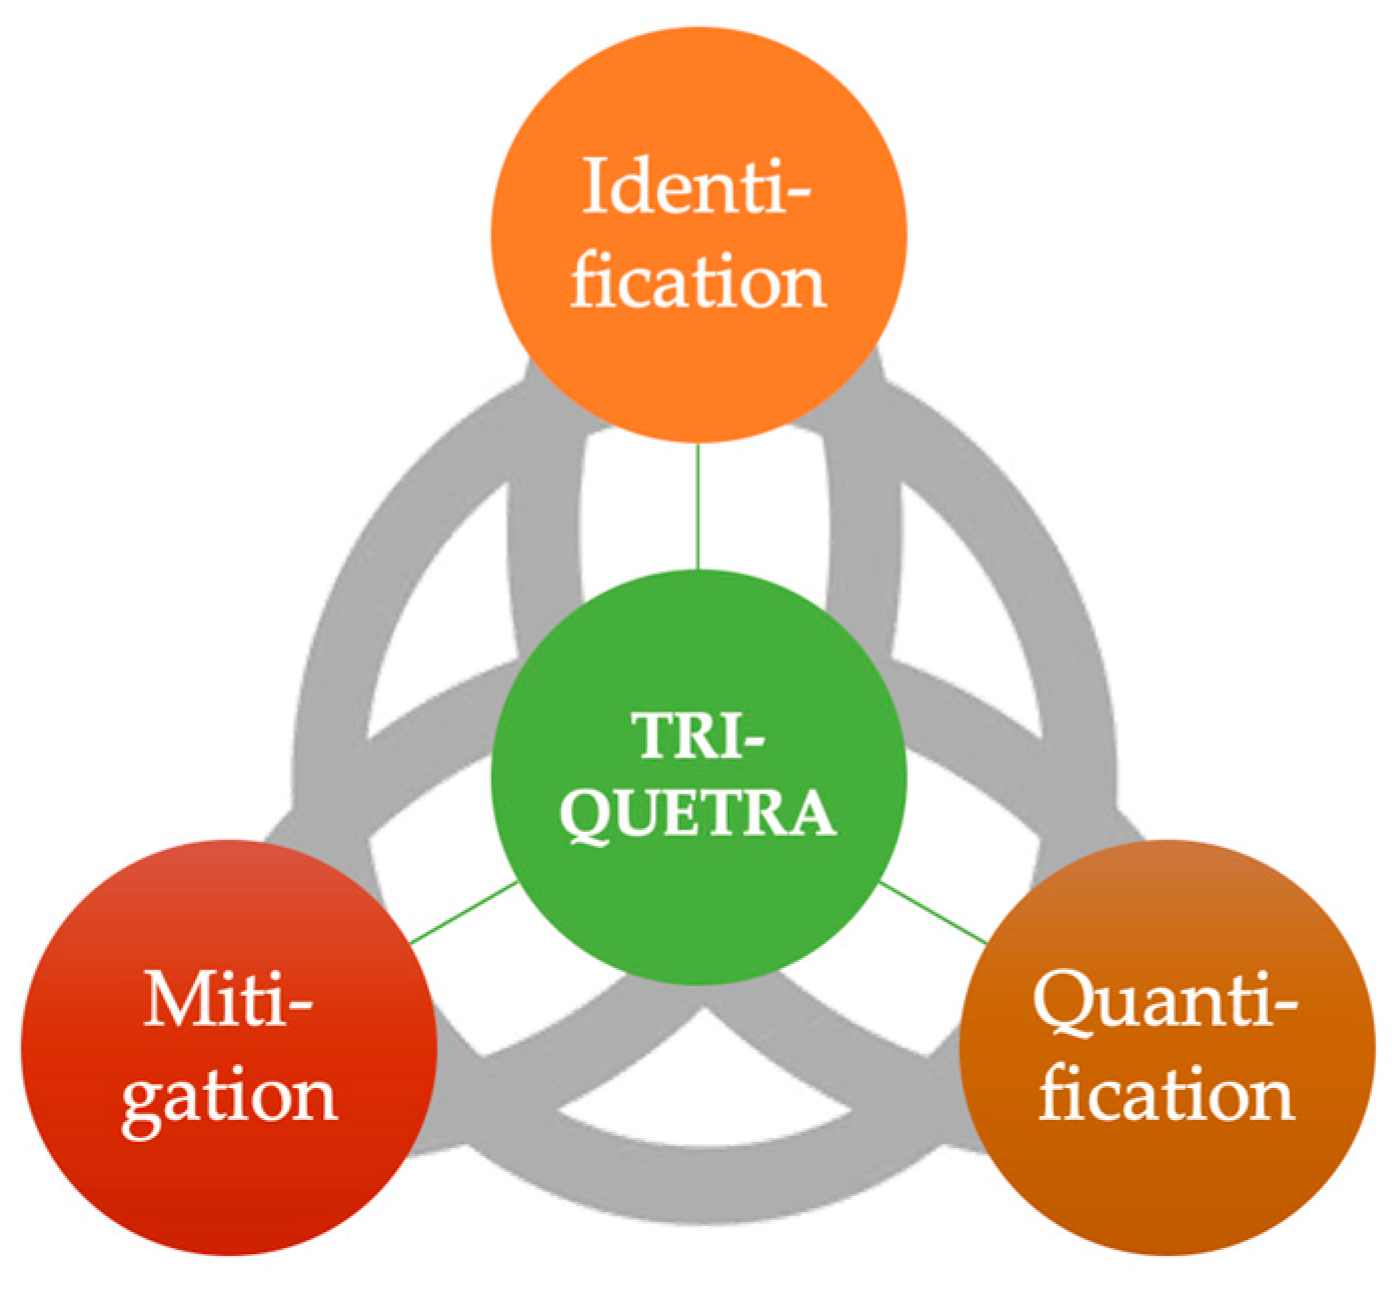
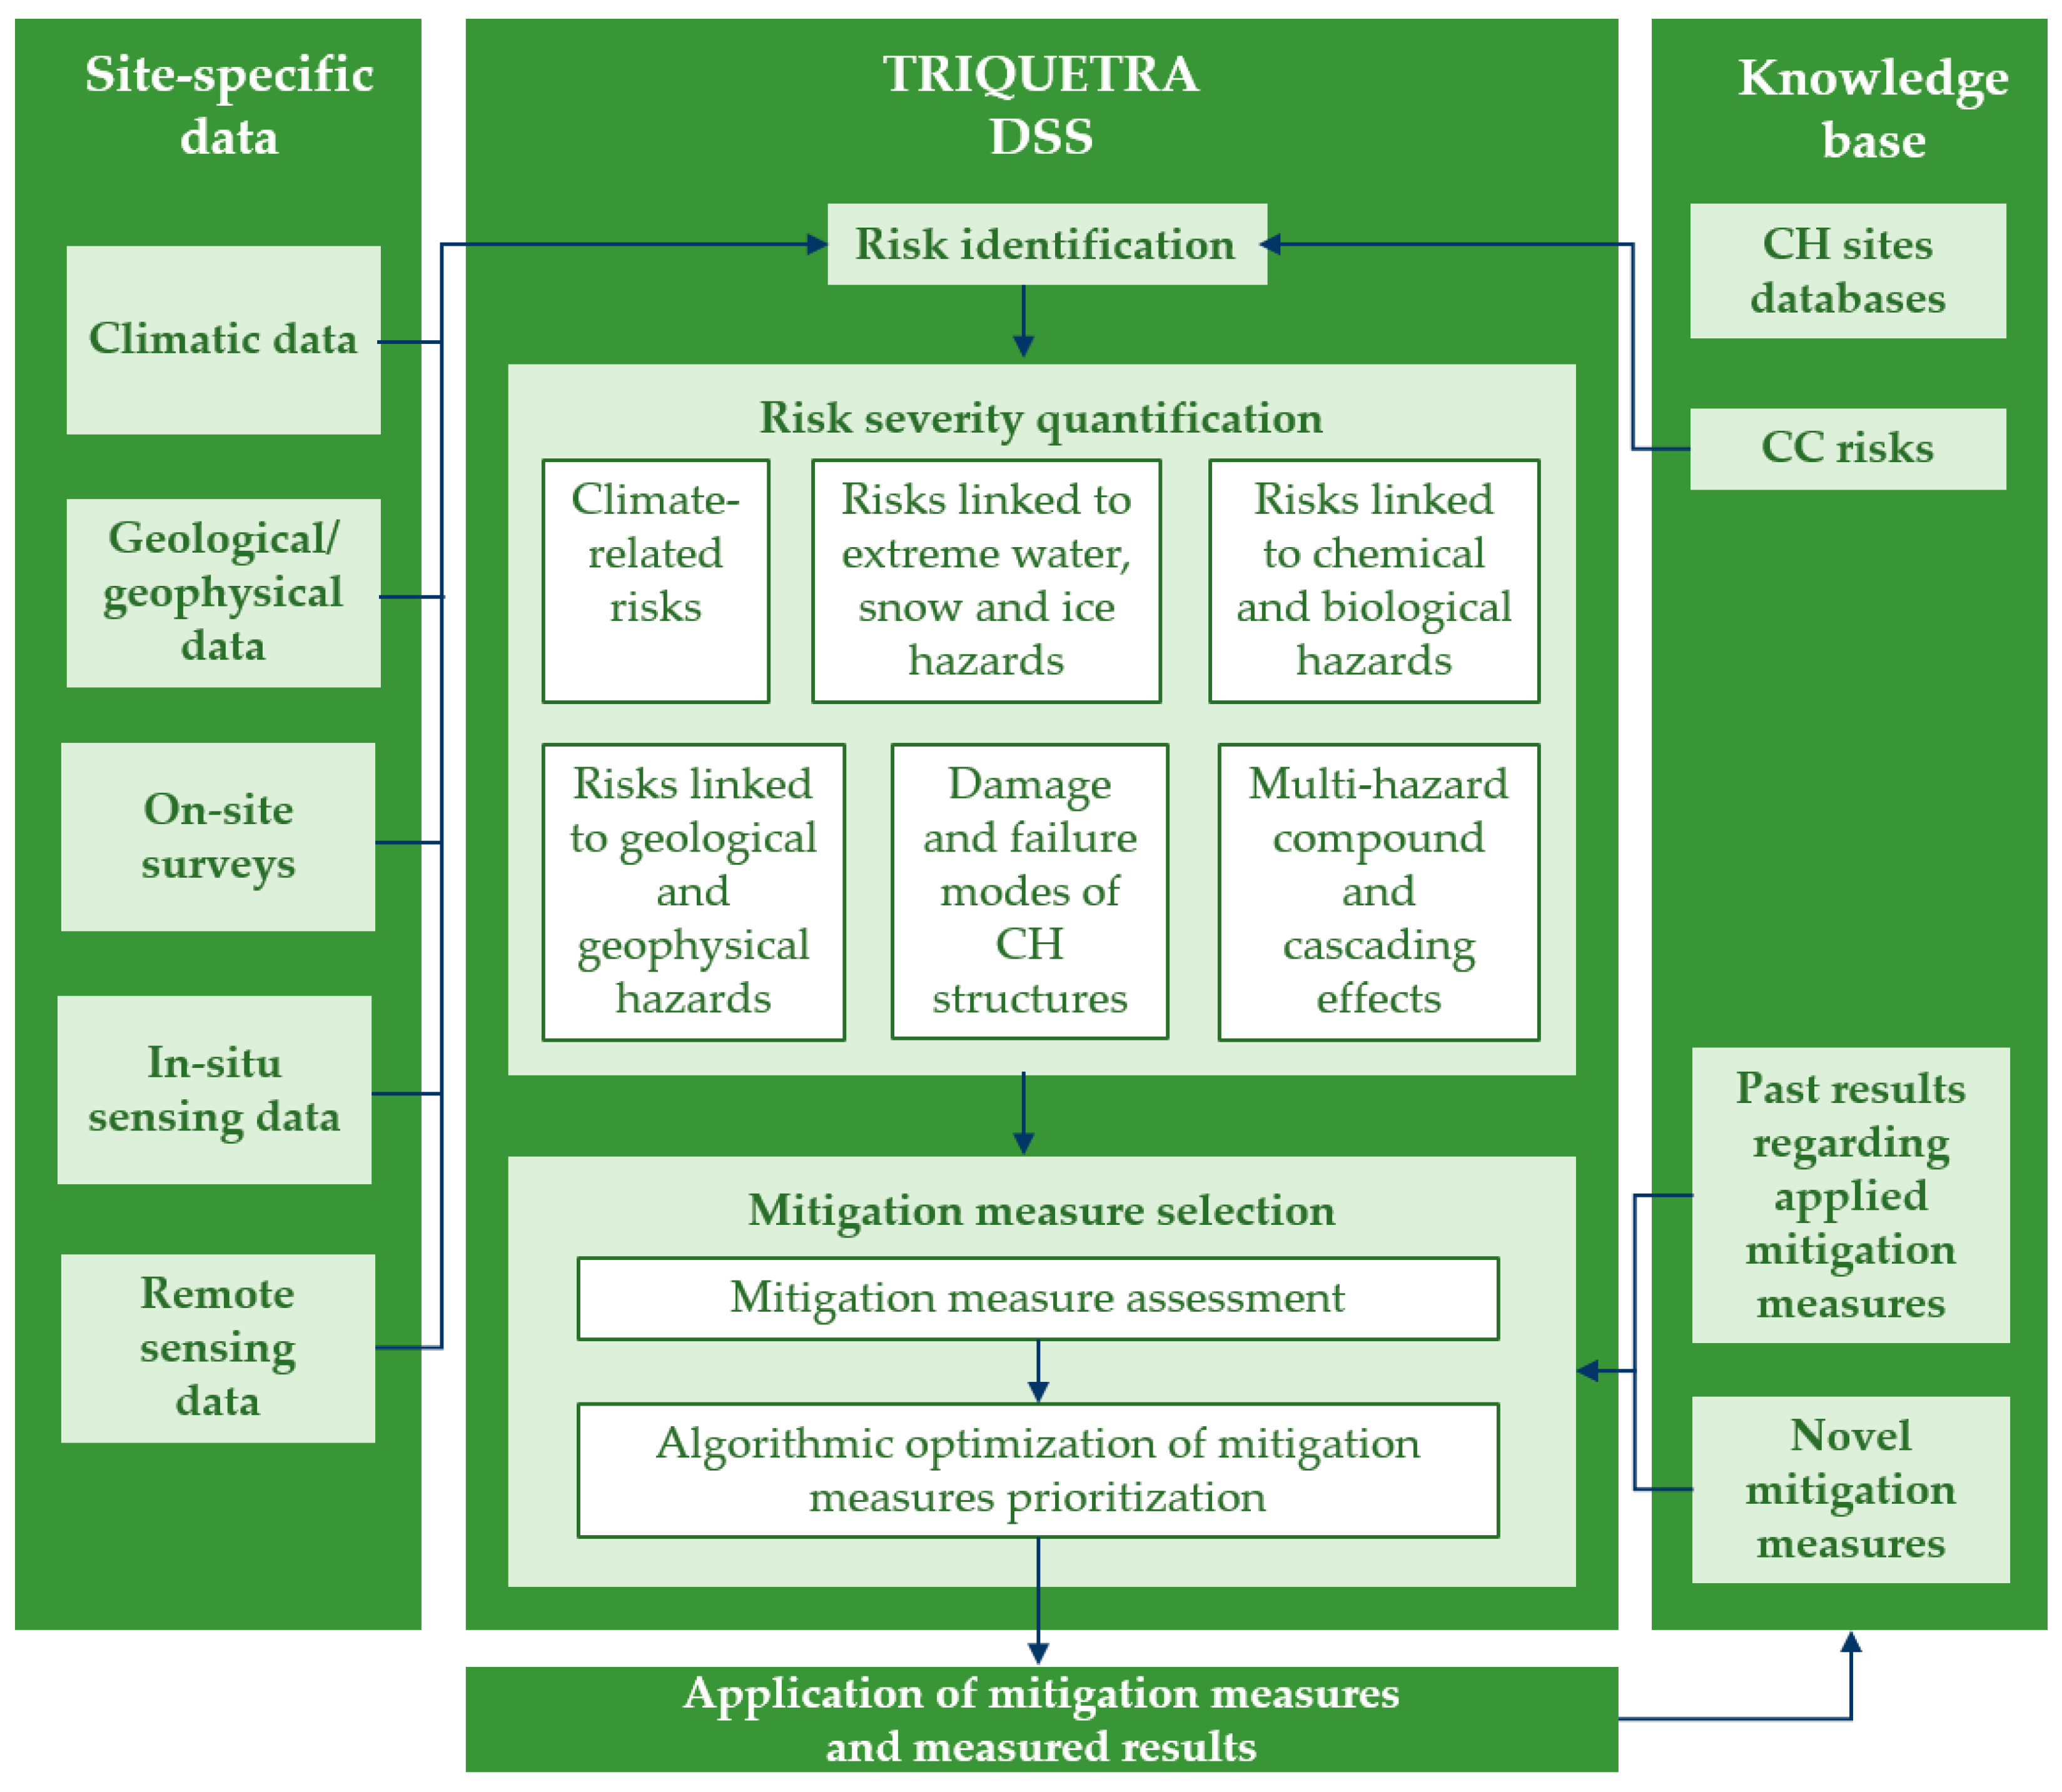
2.1. TRIQUETRAs Main Approach
- climate-related risks, employing high-resolution RCMs, utilizing dynamical downscaling methods from GCM simulations within the CORDEX initiative, focusing on diverse hazards and climate parameters to predict potential damage and flood risks, and integrating RCM output to model impacts on river and coastal flood levels at CH sites;
- extreme water, snow, and ice hazard risks by leveraging optical sensors to identify erosion-sensitive areas, predicting water fluxes during various events like floods or heavy rains using Digital Elevation Models, and assessing water constituents like CDOM, phytoplankton, and non-organic materials to detect potential threats to submerged CH sites, quantifying hydrodynamic forces on CH structures during water hazards, and utilizing computational fluid dynamics with mesh and particle-based methods to model chaotic wave breaking, extreme floods, and 3D effects around monuments;
- geological and geophysical risks, by integrating high-resolution seismometry with terrestrial thermographic surveys to measure dynamic behavior in disconnected rock elements, enabling 4D visualization of thermal measurements, sizing of rock portions involved in geological processes, and precisely projecting vibrational data obtained from seismic sensors onto a 3D model, thus allowing for conceptual modeling of processes, identification of sectors with intense geomorphological dynamics, and detection of precursor signals for potential collapse episodes; using advanced processing to detect microseismic events linked to fractures or coastal detachments; and
- chemical and biological hazard risks, utilizing Advanced Quantum Cascade Lasers (QCLs) and molecular imprinted polymers (MIPs) technology, which facilitate real-time monitoring of significant water-based threats to CH sites, including tracking eutrophication indicators such as nutrients, harmful pollutants like hydrocarbons, and specific biological species like bacteria.
2.2. TRIQUETRAs Toolbox
2.3. Pilot Case Studies
2.3.1. Kalapodi
2.3.2. Ventotene
2.3.3. Aegina
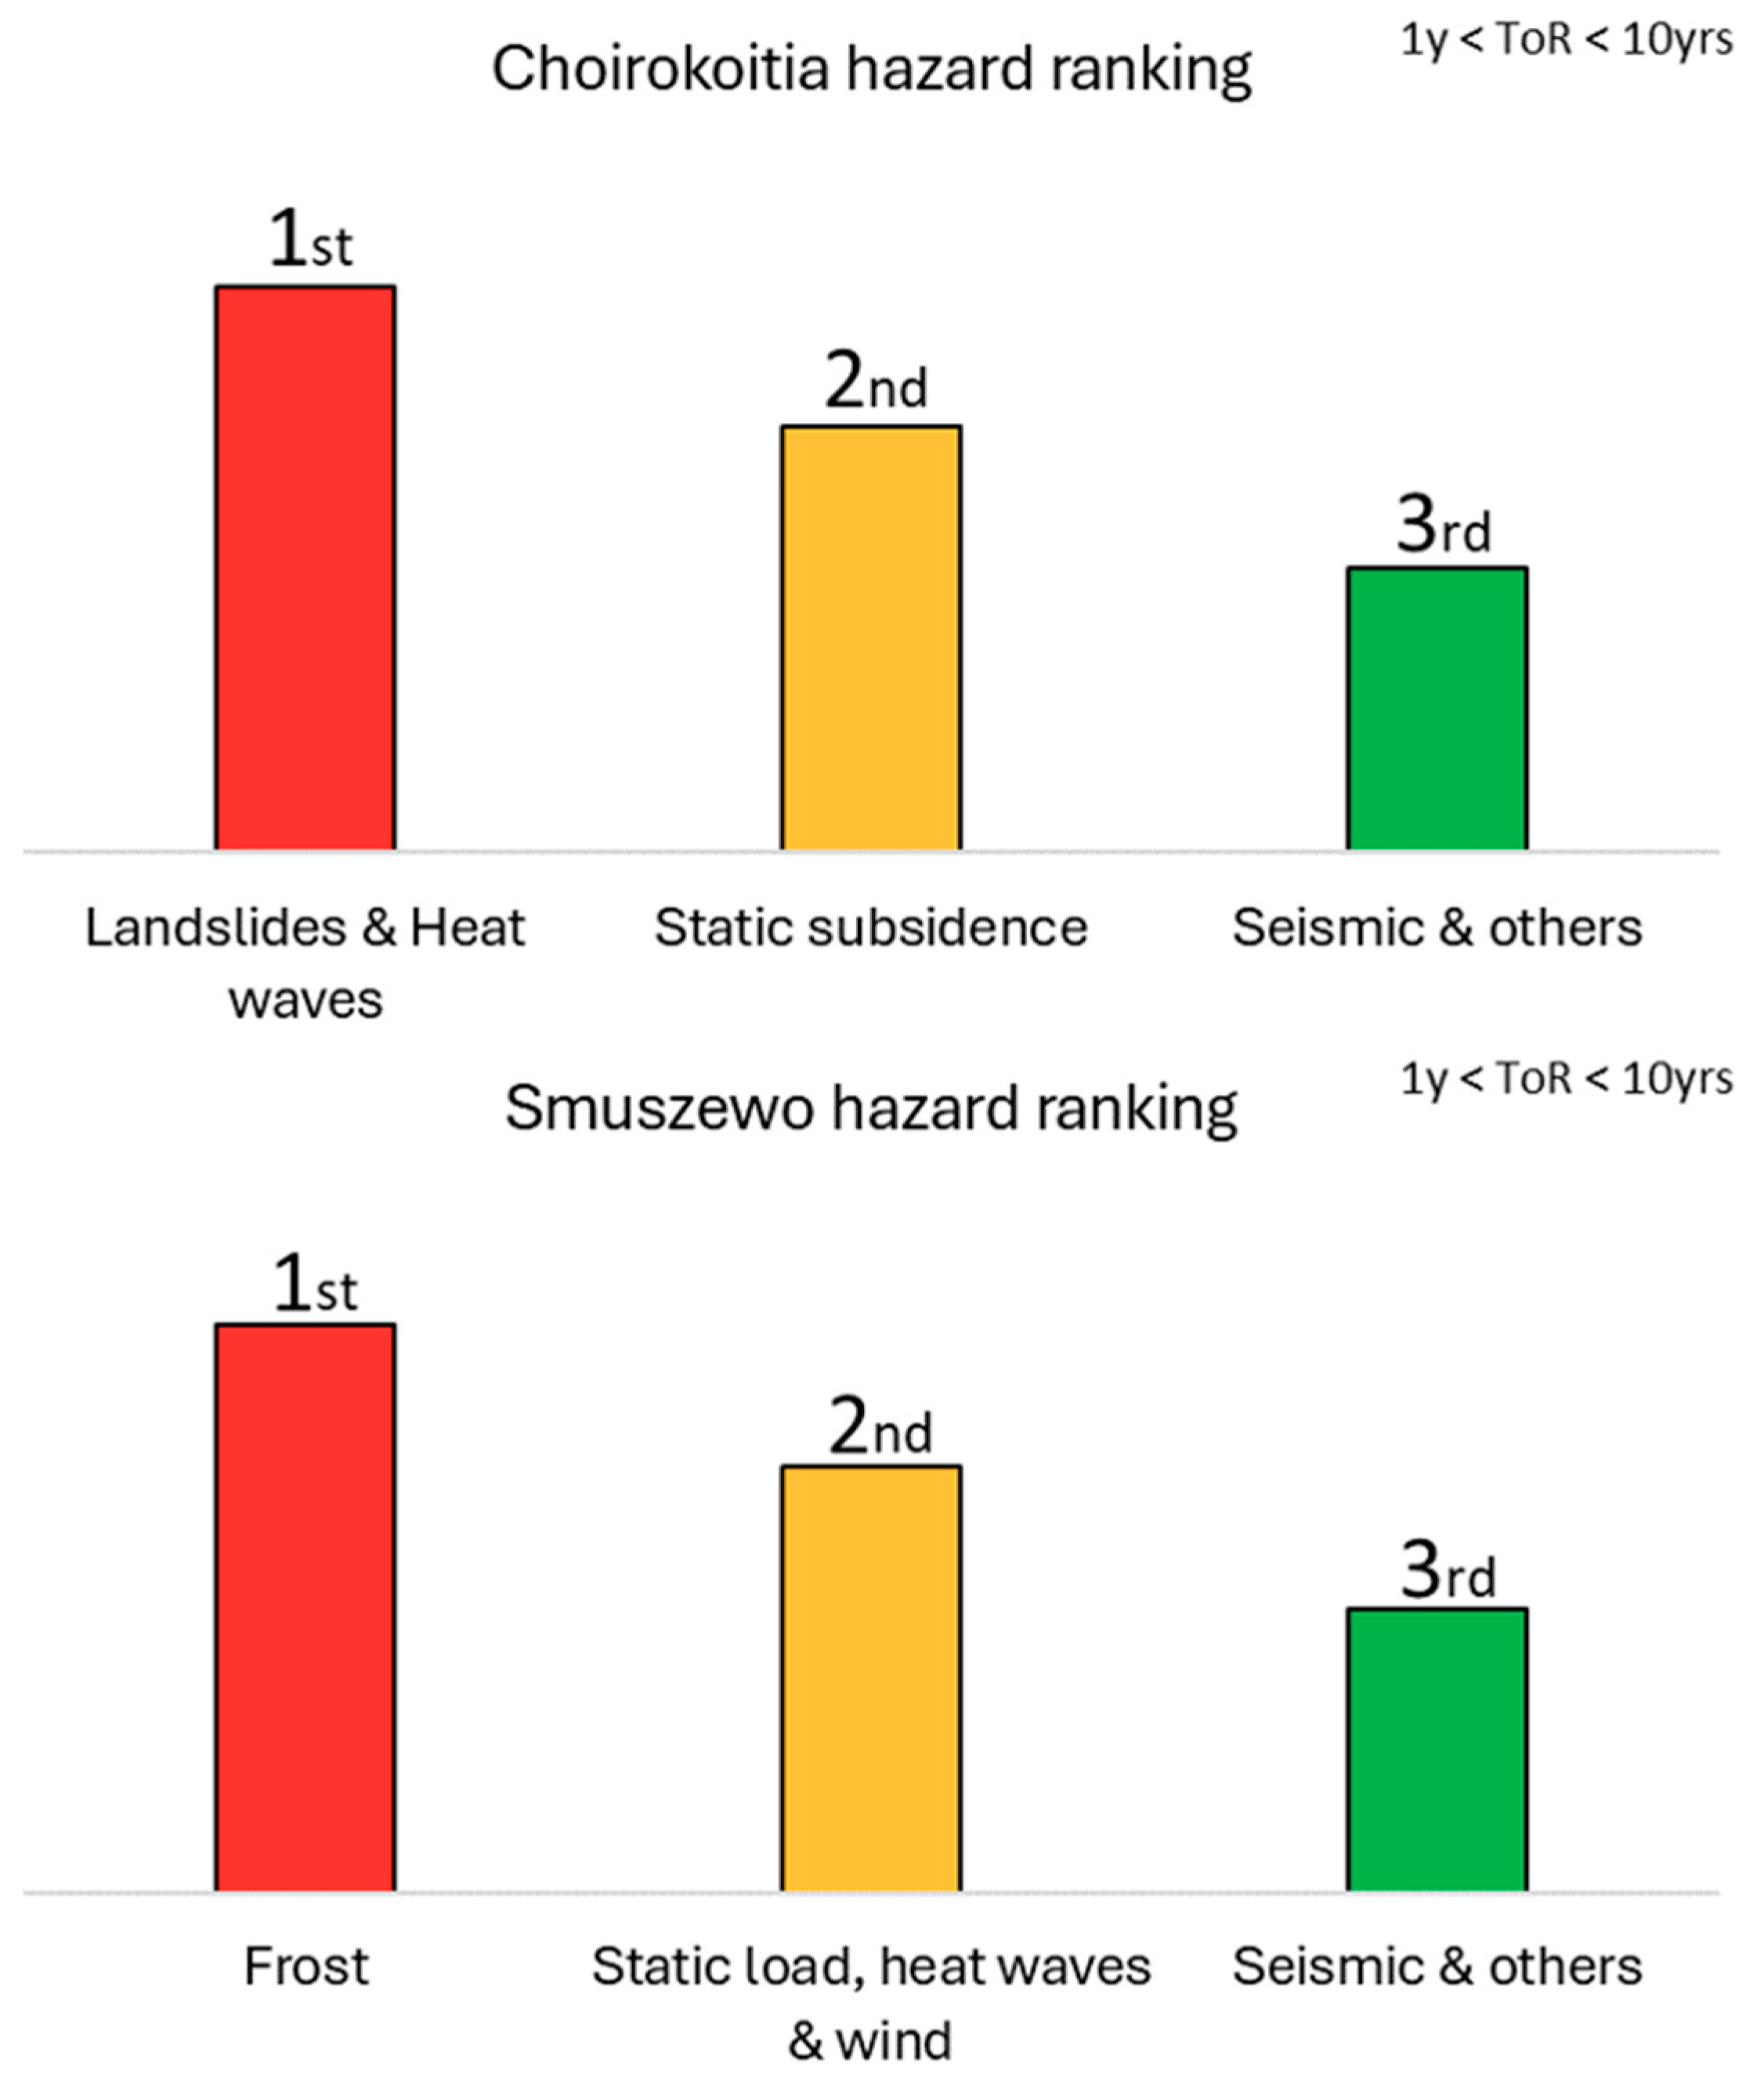
2.3.4. Choirokoitia
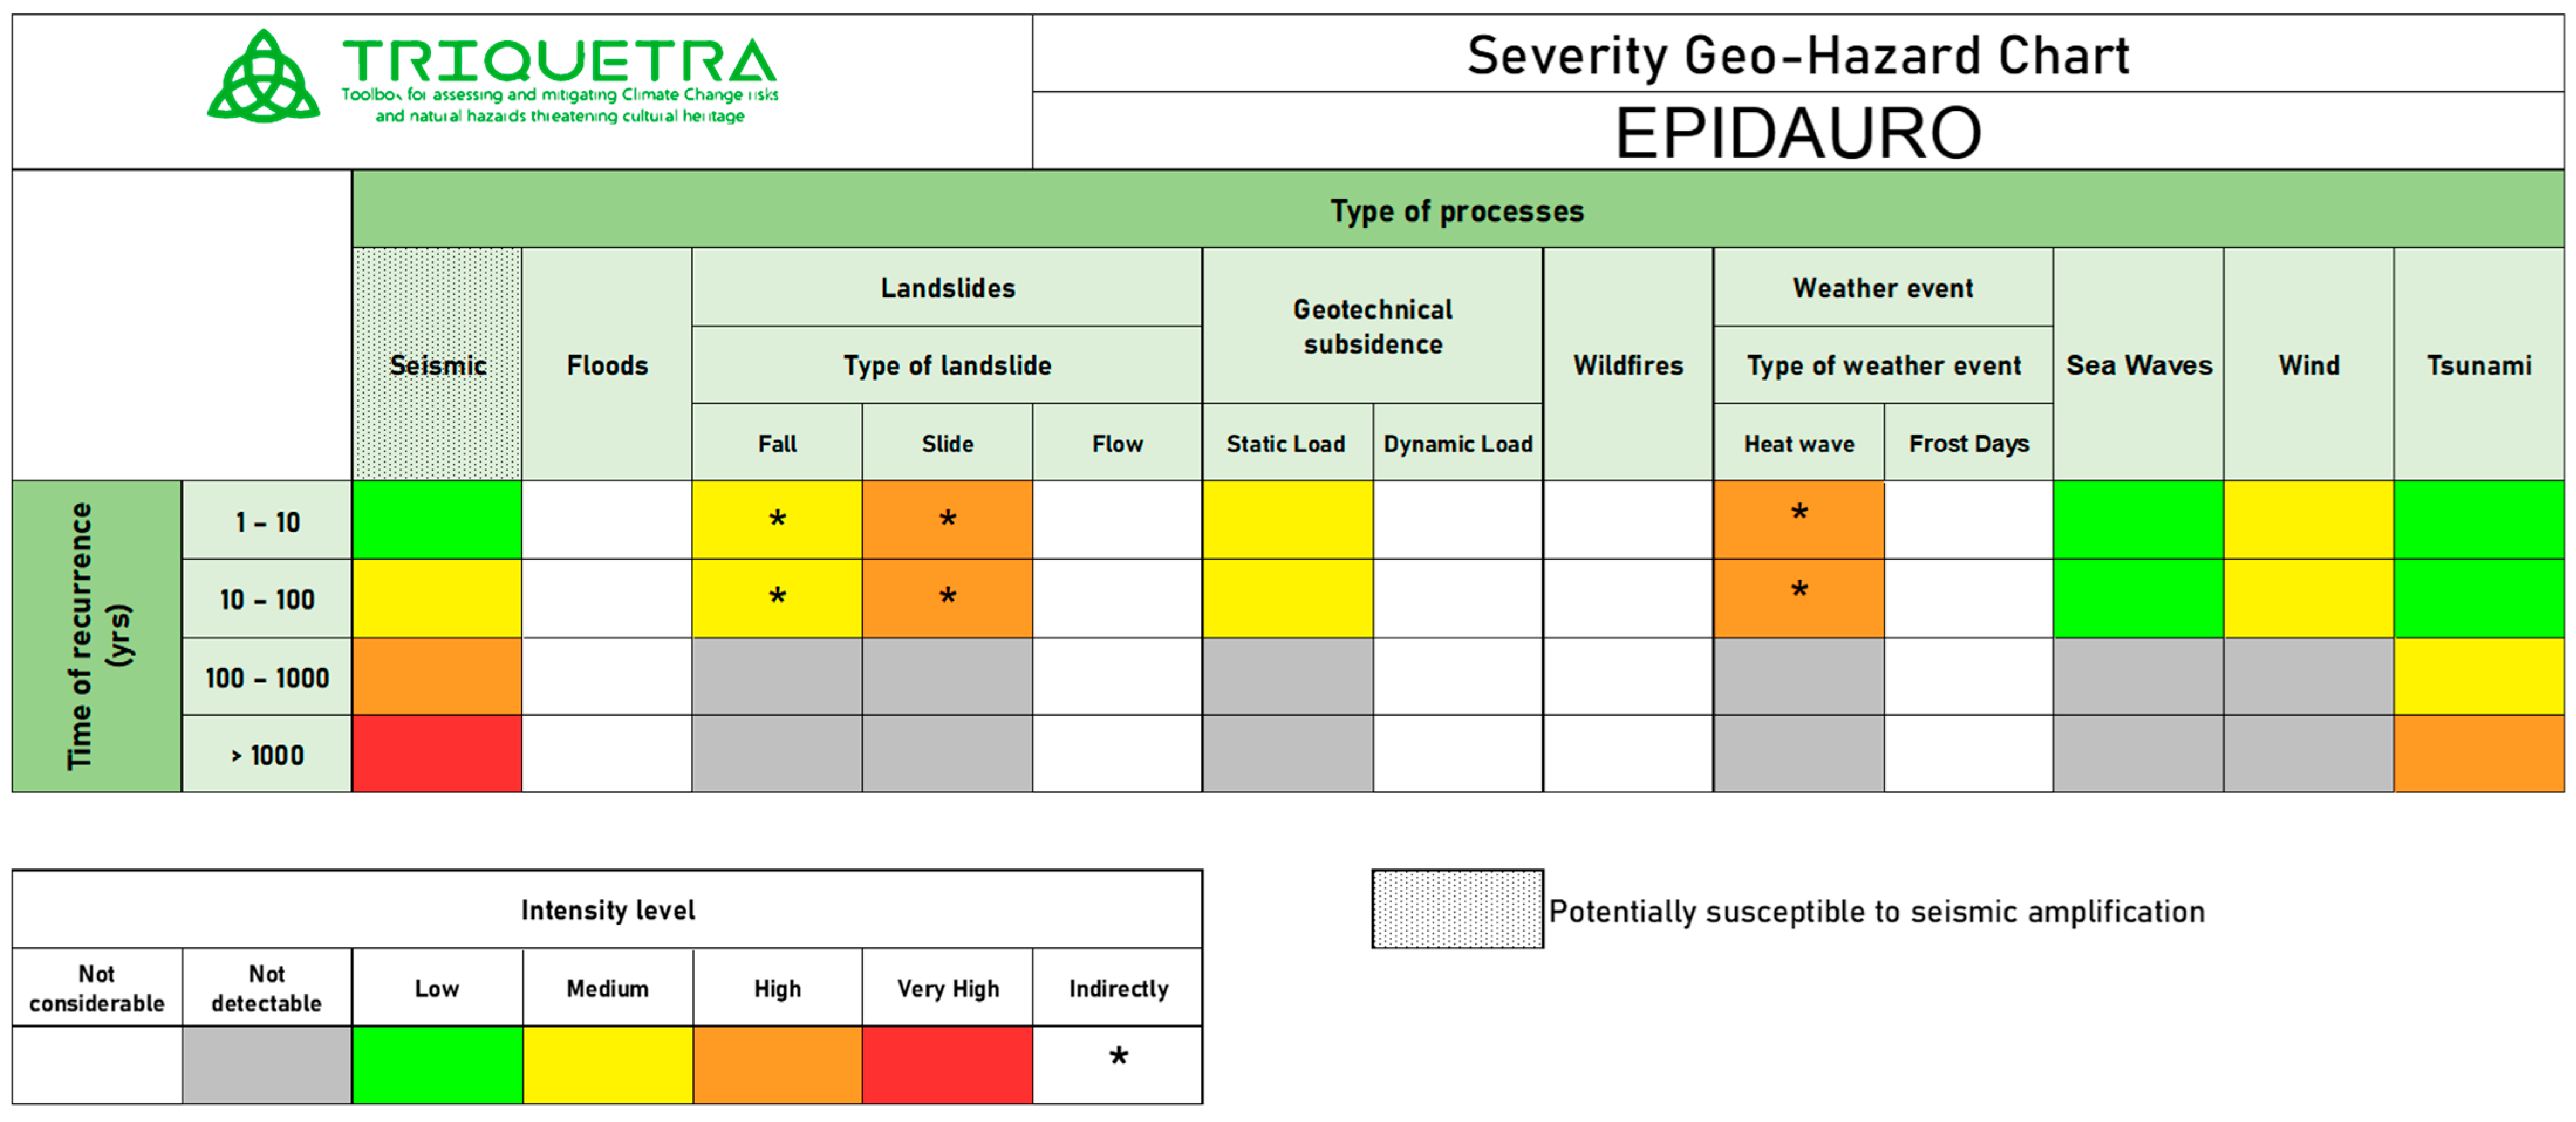
2.3.5. Epidaurus
2.3.6. Roseninsel
2.3.7. Argilliez
2.3.8. Smuszewo
2.4. Novel Sensors and Coatings
2.5. Earth Observation Methods
3. Preliminary Results
3.1. TRIQUETRA Knowledge Base
3.1.1. Data
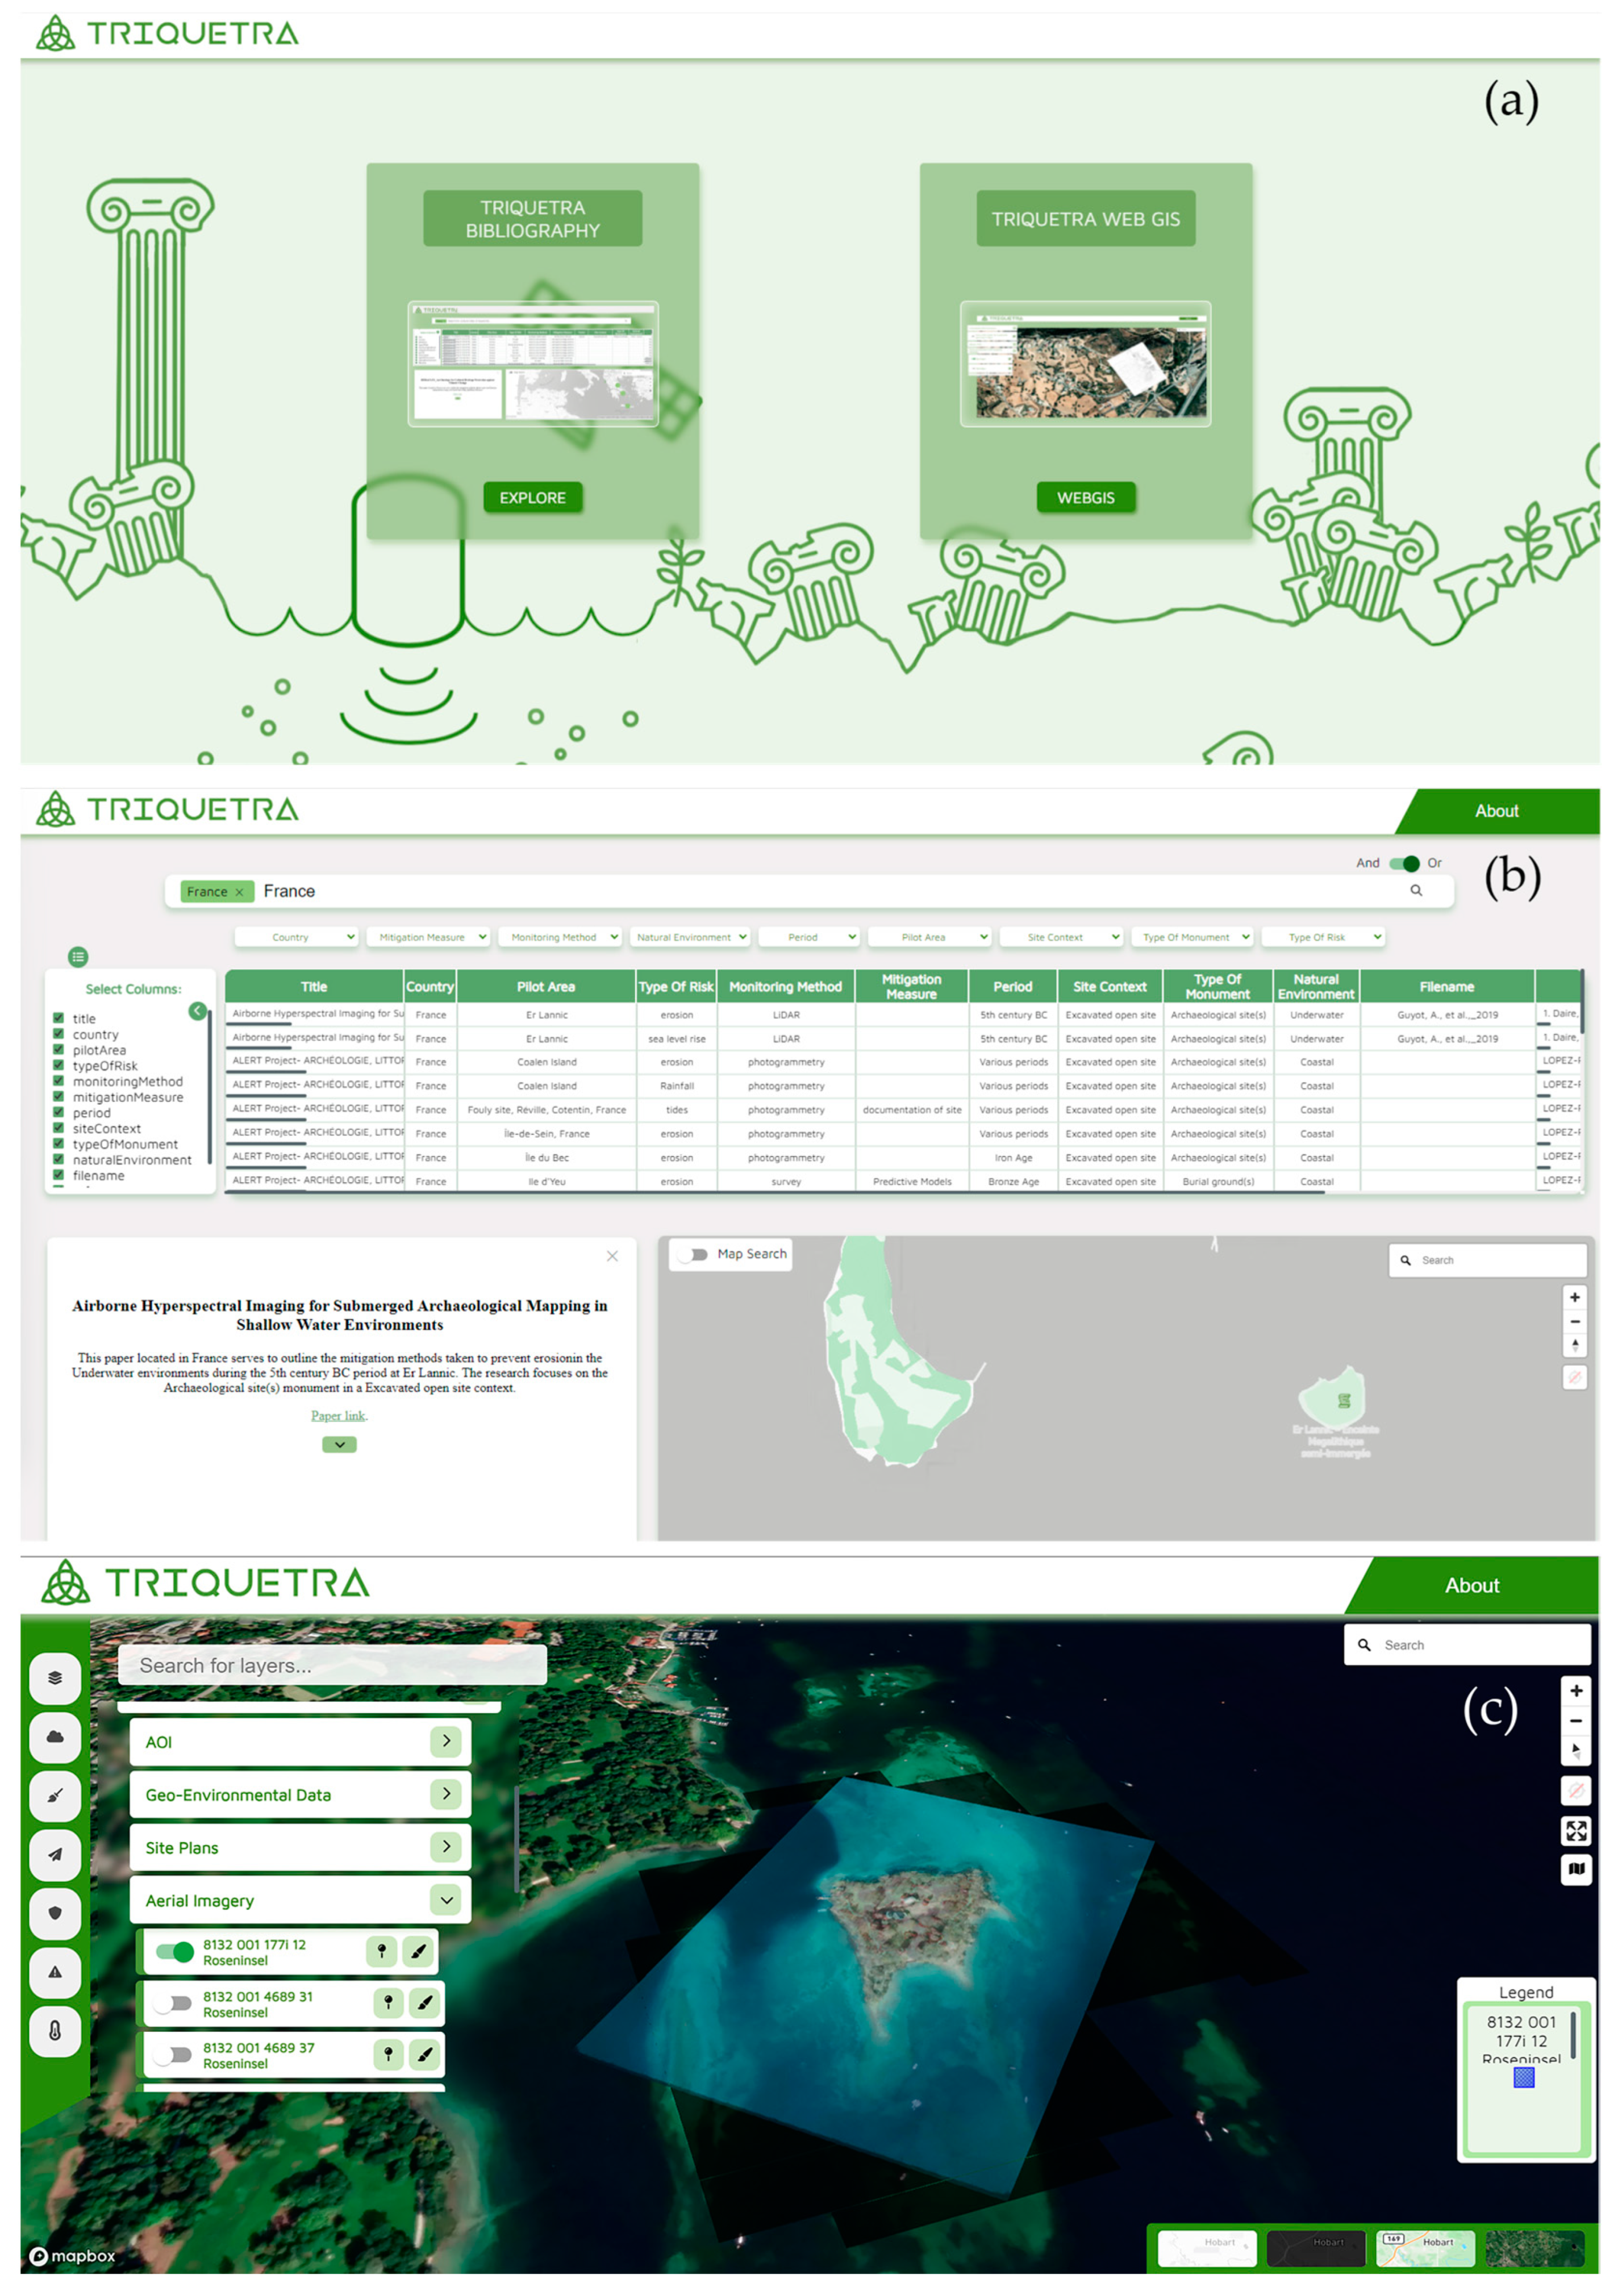
3.1.2. Platform
3.2. Risk Identification
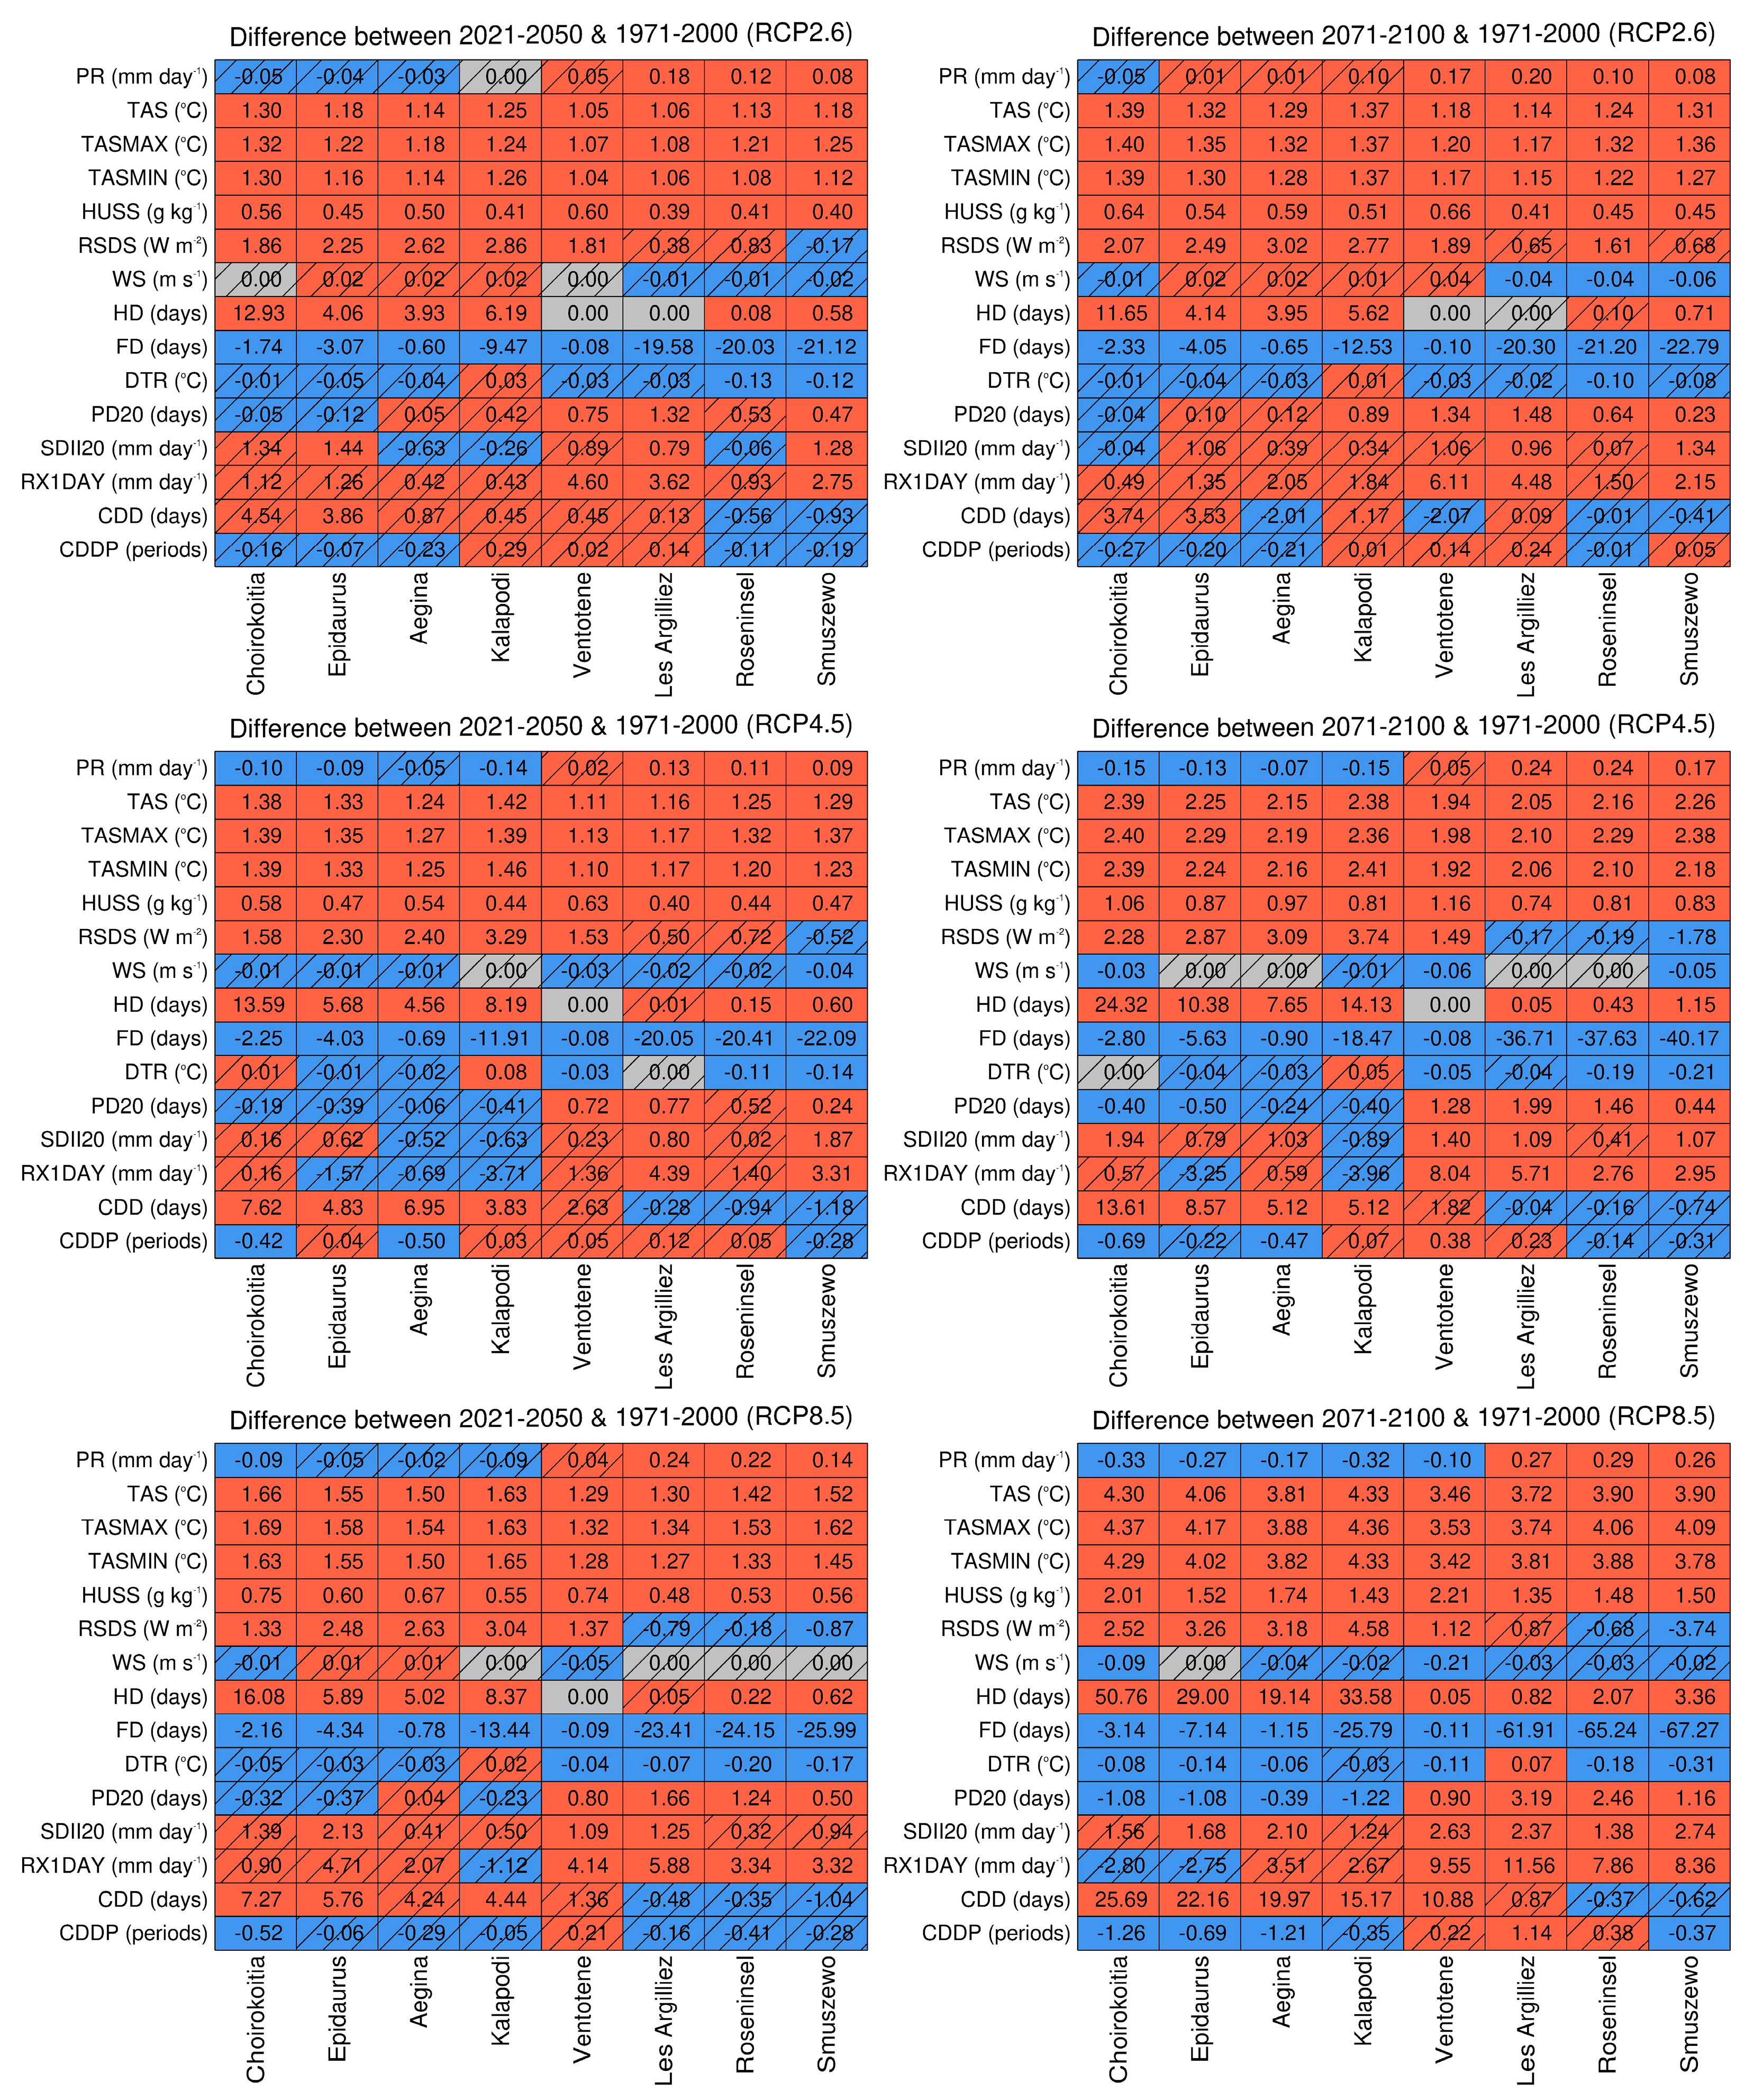
3.2.1. Climate-Related Hazards
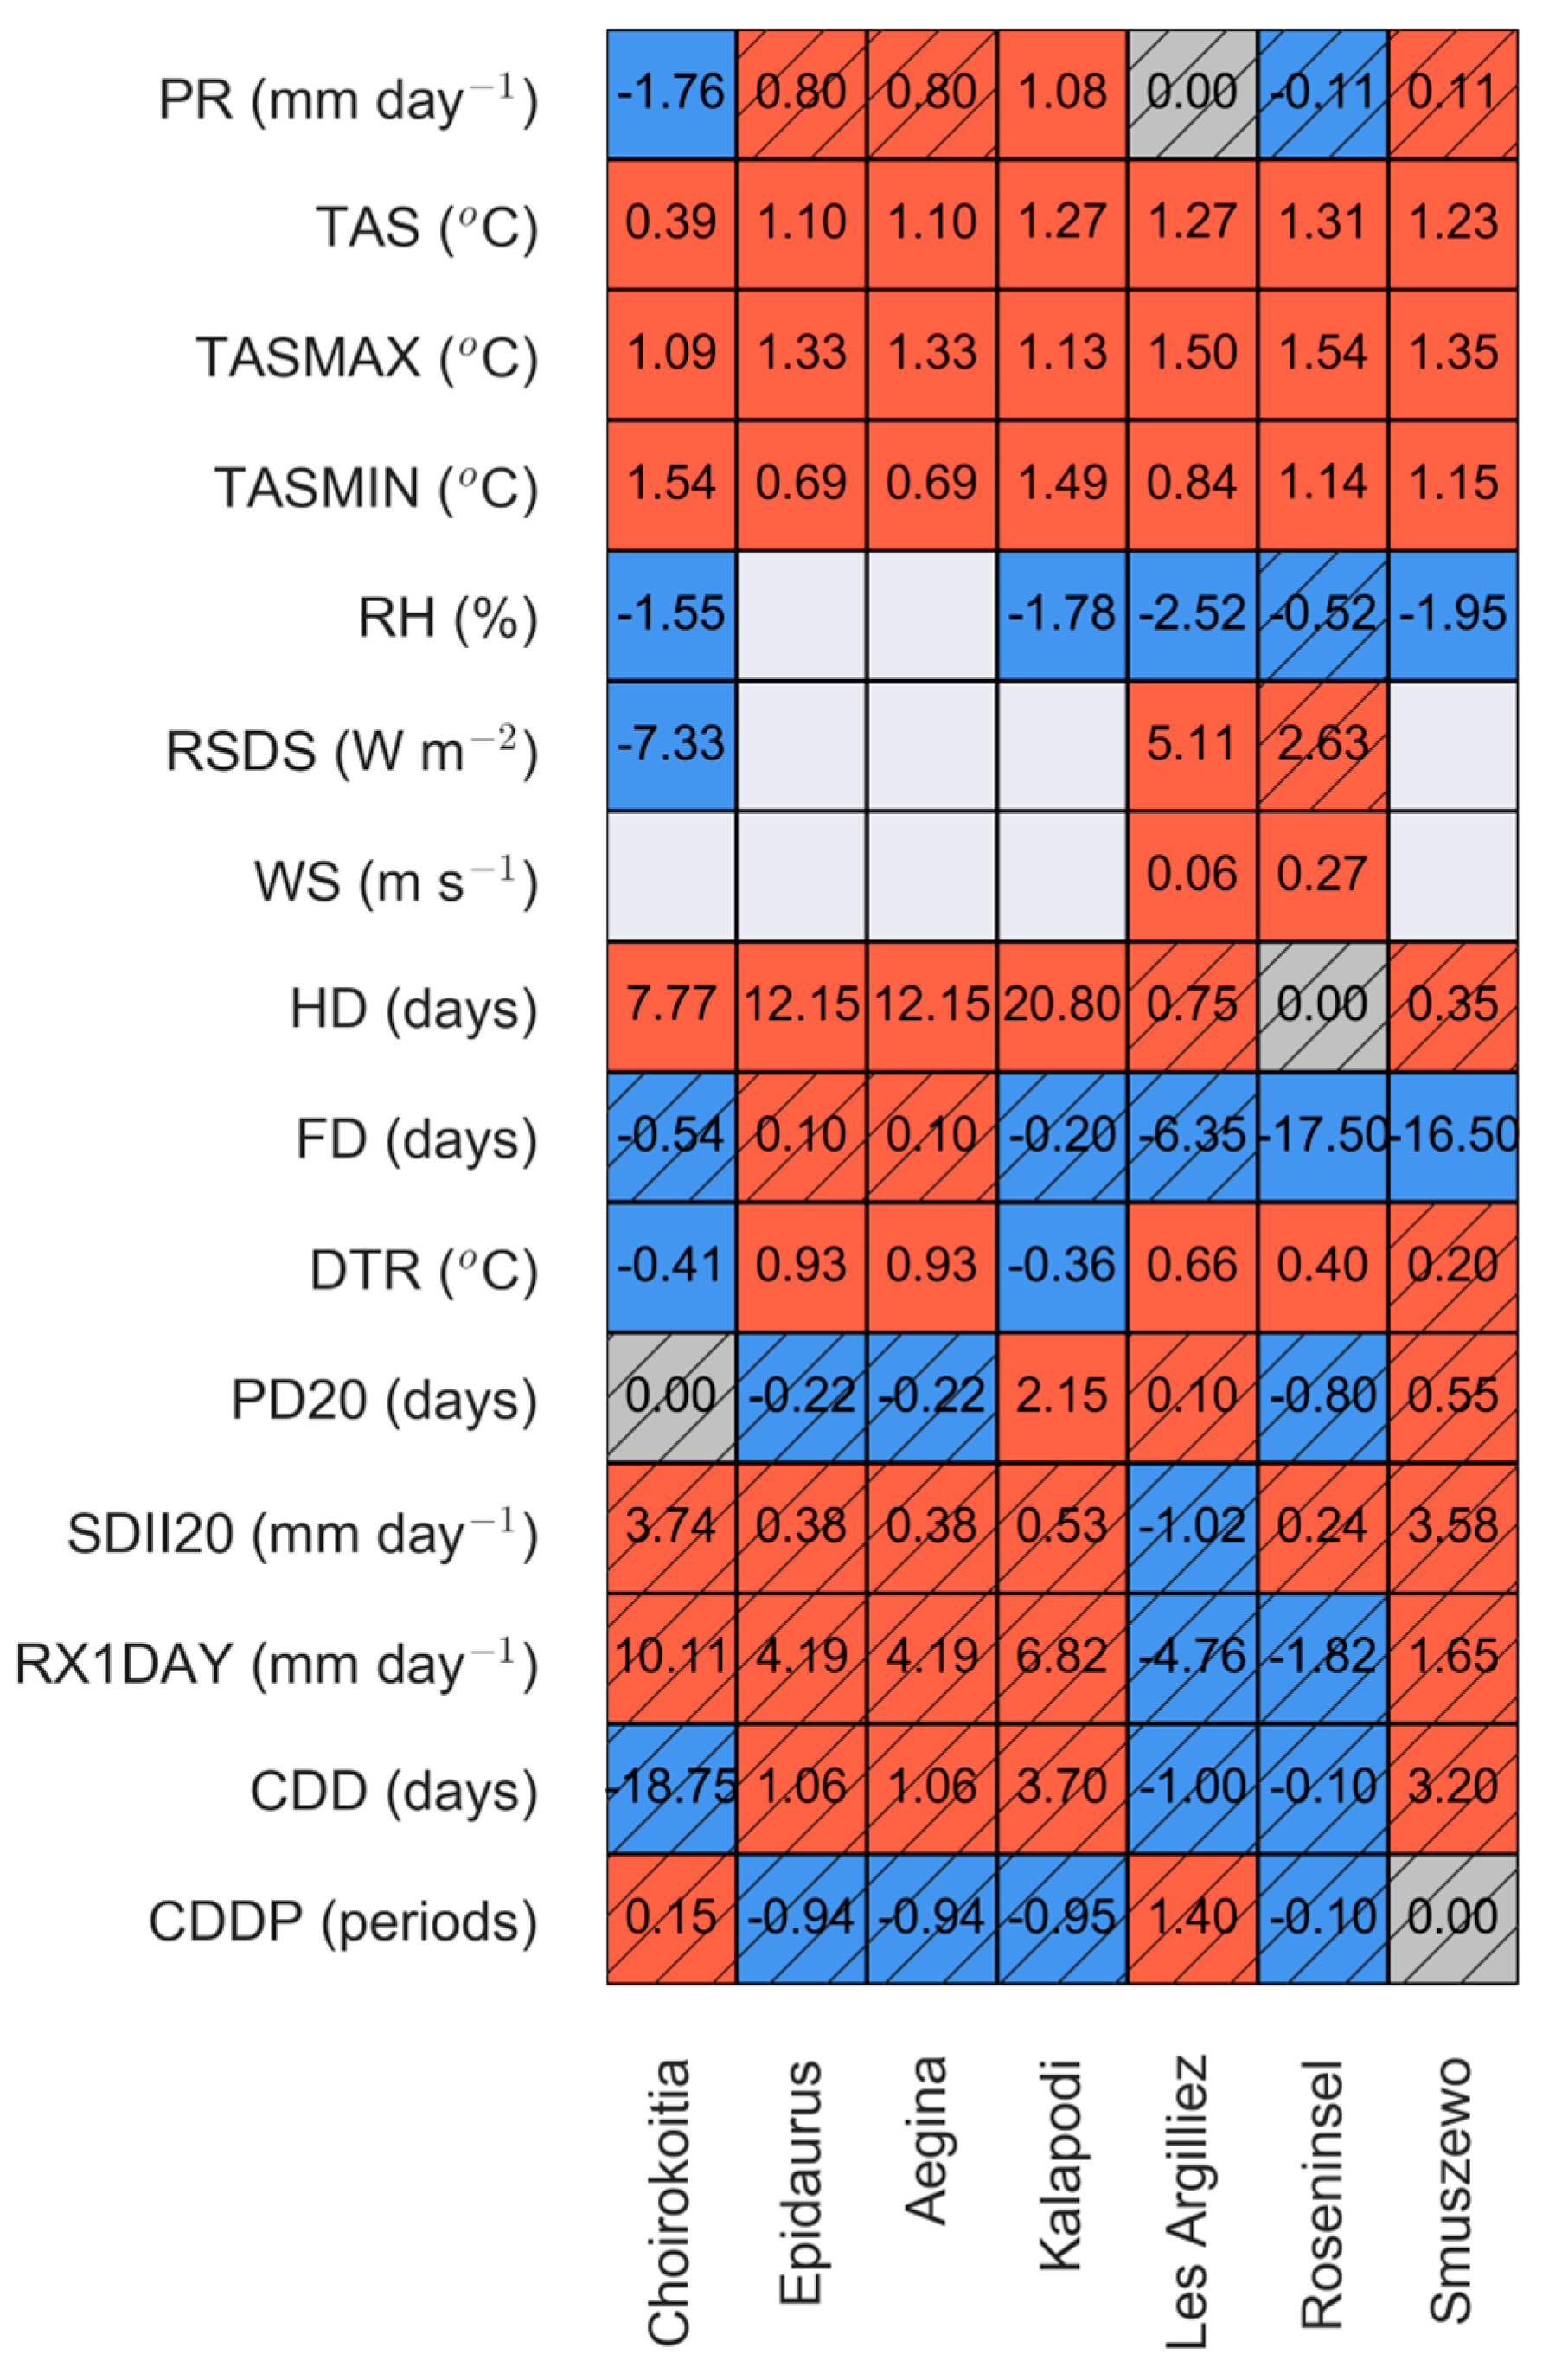
Recent Past and Future Climate Change at Pilot CH Sites
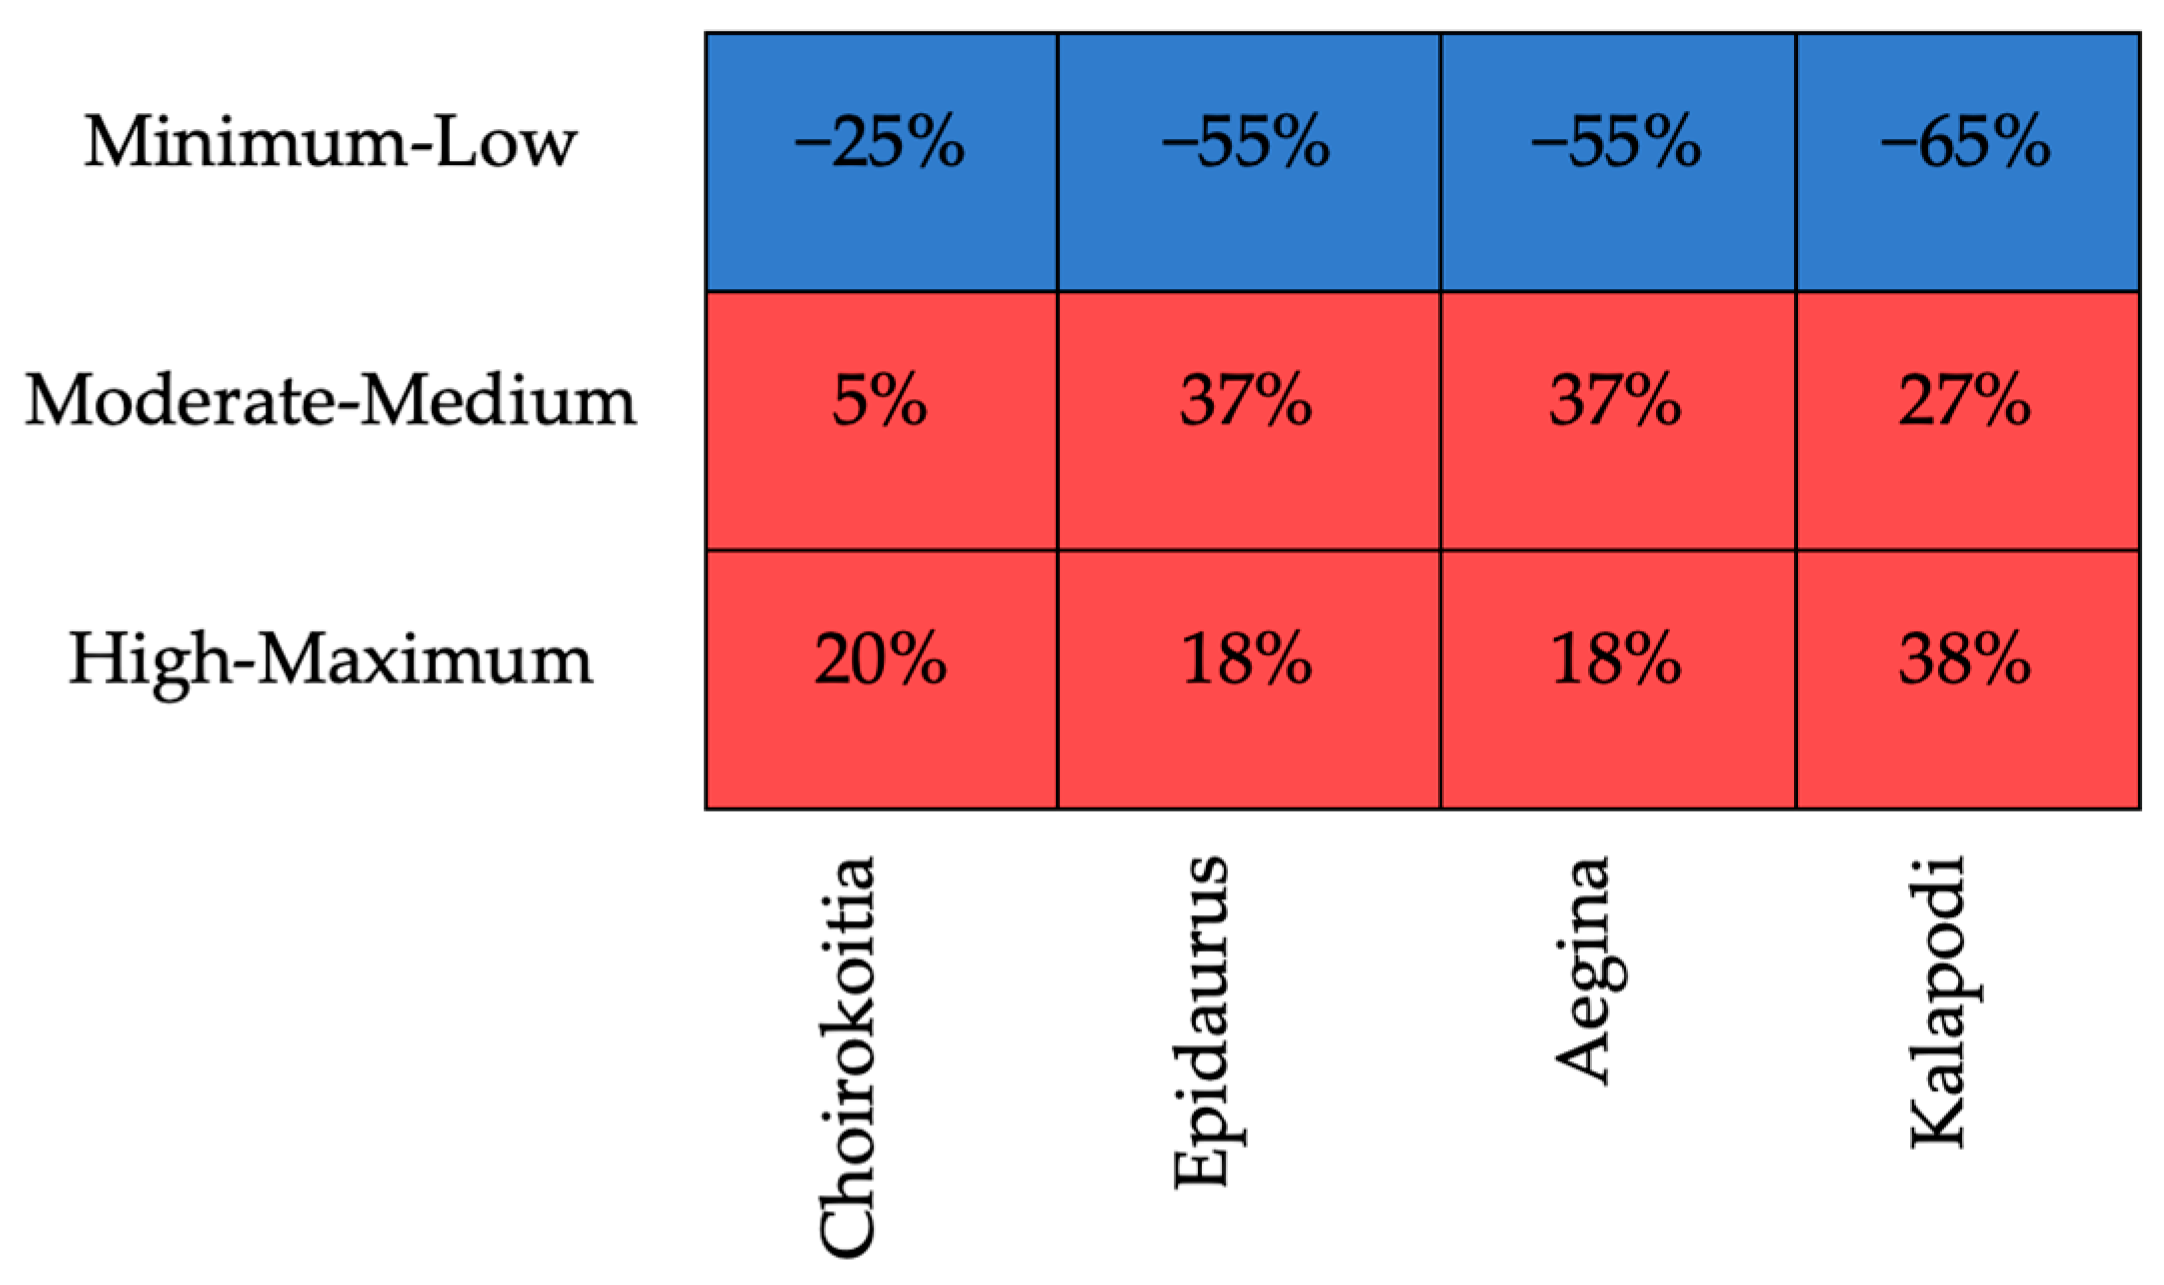
Towards Risk Identification Due to Climate Change at Pilot CH Sites
Sea Level Rise Effects on Coastal CH Assets
3.2.2. Extreme Water Hazards
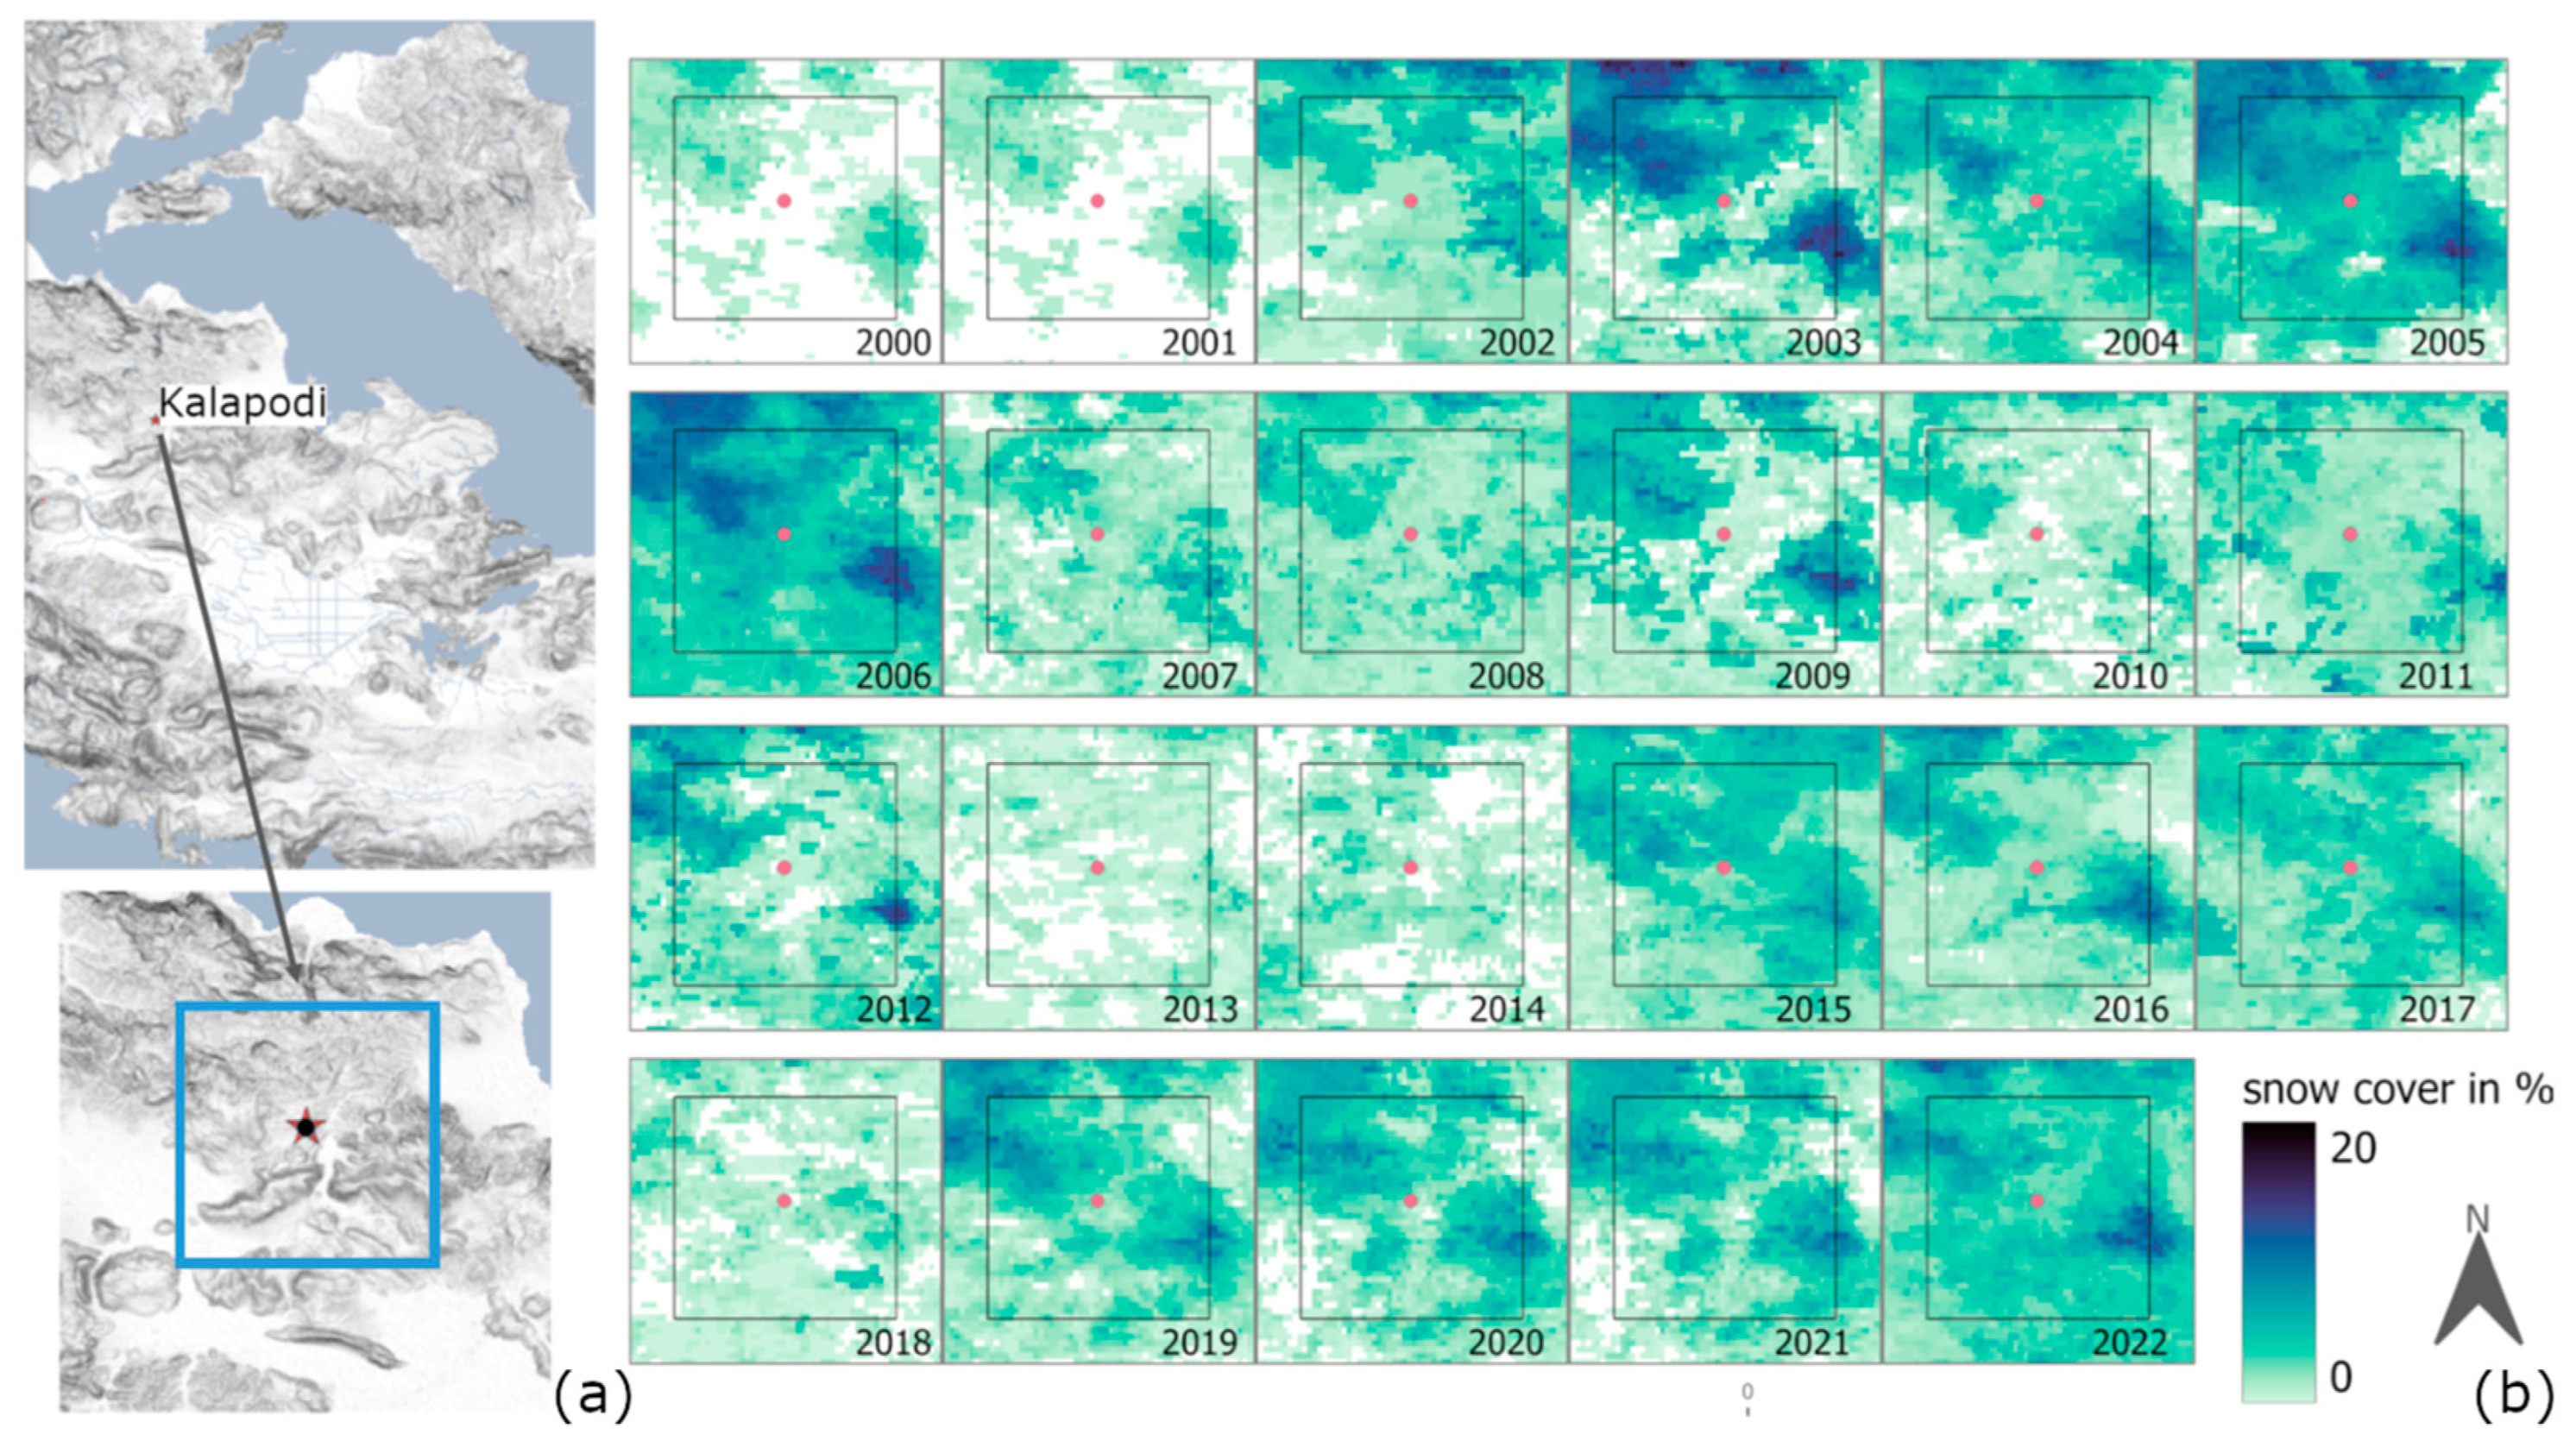
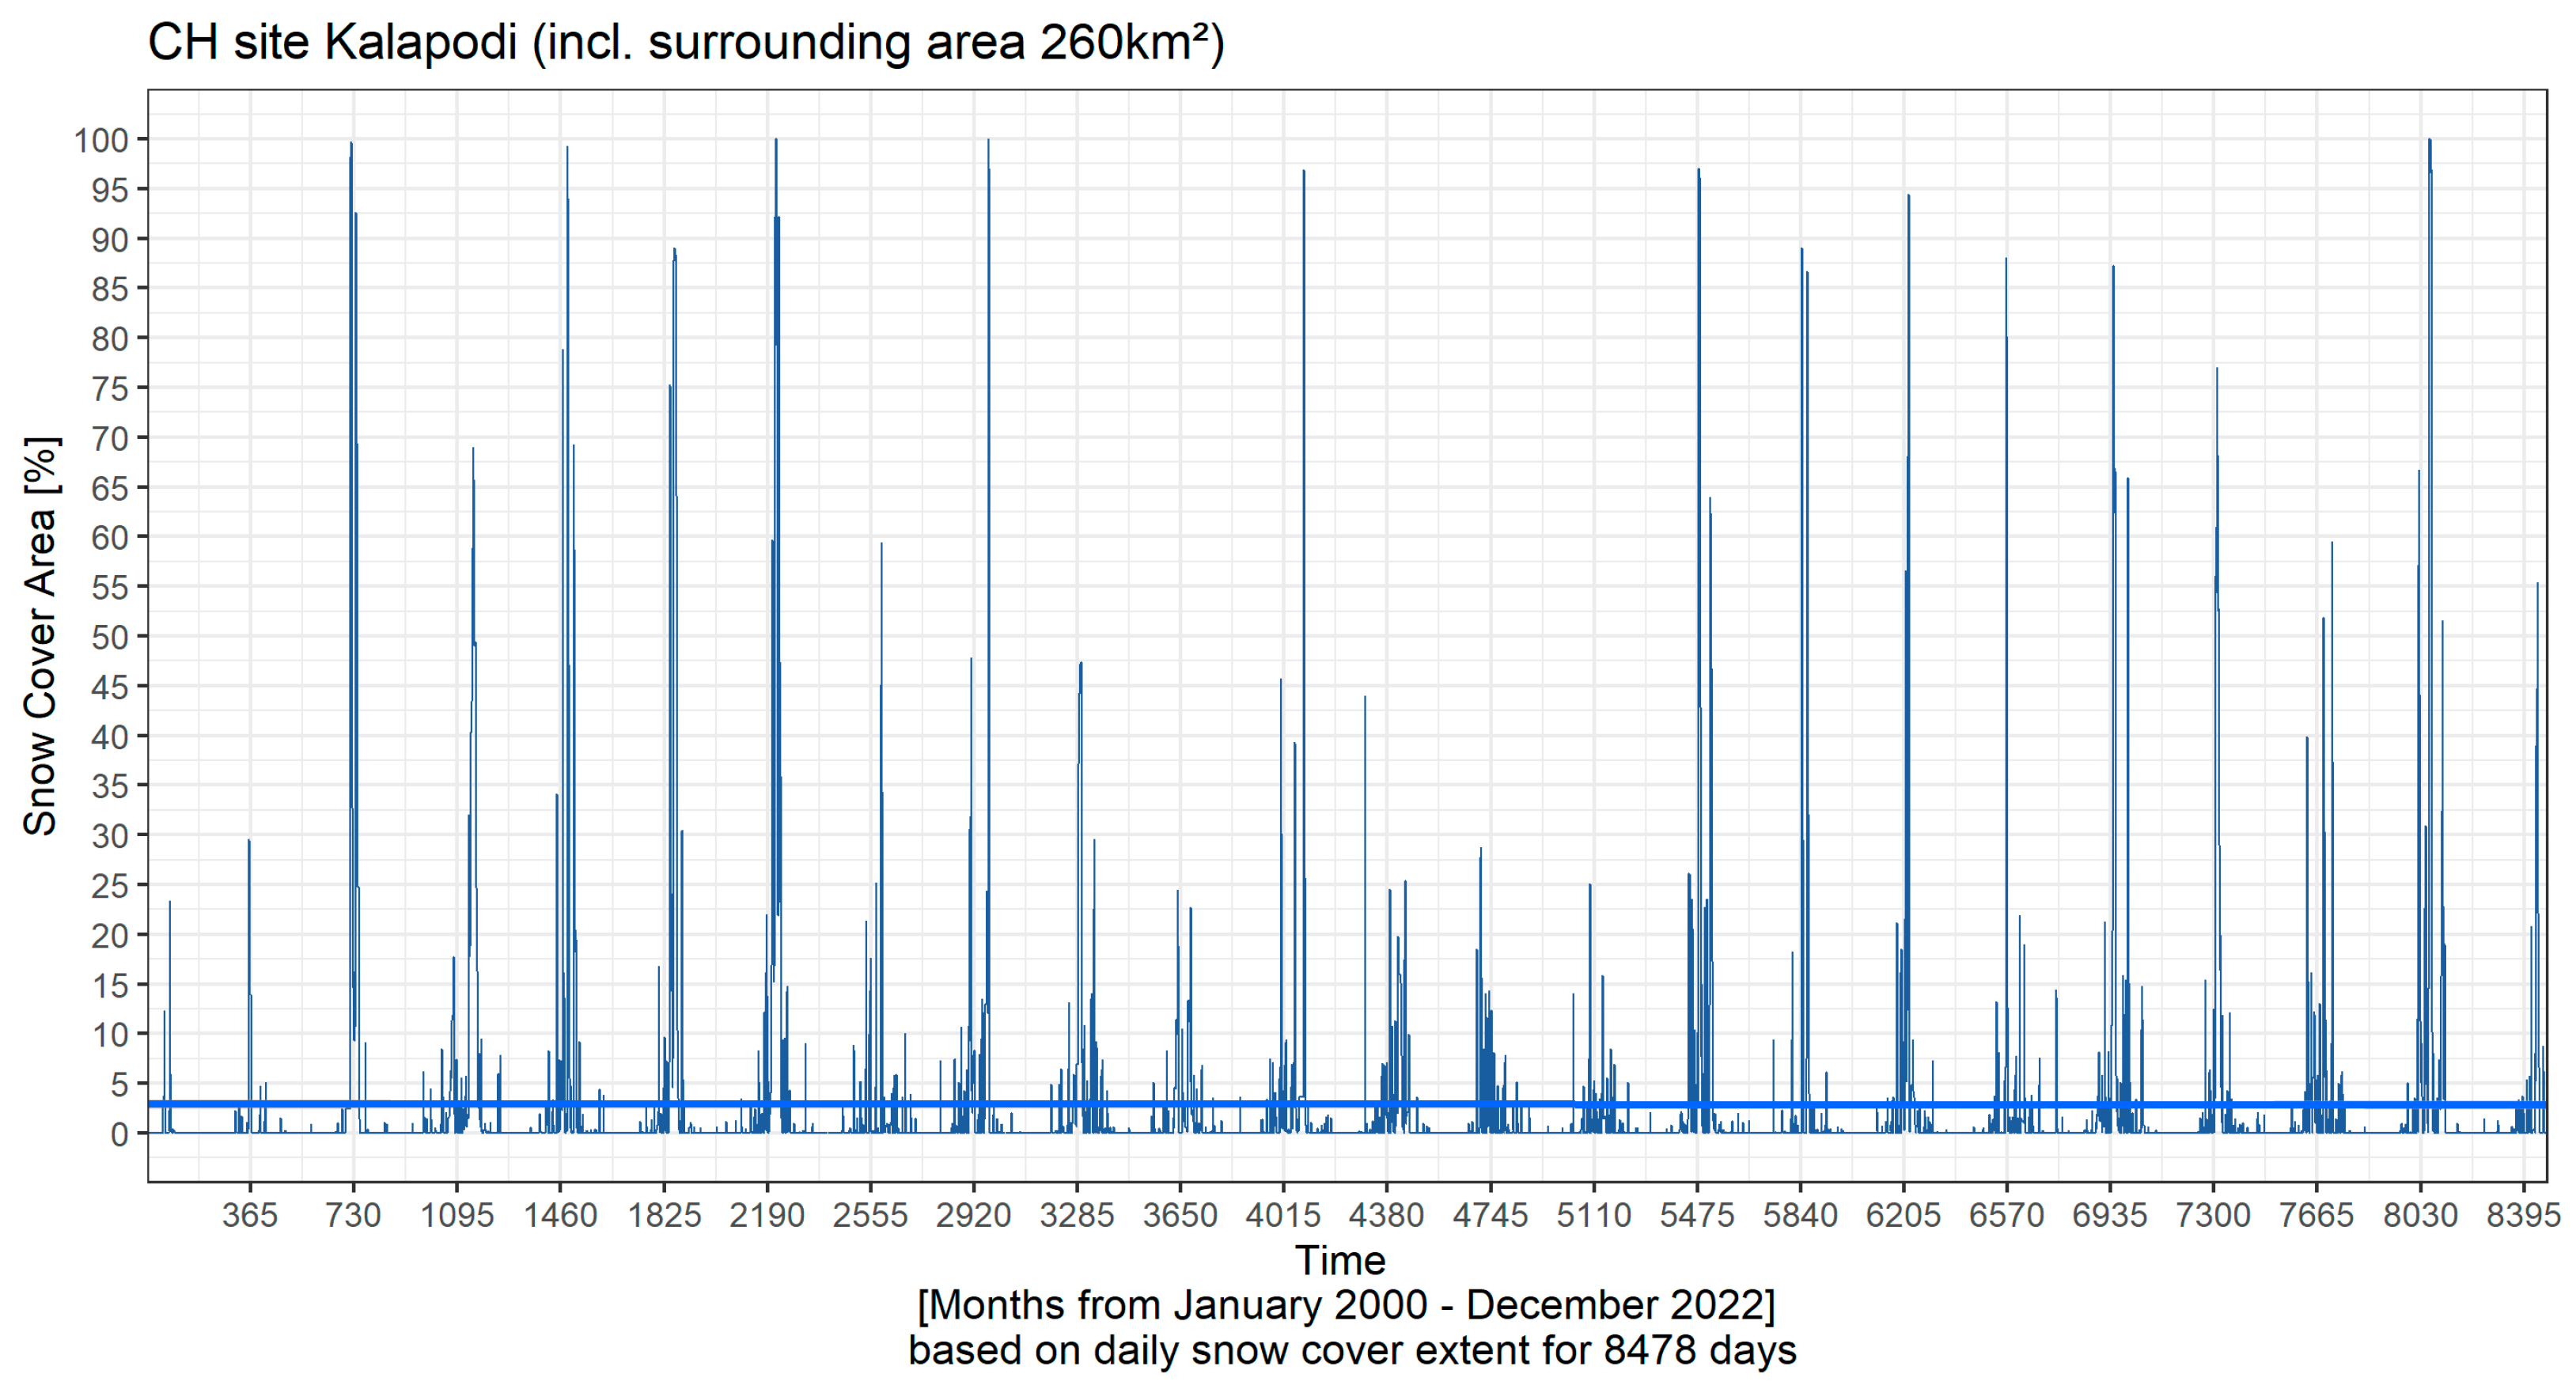
3.2.3. Snow and Ice Hazards
3.2.4. Geological and Geophysical Hazards
3.2.5. Chemical and Biological Hazards
3.3. Novel Sensors and Coatings
3.3.1. Flash LiDAR
3.3.2. Oxygen Sensor
3.3.3. Protective Nano-Coatings
- Igneous Stone: Granite, originating from igneous rocks formed slowly beneath the earth’s surface, is known for its hardness and density. Some variations, like marble, exhibit veining.
- Sedimentary Stone: Sandstone and limestone fall into this category, formed through the compaction of grains or fragments of existing rock material.
- Metamorphic Stone: Marble and slate, examples of metamorphic stones, are created under extremely high pressures and temperatures below the melting point.
- Silicates: Stones primarily composed of quartz-like silica particles, such as granite, sandstone, slate, and quartzite, are hard, durable, and generally resistant to acids.
- Calcium Carbonates: Stones like limestone, marble, and travertine, characterized by softer properties, are less durable than silicates and sensitive to acids.
4. Discussion
- advanced understanding of threats in a global and climate change context, enabling novel solutions to protect CH on land and aquatic ecosystems, further enhancing CH site management through better protection, restoration, and promotion of CH;
- promoting intercultural cooperation while engaging citizens and educating young people, continuous engagement with society and economic sectors, as well as better protection, restoration, and promotion of CH;
- enhancing the full potential of the CH and creative sectors as a driver of sustainable innovation;
- enhancing the EU industrial value chains, within the EU and Associated Countries and across borders; and
- innovative monitoring, safeguarding and transmitting CH, fostering the CCIs, and promoting cultural diversity.
Author Contributions
Funding
Data Availability Statement
Acknowledgments
Conflicts of Interest
References
- Sesana, E.; Gagnon, A.S.; Ciantelli, C.; Cassar, J.; Hughes, J.J. Climate Change Impacts on Cultural Heritage: A Literature Review. WIREs Clim. Chang. 2021, 12, e710. [Google Scholar] [CrossRef]
- Kapsomenakis, J.; Douvis, C.; Poupkou, A.; Zerefos, S.; Solomos, S.; Stavraka, T.; Melis, N.S.; Kyriakidis, E.; Kremlis, G.; Zerefos, C. Climate Change Threats to Cultural and Natural Heritage UNESCO Sites in the Mediterranean. Environ. Dev. Sustain. 2022, 25, 14519–14544. [Google Scholar] [CrossRef]
- UNESCO World Heritage Centre. Policy Document on the Impacts of Climate Change on World Heritage Properties; UNESCO: London, UK, 2008. [Google Scholar]
- Tringa, E.; Tolika, K. Analysis of the Outdoor Microclimate and the Effects on Greek Cultural Heritage Using the Heritage Microclimate Risk (HMR) and Predicted Risk of Damage (PRD) Indices: Present and Future Simulations. Atmosphere 2023, 14, 663. [Google Scholar] [CrossRef]
- Fatorić, S.; Seekamp, E. Evaluating a decision analytic approach to climate change adaptation of cultural resources along the Atlantic Coast of the United States. Land Use Policy 2017, 68, 254–263. [Google Scholar] [CrossRef]
- Orr, S.A.; Richards, J.; Fatorić, S. Climate Change and Cultural Heritage: A Systematic Literature Review (2016–2020). Hist. Environ. Policy Pract. 2021, 12, 434–477. [Google Scholar] [CrossRef]
- Sarris, A.; Katiri, M.; De Benedictis, E.; Vallianatou, E.; Klinkenberg, V.; Polidorou, M. In Pursuit of Understanding Vulnerability: Assessing Cultural Heritage Risks from Climate Change and Natural Hazards. Are we Following the Right Path? In Proceedings of the International Conference on Cultural Heritage and New Technologies (CHNT-ICOMOS AUSTRIA 2023): Cultural Heritage as a Resource, Vienna, Austria, 15–17 November 2023. [Google Scholar]
- TRIQUETRA Project: Toolbox for Assessing and Mitigating Climate Change Risks and Natural Hazards Threatening Cultural Heritage. Available online: https://triquetra-project.eu/ (accessed on 21 December 2023).
- UNFCCC. Paris Agreement. In Proceedings of the Report of the Conference of the Parties to the United Nations Framework Convention on Climate Change (21st Session), Paris, France, 30 November–13 December 2015; UNFCCC: Paris, France, 2015; Volume 4, p. 2017. [Google Scholar]
- Aqdus, S.A.; Hanson, W.S.; Drummond, J. The Potential of Hyperspectral and Multi-Spectral Imagery to Enhance Archaeological Cropmark Detection: A Comparative Study. J. Archaeol. Sci. 2012, 39, 1915–1924. [Google Scholar] [CrossRef]
- Chen, F.; Lasaponara, R.; Masini, N. An Overview of Satellite Synthetic Aperture Radar Remote Sensing in Archaeology: From Site Detection to Monitoring. J. Cult. Herit. 2017, 23, 5–11. [Google Scholar] [CrossRef]
- Evans, D. Airborne laser scanning as a method for exploring long-term socio-ecological dynamics in Cambodia. J. Archaeol. Sci. 2016, 74, 164–175. [Google Scholar] [CrossRef]
- Cerra, D.; Plank, S.; Lysandrou, V.; Tian, J. Cultural Heritage Sites in Danger—Towards Automatic Damage Detection from Space. Remote Sens. 2016, 8, 781. [Google Scholar] [CrossRef]
- Tapete, D.; Cigna, F. Detection of Archaeological Looting from Space: Methods, Achievements and Challenges. Remote Sens. 2019, 11, 2389. [Google Scholar] [CrossRef]
- Osmanoğlu, B.; Sunar, F.; Wdowinski, S.; Cabral-Cano, E. Time Series Analysis of InSAR Data: Methods and Trends. ISPRS J. Photogramm. Remote Sens. 2016, 115, 90–102. [Google Scholar] [CrossRef]
- Verykokou, S.; Ioannidis, C. An Overview on Image-Based and Scanner-Based 3D Modeling Technologies. Sensors 2023, 23, 596. [Google Scholar] [CrossRef]
- Sonnenburg, E.P.; Boyce, J.I. Data-fused digital bathymetry and side-scan sonar as a base for archaeological inventory of submerged landscapes in the Rideau Canal, Ontario, Canada. Geoarchaeology 2018, 23, 654–674. [Google Scholar] [CrossRef]
- Phiri, D.; Simwanda, M.; Salekin, S.; Nyirenda, V.; Murayama, Y.; Ranagalage, M. Sentinel-2 Data for Land Cover/Use Mapping: A Review. Remote Sens. 2020, 12, 2291. [Google Scholar] [CrossRef]
- Justice, C.O.; Townshend, J.R.G.; Vermote, E.F.; Masuoka, E.; Wolfe, R.E.; Saleous, N.; Roy, D.P.; Morisette, J.T. An Overview of MODIS Land Data Processing and Product Status. Remote Sens. Environ. 2002, 83, 3–15. [Google Scholar] [CrossRef]
- Guanter, L.; Kaufmann, H.; Segl, K.; Foerster, S.; Rogass, C.; Chabrillat, S.; Kuester, T.; Hollstein, A.; Rossner, G.; Chlebek, C.; et al. The EnMAP Spaceborne Imaging Spectroscopy Mission for Earth Observation. Remote Sens. 2015, 7, 8830–8857. [Google Scholar] [CrossRef]
- Krutz, D.; Müller, R.; Knodt, U.; Günther, B.; Walter, I.; Sebastian, I.; Säuberlich, T.; Reulke, R.; Carmona, E.; Eckardt, A.; et al. The Instrument Design of the DLR Earth Sensing Imaging Spectrometer (DESIS). Sensors 2019, 19, 1622. [Google Scholar] [CrossRef] [PubMed]
- Musa, Z.N.; Popescu, I.; Mynett, A. A review of applications of satellite SAR, optical, altimetry and DEM data for surface water modelling, mapping and parameter estimation. Hydrol. Earth Syst. Sci. 2015, 19, 3755–3769. [Google Scholar] [CrossRef]
- Georgoulias, A.K.; Akritidis, D.; Kalisoras, A.; Kapsomenakis, J.; Melas, D.; Zerefos, C.S.; Zanis, P. Climate Change Projections for Greece in the 21st Century from High-Resolution EURO-CORDEX RCM Simulations. Atmos. Res. 2022, 271, 106049. [Google Scholar] [CrossRef]
- Jacob, D.; Petersen, J.; Eggert, B.; Alias, A.; Christensen, O.B.; Bouwer, L.M.; Braun, A.; Colette, A.; Déqué, M.; Georgievski, G.; et al. EURO-CORDEX: New High-Resolution Climate Change Projections for European Impact Research. Reg. Environ. Chang. 2014, 14, 563–578. [Google Scholar] [CrossRef]
- Fabbri, K.; Bonora, A. Two New Indices for Preventive Conservation of the Cultural Heritage: Predicted Risk of Damage and Heritage Microclimate Risk. J. Cult. Herit. 2021, 47, 208–217. [Google Scholar] [CrossRef]
- Fatorić, S.; Seekamp, E. Are Cultural Heritage and Resources Threatened by Climate Change? A Systematic Literature Review. Clim. Chang. 2017, 142, 227–254. [Google Scholar] [CrossRef]
- Camuffo, D. Microclimate for Cultural Heritage: Measurement, Risk Assessment, Conservation, Restoration, and Maintenance of Indoor and Outdoor Monuments, 3rd ed.; Elsevier: Amsterdam, The Netherlands; Cambridge, MA, USA, 2019; ISBN 978-0-444-64106-9. [Google Scholar]
- Carson, M.; Köhl, A.; Stammer, D.; Slangen, A.B.A.; Katsman, C.A.; Van de Wal, R.S.W.; Church, J.; White, N. Coastal sea level changes, observed and projected during the 20th and 21st century. Clim. Chang. 2016, 134, 269–281. [Google Scholar] [CrossRef]
- Kopp, R.E.; Horton, R.M.; Little, C.M.; Mitrovica, J.X.; Oppenheimer, M.; Rasmus-sen, D.J.; Strauss, B.H.; Tebaldi, C. Probabilistic 21st and 22nd century sea-level projections at a global network of tide-gauge sites. Earth’s Future 2014, 2, 383–406. [Google Scholar] [CrossRef]
- Jordà, G. Detection Time for Global and Regional Sea Level Trends and Accelerations. JGR Ocean 2014, 119, 7164–7174. [Google Scholar] [CrossRef]
- Vermeer, M.; Rahmstorf, S. Global Sea Level Linked to Global Temperature. Proc. Natl. Acad. Sci. USA 2009, 106, 21527–21532. [Google Scholar] [CrossRef]
- NASA JPL. NASADEM Merged DEM Global 1 arc Second V001; Distributed by OpenTopography; NASA JPL: Pasadena, CA, USA, 2021. [CrossRef]
- Intergovernmental Panel on Climate Change (IPCC). Climate Change 2022—Impacts, Adaptation and Vulnerability: Working Group II Contribution to the Sixth Assessment Report of the Intergovernmental Panel on Climate Change, 1st ed.; Cambridge University Press: Cambridge, UK, 2023; ISBN 9781009325844. [Google Scholar]
- Istituto Superiore per la Protezione e la Ricerca Ambientale. Available online: https://www.mareografico.it/en/stations.html (accessed on 20 December 2023).
- Istrati, D.; Hasanpour, A. Numerical Investigation of Dam Break-Induced Extreme Flooding of Bridge Superstructures. In Proceedings of the 3rd International Conference on Natural Hazards & Infrastructure, Athens, Greece, 5–7 July 2022. EID: 2-s2.0-85137599395 ISSN: 26234513. [Google Scholar]
- Hasanpour, A.; Istrati, D.; Buckle, I.G. Three-Dimensional Numerical Investigation of Floating Debris Effects on Bridge Superstructures during Tsunamis. Ocean Eng. 2023, 289, 116262. [Google Scholar] [CrossRef]
- Dietz, A.J.; Kuenzer, C.; Gessner, U.; Dech, S. Remote Sensing of Snow—A Review of Available Methods. Int. J. Remote Sens. 2012, 33, 4094–4134. [Google Scholar] [CrossRef]
- Uereyen, S.; Bachofer, F.; Klein, I.; Kuenzer, C. Multi-Faceted Analyses of Seasonal Trends and Drivers of Land Surface Variables in Indo-Gangetic River Basins. Sci. Total Environ. 2022, 847, 157515. [Google Scholar] [CrossRef]
- Gelbrich, J.; Mai, C.; Militz, H. Chemical changes in wood degraded by bacteria. Int. Biodeterior. Biodegrad. 2008, 61, 24–32. [Google Scholar] [CrossRef]
- Burdige, D.J. Preservation of organic matter in marine sediments: Controls, mechanisms, and an imbalance in sediment organic carbon budgets? Chem. Rev. 2007, 107, 467–485. [Google Scholar] [CrossRef]
- Kelts, K.; Hsü, K.J. Freshwater Carbonate Sedimentation. In Lakes; Lerman, A., Ed.; Springer: New York, NY, USA, 1978; pp. 295–323. [Google Scholar]
- Thomas, A.; Ramkumar, A.; Shanmugam, A. CO2 acidification and its differential responses on aquatic biota—A review. Environ. Adv. 2022, 8, 100219. [Google Scholar] [CrossRef]
- Valiela, I. Nutrient Cycles in Ecosystems. In Marine Ecological Processes; Springer: New York, NY, USA, 2015; pp. 529–576. [Google Scholar]
- Scolan, E.; Wenger, B.; Pugin, R. Optical Sensor for Detecting a Chemical Species. US10656091B2, 20 December 2016. [Google Scholar]
- Scolan, E.; Wenger, B.; Pugin, R. Optical Sensing Film for Detecting a Chemical Species, Sensor System Comprising the Same and Method of Producing the Same. EP3184994B1, 21 December 2015. [Google Scholar]
- Bonazza, A.; Sardella, A. Climate Change and Cultural Heritage: Methods and Approaches for Damage and Risk Assessment Addressed to a Practical Application. Heritage 2023, 6, 3578–3589. [Google Scholar] [CrossRef]
- Artesani, A.; Di Turo, F.; Zucchelli, M.; Traviglia, A. Recent Advances in Protective Coatings for Cultural Heritage—An Overview. Coatings 2020, 10, 217. [Google Scholar] [CrossRef]
- Sabatini, V.; Pargoletti, E.; Comite, V.; Ortenzi, M.A.; Fermo, P.; Gulotta, D.; Cappelletti, G. Towards Novel Fluorinated Methacrylic Coatings for Cultural Heritage: A Combined Polymers and Surfaces Chemistry Study. Polymers 2019, 11, 1190. [Google Scholar] [CrossRef]
- Baglioni, M.; Poggi, G.; Chelazzi, D.; Baglioni, P. Advanced Materials in Cultural Heritage Conservation. Molecules 2021, 26, 3967. [Google Scholar] [CrossRef]
- Munafò, P.; Goffredo, G.B.; Quagliarini, E. TiO2-based nanocoatings for preserving architectural stone surfaces: An overview. Constr. Build. Mater. 2015, 84, 201–218. [Google Scholar] [CrossRef]
- Sierra-Fernandez, A.; De La Rosa-García, S.C.; Gomez-Villalba, L.S.; Gómez-Cornelio, S.; Rabanal, M.E.; Fort, R.; Quintana, P. Synthesis, Photocatalytic, and Antifungal Properties of MgO, ZnO and Zn/Mg Oxide Nanoparticles for the Protection of Calcareous Stone Heritage. ACS Appl. Mater. Interfaces 2017, 9, 24873–24886. [Google Scholar] [CrossRef] [PubMed]
- Gómez-Ortíz, N.; De La Rosa-García, S.; González-Gómez, W.; Soria-Castro, M.; Quintana, P.; Oskam, G.; Ortega-Morales, B. Antifungal Coatings Based on Ca(OH)2 Mixed with ZnO/TiO2 Nanomaterials for Protection of Limestone Monuments. ACS Appl. Mater. Interfaces 2013, 5, 1556–1565. [Google Scholar] [CrossRef] [PubMed]
- Kapetanaki, K.; Vazgiouraki, E.; Stefanakis, D.; Fotiou, A.; Anyfantis, G.C.; García-Lodeiro, I.; Blanco-Varela, M.T.; Arabatzis, I.; Maravelaki, P.N. TEOS Modified with Nano-Calcium Oxalate and PDMS to Protect Concrete Based Cultural Heritage Buildings. Front. Mater. 2020, 7, 16. [Google Scholar] [CrossRef]
- Crupi, V.; Fazio, B.; Gessini, A.; Kis, Z.; La Russa, M.F.; Majolino, D.; Masciovecchio, C.; Ricca, M.; Rossi, B.; Ruffolo, S.A.; et al. TiO2–SiO2–PDMS Nanocomposite Coating with Self-Cleaning Effect for Stone Material: Finding the Optimal Amount of TiO2. Constr. Build. Mater. 2018, 166, 464–471. [Google Scholar] [CrossRef]


Disclaimer/Publisher’s Note: The statements, opinions and data contained in all publications are solely those of the individual author(s) and contributor(s) and not of MDPI and/or the editor(s). MDPI and/or the editor(s) disclaim responsibility for any injury to people or property resulting from any ideas, methods, instructions or products referred to in the content. |
© 2024 by the authors. Licensee MDPI, Basel, Switzerland. This article is an open access article distributed under the terms and conditions of the Creative Commons Attribution (CC BY) license (https://creativecommons.org/licenses/by/4.0/).
Share and Cite
Ioannidis, C.; Verykokou, S.; Soile, S.; Istrati, D.; Spyrakos, C.; Sarris, A.; Akritidis, D.; Feidas, H.; Georgoulias, A.K.; Tringa, E.; et al. Safeguarding Our Heritage—The TRIQUETRA Project Approach. Heritage 2024, 7, 758-793. https://doi.org/10.3390/heritage7020037
Ioannidis C, Verykokou S, Soile S, Istrati D, Spyrakos C, Sarris A, Akritidis D, Feidas H, Georgoulias AK, Tringa E, et al. Safeguarding Our Heritage—The TRIQUETRA Project Approach. Heritage. 2024; 7(2):758-793. https://doi.org/10.3390/heritage7020037
Chicago/Turabian StyleIoannidis, Charalabos, Styliani Verykokou, Sofia Soile, Denis Istrati, Constantine Spyrakos, Apostolos Sarris, Dimitris Akritidis, Haralambos Feidas, Aristeidis K. Georgoulias, Efstathia Tringa, and et al. 2024. "Safeguarding Our Heritage—The TRIQUETRA Project Approach" Heritage 7, no. 2: 758-793. https://doi.org/10.3390/heritage7020037