Article

The Ceramic Production and Distribution Network in the Ancient Kingdom of Navarre (Spain) during the 12th–15th Centuries

by
Iván Ruiz-Ardanaz
1,2,*,
Sayoa Araiz-González
1,2,
Esther Lasheras
1,2 and
Adrián Durán
1,2,*
1
BIOMA Institute for Biodiversity and the Environment, University of Navarra, Irunlarrea 1, 31008 Pamplona, Spain
2
Chemistry Department, School of Science, University of Navarra, Irunlarrea 1, 31008 Pamplona, Spain
*
Authors to whom correspondence should be addressed.
Heritage 2024, 7(9), 4814-4828; https://doi.org/10.3390/heritage7090228
Submission received: 28 July 2024 / Revised: 30 August 2024 / Accepted: 2 September 2024 / Published: 4 September 2024

Abstract

:
The Kingdom of Navarre was a Christian kingdom located in the north of the Iberian Peninsula during the Middle Ages. Its location on the west of the isthmus between the Iberian Peninsula and the European continent allowed an exchange of cultural currents. The main pottery production centres were in Estella, Lumbier, Pamplona, Tafalla, and Tudela. Ceramic pastes from various mediaeval sites were analysed for both elemental and mineralogical composition determination. The results were evaluated using Principal Component Analysis and allowed us to identify each production centre. Each manufacturing centre showed a different and characteristic composition of raw materials. Ceramics from Tudela were Ca-, Mg-, Na-, and Sr-rich. Ceramics from Estella were richer in Al, K, and Ti. Ca, Sc, and Sr contents were higher in Tafalla ceramics. Lumbier ceramics stood out for being enriched in Si, Mn, Fe, and Zr. Pamplona ceramics showed intermediate values. The analysis of samples from other Navarrese locations allowed us to begin to define what the commercial ceramic network in the Kingdom of Navarre was like during the Middle Ages. Therefore, two aims were defined for this paper: to characterise the ceramic pastes for each of the producing centres and to know where the ceramics were exported to.

1. Introduction

1.1. Geographical and Historical Context

The kingdom of Navarre was a Christian kingdom located in the north of the Iberian Peninsula between 1162 and 1789. However, it was an independent kingdom only until 1512, when it was annexed to the Crown of Aragon, and later it was integrated into Spain [1]. Its location on the west of the isthmus between the Iberian Peninsula and the European continent, and also at the western margin of the Pyrenees (one of the two natural passes), allowed a remarkable exchange of cultural currents.
The Kingdom of Navarre was influenced by both the Al-Andalus Islamic culture from the south and the French–European culture from the north. From the point of view of glazed ceramic production technology, the Kingdom of Navarre inherited Al-Andalus Islamic technology [2]. Although Navarre was not a region with an important ceramic production industry, as Almería, Córdoba, Seville, Valencia or Zaragoza were, there were some production centres with long continuity. The main production centre was Tudela, in the south of the kingdom (Figure 1). The main cause of this development was that Tudela had remained under Islamic rule until 1119, when it was conquered by Alfonso I, “the Battler” [1]. By then, several ceramic production workshops had been established in the suburbs of the city, which followed the Al-Andalus Islamic ceramic techniques. These workshops were maintained after the conquest, since their artisans remained first as Mudejars and later converted [3,4,5].

1.2. Ceramic Production in Navarre

The other ceramic-producing centres were in the cities: Pamplona (the capital) in the centre–north, Estella to the west, Lumbier to the east, and Tafalla in the central south [2,6] (Figure 1). The influence of these centres was not as high as that of Tudela, but enough to remain until the middle of the 20th century.
Historical documentary sources only attested to the production of glazed ceramics during the Middle Ages in Tudela. There are numerous tributary documents that specify the names and locations of Mudejar artisans [7]. In the rest of the producing locations (Estella, Tafalla, Pamplona, and Lumbier) it was unknown when production began or where the workshops were located. According to the reports of Julio Altadill (Spanish historian, 1858–1935), the main production centres in 1842 were Pamplona, Estella, Tafalla, Tudela, and Lumbier [6].
In the absence of historical sources, the most obvious archaeological indicator of the presence of a ceramic producing workshop is the discovery of workshop facilities or a kiln itself. In Navarre, a little is known about two kilns, one Roman one in Ribaforada (1st century AD) (near Tudela) and another mediaeval one in Caparroso (near Tafalla) (11th and 13th centuries) [8,9]. However, the small size of its combustion and firing chambers makes it unlikely that production was more than local.
In addition to the discovery of the kiln itself, other archaeological indicators of the presence of a glazed ceramic workshop are pottery discards and pernettes remaining. Pernettes are ceramic tripods that serve to space out the vessels and prevent the glazes from sticking together. In Navarre, mediaeval pernettes have been found in Pamplona, Tafalla, and Tudela, confirming that there was production of glazed ceramics in those locations [3,4,5,10,11]. The earliest glazes manufactured in the Iberian Peninsula have been found in the south of Al-Andalus and dated to the 9th century. Two colours stood out in these first vessels: green and honey brown. From the 10th century, green and manganese pottery has been documented. All these glazes were manufactured by using silica with lead as the flux and tin as an opacifier [12]. In the 11th–12th century, lead-glazed earthenware ceramics were developed in Western Europe, mainly in France and the British Isles [13,14]. Tin-glazing was introduced in the peninsula through Muslim civilization during the 13th century and then passed to Italy, where the term majolica was first applied to this Hispano-Moresque lusterware [15].

1.3. Previous Studies

Mediaeval ceramics from Navarre began to be profusely studied between 1977 and 1987, when several studies were published on the ceramics found in the excavations of the Cathedral of Pamplona and the city of Tudela [2,3]. In 1988, a general study on unglazed ceramics from Navarre was published [11], although it was not followed up with another on glazed production. Since then, only isolated interventions have been published, in which mediaeval ceramics appeared but not overall studies. A study on the state of the art has recently been published [2]. However, all studies reduce the analysis of ceramics to stylistic comparisons or the colour of the pastes, with no chemical analysis [2].
Ethnological studies were also carried out on ceramic production at the beginning of the 20th century in Lumbier and Estella [16,17,18]. Thanks to the testimonies of the last artisans, these described what the manufacturing process was like and where they extracted the clays they used as raw materials. However, there have been no studies on these production centres in modern times.
For a more complete and precise study of archaeological ceramic materials, it was necessary to classify the materials based on quantitative data that would allow the identification of specific characteristics of the different production centres. The elemental and mineralogical composition of the pastes was directly related to the composition of the clay used as a raw material and was related to the surrounding geology [12,13,19,20,21]. In this way, it was possible to associate the composition of the pastes with the origin of the ceramic materials [13,20,21].

1.4. Geology and Clay Source Provenance

Generally, ceramic artisans used the raw materials available in the near environment. These raw materials, clays, have different elemental and mineralogical compositions depending on the local geology. In this way, the geological map of Navarre [22] has been accessed and clays that could have been used to produce ceramics were identified. On this geological map, Pamplona and Lumbier are in the pre-Pyrenean basins, where marls from the end of the marine Eocene abound. In the case of Lumbier, the clay (raw material) could also have been extracted from decalcification clay of the close Sierra de Leyre (Eocene limestone). In the case of Estella and Tafalla, the clays were found on continental sedimentary materials from the early Miocene. In the case of Estella, Triassic clays from Keuper could also have been used (due to the proximity of the Iguzquitza diapir). Finally, in the Tudela area, continental sedimentary materials from the mid-Miocene stood out. In all of them there were also quaternary alluvial terraces produced by the Arga, Irati, Cidacos, Ega, and Ebro rivers, respectively.
One method to determine the origin of ceramic raw materials is to compare the elemental and mineralogical compositions of the pastes with materials of known origin. In some cases, firing can modify the mineralogical composition of the clay, depending on factors such as temperature or type of atmosphere [23]. The elemental composition of the pastes is rarely modified, resulting in highly reliable data. In recent decades, the use of a statistical tool has been standardised: Principal Component Analysis [24,25,26,27]. This type of multivariate analysis allows us to identify which are the most characteristic elements of each group of samples and facilitates their classification.
This work studies the production centres of ceramics and their distribution networks from the 12th to the 15th century, which was the time of maximum splendour of the Kingdom of Navarre. The aim of the paper is twofold: to identify the characteristic composition of the ceramic pastes for each of the producing centres of the epoch (Tudela, Tafalla, Pamplona, Estella, and Lumbier), trying to differentiate among them, and to know the scope of the exports of the different producing centres within Navarre.

2. Materials and Methods
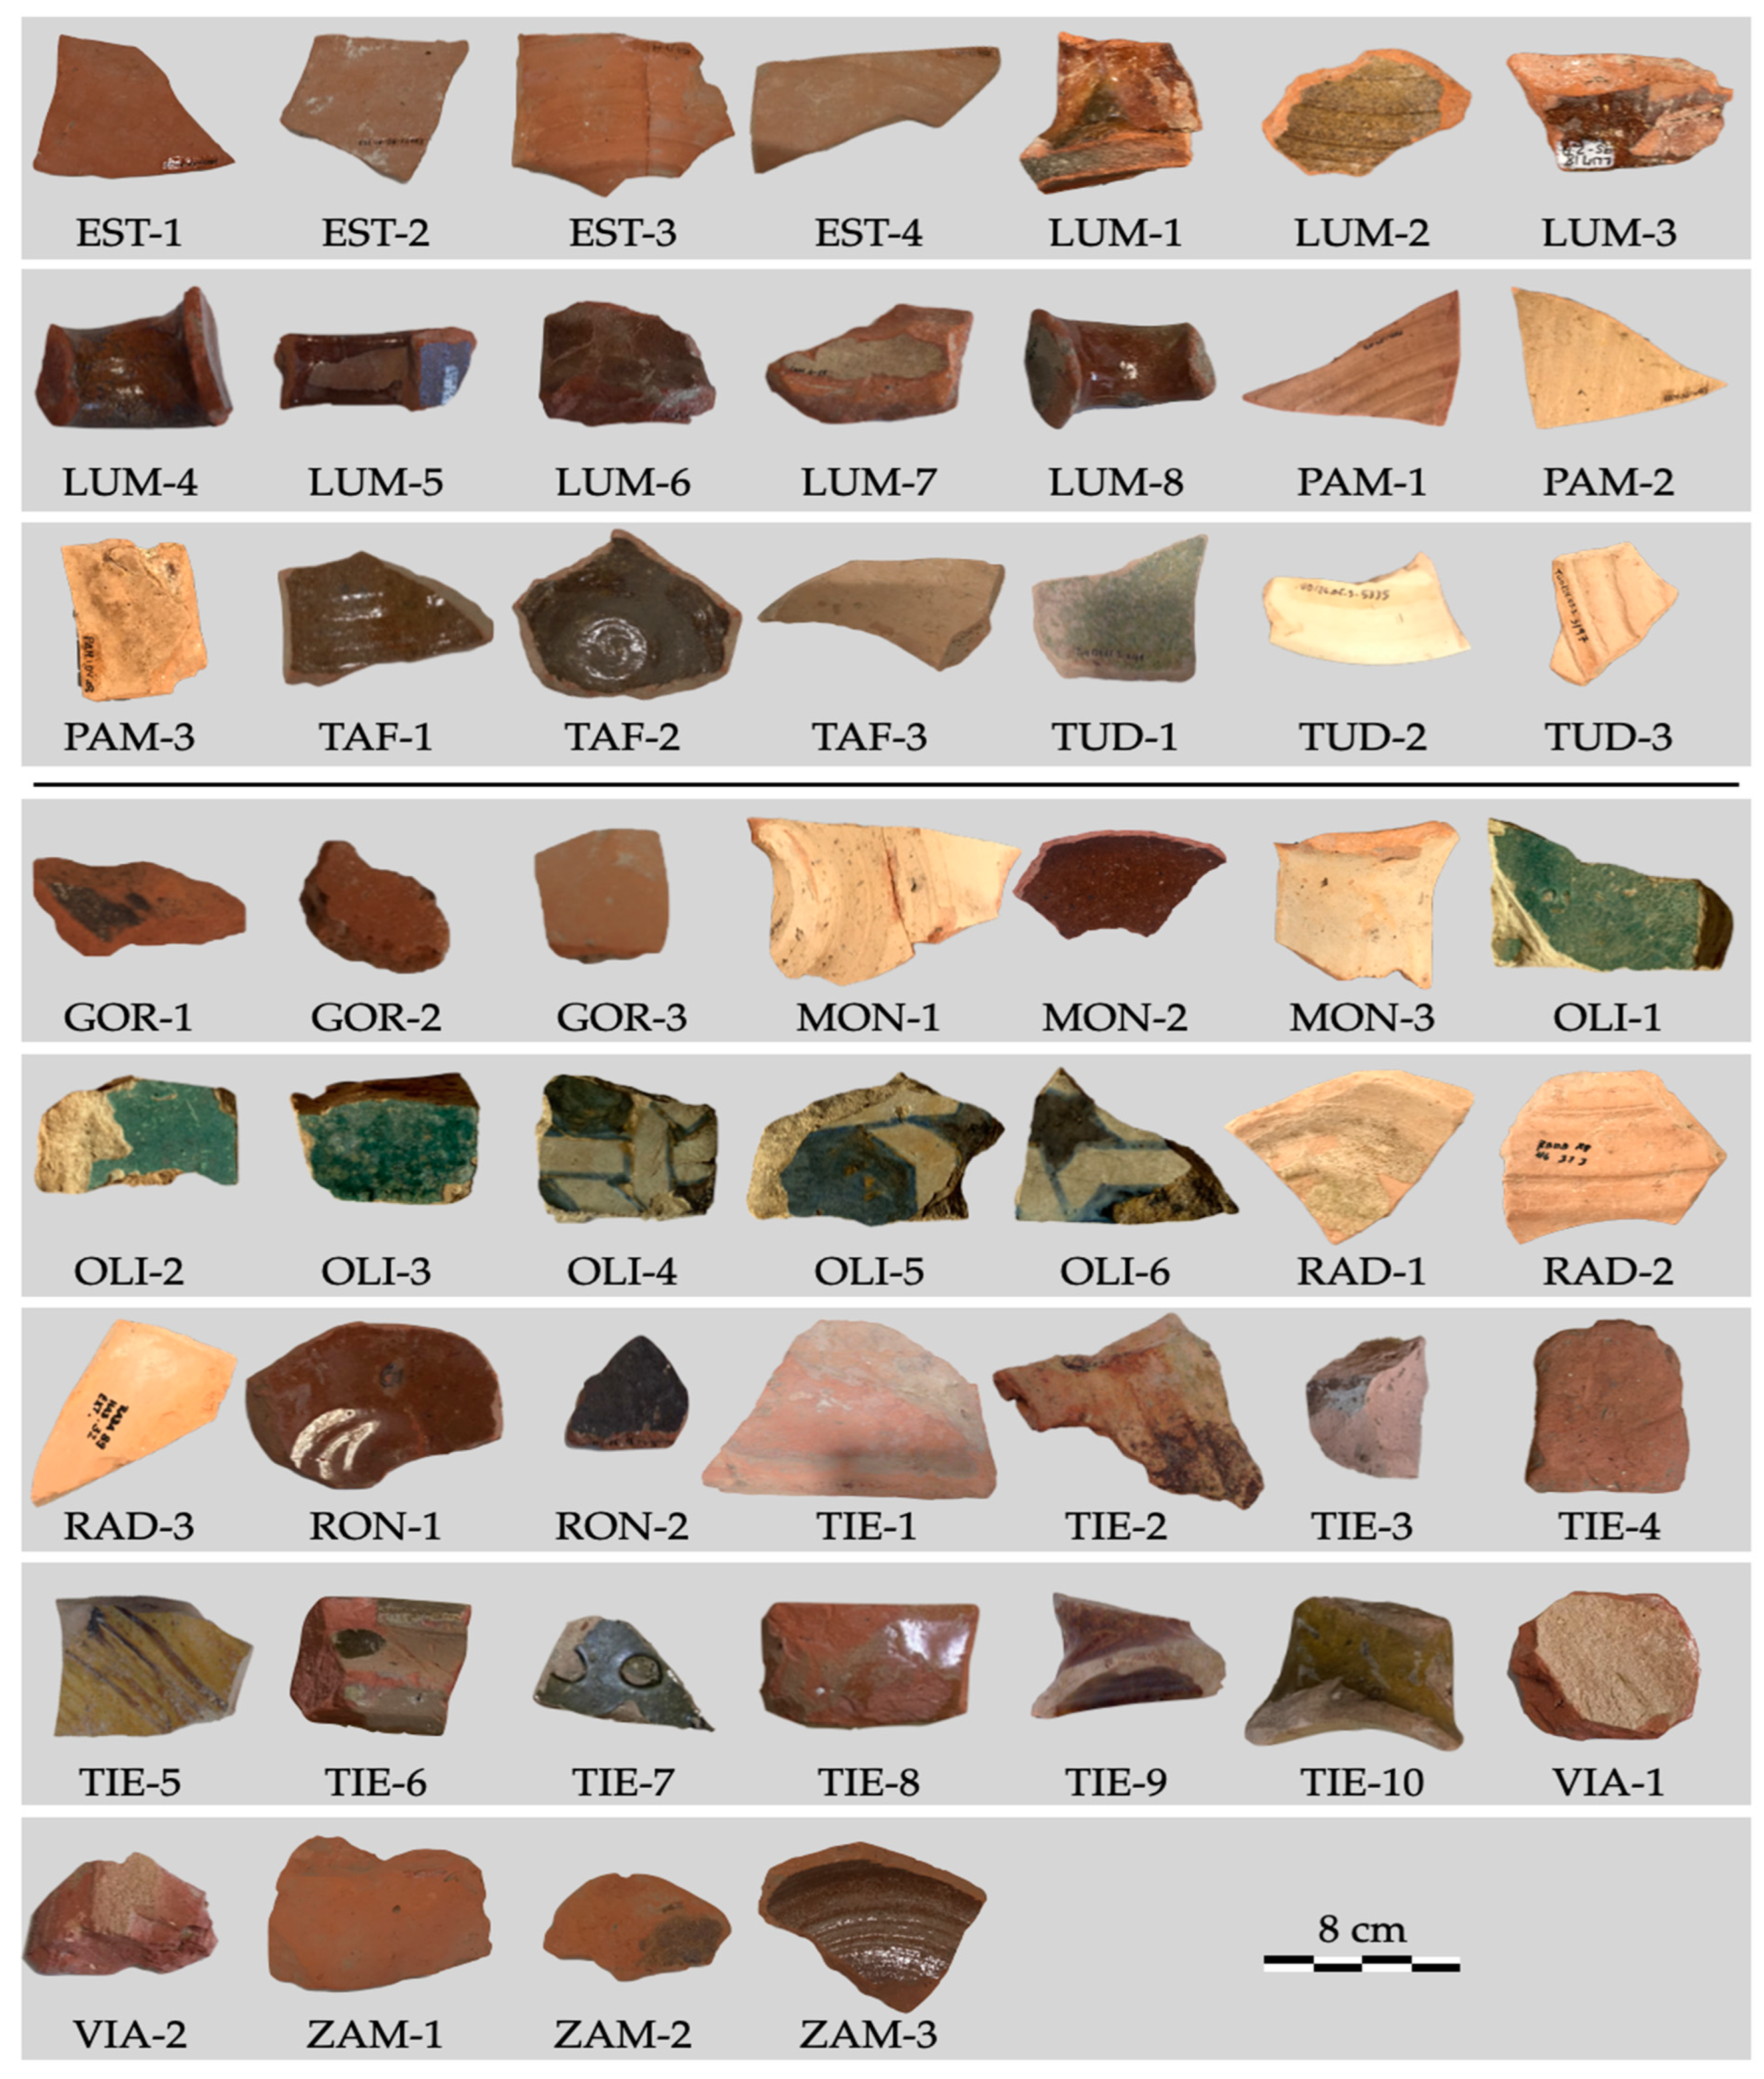
2.1. Materials

Different samples of pottery, bricks, or tiles from the five production centres (Estella, EST; Lumbier, LUM; Pamplona, PAM; Tafalla, TAF; and Tudela, TUD) were selected (Table 1, Figure 2).
Samples from other sites (Gorrizluzea, GOR; Monreal, MON; Olite, OLI; Rada, RAD; Roncesvalles, RON; Tiebas, TIE; Viana, VIA; and Zamarze, ZAM) (Figure 1 and Figure 2) where there was no evidence of ceramic production were also selected, to check if it could be determined where they came from (Table 1). The collection sites were selected with the aim of trying to cover the entire Navarrese territory, from north to south and from east to west.
The samples were collected from the innermost part of the ceramic paste, where there were no remains of glaze or soil. Approximately 1–2 g was extracted to perform the analysis from two different parts of the paste sample (trying to be representative of the whole sample). We tried to damage the archaeological samples as little as possible and they were not subjected to any type of treatment after being collected.
In the case of the creation of the so-called reference groups, we followed the sampling criteria described in the literature [28,29], such as in the assignation of samples to specific geographical locations (EST, LUM, PAM, TAF, and TUD, in our case), the assignation of ceramic type in terms of composition (thanks to XRF and XRD analyses) and typology (Supplementary Materials, Table S1), and also defined chronological periods (Table S1).
Table 1. List of sites from which mediaeval archaeological samples were collected.
IDSiteCoordinatesNTypeChronologyReferences
ESTEstella42.669° N, 2.028° W4PotteryXII–XV[18]
LUMLumbier42.652° N, 1.308° W8PotteryXII–XV[30]
PAMPamplona42.818° N, 1.646° W3PotteryXII–XIII[10]
TAFTafalla42.528° N, 1.674° W3Pottery, bricksXII–XV[11]
TUDTudela42.063° N, 1.608° W3PotteryXII–XV[4]
GORGorrizluzea42.704° N, 1.621° W3PotteryXII–XIII-
MONMonreal42.705° N, 1.510° W3PotteryXIII–XV-
OLIOlite42.482° N, 1.650° W6TilesXV-
RADRada42.341° N, 1.616° W3PotteryXII–XIV[31]
RONRoncesvalles43.010° N, 1.320° W2PotteryXII–XV-
TIETiebas42.697° N, 1.638° W10Pottery, bricksXIII–XV[32]
VIAViana42.515° N, 2.371° W2PotteryXII–XV-
ZAMZamarze42.923° N, 1.963° W3PotteryXII–XV[33]
Samples which were selected as references for a production centre were those described as being from the different production centres described. First, this selection was performed following historical and geographical criteria [4,10,11,18,30], and then following chemical elemental and mineralogical characterisation criteria. These samples were the following (see Supplementary Materials, Table S1): EST-1, EST-2, EST-3, EST-4, LUM-1, LUM-2, LUM-3, LUM-4, LUM-5, LUM-6, LUM-7, LUM-8, PAM-1, PAM-3, TAF-3, TUD-1, TUD-2, and TUD-3. In addition, some other samples of known origin and associated with each of the production centres were analysed. Associated with the Lumbier production centre, the pastes of two fragments of ceramics (LUM-mod-1, LUM-mod-2) produced in Lumbier in the mid-20th century (kindly donated by Esteban Labiano) were analysed. Associated with the Tafalla production centre, the clays used in a local weaving factory that maintained production until the end of the 20th century (TAF-clay, TAF-mod-1, TAF-mod-2) and several brick fragments from the ancient kiln (TAF-kiln-1, TAF-kiln-2) [6] were analysed. The provenance of these samples from Lumbier and Tafalla was widely consulted on with local authorities and technicians from Navarre Government. Finally, several fragments of Roman tegula (ABL-1, ABL-2, ABL-3, ABL-4, ABL-5, ABL-6) from the town of Villar de Ablitas, a few kilometres from Tudela, were analysed [34]. It is well known that the raw material used to make the tegulae was local clay.
Archaeological samples from other Navarrese sites were the following: from Gorrizluzea, GOR-1, GOR-2, and GOR-3; from Monreal, MON-1, MON-2, and MON-3; from Olite, OLI-1, OLI-2, OLI-3, OLI-4, OLI-5, and OLI-6; from Rada, RAD-1, RAD-2, and RAD-3; from Roncesvalles, RON-1 and RON-2; from Tiebas, TIE-1, TIE-2, TIE-3, TIE-4, TIE-5, TIE-6, TIE-7, TIE-8, TIE-9, and TIE-10; from Viana, VIA-1 and VIA-2; and from Zamarze, ZAM-1, ZAM-2, and ZAM-3. There were also samples PAM-2, TAF-1, and TAF-2.

2.2. Methods

Archaeological (Figure 2, Table 1, and Supplementary Materials Table S1) and reference samples (those described in the above paragraph) were characterised using X-ray Fluorescence (XRF) and X-ray Diffraction (XRD). All samples were analysed in powder form after grinding with an agate mortar. For the XRF analyses, a Bruker S2 Puma device (Bruker AXS, Karlsruhe, Germany) was used, with a silver anode and helium atmosphere. The measurement conditions were triplicate scans at 20 kV, 40 kV, and 50 kV, and a detector resolution of 10.8 eV (at 20 kV). The software Spectra Results Analysis (Spectra.Elements, version 2.3) was employed for quantification. XRD analyses were carried out with a Bruker D8 Advance diffractometer, with a Cu-Kα1 tube (1.5418 Å, 40 kV, 25 mA) and a LYNXEYE detector. The experimental conditions were the following: scans from 5° to 70° (2θ), at a speed of 2 s/step and a resolution of 0.02°/step. The software DIFFRAC.EVA (version 4.3) was employed for the interpretation of results.
For exploratory and classificatory purposes, the XRF results were processed by means of PCA (Principal Component Analysis) with the aim of carrying out a more objective identification of the raw materials of each ceramic workshop. PCA was implemented using Matlab version R2023b, Update 7. PCA identifies which are the linear combinations of the experimental data (elemental concentration) and orders the linear combinations according to their variance. In this sense, a data matrix (X1) was built considering the elemental quantification of all samples as variables (data available as Supplementary Materials, Table S2). The elemental quantification data were normalised between 0 and 1 according to the maximum and minimum of each element. The objective of normalisation was that all variables (major and minor elements) were equally represented and were only distinguished by their greater or lesser variance. The data were centred at zero, by subtracting the arithmetic mean of each variable. In this way, values below the mean take negative values and values above the mean take positive values. PCA analysis was applied to this second normalised and centred matrix (X2), producing a matrix of coefficients (V), a matrix of scores (U), and the % of variance that explains each Principal Component [35]. The coefficient matrix (V) contains the calculated linear combinations. Linear combinations (or principal components) are a set of coefficients that are ordered from highest to lowest according to the explained X2 variance. Each Principal Component has as many coefficients as elemental variables analysed. The value of each coefficient indicates how variable that element is within the data set, with 0 being a little variable; and ±1 highly variable. The sign of the coefficient means that it has a direct correlation with another of the same sign and an indirect correlation with another of the opposite sign [35]. The scores matrix (U) contains the values for each sample once the coefficient matrix (V) and the data matrix (X2) have been multiplied. By graphing the results of the principal components with the greatest variance, it is possible to group the results considering all the variables [35]. All data are available as Supplementary Materials (Table S2).

3. Results

3.1. PCA Coefficient Matrix (V)

Once all the samples (65, those described in the Supplementary Materials, Table S1) had been analysed by XRF and quantification had been performed, the twelve elements above the quantification limit (Na, Mg, Al, Si, K, Ca, Sc, Ti, Mn, Fe, Sr, and Zr) were selected for statistical analysis and the rest were discarded.
Quantification results were normalised and centred at 0 before applying PCA, as mentioned in Section 2.2. Table 2 shows the coefficient matrix obtained from that PCA. It reflects how Principal Component 1 (PC1) includes 59% of the variance of the data set. PC2 and PC3 explain 14% and 12% of the variance, respectively, while the remaining nine, PC4-PC12, have percentages less than 5%.
The positive coefficient of PC1 showed that Mg, Ca, Sc, and Sr directly correlated with each other (Ca group). On the other hand, they had an inverse correlation with Al, Si, Ti, and Fe, which showed a direct correlation between themselves (Si group). On the other hand, Na, K, Mn, and Zr were minor elements, although the signs of the coefficients allowed Na to be grouped with the Ca group (positive values of PC1), and K, Mn, and Zr with the Si group (negative values of PC1) (Table 2). From a geochemical point of view, the explanation for this division could be based on the sedimentary character of the elements forming part of the Ca group. All of them form abundant minerals in nature, such as halite, calcite, dolomite, magnesite, or strontianite. Calcite and dolomite are the most relevant phases usually found in a ceramic. On the other hand, the Si group included elements that form insoluble and cumulative minerals such as quartz, rutile, hematite, or aluminosilicates. This division distinguished calcareous clays from siliceous clays.
Two groups were distinguished, considering the coefficients of PC2: the first group was formed by Na, Mg, Al, and Ti with positive values, and the second by Sc, Mn, and Zr with negative values. Si, K, Ca, Fe, and Sr appeared as major elements (Table 2). This division distinguished between clays rich in aluminosilicates and light cations such as Na+ or Mg2+, and clays with transition metal impurities (Sc, Mn, and Zr).
Finally, the values of the coefficients of PC3 divided the elements in two groups: Na (0.38), Mg (0.38), Mn (0.60), Fe (0.23), and Zr (0.34) (positive values), divided from K (−0.37) (negative values) (Table 2). Potassium seemed to be specific to the second group of samples, in which the rest of the elements were in lower concentrations: Al (−0.15), Ti (−0.09), Sc (−0.06), and Ca (−0.05) (Table 2).
Figure 3 shows how the different elements were distributed when combining pairs of the first three Principal Components (PC1 and PC2 in Figure 3a and PC1 and PC3 in Figure 3b). Ca and Sc appeared together in both graphs, indicating an important correlation. In the same way, Zr and Mn, Ti and Al, or Na and Mg appeared together. On the other hand, Si, Fe, and Ti appeared completely opposite to Ca, Sr, and Sc.

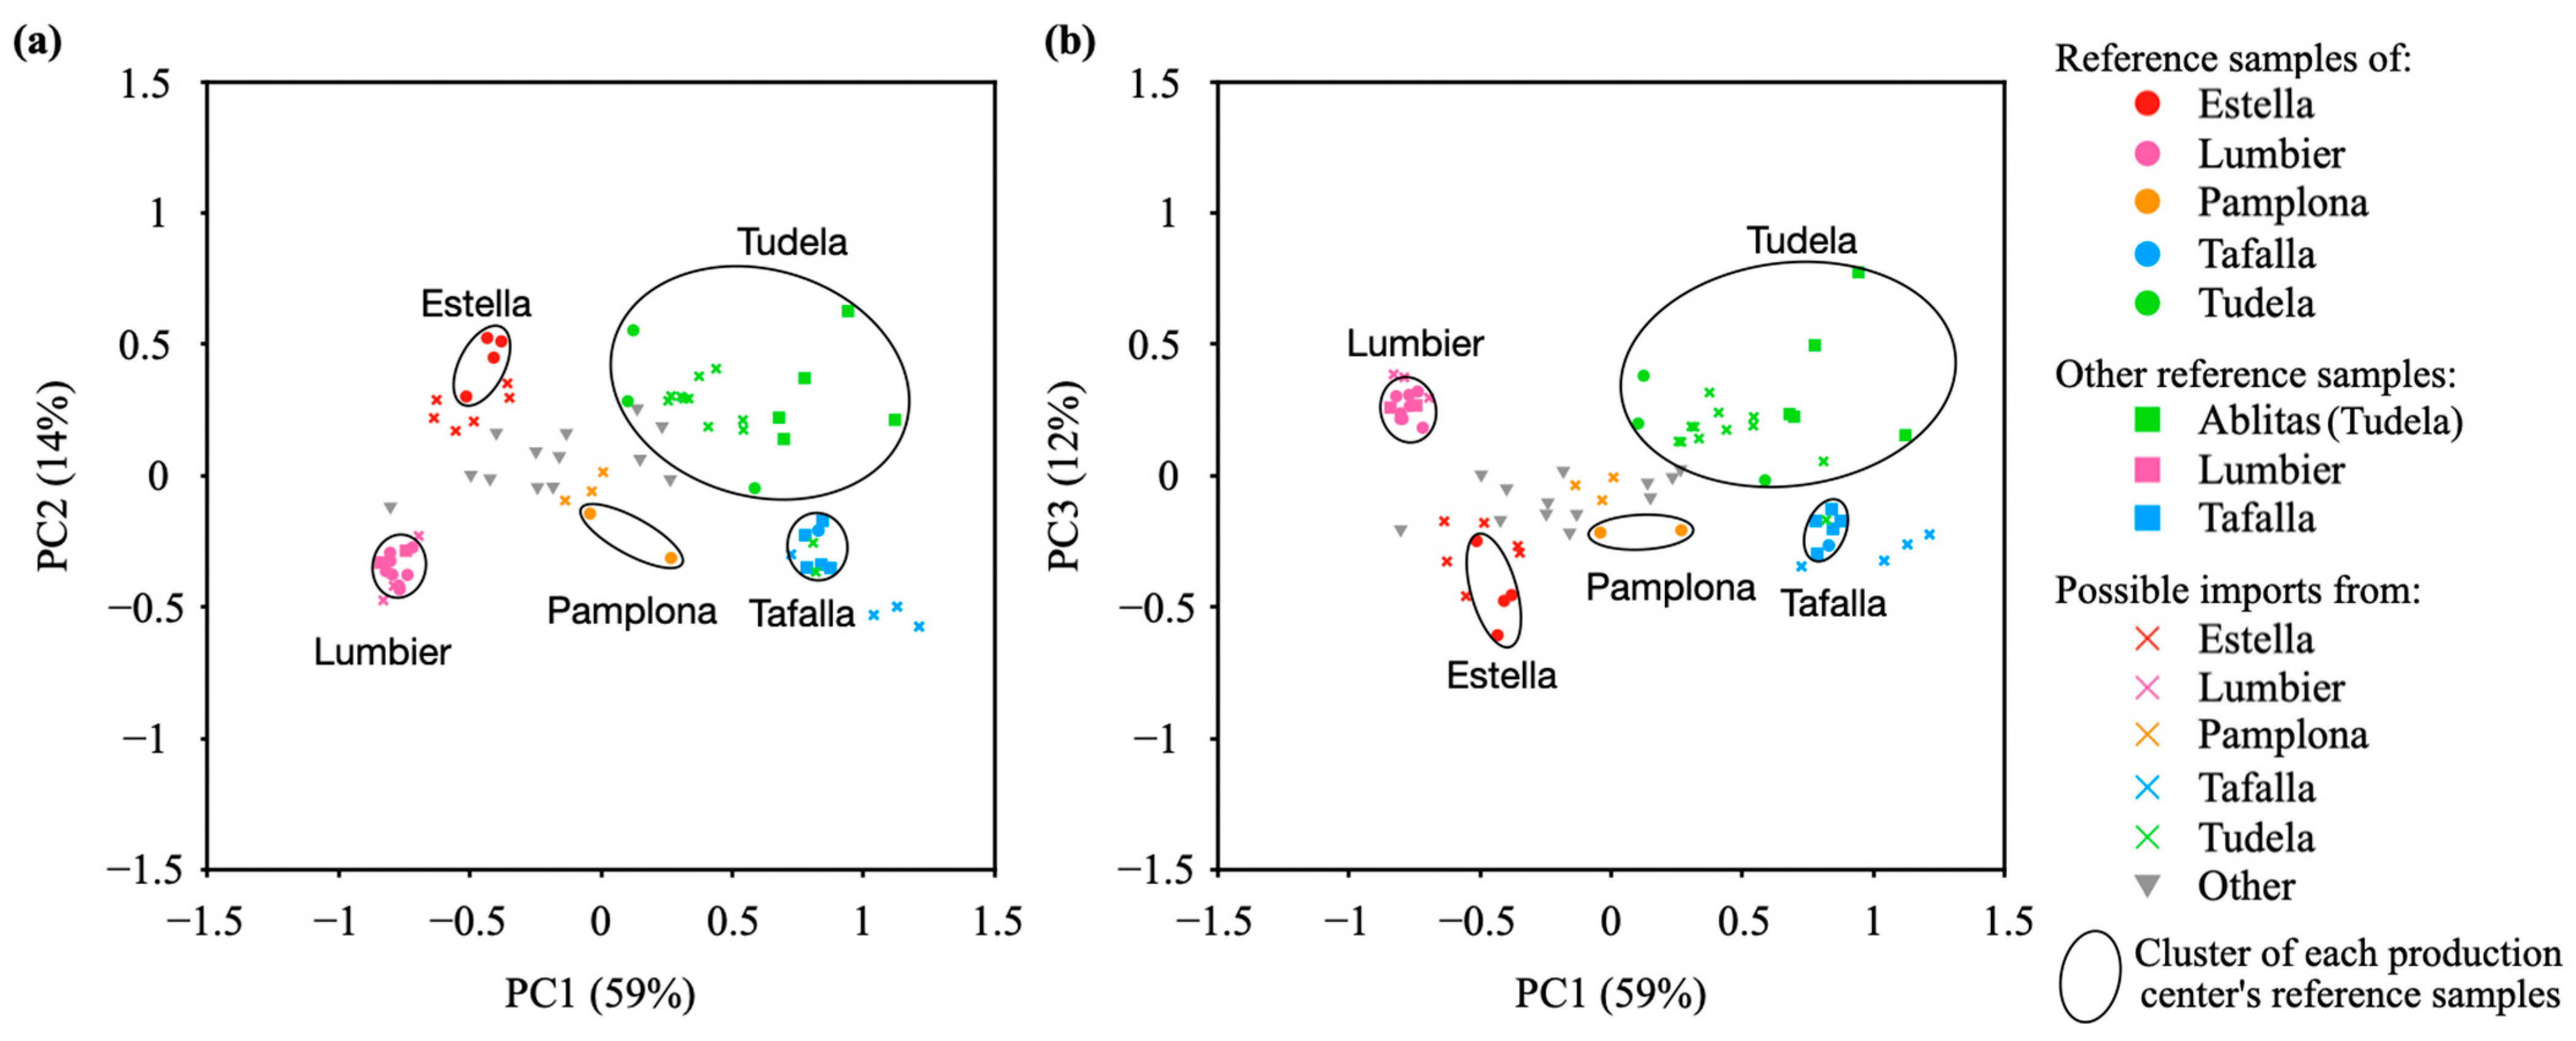
3.2. PCA Scores Matrix (U)

The score matrix (U) allowed the samples to be classified depending on the chemical elemental analysis (by XRF) and the representation of PC1, PC2, and PC3 (Figure 4). In Figure 4, we can see how the samples were distributed in a manner analogous to Figure 3. By comparing both (Figure 3 and Figure 4), it was possible to identify the five production centres groups and their composition relative to the average.
From Figure 4, we could identify which elements were especially high or scarce for each production centre. In this way, it was found that Tudela ceramics were rich in Na, Mg, Ca, and Sr, while they were poor in Si and Zr (Figure 3 and Figure 4). Ceramic samples from Estella were rich in Al and K, while they were poor in Mg, Sc, and Mn (Figure 3 and Figure 4). Lumbier ceramic samples were rich in Si, Mn, Fe, and Zr, and poor in Na, Mg, Ca, Sc, and Sr (Figure 3 and Figure 4). The ceramic samples from Tafalla were rich in Ca, Sc, and Sr, while they were poor in Na, Si, Al, K, Ti, and Fe (Figure 3 and Figure 4). Finally, the ceramic samples from Pamplona were rich in Ca and Si, and poor in Na and Mg (Figure 3 and Figure 4).
It could also be seen how the archaeological and reference samples from Lumbier and from Tafalla grouped together well. On the other hand, the Tudela samples were much more widely dispersed. Still, all the Tudela samples were in the upper right quadrant, which meant that they maintained the same trend although with variable elemental concentration (Figure 3 and Figure 4). A possible explanation for this phenomenon could be that in the case of Lumbier and Tafalla, the clay was only extracted from a single, very homogeneous deposit, while in the case of Tudela, the extraction was carried out from different and/or more heterogeneous sources.
In Supplementary Materials, Table S3, the elemental chemical analyses (by XRF) of the samples considered as reference samples (30 in total) are shown. In Supplementary Materials, Table S4, the elemental chemical analyses (by XRF) of the samples found in other archaeological sites within Navarra are shown.
As for the samples from other archaeological sites (Gorrizluzea, Monreal, Olite Rada, Roncesvalles, Tiebas, Viana, and Zamarze), it could be seen how some of them grouped very well within the groups of the producing centres, as was the case with Lumbier or Tudela. The chemical composition of GOR-2, MON-2, RON-2, and ZAM-3 matched with those from Lumbier due to the high percentages of Si (50% or more), very low percentages of Ca and Mg (lower than 5%), and Al and Fe ca. 19% and 15%, respectively (Supplementary Materials, Tables S3 and S4). Analyses of samples OLI-1, OLI-2, OLI-3, OLI-4, OLI-5, OLI-6, RAD-1, and RAD-2 showed similarities with those from Tudela and Ablitas (Si percentages ca. 32%, and high Ca and Mg percentages ca. 30% and 5%) (Supplementary Materials, Tables S3 and S4).
In other cases, however, they were at a certain distance, as was the case with Estella, Pamplona, and Tafalla. In these three cases, both the value proximity and the direction in which the points fall have been considered to include (or not) some of them within the production centres (Figure 4). Samples GOR-1, GOR-3, RAD-3, RON-1, TIE-7, TIE-10, and ZAM-1 were assigned to the producing centre of Estella. The most characteristic percentages of these samples were those of Al (the highest of the producing centres, ca. 22%) and K (the highest values of the producing centres on average, ca. 6%) (Supplementary Materials Tables S3 and S4). Samples MON-3, TIE-5, TIE-6, TIE-8, and TIE-9 were associated with the Pamplona manufacturing centre, and samples TIE-1, TIE-2, TIE-3, and TIE-4 with Tafalla production (Supplementary Materials Tables S3 and S4). Samples TIE-1, TIE-2, TIE-3, and TIE-4 were bricks with compositions based on very high percentages of Ca (usually higher than 40%) and low percentages of Si (percentages less than 30%) and Fe (less than 11%) (Supplementary Materials Tables S3 and S4).
It was not possible to assign samples PAM-2, TAF-1, TAF-2, MON-1, VIA-1, VIA-2, and ZAM-2 to any production centres (Table S4, marked with an asterisk in the Supplementary Materials Table S1, and indicated with grey triangles in Figure 4). PAM-2 was not associated with the PAM centre due to the low Ca content (12.6%), in comparison with the Ca average content of the other PAM samples (21.8%). TAF-1 and TAF-2 showed higher Si (45.1 and 53.8% respectively), Al (18.1 and 17.4%), and Fe (13.1 and 14.7%) contents in comparison with the average values of TAF samples: 24.4% of Si, 12.3% of Al, and 9.9% of Fe. The amounts of Ca in TAF-1 and TAF-2 were very low (13.3% and 5.4%) when compared with the average TAF content in Ca (41.9%). The percentages of the other samples (MON-1, VIA-1, VIA-2, and ZAM-2) were not completely matched with any of the producing centres.
Table 3 shows the average composition values of each production centre, considering the archaeological samples, the reference samples (if any) and those samples exported to other Navarrese archaeological sites (if any).

3.3. Mineralogical Composition

The mineralogical analysis using XRD allowed us to identify the mineral form in which some of the most characteristic elements of each group were available (Table 4, Supplementary Materials Figure S1). In this way, the Estella ceramics were mainly formed of quartz (SiO2, PDF 33-1161), as well as of illite ((K,H3O)(Al,Mg,Fe)2(Si,Al)4O10, PDF 70-3754), hematite (Fe2O3, PDF 33-0664), and to a lesser extent calcite (CaCO3, PDF 05-0586) and gehlenite (Ca2Al(AlSi)O7, PDF 35-0755). These results coincided with those of XRF, in which the contents of K (illite phase) and Si (quartz and illite) were high, and the content of Ca (calcite and gehlenite) was low (Table 3, Supplementary Materials Tables S3 and S4). Clays from Estella probably came from the sedimentary materials from the Miocene and Triassic clays from Keuper. Lumbier ceramics were characterised by being composed of quartz and hematite (these samples showed the highest percentages of Si and Fe, Table 3, Tables S3 and S4), with traces of illite. The ceramics of Pamplona were composed of quartz, calcite, illite, and, to a lesser extent, of hematite and gehlenite. Marls from the end of the marine Eocene period are probably the origin of Pamplona clays. The Tafalla ceramics presented a very high concentration of gehlenite (the highest values of Ca by XRF, Table 3, Tables S3 and S4), and also calcite and quartz and, to a lesser extent, hematite, illite, anorthite (CaAl2Si2O8, PDF 41-1486), and wollastonite (CaSiO3, PDF 43-1460). The presence of anorthite indicated high firing temperatures (1000 °C or more). Finally, Tudela showed a higher proportion of anorthite. Quartz, illite, calcite, gehlenite, and to a lesser extent hematite and diopside (MgCaSi2O6, PDF 17-0318) were also abundant. The results seemed to indicate that clays from Tafalla and Tudela are calcareous clay. The detection of wollastonite (in Tafalla samples) and diopside (in Tudela samples) indicate firing temperatures from 950 °C to 1000 °C. Tafalla and Tudela clays proceed from the continental sedimentary materials from the Miocene period.
Regarding the classification of the different archaeological samples within the producing centres, the most remarkable findings were the following: calcite was not detected in either GOR-2 or MON-2 (therefore, they could be related to the LUM producing centre), and gehlenite was observed in MON-3 and assigned to PAM centre. Relatively high amounts of gehlenite were detected in OLI-1 and OLI-3, anorthite in OLI-2 and OLI-3, and diopside in OLI-2, which allowed them to be related to TUD. Similar results, especially for anorthite and diopside phases, were detected in RAD-1 and RAD-2. The presence of wollastonite in TIE-2, TIE-3, and TIE-4 was associated with TAF. In RON-1, calcite was present (EST), and it was absent in RON-2 (LUM) (Table S1 and Table 4). In almost all groups (except for LUM), there was also another felspar type than anorthite, very possibly albite (NaAlSi3O8, PDF 09-0466).

4. Discussion

4.1. Production Centres

From the above results, we could identify which elements were assigned for each production centre, with especially high or scarce chemical elemental quantities (Table 3).
Si was very high for Lumbier and Pamplona, and in Estella. Accordingly, quartz was the main mineralogical phase detected. Fe and hematite phase were high for the same three production centres (Lumbier, Estella, and Pamplona), and especially for Lumbier ceramics.
Ca-based phases were detected in Tafalla, Tudela, and Pamplona: calcite and gehlenite (mainly in Tafalla), anorthite in Tudela and in Tafalla, diopside in Tudela, and wollastonite in Tafalla.
Regarding other minor elements, Tudela ceramics were rich in Na, Mg, and Sr. Lumbier ceramics showed important amounts of Fe, Zr, and Mn. Estella samples stood out for their amount of Al and K (illite was abundant). Finally, Sc and Sr were abundant in Tafalla samples.
Regarding the similarities or differences in crystalline phases detected in the different producing centres, quartz was identified in all the samples (mainly in EST, LUM, and PAM), and illite was also found in all the samples (minor abundance in LUM). Higher quantities of calcite were detected for TAF, PAM, and TUD, although this phase was also detected in EST. Hematite appeared in all the samples, mainly in EST and LUM. Gehlenite was observed in four of the five centres (mainly in TAF and TUD, but also in PAM and EST). The main differences between the centres were due to the presence of anorthite, only existing in TUD and TAF, diopside only existing in TUD, and wollastonite in TAF (Table 4 and Supplementary Materials Figure S1).
On the other hand, the presence of anorthite (2θ values at 21.7° and 24.5° by XRD) (Table 4) in Tafalla and Tudela samples indicated firing temperatures higher than 1000 °C [23,36]. In addition, diopside (2θ values at 40.8° and 42.3°) was detected in Tudela ceramics and wollastonite (2θ values at 53.3° and 68.9°) in Tafalla samples (Table 4). Both mineralogical phases appeared from 950 to 1000 °C [23,36]. These data meant that the kilns of those production centres (Tafalla and Tudela) were able to reach higher temperatures than those from the other three (Estella, Lumbier, and Pamplona).

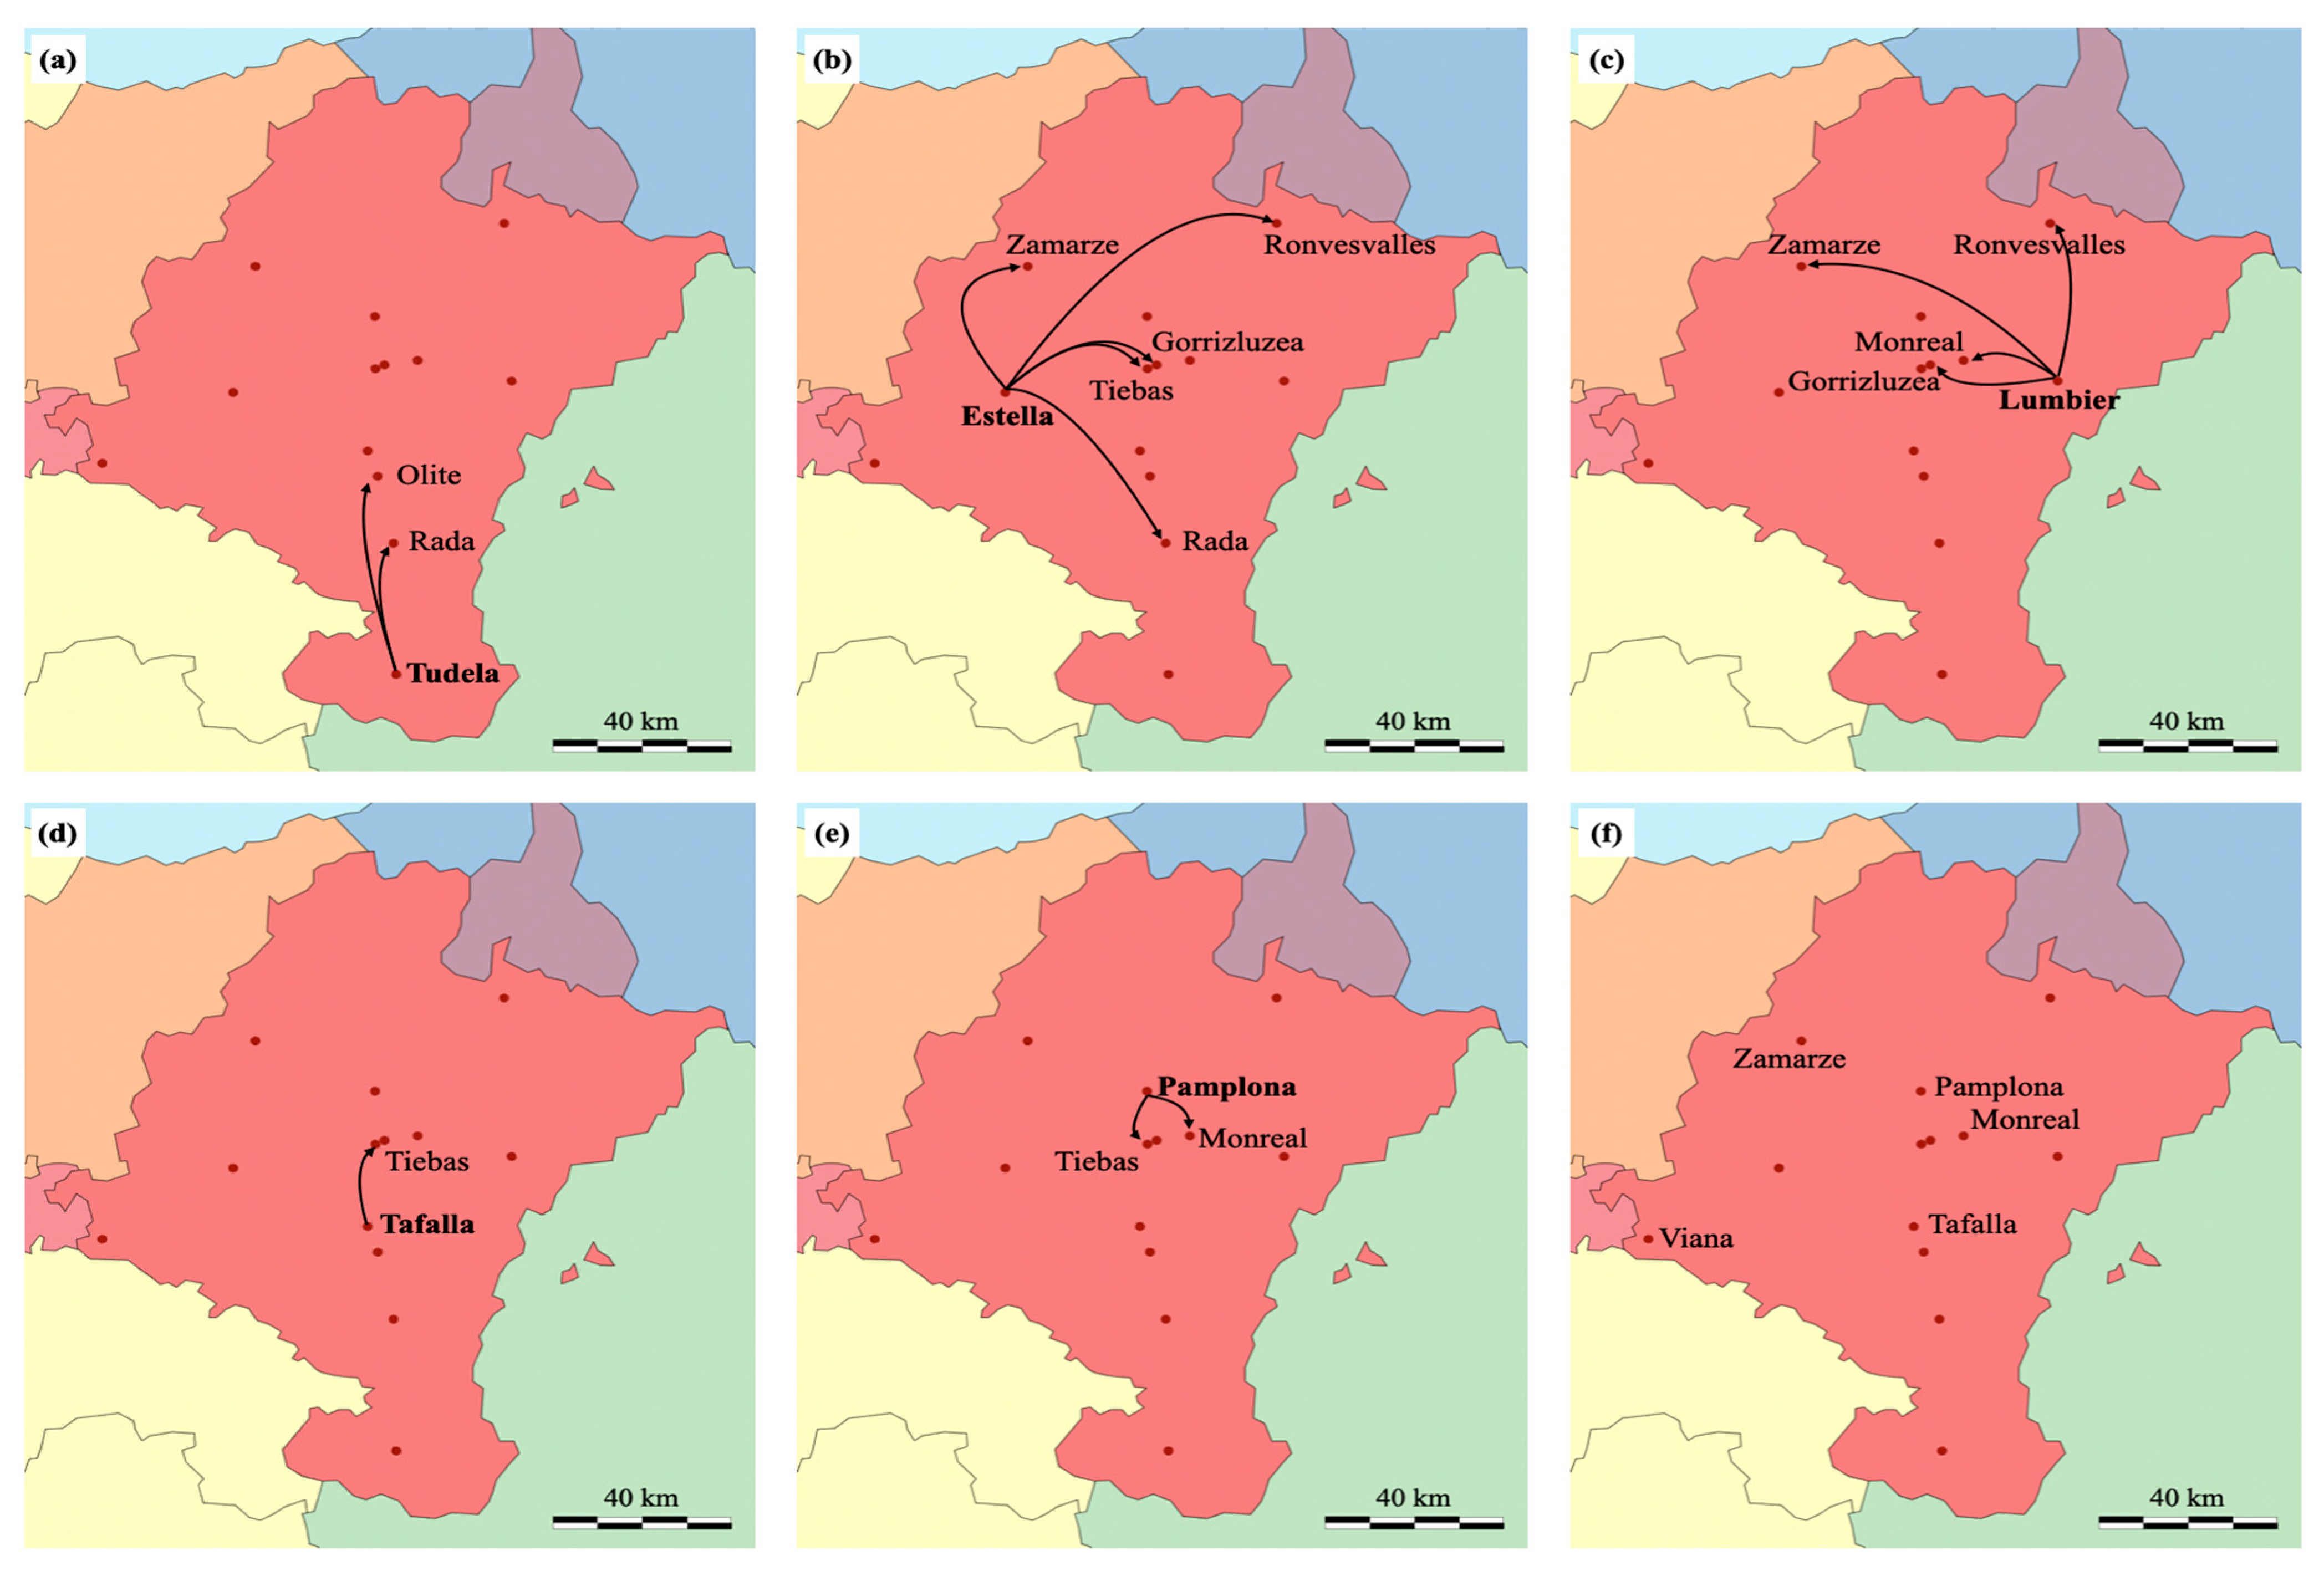
4.2. Distribution Network

Once the pastes from the production centres had been classified by similarity, it was possible to identify which samples from the other Navarrese sites could have been exported from each of them.
Thus, Tudela exported ceramics to Rada (RAD-1 and RAD-2) and tiles to Olite (OLI-1, OLI-2, OLI-3, OLI-4, OLI-5, and OLI-6). Estella exported ceramics to Roncesvalles (RON-1), Gorrizluzea (GOR-1 and GOR-3), Tiebas (TIE-7 and TIE-10), Rada (RAD-3), and Zamarze (ZAM-1). Lumbier exported ceramics to Roncesvalles (RON-2), Zamarze (ZAM-3), Gorrizluzea (GOR-2), and Monreal (MON-2). Tafalla exported bricks to Tiebas (TIE-1, TIE-2, TIE-3, and TIE-4). And finally, Pamplona exported ceramics to Monreal (MON-3) and Tiebas (TIE-5, TIE-6, TIE-8, and TIE-9).
Of all of them, the export from Tudela to Olite was especially noteworthy since there is historical documentation that attests to the purchase of tiles from Tudela for the work on the Olite Castle at the beginning of the 15th century.
The cluster of Tudela in the PCA diagram is shown to be quite disperse (Figure 4). The possible heterogeneity could have at least two complementary explanations: the intrinsic variability of the samples from Tudela, and the two different samples origins (TUD and ABL) that were considered as being the “reference” for the same producing centre (TUD) (Supplementary Materials, Table S1). Comparing both TUD and ABL samples, some differences were found in Ca content (20.6% for TUD and 32.2% for ABL). There were also different contents of Fe, notably low Si content for ABL-4 (27.9%) and Al for TUD-2 (15.8%), and a high Ca amount for TUD-2 (26.7%) (Supplementary Materials, Table S3).
Figure 5 and Supplementary Material, Table S1, show to which places within Navarre the ceramics samples manufactured in the different production centres were exported and the types of materials studied (ceramics (body of vessel, handle of a vessel, lip of a vessel, base of a vessel), wall tiles, bricks, clays, and tegulae). As can be seen in Figure 5 and in Table S1, most exports were made to the closest sites, with some specific exceptions.
On the other hand, some ceramic samples could not be assigned to any production centre with certainty. These samples were the following: MON-1, PAM-2, TAF-1, TAF-2, VIA-1, VIA-2, and ZAM-2 (Supplementary Materials Table S1, Figure 4 and Figure 5). Samples PAM-2, TAF-1, and TAF-2, historically associated with PAM and TAF producing centres, did not fit with them from the chemical (XRF and XRD analyses) point of view.

4.3. Navarrese Cultural Diversity

Navarrese history in the Middle Ages was marked by alliances and battles with both Muslims and the other close Christian kingdoms (France, Castile, and Aragon) [1,37]. After the Christian conquest of the Navarrese bank of the Ebro in 1119, an important Muslim community remained in Christian territory, mainly in Tudela, having noticeable relationships with the Navarrese monarchy, Jewish neighbours, and the Iberian Muslim communities of Al-Andalus [38]. After the Christian conquest in 1119, a new paradigm was created in the material culture, since the techniques of Muslim potters were incorporated into Christian productions [2,3]. For this reason, compositional analysis could not be linked to the different producing cultures.
In Navarre, Christian ceramics were the best known from the historical and artistic point of view, followed by Islamic productions [2]. Jewish ceramics were also present [2,39]. However, from Christian and Islamic productions, a gap opens with respect to Visigoth and Jewish ceramics [2,39]. The communities of Estella and Tudela had greater cultural diversity, with more than one religion: Christian, Muslim, and Jewish populations were all present. In the north of Navarre, Pamplona was the great exception, since ceramics from the three groups appeared in its proximity [2,6,10]. In this sense, in Pamplona during the 10th century, Visigoths, Muslims, and Carolingians fought for control of the city. In Tudela, Alfonso I the Battler took the town in 1119. Under Christian rule, urban planning underwent some changes, such as the replacement of the main mosque with the cathedral, the creation of a Muslim quarter, and the displacement of the Jewish population [2,3,38,39].
This work, devoted to the study of ceramics from the main pottery production centres in the region (Estella, Lumbier, Pamplona, Tafalla, and Tudela), provides new and valuable information about the mediaeval production of ceramics in Navarre.

5. Conclusions

The main pottery production centres in the ancient Kingdom of Navarre were Estella, Lumbier, Pamplona, Tafalla, and Tudela. The results allowed us to define, for each production centre, the chemical, elemental and mineralogical composition of the clays they used as raw materials. Ceramics from the Tudela area were characterised by a greater abundance of Ca, Mg, Na, and Sr. Ceramics from Estella were richer in Al, K, and Ti. Ca, Sc, and Sr were higher in Tafalla ceramics. Lumbier ceramics stood out for their high concentrations of Si, Mn, Fe, and Zr. Pamplona ceramics showed intermediate values. Quartz, illite, and hematite were mainly detected in Estella, Lumbier, and Pamplona ceramics. Ca-based phases were observed in ceramics from Tafalla, Tudela, and Pamplona. The kilns from Tafalla and Tudela reached higher temperatures. Some of the production centres, such as Tafalla and Lumbier, maintained the sources of raw materials until the 20th century.
Furthermore, the analysis of samples from other Navarrese locations allowed us to begin to define what the ceramic commercial network was like during the Middle Ages. Tudela exported ceramics to Rada and tiles to Olite. Lumbier exported ceramics to Roncesvalles, Zamarze, Gorrizluzea, and Monreal. Estella exported ceramics to Roncesvalles, Gorrizluzea, Tiebas, Rada, and Zamarze. Tafalla exported bricks to Tiebas. Pamplona exported ceramics to Monreal and Tiebas.
This study will allow the identification of the origin of other Navarrese ceramics from each production centre, contributing to knowledge in a historical period in which mainly Christian and Islamic productions were present.

Supplementary Materials

The following supporting information can be downloaded at: https://www.mdpi.com/article/10.3390/heritage7090228/s1, Table S1: Type of ceramics, site of location, and producing centres assigned. Table S2: Original chemical elemental data and Principal Component Analysis matrix. Table S3: Chemical elemental data of the samples selected as “reference”. Table S4: Chemical elemental data of the other archaeological samples found within the Navarre region. Figure S1: X-ray diffraction patterns of one representative sample of each producing centre (Estella, EST-1; Lumbier, LUM-3; Pamplona, PAM-1; Tafalla, TAF-3; and Tudela, TUD-1). Abbreviations: I—illite; W—wollastonite; A—anorthite; G—gehlenite; Q—quartz; C—calcite; D—diopside; L—lime; H—hematite.

Author Contributions

Conceptualization, I.R.-A., E.L. and A.D.; methodology, I.R.-A., S.A.-G., E.L. and A.D.; software, I.R.-A. and S.A.-G.; validation, I.R.-A. and S.A.-G.; formal analysis, I.R.-A. and S.A.-G.; investigation, I.R.-A., S.A.-G., E.L. and A.D.; resources, I.R.-A. and S.A.-G.; data curation, I.R.-A. and S.A.-G.; writing—original draft preparation, I.R.-A.; writing—review and editing, S.A.-G., E.L. and A.D.; visualisation, I.R.-A.; supervision, E.L. and A.D.; project administration, E.L. and A.D.; funding acquisition, E.L. and A.D. All authors have read and agreed to the published version of the manuscript.

Funding

The reported study was funded by the Dirección General de Cultura—Institución Príncipe de Viana (Navarre Government) under the projects “Thibalt. Caracterización arqueométrica de Carreaux de Pavement procedentes del Castillo de Tiebas (Navarra)” and “Aplicación del arqueomagnetismo y otras técnicas fisicoquímicas para el estudio de la tecnología de fabricación de azulejos medievales navarros”. I.R.-A. also acknowledges the Asociación de Amigos de la Universidad de Navarra for his doctoral grant.

Data Availability Statement

Data will be made available on request.

Acknowledgments

The authors thank the Dirección General de Cultura—Institución Príncipe de Viana (Navarre Government) for allowing us to analyse the specimens from its collections. Especially thanks to Jesús Sesma Sesma and Jesús García Gazolaz, for advice on sample selection. The authors also thank Esteban Labiano Iriarte and Jaime Aznar Auzmendi for their knowledge of Lumbier and Estella ceramic production, respectively.

Conflicts of Interest

The authors declare no conflicts of interest.

References

  1. Fortún-Pérez de Ciriza, L.J.; Floristán-Imizcoz, A. Navarra, Los Límites del Reyno; Gobierno de Navarra: Pamplona, Spain, 2008. [Google Scholar]
  2. Aznar-Auzmendi, J. El estudio de la cerámica medieval en Navarra. Un estado de la cuestión. Cuad. Arqueol. Univ. Navar. 2022, 30, 163–228. [Google Scholar] [CrossRef]
  3. Bienes, J.J. Introducción al estudio de la cerámica musulmana de la ciudad de Tudela. Turiaso 1987, 7, 115–158. [Google Scholar]
  4. Zuazúa, N.; García-Barberena, M.; Unzu, M.; Zuza, C. Memoria de la intervención arqueológica en el número 12 de la calle Herrerías de Tudela. Trab. Arqueol. Navar. 2015, 27, 7–62. [Google Scholar]
  5. Pérez–Omeñaca, M.C. Excavaciones de urgencia. fase II de la plaza de la Judería (Tudela). Trab. Arqueol. Navar. 2002, 16, 163–173. [Google Scholar]
  6. Silván, L. Cerámica Navarra, 1st ed.; Graficas Izarra: San Sebastián, Spain, 1973. [Google Scholar]
  7. Ozaki, A. El régimen tributario y la vida económica de los mudéjares de Navarra. Príncipe Viana 1986, 47, 437–484. [Google Scholar]
  8. García–Barberena, M.; Unzu, M.; Zuazúa, N.; Zuza, C. Pueblo Viejo de Caparroso, campañas de excavaciones arqueológicas 2016 y 2017. Trab. Arqueol. Navar. 2017, 29, 243–249. [Google Scholar]
  9. Bienes, J.J.; Sola, O.; Soto-Uriz, N. Yacimiento romano de San Gregorio, Ribaforada. III campaña de excavación. Trab. Arqueol. Navar. 2020, 31/32, 315–322. [Google Scholar] [CrossRef]
  10. Faro, J.A.; García-Barberena, M.; Unzu, M. Pamplona y el Islam. Nuevos testimonios arqueológicos. Trab. Arqueol. Navar. 2008, 20, 229–283. [Google Scholar]
  11. Jusué, C.; Tabar, M.I. La cerámica medieval navarra. I. Producción no vidriada. Trab. Arqueol. Navar. 1988, 7, 273–318. [Google Scholar]
  12. Molera, J.; Carvajal-López, J.C.; Molina, G.; Pradell, T. Glazes, colourants and decorations in early Islamic glazed ceramics from the Vega of Granada (9th to 12th centuries CE). J. Archaeol. Sci. Rep. 2018, 21, 1141–1151. [Google Scholar] [CrossRef]
  13. Vieira Ferreira, L.F.; Casimiro, T.M.; Boavida, C.; Costa Pereira, M.F.; Ferreira Machado, I. An Archaeometric Study of Lead-Glazed Medieval Ceramics (13th–14th Century) from Santarém, Portugal. Heritage 2024, 7, 2217–2238. [Google Scholar] [CrossRef]
  14. Holmqvist, E.; Heinonen, T.; Vaisanen, R.; Pihlman, A.; Koivisto, A.; Russow, E. Ceramic fabrics and lead glazes of late medieval redware pots in the Helsinki, Turku and Tallinn regions (ED-XRF, SEM-EDX). J. Archaeol. Sci. Rep. 2020, 34, 102627. [Google Scholar] [CrossRef]
  15. Savage, G. Majolica in Western Pottery. Britannica Enciclopaedia. Pottery—Majolica, Glazing, Ceramics|Britannica. Available online: https://www.britannica.com/art/pottery/Majolica (accessed on 19 August 2024).
  16. Hualde, F. Alfarería en Lumbier, 1st ed.; Lamiñarra: Pamplona, Spain, 2013. [Google Scholar]
  17. Muruzábal, J.M. Alfarería de Estella: Cuchareros de los Echeverría. Cuad. Etnol. Etnogr. 2017, 91, 43–67. [Google Scholar]
  18. Ramos-Aguirre, M. Intervenciones arqueológicas en el castillo de Estella (2001–2010). Trab. Arqueol. Navar. 2015, 27, 185–218. [Google Scholar]
  19. Amadori, M.L.; Cardellini, S.; Mengacci, V. Advances in lead-barium-zinc-silicate-type glazed warming bowl related to the Chinese Xuande Reign (1426–1435). Heritage 2024, 7, 1496–1509. [Google Scholar] [CrossRef]
  20. Polvorinos, A.; Aucouturier, M.; Bouquillon, A.; Castaing, J. The evolution of lustre ceramics from Manises (Valencia, Spain) between the 14th and 18th centuries. Archaeometry 2011, 3, 490–509. [Google Scholar] [CrossRef]
  21. Tite, M.S. Ceramic production, provenance and use—A review. Archaeometry 2008, 2, 216–231. [Google Scholar] [CrossRef]
  22. Mapa Geológico de Navarra (Memoria y Mapa); Gobierno de Navarra, Departamento de Obras Públicas, Transportes y Comunicaciones, Servicio de Obras públicas: Pamplona, Spain, 1997.
  23. Ruiz-Ardanaz, I.; Gil-Fernández, M.; Lasheras, E.; Durán, A. Revealing the manufacturing technology to produce the unique carreaux de pavement found in the Iberian Peninsula. Appl. Clay Sci. 2023, 231, 106725. [Google Scholar] [CrossRef]
  24. Papachristodoulou, C.; Gravani, K.; Oikonomou, A.; Ioannides, K. On the provenance and manufacture of red-slipped fine ware from ancient Cassope (NW Greece): Evidence by X-ray analytical methods. J. Archaeol. Sci. 2010, 37, 2146–2154. [Google Scholar] [CrossRef]
  25. Gajić-Kvaščev, M.D.; Marić-Stojanović, M.D.; Jančić-Heinemann, R.M.; Kvaščev, G.S.; Andrić, V.D. Non-destructive characterisation and classification of ceramic artefacts using pEDXRF and statistical pattern recognition. Chem. Cent. J. 2012, 6, 102. [Google Scholar] [CrossRef]
  26. Maltsev, A.S.; Pashkova, G.V.; Fernández-Ruiz, R.; Demonterova, E.I.; Shuliumova, A.N.; Umarova, N.N.; Shergin, D.L.; Mukhamedova, M.M.; Chubarov, V.M.; Mikheeva, E.A. Characterization of archaeological ceramics from eastern Siberia by total-reflection X-ray fluorescence spectrometry and principal component analysis. Spectrochim. Acta Part B At. Spectrosc. 2021, 175, 106012. [Google Scholar] [CrossRef]
  27. Longoni, M.; Calore, N.; Marzullo, M.; Teseo, D.; Duranti, V.; Bagnasco Gianni, G.; Bruni, S. Bucchero Ware from the Etruscan Town of Tarquinia (Italy): A Study of the Production Site and Technology through Spectroscopic Techniques and Multivariate Data Analysis. Ceramics 2023, 6, 584–599. [Google Scholar] [CrossRef]
  28. Neff, H. Theory, Sampling, and Analytical Techniques in the Archaeological Study of Prehistoric Ceramics. Am. Antiq. 1993, 58, 23–44. [Google Scholar] [CrossRef]
  29. Gliozzo, E. Ceramics investigation: Research questions and sampling criteria. Archaeol. Anthropol. Sci. 2020, 12, 202. [Google Scholar] [CrossRef]
  30. Ramos-Aguirre, M. Excavaciones en la ciudad romana de Ilumberris (Lumbier, Navarra). Cæsaraugusta 2007, 78, 521–534. [Google Scholar]
  31. Tabar, M.I. Actividad Arqueológica en Navarra 1988–1989. Trab. Arqueol. Navar. 1992, 10, 435–436. [Google Scholar]
  32. Ramos-Aguirre, M. Excavaciones en el castillo de Tiebas (Navarra), primer informe provisional. Trab. Arqueol. Navar. 1998, 15, 167–214. [Google Scholar]
  33. Armendariz, R.; Mateo, M.R. Santa María de Zamartze (Uharte–Arakil). Trab. Arqueol. Navar. 2009, 21, 293–315. [Google Scholar]
  34. Bienes, J.J.; Sola, O. La villa romana de El Villar de Ablitas. Campaña de 2015. Trab. Arqueol. Navar. 2016, 28, 7–14. [Google Scholar]
  35. Ramis-Ramos, G.; Álvarez-Coque, M.C. Quimiometría; Editorial Síntesis: Madrid, Spain, 2001. [Google Scholar]
  36. Ruiz-Ardanaz, I.; Úriz-Asiáin, O.; Lasheras, E.; Durán, A. Tiebas Castle’ tuiles vernissées: Characterization, raw clay provenance, and manufacturing technology. Appl. Clay Sci. 2024; Under review. [Google Scholar]
  37. García Fitz, F.; Gouveia Montero, J. War in the Iberian Peninsula, 700–1600, 1st ed.; Routledge: London, UK, 2018. [Google Scholar]
  38. Solares, C.C. Social continuity and religious coexistence: The Muslim community of Tudela in Navarre before the expulsion of 1516. Contin. Change 2011, 26, 309–331. [Google Scholar] [CrossRef]
  39. Ramos, M.; Labé, L.F.; Sánchez, A.C. Arqueología y cultura judaica. Príncipe Viana 2011, 253, 121–133. [Google Scholar]
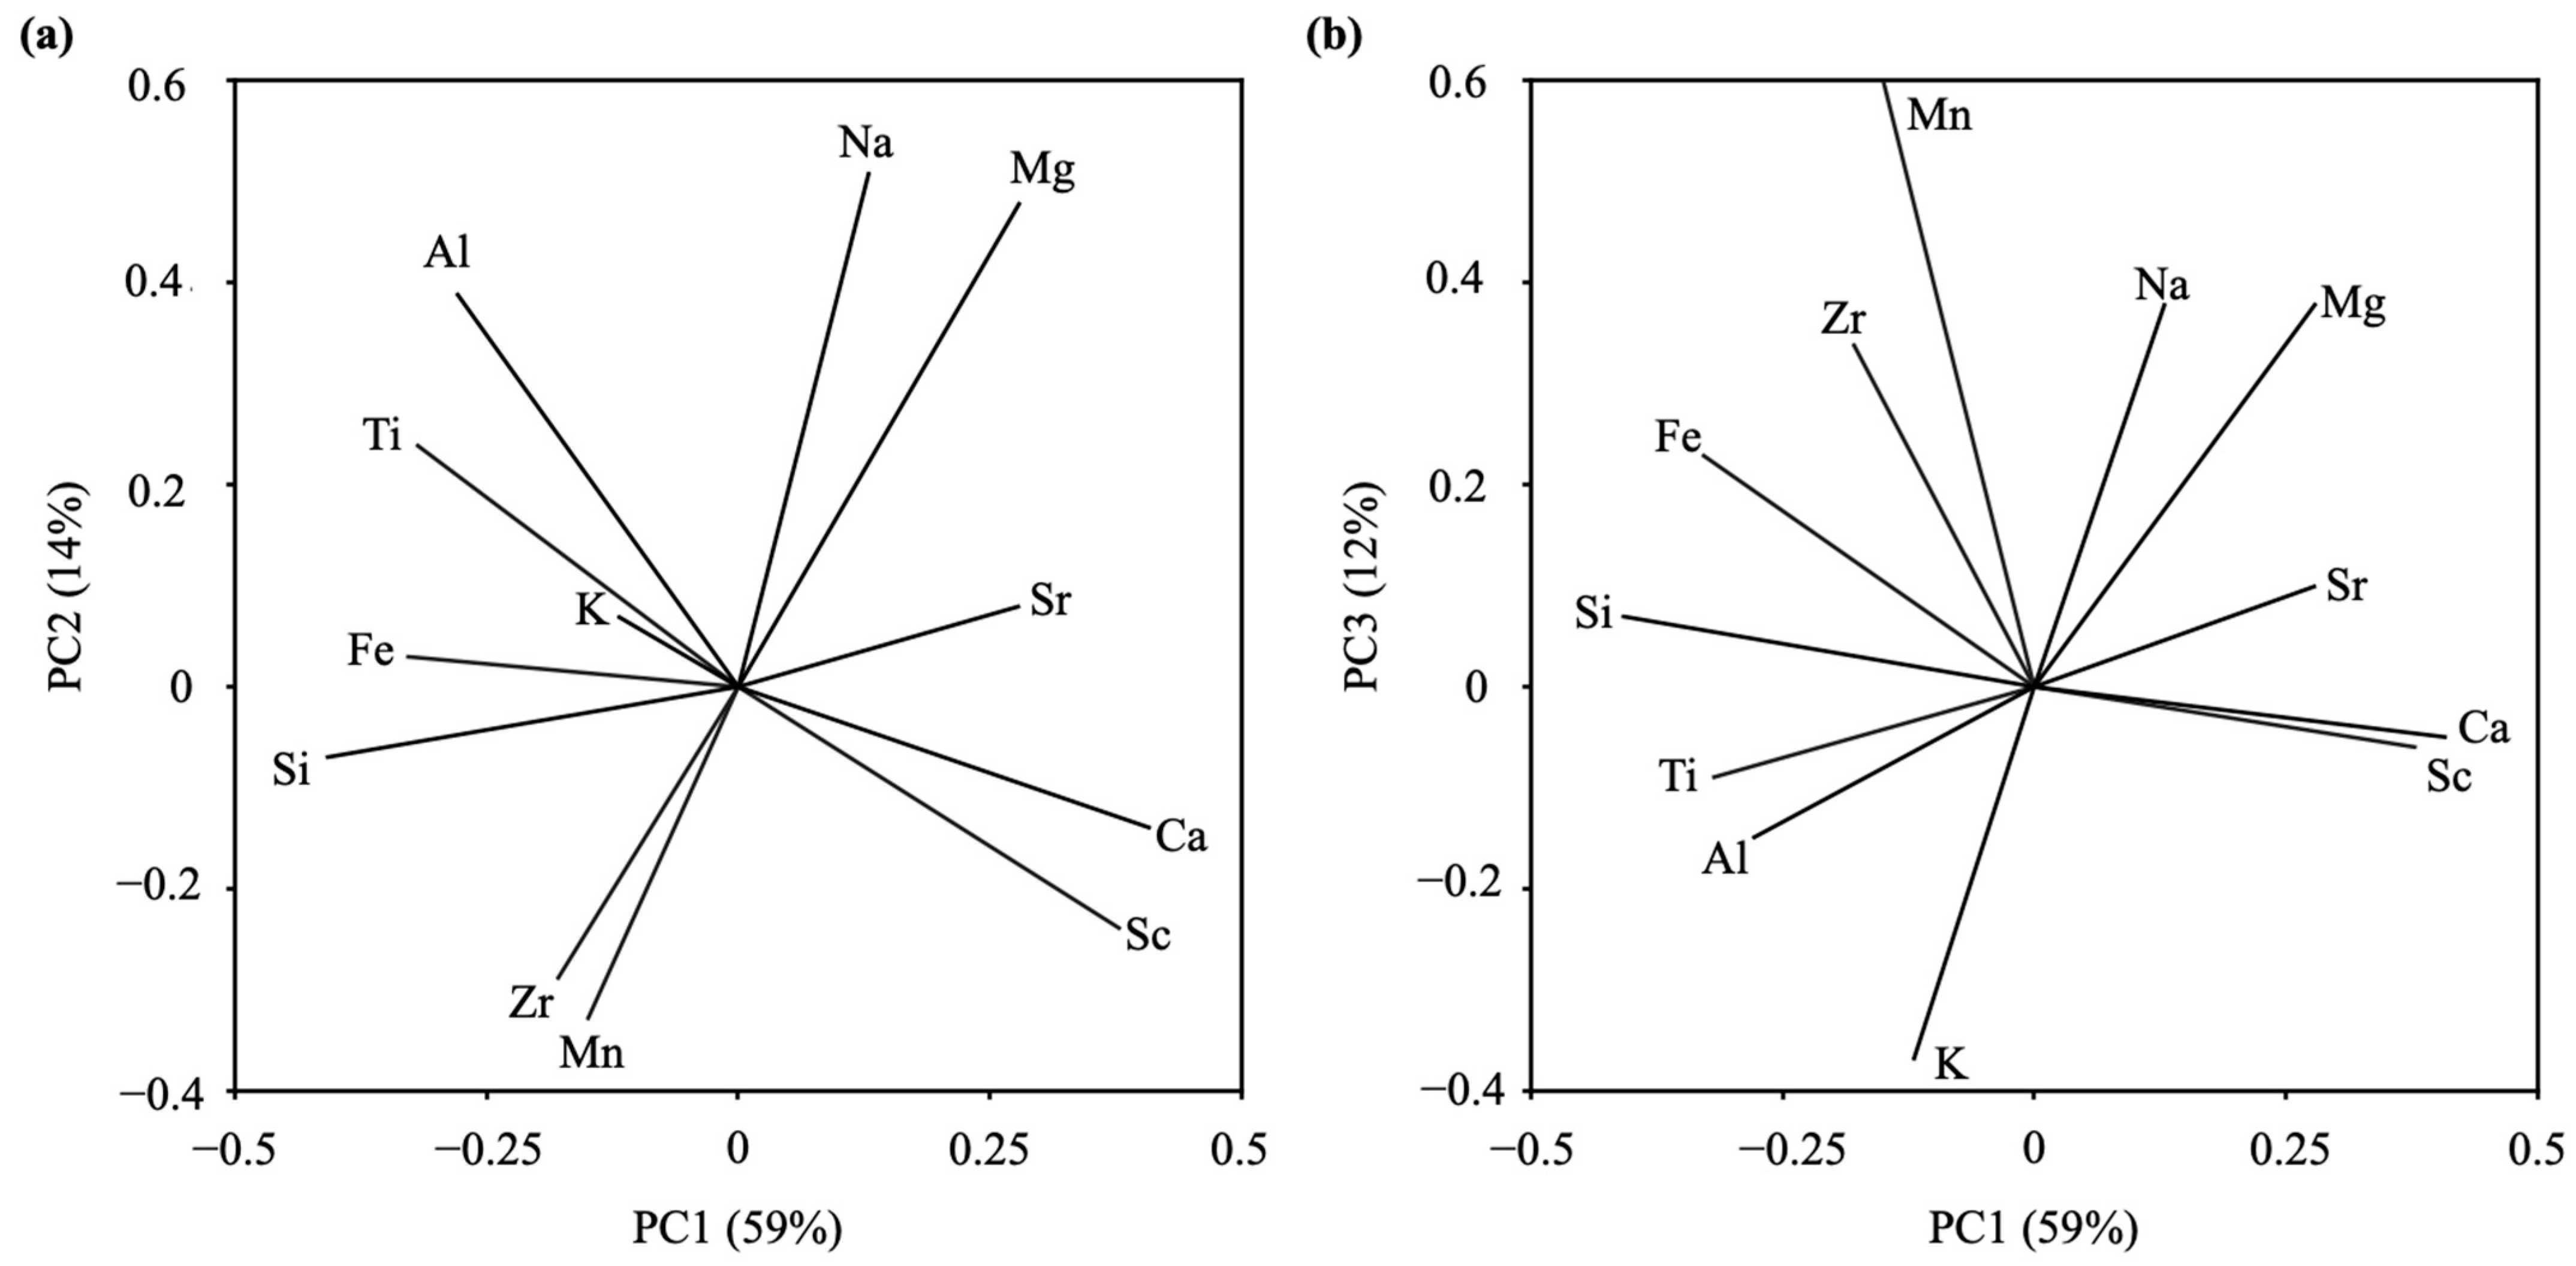
Figure 1. Location of the ancient Kingdom of Navarre in the north of the Iberian Peninsula and surrounding kingdoms [1]. The sites shown within the Kingdom of Navarre are subjects of study in this article.
Heritage 07 00228 g001
Figure 2. Archaeological ceramic fragments selected for analysis, arranged by site. Above are the samples from the production centres considered as “references” (Estella, EST; Lumbier, LUM; Pamplona, PAM; Tafalla, TAF; and Tudela, TUD); below are samples from the other sites (Gorrizluzea, GOR; Monreal, MON; Olite, OLI; Rada, RAD; Roncesvalles, RON; Tiebas, TIE; Viana, VIA; and Zamarze, ZAM).
Heritage 07 00228 g002
Figure 3. Representation of PCA coefficients from the elemental compositions of ceramics: (a) first two Principal Components (PC1 and PC2), where the most contributing elements were Si, Fe, Ca, and Sc for PC1 and Mn, Zr, Na, and Mg for PC2; (b) first and third Principal Components (PC1 and PC3), where the most contributing elements were Mn and K for PC3.
Heritage 07 00228 g003
Figure 4. PCA distribution of samples according to the elemental compositions of ceramics: (a) first two Principal Components (PC1 and PC2); (b) first and third Principal Components (PC1 and PC3). The circles refer to archaeological samples from the producing centres, considered as “reference” samples (Estella, red circle dot; Lumbier, purple circle dot; Pamplona, orange circle dot; Tafalla, blue circle dot; and Tudela green circle dot), the square dots refer to the other reference samples of known origin (Lumbier, purple square dot; Tafalla, blue square dot; Ablitas (Tudela), green square dot), and the inverted triangles and x refer to samples from other archaeological sites: Gorrizluzea, Monreal, Olite, Rada, Roncesvalles, Tiebas, Viana, and Zamarze. The colours of the inverted triangles and x are related to the colour of the producing centre reference samples: red for EST, purple for LUM, orange for PAM, blue for TAF, and green for TUD. Outliers are represented by grey inverted triangles.
Heritage 07 00228 g004
Figure 5. Export network of the main production centres of the former Kingdom of Navarre: (a) Tudela; (b) Estella; (c) Lumbier; (d) Tafalla; (e) Pamplona; (f) unknown provenance.
Heritage 07 00228 g005
Table 2. Principal Component Analysis coefficient matrix (V) obtained from the normalised and centred data set (X2) (data available as Supplementary Materials, Table S1). In bold are those coefficients above ±0.2 from the Principal Components with higher variance (PC1, PC2, and PC3).
ElementPC1PC2PC3PC4PC5PC6PC7PC8PC9PC10PC11PC12
Na0.130.510.38−0.44−0.080.01−0.420.080.090.42−0.130.02
Mg0.280.480.380.500.18−0.250.160.09−0.29−0.180.200.10
Al−0.280.39−0.150.070.150.25−0.03−0.090.64−0.180.400.22
Si−0.41−0.070.07−0.16−0.21−0.300.24−0.05−0.240.330.330.57
K−0.120.07−0.370.500.21−0.16−0.150.270.130.53−0.330.12
Ca0.41−0.14−0.05−0.080.060.09−0.170.020.06−0.29−0.300.76
Sc0.38−0.24−0.06−0.060.120.33−0.010.54−0.050.260.550.00
Ti−0.320.24−0.09−0.330.180.020.310.64−0.13−0.30−0.280.00
Mn−0.15−0.330.600.24−0.30−0.070.030.350.47−0.06−0.120.01
Fe−0.330.030.230.26−0.040.76−0.09−0.08−0.380.07−0.130.11
Sr0.280.080.10−0.070.080.230.76−0.210.230.34−0.230.03
Zr−0.18−0.290.34−0.140.84−0.09−0.10−0.150.020.060.010.00
Explained59%14%12%5%4%3%2%0.8%0.8%0.7%0.3%0.01%
Table 3. Mean elemental composition (in %) of the pastes of each production centre (Estella, EST; Lumbier, LUM; Pamplona, PAM; Tafalla, TAF; and Tudela, TUD) considering both archaeological and reference samples.
IDSiCaAlFeKMgTi
EST47 ± 37 ± 322 ± 213.4 ± 0.86.2 ± 0.82.2 ± 0.71.34 ± 0.08
LUM54 ± 32 ± 119 ± 116 ± 14.9 ± 0.71.7 ± 0.41.26 ± 0.08
PAM40 ± 220 ± 417 ± 112.1 ± 0.85.2 ± 0.62.6 ± 0.41.10 ± 0.06
TAF25 ± 344 ± 512 ± 19.9 ± 0.54.1 ± 0.72.2 ± 0.50.86 ± 0.06
TUD33 ± 225 ± 517 ± 212 ± 14 ± 25.0 ± 0.91.05 ± 0.08
IDNaMnSrScZr
EST0.5 ± 0.20.10 ± 0.040.11 ± 0.030.01 ± 0.010.07 ± 0.05
LUM0.18 ± 0.090.32 ± 0.060.06 ± 0.010.00 ± 0.010.14 ± 0.02
PAM0.3 ± 0.20.20 ± 0.020.16 ± 0.040.08 ± 0.040.07 ± 0.01
TAF0.01 ± 0.010.13 ± 0.010.29 ± 0.080.24 ± 0.070.06 ± 0.01
TUD0.9 ± 0.40.19 ± 0.020.3 ± 0.10.11 ± 0.040.06 ± 0.01
Table 4. Semiquantitative mineralogical composition of ceramic pastes by production centres (Estella, EST; Lumbier, LUM; Pamplona, PAM; Tafalla, TAF; and Tudela, TUD). Abbreviations: Q—quartz; I—illite; C—calcite; H—hematite; G—gehlenite; A—anorthite; D—diopside; W—wollastonite. Abundance: +++: abundant; ++: moderate; +: minority; –: not detected.
IDQICHGADW
EST+++++++++
LUM++++++
PAM+++++++++
TAF++++++++++++
TUD++++++++++++
Disclaimer/Publisher’s Note: The statements, opinions and data contained in all publications are solely those of the individual author(s) and contributor(s) and not of MDPI and/or the editor(s). MDPI and/or the editor(s) disclaim responsibility for any injury to people or property resulting from any ideas, methods, instructions or products referred to in the content.

