Review

Uses of Gas Sorption and Mercury Porosimetry Methods in Studies of Heritage Materials

Department of Chemical and Environmental Engineering, Faculty of Engineering, University of Nottingham, University Park, Nottingham NG7 2RD, UK
Heritage 2025, 8(4), 132; https://doi.org/10.3390/heritage8040132
Submission received: 27 February 2025 / Revised: 27 March 2025 / Accepted: 2 April 2025 / Published: 5 April 2025

Abstract

:
This review explains why pore structure characterisation, particularly utilising gas sorption and mercury porosimetry, is important for the study of many different types of heritage materials, such as for determining their raw materials, methods of fabrication, and ancient uses. It then describes the basic experimental methods, including details of particular relevance to heritage materials. Several relatively novel methods, such as gas over-condensation, scanning curves and loops, and hybrid experiments, not often used with heritage materials, are also described and their potential applications discussed. In particular, gas over-condensation can probe pores of sizes from the molecular scale to hundreds of microns in one experiment, and thus can be used to provide “fingerprints” characteristic of the internal void space of different types of ceramics or glasses to aid in identification without damaging the finds. This work also surveys the various applications of gas sorption and mercury porosimetry to ancient ceramics, glasses, and building materials, with particular discussion of uses in testing the mode of action and effectiveness of various conservation methods.

1. Introduction

Many heritage materials are porous, including ancient glass, ceramics, and building materials like stone, brick, concrete, and mortar [1]. In order to understand how they were made, how they were used, and/or how they are deteriorating with age, it is often important to determine the nature of the internal pore structure. The pores in such materials often form complex, disordered networks with voids in a size range anywhere from angstroms to hundreds of microns. Even so, complex void spaces can be characterised by descriptors like the porosity (or voidage fraction), the specific surface area, the pore size distribution, and pore connectivity, to be discussed below. As will be seen, these characteristic parameters can be correlated with other material properties, such as mechanical strength, or used to predict physico-chemical processes occurring within the void space, such as weathering due to environmental exposure. Characterisation of porous heritage materials to obtain the aforementioned descriptors is carried out using a variety of experimental techniques, but very common ones, available in many labs, are gas sorption and mercury porosimetry, which will be the subject of this work. The particular advantages and disadvantages of these two techniques will be discussed below.
It is suggested that a study of the porosity and pore structure of prehistoric ceramics will play an ever greater role in archaeological studies in the future due to the correlates between pore structure and the function of ceramics [2]. The porous structure of ceramics also affects their propensity to survive in the archaeological record. Sobott et al. [3] have suggested that ceramics can be regarded as thermally metamorphosed mud rocks, and so the same mineralogical and petrophysical analysis techniques used for rocks, like shales [4], can be used on ancient pottery and other ceramics. These types of analyses include gas sorption (GS) and mercury porosimetry (MP). The clay deposits used in ceramic manufacturing can be primary deposits, weathered in situ, or secondary redeposited sediments [2]. This results in variations of workability and physical and chemical composition of the clay. The pore structure within ceramic materials is determined by the nature of the raw material but also the physical and chemical processing in the course of drying and firing the clay paste [3]. After forming the clay vessel, it is first dried at room temperature when the water of plasticity is evaporated. During the drying process, the clay paste shrinks and undergoes a re-arrangement of its constituent particles. Further water is driven off from the clay and any temper particles, thereby creating a mass of solid particles with interstitial pores, through low-temperature firing between 100 and 200 °C. Once all of the adsorbed water has been driven off, further increases in porosity can only arise from chemical reactions in which the volume of the products is less than that of the reactants. Such reactions include the dehydroxylation of clay minerals, the decomposition of carbonates (e.g., calcite), and reactions between mineral grains. For example, the decomposition of calcite and the reaction of calcium oxide with silica to wollastonite lead to an increase in free volume of 33%, while the reaction of dolomite with silica to form diopside and carbon dioxide leads to a gain in free volume of 40%. These reactions occur over firing temperatures in the range of ~400 to 800 °C before the onset of partial melting. However, firing temperatures exceeding ~800 °C lead to reactions between anhydrous silicate phases and the formation of melt, which cause a decrease in open porosity. For example, the reaction of gehlenite and silica to wollastonite and anorthite leads to an overall volume increase of the products of 2.6%, meaning pore space is then lost. The melting that occurs above 800 °C leads to liquid phase sintering, the loss of small pores that fill with melt, and a reduction in the size of larger pores. At the very highest firing temperatures, the ceramic can become vitrified. The link between porosity and firing temperature has also been confirmed through experimental archaeology [5]. Similar relationships between firing temperature and the pore structure of clay bricks have also been found [6]. Hence, the characterisation of the pore structure using GS and MP can reveal the degree of firing of ceramics of many types. In addition, the porosity of ceramics increases with the amount of temper and with increasing fineness of the temper [2]. For example, Heimann [5] found that Roman terra signillata moulds from Germany with larger amounts of quartz temper and lower firing temperatures had greater porosity. Tempers are added to the clay paste to improve workability and tensile strength [2]. The foregoing discussion demonstrates that various processes employed in pottery and brick manufacturing of potential interest to ancient historians and technologists will leave their traces in the porous structure of archaeological material.
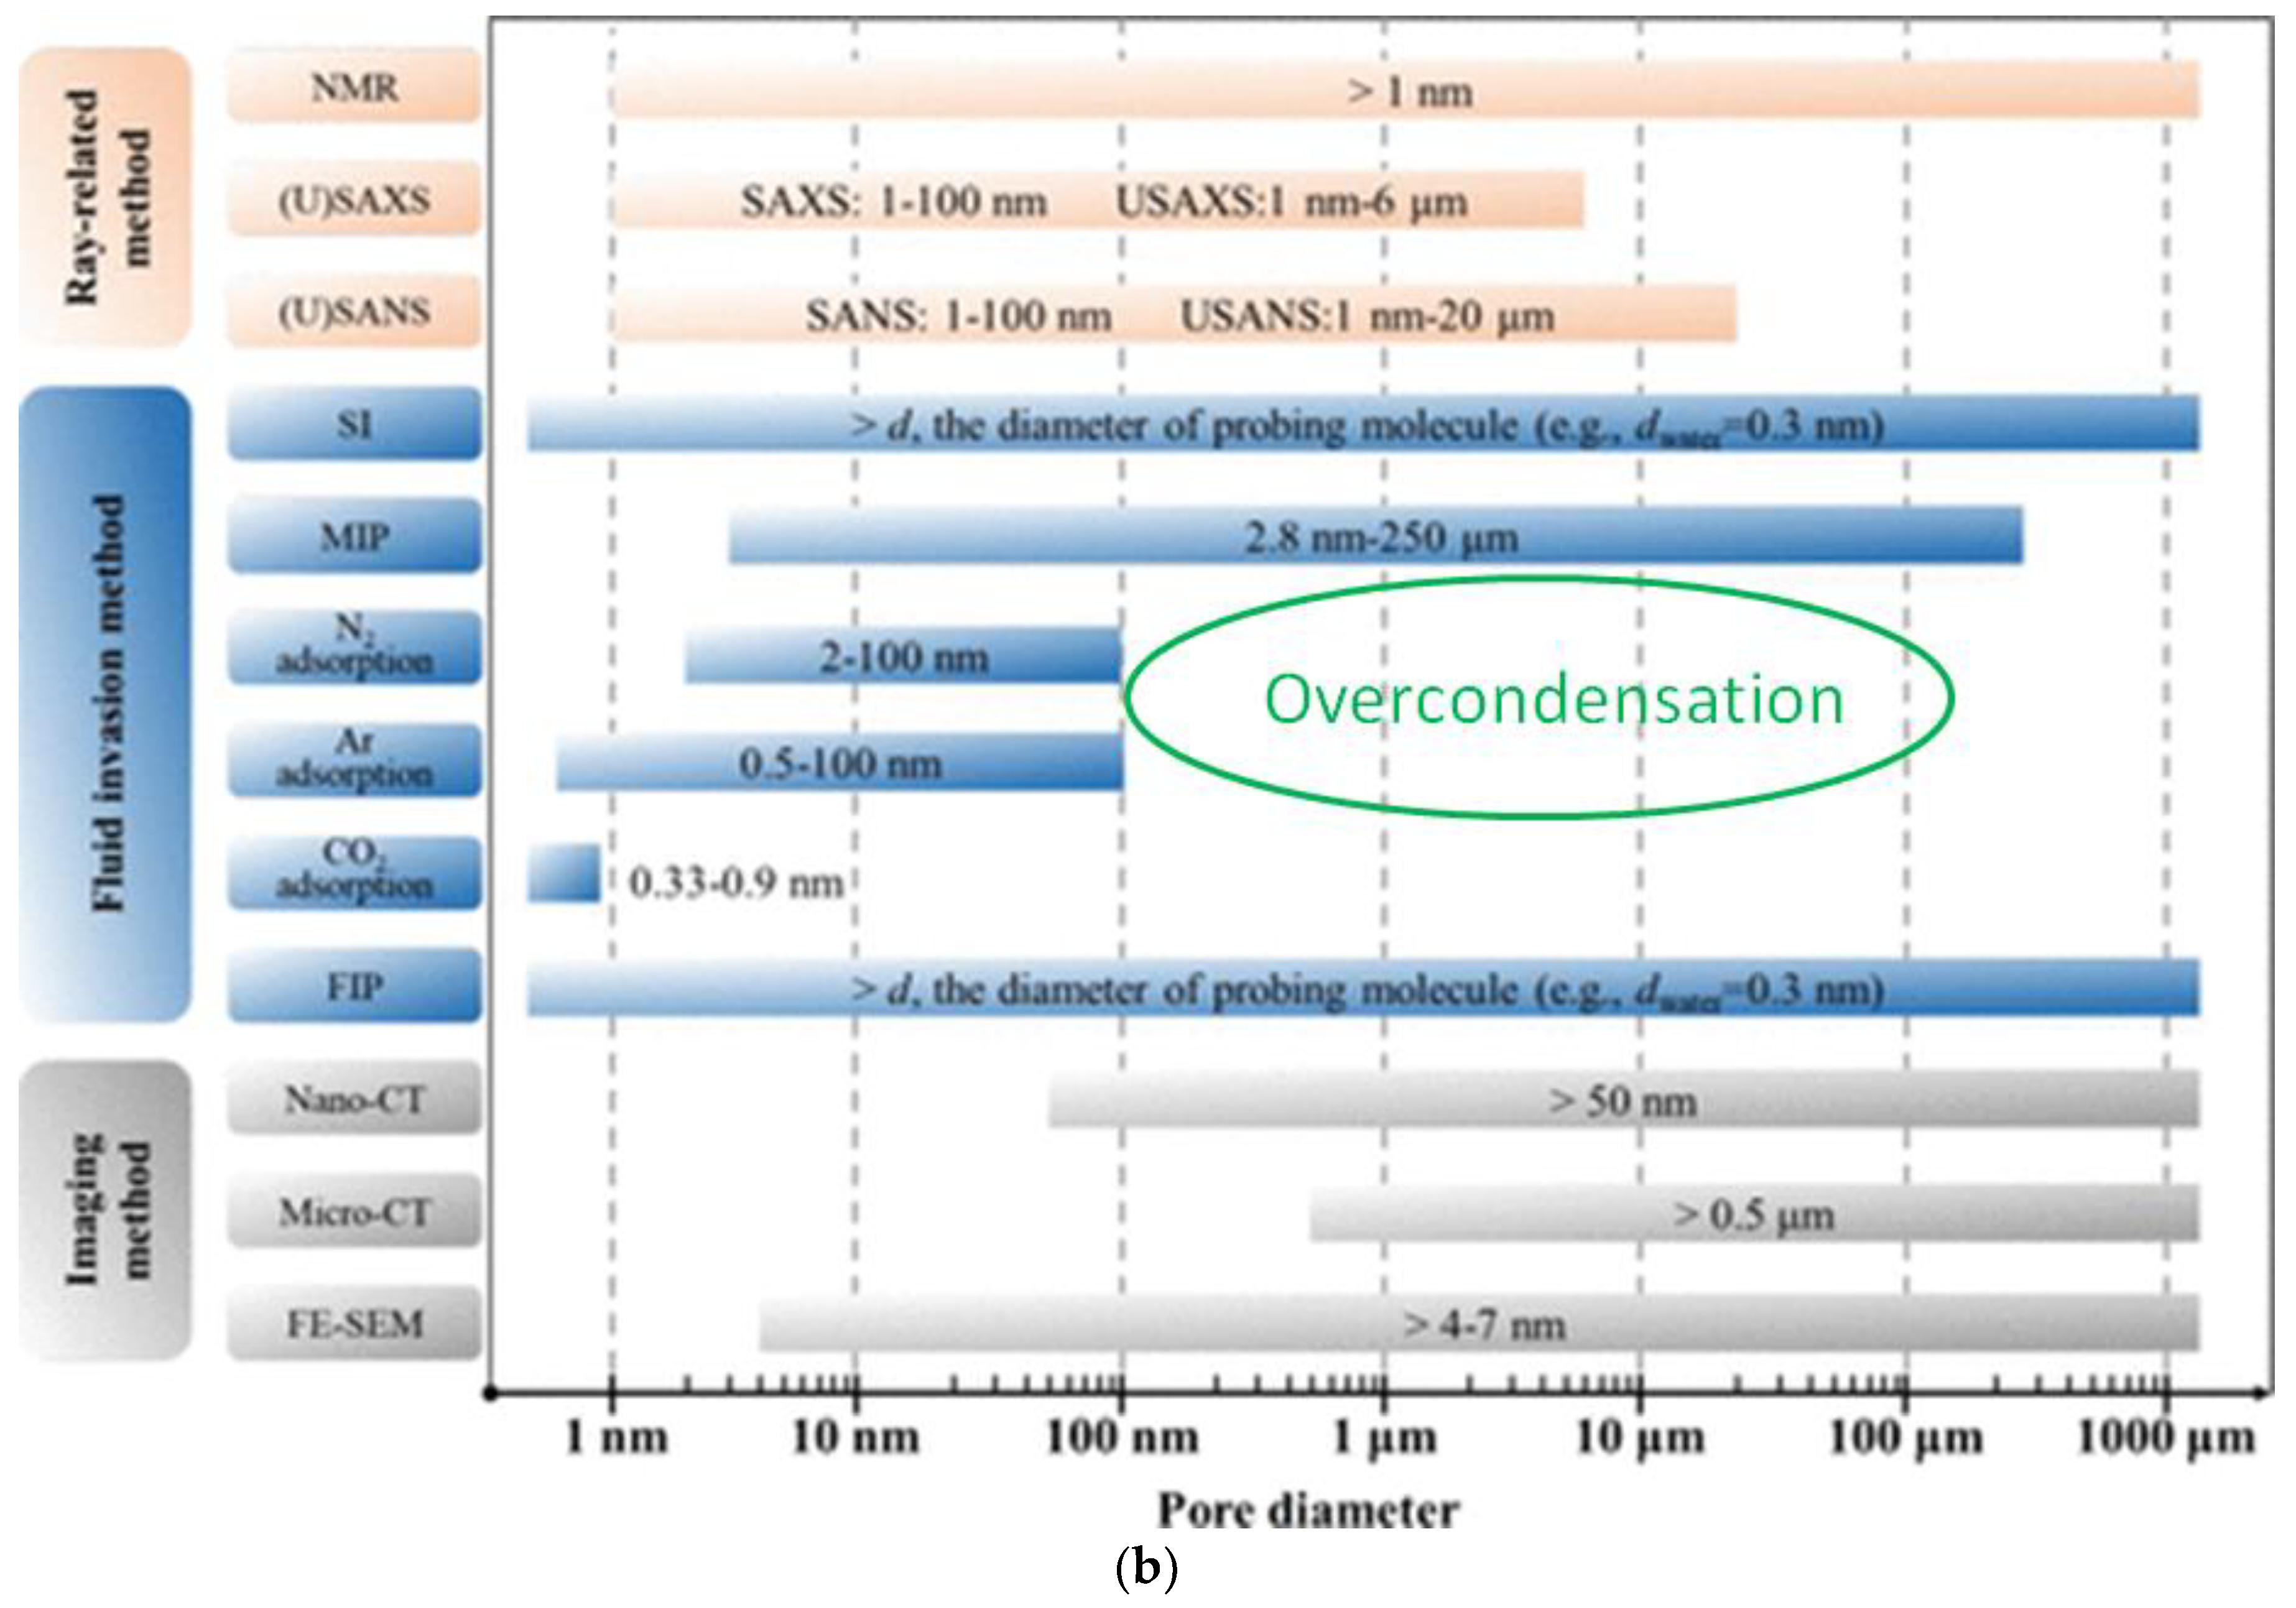
A key issue determining the power and usefulness of a given experimental pore characterisation technique is the range of different pore sizes that can be probed. Figure 1 illustrates the typical range of pore sizes that can be probed through various pore characterisation methods. The major advantage of mercury porosimetry is that, typically, a commercially available apparatus can be used to probe pore sizes from hundreds of microns down to a few nanometres all in one, relatively quick, experiment [7,8]. However, it has the disadvantage of needing potentially hazardous mercury, and it cannot probe molecular length scales. Hence, conventional gas sorption provides a complementary method that can probe pores on length scales down to the molecular and, nowadays, up to a few hundred nanometres. For samples, such as carbonate rocks, with hierarchical porosity where pore sizes can range from ~1 nm up to hundreds of microns, it was previously necessary to stitch together the data from the complementary size ranges covered by gas sorption and mercury porosimetry to obtain the full spectrum of the pore size distribution. However, while the relatively novel technique known as gas over-condensation [8,9,10] is often neglected in the literature, it can provide pore structural characterisation all the way from molecular length scales up to hundreds of microns in one single experiment, as shown in Figure 1. This is an advantage not shared by any other technique. Hence, gas sorption is more flexible and more powerful as a characterisation technique than is often supposed.
It is the purpose of this work to first introduce gas sorption and mercury porosimetry as experimental techniques in the context of the study of heritage materials. This will involve a discussion of the selection of suitable samples, including potential limitations on their applicability to different materials, sample preparation, the various types of experimental protocols, and selection of key parameters for the experiments. It will then describe how the various structural descriptors of porous media can be determined from the raw experimental data, with special consideration given to how to obtain reliable and accurate values for heritage materials. In particular, this review will consider the novel and under-used technique of gas over-condensation, which is a potential replacement for mercury intrusion that does not result in samples potentially contaminated with mercury. It will also consider experimental protocols, like scanning curves, and data analyses, like percolation theory, not currently widely used in the heritage literature. The various applications of gas sorption and mercury porosimetry to heritage materials will be surveyed to show the wide range of potential uses of the techniques. Finally, some overall conclusions regarding the uses of gas sorption and mercury porosimetry for the study of heritage materials will be drawn.

2. Methodology

2.1. Equipment

Nowadays, gas sorption (GS) and mercury porosimetry (MP) are typically conducted on commercially produced apparatus, although some researchers still use home-built volumetric gas adsorption rigs typically made from glassware. The advantage of the latter is that the state of the sample can be observed during the course of the experiment, whereas for the former this is often not possible. Home-built glassware rigs enable colour or form changes to be detected. A commercial apparatus is available for either volumetric or gravimetric gas sorption experiments. The latter is often easier to use for kinetics experiments. Mercury porosimeters are available with a range of ultimate possible pressures, but the current largest is typically 60,000 psia (~414 MPa).

2.2. Sampling

The typical size of samples for mercury porosimetry and gas sorption is ~0.1–1 g. There is a rough rule of thumb that to ensure a good enough signal-to-noise ratio, the total area for a gas sorption sample should be ~20 m2, so for a sample with an expected total specific surface area of around 200 m2g−1, then 0.1 g of material is needed [8]. The size, shape, and material of the sample holders for typical gas sorption are ~12 mm diameter round-bottomed, glass vessels. Mercury porosimetry has separate design sample tubes for powder and larger particle size (e.g., chip) samples. The sample sizes that will fit in GS and MP apparatuses are often smaller than the original form of the material under test, such as a brick. Hence, sample coring is often necessary. Coring is also used to extract samples from different depths within the body of the test material, such as when the extent of weathering or conservation treatments is under study [1].

2.3. Sample Preparation

For both GS and MP, it is necessary to remove prior adsorbed contaminants, particularly atmospheric moisture, from the interior surface of the sample to leave a clean void space. This is because such contaminants can lead to experimental errors. For example, contaminants can progressively collect at the intruding mercury meniscus in MP and change the contact angle [13], affecting perceived pore sizes. Typically, a combination of heating and vacuum extraction conditions is used to desorb contaminants. Commercial equipment manufacturers can provide degassing apparatus, such as Micromeritics (Norcross, GA, USA) VacPrepTM. For heritage materials like ceramics, the amount of residual moisture varies due to different depositional histories, and so different pre-treatment conditions are required for different samples [2]. Because it is also possible for thermal pre-treatment to damage some types of samples, when a precedent in the literature is not available and it is possible (i.e., enough material is available), it is often useful to conduct temperature programmed desorption (TPD) experiments to determine the appropriate maximum temperature that removes things like adsorbed moisture but leaves the solid phase unaltered (e.g., no sintering or decomposition). Some workers have initially tested out pre-treatment conditions and experimental protocols on modern analogues of ancient materials in order to rule out the risk of damage to heritage materials [14]. For some materials, such as those possessing surface chemical groups, such as hydroxyls, the thermal treatment can alter the number or type of surface groups. For example, thermal treatment of silica- or alumina-containing materials to temperatures above ~200 °C can start partial dehydroxylation of the surface, with temperatures up to ~900 °C leading to complete dehydroxylation of the surface. The heterogeneous surface chemistry produced by partial dehydroxylation can lead to errors in the specific surface area obtained from the analysis of nitrogen adsorption isotherms using the standard Brunauer–Emmett–Teller (BET) model [15] due to the assumptions of the model, as will be discussed in Section 2.6.1. In some microporous materials, particularly building materials containing swelling clays. such as smectite, moisture can be trapped between the silicate layers within the clay. In such materials, progressively more intensive thermal treatments can partially remove ever more moisture, leading to the opening up of larger fractions of microporosity to access to probe adsorbate with increasing treatment temperatures [16]. However, it is sometimes not possible to find a set of pre-treatment conditions that will successfully drive off all adsorbed moisture but leave the solid unaltered. In such circumstances, it is often better to leave the moisture behind in the micropores and use nitrogen adsorption at 77 K to probe the remaining meso- and macro-porosity, as the micropore water is then frozen in place for the adsorption experiment itself [16]. Volzone and Zagorodny [17] suggested that adsorption using water vapour as the probe adsorbate was not suitable for pottery that has not been fired to high temperatures because then the clay minerals will interact with the adsorbing water. Complementary methods, such as nuclear magnetic resonance (NMR), can be used to probe the micropore volume using the in-situ moisture as the probe [18]. For other contaminants not easily removed through thermal and/or vacuum treatment, then a washing or solvent extraction process may work. For example, a dilute solution of hydrogen peroxide is often used to remove organic residues from oxide materials. In the forthcoming discussions of individual studies from the literature, the specific details of the collection and preparation of individual samples can be found in the relevant quoted references, unless particularly relevant to the discussion.

2.4. Experiment Protocols and Parameters

2.4.1. Basic Experiment

The GS technique is based on the physical principle that even at low pressures, molecules from the gas phase will tend to adhere to a solid surface through intermolecular forces in a process known as physisorption, and that within confined geometries, at a sufficiently high vapour pressure, a phase transition from gas to liquid, similar to dew formation, will occur at pressures below the normal saturated vapour pressure needed for condensation on flat surfaces from the bulk gas phase [8]. Mercury porosimetry is based on the fact that mercury is a non-wetting fluid for most surfaces, and thus external work must be performed by applying increased hydrostatic pressure to force it to enter confined geometries like pores.
In GS and MP experiments, international standards, such as the ISO Brunauer–Emmett–Teller (BET) method (BS ISO 9277:2010) [19] and ASTM D4404-18 [20] for MP, are often used. However, these standards may not be appropriate for some heritage materials for reasons that will be described below. The standard experiments for GS and MP are very similar. The control variable, namely, the pressure of adsorbate gas or the hydrostatic pressure of mercury, is increased progressively in small steps, and the amount of adsorbate adsorbing or mercury intruding into the sample is recorded. For GS, the set of pairs of amounts of gas adsorbed on the sample for each vapour pressure reached is known as the “adsorption isotherm”, as the experiment is conducted at a constant temperature. The typical number of data points in a given dataset will be evident in the examples of data shown below. Once the ultimate, maximum pressure is obtained, the pressure is then decremented in small steps to obtain the desorption isotherm or the extrusion curve for GS or MP, respectively. This basic experiment, if the ultimate, maximum pressure leads to complete filling of the exterior accessible void space with either adsorbate or mercury, leads to the extremal data, known as the boundary curves. This is because these data tend to have the maximum height and breadth for the envelope of the pressure or amount adsorbed/intruded possible for a given sample.
There are some key parameters that control the nature of the experiment. In both GS and MP, each time the pressure is changed, it is necessary to wait a particular (equilibration) time to ensure that the system achieves equilibrium [8]. This requires that sufficient time be allowed for the gas to diffuse or the mercury to flow into or out of (in pressure decrements) the void space and the new equilibrium distribution of the probe fluid to be obtained. If the equilibration time is too short, the next pressure change will occur before all fluid displacement has stopped, and thus the isotherm or the porosimetry curve will not be properly equilibrated. This can lead to inaccuracies in the parameters obtained from such a curve, because, as will be seen, most analysis methods use theories that assume that the experimental data are for the equilibrium state.
For gas sorption, the lack of proper equilibration of the isotherm can manifest, for some adsorbates like nitrogen and argon, in the lack of closure of the hysteresis between adsorption and desorption isotherms below a relative pressure of ~0.4–0.5, depending on the adsorbate [8]. In MP, the lack of proper equilibration manifests itself in shifts in the position and shape of the intrusion and extrusion curves with equilibration time. Typical equilibration times for nitrogen GS of mesoporous materials are ~5–15 s, but it can take much longer for microporous materials. Typical equilibration times for MP are ~10–30 s, although, again, it can take much longer, even up to 100–150 s on retraction. The length of the equilibration time affects the total experiment time, but the latter is typically several hours for full curves up to the maximum possible pressure, but it can be much quicker if only, say, a few low-pressure data points for a specific surface area are needed from GS.
Where the amount of low pressure hysteresis between sorption isotherms does not decrease with increased equilibration time, then chemisorption may be occurring, particularly for potentially reactive adsorbates like water. Residual hysteresis can be retained even when the vapour pressure is reduced back to near zero if the adsorbate has chemically reacted with the surface under testing. For example, it was found that water underwent a rehydroxylation reaction with the surface of a fire-damaged parchment from an old manuscript [21].
When the ultimate maximum pressure is reached in a mercury porosimetry experiment and the direction of the pressure steps is reversed, the retraction curve does not typically follow the intrusion curve, and hysteresis results. When the pressure is reduced back down to atmospheric pressure, some mercury may be retained in the sample, which is known as entrapment. The so-called irreversible contamination of the sample with mercury means that it is often thought that the sample has to be sacrificed when mercury porosimetry is used, and so the amount or number of heritage materials studied with mercury porosimetry is often restricted [14,22]. For example, of the twenty lime-based mortars studied by Rispoli et al. [23], only three were subjected to mercury porosimetry due to the scarcity of the available material. However, it is sometimes possible to remove entrapped mercury through immersion in water, as the wetting water expels the entrapped, non-wetting mercury from the sample [24]. Hence, the sample is not always “…convert[ed]…into toxic waste”, as is sometimes claimed [3]. Furthermore, the gas over-condensation technique described below can obtain the same information as the mercury intrusion curve but leaves no probe fluid behind afterwards.
Experimental error in the basic GS and MP experiments results from the levels of precision and accuracy possible for the measurements of the individual pressure step values and the amount of probe fluid entering or leaving the sample at each step. However, for the commercial apparatus commonly used to run GS or MP experiments nowadays, the measurement errors in these variables are generally small, with, for example, GS pressure transducer accuracy typically being 0.12–0.15%. Errors can also arise from temperature variations during the course of the experiment, but, typically, commercial GS apparatuses can maintain temperatures constant to ±0.05 K. The main source of experimental uncertainty arises from inter-sample variability due to heterogeneity in pore space parameters, like the specific pore volume, between samples. However, many heritage material samples are unique, so repetitions using different samples of the same material to obviate this problem are often not possible.
The key safety risks of the use of mercury, as will be detailed in material hazard data sheets, come from acute inhalation toxicity, and mercury causes damage to organs through prolonged or repeated exposure. Proper disposal of mercury-contaminated wastes is required.

2.4.2. Scanning Curves (SCs) and Scanning Loops (SL)

Both GS and MP have a greater potential repertoire of experiments than just the basic ones described above, but these have hardly ever been used in studies of heritage materials. Rather than adsorb gas or intrude mercury up to the maximum possible with the apparatus used, it is also possible to perform a series of experiments that each halts the pressure increments at a lower ultimate pressure and then starts the pressure decrements back down to atmospheric pressure or lower. This type of experiment is called a descending scanning curve. The main aspect of the results of interest in a scanning curve experiment is the form of the desorption isotherm or the mercury retraction curve in GS or MP, respectively. It is also possible to perform what is known as an ascending scanning curve, where the same pattern as the basic experiment is followed until one reaches a desired position part way down the desorption isotherm or mercury retraction curve, and then the direction of pressure changes is reversed once more and the pressure begins to be incremented again back up to the ultimate maximum. A common use of an ascending scanning curve in mercury porosimetry is the re-intrusion test for potential mechanical damage to the sample due to the high pressures (of ~60,000 psia/~414 MPa) often used in mercury porosimetry experiments [13]. In general, mechanical damage arises for highly porous samples or materials with weak material strength. Possible mechanical damage has been suggested as the reason for discrepancies between void space descriptors measured through different methods, including MP, such as the porosity of mortars [25]. The re-intrusion test checks that the second mercury intrusion (i.e., the ascending scanning curve) follows the same path as the initial intrusion. This is because any mechanical damage arising during the initial intrusion, such as structural collapse of some pores, is likely to lead to a change in the nature of the void space, which would manifest as a change in the shape of the re-intrusion curve. It is also possible for mechanical collapse of materials to manifest as a particular shape/form of the initial mercury intrusion curve itself, as will be discussed in Section 2.6.2 below.
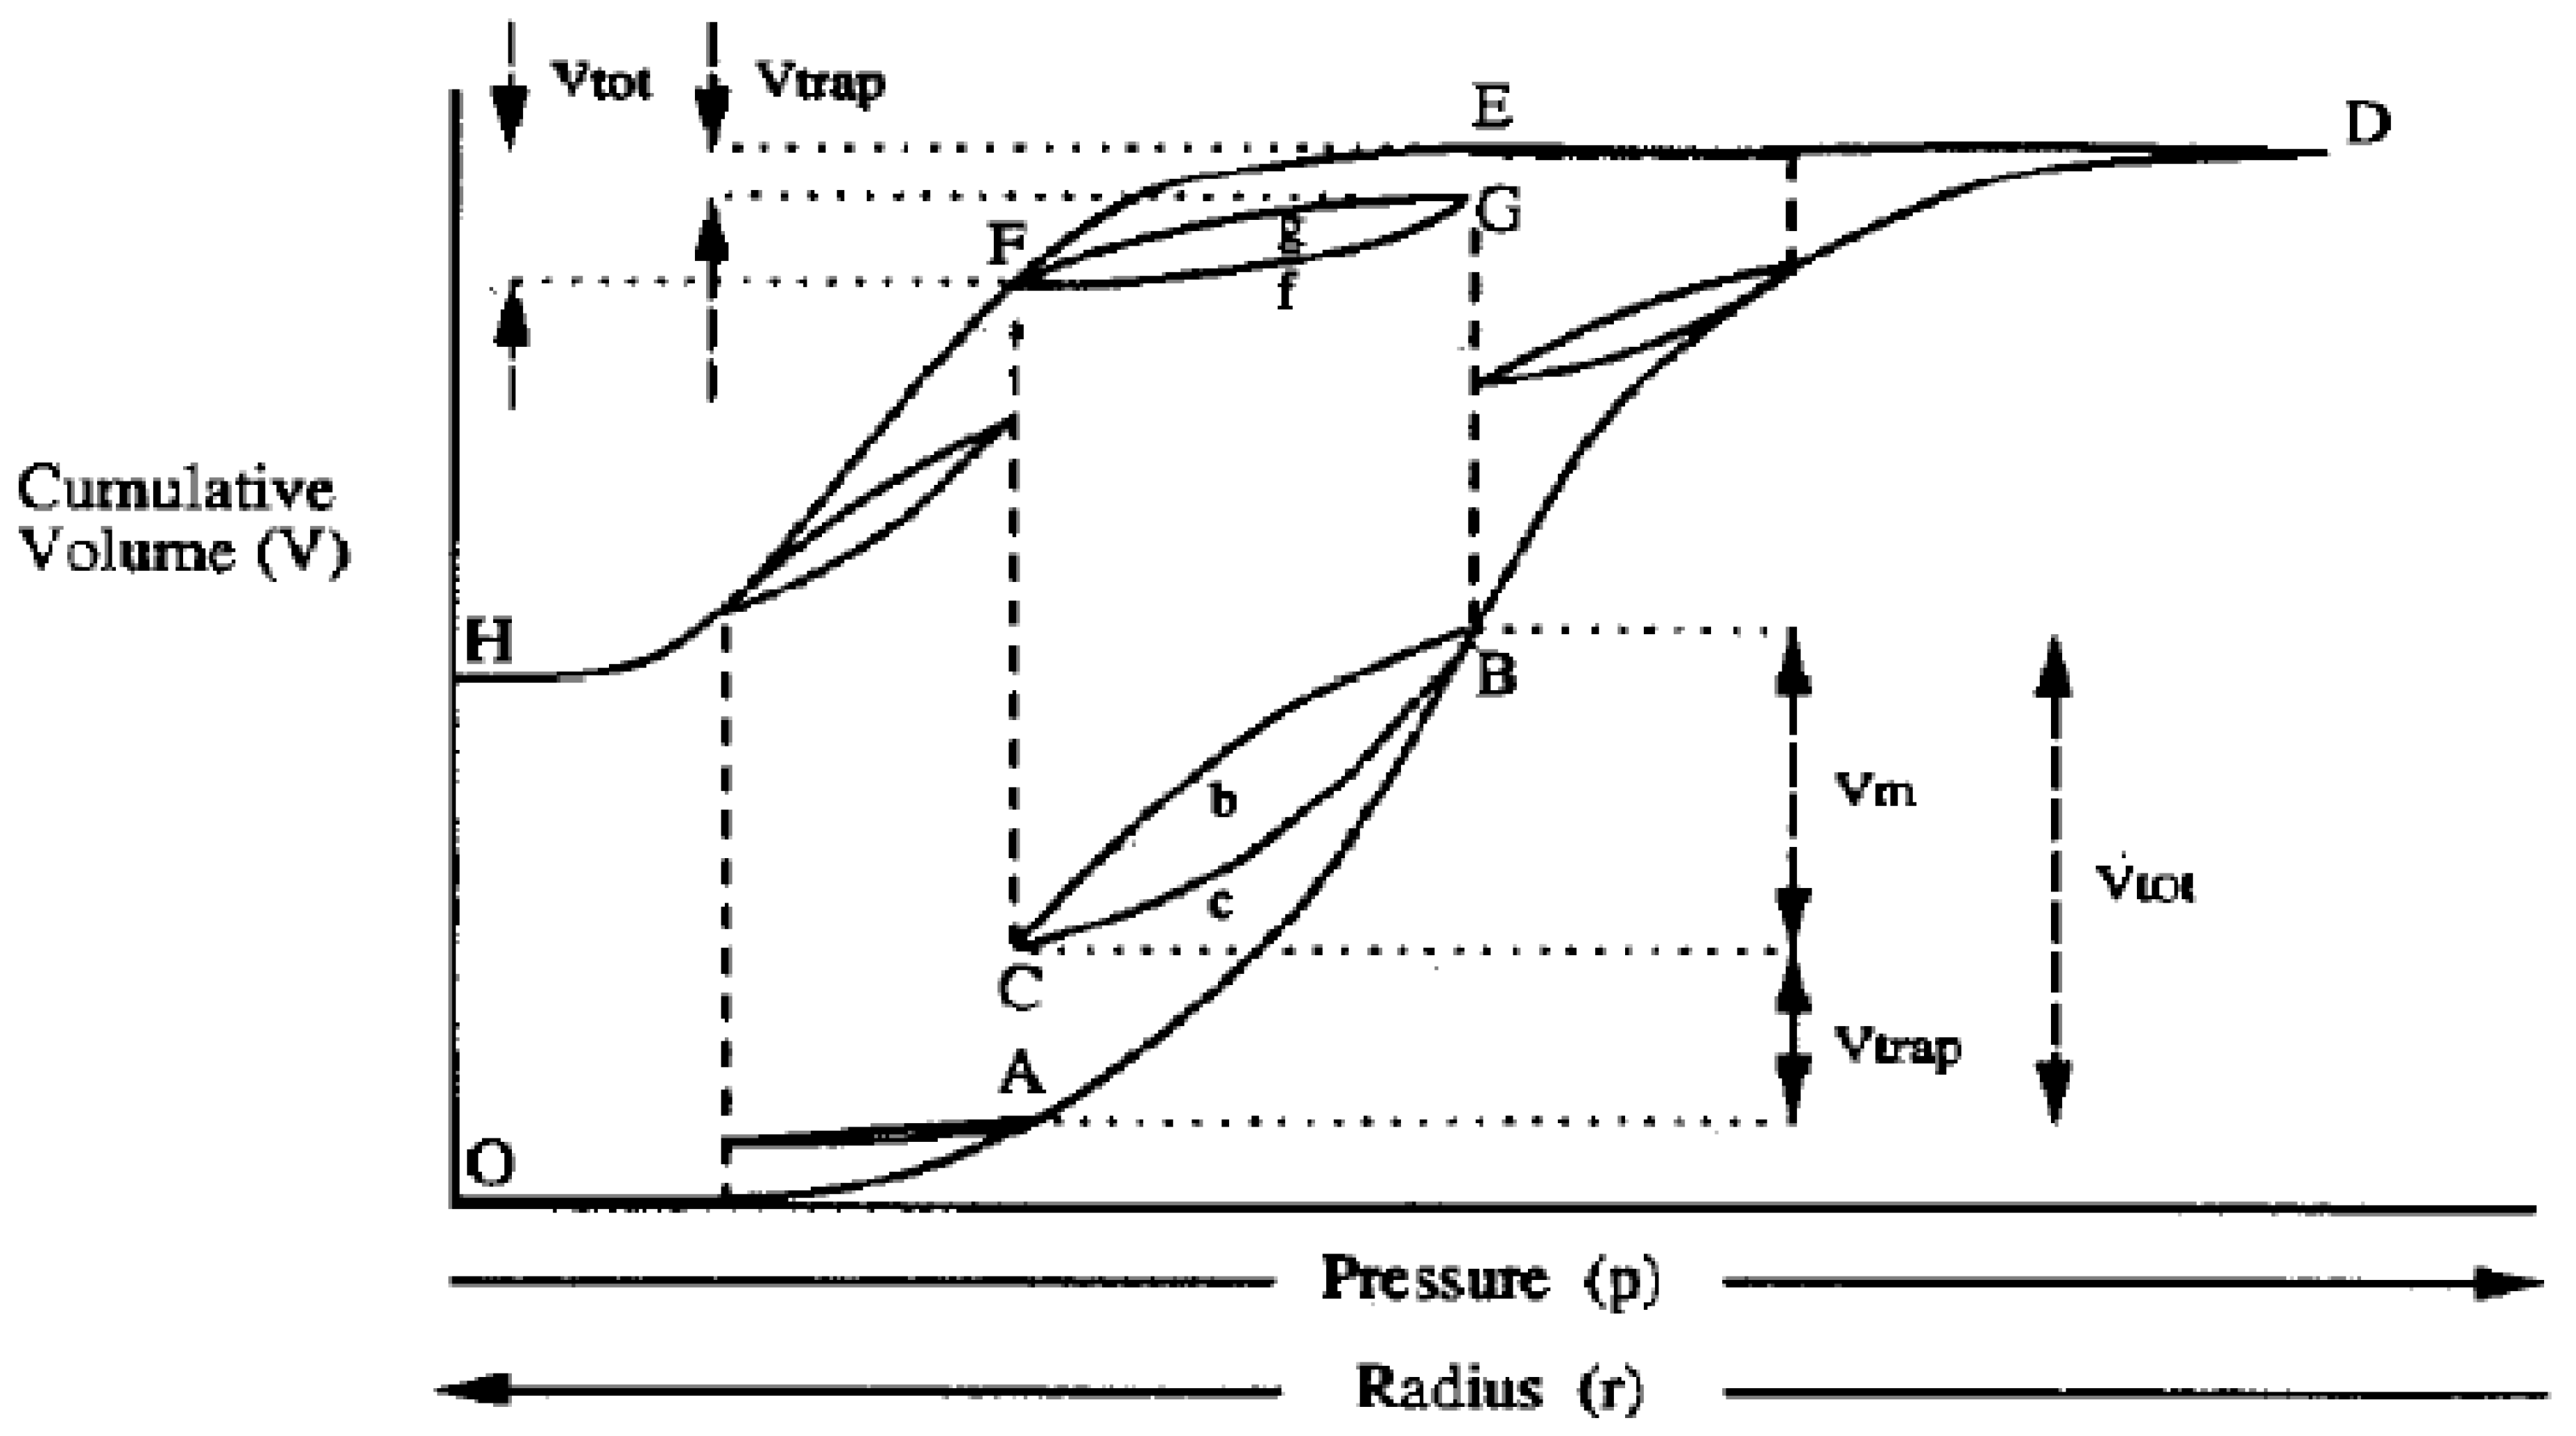
A more complex form of the scanning curve experiment is the scanning loop [26,27]. In this case, the direction of pressure variation is changed up to three times, depending on where along the boundary curves the loop is required. On the ascending boundary curve, the direction of pressure variation is changed once part way up that curve and again part way down the descending scanning curve to produce an ascending scanning curve that tends to rejoin the point of initial departure from the boundary to form a loop, as shown for MP in Figure 2. Scanning loops can also be formed on the descending boundary curve by changing the direction of pressure variation three times before reaching either the maximum or minimum possible pressures, as seen in Figure 2. The potential applications of SCs and SLs will be discussed below in Section 2.4.3 and Section 2.6.3.

2.4.3. Over-Condensation (OC)

It is often claimed in the literature that it is only possible to measure micro- to mesopores, and not macropores, with gas sorption [28], but all pores, from micropores to macropores, can be measured if the over-condensation (OC) technique is used. Hence, one technique can cover this whole range, in contrast to what is frequently asserted in the heritage literature [3]. The experimental procedure for performing OC was first described by Auckett and Jessop [9], and, thereafter, by Murray et al. [10], and more details are given therein. The OC technique involves the sample chamber being flooded with condensed liquid nitrogen to completely immerse the sample therein in order to fill any macroporosity beyond the typical upper limit (P/P0 > 0.995) for the conventional experiment. To do this, a single adsorption relative pressure point of 1.0 is assigned within the instrument pressure table, followed by relative pressure points for the desorption, which match those of the “normal” isotherm. Operator intervention is required when P/P0 = 1.0 is being targeted. When measuring the full adsorption isotherm, it is difficult to time when this happens, so the adsorption data, which are usually collected during a “normal” isotherm, are omitted. The time taken to reach saturation can be many hours, as the instrument can only dose in small amounts at a time. Eventually, the instrument will “time out”, leading to automatic termination of the analysis. To avoid this happening, the analysis run is suspended, and the operator needs to take manual control. The instrument valves are configured to allow nitrogen gas to flow into the sample tube, and the dewar is periodically lowered to check when the sample is fully submerged in liquid nitrogen and then immediately raised again. After the sample has been fully submerged in liquid nitrogen and total pore filling has occurred, the pressure in the sample tube is decreased to just below the saturated vapour pressure of nitrogen in order for the bulk condensate located outside of the sample to be vapourised completely but also to ensure that all of the internal porosity of the sample remains completely full of liquid. Upon achieving this state, the first data point on the over-condensation desorption isotherm can then be obtained. This point reflects the total pore volume of the sample. The pressure is then progressively decreased in small steps, and the rest of the desorption isotherm can be obtained in the usual way. Due to the underlying similarities in the techniques, the same limitations for cultural heritage samples apply to the OC method as apply to conventional gas sorption.
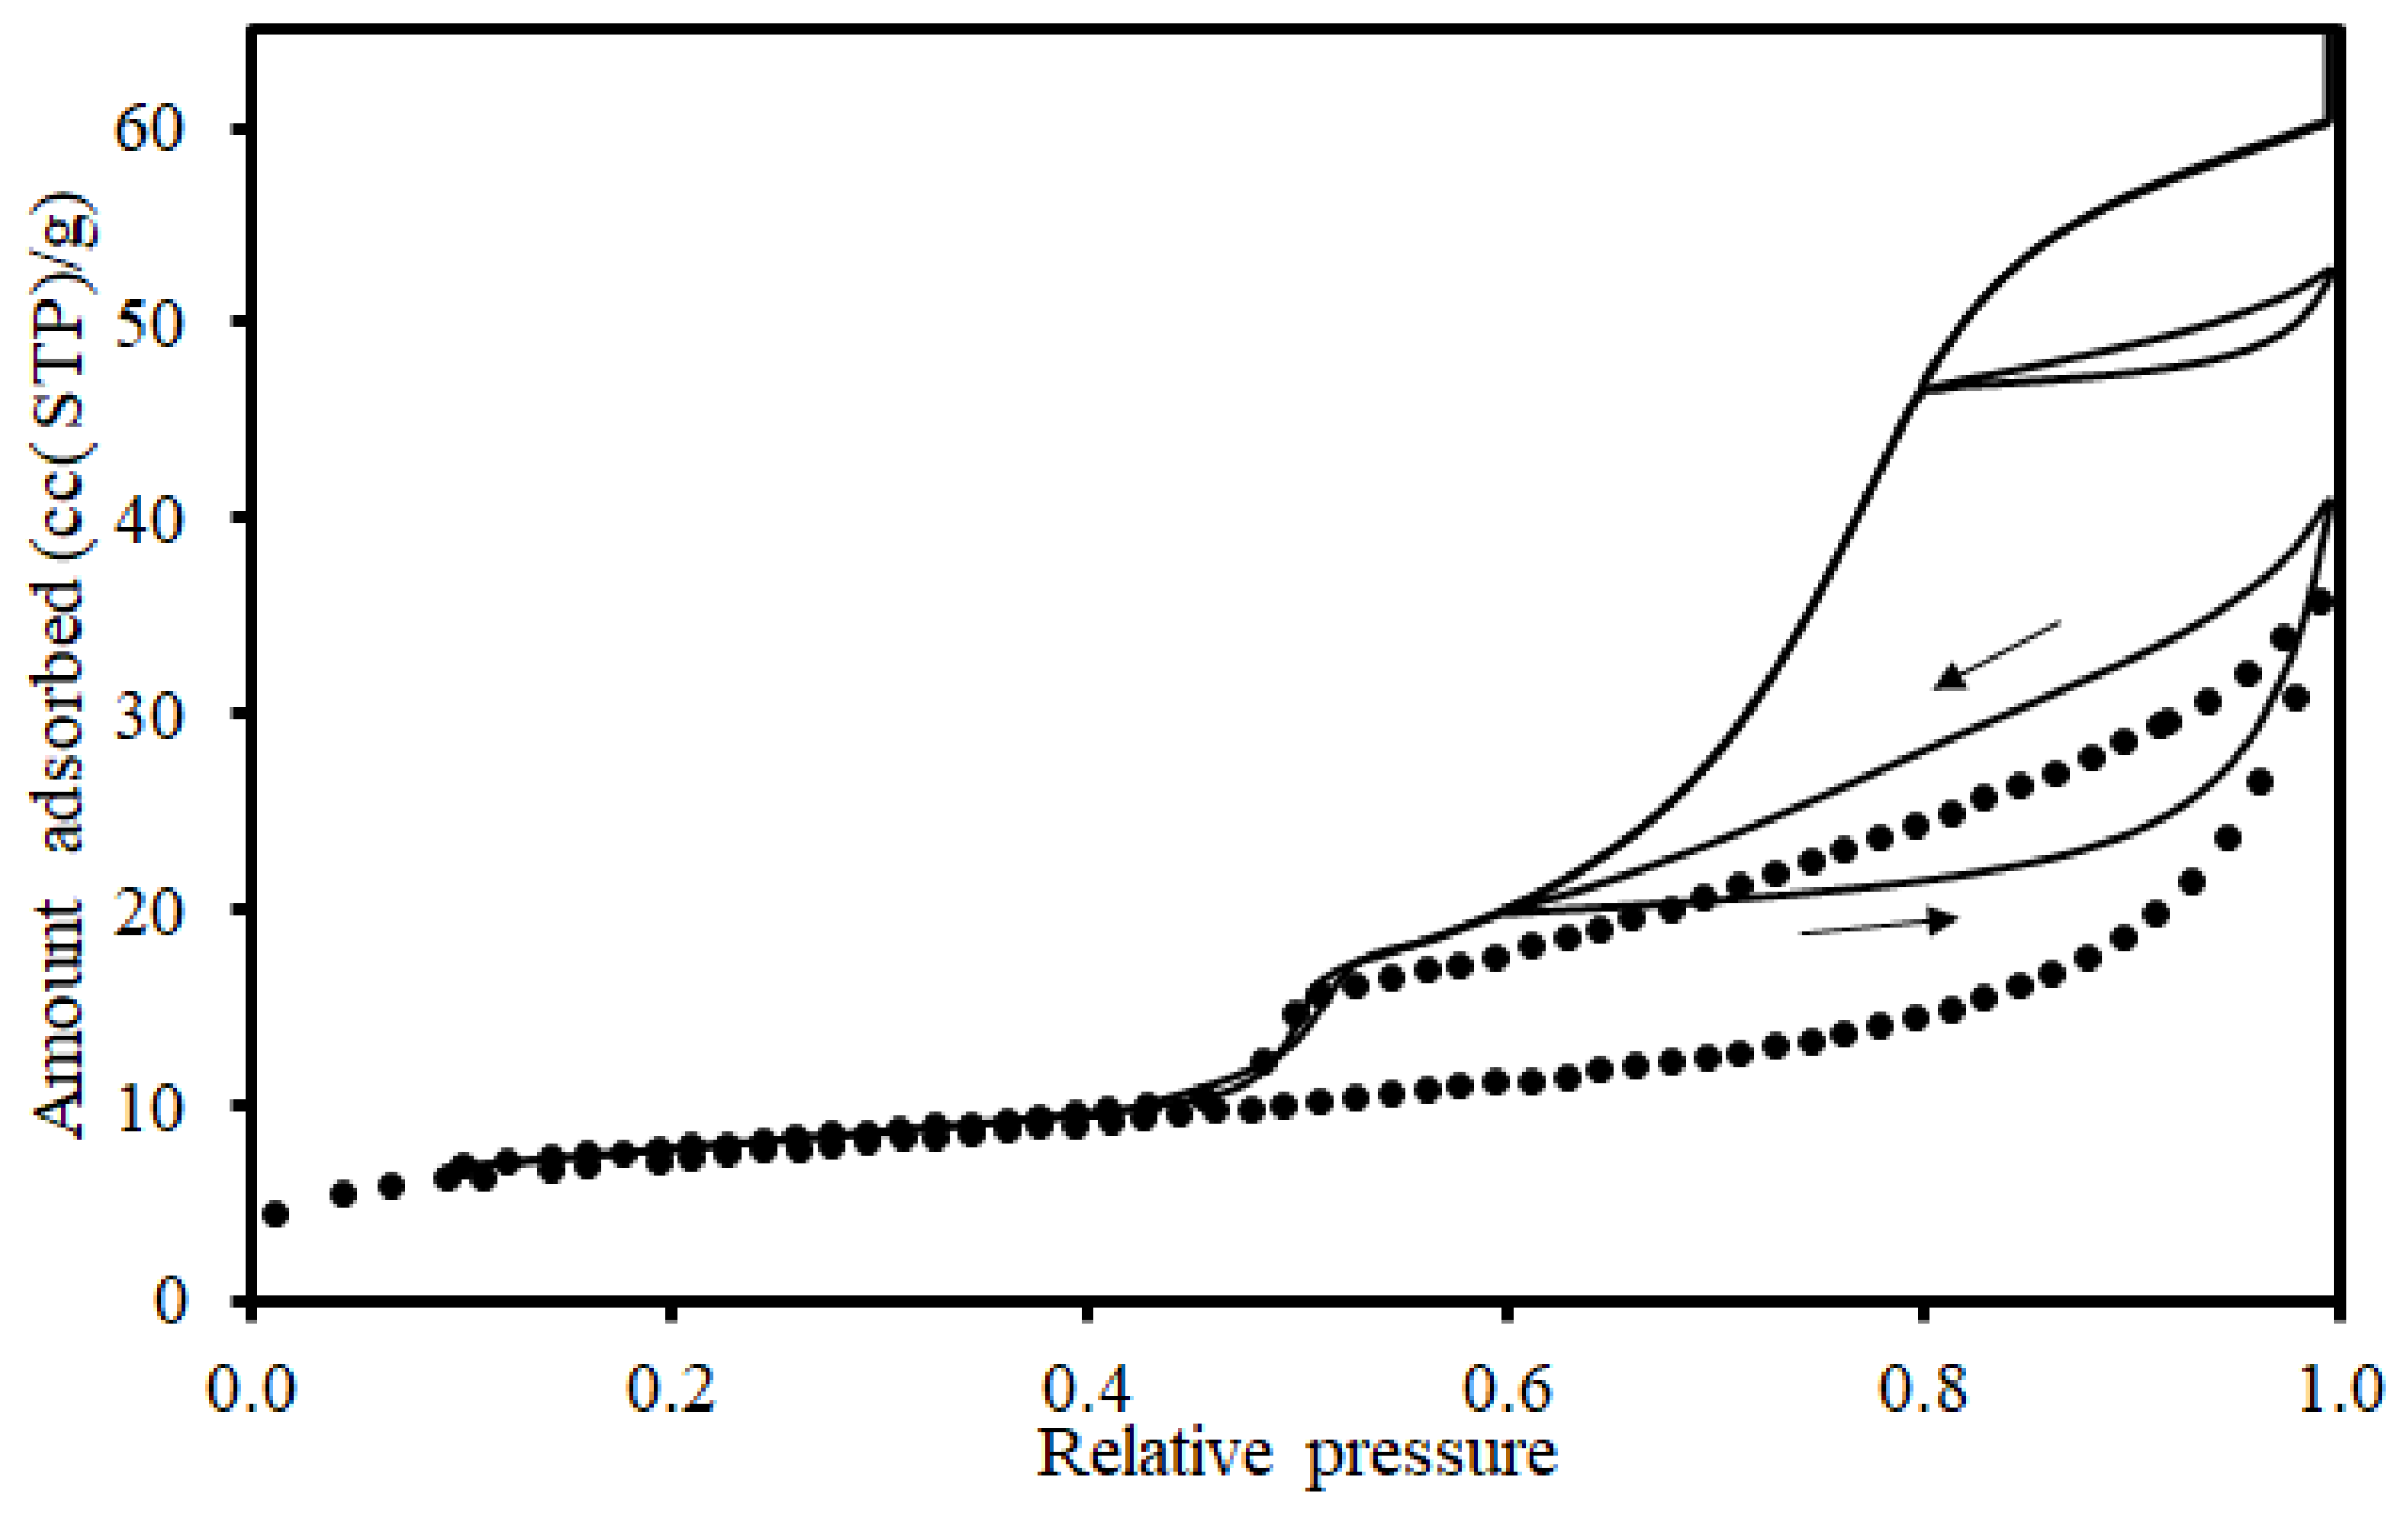
Conventional nitrogen sorption experiments on heritage materials, such as ancient bricks [29] and bone [30], often have the form shown in Figure 3. For a mud rock dominated by clay [26], where the high uptake region of the adsorption isotherm at the conventional high-pressure limit (e.g., a relative pressure of 0.991 in the aforementioned study of ancient bricks) is still near vertical (hyperbolic form), desorption starts immediately upon commencement of reversing the direction of pressure steps. This shows that the biggest pores have not been filled with condensate at top of the isotherm. Hence, the PSD for materials obtained from such a shaped isotherm, like that for ancient putty from Nanjing, China [31], will be missing the larger pores. The shape of the hysteresis loop in such a case is typically classified as Type B (in the de Boer classification [32]) or H3/H4 (in the IUPAC scheme [33]). Based on proposals from previous authors, such as Gregg and Sing [34], this particular shape of hysteresis loop has frequently been suggested to indicate the presence of slit-shaped pores in heritage materials, such as ancient bone [30]. However, as the OC data for the same sample, also shown in Figure 3, show, this supposition would be mistaken. The OC data reveal the true form of the full hysteresis loop and show that it is very different. The full loop, composed of actual boundary curves, is much wider, and the top of the desorption isotherm is more horizontal. The conventional desorption isotherm is, thence, shown to be only a mere scanning curve, and, therefore, much of the porosity present in the sample has been missed in the conventional experiment. Besides obtaining the full boundary desorption isotherm in OC experiments, it is also possible to produce ascending scanning curves up from that OC desorption isotherm in order to probe regions within the hysteresis loop that have higher uptake than possible with the conventional adsorption experiment. This can be seen in Figure 3, where the ascending scanning curve commencing at a relative pressure of 0.6 can reach amounts adsorbed, at the highest relative pressures, in excess of that obtained on the conventional adsorption isotherm. This is possible because of the operation of the advanced condensation effect [8,35]. Because the over-condensation process means that all pores are filled at the top of the isotherm, at a point part way down it, the residual saturation remaining there can occupy pores not even filled at the top of the conventional adsorption isotherm. Furthermore, these additional filled pores can facilitate further filling on the adsorption branch via the advanced adsorption effect [8,26]. If such an effect is present, it allows for inferences regarding the relative spatial juxtaposition of pores of different sizes across the material to be made. Scanning curves and loops can, thence, be employed to assess pore connectivity [8].
Due to both gas desorption and mercury intrusion being invasion percolation processes, they can obtain the equivalent information about a porous solid. Hence, OC can potentially be used to calibrate the PSD from mercury porosimetry (see below, Section 2.6.2). Furthermore, because gas sorption can probe micropores, then the OC gas desorption isotherm contains information for a much wider range of pore sizes, from 100s microns to angstroms, than is possible with any other single technique.

2.5. Hybrid Experiments

Because nitrogen sorption experiments are typically carried out at 77 K and this is below the usual freezing point of mercury of 234 K, nitrogen sorption experiments can be carried out in series both before and after an MP experiment on the same sample because any mercury that becomes entrapped will be frozen solid before the second GS experiment. The details of this sort of experiment, and its potential applications, are detailed elsewhere [8]. However, this experiment can be used to obtain void space descriptors, such as the pore length and the spatial distribution of different pore sizes. MP can also be combined with computerised X-ray tomography to image the location of entrapped mercury for a range of applications discussed in more detail elsewhere [8], but this can include mapping larger pores shielded by smaller pores. Because gas over-condensation bridges the widest range of length scales possible with any single pore characterisation technique, it can be used to develop upscaling methods for use with imaging methods with different resolutions [8].

2.6. Data Analysis

2.6.1. Specific Surface Area

The multi-layer build-up region of a gas adsorption isotherm can be used to determine the specific surface area through analysis using a model like that of Brunauer–Emmett–Teller (BET) [36]. The physical derivation of the BET model is discussed in more detail elsewhere [34]. The raw isotherm data, consisting of the amount adsorbed (V) against the relative pressure (x), is transformed to the BET plot such that
x V 1 x = 1 V m C + C 1 V m C x
where Vm is the monolayer capacity and C is the BET constant. The range of relative pressures from the isotherm data fitted to the model, and the quality of fit, can significantly affect the values of these parameters obtained, and, thus, the range and quality of fit parameters (e.g., coefficient of determination) should be quoted but seldom are in the heritage materials literature. The BET constant is related to the heat of adsorption. The monolayer capacity (in molecules per gram of solid), which is the number of molecules required to completely carpet the pores in a layer just one molecule thick, can be converted into an area using a value for the cross-sectional area (csa) of a single molecule. The csa is often derived assuming that the adsorbed state and, thence, molecular packing, are the same as that for the normal adsorbate liquid at the isotherm temperature and is therefore obtained by taking the 2/3-root of a single molecular volume (itself obtained from the molar density of the liquid). The adsorbates most commonly used for surface area determination are nitrogen and argon. However, nitrogen is not recommended for low surface area materials with BET surface areas below ~10 m2g−1 due to poor accuracy. Such low surface areas arise in several types of heritage materials, such as ancient bricks [29]. Krypton is the recommended alternative adsorbate for low surface area materials [34].
However, the BET model (and the alternative Langmuir model, too [34]) makes a number of assumptions that may not apply to heritage materials. It is, first, assumed that the surface is homogeneous, such that all adsorption sites have the same heat of adsorption. This latter assumption may not hold because many heritage materials are chemically complex and thus are perceived as heterogeneous surfaces by even the commonly used adsorbates, such as nitrogen and argon, because the former has a permanent quadrupole moment while the latter has high polarizability [34]. This means that if the surface has regions covered by polar groups, such as hydroxyls, surrounded by a remainder denuded of these groups, then the supposedly non-specific adsorbates nitrogen and argon can be preferentially adsorbed on the polar hydroxyl sites, thereby making the surface area appear smaller than it actually is. This effect has been explicitly observed for nitrogen adsorption on silica [15]. The impact of surface chemical heterogeneity on the measured specific surface area can be reduced by using the homotattic (isoenergetic) patch model, which considers the surface to consist of a patchwork of zones of adsorption sites of differing heats of adsorption [8,37], such that
V = V m p 1 I 1 + p 2 I 2 + + p i I i +
where Ii is the isotherm equation describing adsorption on the ith patch and pi is the fraction of the surface occupied by patches of type Ii, such that the various pi-values obey
p 1 + p 2 + + p i + = 1
For example, the ISO BET method was found to severely underestimate the specific surface areas of various types of ancient glass compared with an analysis of the same raw experimental data using the homotattic patch model [38].
The second main assumption of the BET model is that the surface is flat, such that the apparent surface area is independent of adsorbate size. However, comparisons of specific surface areas obtained using different adsorbates often show discrepancies, even when uncertainties in the measurements of the individual csas are taken into account [24]. This is because the surfaces of heritage materials are often rough, and this results in a molecular sieving effect whereby larger molecules cannot enter the smallest surface indentations and thus miss their surface areas out of the apparent measured total. However, even when using just a single adsorbate, the impact of surface roughness can still be detected through its concomitant influence on multi-layer build-up. On rough surfaces, the total number of available adsorption sites declines with each successive adsorbate layer. If the surface roughness is also fractal in character, such that it is self-similar over increasing length-scales, then this manifests as a power law relation for the decline in the number of adsorption sites with layer thickness that can be incorporated into the BET model to give a fractal BET equation [39]:
l o g V = l o g V m + l o g C x 1 x + C x 3 D l o g 1 x
where D is the surface fractal dimension. The surface fractal dimension characterises the degree of surface roughness, with a flat surface taking a value of 2, while a very highly rugged surface would have a value of 3. The particular value of the surface fractal dimension can be a characteristic “fingerprint” of a specific type of surface or the result of roughening due to a certain type of weathering/erosion due to environmental exposure. For example, different sets of fractal dimensions were found to be characteristic of certain Bronze Age glasses compared to Roman glasses [38].
An alternative model for multi-layer film build-up, including on rough fractal surfaces, is the Frenkel–Halsey–Hill (FHH) equation, such that [15,40]:
l n V V m = K + S l n l n P 0 P
where the parameter S depends on the surface fractal dimension and the mechanism of adsorption. For systems where the adsorbate film surface tension dominates, typically in the upper part of an isotherm, then S = D − 3. The FHH model has been used to determine the surface fractal dimension of Spanish carbonate rocks used as replacements for decayed historical material [41]. A higher fractal dimension was associated with more extensive and complex microporosity, which also made the rock more susceptible to environmentally induced decay.
The specific surface area can also be used as an indirect measure of the particle size distribution for porous materials consisting of aggregates/packings where the constituent particles are liable to damage by, or reaction with, the water used in other methods of particle sizing [42]. If the total pore volume is also known, such as from the Gurvitsch volume from the top of a gas adsorption isotherm [34], and the porous material is considered to consist of a particular particle packing (e.g., hexagonal close packing) with a known surface area-to-volume ratio, an average (characteristic) particle size can be determined.
The specific surface area can also be obtained from mercury porosimetry, but only via the pore size distribution (PSD). This descriptor will be discussed in the next section. Since mercury intrusion is often affected by pore shielding (i.e., the “ink-bottle” effect), the surface area from it is often larger than that from BET analysis of gas adsorption [8]. However, the size of this discrepancy can be used to assess the level of pore shielding present in the mercury intrusion data and thus the degree of skew in the PSD towards the smaller necks doing the shielding.

2.6.2. Pore Size Distribution (PSD)

Following multi-layer build-up, the capillary condensation region of a gas sorption isotherm can be used to determine the pore size distribution. This is because the critical pressure at which a pore fills with, or empties of, condensate depends on the pore size. For pores where the condensate can be treated as a continuum fluid with constant physical properties that differ substantially from the non-adsorbed phase, the pressure is determined through the Kelvin equation [34]:
l n p p 0 = κ γ V ¯ r t R T c o s   θ
where κ is a geometry parameter and depends on the pore and meniscus type. For a cylindrical pore open at both ends, where the adsorbed film forms a cylindrical sleeve-shaped meniscus, κ = 1, while for a pore with one dead end, or for desorption, condensation occurs at a hemispherical meniscus such that κ = 2. γ is the surface tension, V ¯ is the partial molar volume, R is the universal gas constant, θ is the gas–liquid–solid contact angle (typically assumed to be zero), and r is the pore radius. The variation of the thickness t of the multi-layer with relative pressure is usually described through a so-called universal t-layer equation, such as those of Halsey or Harkins and Jura [34]. It is necessary to specify which particular geometry (hemispherical versus sleeve-shaped for cylindrical pores) is assumed for the meniscus, as the condensation pressure (and thence the pore size thereby derived) differs by a factor of ~2 between them. An algorithm, such as that by Barrett, Joyner, and Halenda (BJH) [43], is used to obtain the PSD from the adsorption or desorption isotherm.
However, as the pore size becomes smaller, the potential from one solid wall may begin to overlap to a significant degree with that from the opposite wall within the centreline region. In such circumstances, the phase nearer the pore wall may no longer have a sharp step-change transition in density compared with the adsorbate in the central region of the pore, so there is less distinction between adsorbed and non-adsorbed phases, and the Kelvin equation is no longer suitable to accurately describe the physics of the system. For smaller pores (<~5–10 nm) it is, thus, better to use density functional theory (DFT) methods to obtain the condensation pressures [8,44]. Whichever theory (DFT or Kelvin equation) is used to obtain the critical condensation pressures, the underlying structural model used to define the PSD is the same. The void space is typically considered to consist of a parallel bundle of pores, all with a regular geometry, such as a cylinder or a slit. The PSD is then considered to be the set of such pores with a particular array of pore sizes such that their composite adsorption behaviour matches the observed experimental isotherm. However, many heritage materials have void spaces consisting of disordered, inter-connected networks in which pore to pore co-operative effects, such as advanced condensation, (network-based) delayed condensation, and pore blocking effects can operate [8]. These effects can act to narrow or shift the PSD, but tests are available to verify their presence, and reviews have been published [35]. They are detectable using methods described in previous work [35]. The typical size of the error in the pore sizes introduced through advanced condensation is a factor of ~2, whereas for pore blocking on the desorption isotherm, it can be any factor depending on the neck sizes relative to the shielded body sizes. However, pore blocking on desorption can be a useful complement to the adsorption isotherm and used to determine pore connectivity (see below)
The PSD can be obtained from the mercury intrusion curve using the so-called Washburn equation [45], written here for cylindrical pores:
p H g p g = p = 2 γ c o s   θ r
where pHg is the hydrostatic pressure of mercury, pg is the pressure of any residual gas in the sample (typically assumed to be zero), γ is the surface tension, θ is the mercury contact angle, and r is the pore radius. In order to convert intrusion pressures into pore sizes, it is necessary to select the appropriate values of the contact angle and the surface tension. However, the majority of publications in the heritage literature fail to even mention the values used. Where the contact angle used has actually been stated, the reason for the particular choice often is not [46]. Sometimes only a precedent in the literature for other archaeological materials is used [14]. However, the correct selection of the contact angle is vital because the contact angle depends on the chemical nature of the surface, the degree of surface roughness, and the size of the pore [8]. If the wrong contact angle is chosen, then it is often hard to reconcile mercury porosimetry PSDs with those from complementary data, even those which should be equivalent, such as gas desorption PSDs. The sessile drop experiment can be used to measure the mercury contact angle on a new material [13]. However, a reasonable amount of powdered material is needed for that experiment. As mentioned above, because mercury intrusion and gas desorption are both invasion percolation processes, then the OC data can be used to calibrate the contact angle for mercury porosimetry, as gas desorption is known to arise from hemispherical menisci (or equilibrium DFT kernels) [8].
Attempts have also been made to calibrate the γ·cos θ term in the Washburn equation by obtaining the intrusion and extrusion pressures for model materials, such as controlled pore glasses (CPGs), where the pore size is known independently from complementary methods, such as electron microscopy [47,48,49]. The calibrated versions of the Washburn equation have been found to work for a variety of materials other than the CPGs used to obtain them [50,51]. It is possible to check that the calibrated equations work by seeing if they can completely remove (within the experimental error) the contact angle hysteresis between intrusion and extrusion, such that the curves become superposed for at least part of the pore size range. If it is possible to superpose the intrusion and extrusion curves via adjusting the contact angle term in Equation (7), then this means that it is likely that there is no structural hysteresis and no pore shielding. Hence, it is likely that the pore size is then correct. For many materials, the calibrated versions of the Washburn equation then give rise to PSDs that match those from other techniques, such as gas sorption or cryoporometry [8]. It is often suggested that it is a weakness of mercury porosimetry that it is necessary to assume a particular pore geometry, such as a cylindrical geometry [28]. However, if a superposition of the raw intrusion and extrusion curves is analysed using calibrations obtained from a material with cylindrical pores, such as CPGs, then this is good evidence for a similarly shaped pore in the new material under testing. This suggestion has been confirmed for some silicas using cryoporometry, where the hysteresis width is particularly sensitive to pore geometry [52].
Modified versions of the aforementioned correlations were found to be able to superpose the intrusion and extrusion curves for non-hydraulic lime mortars used in building conservation [51]. In that work, obtaining the right model of carbonation of the mortars depended on having the correct interpretation of the mercury porosimetry data, especially when determining the nature of the hysteresis (contact angle or structural) to infer the lack, or presence, of pore shielding, which was different depending on the level of carbonation. Carbonation changes the microstructure of the mortars, thereby changing the mechanical properties and water transport characteristics. Carbonation led to the re-crystallisation of more dispersed portlandite crystals as carbonate crystals on the surface of aggregate particles, with the latter crystals being smaller than the former, thus creating new, small pores between them. This arrangement could be deduced from the lack of any additional pore shielding effects arising from the new, smaller pores.
Where the inability to be able to achieve a superposition of mercury intrusion and extrusion curves indicates some residual structural hysteresis, and thus some pore shielding, this is often associated with mercury entrapment. Experiments on glass micromodels have suggested that mercury entrapment is associated with structures possessing large pore bodies shielded by much narrower pore necks and/or isolated regions of larger pores surrounded by a “sea” of smaller pores [53,54]. However, when entrapment arises due to pore shielding, the residual mercury can be used as the probe fluid for mercury thermoporometry to determine the sizes of the shielded pores [55].
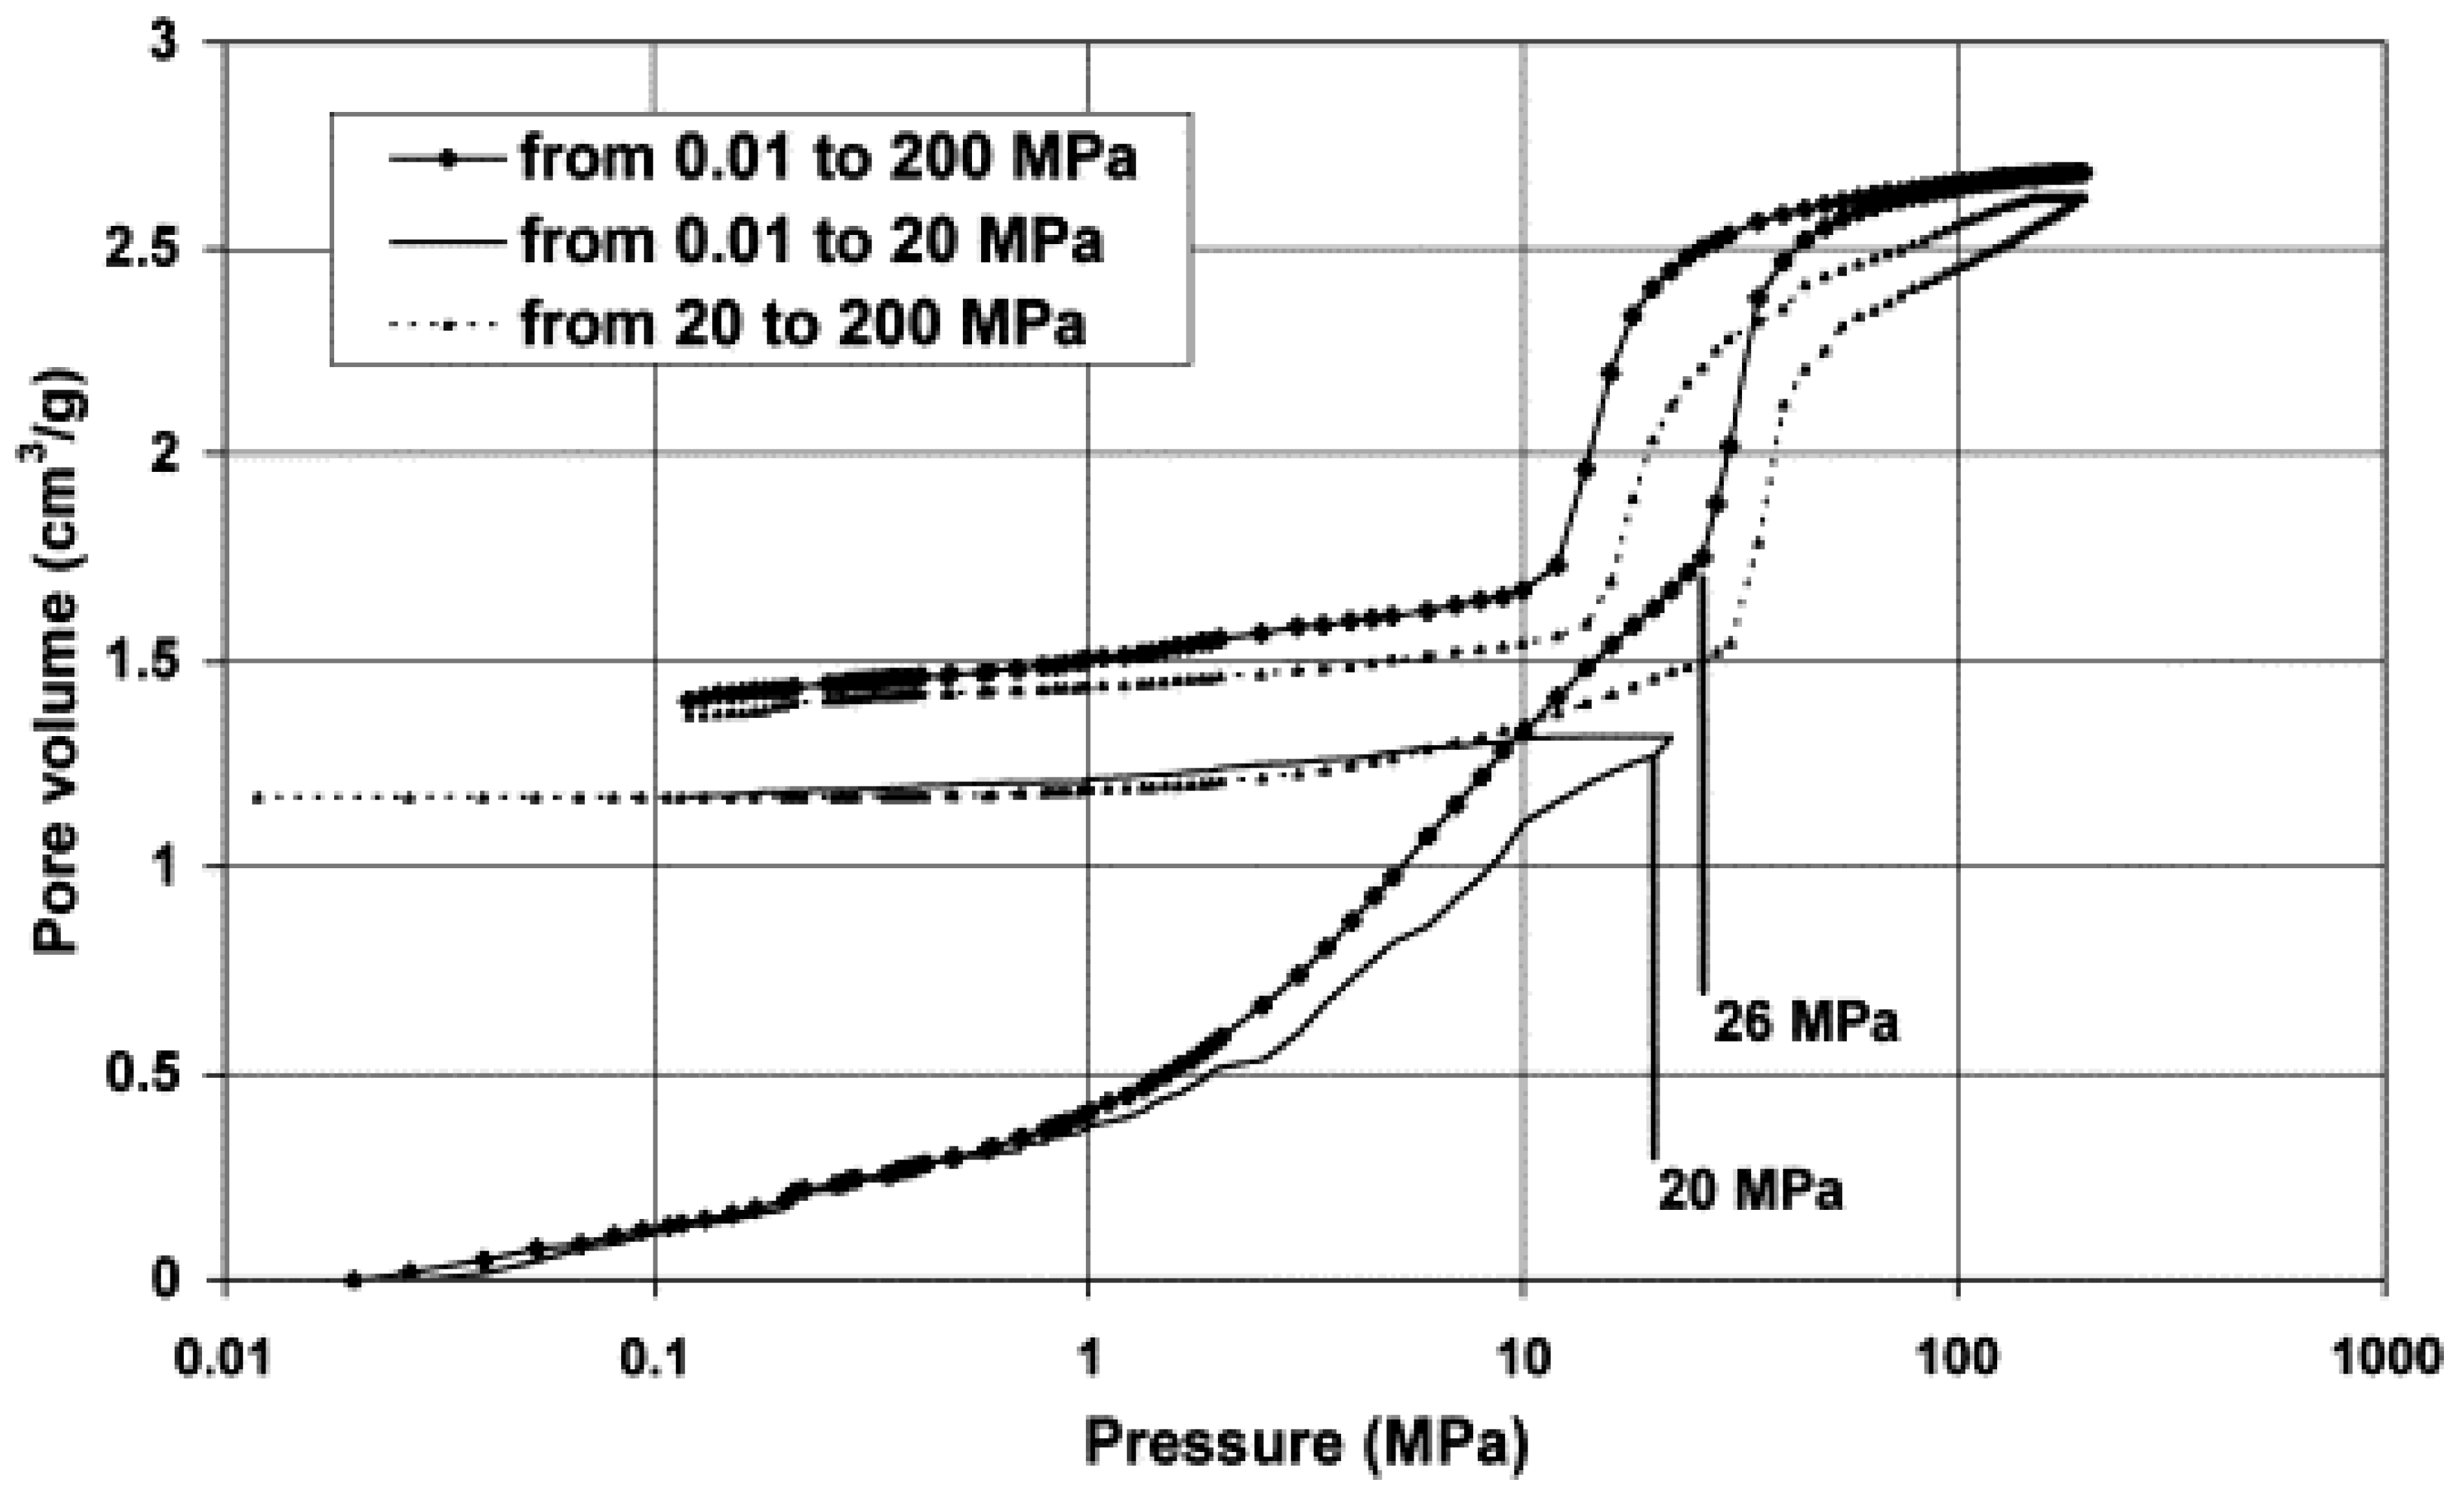
Where the apparent PSD obtained from mercury intrusion consists of a straight-line relationship on a semi-log pressure or pore size versus (apparent) intruded volume, then this is likely to imply that mechanical damage is occurring, whereby individual pores are collapsing [56,57]. An example of such data is given in Figure 4, where the apparent intrusion is linear on the log-linear plot for pressures from ~2 to 26 MPa. This linearity is because pore collapse follows the Euler buckling relation such that the lower size limit L of pores crushed at a given pressure P is given by [57]:
L = k f P 0.25 ,
where kf is a constant related to the Young’s modulus of the material. In materials where mechanical damage arises at low pressures and conventional mercury intrusion occurs at higher pressures, there is often a marked transition, in the form of a knee, between the aforementioned straight-line relationship and a more curved line, as seen in Figure 4 at ~26 MPa. The lower part of the intrusion can still be used to obtain a PSD, but the Euler buckling relationship must be used to convert pressure into pore sizes.
Mechanical damage of a sample during mercury porosimetry can also manifest as apparent entrapment but no actual mercury left behind in the sample, as also seen by the solid line shown in Figure 4. Hence, it is important to present both intrusion and extrusion data when reporting mercury porosimetry results and check that any apparent mercury is associated with visual observations of mercury left within the sample or a colour change. Mercury entrapment within often results in pale-coloured samples turning darker to greys and blacks. Mechanical damage due to the high pressures used in MP has also been suggested as the reason for the disagreement in estimates of the porosity of ancient mortars from Cyprus obtained by it, and those from gravimetric analysis following vacuum saturation with water [25].
If a sample is in a powder form, such as soil, the initial stage of the first pressure increases during mercury intrusion experiments tends to consolidate the loose powder particles within a surrounding mercury envelope (and the form of the curve looks similar to the low-pressure regions in Figure 4), and then intrusion of mercury starts into the windows and gaps left between the individual powder particles of the consolidated packing. Since the gaps left between particles in the packing tend to be of the same order in size as the particles themselves (the exact relationship depends on the shape of the particles), mercury porosimetry can be used to obtain a particle size distribution for the powder in an similar manner as for the pore size distribution [8].

2.6.3. Pore Connectivity

The combined gas adsorption and desorption isotherms, or the gas adsorption isotherm and mercury intrusion curve, can be analysed together to obtain estimates of pore connectivity, defined as the average number of pore bonds meeting at a network node [58]. These methods are generally based on percolation theory for either invasion or seeded percolation [8]. For methods based on invasion percolation, a full boundary desorption or mercury intrusion curve is necessary. However, the seeded percolation model can be used where pore-filling is not obtained at the top of the desorption isotherm, such as with scanning curves. Scanning loop experiments can be used to determine pore connectivity using mercury porosimetry [27].
The tortuosity factor, according to the main definition, characterises the deviation from a straight-line path that a diffusive flux is required to make due to the obstacles formed by the pore walls within a porous medium [59]. It is strongly related to pore connectivity, because high connectivity is associated with low tortuosity because an abundance of pores joining at each node minimises the necessity of the deviation of the diffusive flux. Correlations have been derived to obtain tortuosity from mercury porosimetry data, especially the mercury entrapment fraction, such that [60]
τ = 4.6242 l n 4.996 1 α e n 1 5.8032 ,
where
α e n = V e n V t ,
and where Ven is the volume of entrapment and Vt is the total pore volume. This correlation has been used to characterise the pore networks of ancient city wall bricks [29].

3. Materials

3.1. Ancient Glass

Gas OC permits testing whether bigger mesopores and macropores are missing from the conventional gas sorption PSD. Hence, from a comparison of the ultimate mesopore volumes of Bronze Age and Roman glasses from Tel Brak, Syria, and Beirut, respectively, with their elemental compositions, it was found that the glasses with the highest alkalinity (sodium plus potassium), which were Bronze Age glasses with values of ~20%, also had the largest mesopore volumes, while the Roman glass sample with the lowest alkalinity (of ~13%) also had the lowest mesopore volume [38]. This finding was consistent with a suggestion in the earlier literature [61] that the particular amount of nanoscale porosity within a given ancient glass relates to its alkali content.
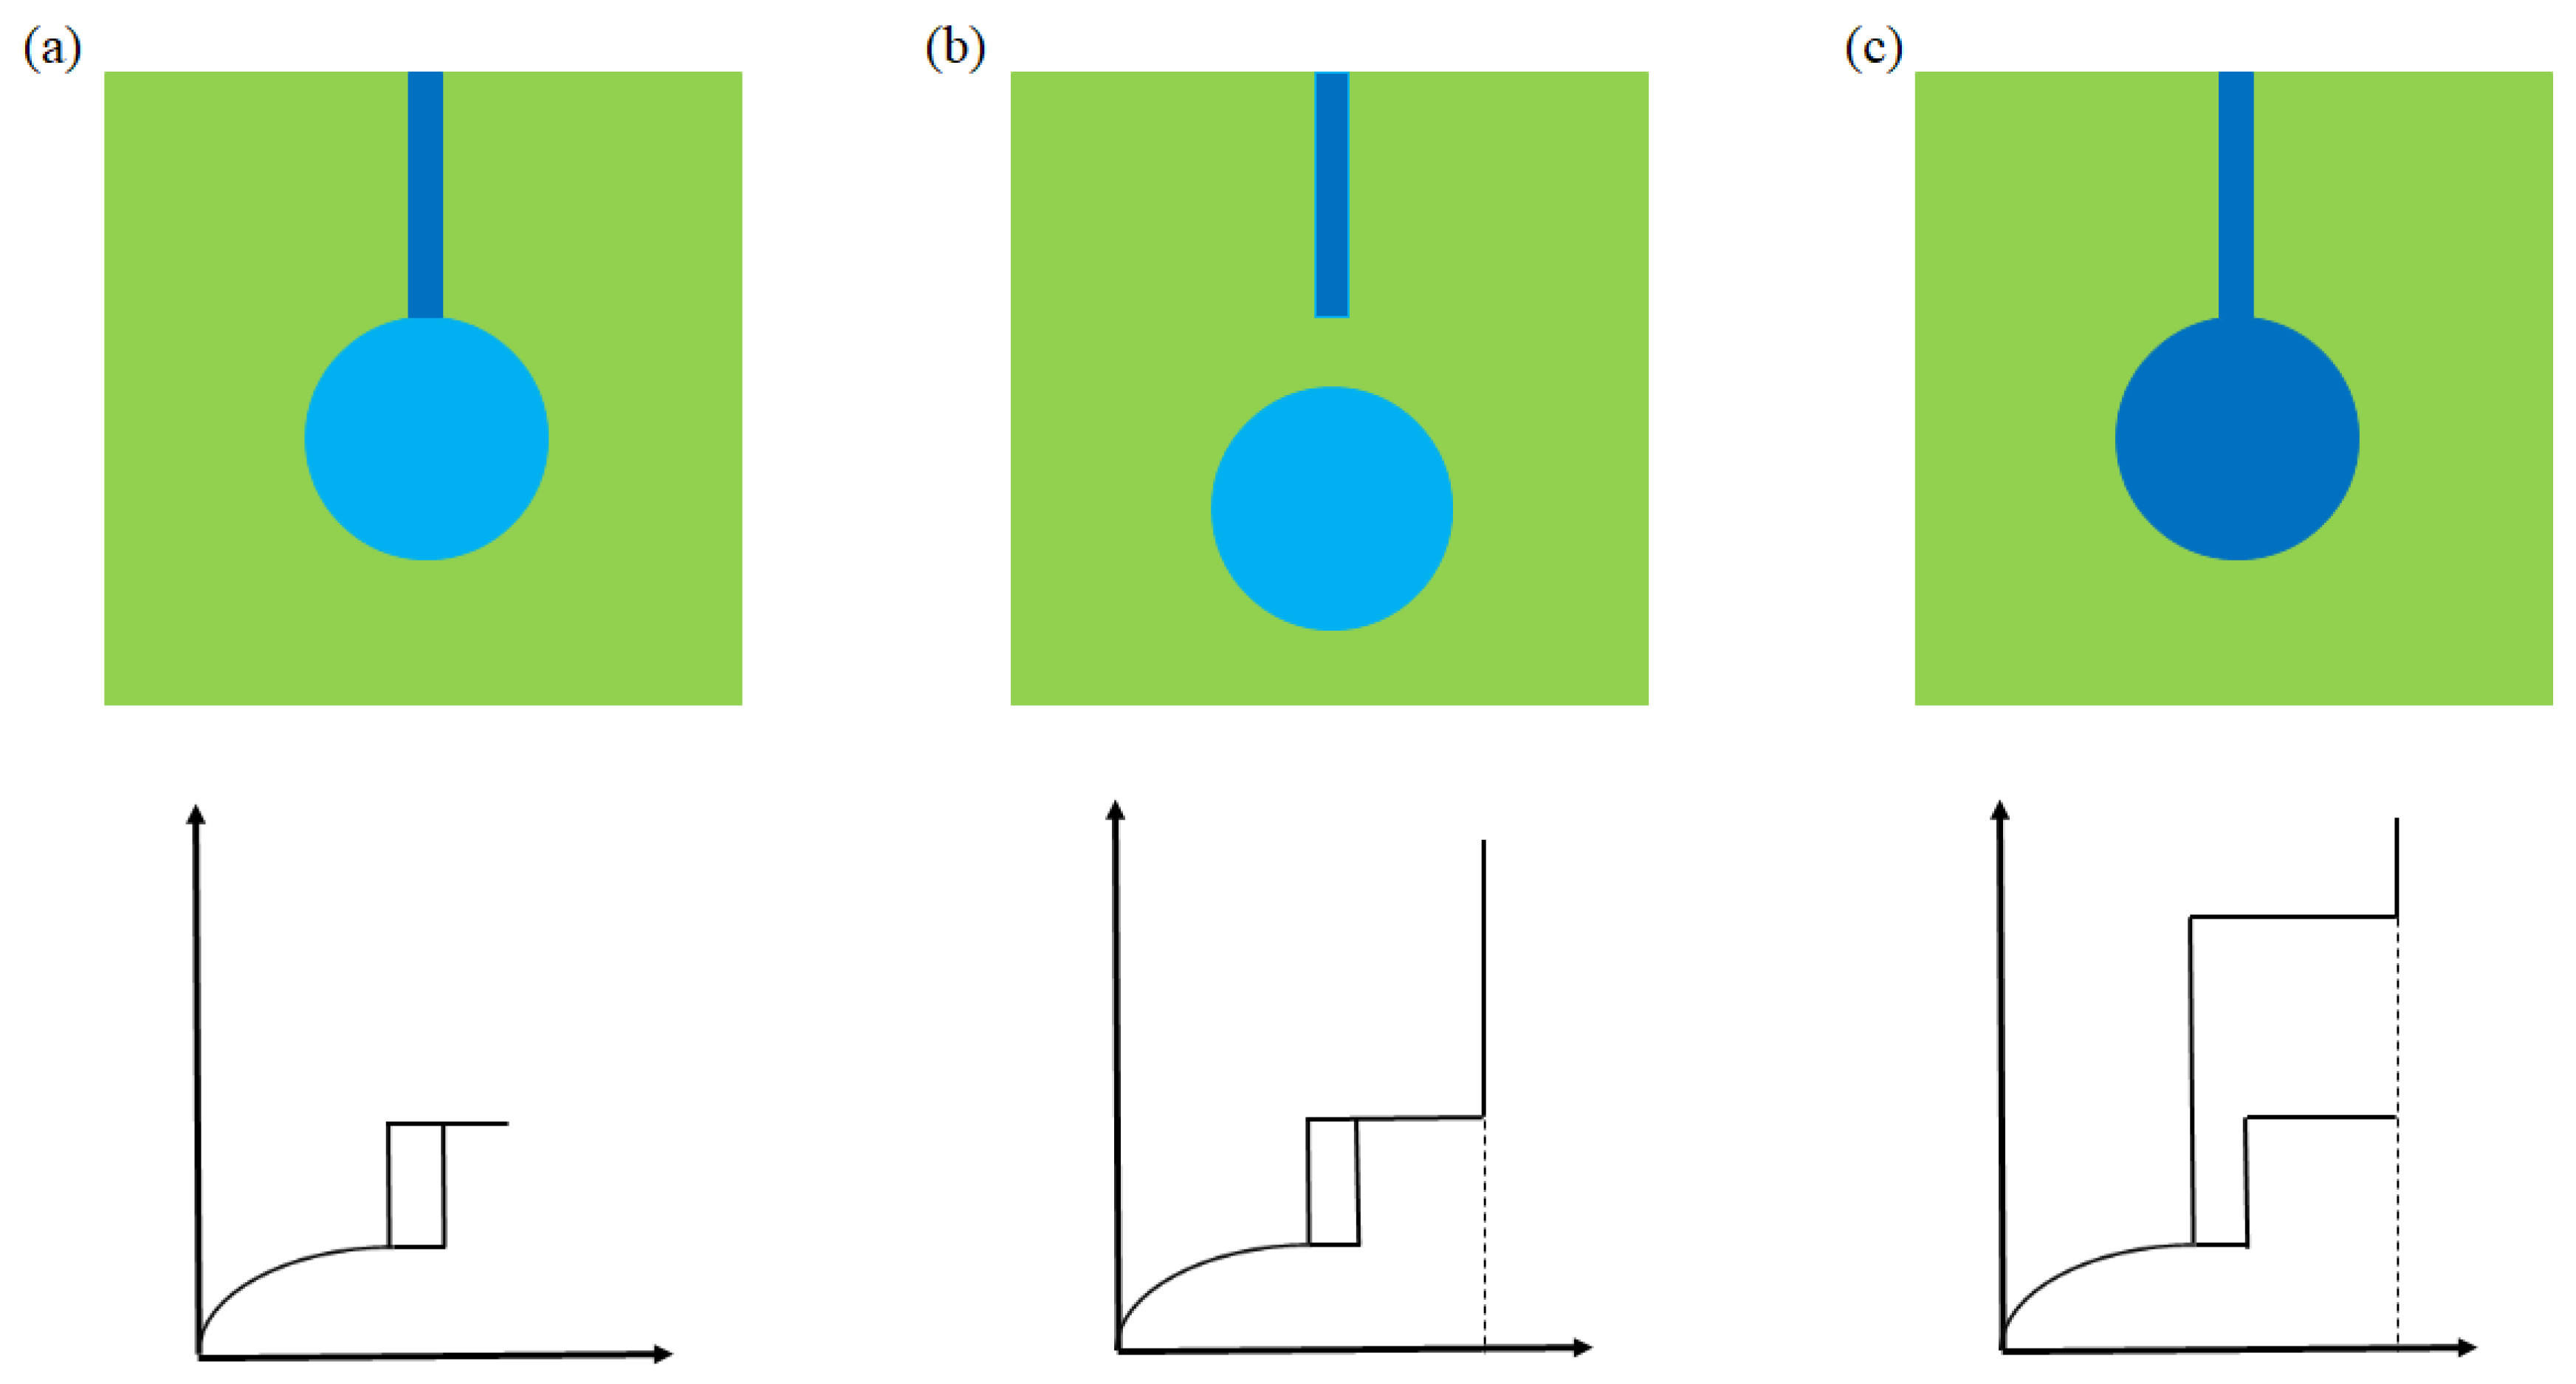
Computerised X-ray tomography (CXT) data have shown that both Bronze Age and Roman glass samples contain bubble-like macropores that seem isolated on the macroscopic scale (>10 μm) [38]. For conventional nitrogen gas sorption, such macropores are beyond the detectability limit of the experiments, but these macropores are detectable using over-condensation (OC) experiments. The schematic diagram in Figure 5 illustrates the shapes of gas sorption isotherms expected from a conventional GS experiment for a material where the macroporous bubbles are only accessible from the exterior via surrounding nanopores. Unfortunately, conventional isotherms can detect sorption only in the nanopores, as the macropores would not fill with condensate during a conventional experiment. In contrast, in an OC experiment, bulk condensation can be obtained (as shown by the vertical solid line at the bulk saturated vapour pressure in Figure 5), but if the macropores are completely isolated, then they are not accessible at all to the adsorbate, and no adsorption whatsoever can arise in them (as shown in Figure 5b). However, if the macropores are accessible to the exterior through nanopores and an OC experiment is carried out, then the macropores will be filled at the bulk condensation pressure, and the size of the step in the boundary desorption isotherm will be much larger compared to that from the conventional experiment (as shown in Figure 5). The scenario shown in Figure 5c is one that has already been obtained experimentally for shale rock samples with macropores shielded entirely by mesopores, as shown in Figure 3. In ancient glasses, the scenario in Figure 5c could be anticipated if the nanopores had been generated by the leaching of material from the matrix around the bubble pores and cracks, thereby creating a “corona” of nanoporosity around the macroporosity.
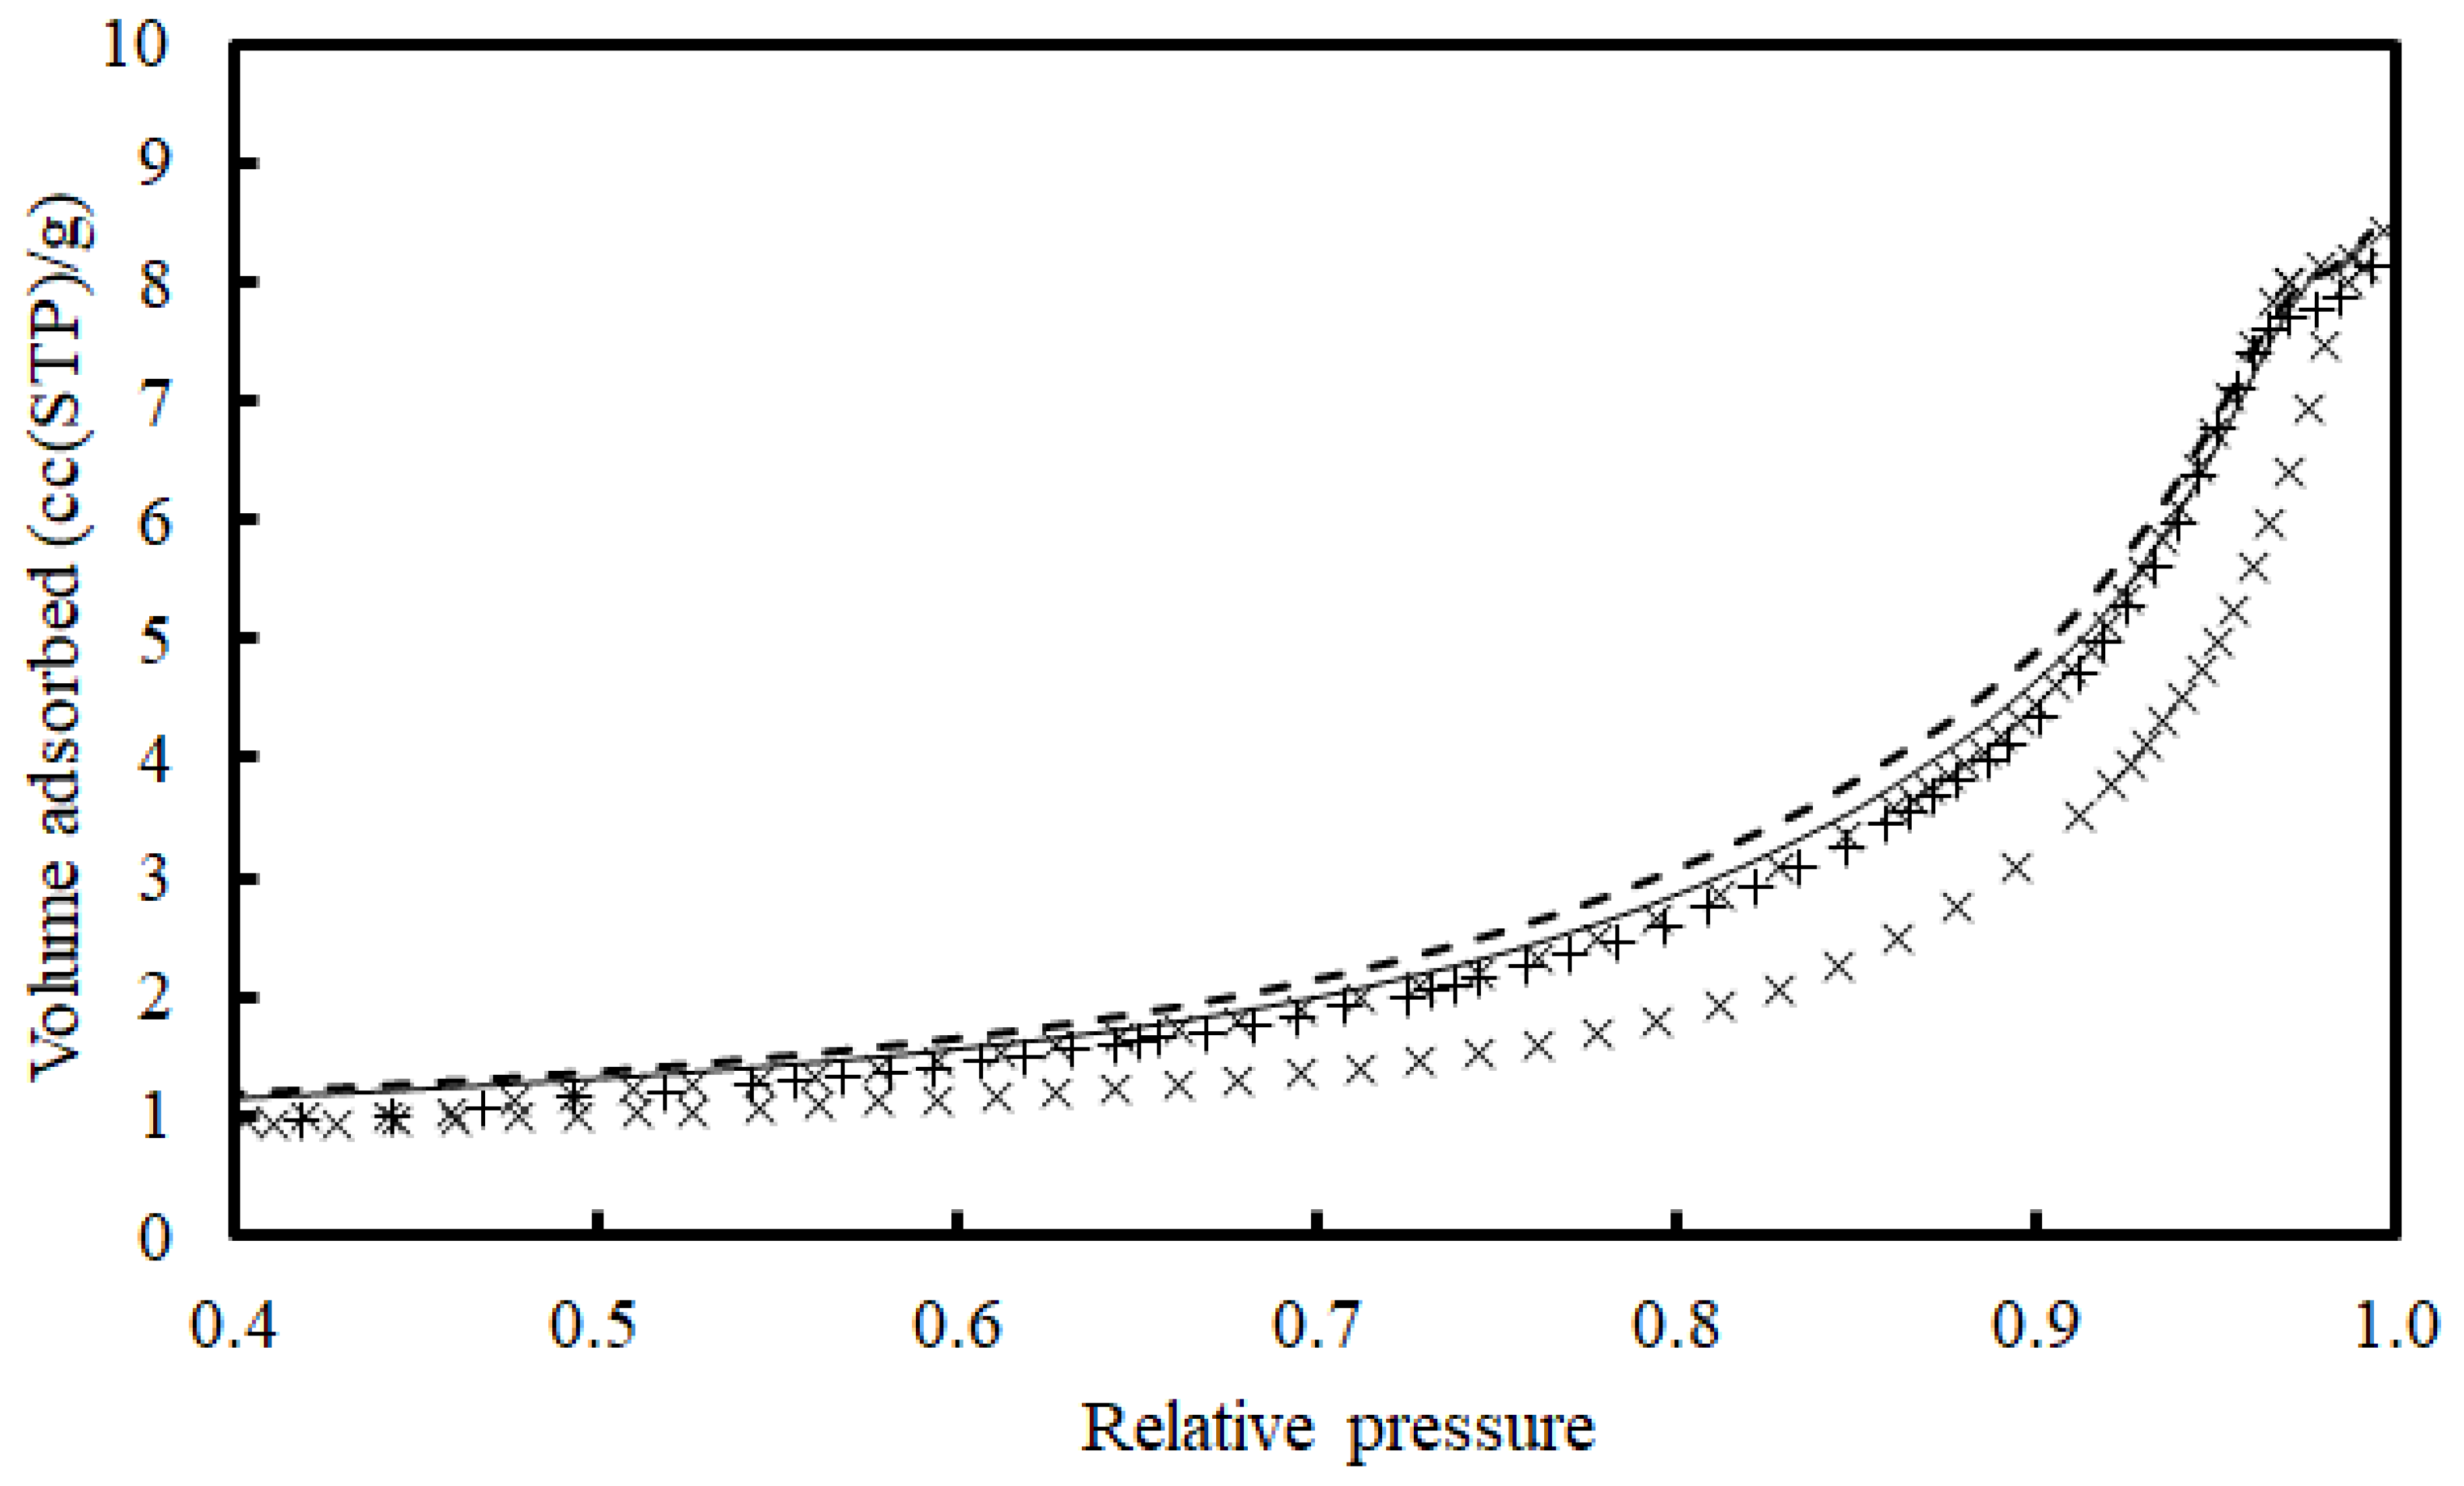
Figure 6 shows the hysteresis loop region of the conventional nitrogen sorption isotherms and the OC boundary desorption isotherm for a sample of chips of ancient Roman glass from Beirut [38]. Similar data were also obtained for other Roman and Bronze Age glass samples. The occurrence of capillary condensation is suggested by the hysteresis loop in the data, which suggests that some mesoporosity is present. However, the hysteresis loop region is generally quite thin. Furthermore, the form of the full boundary curve from OC is close to that of the desorption branch of the conventional isotherm, as would be expected for the scenario given in Figure 5b. This observation suggests that in the conventional adsorption experiment, there were not any macropores that did not fill but are shielded by smaller pores that condense at lower pressures. Hence, the bubble pores, which were seen in complementary CXT images, were not accessible to the exterior at all, as, otherwise, a big step in initial condensation and an obvious pore blocking or cavitation step in the over-condensation boundary desorption isotherm would be anticipated (as seen in Figure 5c). This could not have been inferred from the CXT data, as the nanoporosity was below its resolution limit.

3.2. Ancient Ceramics

Pottery sherds are typically identified using descriptive typologies that “establish temporal sequences and cultural boundaries within a cultural-historical framework” [2]. However, it can be difficult to distinguish between different types if the sherd is not part of a rim or an otherwise idiosyncratic feature of a known type of pottery [62]. However, besides the overall exterior form of the pot, the complex internal void space of the ceramic may be characteristic of a particular pottery type, as it depends on both the specific type of clay raw material used, which affects the degree of plasticity, and the specific processing that the clay undergoes in the fabrication of the vessel, such as the firing temperature. Hence, the PSD can be used as a sort of “fingerprint” of a given type of pottery [63]. For example, Sanders [62] obtained PSDs from mercury porosimetry for four samples of neolithic pottery from Warwick, one from a neolithic chamber tomb in Argyll, four samples of Iron Age pottery from Northamptonshire, UK, a Roman mortarium, Roman pottery from Chesterton, UK, two samples of Roman Samian ware, a Pagan Saxon sample, a twelfth-century medieval sample, and a modern teacup. The neolithic pottery from Warwick and the Saxon pottery came from find sites near each other and, thus, are likely to be made of similar local raw material, and so the differences in observed PSD would be due to differences in fabrication methodology. Sanders [62] found that the various sherds of neolithic pottery gave similar mercury intrusion curves, suggesting that the firing method was responsible for the particular PSD. The Roman pottery, with one exception, tended to have a mercury intrusion curve that was exponential in shape, leading to a relatively narrow PSD overall, and Sanders [62] suggested that this was associated with well-made pottery. The pagan Saxon and medieval pottery both had a much wider PSD and were thus of poorer quality.
Morariu et al. [63] conducted a similar study to that of Sanders of the mercury porosimetry PSDs of different types of pottery. They suggested that the pore structures of ancient pottery can be divided into four main categories, irrespective of origin or age. The first category consisted of poor quality, coarse pottery, with a very broad PSD, probably due to being fired at a relatively low temperature (less than 700 °C), as shown by the remaining presence of carbonate, which would have decomposed at higher temperatures. Examples of the first category included Dacian ware of the second and third centuries CE. The second category had a more homogeneous pore structure suggestive of a higher firing temperature and included Bronze Age pottery excavated in Romania and eight century BCE Assyrian pottery. The third category was characterised by a sharp upper limit to the pore size but was of high quality and included Hellenistic, Roman, and Dacian ware of the second to the first centuries CE. The fourth category had the most homogeneous pore structure, with a very narrow PSD, and thus probably had a very high firing temperature >900 °C. Typical pottery in the fourth category included Roman and Dacian pottery of the fourth century CE. Some of the other pottery studied by Morariu et al. [63] had a very specific characteristic PSD, such as fourth to second century BCE Celtic pottery from Transylvania.
Overall, Morariu et al. [63] found that the higher firing temperatures resulted in finer pottery with narrower PSDs, lower average pore sizes, and a more homogeneous pore structure. Similar findings were obtained by Volzone and Zagorodny [17] for archaeological pottery from the Hualfin Valley, Argentina. However, Volzone and Zagorodny [17] also found that the porosity of the body section of vessels was typically less than that of the neck and that the cumulative PSD of the body was missing pores seen in the neck PSD. They suggested that the smallest pores apparently missing from the vessel body PSD might have become sealed off by the presence of soot (a soot coating was observed to be present by the naked eye) originating from the fire used during cooking.
Conflicting results have been found regarding the impact of visible carbonated deposits on the pore structure of ceramic shards. Some authors [14,64] suggest that these sorts of deposits do not reduce porosity and thus have a limited impact on the post-depositional evolution of that porosity, while others have found the contrary [2,65].
Cayme et al. [66] conducted experimental archaeology studies with the ultimate aim of determining the role of micro- and mesoporosity in preserving ancient biomolecules in ancient ceramics but initially to determine the impact of the fabrication method on the pore structure. They fabricated replica ancient pottery briquettes from either illitic or kaolinitic clays with different tempers and using one of two different firing temperatures (600 or 800 °C). They then determined the specific surface area and PSD using nitrogen sorption. It was found that the mesopore surface areas and pore volumes of the briquettes depended on the original porosity of the clay raw material. Furthermore, the high pH of chalk-tempered clay pastes led to the loss of porosity, while sand tempers were relatively inert.
During use of the pot, organic molecules can be absorbed into unglazed ceramic vessel walls, which protects them from the surrounding environment by reducing the availability of oxygen and other nutrients to micro-organisms, enabling the organic matter to be preserved. The porosity and PSD of ancient pottery are key parameters that determine its ability to trap lipids during the original use of the pot in the first place and then preserve them over time [14]. Experimental studies on test ceramics have suggested that pores that are less than a few microns in diameter are particularly important for the preservation of organic residues because they provide protection from most biological and chemical degradation processes in the buried environment [67]. Namdar et al. [68] found that even cooking at low temperatures led to an increase in the porosity of chlorite cooking vessels from Merv, Turkmenistan, mostly in the form of nanopores but including some larger micron-sized pores. This was discovered by comparing the PSD from mercury porosimetry for ancient pots with fresh stone standards and heated stone standards. This meant that the vessels had a greater propensity to absorb organic residues from the processing of foodstuffs. However, it was also found that the absorption of food residues led to a sealing effect that reduced subsequent porosity evolution.
Since mercury intrusion and nitrogen desorption are invasion percolation processes and thus the key phase ingress is from the outside inwards, they are most sensitive to the porosity and pore sizes at the external surface of materials. Therefore, in principle, they can be used to study the impact of exterior glazing and surface treatments, such as burnishing and the application of slips, on the accessibility of the interior pore space of ceramics [14]. The surface properties will affect the propensity to adsorb organic and other materials from substances placed in the vessels, etc. However, in order to fit samples of such materials into the apparatus sample tubes, it is often necessary to fragment the vessel or shards further. This would reveal fresh fractured edges that will also permit ingress of mercury or egress of condensate and thus contaminate the signal from surface layers. However, if the particular pore sizes from surface layers are needed, then a solution to this problem used by the oil industry on core samples can be adapted for ceramics. The new fractured surfaces can be covered in an impermeable coating, such as epoxy resin, to restrict access to the original surface only [8].
Porosity measurements can be used to test theories concerning ancient manufacturing practices. It was supposed that lamp-makers might coat their ceramic lamps with slip not just for decoration but also in order to prevent seepage of oil from the fuel reservoir [69]. Lapp used water absorption to test the porosity of clay lamps from Pella in Jordan [69]. Dry samples were immersed in water, and the uptake was measured gravimetrically. However, access to internal porosity may also be limited by fuel residue and/or salt deposition besides the presence of slip. The samples thus needed testing for soot deposits. Residues of more organic materials can be tested through gas chromatography coupled to mass spectrometry. The presence of salt deposits is commonly associated with efflorescence, which can be seen as a white coating on the exterior of the sample. A study of lamp bodies found that they were porous. It was found that wheel-thrown lamps had lower porosity than lamps made by pressing into moulds [69]. Lapp suggested that the porosity was left by lamp-makers to improve resistance of the vessel to thermal shock during use, as higher porosity vessels had lower thermal conductivity [69]. Similar findings regarding the porosity and thermal shock resistance of pottery were obtained by Reid [70].

3.3. Building Materials

Because mercury porosimetry (and gas sorption) only probes externally accessible porosity with pore sizes above a lower limit (imposed by the maximum porosimeter pressure or the adsorbate size), the value of the total pore volume obtained through these methods may be inaccurate, but it can potentially be independently validated through comparison with another measure, such as that derived from computerised X-ray tomography (CXT) [1]. The key limitation on CXT is the lower limit of resolution possible for a given field-of-view. For example, Xu et al. [71] found that porosities obtained for ancient Roman concrete through CXT were much lower than those obtained through MP because a lot of the pores were below the resolution limit possible with CXT. The application of CXT to the study of heritage materials has already been discussed in more detail previously, and the reader is referred to a previous publication [1]. However, it should also be noted that the PSD obtained from MP and GA is different in intrinsic nature to that obtained through analysis of pixellated images [72]. Image analysis methods, such as CXT, involve partitioning the void space up into individual elements with clear boundaries, leading to a discrete distribution of pore sizes, as shown schematically in Figure 7. In contrast, more indirect pore structure characterisation methods, such as MP and GA, deliver a continuous spectrum of pore sizes, as shown schematically in Figure 7. Gas sorption utilises a physical phase transition (i.e., condensation or evaporation), while mercury porosimetry involves a fluid–fluid displacement process, but both involve a meniscus separating two phases moving through the porous medium gradually as the relevant control variable (e.g. vapour or hydrostatic pressure) is changed [8]. This meniscus marks the boundary between pores with sizes accessible with the current value of the control variable, and the volume of the phase behind it indicates the volume of those pores. Because the meniscus can advance incrementally as the control variable is changed, the PSD thereby obtained is a continuous spectrum of sizes, particularly if the void space geometry intruded is, say, of conical form (or an analogue), as shown in Figure 7.
Mercury porosimetry has also been used to corroborate PSDs obtained from NMR relaxometry for ancient building materials from the Graeco-Roman theatre at Taormina in Sicily [73]. NMR has the advantage that it is possible to take measurements with portable equipment (e.g., NMR Mouse type scanners) that can be used in the field, such as at ancient buildings, while GS and MP are lab-based. However, it is often necessary to use a PSD from mercury porosimetry to calibrate the surface relaxivity (or the surface relaxation strength) parameter to enable an NMR relaxation time to be converted into a pore size. NMR relaxometry is also more prone to the impact of chemical heterogeneity on pore size measurements, particularly if the internal surface of the test material contains paramagnetic species [8]. Furthermore, in an ink-bottle type geometry, the pore size determined from NMR relaxometry would be weighted more toward the body size, while for MP it would be more weighted to the neck size. The measured NMR relaxation time is the volume-weighted average for the region of the void space explored by a given molecule during the course of the experiment (typically of the order of ~10–100 μm), and thus NMR measurements can average out pore size variations over smaller length scales than this and lead to a narrowing of the measured PSD compared to the actual width. This effect tends to be more impactful than the pore to pore co-operative effects that operate in gas adsorption [8].
Pore structure characterisation can be part of a forensic study aimed at understanding the quality of ancient building materials and determining the manufacturing and processing technologies used in their fabrication [42]. Goli et al. [42] used MP to obtain cumulative intrusion volumes (pore volumes) and suggested that lower values of this parameter, for ancient bricks from a Buddhist stupa in India, could be attributed to partial vitrification. Furthermore, these authors found that the pore volumes of bricks were associated with the particular time period in which they were made. They also found that bricks with larger porosities were more fragile and less durable. Goli et al. [42] suggested that the larger pore sizes found for some bricks were probably due to the use of (lost) organic pore-forming agents used in brick manufacturing in India.
Lime has been used to make mortars and plaster since 7000 BCE [74]. When lime mortars are mixed with water, the CaO is transformed into calcium hydroxide. The carbonation process is influenced by the rate of diffusion of carbon dioxide into the pore structure of the mortar, which, in turn, is controlled by the porosity and pore size. Mercury porosimetry can be used to determine the key pore structural parameters, such as the surface area, pore volume, and PSD, for input into a coupled diffusion-reaction model for reactions of carbon dioxide with ancient Greek mortars [22]. The porosimetry data showed that macropores of sizes >900 Å played a major role in the structure.
Both mercury porosimetry and CXT with a voxel resolution of 10 μm were used to obtain the PSDs for “mock-up” mortars for cultural heritage [75]. CXT was used to obtain pore sizes from the images equivalent to “the diameter of a sphere with the same number of voxels as the object”, which is similar to that shown schematically (in 2D) in Figure 7. It was found that there were big discrepancies in the total specific pore volume and the typical size values of the cumulative, volume-weighted PSDs between the two methods. Brunello et al. [75] suggested that these discrepancies arose from the pore shielding effect and mercury porosimetry missing large pores on the surface of the samples. However, because the CXT cumulative PSDs were generally steeper and narrower compared to those obtained from mercury porosimetry, the effects shown in Figure 7 are probably responsible for the discrepancy in PSDs from the two techniques for the mortars.
Mercury porosimetry has been used to show that ancient Roman pozzolanic mortars from the Villa del Capo di Sorrento, Italy, had pores of radii ~5–100 nm, which are about one order of magnitude smaller than modern hydraulic mortars with pore sizes ~100–1000 nm [23]. This characteristic pore structure probably originated from the vesicular structure of the pozzolanic materials (i.e., pumice) used in these ancient structures. Furthermore, secondary minerogenetic products, such as hydrocalumite and calcium–aluminium–silicate–hydrate (C-A-S-H) gel phases, fill pores, thereby enhancing the bonding and reducing the permeability of the mortars. This led to improved mechanical resistance and durability.

3.4. Resilience and Conservation of Heritage Materials

The PSD of a building material is the key factor affecting the susceptibility of the material to weathering processes, particularly involving salt precipitation [76]. Hence, GS and MP have found numerous uses in studies aimed at protecting ancient building materials from such processes.
The kinetics and extent of the ingress and egress of water into ancient building materials are key parameters affecting alteration processes responsible for degradation of the materials [77]. Since the raw mercury porosimetry pressure versus the intruded volume curve is a form of capillary pressure curve, it can be converted into the equivalent curve for another liquid by substituting the relevant values of surface tension and contact angle. Just as a threshold pressure needs to be exceeded to achieve intrusion of mercury, a similar threshold may exist to obtain ingress of another fluid, such as water. Mercury porosimetry has been used to obtain suction curves that can be used to describe how and how fast two touching porous materials exchange water [77]. An example of such materials are successive layers of wall plaster and the supporting masonry. The suction curve data can show that different layers may have different suction capacity for moisture, leading to considerable differences in water content between layers. The suction curves can also be used to determine how well the application of another coating will improve the protection and strength of historical materials.
Where ancient stone is irreparably damaged and needs replacing, the new stone must be compatible with the original. This requires not just that the appearance be similar but also that the petrophysical parameters, such as porosity and pore sizes, are compatible [41]. Rocks used to replace historical materials should also be less prone to chemically induced (e.g., dissolution of the carbonate cement by salts or aqueous acid solutions) deterioration than the historical stone.
High porosity affects durability [41]. Cardiano et al. [78] suggested that meso- and, especially, micropores are the ones most important to stone decay as they are the ones most involved in water transport and salt crystallisation. Micropores can more preferentially retain water than larger pores [41]. Manohar et al. [79] suggested that exfoliation caused by salt precipitation depends strongly upon the PSD of the building material. This is because the internal pressure generated by crystallisation out of solids within pores depends on the pore size. In small pores, the crystal may be restrained from growing in some directions by the pore wall, leading to an internal stress developing on the fabric of the building material, while larger pores may be big enough to accommodate the growing crystal and there is much less pressure build-up. In addition, the level of crystallisation pressure build-up also depends on the rate of ion transport, which depends on the porosity and PSD [79] and the particular juxtaposition of pores of different sizes. A crystal growing in a small pore is stressed due to the confinement and, thus, is at a higher chemical potential than an unstressed crystal. There is, thence, a driving force, if the growing crystals are bathed in the same pore solution, for the migration of ions from the stressed crystal to unstressed crystals elsewhere. Hence, crystallisation stress within a smaller pore will decline if another crystal has nucleated in an adjacent, connected, larger pore. However, high rates of evaporation of pore liquid can lead to discontinuities in the ganglia of solution connecting different pores, thereby leading to a loss of the relief mechanism for crystallisation stress in smaller pores [79]. Hence, the pore connectivity of building materials will be important in determining their resistance to exfoliation, as it affects the ease with which ion solution can become disconnected and the rate of evaporation causing it [80]. The particular PSD possessed by some building materials, such as coral stones, makes them more resistant to damage from salt crystallisation processes, and efflorescence can arise at the surface but without internal structural damage [81]. The critical pore diameter (the diameter at percolation in mercury intrusion) was found to be larger, at ~15 μm, and the fraction of all pores with diameters larger than 0.5 μm was greater for coral stones than other types of common, ancient building stones, such as granite, limestone, sandstone, etc. Manohar and Santhanam [6,82] found that clay bricks with the most nanopores were the most susceptible to damage from salt crystallisation. In studies of sandstones from the city walls of Aachen, Germany, Kamh and Koltuk [76] found that initially the stone was resistant to damage, but, as the pore system filled up with salt crystals and secondary mineral deposits and so the typical pore sizes dropped to ~0.1–1 μm, the stone became prone to salt damage, and this susceptibility increased further as the pore sizes dropped down even more to ~0.05–0.5 μm. Hence, the degradation process can lead to positive feedback, whereby initial salt deposition leads to greater deposition still and, thence, damage.
The PSD is a key parameter in assessing the degree of decay of building materials like bricks because the materials associated with decay of bricks can accumulate in the pores [78]. In order to determine the physicomechanical modifications over time to ancient bricks from Toledo in Spain, modern experimental replicas were made using the same raw materials, and their pore structure was compared with that of their ancient counterparts using MP [74]. For example, this comparison showed for a brick taken from the Toledo fortress that the fraction of pores in the size range of 31.6–110 μm stayed the same, while that in the range of 0.316–3.16 μm dropped by 14.6% and that for pores with a size < 0.316 μm increased by 15%. It was suggested that the increase in small pores was caused by corrosion from fluid infiltration and that the loss of intermediate pore sizes was caused by cementation from saturated calcium carbonate solution derived from dissolution of primary calcite within the brick or from the lime mortar used.
Parameters obtained directly from mercury porosimetry data have been defined for characterising the durability of clay bricks. For example, Hansen and Kung [83] have defined a saturation coefficient as “the ratio of the threshold porosity to the total porosity (the [ratio of the] mercury intrusion volume corresponding to the threshold pore diameter to [that for] the total mercury intrusion volume)” [84]. In contrast, Maage suggested a durability index based on the porosity, and pore diameters larger than 3 μm could measure frost resistance [85]. Tang et al. [84] found that brick age and the resistance to efflorescence of ancient Chinese bricks correlated well with the Hansen and Kung saturation index and the Maage durability index for bricks with pores in the range of diameters 1–5 μm. Tang et al. [84] also found that there was a linear relationship between the volume increase in pores of diameters 1–5 μm and brick age, which suggested that the ratio of pores in this range to the total porosity could be used to assess the level of decay of a material due to environmental effects.
Coatings can be applied to building materials to reduce the porosity itself or its accessibility from the exterior to try to stop decay processes [79]. However, incomplete coating operations can actually increase the risk of structural deterioration due to the creation of the very smaller pores that enhance decay processes, like efflorescence, etc., by only achieving partial filling of the pores. The PSD after treatment is thus a key parameter to assess the effectiveness of treatments. Manohar et al. [79] tested the PSD for coated and uncoated samples of bricks following accelerated weathering. Due to the pore shielding (or “ink-bottle” pore) effect to which it is particularly prone, Manohar et al. [79] found that MP is, therefore, especially suitable for detecting the size changes in surface necks arising from coatings applied to the exterior surface. They found that the number of macropores decreased following weathering due to salt deposition within the pores. Higher salt deposition was also associated with macropore formation due to the induction of cracking. The highest degree of deterioration due to accelerated weathering occurred in those brick samples that had the highest amount of nanopores, with pores smaller than ~50 nm being especially problematic. Furthermore, Cardiano et al. [78] tested the coating of stone building materials with hydrophobic, fluorinated organic–inorganic hybrid materials. They used MP to find that the coating treatment led to a partial filling of macropores and thus a shift of the PSD towards smaller pores, but it did not improve the hydrophobic properties of the building materials.
Pore structure characterisation using GS and MP can also be used to assess the operation and effectiveness of conservation interventions. Absorbent cellulose poulticing is a method of desalination used to remove salts from ancient masonry to prevent damage from efflorescence. The PSD and tortuosity of the building materials play a role in the effectiveness of this sort of treatment, as they affect the capillarity of the pore structure. In general, the pore size of the substrate must be in proportion to that of the poultice for efficient desalination [6,82]. MP has been used to measure the PSD for modern, fired clay bricks before and after coating treatments, after accelerated weathering, and after desalination following accelerated weathered, as a test of the poulticing technique. The porosity values were compared for bricks exposed to accelerated weathering using sodium sulphate or sodium chloride solutions. These tests showed that the poulticing method used was more effective at removing sodium sulphate than sodium chloride salts from bricks. It was also found that for bricks with more macropores, sodium sulphate crystallisation and deposition was less favoured. For such bricks, the modal pore size did not change significantly before and after weathering or desalination. It was easier to remove salts with the poultice for brick samples containing relatively larger pores. In contrast, when the pore sizes were larger in the poultice than in the bricks, capillary suction failed to transport the salts from the bricks.
Stryszewska and Kańka [86] have studied the frost resistance of bricks. They used mercury porosimetry to obtain the pore size distribution of the materials studied. These workers found that bricks characterised by a prevalence of pores with diameters in the range of 1–10 μm did not show any signs of damage or powdering of bricks, as a result of freeze–thaw action. In contrast, bricks with pores in the ranges of 0.1–1.0 μm and 1–10 μm did show signs of flaking and cracking. In general, bricks with pores of less than 1 micron showed the least frost resistance.
Wesolowska et al. [87] looked at the susceptibility to moisture and thus frost resistance of ceramic building materials. They found that the ceramic materials that had been exposed to the outside environment were characterised by about double the initial rate of water absorption and by a different dominant size of pores and a different MP PSD when compared with ceramic materials stored under laboratory conditions.

4. Conclusions

It has been found that the typical descriptions of methods for gas sorption and mercury porosimetry experiments given in the heritage literature often fail to quote the values of key experimental parameters used that would enable repetition of the work and a proper comparison of void space descriptors between studies and samples. Gas sorption (GS) and mercury porosimetry (MP) have found many applications in the study of heritage materials. However, much of the potential repertoire of experiments possible with these techniques has yet to be exploited with heritage materials, thereby limiting the range of information that can be possibly obtained. In particular, gas over-condensation provides an alternative pore structural characterisation method to MP. While it can probe macropores like MP, it can also probe molecular-scale pores and does not have issues with the entrapment of residual probe fluid after the experiment. It can thus provide a fuller “fingerprint” of a sample void space than any other single technique and permits sample preservation and re-use, which are not possible with MP. However, mercury entrapment does also have its uses, as it can potentially be used as a probe fluid for thermoporometry to de-shield the PSD from MP, so entrapment can be advantageous after all. The invasive percolation nature of gas desorption and mercury intrusion makes them especially useful for probing the surface coatings of ancient ceramics and building materials and the impact of modern coatings in helping material preservation. Gas sorption and mercury porosimetry are particularly valuable in testing the efficacy of conservation techniques for heritage materials.

Funding

This research received no external funding.

Data Availability Statement

No new data were created or analyzed in this study. Data sharing is not applicable to this article.

Conflicts of Interest

The authors declare no conflict of interest.

References

  1. Rigby, S.P. Use of Computerised X-ray Tomography in the Study of the Fabrication Methods and Conservation of Ceramics, Glass and Stone Building Materials. Heritage 2024, 7, 5687–5722. [Google Scholar] [CrossRef]
  2. Bronitsky, G. The use of materials science techniques in the study of pottery construction and use. Adv. Archaeol. Method Theory 1986, 9, 209–276. [Google Scholar] [CrossRef]
  3. Sobott, R.; Bente, K.; Kittel, M. Comparative porosity measurements on ceramic materials. Old Potter’s Alm. 2014, 19, 18–25. [Google Scholar]
  4. Rigby, S.P.; Himona, E. Methods of Pore Structural Characterisation of Sedimentary Rocks and Their Constituent Minerals. Minerals 2024, 14, 756. [Google Scholar] [CrossRef]
  5. Heimann, R. Firing technologies and their possible assessment by modern analytical methods. In Archaeological Ceramics; Olin, J., Franklin, A., Eds.; Smithsonian Institute: Washington, DC, USA, 1982; pp. 89–96. [Google Scholar]
  6. Manohar, S.; Santhanam, M. Correlation between physical-mineralogical properties and weathering resistance using characterisation case studies in historic Indian bricks. Int. J. Archit. Herit. 2022, 16, 667–680. [Google Scholar] [CrossRef]
  7. Giesche, H. Mercury porosimetry: A general (practical) overview. Part. Part. Syst. Charact. 2006, 23, 9–19. [Google Scholar] [CrossRef]
  8. Rigby, S.P. Structural Characterisation of Natural and Industrial Porous Materials: A Manual; Springer International Publishing: Cham, Switzerland, 2020. [Google Scholar]
  9. Aukett, P.N.; Jessop, C.A. Assessment of connectivity in mixed meso/macroporous solids using nitrogen sorption. In Fundamentals of Adsorption; Kluwer Academic Publishers: Boston, MA, USA, 1996; pp. 59–66. [Google Scholar]
  10. Murray, K.L.; Seaton, N.A.; Day, M.A. An Adsorption-Based Method for the Characterization of Pore Networks Containing Both Mesopores and Macropores. Langmuir 1999, 15, 6728–6737. [Google Scholar] [CrossRef]
  11. Liu, Q.; Sun, M.; Sun, X.; Liu, B.; Ostadhassan, M.; Huang, W.; Chen, X.; Pan, Z. Pore network characterization of shale reservoirs through state-of-the-art X-ray computed tomography: A review. Gas Sci. Eng. 2023, 113, 204967. [Google Scholar] [CrossRef]
  12. Wang, Y.; Cheng, H. Advances in Microscopic Pore Structure Characterization of Fine-Grained Mudrocks. Energy Fuels 2023, 37, 1495. [Google Scholar]
  13. Van Brakel, J.; Modrý, S.; Svatá, M. Mercury porosimetry: State of the art. Powder Technol. 1981, 29, 1–12. [Google Scholar] [CrossRef]
  14. Drieu, L.; Horgnies, M.; Binder, D.; Pétrequin, P.; Pétrequin, A.-M.; Peche-Quilichini, K.; Lachenal, T.; Regert, M. Influence of porosity on lipid preservation in the wall of archaeological pottery. Archaeometry 2019, 61, 1081–1096. [Google Scholar] [CrossRef]
  15. Watt-Smith, M.; Edler, K.J.; Rigby, S.P. An Experimental Study of Gas Adsorption on Fractal Surfaces. Langmuir 2005, 21, 2281–2292. [Google Scholar] [CrossRef] [PubMed]
  16. Pitcher, E.G.; Fletcher, R.S.; Large, D.J.; Rigby, S.P. Pore structure–transport relationships in the Bowland Shale. In The Bowland Shale Formation, UK: Processes and Resources; Emmings, J.F., Parnell, J., Stephenson, M.H., Lodhia, B.E., Eds.; The Geological Society: London, UK, 2024; pp. 183–200. [Google Scholar]
  17. Volzone, C.; Zagorodny, N. Mercury intrusion porosimetry (MIP) study of archaeological pottery from Hualfin Valley, Catamarca, Argentina. Appl. Clay Sci. 2014, 91–92, 12–15. [Google Scholar] [CrossRef]
  18. Ning, C.; Jiang, Z.; Gao, Z.; Li, Z.; Zhu, R.; Su, S.; Li, T.; Wang, Z.; Huang, R.; Chen, L. Quantitative evaluation of pore connectivity with nuclear magnetic resonance and high pressure mercury injection: A case study of the lower section of Es3 in Zhanhua sag. J. China Univ. Min. Technol. 2017, 46, 578–584. [Google Scholar] [CrossRef]
  19. BS ISO 9277:2010; Determination of the Specific Surface Area of Solids by Gas Adsorption—BET Method. International Standards Organisation (ISO): Geneva, Switzerland, 2010.
  20. ASTM D4404–10; Standard Test Method for Determination of Pore Volume and Pore Volume Distribution of Soil and Rock by Mercury Intrusion Porosimetry. STM International: West Conshohocken, PA, USA, 2010.
  21. Facchini, A.; Malara, C.; Bazzani, G.; Cavallotti, P.L. Ancient Parchment Examination by Surface Investigation Methods. J. Colloid Interface Sci. 2000, 231, 213–220. [Google Scholar] [CrossRef]
  22. Zouridakis, N.M.; Economou, I.G.; Tzevelekos, K.P.; Kikkinides, E.S. Investigation of the physicochemical characteristics of ancient mortars by static and dynamic studies. Cem. Concr. Res. 2000, 30, 1151–1155. [Google Scholar] [CrossRef]
  23. Rispoli, C.; Esposito, R.; Guerriero, L.; Cappelletti, P. Ancient Roman Mortars from Villa del Capo di Sorrento: A Multi-Analytical Approach to Define Microstructural and Compositional Features. Minerals 2021, 11, 469. [Google Scholar] [CrossRef]
  24. Mousa, S.; Baron, K.; Fletcher, R.S.; Rigby, S.P. Triangulation of pore structural characterisation of disordered mesoporous silica using novel hybrid methods involving dual-probe porosimetries. Colloids Surf. A Physicochem. Eng. Asp. 2022, 653, 130026. [Google Scholar] [CrossRef]
  25. Theodoridou, M.; Ioannou, I.; Philokyprou, M. New evidence of early use of artificial pozzolanic material in mortars. J. Archaeol. Sci. 2013, 40, 3263–3269. [Google Scholar] [CrossRef]
  26. Rigby, S.P.; Jahan, H.; Stevens, L.; Uguna, C.; Snape, C.; Macnaughton, B.; Large, D.J.; Fletcher, R.S. Pore structural evolution of shale following thermochemical treatment. Mar. Pet. Geol. 2020, 112, 104058. [Google Scholar] [CrossRef]
  27. Portsmouth, R.L.; Gladden, L.F. Determination of pore connectivity by mercury porosimetry. Chem. Eng. Sci. 1991, 46, 3023–3036. [Google Scholar] [CrossRef]
  28. Kanth, A.P.; Singh, M.R.; Ganaraj, K. Spectroscopic and X-ray based microstructural investigation of the early-Harappan potsherds and estimation of firing temperature from Kunal archaeological site, India. Int. J. Conserv. Sci. 2022, 13, 131–146. [Google Scholar]
  29. Shi, J.; Chun, Q.; Feng, S.; Liu, C.; Liu, Z.; Wang, D.; Zhang, Y. Pore structure and fractal dimension analysis of ancient city wall bricks in China. J. Build. Eng. 2023, 76, 107324. [Google Scholar]
  30. Salvatore, A.; Vai, S.; Caporali, S.; Caramelli, D.; Lari, M.; Carretti, E. Evaluation of Diammonium hydrogen phosphate and Ca(OH)2 nanoparticles for consolidation of ancient bones. J. Cult. Herit. 2020, 41, 1–12. [Google Scholar]
  31. Gong, Y.; Qiao, C.; Yu, X.; Wang, J.; Gong, D. Study on the ancient putty from the site of the Ming Dynasty (1368–1644 CE) Baochuanchang Shipyard, Nanjing, China. J. Archaeol. Sci. Rep. 2019, 23, 189–195. [Google Scholar]
  32. De Boer, J.H. The Shapes of Capillaries. In The Structure and Properties of Porous Solids; Everett, D.H., Stone, F.S., Eds.; Butterworths Scientific Publications: London, UK, 1958; p. 68. [Google Scholar]
  33. Thommes, M.; Kaneko, K.; Neimark, A.V.; Olivier, J.P.; Rodriguez-Reinoso, F.; Rouquerol, J.; Sing, K.S.W. Physisorption of gases, with special reference to the evaluation of surface area and pore size distribution (IUPAC Technical Report). Pure Appl. Chem. 2015, 87, 1051–1069. [Google Scholar]
  34. Gregg, S.J.; Sing, K.S.W. Adsorption, Surface Area and Porosity; Academic Press Inc.: London, UK, 1982. [Google Scholar]
  35. Rigby, S.P. Novel hybrid methods provide greatly increased information on this important class of solids. Joh. Matthey Technol. Rev. 2018, 62, 296–312. [Google Scholar]
  36. Brunauer, S.; Emmett, P.H.; Teller, E. Adsorption of Gases in Multimolecular Layers. J. Am. Chem. Soc. 1938, 60, 309–319. [Google Scholar] [CrossRef]
  37. Walker, W.C.; Zettlemoyer, A.C. A dual-surface BET adsorption theory. J. Phys. Phys. Chem. 1948, 52, 47–58. [Google Scholar]
  38. Rigby, S.P.; Stevens, L.; Meersmann, T.; Pavloskaya, G.E.; Rees, G.J.; Henderson, J.; Bryant, S.J.; Edler, K.J.; Fletcher, R.S. Structural and chemical heterogeneity in ancient glass probed using gas overcondensation, X-ray tomography, and solid-state NMR. Mater. Charact. 2020, 167, 110467. [Google Scholar]
  39. Mahnke, M.; Mögel, H.J. Fractal Analysis of Physical Adsorption on Material Surfaces. Colloids Surf. A 2003, 216, 215–228. [Google Scholar]
  40. Pfeifer, P.; Wu, Y.J.; Cole, M.W.; Krim, J. Multilayer adsorption on a fractally rough surface. Phys. Rev. Lett. 1989, 62, 1997–2000. [Google Scholar]
  41. Urosevic, M.; Pardo, E.S.; Rutz-Agudo, E.; Cardell, C. Physical properties of carbonate rocks used as a modern and historic construction material in Eastern Andalusia, Spain. Mater. Constr. 2011, 61, 93–114. [Google Scholar]
  42. Goli, V.S.N.S.; Yadav, R.; Singh, M.R. Forensic investigations on 1900 years old brick and mortar samples from Buddhist stupa located at Nalasopara, India. Constr. Build. Mater. 2023, 367, 130281. [Google Scholar]
  43. Barrett, E.P.; Joyner, L.G.; Halenda, P.P. The Determination of Pore Volume and Area Distributions in Porous Substances. I. Computations from Nitrogen Isotherms. J. Am. Chem. Soc. 1951, 73, 373–380. [Google Scholar]
  44. Neimark, A.V.; Ravikovitch, P.I. Capillary Condensation in MMS and Pore Structure Characterization. Microporous Mesoporous Mater. 2001, 44, 697–707. [Google Scholar]
  45. Washburn, E.W. The Dynamics of Capillary Flow. Phys. Rev. 1921, 17, 273. [Google Scholar]
  46. Zhang, J.; Xiao, H.; Chen, Y.; Qi, J.; Xie, J.; Huang, X.; Jiang, Y. Porosity and pore size distribution of recent and ancient buried phoebe zhennan wood determined by mercury intrusion porosimetry. Wood Res. 2021, 66, 277–283. [Google Scholar]
  47. Liabastre, A.A.; Orr, C. Evaluation of pore structure by mercury penetration. J. Colloid Interface Sci. 1978, 64, 1–18. [Google Scholar]
  48. Kloubek, J. Hysteresis in porosimetry. Powder Technol. 1981, 29, 63–73. [Google Scholar]
  49. Rigby, S.P. New methodologies in mercury porosimetry. Stud. Surf. Sci. Cat. 2000, 144, 185–192. [Google Scholar]
  50. Rigby, S.P.; Edler, K.J. The influence of mercury contact angle, surface tension and retraction mechanism on the interpretation of mercury porosimetry data. J. Colloid Interface Sci. 2002, 250, 175–190. [Google Scholar] [CrossRef]
  51. Lawrence, R.M.; Mays, T.J.; Rigby, S.P.; Walker, P.; D’Ayala, D. Effects of carbonation on the pore structure of non-hydraulic lime mortars. Cem. Concr. Res. 2007, 37, 1059–1069. [Google Scholar]
  52. Perkins, E.L.; Lowe, J.P.; Edler, K.J.; Tanko, N.; Rigby, S.P. Determination of the percolation properties and pore connectivity for mesoporous solids using NMR cryodiffusometry. Chem. Eng. Sci. 2008, 63, 1929–1940. [Google Scholar]
  53. Wardlaw, N.C.; McKellar, M. Mercury porosimetry and the interpretation of pore geometry in sedimentary rocks and artificial models. Powder Technol. 1981, 29, 127–143. [Google Scholar]
  54. Tsakiroglou, C.D.; Payatakes, A.C. Mercury intrusion and retraction in model porous media. Adv. Colloid Interface Sci. 1998, 75, 215–253. [Google Scholar]
  55. Bafarawa, B.; Nepryahin, A.; Lu, J.; Holt, E.M.; Wang, J.; Rigby, S.P. Combining mercury thermoporometry with integrated gas sorption and mercury porosimetry to improve accuracy of pore-size distributions for disordered solids. J. Colloid Interface Sci. 2014, 426, 72–79. [Google Scholar] [CrossRef]
  56. Alié, C.; Pirard, R.; Pirard, J.P. Mercury porosimetry applied to porous silica materials: Successive buckling and intrusion mechanisms. Colloids Surf. A Physicochem. Eng. Asp. 2001, 187–188, 367–374. [Google Scholar]
  57. Pirard, R.; Alié, C.; Pirard, J.P. Characterization of porous texture of hyperporous materials by mercury porosimetry using densification equation. Powder Technol. 2002, 128, 242–247. [Google Scholar]
  58. Seaton, N.A. Determination of the connectivity of porous solids from nitrogen sorption measurements. Chem. Eng. Sci. 1991, 46, 1895–1909. [Google Scholar] [CrossRef]
  59. Ghanbarian, B.; Hunt, A.G.; Ewing, R.P.; Sahimi, M. Tortuosity in Porous Media: A Critical Review. Soil Sci. Soc. Am. J. 2013, 77, 1461–1477. [Google Scholar] [CrossRef]
  60. Androutsopoulos, G.P.; Salmas, C.E. A New Model for Capillary Condensation−Evaporation Hysteresis Based on a Random Corrugated Pore Structure Concept:  Prediction of Intrinsic Pore Size Distributions. 1. Model Formulation. Ind. Eng. Chem. Res. 2000, 39, 3747–3763. [Google Scholar] [CrossRef]
  61. Lester, E.; Hilal, N.; Henderson, J. Porosity in ancient glass from Syria (c. 800 AD) using gas sorption and atomic force microscopy. Surf. Interface Anal. 2004, 36, 1323–1329. [Google Scholar] [CrossRef]
  62. Sanders, H.P. Pore-size distribution determinations in Neolithic, iron age, Roman and other pottery. Archaeometry 1973, 15, 159–161. [Google Scholar] [CrossRef]
  63. Morariu, V.; Bogdan, M.; Ardelean, I. Ancient pottery: Its pore structure. Archaeometry 1977, 19, 187–192. [Google Scholar] [CrossRef]
  64. Drieu, L.; Peche-Quilichini, K.; Lachenal, T.; Regert, M. Domestic activities and pottery use in the iron age Corsican settlement of Cuciurpula revealed by organic residue analysis. J. Archaeol. Sci. Rep. 2018, 19, 213–223. [Google Scholar] [CrossRef]
  65. Rice, P.M. Pottery Analysis: A Sourcebook; The University of Chicago Press: Chicago, IL, USA, 1987. [Google Scholar]
  66. Cayme, J.-M.; Palm, R.; Somelar, P.; Vahur, S.; Leito, I.; Oras, E. Influence of mineral composition and firing temperature on the micro- and mesoporosity of replicate archaeological ceramics. Clays Clay Miner. 2024, 72, 1–14. [Google Scholar] [CrossRef]
  67. Evershed, R.P. Experimental approaches to the interpretation of absorbed organic residues in archaeological ceramics. World Archaeol. 2008, 40, 26–47. [Google Scholar] [CrossRef]
  68. Namdar, D.; Stacey, R.J.; Simpson, S.J. First results on thermally induced porosity in chlorite cooking vessels from Merv (Turkmenistan) and implications for the formation and preservation of archaeological lipid residues. J. Archaeol. Sci. 2009, 36, 2507–2516. [Google Scholar] [CrossRef]
  69. Lapp, E.C. A water absorption analysis of Nabatean, North African and other clay lamp fabrics unearthed at the Red Sea port of Roman Aila (Aqaba, Jordan). Archaeometry 2012, 54, 56–79. [Google Scholar] [CrossRef]
  70. Reid, K. Fire and ice: New evidence for the production and preservation of Late Archaic fiber-tempered pottery in the middle-latitude lowlands. Am. Antiq. 1984, 49, 55–76. [Google Scholar] [CrossRef]
  71. Xu, K.; Tremsin, A.S.; Li, J.; Ushizima, D.M.; Davy, C.A.; Bouterf, A.; Su, Y.T.; Marroccoli, M.; Mauro, A.M.; Osanna, M.; et al. Microstructure and water absorption of ancient concrete from Pompeii: An integrated synchrotron microtomography and neutron radiography characterization. Cem. Concr. Res. 2021, 139, 106282. [Google Scholar]
  72. Münch, B.; Holzer, L. Contradicting geometrical concepts in pore size analysis attained with electron microscopy and mercury intrusion. J. Am. Ceram. Soc. 2008, 91, 4059–4067. [Google Scholar]
  73. Brai, M.; Casieri, C.; De Luca, F.; Fantazzini, P.; Gombia, M.; Terenzi, C. Validity of NMR pore-size analysis of cultural heritage ancient building materials containing magnetic impurities. Solid State Nucl. Magn. Reson. 2007, 32, 129–135. [Google Scholar]
  74. Lopez-Acre, P.; Benavente, D.; Garcia-Guinea, J. Durability improvement of ancient bricks by cementation of porous media. J. Am. Ceram. Soc. 2005, 88, 2564–2572. [Google Scholar]
  75. Brunello, V.; Canevali, C.; Corti, C.; De Kock, T.; Rampazzi, L.; Recchia, S.; Sansonetti, A.; Tedeschi, C.; Cnudde, V. Understanding the Microstructure of Mortars for Cultural Heritage Using X-ray CT and MIP. Materials 2021, 14, 5939. [Google Scholar] [CrossRef]
  76. Kamh, G.M.E.; Koltuk, S. Micro-topographic and geotechnical investigations of sandstone wall on weathering progress, Aachen city, Germany, case study. Arab. J. Sci. Eng. 2016, 41, 2284–2294. [Google Scholar] [CrossRef]
  77. D’Orazio, M.; Stazi, A. Dynamic of moisture transfer in ancient plasters. J. Cult. Herit. 2006, 7, 116–122. [Google Scholar]
  78. Cardiano, P.; Ioppolo, S.; De Stefano, C.; Pettignano, A.; Sergi, S.; Piraino, P. Study and characterization of the ancient bricks of monastery of “San Filippo di Fragalà” in Frazzanò (Sicily). Anal. Chim. Acta 2004, 519, 103–111. [Google Scholar]
  79. Manohar, S.; Santhanam, M.; Chockalingam, N. Performance and microstructure of bricks with protective coatings subjected to salt weathering. Constr. Build. Mater. 2019, 226, 94–105. [Google Scholar]
  80. Manohar, S.; Chockalingam, N.; Santhanam, M. Experimental comparison between salt weathering testing procedures on different types of bricks. J. Mater. Civ. Eng. 2021, 33, 04021305. [Google Scholar] [CrossRef]
  81. Manohar, S.; Bala, K.; Santhanam, M.; Menon, A. Characteristics and deterioration mechanisms in coral stones used in a historical monument in a saline environment. Constr. Build. Mater. 2020, 241, 118102. [Google Scholar]
  82. Manohar, S.; Santhanam, M. Use of poulticing in desalination of masonry units–implications on salt-deteriorated structures. Curr. Sci. 2021, 121, 1307–1315. [Google Scholar]
  83. Hansen, W.; Kung, J.W. Pore structure and frost durability of clay bricks. Mater. Struct. 1988, 21, 443–447. [Google Scholar]
  84. Tang, Y.; Shao, Z.; Xu, T. Pore structure of ancient Chinese bricks under environmental vicissitudes. KSCE J. Civ. Eng. 2016, 20, 1895–1902. [Google Scholar]
  85. Maage, M. Frost resistance and pore size distribution in bricks. Mater. Str. 1983, 17, 345–350. [Google Scholar] [CrossRef]
  86. Stryszewska, T.; Kańka, S. Forms of Damage of Bricks Subjected to Cyclic Freezing and Thawing in Actual Conditions. Materials 2019, 12, 1165. [Google Scholar] [CrossRef]
  87. Wesolowska, M.; Kaczmarek, A.; Hola, J. The Influence of External Environmental Conditions on Properties of Ceramic Building Materials with Waste Material Additives. Materials 2021, 14, 2982. [Google Scholar] [CrossRef]
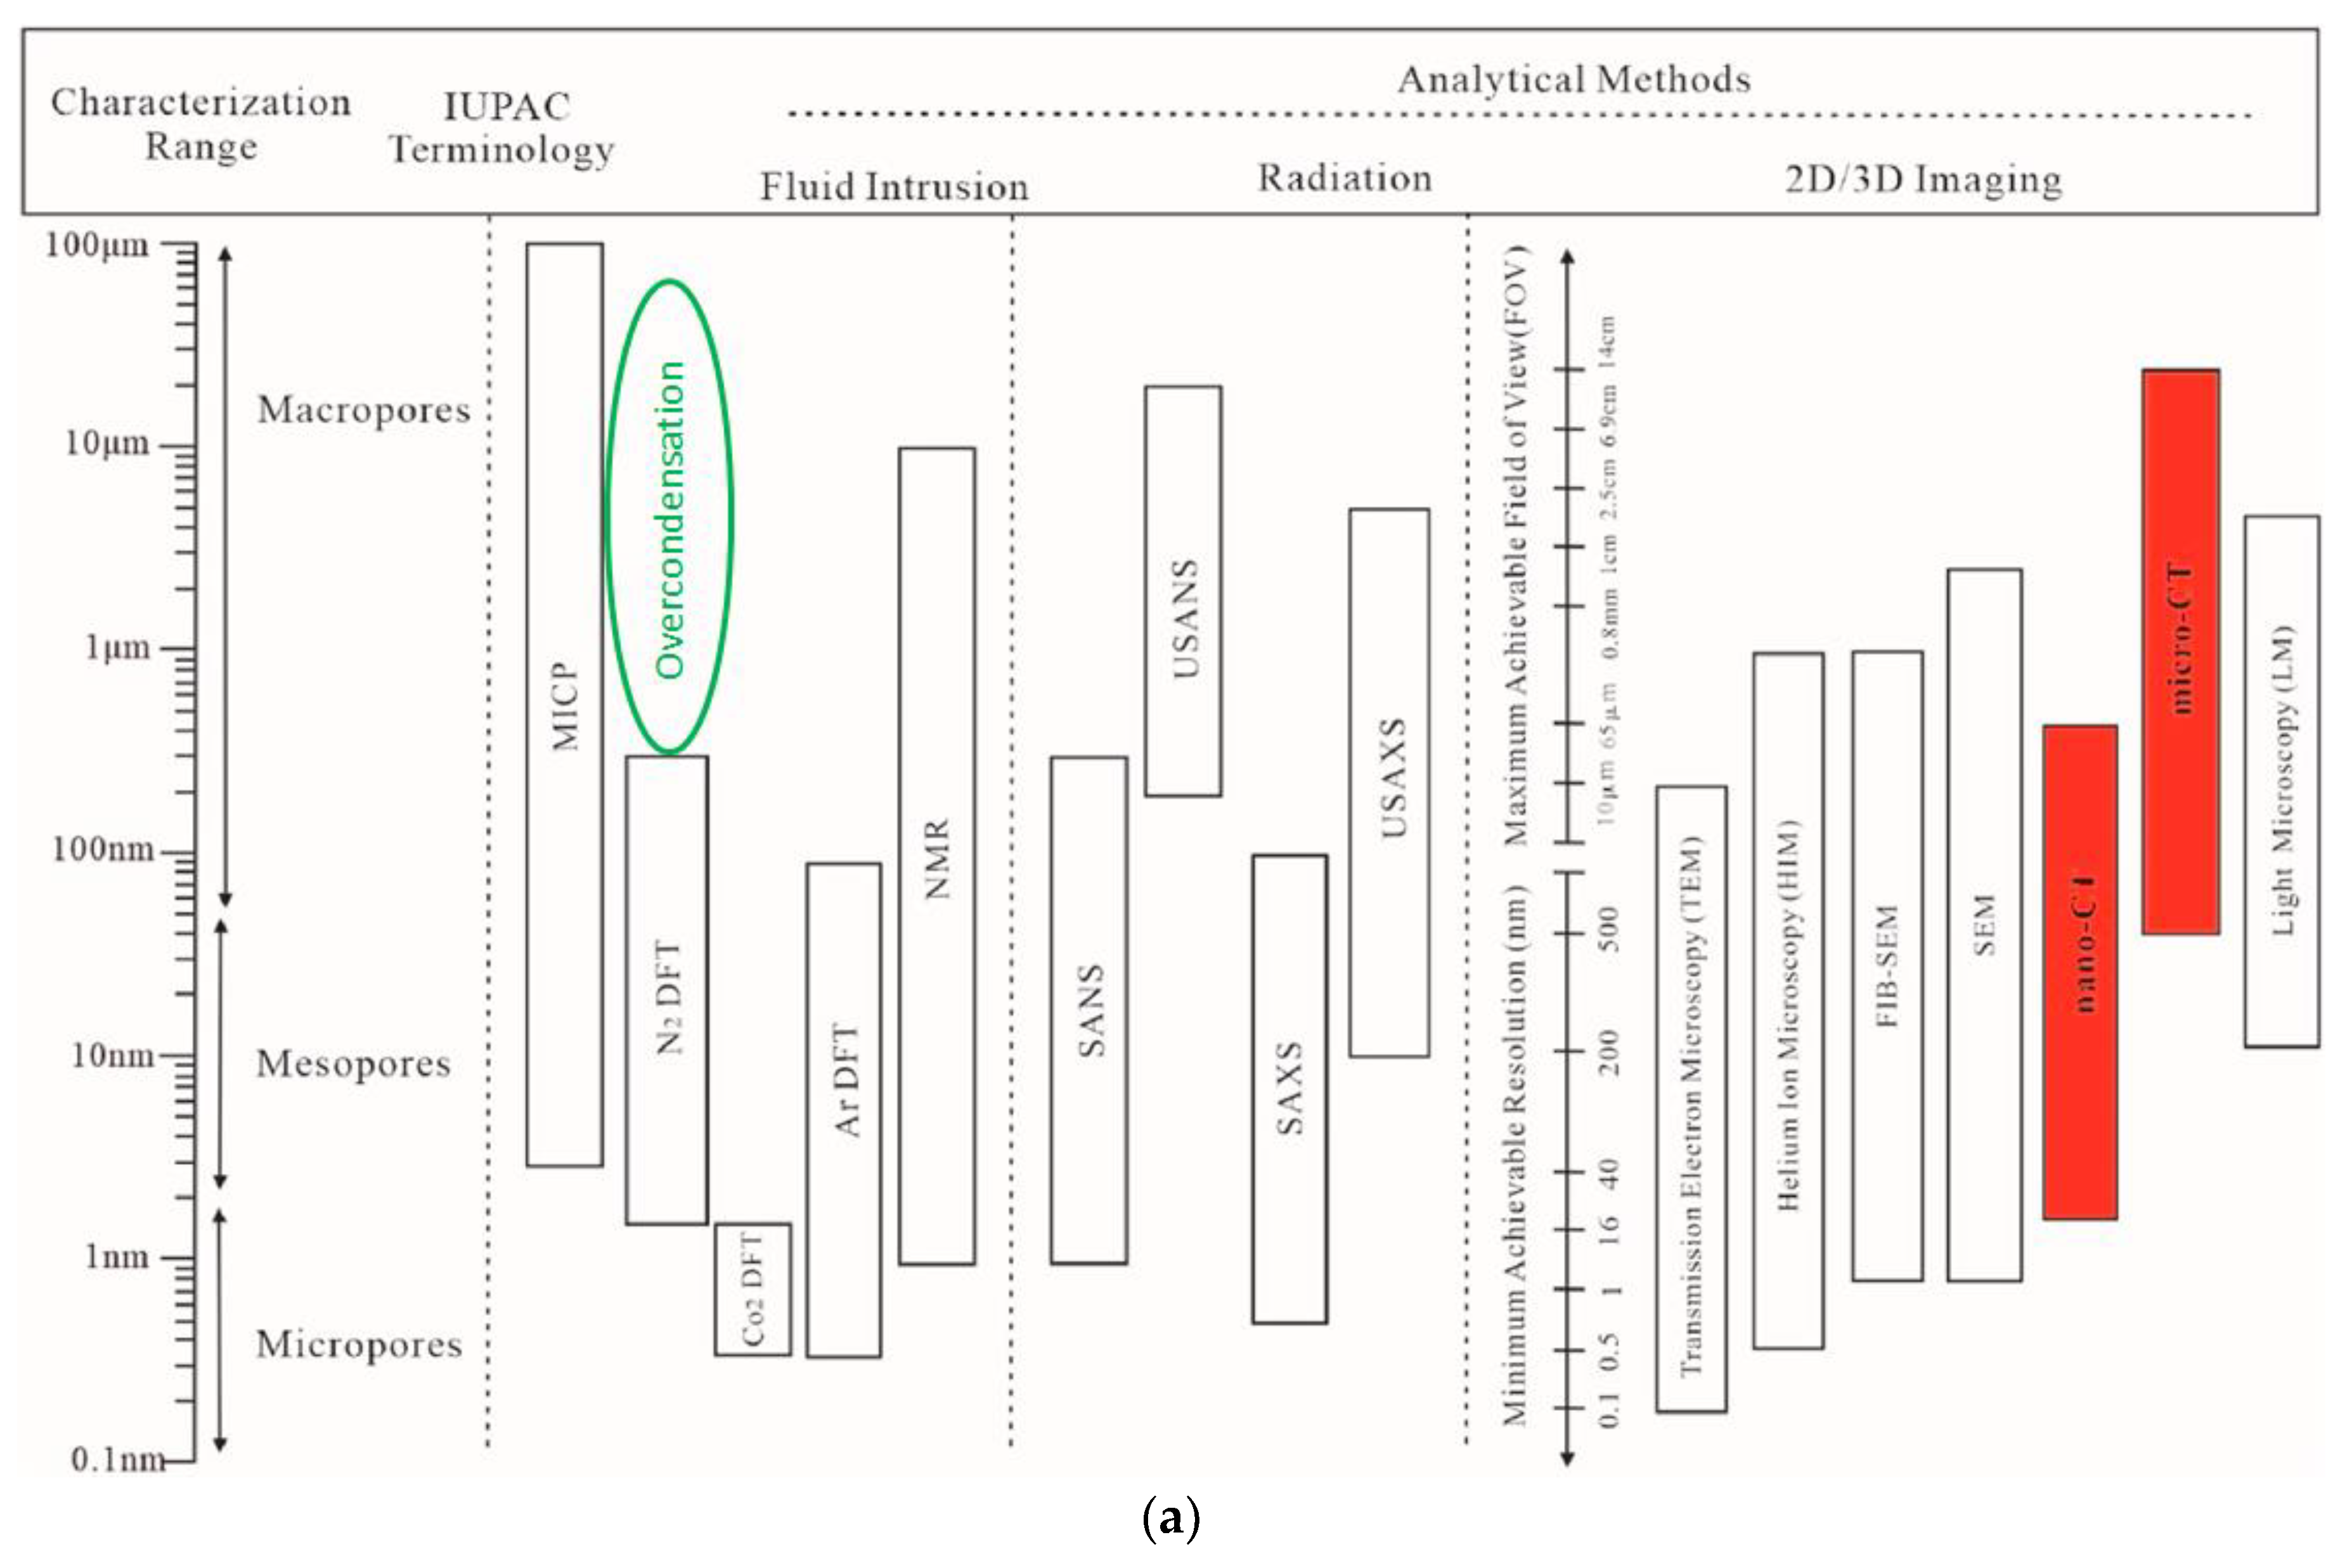
Figure 1. (a) Methods used for pore structure characterisation (adapted from Liu et al. [11]). Reprinted from Gas Science and Engineering, Vol. 113, Liu, Q.; Sun, M.; Sun, X.; Liu, B.; Ostadhassan, M.; Huang, W.; Chen, X.; Pan, Z., Pore network characterization of shale reservoirs through state-of-the-art X-ray computed tomography: A review, 204967, Copyright (2023), with permission from Elsevier. (b) Generalised detectable pore diameter range of different pore structural characterisation techniques. Reprinted (adapted) with permission from Wang, Y. and Cheng, H., Advances in Microscopic Pore Structure Characterization of Fine-Grained Mudrocks. Energy & Fuels 2023, 37, 1495 [12]. Copyright 2023 American Chemical Society. In both cases, the added green oval represents the range of applicability of the neglected gas sorption technique of over-condensation.
Heritage 08 00132 g001aHeritage 08 00132 g001b
Figure 2. A schematic representation of mini-hysteresis loops on the overall intrusion and extrusion curves. Reprinted from Chemical Engineering Science, 46(12), Portsmouth RL, Gladden LF, Determination of pore connectivity by mercury porosimetry, 3023–3036, Copyright (1991), with permission from Elsevier [27]. The upper-case letter labels denote particular positions around the porosimetry curves. The lower-case letter labels denote individual arcs of the scanning loops.
Heritage 08 00132 g002
Figure 3. Ascending adsorption scanning curves (starting at relative pressures of 0.6 and 0.8) and corresponding descending desorption curves (indicated by the descending arrow) for scanning loops starting on the over-condensation boundary desorption isotherm (solid line) and conventional isotherms for a hydrothermally treated sample of Rempstone shale (black circles). Reproduced under a Creative Commons CC-BY License [26].
Heritage 08 00132 g003
Figure 4. Mercury porosimetry curve (volume variation as a function of mercury pressure) for a sample of silica xerogel. Reprinted from Powder Technology 128, Pirard, R.; Alié, C.; Pirard, J.P., Characterization of porous texture of hyperporous materials by mercury porosimetry using densification equation, pp. 242–247, Copyright (2002), with permission from Elsevier [57].
Heritage 08 00132 g004
Figure 5. Schematic diagram depicting pore geometry and results anticipated from gas sorption experiments with (a) nanopore-connected macropore in conventional adsorption experiment, (b) disconnected macropore in over-condensation experiment, and (c) nanopore-connected macropore in over-condensation experiment. The dark (blue) shading indicates the presence of condensate, while the light (blue) shading indicates an empty pore or vapour only. The dotted line indicates bulk condensation pressure. Reprinted from Rigby et al. [38] under Creative Commons CC-BY Licence.
Heritage 08 00132 g005
Figure 6. Hysteresis loop region of conventional nitrogen sorption isotherms (×) and over-condensation boundary desorption isotherm (+) for chip sample of ancient Roman glass from Beirut. The solid and dashed lines are the conventional adsorption isotherm data with the relative pressures raised to the powers of 1.8 and 2.0, respectively. Reprinted from Rigby et al. [38] under Creative Commons CC-BY Licence.
Heritage 08 00132 g006
Figure 7. Illustration of the two different concepts of the “continuous pore size distribution (PSD)” and the “discrete PSD”. The star-like prism displayed to the upper left represents a model pore of rather simple geometry. In the case of 2D analysis, the radius of its coextensive circle is considered the only pore size yielded by the “discrete PSD”. In the case of the “continuous PSD” definition, the single pore object is resolved into its entire size spectrum. It is important to note that for a simplified pore structure without pore necks (such as the presented star-like prism), the “ink-bottle effect” disappears, and the results from the “continuous PSD” and from Mercury Intrusion Porosimetry would give identical results. Reprinted with permission from Ref. [72]. 2008, John Wiley and Sons.
Heritage 08 00132 g007
Disclaimer/Publisher’s Note: The statements, opinions and data contained in all publications are solely those of the individual author(s) and contributor(s) and not of MDPI and/or the editor(s). MDPI and/or the editor(s) disclaim responsibility for any injury to people or property resulting from any ideas, methods, instructions or products referred to in the content.