Article

Green One-Step Synthesis and Characterization of Fluorescent Carbon Quantum Dots from PET Waste as a Dual-Mode Sensing Probe for Pd(II), Ciprofloxacin, and Fluoxetine via Fluorescence Quenching and Enhancement Mechanisms

by
Christian Ebere Enyoh
1,*,
Qingyue Wang
1,*,
Weiqian Wang
1,
Miho Suzuki
1,
Go Masuda
1,
Daisuke Nakajima
2 and
Senlin Lu
3
1
Graduate School of Science and Engineering, Saitama University, 255 Shimo-Okubo, Sakura-ku, Saitama 338-8570, Japan
2
Research Center for Environmental Risk, National Institute for Environmental Studies, 16-2 Onogawa, Tsukuba 305-8506, Ibaraki, Japan
3
School of Environmental and Chemical Engineering, Shanghai University, 99 Shangdalu, Baoshan District, Shanghai 200444, China
*
Authors to whom correspondence should be addressed.
Surfaces 2025, 8(2), 24; https://doi.org/10.3390/surfaces8020024
Submission received: 7 March 2025 / Revised: 29 March 2025 / Accepted: 1 April 2025 / Published: 3 April 2025

Abstract

:
In this study, we report a green, one-step synthesis of fluorescent carbon quantum dots (PET-FCQDs) derived from polyethylene terephthalate (PET) waste using an environmentally friendly pyrolytic method. The PET-FCQDs were systematically characterized using techniques such as UV-Vis spectroscopy, fluorescence spectroscopy, ATR-FTIR, TGA, and fluorescence microscope, confirming their nanoscale size (2–50 nm), rich functional groups and thermal stability. Thermal stability and dynamics evaluated by the Coats–Redfern method showed endothermic reactions with an activation energy of 88.84–125.05 kJ/mol. Density functional theory studies showed a binding energy, highest occupied molecular orbital, lowest unoccupied molecular orbital, and energy gap of −675.39, −5.23, −5.07, and 0.17 eV, respectively. The as-synthesized PET-FCQDs demonstrated excellent optical properties with quantum yield ( Φ ) of 49.6% and were applied as a dual-mode fluorescent sensing probe for the detection of Pd2+, ciprofloxacin (CIP), and fluoxetine (FLX) in aqueous systems via fluorescence quenching and enhancement mechanisms. For Pd2+, the fluorescence emission intensity at 470 nm was quenched proportionally to the increasing concentration, while CIP and FLX induced fluorescence enhancement. The Stern–Volmer analysis confirmed strong interaction between the analytes and PET-FCQDs, distinguishing dynamic quenching for Pd2+ and static interactions for CIP and FLX. The method exhibited linear detection ranges of 1–10 mg/L for Pd2+, 50–150 µg/L for CIP, and 100–400 ng/L for FLX, with corresponding limits of detection (LOD) of 1.26 mg/L, 3.3 µg/L, and 134 ng/L, respectively. Recovery studies in spiked tap water and river water samples demonstrated the practical applicability of PET-FCQDs, although matrix effects were observed, particularly for FLX. This work not only highlights a sustainable route for PET waste upcycling but also demonstrates the potential of PET-FCQDs as cost-effective, sensitive, and versatile fluorescent probes for environmental monitoring of heavy metal ions and pharmaceutical pollutants. Further optimization of the sensing platform could enhance its selectivity and performance in real-world applications.

Graphical Abstract

1. Introduction

The pervasive issue of plastic pollution, especially from polyethylene terephthalate (PET), has become a significant environmental and public health concern [1,2]. PET, widely used in beverage bottles and food packaging, is non-biodegradable and persists in ecosystems, posing a long-term threat to both terrestrial and aquatic environments [3]. As global PET production continues to rise, finding sustainable and efficient recycling methods has become crucial. Converting PET waste into value-added products not only mitigates environmental pollution but also contributes to the circular economy [4]. Researchers are actively investigating technologies for recycling and disposing of plastic waste to mitigate environmental impacts. Although thermocatalysis has been used to convert waste plastics into carbon fuels and other reusable materials, its widespread use is constrained by the high temperatures, pressures, and reliance on precious metals required for the process [5]. Alternative methods such as depolymerization and thermochemical conversion are being explored to create sustainable, circular materials from plastic waste [6]. Furthermore, advanced gasification techniques—including microwave-assisted, plasma-assisted, and catalyst-based methods—have been developed to improve energy efficiency and increase product selectivity [7]. Nevertheless, a greener and more efficient approach to plastic waste treatment remains necessary [8].
One promising solution involves upcycling PET plastic waste into a variety of carbon-based nanomaterials, such as hierarchical porous carbon, carbon nanotubes, graphene, carbon quantum dots (CQDs), and carbon-based composites [9,10]. PET waste, with its abundant carbon content, is an ideal candidate for producing these advanced materials. The aromatic rings in PET provide high strength and modulus [1], making it a robust polymer composed of ethylene and terephthalate units. PET’s properties—ranging from its amorphous, semi-crystalline, or crystalline states—are influenced by factors such as cooling rate, additives, and thermal treatment [11]. Additionally, PET demonstrates excellent electrical properties, high thermal stability, and strong resistance to oils, alcohols, aliphatic hydrocarbons, and diluted acids [12]. Utilizing carbon-rich precursors like PET waste, pyrolysis has emerged as an effective method to convert plastic into carbon nanomaterials [13,14,15]. This approach not only reduces plastic pollution but also contributes to global carbon sequestration efforts, presenting a sustainable pathway for managing plastic waste while generating valuable carbon-based materials. These carbon materials have gained significant attention due to their unique optical properties, low toxicity, chemical stability, and environmentally friendly synthesis routes [16]. They have been reported to have a wide range of applications, including bioimaging, sensing, catalysis, and water purification, making them attractive for both environmental and technological purposes [8,16].
This study focuses on the sustainable synthesis of fluorescent carbon dots (FCQDs) from PET plastic waste through a simple method. Comprehensive characterization techniques are employed to analyze the structural, optical, fluorescence, and thermal properties of the synthesized FCQDs. In addition, the study evaluates the thermal stability of PET-derived carbon dots (PET-FCQDs) using thermogravimetric analysis (TGA) and kinetic modeling approaches, providing insights into their decomposition behavior. Furthermore, the potential of PET-FCQDs as sensor probes for heavy metals such as palladium (Pd2+) and emerging pharmaceutical pollutants, including fluoxetine (FLX) and ciprofloxacin (CIP) from water, was evaluated based on fluorescence quenching and enhancement techniques, offering an efficient approach to low-level detection of environmental and pharmaceutical contaminants.
Pd2+ concentrations in the general environment are rising due to its growing usage in automotive catalysts, although environmental exposure and dietary intake remain negligible, and levels of palladium in water, soil, and ambient air are not high [17]. Studies on the mechanism of Pd2+ toxicity indicate that it is very hazardous when assessed at the cellular level in the kidney and liver over an extended period of time [18]. FLX, an antidepressant, has also been found in water bodies worldwide in ng/L and can negatively impact aquatic life [19]. Similarly, CIP is an antibiotic, widely used in medical and agricultural contexts, that has become an unexpected environmental contaminant [20]. FLX and CIP journey into ecosystems is multifaceted—originating from pharmaceutical manufacturing waste, hospital effluents, agricultural runoff, and human and animal excretion. Their pollution affects aquatic life, disrupting endocrine systems and behavior in fish and other organisms. Long-term exposure raises concerns about ecosystem health and biodiversity [21,22].
Because of this, it is very important to detect Pd2+, FLX, and CIP in the environment. The need to detect these pollutants can be met by using conventional investigative techniques like UV-visible, spectroscopic, and chromatographic techniques [19,20,23]. However, expensive equipment, difficult sample preparation, and challenging experimental processing limit their use. In addition to previous approaches, fluorescence-based sensing provides a quick, easy, inexpensive, and quantitative way to find Pd2+, FLX, and CIP in aqueous conditions. However, there is a dearth of research on the use of CQDs made from PET plastic waste for fluorometric sensing of Pd2+, FLX, and CIP. The scope of the present study has been further expanded by the fact that it is extremely difficult to build an efficient fluorescent-based probe for the selective and sensitive detection of Pd2+, FLX, and CIP in aqueous conditions. Water samples from a variety of natural sources are used to evaluate the created particles’ sensing ability. Advanced nanoparticles have been rationalized as an alternative greener sensory probe for Pd2+, FLX, and CIP in aqueous conditions, and their widespread interest in technological applications has been heightened by the low-cost, green synthetic production technique that is easy to scale up. In addition to addressing plastic pollution, this research investigates a novel use in environmental sensing and remediation by turning PET waste into functional CQDs.

2. Materials and Methods

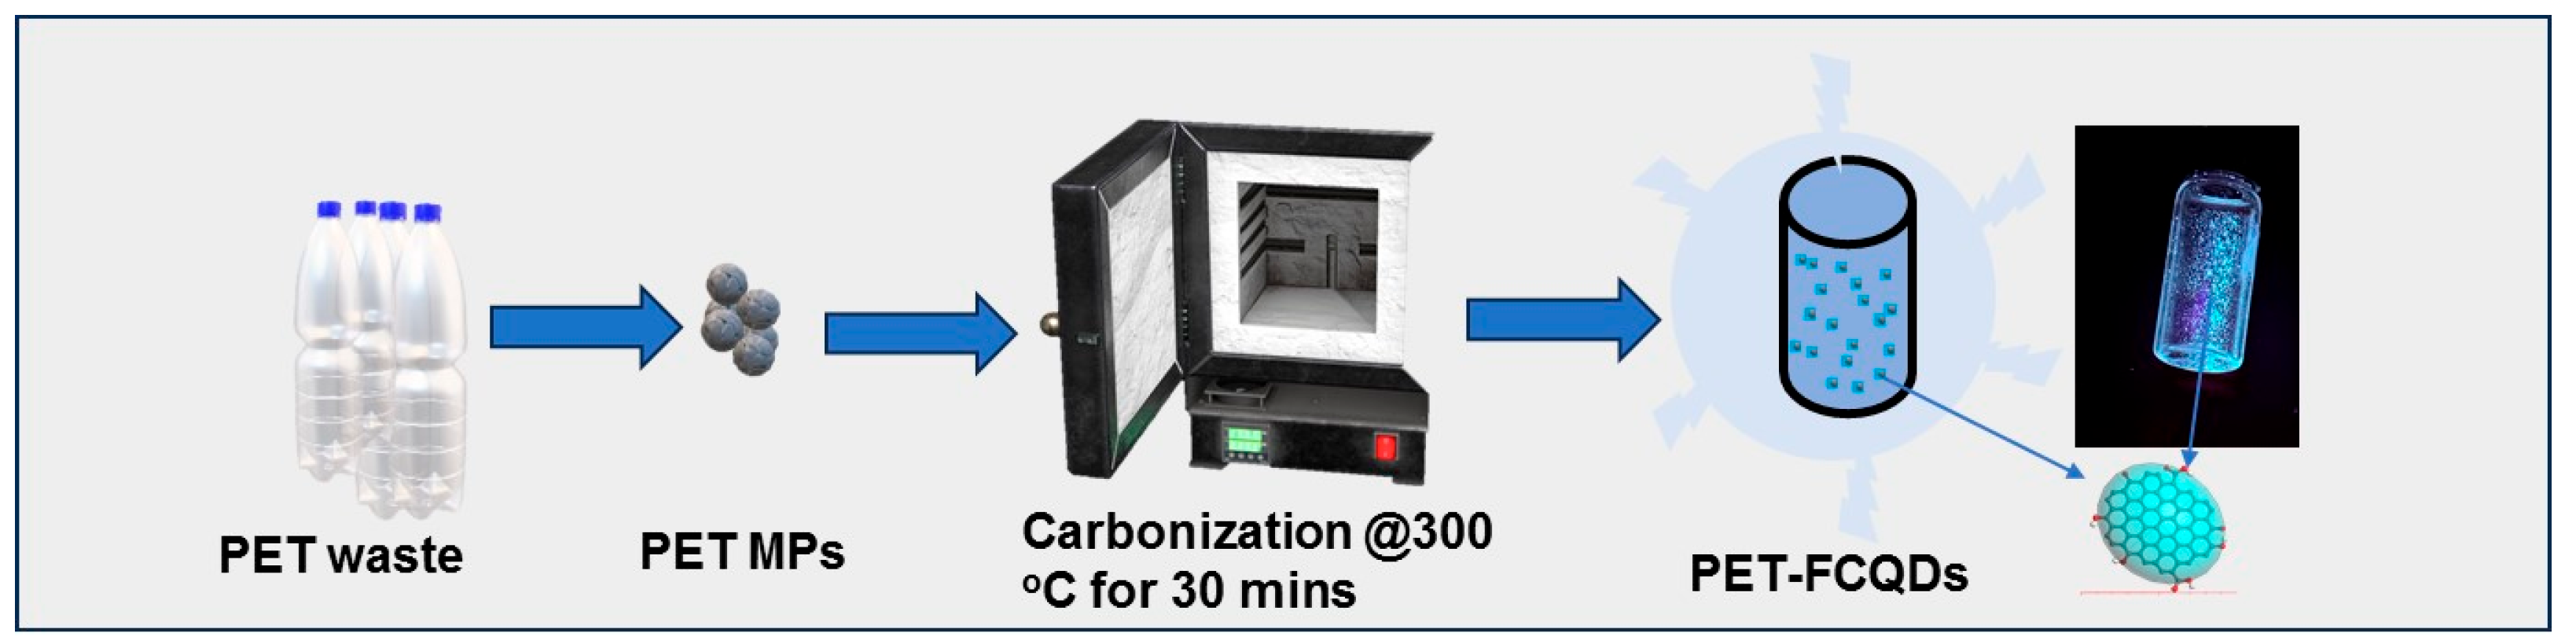
2.1. Chemicals and Preparation of Fluorescent Carbon Quantum Dots

Wako Pure Chemical Industries, Osaka, Japan, provided the palladium, ciprofloxacin (CIP: C17H18FN3O3, analytical grade, 98%), and fluoxetine (FLX: C17H18F3NO·HCl, analytical grade, 98%). Without any additional purification, the chemicals were utilized just as they were sent by the manufacturer. All experiments were carried out using ultrapure water (Direct Q-3UV, Merck KGaA, Darmstadt, Germany), unless otherwise noted.
Disposable water bottles made of commercial-grade PET were used as the source material to obtain the microplastics (MPs) required for CQD synthesis. The preparation of PET MPs has been thoroughly detailed in previous studies [20]. PET-derived fluorescent carbon quantum dots (PET-FCQDs) were synthesized using a simple, one-step pyrolysis method (Figure 1).
In this process, 1 g of PET MPs was placed in a ceramic crucible and heated in a muffle furnace (Sibata Ceramic CM-150, Sibata Scientific Technology, Ltd., Tokyo, Japan) to 300 °C at a controlled heating rate of 10 °C/min. The temperature was maintained at 300 °C for 30 min. Following carbonization, the resulting black powder was allowed to cool and then finely ground using a mortar and pestle. To prepare an aqueous solution for future applications, 1 g of the ground powder was dissolved in 10 mL of ultrapure water, resulting in a solution with a concentration of 0.1 g/mL. This straightforward synthesis method demonstrates the efficient conversion of PET waste into high-yield FCQDs suitable for further characterization and applications.

2.2. Analytical Techniques

The characterization of PET-FCQDs was conducted using various analytical techniques to determine their optical, structural, and thermal properties. The absorbance and emission spectra of PET-FCQDs were measured using a UV-VIS spectrophotometer (UVmini-1240, Shimadzu, Kyoto, Japan) and a fluorescence spectrophotometer (RF-5300PC, Shimadzu, Kyoto, Japan). These measurements provided insights into the photoluminescent behavior of the samples. The size and morphology of the PET-FCQDs (20 µL sample) were examined using a fluorescent microscope (MX6300, Meiji Techno Co., Saitama-ken, Japan) equipped with a 4K Moticam4000 microscope camera. The analysis was conducted under visible light at a nanometer scale with a 100× magnification. The captured fluorescent microscope images were further processed and analyzed for size and shape using Motic Image Plus 2.3S software. Functional group analysis: Functional groups present on the surface of PET-FCQDs were identified using Attenuated Total Reflectance-Fourier Transform Infrared (ATR-FTIR) spectroscopy (JASCO FTIR-6100). Before measurement, the instrument was calibrated by blanking to ensure accuracy. The PET-FCQDs were securely positioned on the ATR crystal (diamond) for analysis. Infrared spectra were recorded in the range of 400–4000 cm−1, averaging 64 scans at a resolution of 4 cm−1. This analysis provided molecular-level information about the surface composition, which is critical for understanding potential environmental degradation effects. Thermal stability and degradation analysis: The thermal stability and degradation behavior of the PET-FCQDs were studied using a thermogravimetric–differential thermal analysis (TG-DTA) system (DTG-60, Shimadzu Corporation, Kyoto, Japan). For each analysis, 5 mg of the sample was placed in a platinum crucible. The furnace chamber was purged with argon gas for 15 min to establish an inert atmosphere. The temperature was then ramped from room temperature to 700 °C at a rate of 10 °C/min under an argon flow rate of 100 mL/min. Continuous monitoring of the weight loss allowed for the generation of derivative thermogravimetric (DTG) curves, which provided insights into the thermal degradation mechanisms and stability of the PET-FCQDs.

2.3. Thermal Stability Modeling

TGA is used to investigate the thermal breakdown of PET-FCQDs, and the changes in conversion rate over time and temperature under different thermal conditions can reveal details about the degradation process, including the average reaction rate, the peak temperature, and the decomposition temperature [4]. The following is the mathematical formula for materials’ thermal degradation in non-isothermal conditions [24]:
r = α t = A e ( E R T ) ( 1 α ) n
The universal gas constant (R) is 8.314 × 10⁻³ kJ/mol.K, T is temperature, n is the reaction order, A is the pre-exponential factor, E is the activation energy and α is the degree of conversion. This is one way to calculate conversion:
α = m o m m o m f
where m is the sample weight at any given time or temperature, mf is the sample weight at the conclusion of the TGA experiment, and mo is the sample weight at time = 0.
Kinetic triple parameters from TGA data may be obtained using several models produced by Equation (1). The published models either employ a single TGA data set (referred to as non-iso-conversional or model-fitting methods) or several TGA at different heating rates (referred to as iso-conversional or model-free procedures). The Arrhenius equation, the Prout–Tompkins (autocatalytic) model, and the Coats–Redfern model [25] were among the model-fitting strategies used in this investigation to obtain values for the kinetic parameters.

2.4. Quantum Chemical Analysis-Density Functional Theory

Following the ATR-FTIR analysis of PET-FCQDs and a review of relevant literature [13], the base structure of PET-FCQDs was modeled and subjected to computational analysis to investigate their quantum chemical and mechanistic properties. The structure of PET-FCQDs had carbon of 68, hydrogen content of 5, and oxygen content of 9 (C68H5O9) with a total of 82 atoms, a net mass of 965.78 g, and a Connolly surface area of 622.70 A2 (Figure S1). Density Functional Theory (DFT) in Dmol3 was used to study the electronic structures of the PET-FCQDs. This method was employed as the computational framework due to its robustness in accurately predicting molecular electronic structures and properties [26,27]. The importance of this computational study is to provide information on the fundamental properties of PET-FCQDs.
DFT calculations for this study were carried out using the COMPASS force field on the DMOL3+ server within Biovia Materials Studio 8. Utilizing first-principles methods, DFT with a numerical radial function basis set was employed to evaluate the electronic properties of molecular clusters, surfaces, and crystalline solids. Geometry optimization was performed using Local Density Approximations (LDA) with the Perdew–Wang Correlation (PWC) functional, with the following convergence parameters: energy accuracy of 2 × 10⁻⁵ Ha, maximum force of 0.004 Ha, gradient convergence of 4 × 10⁻³ A°, displacement convergence of 5 × 10⁻³ A°, maximum displacement of 0.3 A°, and an iteration limit of 50. Spin polarization and pseudopotential effects were constrained during calculations. The LDA-PWC was applied as a functional basis, while the Double Numerical Plus Polarization (DNP) basis set was used for DFT-exchange correlation potential. To improve the self-consistent field (SCF) convergence, the Direct Inversion in the Iterative Subspace (DIIS) method was implemented with a subspace size of 6. The SCF tolerance was set to 10−5, and charge mixing was optimized at 0.25 Ha. The optimized structure of PET-FCQDs was analyzed to determine key quantum parameters, including the energies of the highest occupied molecular orbital (EHOMO) and lowest unoccupied molecular orbital (ELUMO), energy gap (Egap) (Equation (3)), electronic chemical potential (μ) (Equation (4)), electronegativity (χ) (Equation (4)), ionization potential (IE) (Equation (5)), and electron affinity (EA) (Equation (6)). These parameters provide critical insights into the electronic and reactive properties of the PET-FCQDs.
E g a p = E L U M O E H U M O
μ = χ = E H U M O E L U M O 2
IE = −EHOMO
EA = −ELUMO
The global hardness (η) and global softness (S) values were calculated following the methodologies outlined by Parr and Pearson [28,29], ensuring consistency with established theoretical frameworks for chemical reactivity descriptors.
η = I E E A 2
s = 1 n

2.5. Fluorescence Sensing of Pd2+, FLX, and CIP

To detect Pd2+, 300 μL of an aqueous Pd(NO3)2 solution at a specific concentration was mixed with 100 μL of a PET-FCQDs dispersion (0.1 g/mL). The mixture was equilibrated for 20 min, and the photoluminescence spectrum was recorded at an excitation wavelength of 254 nm using a fluorescence spectrophotometer (RF-5300PC, Shimadzu, Kyoto, Japan). For selectivity experiments, the Pd(NO3)2 solution (300 μL, 1000 mg/L) was replaced with solutions of AgNO3, Co(NO3)2, Hg(ClO4)2, and Fe(NO3)3 to evaluate the response of PET-FCQDs to other metals. For drug detection, 300 μL of aqueous solutions of ibuprofen (IBU), ciprofloxacin (CIP), or fluoxetine (FLX) (1 g/L each) were mixed with 20 μL of PET-FCQDs dispersion (0.1 g/mL). After a 20 min equilibration period, the fluorescence spectra were recorded using the same spectrophotometer.

2.5.1. Linearity and Detection Limits

To determine linearity, a series of standard solutions with varying concentrations of Pd2+ (1 mg/L to 10 mg/L), ciprofloxacin (CIP, 50 to 150 µg/L), and fluoxetine (FLX, 100 to 400 ng/L) were prepared through serial dilutions. The stock solutions were initially prepared at higher concentrations (e.g., 100 mg/L for Pd2+, 1 mg/L for CIP, and 1 µg/L for FLX) and subsequently diluted stepwise with deionized water to achieve the desired concentration range. For each concentration, 300 μL of the standard solution was mixed with 100 μL of PET-FCQDs dispersion (0.1 g/mL). After equilibration for 20 min, the fluorescence spectra were recorded at an excitation wavelength of 254 nm using a fluorescence spectrophotometer (RF-5300PC, Shimadzu, Kyoto, Japan). The fluorescence intensity was plotted against the analyte concentration to generate calibration curves for Pd2+, CIP, and FLX, confirming linearity within the tested range.
For the determination of the limit of detection (LOD) and limit of quantification (LOQ), blank measurements were performed in quadruplicate by recording the fluorescence intensity of PET-FCQDs in the absence of analytes under identical experimental conditions. The mean fluorescence intensity and standard deviation (σ) of the blank signal were calculated. The LOD and LOQ were derived using the following equations:
L O D = 3.3 × σ   m
L O Q = 10 × σ   m
Here, m represents the slope of the calibration curve obtained from linear regression analysis.

2.5.2. Analysis of Pd2+, FLX, and CIP in Real Water Samples

River water samples were collected from the Kamogawa River in Saitama (Latitude: 35.875672 and Longitude: 139.602114), and tap water was obtained from the Building of Research and Projects at Saitama University. Both water samples were pretreated by centrifugation at 10,000 rpm for 10 min to remove suspended particulates, followed by filtration through a 0.20 µm membrane filter. For the assays, 300 μL of the prepared real water sample was mixed with 200 μL of aqueous solutions containing the target analytes (Pd2+; 1 mg/L to 10 mg/L, and FLX; 100 to 400 ng/L CIP; 50 to 150 µg/L,) and 100 μL of PET-FCQDs dispersion (0.1 g/mL). The mixtures were allowed to equilibrate for 15 min, and fluorescence measurements were then performed as previously described using the fluorescence spectrophotometer (RF-5300PC, Shimadzu, Kyoto, Japan). The recovery rate of the PET-FCQDs was determined as follows;
R e c o v e r y % = F s p i k e d × F b l a n k F s t a n d a r d × 100
Here, F s p i k e d represents the fluorescence of a mixture of real water, pollutants and PET-FCQDs; F b l a n k represents the fluorescence of a real water sample, and F s t a n d a r d represents the fluorescence of the pollutants.

2.6. Statistical Analysis

Statistical analysis was conducted using Microsoft Excel and OriginLab Pro 8 to evaluate the mean and standard deviation of triplicate analyses.

3. Results and Discussion

3.1. Quantum Yield of PET-FCQDs

Quantum yield ( Φ ) is an important parameter that quantifies the efficiency of photon emission by CQDs [30,31]. According to Bouwer [32], it is the ratio of photons released to photons received. This was determined as described in Equation (12) [32]:
Φ P E T F C Q D s = Φ R E F × A P E T F C Q D s A R E F × A b s R E F A b s P E T F C Q D s × n P E T F C Q D s 2 n R E F 2
For the Φ determination, Rhodamine 6G in ethanol was chosen as the reference material with a known quantum yield (0.95). The A (integrated area) for PET-FCQDs was (14.18), and the reference was (54.31), respectively (data computation is presented in Figure S2). The reference A value was computed from available fluorescence emission data for Rhodamine 6G in ethanol (https://omlc.org/spectra/PhotochemCAD/html/083.html, accessed 20 November 2024). Abs (Absorbance values) at the excitation wavelength for PET-FCQDs was (254.5 nm) and reference (532 nm), respectively. Refractive indices (n) of the solvents used for the PET-FCQDs (water: 1.33) and reference (ethanol: 1.36), respectively. Substituting these data into Equation (12), Equation (13) was computed for the quantum yield.
Φ P E T F C Q D s = 0.95 × 14.18 54.31 × 532 254.5 × 1.33 2 1.36 2 = 0.496
The calculated quantum yield ( Φ ) of the PET-FCQDs sample is approximately 0.496, demonstrating a significant quantum yield of 49.6%. The achieved quantum yield was higher than those reported for other plastic-derived CQDs, such as those synthesized from PET bottles by solvothermal method (relative yield of 0.4–47.8%) [14], PET aminolysis product (9.1%) [33], and for polyurethane foam by pyrolysis with H2SO4 (33%) [34]. However, for CQDs from PET oligomer with p-phenylenediamine and concentrated sulfuric acid, a yield of 49.6% was obtained [35] while a higher yield (62–65%) was reported for plastic mix by hyrothermal synthesis [36]. When compared to CQDs from other precursors, a higher yield was also obtained in this study. Egorova [37] reported a quantum yield of 0.8 to 46% by hydrothermal synthesis from ethylene glycol, citric acid, and berries. The high quantum yield of PET-FCQDs can be attributed to excellent self-surface passivation, well-controlled particle size distribution, and minimal non-radiative recombination pathways [38]. This achievement is particularly significant as it demonstrates the potential for converting waste plastic into high-value photoluminescent materials with efficiencies approaching those of purpose-synthesized CQDs [2].

3.2. Characterization of PET-FCQDs

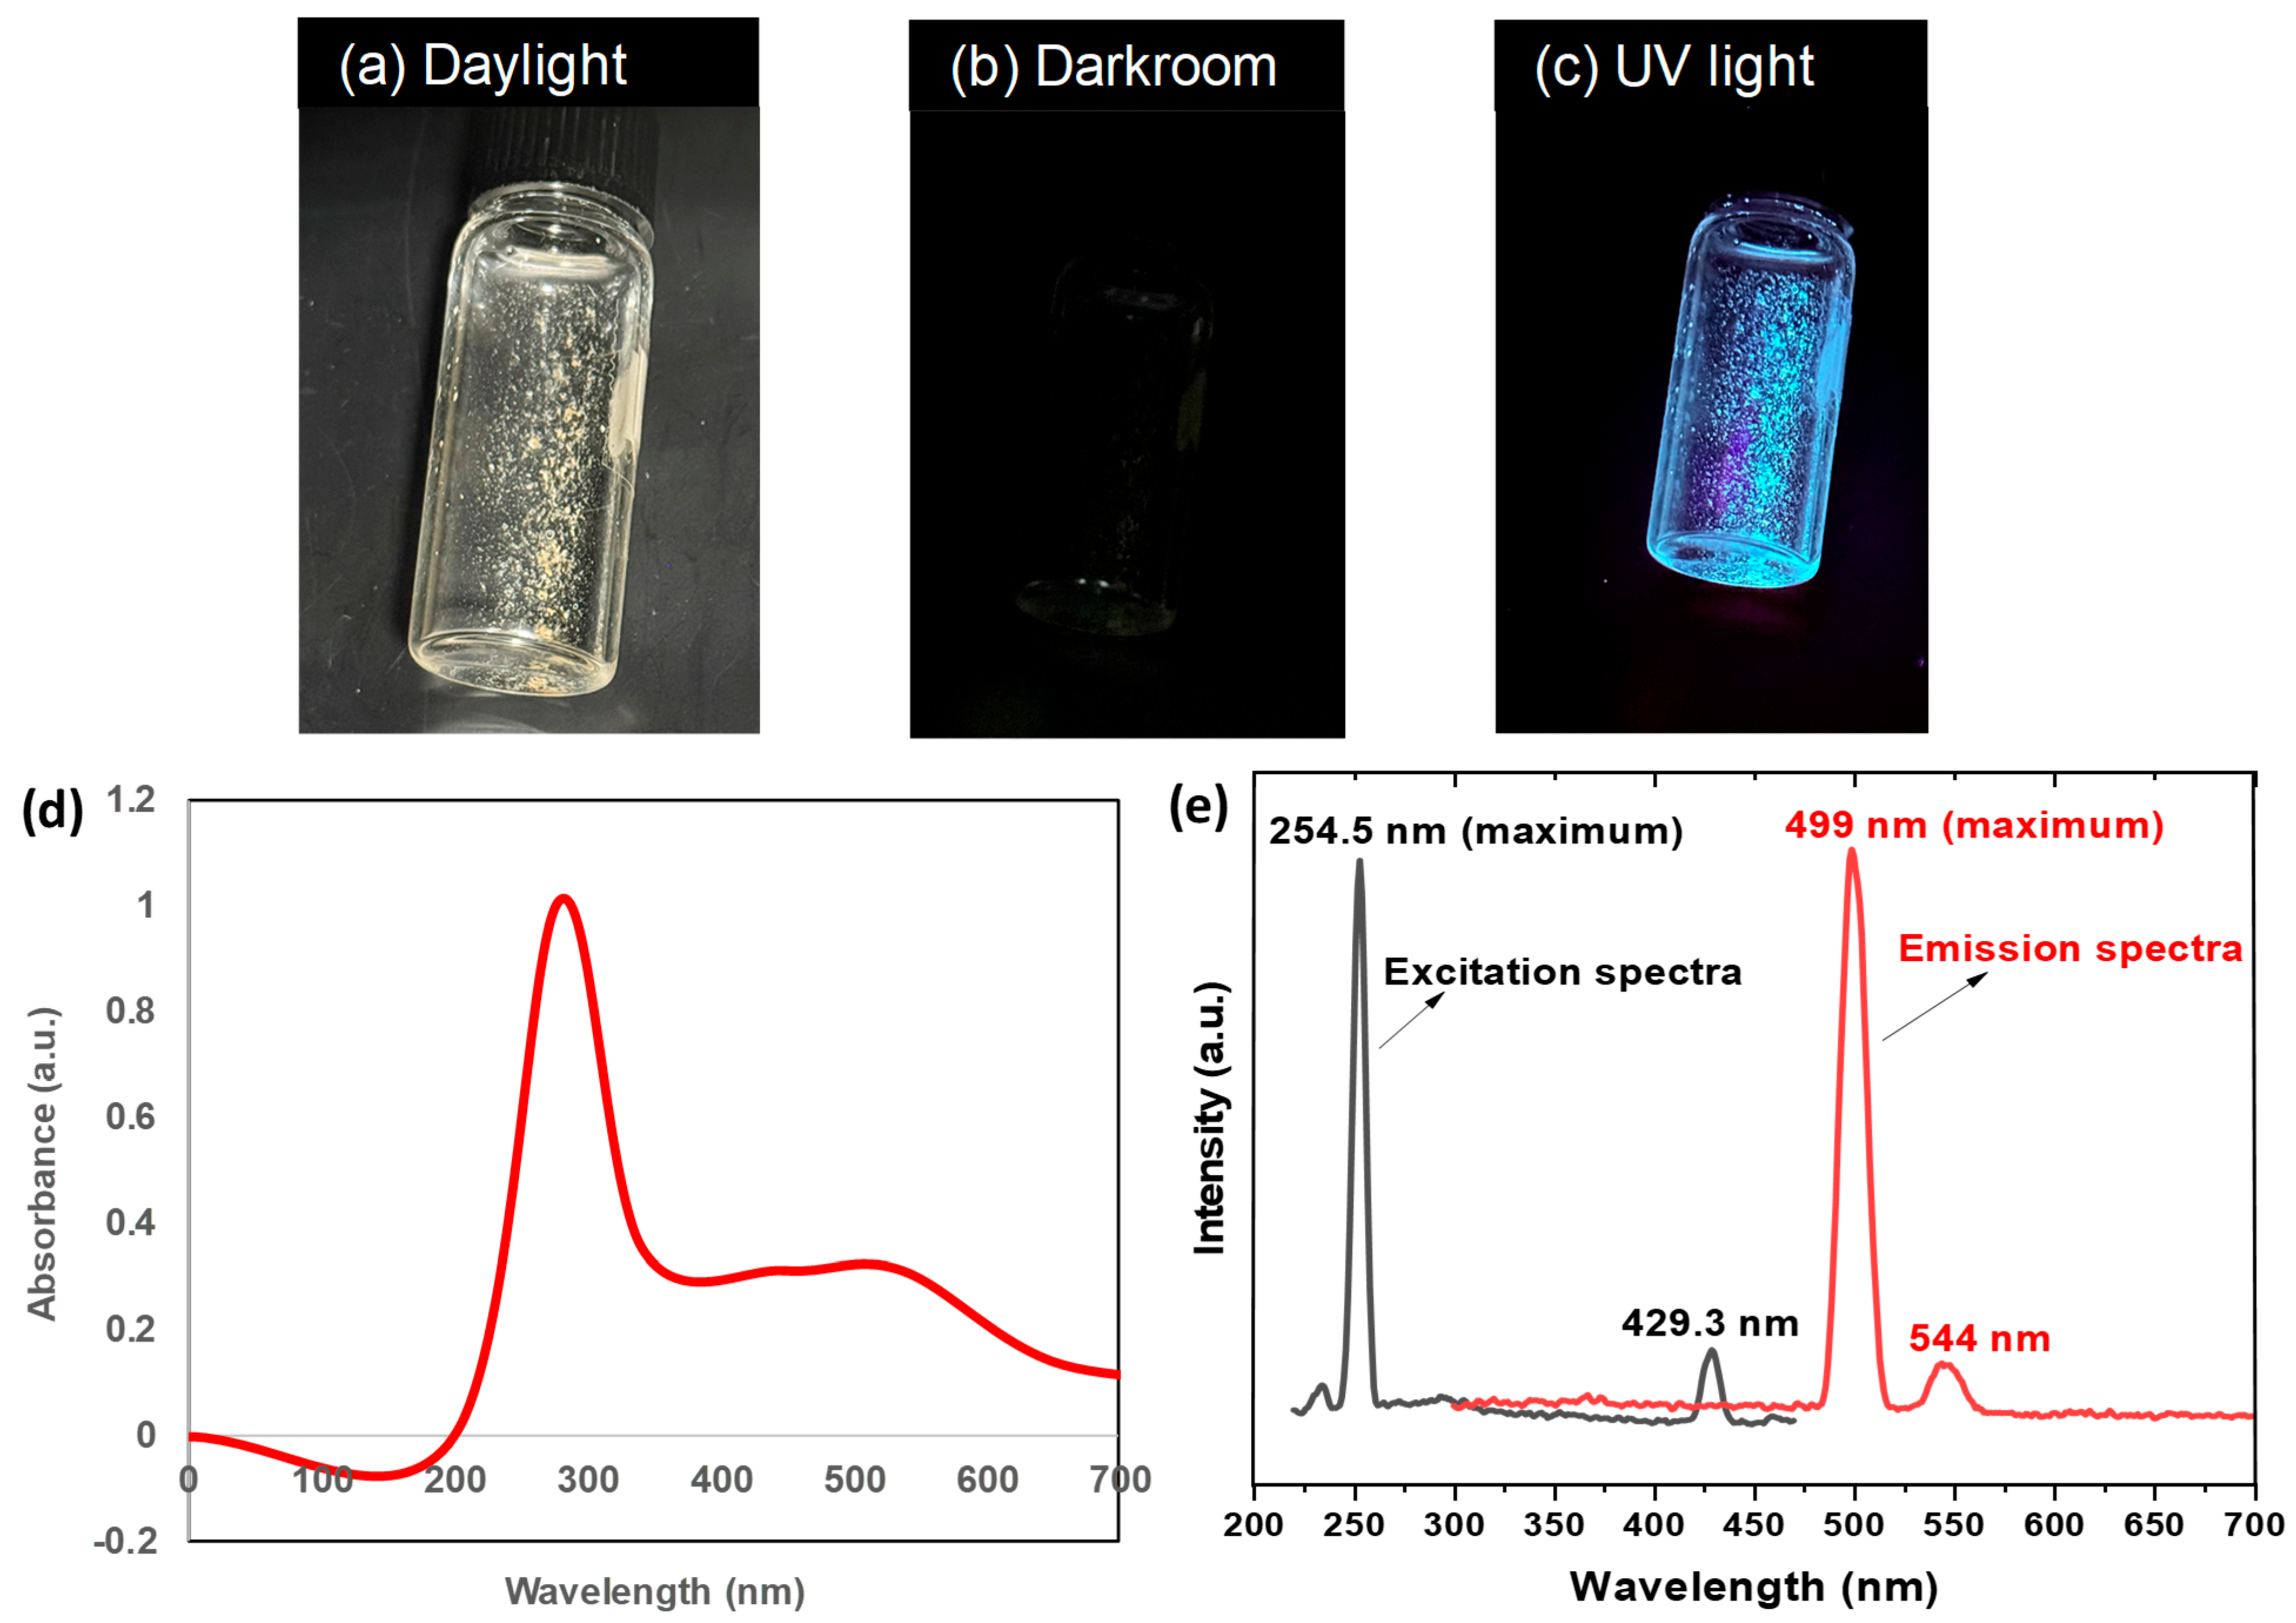
3.2.1. Optical and Fluorescence Analysis

Figure 2 presents both optical and fluorescence analysis of PET-FCQDs, demonstrating their appearance under different lighting conditions, their absorbance, and emission profile. Under normal daylight (Figure 2a), the PET-FCQDs appear as off-white or pale yellow or brownish particles. There is no visible fluorescence (which was also observed in the darkroom in Figure 2b), suggesting that they absorb and emit light outside the visible spectrum under these conditions. However, when exposed to UV light (@365 nm), the PET-FCQDs exhibit bright bluish fluorescence (Figure 2c). This fluorescence indicates that the particles absorb UV light and re-emit it at a longer wavelength, likely in the visible spectrum, which is a common characteristic of carbon-based nanomaterials with fluorescent properties [39]. The emission under UV light also confirms the successful synthesis of fluorescent CQDs from PET. In Figure 2d, there was strong absorbance in the UV range, especially around 270 nm and 341 nm, indicating that the CQDs absorb in this region. The decreased absorbance beyond 400 nm indicates limited absorption in the visible range. Furthermore, the PET-FCQDs absorbance of the PET-FCQDs, obtained by subtracting the dispersant’s absorbance from the total, exhibited notable absorbance at 279 to 536 nm with minimal visible light absorption, confirming their strong UV absorbance properties due to π-π* transitions from the aromatic sp2 domain in the PET-FCQDs [40]. The π-π* transition requires relatively high energy. This energy matches the energy gap between the bonding and antibonding π orbitals, hence the strong absorbance in the UV region (around 200–300 nm). In addition to π-π* transitions, n-π* transitions, which require lower energy levels, may also occur in PET-FCQDs on C=O groups at 314 nm [41,42]. The lack of significant absorbance in the visible range further suggests that they are primarily UV-absorbing materials with fluorescence likely shifted to the visible range (Figure 2a,e). This is consistent with carbon dots made from plastic waste, as they often have aromatic and conjugated structures capable of strong UV absorption [36,39]. In Figure 2e, upon excitation at 254 nm, the PET-FCQDs exhibited a strong emission peak at 499 nm, representing the maximum fluorescence intensity. This emission corresponds to the blue region of the visible spectrum and suggests effective quantum confinement and surface state effects [30]. A weaker secondary emission peak is observed at 544 nm, falling in the green region of the spectrum. This could be attributed to heterogeneity in the surface functional groups or particle size distribution, leading to variations in fluorescence behavior. This fluorescence can make PET-FCQDs suitable for applications in bioimaging, sensing, or environmental monitoring, where UV-induced fluorescence is beneficial. Furthermore, the UV-Vis absorbance spectrum shows that PET-FCQDs absorb strongly in the UV region, which aligns with their potential use in UV shielding or as photosensitizers [30].

3.2.2. Particle Size Analysis

The fluorescence micrograph of synthesized PET-FCQDs and size distribution shown in Figure 3 provides information about their morphology and size distribution. The fluorescence microscope images reveal that the PET-FCQDs have irregular, non-spherical shapes, with jagged edges and varied surface textures (Figure 3a). This morphology is typical for carbon-based particles synthesized from polymeric precursors, such as PET, which may not break down uniformly during the carbonization process [43]. These rough surfaces could influence the material’s optical properties, particularly in terms of light scattering and interaction with the dispersant.
The size distribution of the PET-FCQDs, as shown in the histogram, reveals a predominant particle size range between 1 and 5 nm, which accounts for the majority of the quantum dots. This indicates that the PET-FCQDs synthesized through the green one-step method have achieved a uniform and ultra-small size, consistent with the desired properties for quantum dots. The distribution curve suggests a sharp decline in frequency for particles larger than 5 nm, with very few particles exceeding 10 nm in diameter. Smaller quantum dots are often associated with higher quantum yields and better optical properties, making this size range advantageous for fluorescence-based sensing applications [44,45]. However, the particle size generally ranged from 2 to 50 nm, with an average size of 9.98 ± 10.90 nm, suggesting a heterogeneous particle size distribution (Figure 3b). The tailing observed for larger particle sizes could be attributed to aggregation or incomplete fragmentation during the synthesis process. The rough surfaces and variable particle sizes may increase the available surface area, which could be advantageous for applications requiring surface interactions, such as sensing and adsorption.

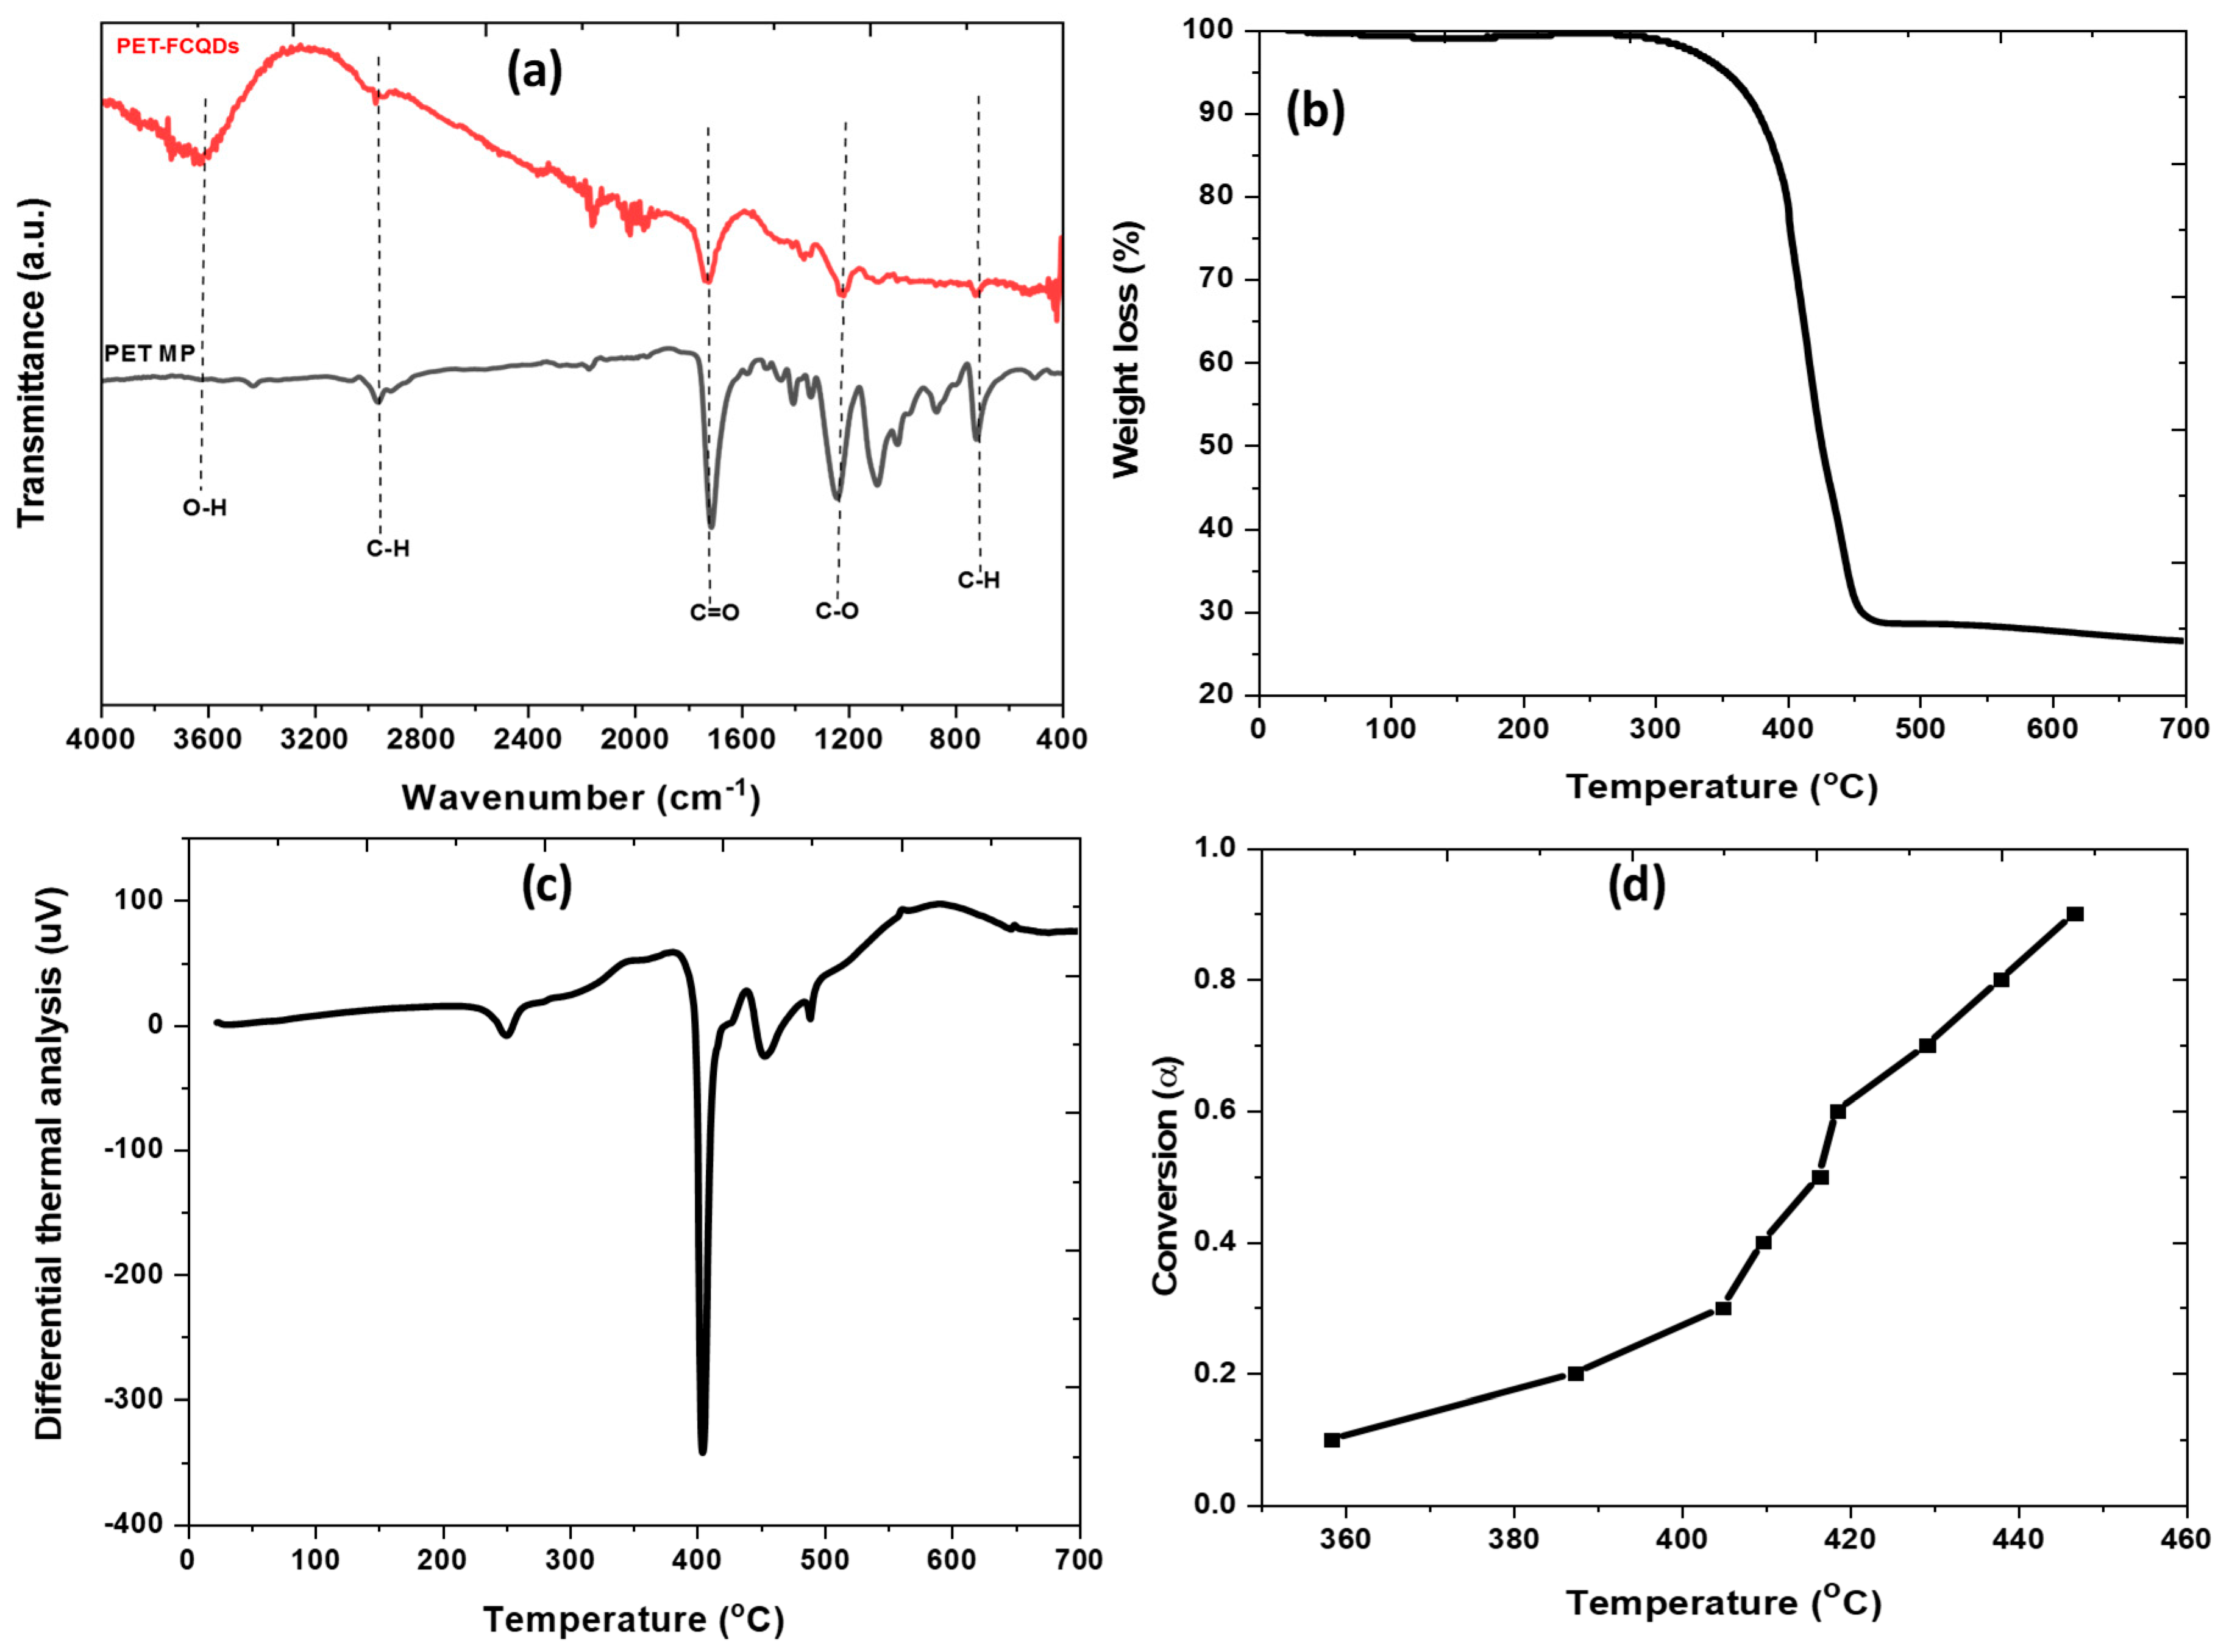
3.2.3. Surface Functional Group Analysis

The FTIR-ATR spectrum (Figure 4a) presented for the PET plastic waste after heating treatment highlights the key functional groups present in the synthesized PET fluorescent carbon microdots (PET-FCQDs) and provides information on the structural changes induced by the recycling process. This analysis is essential for understanding the optical properties observed in the UV-Vis spectra.
Based on the spectra of raw PET plastic waste as reported by [46,47], the characteristic bands observed at 1000 cm−1, 1099 cm−1, 1701 cm−1, 2925 cm−1, and 3400 cm−1 correspond to specific functional groups in the PET structure: 1000 cm−1 (aromatic -CH vibrations), 1099 cm−1 (O-C-C linkages), 1701 cm−1 (C=O carbonyl group), and 2925 cm−1 (-C-C- alkyl chains). These functional groups are integral to the molecular framework of PET and contribute to its characteristic absorption features.
Recycling plastic waste by heating it breaks the carbon chains and reorganizes them into dots [48]. Broken and rearranged carbon chains will bind atoms like hydrogen (H), oxygen (O), and other functional groups. The ethanol utilized as dispersion polymer particles gives rise to the alcohol -OH group, as shown at a wavenumber of 3445 cm−1 (Figure 4a). In comparing the FTIR spectra of the synthesized PET-FCQDs with standard PET MPs spectra, several key functional groups, such as those from the original PET structure, may be missing or reduced due to chemical transformations during synthesis, typically involving carbonization and oxidation processes. The ester bond (O=C-O-C) is a defining feature of PET, with characteristic peaks around 1700–1710 cm−1 (carbonyl C=O stretch) and 1099 cm−1 (C-O stretch). During the high-temperature synthesis of PET-FCQDs, ester bonds are likely to break down first, resulting in the loss of some ester-related peaks and the formation leading to the release of small molecular fragments of terephthalic acid (C8H6O4) and ethylene glycol (C2H6O2) (Figure 5). This process converts ester groups into abundant C=O and -COOH (̴1650 to 1700 cm−1) and C-O (1300 cm−1) groups, which shift or alter the original ester peaks. This shift indicates a structural reorganization, and a broader, less distinct C=O peak may appear as a result. This is due to the degradation of ester linkages and subsequent decarboxylation reactions to other oxygen-containing groups (Figure 5). The C=O contributes to n-π* transitions, absorbing light in the UV region around 341 nm (Figure 2d) [49], while C-O bonds may contribute minimally to absorbance [39]. The C=O, COOH, and C-O functionalization also play a role in photoluminescence properties by creating additional electron acceptor sites, which facilitate the electron transitions and stabilize excited states responsible for photoluminescence under UV excitation [50,51]. In standard spectra, aliphatic -CH stretching vibrations are typically found around 2925 cm−1 and 2855 cm−1. These peaks were significantly reduced or absent in PET-FCQDs because the carbonization process can break down aliphatic chains, leading to the formation of a more aromatic structure. The absence or reduction in these peaks indicates a decrease in aliphatic hydrocarbon chains, contributing to a more rigid, carbon-rich structure. The aromatic C-H out-of-plane bending vibrations are seen around 700–900 cm−1 in raw PET material, but they were weakened in the PET-FCQDs, indicating that the synthesis process modifies or removes some of the aromatic rings. Although some aromaticity is typically retained, partial breakdown and rearrangement of the rings can lead to a decrease in these specific bending peaks [1]. The production mechanism of the PET-FCQDs is presented in Figure 5. The FTIR spectrum confirms the presence of functional groups that contribute to the UV absorbance characteristics of PET-FCQDs. Carbonyl and C-O groups play critical roles in defining the optical properties, as observed in the UV-Vis spectrum, by facilitating electronic transitions that lead to strong UV absorbance under UV illumination. These functional groups enhance the photophysical properties of PET-FCQDs, making them promising for applications requiring strong UV absorbance and visible fluorescence, such as sensing or bioimaging [52].

3.2.4. TGA, DTA, and Conversion Factors

The TGA thermogram, differential thermal analysis (DTA), and conversion data for the CQDs are presented in Figure 4b–d. These data provide information on the thermal behavior and decomposition process of PET-FCQDs derived from recycled PET plastic waste.
The thermogravimetric analysis (TGA) plot (Figure 4b) illustrates the weight loss behavior of PET-FCQDs as temperature increases. The PET-FCQDs exhibit thermal stability at lower temperatures, showing minimal weight loss up to approximately 300 °C. This stability suggests that the material is largely free of moisture or volatile components, which would typically decompose at lower temperatures. In comparison, raw PET MPs remains stable up to around 397 °C [47], indicating that the PET-FCQDs, though retaining some stability, begin to decompose at slightly lower temperatures than raw PET MPs. A sharp weight loss occurs between approximately 350 °C and 450 °C, where a significant portion of the PET-FCQDs decomposes. This sharp decrease in mass indicates the thermal degradation of organic structures within the PET-FCQDs, likely due to the breakdown of remaining aromatic or oxygen-containing functional groups. After 450 °C, weight loss stabilizes, indicating that the 28% carbonized residue (likely to consist of stable carbon structures) remains resistant to further decomposition at higher temperatures. The high-temperature stability after decomposition indicates that a stable, carbon-rich residue remains, which is characteristic of carbon-based materials produced by pyrolysis or carbonization [53].
The DTA curve reveals the endothermic and exothermic transitions occurring within the sample as a function of temperature (Figure 4c). The curve showed that there may be small endothermic events (around 250 °C) before the major decomposition stage, which could be attributed to minor structural rearrangements or phase transitions in the PET-FCQDs. Furthermore, the prominent exothermic peak around 400 °C correlates with the rapid decomposition observed in the TGA curve. This exothermic event is likely due to the oxidative degradation of carbon and other functional groups, releasing energy as they decompose.
The conversion factor (α) plot, showing the progression of thermal degradation, highlights the extent of decomposition over the temperature range (Figure 4d). The result showed that initially, the conversion factor remains low as there is minimal decomposition. Then, around 350 °C, the conversion factor sharply rises, corresponding to the major weight loss and degradation phase observed in the TGA and DTA curves. This increase signifies the main decomposition reaction of the PET-FCQDs. Furthermore, after reaching high conversion levels at around 450 °C, the curve plateaus, indicating that most of the decomposable components have been broken down and that the remaining material is thermally stable.

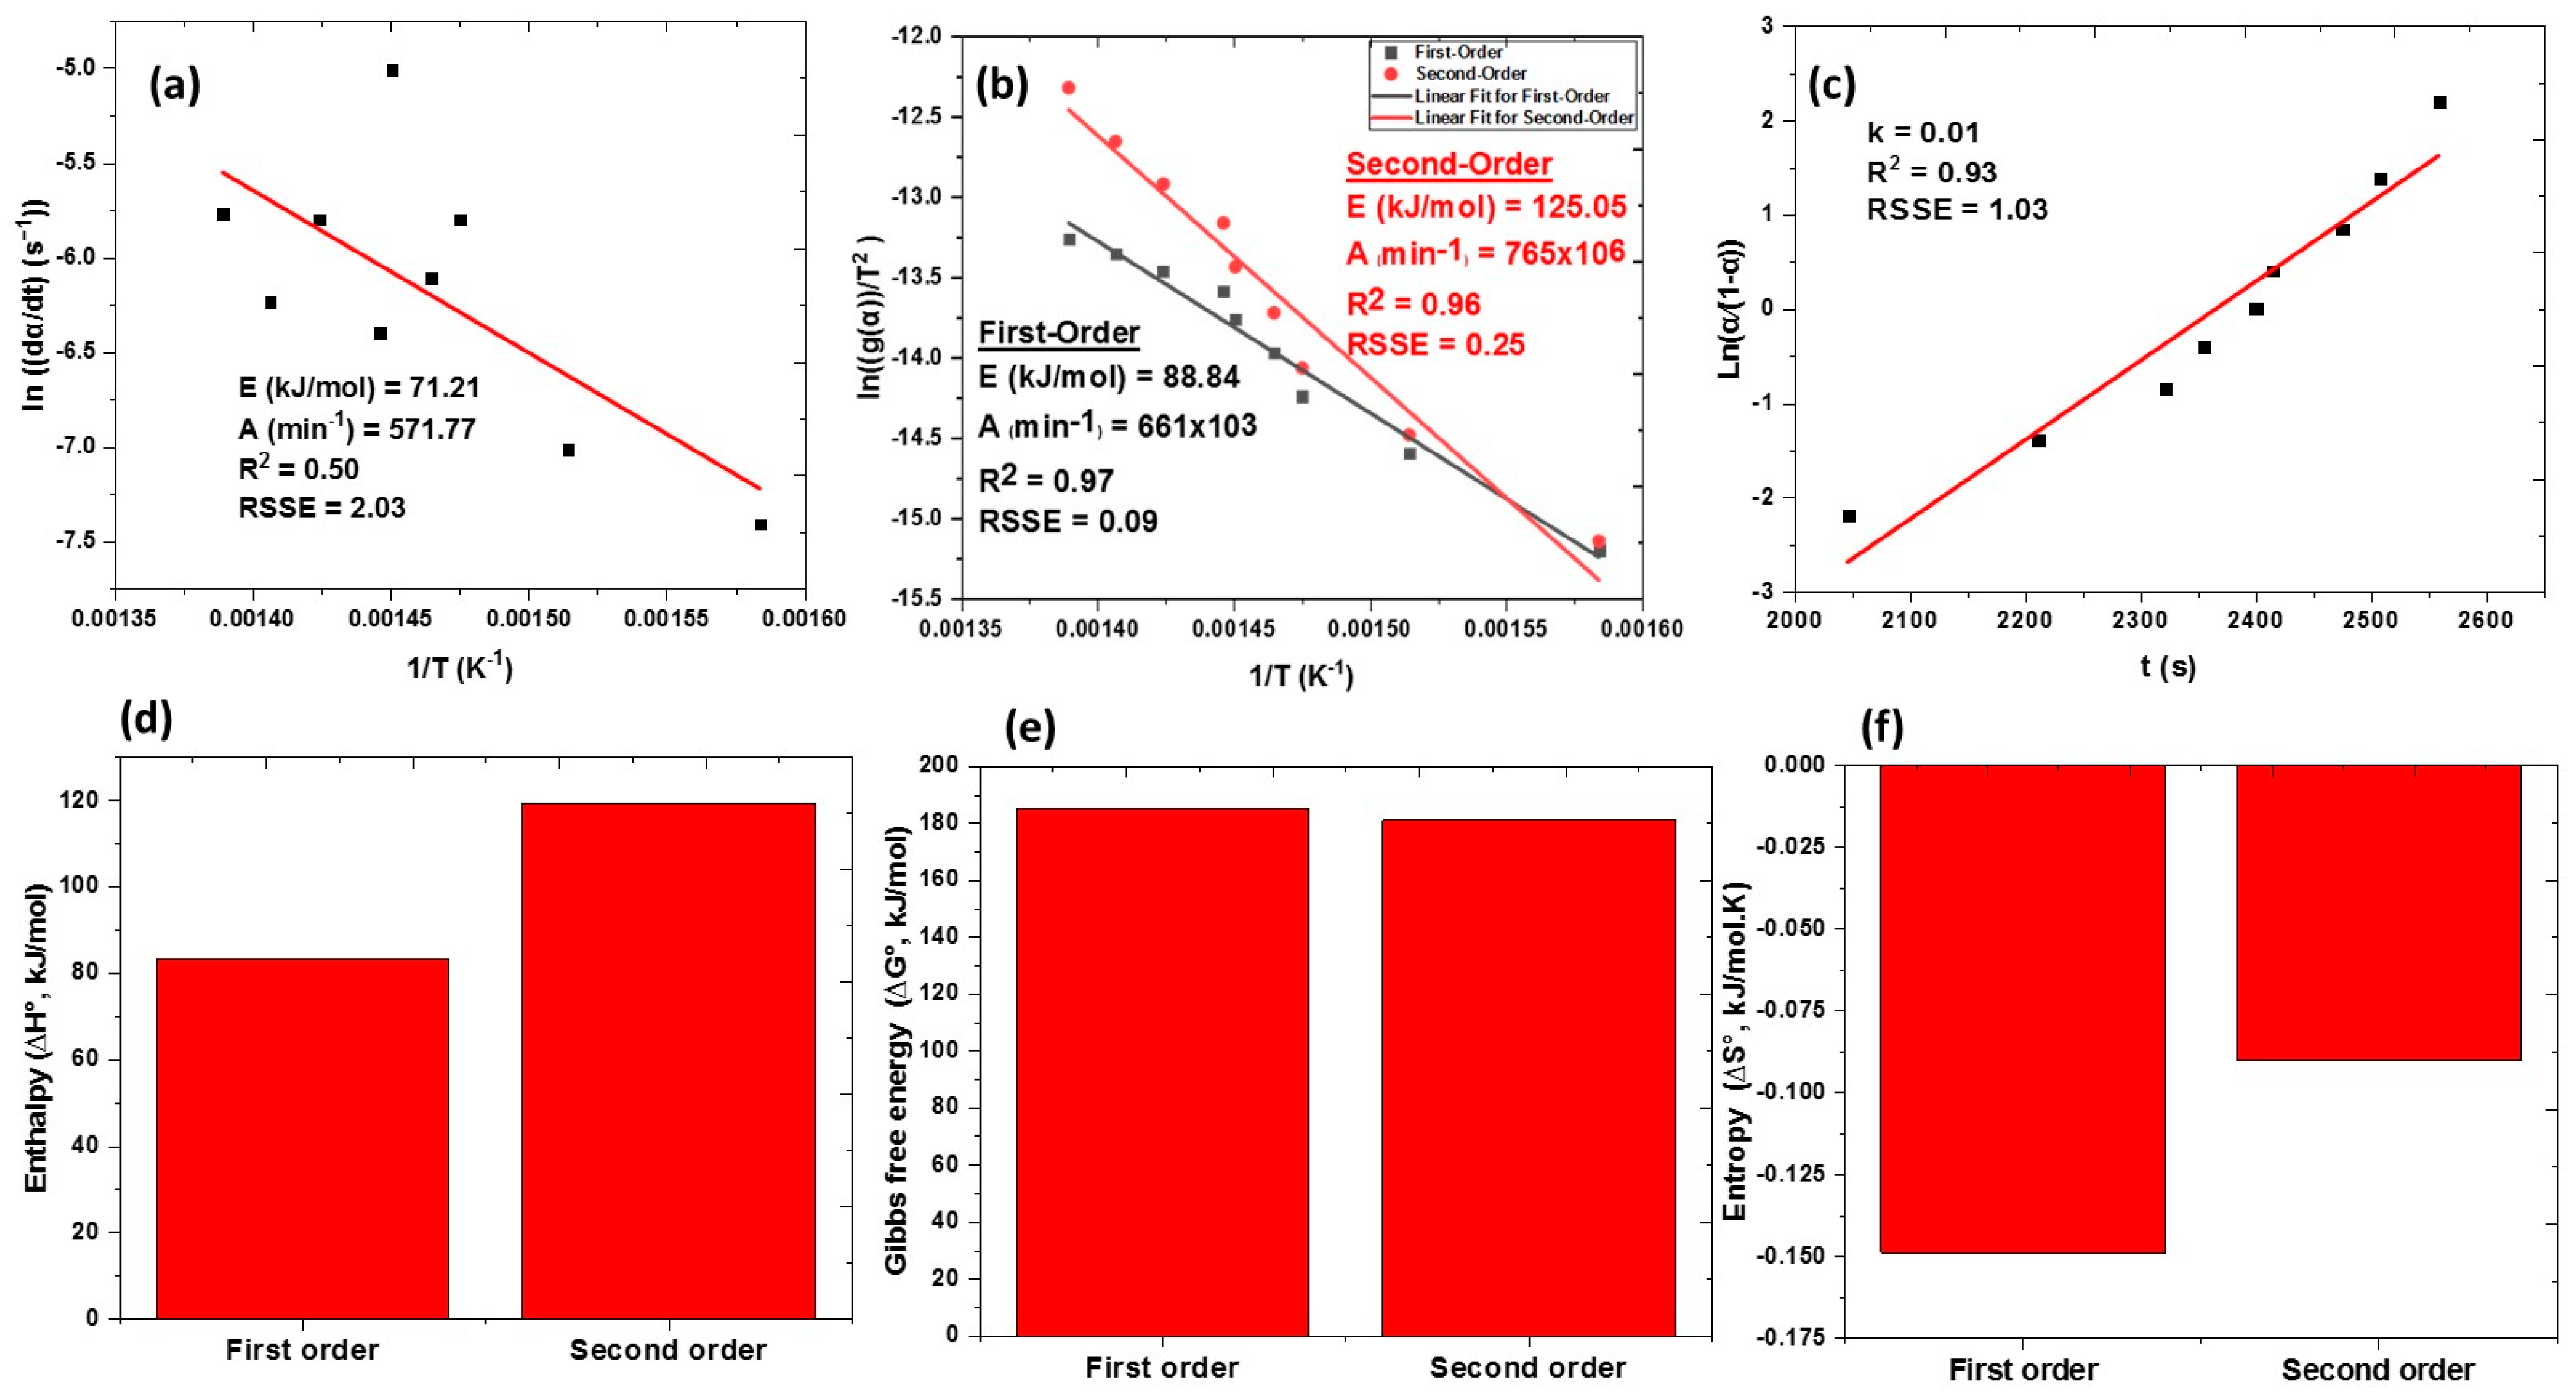
3.3. Kinetic and Thermodynamic Stability Modeling of PET-FCQDs

3.3.1. Kinetic Theory of Breakdown Reaction

The kinetics for the thermal breakdown process of the PET-FCQDs was studied using model-fitting kinetic models such as the Arrhenius equation, Coats–Redfern (CR), Prout–Tompkins (Autocatalytic) Model
In linearized form, the Arrhenius Equation (1) becomes Equation (14)
I n d α d t = E R T + ln A
where plots of I n d α d t vs. 1/T will give the activation energy (E) and pre-exponential factor (A).
This study also utilized the Coats–Redfern (CR) method, a robust model-fitting approach designed to analyze reaction kinetics by fitting various models to reaction extent versus temperature curves. Through this method, both the activation energy and frequency factor can be determined simultaneously, as described by Coats and Redfern [25]. The approach simplifies the exponential integral using an asymptotic series expansion, as presented in Equation (15). To represent the function g(α), numerous reaction model approximations are documented in the literature [54,55]. For this research, the kinetic models for zero and first-order reactions were selected for analysis. The first-order model assumes that a single reaction pathway dominates, and that the reaction rate is temperature-dependent, while the zero-order model suggests that the decomposition rate is independent of the concentration of the reactant. Equations (16) and (17) approximate g(α) for zero and first-order reactions, respectively, and substituting these into Equation (13) yields Equations (18) and (19).
I n g ( α ) T 2 = I n A R β E 1 2 R T ¯ E E R T
g(α) = α
g(α) = −ln(1 − α)
I n α T 2 = I n A R β E 1 2 R T ¯ E E R T
I n I n ( 1 α ) T 2 = I n A R β E 1 2 R T ¯ E E R T
The plot I n α T 2 and I n I n ( 1 α ) T 2 , against 1/T gives the intercept and slope of a linear equation, and thereafter, the values of the E and A are calculated from the slope and intercept values.
Additionally, the Prout–Tompkins model (Equation (20)), also known as the autocatalytic model, was employed to investigate the breakdown process. This model is particularly useful for analyzing reactions where the reaction rate increases initially due to an autocatalytic effect. Such behavior is commonly observed in polymer degradation, combustion, and crystallization processes [56]. The basic form of the Prout–Tompkins model equation is described in [57]: Where k is the rate constant, which often follows the Arrhenius equation.
L n α 1 α = k t
The model-fitting kinetic analysis of the thermal breakdown process for PET-FCQDs is illustrated in Figure 6, which includes three models: (a) the Arrhenius equation, (b) the Coats–Redfern (CR) model, and (c) the Prout–Tompkins (autocatalytic) model. The kinetic analysis provided data on the activation energy (E) and the pre-exponential factor (A). Activation energy is the minimum energy needed for a reactive molecule to undergo a chemical transformation and form products. It plays a crucial role in initiating chemical reactions by providing the necessary energy for molecules or atoms to engage in the reaction process [1]. The pre-exponential factor (A) provides insight into the ease with which a reaction begins. Lower values of A are associated with slower reaction rates, while higher values indicate that the reaction occurs more rapidly [4].
The Arrhenius plot (Figure 6a) estimates an E of 71.21 kJ/mol with an A of 571.77 min−1 and an R2 of 0.50, indicating a moderate fit and suggesting some limitations in describing the decomposition accurately. The Coats–Redfern (CR) analysis yields a more robust fit: the first-order model estimates an activation energy of 88.84 kJ/mol with a high R2 value of 0.97 and a low residual sum of squares error (RSSE) of 0.09 (Figure 6b). This indicates that the first-order kinetic mechanism describes the decomposition well. In contrast, the CR second-order model provides an even higher activation energy of 125.05 kJ/mol, with an R2 of 0.96, showing a strong yet slightly less optimal fit given its higher RSSE of 0.25. The comparison suggests that the first-order model is preferable, implying that the decomposition is likely governed by a temperature-dependent, single-step reaction pathway. The activation energy (E) values obtained for the PET-FCQDs were lower than those previously reported for pyrolyzed PET waste. Mishra [58] observed E values between 208.6 and 236.0 kJ/mol for PET co-pyrolysis with biomass seeds. Similarly, [59], using an iso-conversional approach, reported E values ranging from 196 to 217 kJ/mol for PET pyrolysis at high heating rates. In contrast, the E values for PET-FCQDs were higher than those reported for PET microplastics (9.56 to 21.09 kJ/mol) by [4]. This indicates that the PET-FCQDs fall within a unique range, likely due to differences in thermal behavior and structural composition. The Prout–Tompkins model (Figure 6c) further supports the kinetic assessment, where the autocatalytic constant (k) is 0.01, and the model shows a strong R2 of 0.93, despite a higher RSSE of 1.03. This model accounts for reaction acceleration through autocatalysis, which may suggest that the decomposition products influence and enhance the breakdown process. The combined analysis highlights that the decomposition of PET-FCQDs likely follows a first-order mechanism, but the involvement of autocatalytic effects cannot be ignored, potentially complicating the thermal behavior.

3.3.2. Thermodynamic Theory of Breakdown Reaction

Thermodynamic analysis is crucial for understanding the overall performance of any chemical process, as it helps identify and explain the losses caused by irreversibility. In this study, the kinetic parameters derived from model-fitting kinetics are utilized to calculate key thermodynamic parameters associated with the thermal degradation of PET-FCQDs: changes in enthalpy (∆H°, kJ/mol), entropy (∆S°, kJ/mol·K), and Gibbs free energy (∆G°, kJ/mol). These parameters are determined using Equations (21)–(23) to perform a comprehensive thermodynamic assessment. Where T: Temperature in Kelvin (K) and for this study, the temperature was 685.10 K (average temperature for the different conversion α); kb: Boltzmann constant with a value of 1.381 × 10⁻²³ J/K and ℎ: Planck constant with a value of 6.626 × 10⁻³⁴ J·s.
H = E R T
G = E + R T ln k b T h A
S = H G T
As highlighted by [24], understanding ∆H, ∆S, and ∆G is vital for monitoring energy changes and assessing both the feasibility and the progression of the thermal degradation process. Based on the kinetic parameters obtained from the CR models, the thermodynamic parameters of PET-FCQDs were calculated; the outcomes are shown in Figure 6d–f.
ΔH∘ indicates the energy needed for the reaction to proceed. The values are positive for both reactions, meaning they are endothermic. Energy is required for the conversion of reactants into products. The second-order reaction has a higher ΔH∘ (First order: 83.16 kJ/mol < Second order: 119.36 kJ/mol), suggesting that it requires more energy to reach the activated state compared to the first-order reaction. This could imply that the second-order reaction involves more complex interactions between molecules (e.g., collisions between two reactants), resulting in a higher energy barrier. ΔG∘ measures the likelihood of the reaction proceeding under standard conditions. Positive values of ΔG∘ for both models (First order: 185 kJ/mol; Second order: 181.04 kJ/mol) indicate that the reactions are non-spontaneous, requiring an external energy source to occur. The second-order reaction has a slightly lower ΔG∘, suggesting that it is marginally more thermodynamically favorable than the first-order reaction. This could imply that the second-order reaction may proceed slightly more easily under specific conditions, although it is still non-spontaneous overall. ΔS∘ reflects the degree of disorder in the system. Negative values for both reactions (first order: −0.14865 kJ/mol.K; second order: 119.36 kJ/mol) indicate that the products are more ordered than the reactants, with a decrease in molecular randomness during the transformation process. The first-order reaction has a more negative ΔS∘, suggesting a greater loss of disorder compared to the second-order reaction. This could indicate that the products formed in the first-order reaction are more structured or constrained. The less negative ΔS∘ for the second-order reaction suggests a smaller reduction in molecular freedom, potentially due to the involvement of multiple reactant molecules maintaining some level of randomness in the system. The thermodynamic parameters indicate that the second-order reaction is slightly more favorable overall due to its lower ΔG∘ and less negative ΔS∘. However, the higher energy requirement (ΔH∘) for the second-order reaction reflects its potentially more complex mechanism. In practical terms, if experimental conditions allow for sufficient energy input, the second-order reaction might be preferred due to its better balance of thermodynamic properties, especially when molecular interactions play a significant role. The first-order reaction, with its lower energy barrier, might dominate under limited energy input conditions, but at the cost of greater entropic restriction and reactivity reduction.

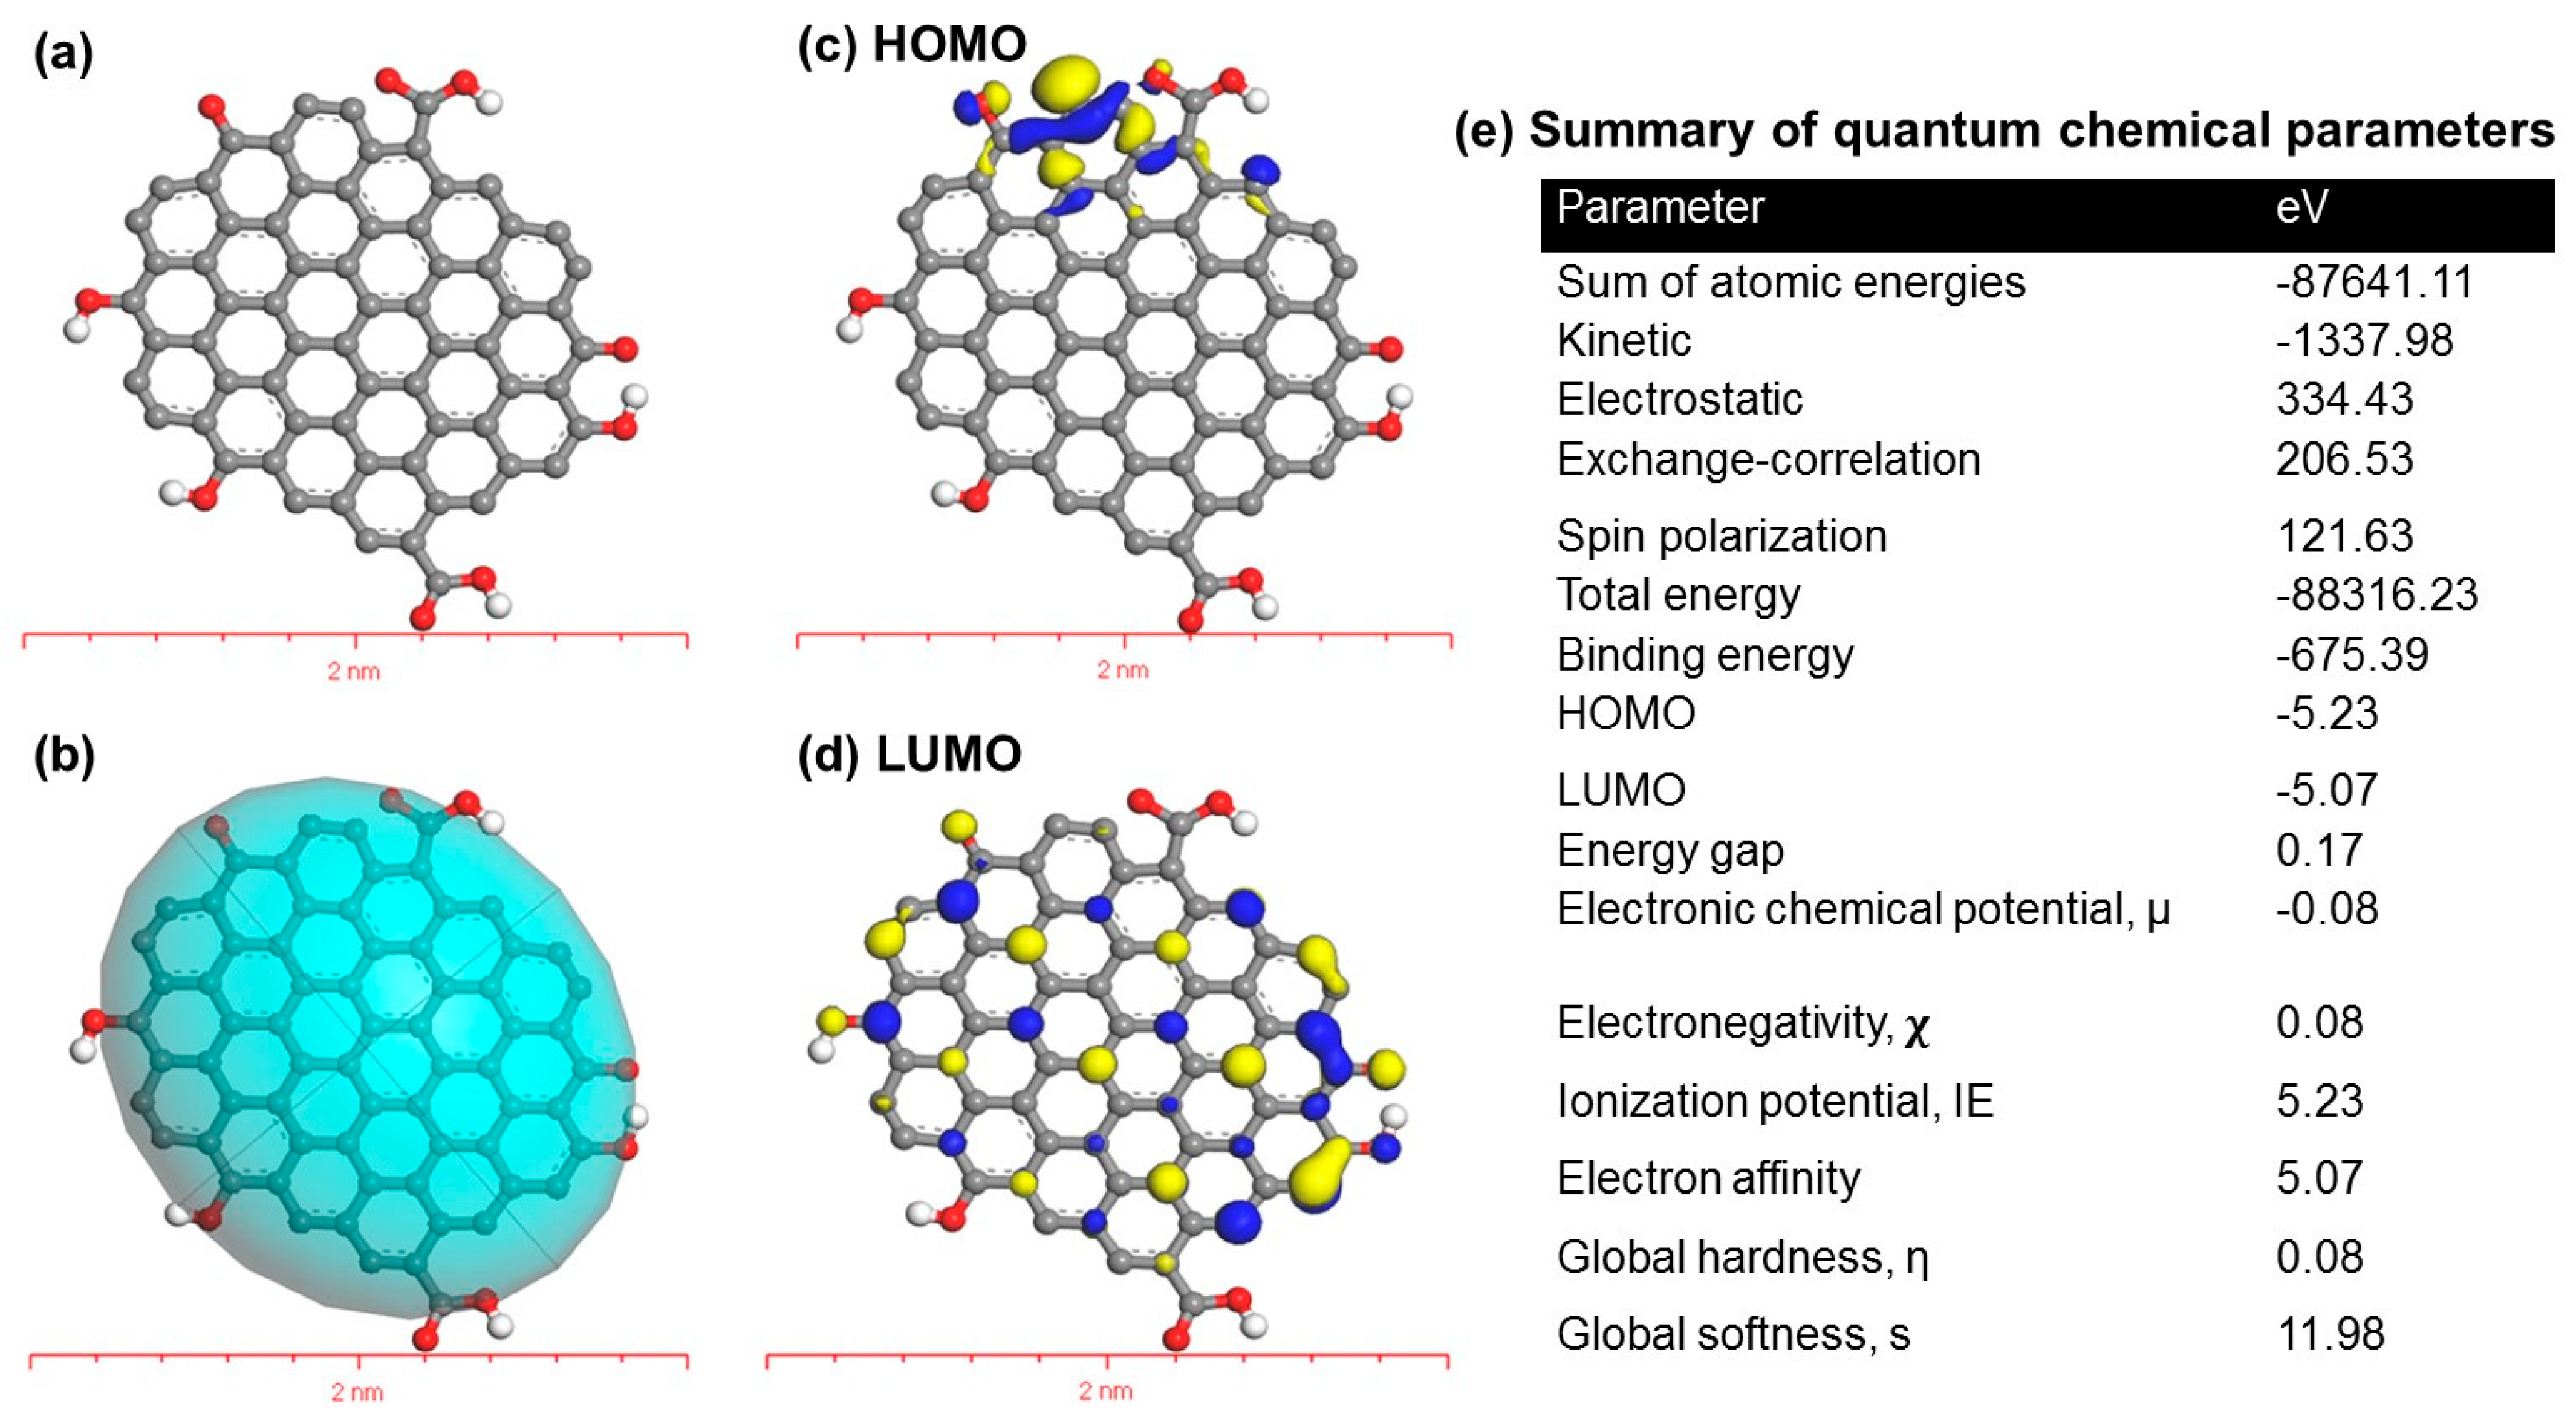
3.4. Quantum Chemical Properties of PET-FCQDs

The geometry optimization process of the PET-CQDs identified the most energetically favorable molecular configuration by minimizing the interatomic forces on the potential energy surface [60]. Since it reflects the most stable and naturally occurring molecule configuration, this optimization is essential. The electronic structure calculations revealed key molecular orbital characteristics through HOMO (highest occupied molecular orbital) and LUMO (lowest unoccupied molecular orbital) analyses, which are visualized in Figure 7. The comprehensive quantum chemical parameters were determined, including total and binding energies, HOMO-LUMO energies and their gap (Egap), electronic chemical potential (μ), electronegativity (χ), ionization potential (IE), electron affinity (EA), and global reactivity descriptors (hardness η and softness S), as presented in Figure 7e. These parameters provide information on electronic behavior, chemical reactivity, and potential applications of PET-FCQDs.
The energetic parameters, including a total energy and binding energy, demonstrate significant structural stability. The total energy obtained from the DFT calculation was −87,641.11 eV, accounting for quantum mechanical electronic contributions, including exchange–correlation and electron delocalization. The binding energy of PET-FCQDs was calculated to be −675.39 eV, significantly lower than the range of −0.84 to −27.59 eV reported for platinum-doped CQDs based on DFT analysis [61]. This significantly lower binding energy indicates a much stronger interaction within the PET-FCQDs, reflecting their enhanced structural integrity and higher stability [62]. The stronger binding suggests that the carbon framework in PET-FCQDs is robust, making them ideal for applications requiring durable nanomaterials, such as in catalysis, optoelectronics, and sensing. This stability also implies that PET-FCQDs can maintain their performance under various environmental and operational conditions. The spin polarization value of 121.63 eV suggests interesting magnetic properties, which are relatively high compared to values reported from DFT analysis of carbon materials (10 carbon atoms) induced by a ferromagnetic material, i.e., two Fe atoms [63]. According to the frontier molecular orbital (FMO) theory, chemical reactivity involves electron transitions between the HOMO and LUMO of reacting species [62]. The HOMO energy (EHOMO) reflects the highest occupied energy level, determining the CQDs’ ability to donate electrons and relates to their ionization potential (IE). The LUMO energy (ELUMO) represents the lowest unoccupied level, indicating the CQDs’ ability to accept electrons, linked to their electron affinity [64,65]. The HOMO and LUMO plots of the PET-FCQDs, in which the molecules in the locations can be identified, are presented in Figure 7c,d. The HOMO is plotted mainly around the C=O, while the LUMO is mainly distributed across the aromatic rings. The summary of the HOMO and LUMO energies were found to be −5.23 eV and −5.07 eV, respectively (Figure 7e). These values are comparable with HOMO and LUMO energies for nitrogen-doped graphene quantum dots (Vercelli, 2021 [66]) and Pt-doped CQDs [61]. The HOMO-LUMO (energy) gap determines the light wavelength CQDs can absorb or emit, with smaller gaps favoring longer wavelengths (e.g., visible/near-infrared) and larger gaps favoring shorter ones (e.g., UV) [66,67]. A smaller energy gap also enhances electron transitions, improving charge transport, chemical reactivity, and suitability for applications like biochemical sensing [68]. The energy gap obtained for the PET-FCQDs was small (0.17 eV), suggesting high electronic conductivity and potential near-IR optical properties [66]. Snee [26] from DFT analysis of several indium phosphide CQDs reported energy gaps ranging from −3.3 to 0.89 eV, while nitrogen-doped graphene quantum dots generally display gaps of 0.76–2.23 eV [66]. The calculated ionization potential (5.23 eV), electron affinity (5.07 eV), electrochemical potential (−0.08 eV), and electronegativity (0.08 eV) for PET-FCQDs indicate their balanced ability to donate and accept electrons in redox processes. This versatility makes them suitable for applications where they can function as both reducing and oxidizing agents in charge–transfer reactions [69]. The global chemical reactivity descriptors, with a global hardness (η) of 0.08 and global softness (s) of 11.98, suggest high reactivity and polarizability [27]. These properties, combined with the small HOMO-LUMO gap, indicate potential applications of PET-FCQDs in optoelectronic devices, near-IR sensing applications, and environmental monitoring.

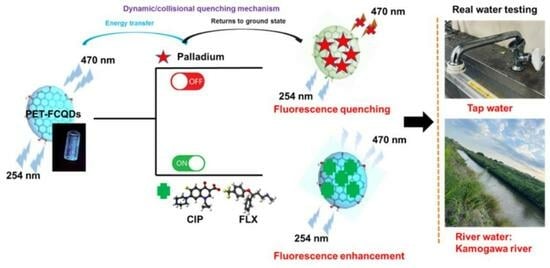
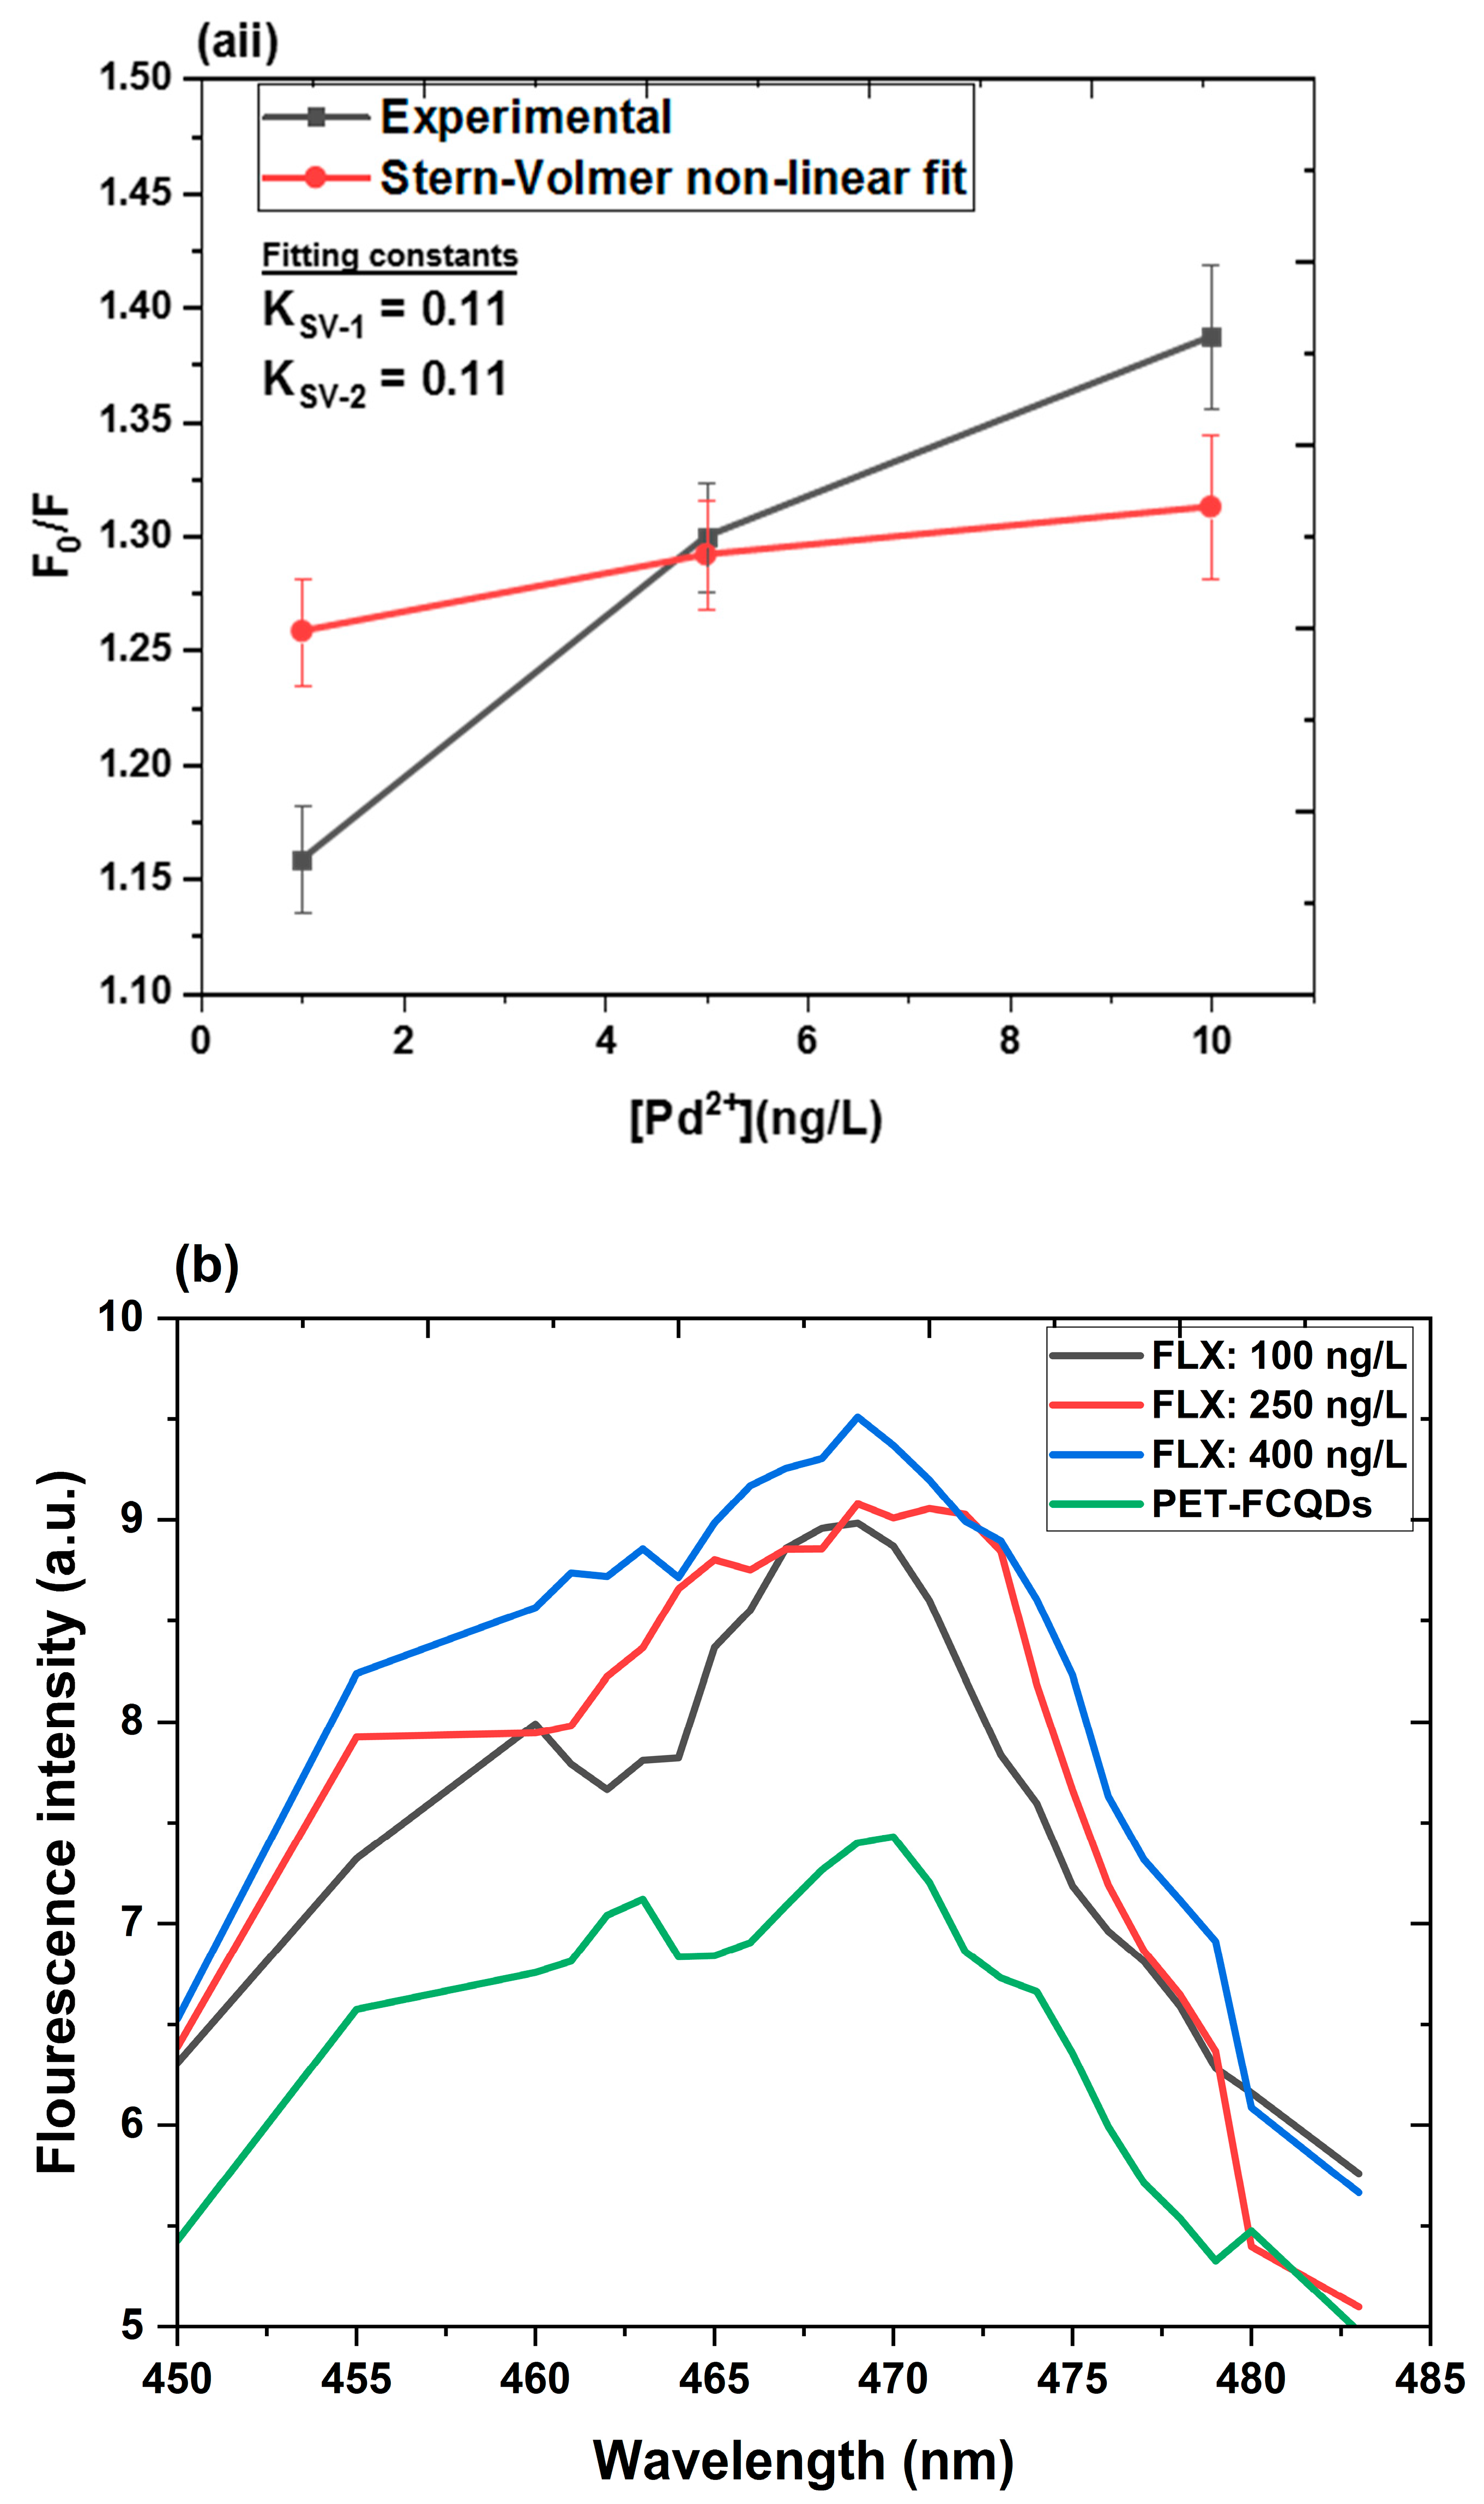
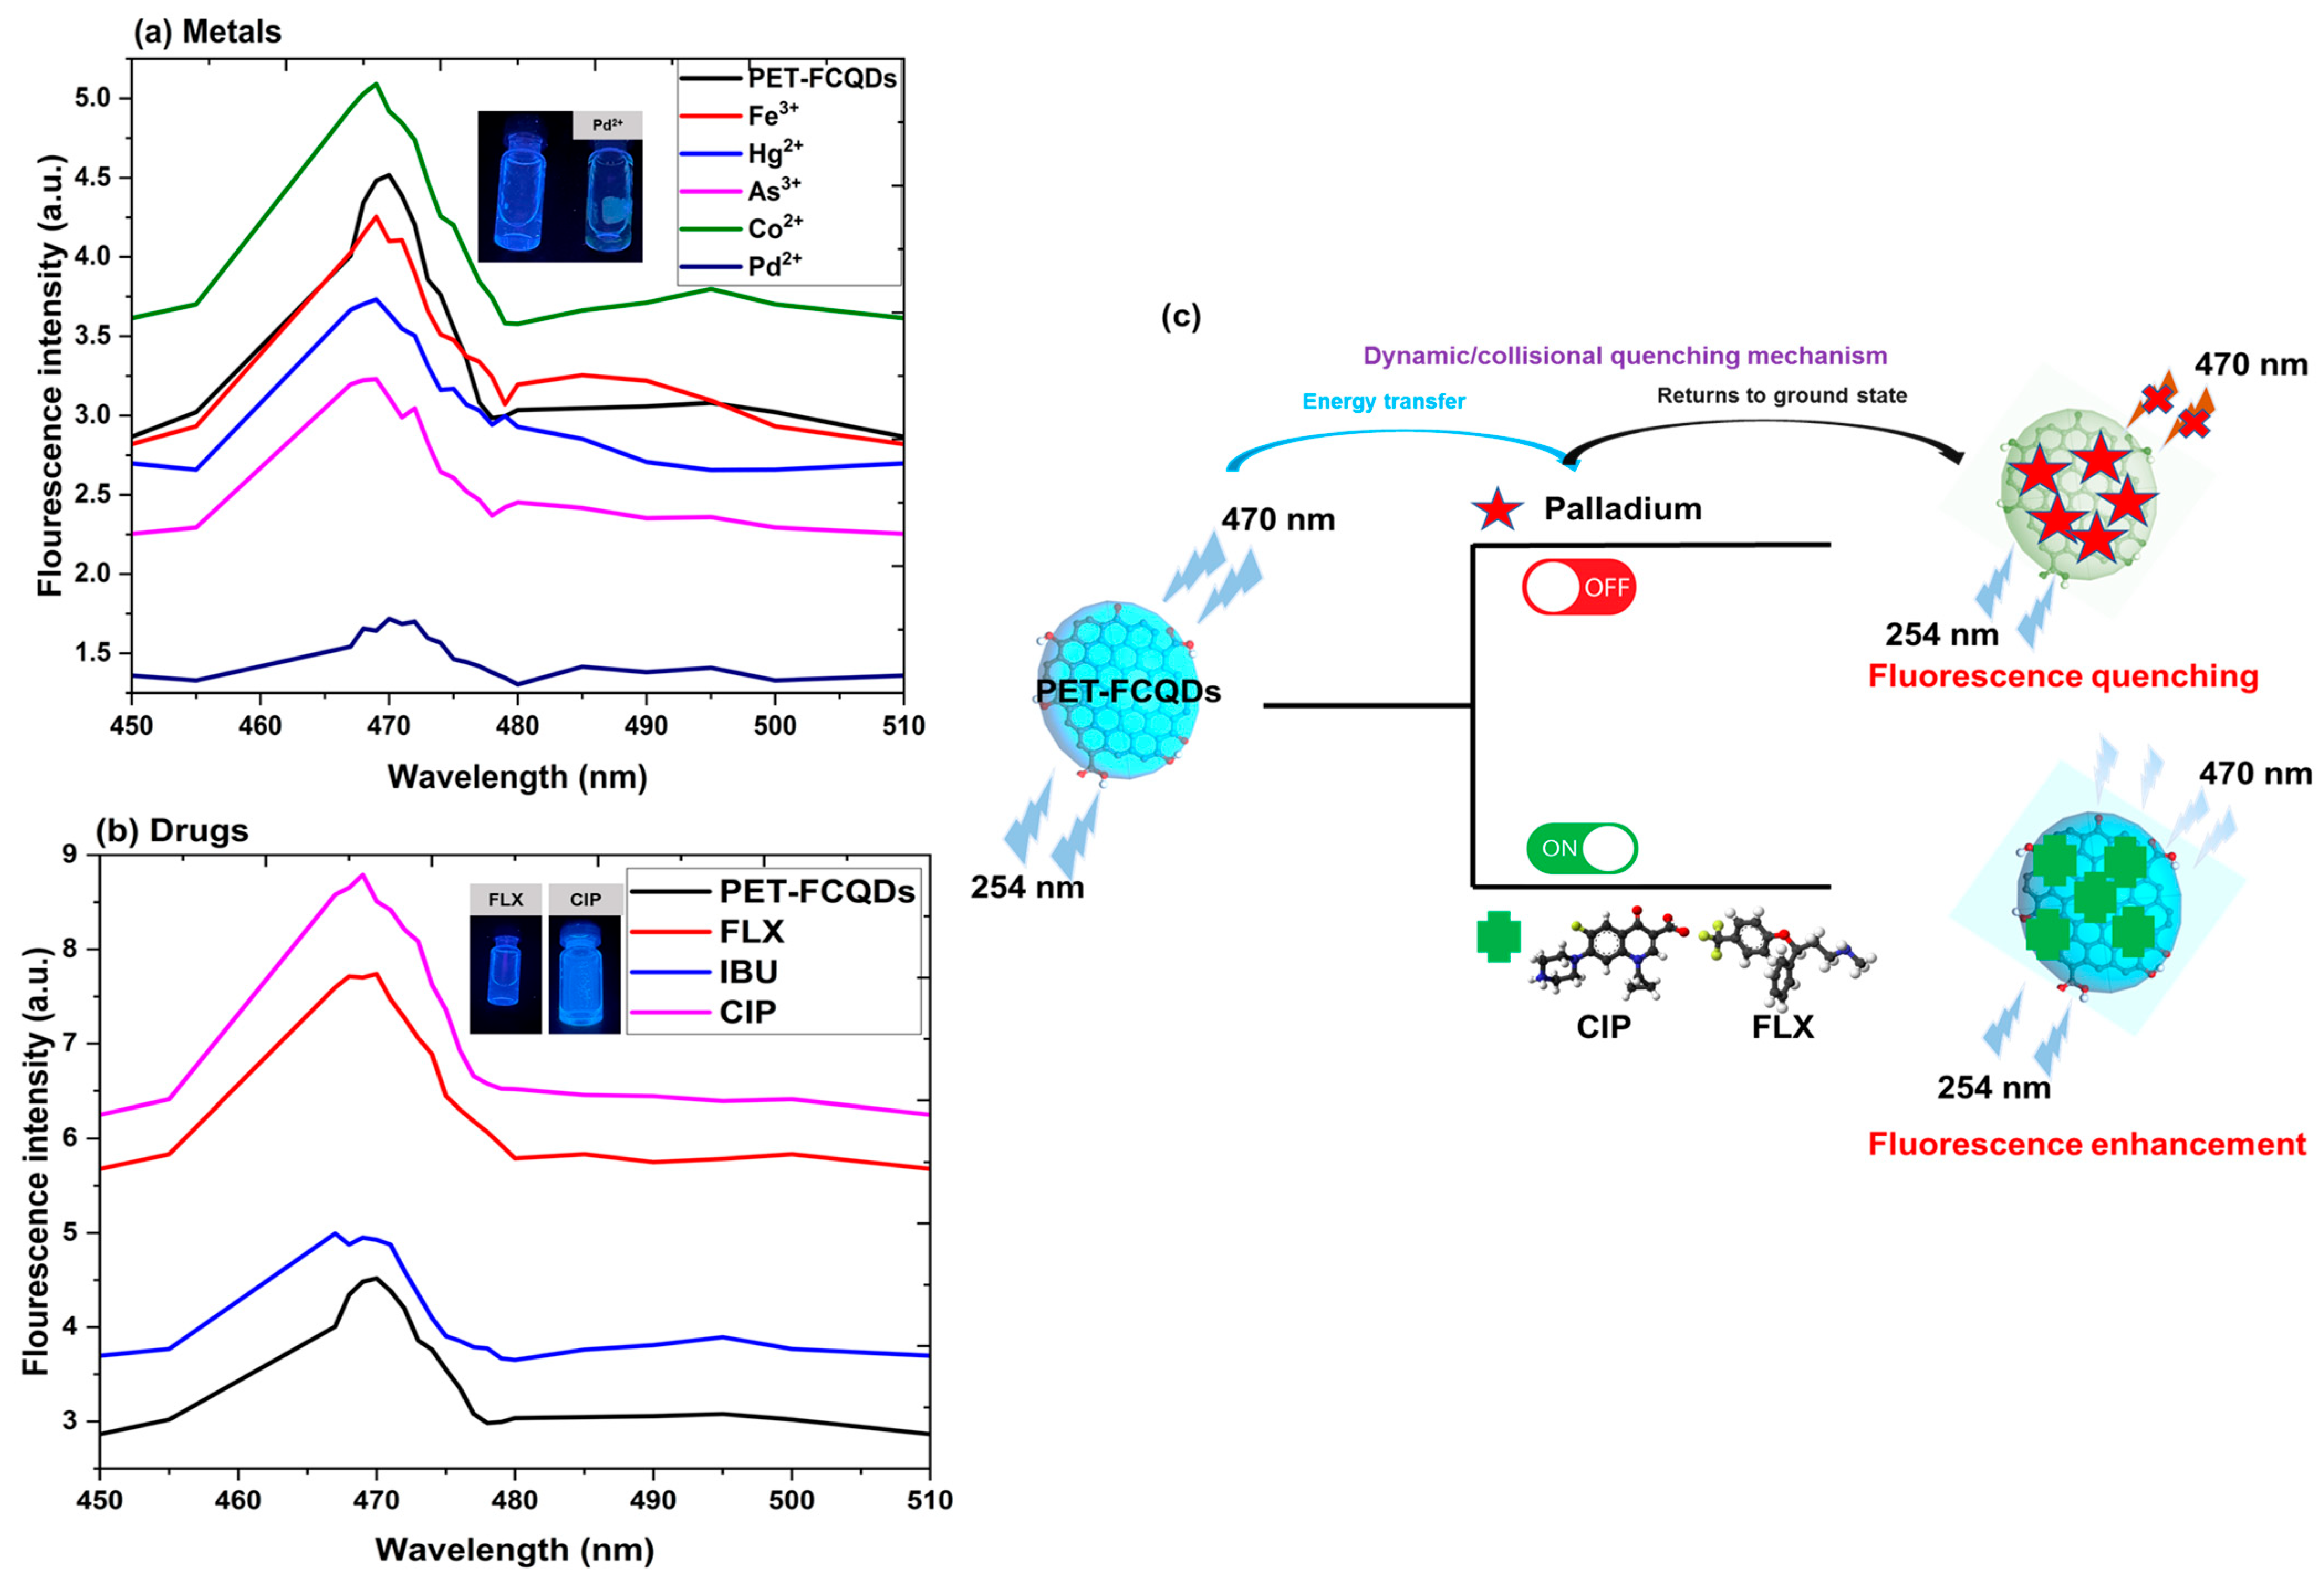
3.5. Fluorescence Assays of Pd2+, CIP, and FLX

The sensing capabilities of PET-FCQDs were evaluated by monitoring their fluorescence emission at 254 nm after the addition of various metals (Fe3+, Hg2+, As3+, Co2+, and Pd2+) and drugs (ciprofloxacin (CIP), ibuprofen (IBU), and fluoxetine (FLX)) (Figure 8a,b). The results revealed that Pd caused a significant fluorescence quenching, reducing the emission intensity by 62%, while the introduction of CIP and FLX to PET-FCQDs led to notable fluorescence enhancements of 94% and 70.58%, respectively (Figure 4b). Other tested metals and drugs had negligible effects on the fluorescence spectra, highlighting the high selectivity of PET-FCQDs toward Pd2+, CIP, and FLX.
This selective response suggests that PET-FCQDs function effectively as a nanoprobe, employing a fluorescence “quenching or turn-off” mechanism for Pd2+ detection and a fluorescence “enhancement or turn-on” mechanism for the identification of CIP and FLX, as illustrated in Figure 4c. These findings align with previous studies reporting carbon dot-based sensors for selective Pd2+ ion by quenching [70], and by enhancement for CIP [71] and FLX [72]. The fluorescence quenching for Pd2+ is attributed to electron transfer from the PET-FCQD surface to Pd2+ (as acceptor), facilitated by interactions with electron-rich groups like C=O (in the HOMO region, Figure 7d) [70]. Conversely, CIP and FLX enhance fluorescence through multiple mechanisms. These include the passivation of surface defect sites through functional group interactions [71,73], π-π stacking between their aromatic structures and the graphitic core of PET-FCQDs, and hydrogen bonding with oxygen-containing groups, which stabilizes the excited state [71]. Additionally, adsorption of CIP and FLX alters the dielectric environment, facilitating exciton recombination and boosting emission [72]. The selective “turn-off” response for Pd2+ is valuable for detecting toxic metals, while the “turn-on” response for CIP and FLX supports pharmaceutical monitoring, underscoring the potential of PET-FCQDs in environmental and water quality analysis.

Quenching Mechanism, Linearity, and Detection Limits

The linear range, limit of detection (LOD), and limit of quantification (LOQ) of the PET-FCQDs were evaluated to assess their sensitivity to Pd2+, fluoxetine (FLX), and ciprofloxacin (CIP) at pH 6. The experiments involved studying the fluorescence response of PET-FCQDs upon the addition of varying concentrations of Pd2+ (1–10 mg/L), FLX (100–400 ng/L), and CIP (50–150 µg/L).
  • Quenching mechanism
For Pd2+, the fluorescence emission peak at 470 nm exhibited a significant quenching in intensity as the Pd2+ concentration increased (Figure 9a). This suggests a strong interaction between Pd2+ and the functional groups on the PET-FCQD surface, leading to fluorescence quenching. The quenching mechanism of Pd2+ was evaluated using the Stern–Volmer curve. The effect of the quencher’s concentration on an emitter’s fluorescence intensity or lifespan is examined using the Stern–Volmer plot [74]. It is described as in Equation (24), where F0 and F represent the fluorescence intensity before and after adding quencher (Pd2+);
F 0 F = 1 + k S V P d 2 +
According to Equation (24), a plot of F 0 F versus [Pd2+] should be linear with an intercept equal to one, and the slope can be analyzed to obtain the bimolecular quenching rate constant, kSV.
Stern–Volmer curve for Pd2+showed a linear correlation with Pd2+ concentration, and the high regression coefficient (R2 = 0.955) suggests that the linear model fits the data well (not perfectly), supporting the reliability of the Stern–Volmer constant determination. The intercept of the curve is approximately 1.145, deviating from the expected value of 1 (Figure 9(ai)). This indicates that the fluorescence quenching mechanisms are beyond simple collisional quenching, like static quenching or complex formation. This indicates that the quenching involves both a non-radiative energy transfer or electron transfer from excited PET-FCQDs to Pd2+, as well as forming a complex in the ground state [75].
To further analyze the quenching mechanism, a non-linear Stern–Volmer plot was generated (Figure 9(aii)) using Equation (25) [76], and the Stern–Volmer constants (kSV) for the static (kSV-1) and dynamic quenching (kSV-2) were determined using the SOLVER function error minimalization.
F 0 F = ( 1 + k S V 1 P d 2 + ) ( 1 + k S V 2 P d 2 + )
The Stern–Volmer constant for both static and dynamic quenching was 0.11 L/mol, indicating that the quenching mechanism of Pd2+ on PET-CQDs is likely governed by a single mode of interaction rather than a combination of static and dynamic processes. If static quenching were dominant, the formation of a stable Pd2+-PET-CQDs complex would result in a higher constant for static quenching compared to dynamic quenching. However, the identical values suggest that Pd2+ does not strongly bind to PET-CQDs in a manner that significantly alters fluorescence. Instead, quenching likely occurs through collisional encounters in the excited state rather than complex formation (Figure 8c). This is further supported by the lack of a significant shift in the absorbance spectrum after varying concentrations of Pd2+ were added (inset of Figure 9(ai)), confirming that dynamic quenching is the predominant mechanism. However, the relatively small kSV values indicate low quenching efficiency for Pd2+. Larger Pd2+ quenching efficiencies ranging from 2770 to 7960 L/mol were reported for green synthesized fluorescent carbon dots from Momordica charantia [77]. This quenching constant provides insight into the sensor’s sensitivity, indicating lower sensitivity [74].
  • Linearity
The linear response (Figure 9(ai)) to Pd2+ concentration indicates that PET-FCQDs can be effectively used as a nanoprobe for Pd2+ detection. For FLX and CIP, the fluorescence emission peak at 470 nm demonstrated an enhancement in intensity with increasing analyte concentration (Figure 9b,c). The fluorescence intensity ratio (F/F0) also exhibited a strong linear relationship with FLX (Figure 9(bi)) and CIP (Figure 9(ci)) concentrations, further confirming the probe’s sensitivity and reliability for detecting these pharmaceutical compounds. The relationship between the fluorescence intensity ratio and the concentration of analytes was modeled using linear equations, demonstrating strong correlations for each target analyte: Pd2+: F 0 F = 0.026 [Pd2+] + 1.145 with a correlation coefficient of R2 = 0.95, indicating a reliable linear relationship between the quenching of fluorescence and Pd2+ concentration. FLX: F/F0 = 2.445 × 10⁻⁴[FLX] + 1.187 with a correlation coefficient of R2 = 0.99, showing an excellent linear fit and high sensitivity in detecting FLX through fluorescence enhancement. CIP: F/F0 = 0.009[CIP] + 0.768 with a correlation coefficient of R2 = 0.95, reflecting a strong linear trend for CIP detection via fluorescence enhancement. These linear equations highlight the quantitative capability of PET-FCQDs for Pd2+, FLX, and CIP, making them a promising tool for environmental monitoring. The high R2 values indicate the reliability and precision of the PET-FCQDs in fluorescence-based sensing applications.
Figure 9. Fluorescence detection application of PET-FCQDs: (a) Fluorescence response, (ai) Stern–Volmer linear curve and (aii) non-linear curve to increasing concentration of Pd2+; (b) Fluorescence response and (bi) linear plot between fluorescence ratio to increasing concentration of FLX; (c) Fluorescence response and (ci) linear plot between fluorescence ratio to increasing concentration of CIP [Inset in (ai): absorbance spectra and photos of the PET-FCQDs solution above taken at 365 nm with UV light after 0, 1, 5, and 10 mg/L of Pd2+ had been added (larger images in Figure S4)].
Surfaces 08 00024 g009aSurfaces 08 00024 g009bSurfaces 08 00024 g009cSurfaces 08 00024 g009d
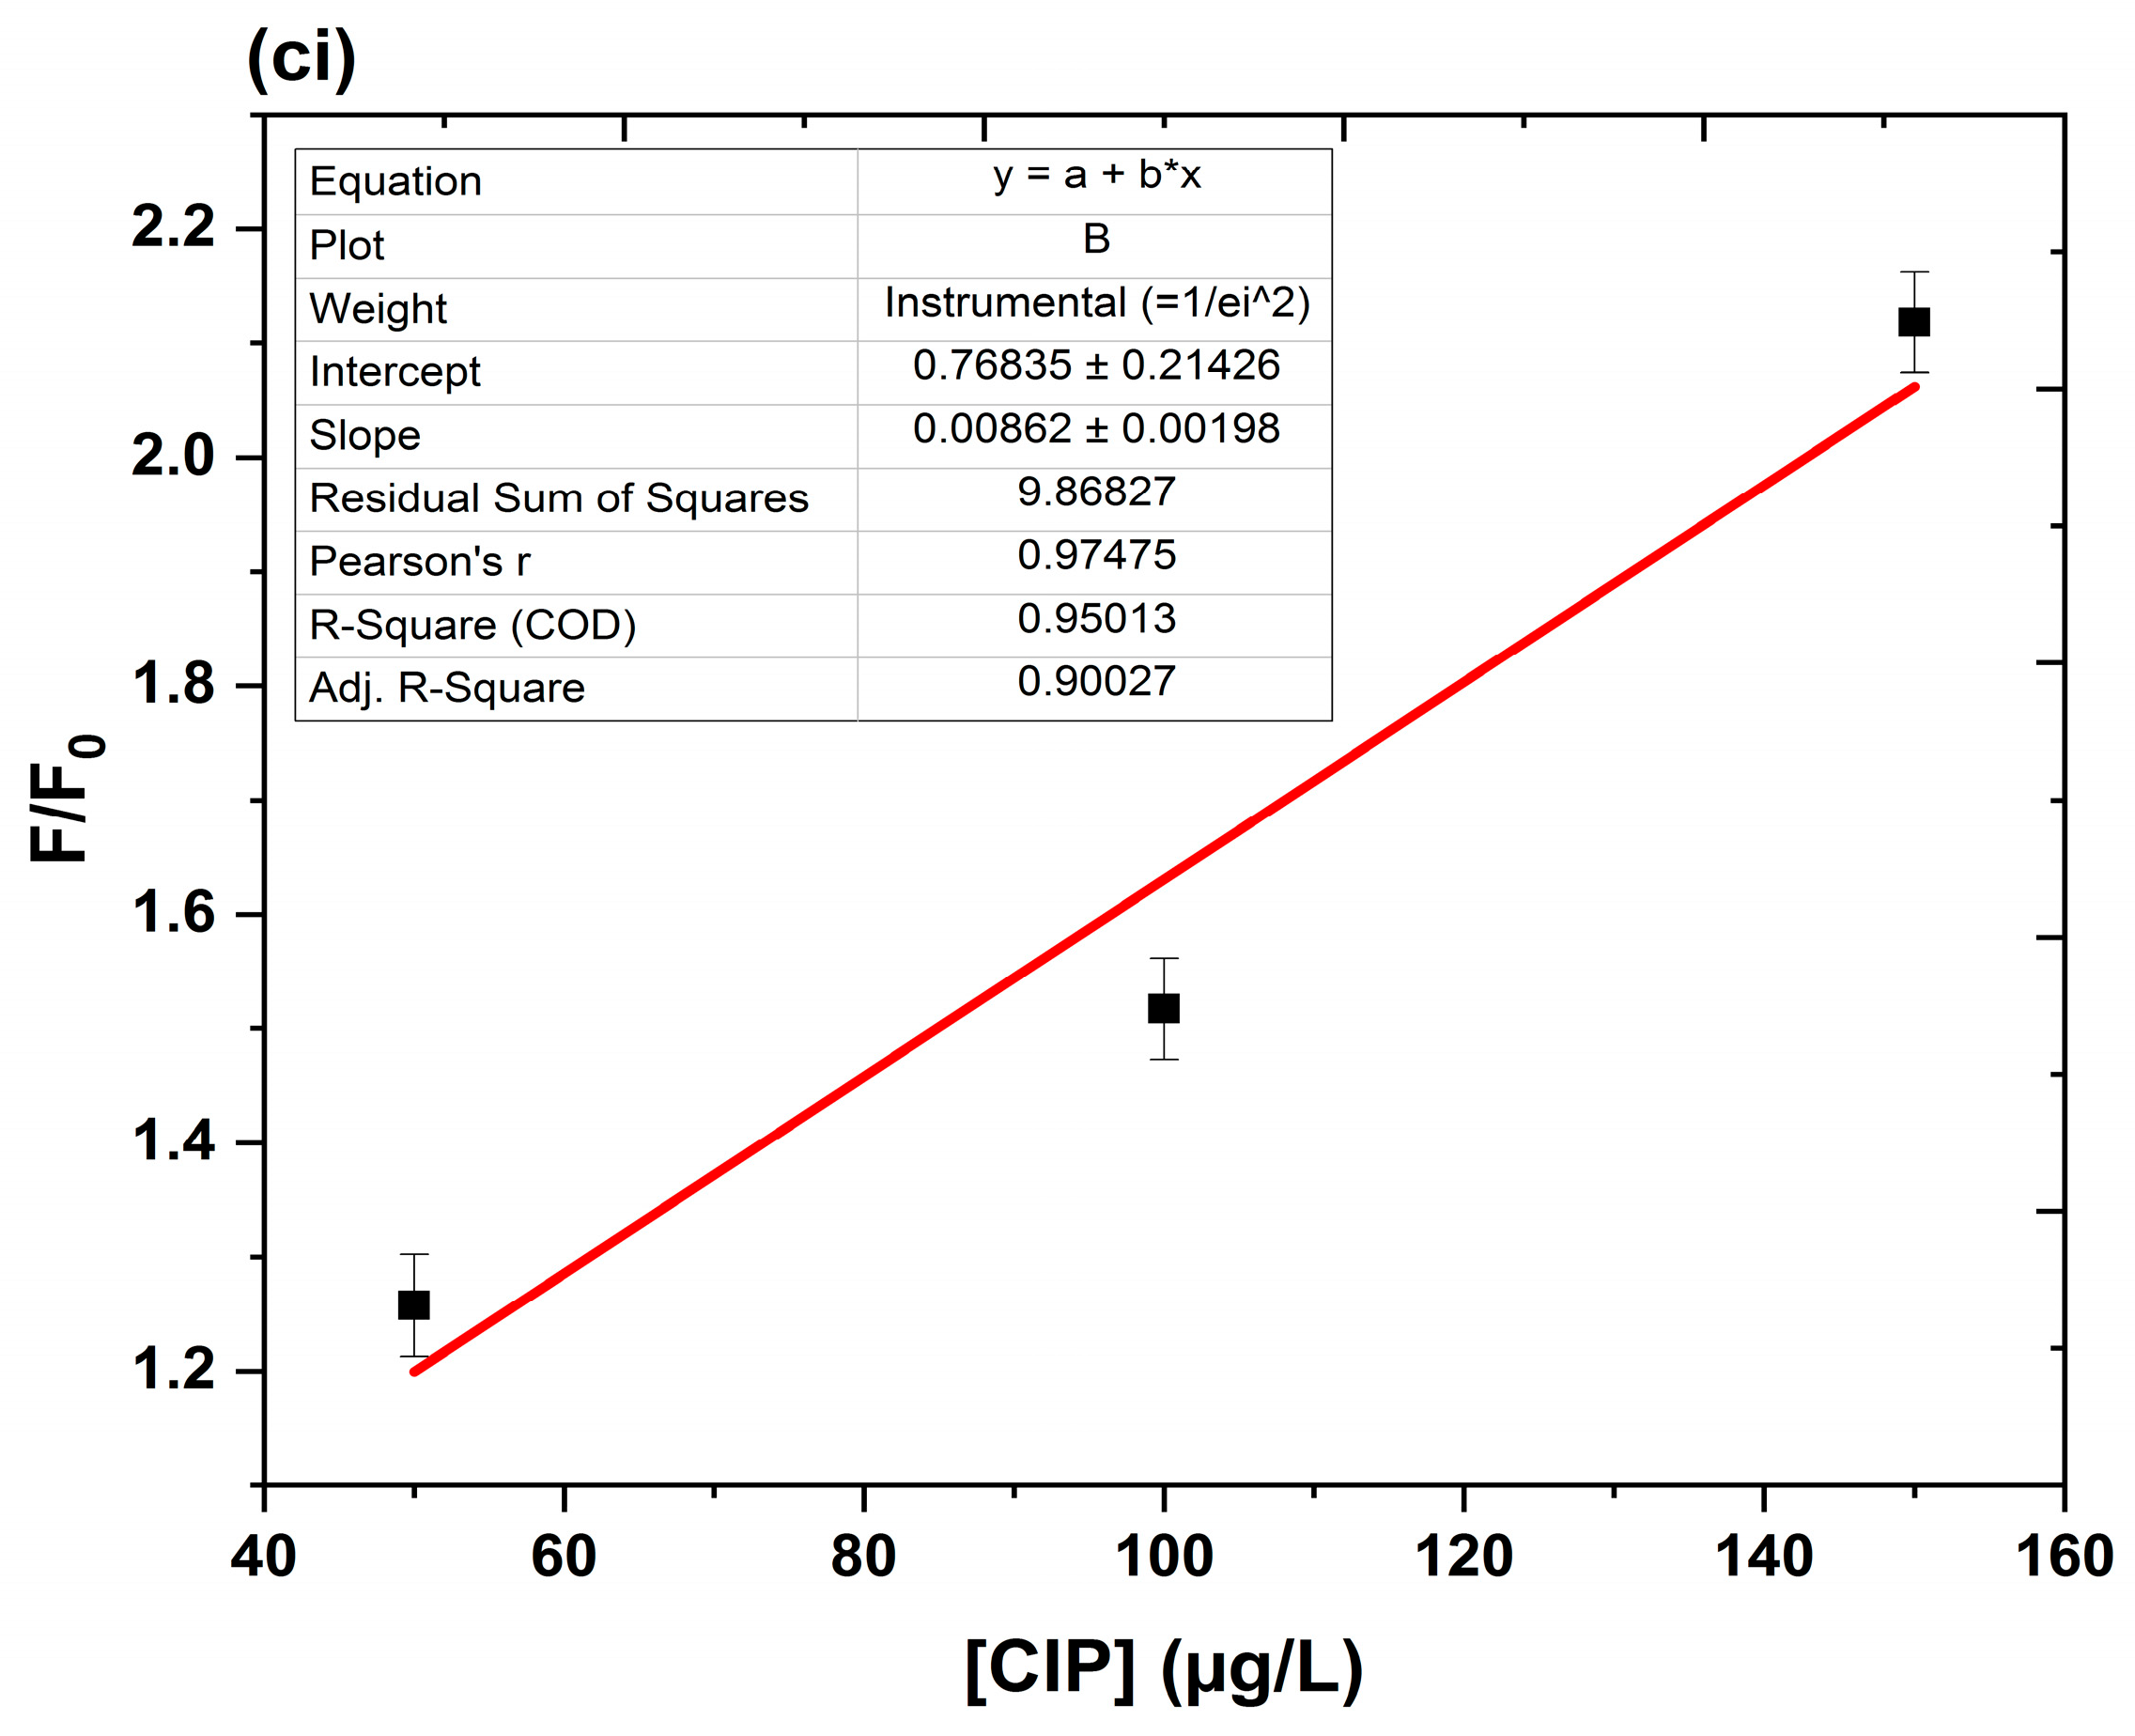
  • Limits of detection (LOD) and quantification (LOQ)
According to the 3σ and 10σ rule, the calculated limits of detection (LOD) and quantification (LOQ) for PET-FCQDs were 1.26 mg/L and 3.85 mg/L for Pd2+, 134 ng/L and 408.99 ng/L for FLX, and 3.3 µg/L and 10 µg/L for CIP, respectively. When compared with literature data (Table 1), the LOD for Pd2+ was higher than that of other fluorescence-based sensors, indicating lower sensitivity. This suggests that, while effective, PET-FCQDs could benefit from further optimization to enhance their sensitivity for Pd2+ detection. For FLX, PET-FCQDs achieved an LOD of 134 ng/L, which outperforms some reported systems, such as citrate-capped silver nanoparticles with a colorimetry-based LOD of 180 × 103 ng/L [78]. However, PET-FCQDs are less sensitive compared to Eu3+-doped niobium carbide MXene quantum dots, which exhibit a superior LOD of 4.64 ng/L [72]. For CIP, the LOD of PET-FCQDs (3.3 µg/L) is significantly more sensitive than the 258.453 µg/L LOD reported for lanthanide-based nanoparticles [79]. Additionally, it is comparable to other quantum dot systems, such as MPA-CdS quantum dots (4 µg/L, [80]), and is superior to Mn-doped ZnS quantum dots (150 µg/L, [81]). PET-FCQDs exhibit competitive performance for detecting FLX and CIP, while further improvements in sensitivity could make them more effective for Pd2+ detection. Their performance, combined with their green synthesis from PET waste, highlights their potential for environmental applications.

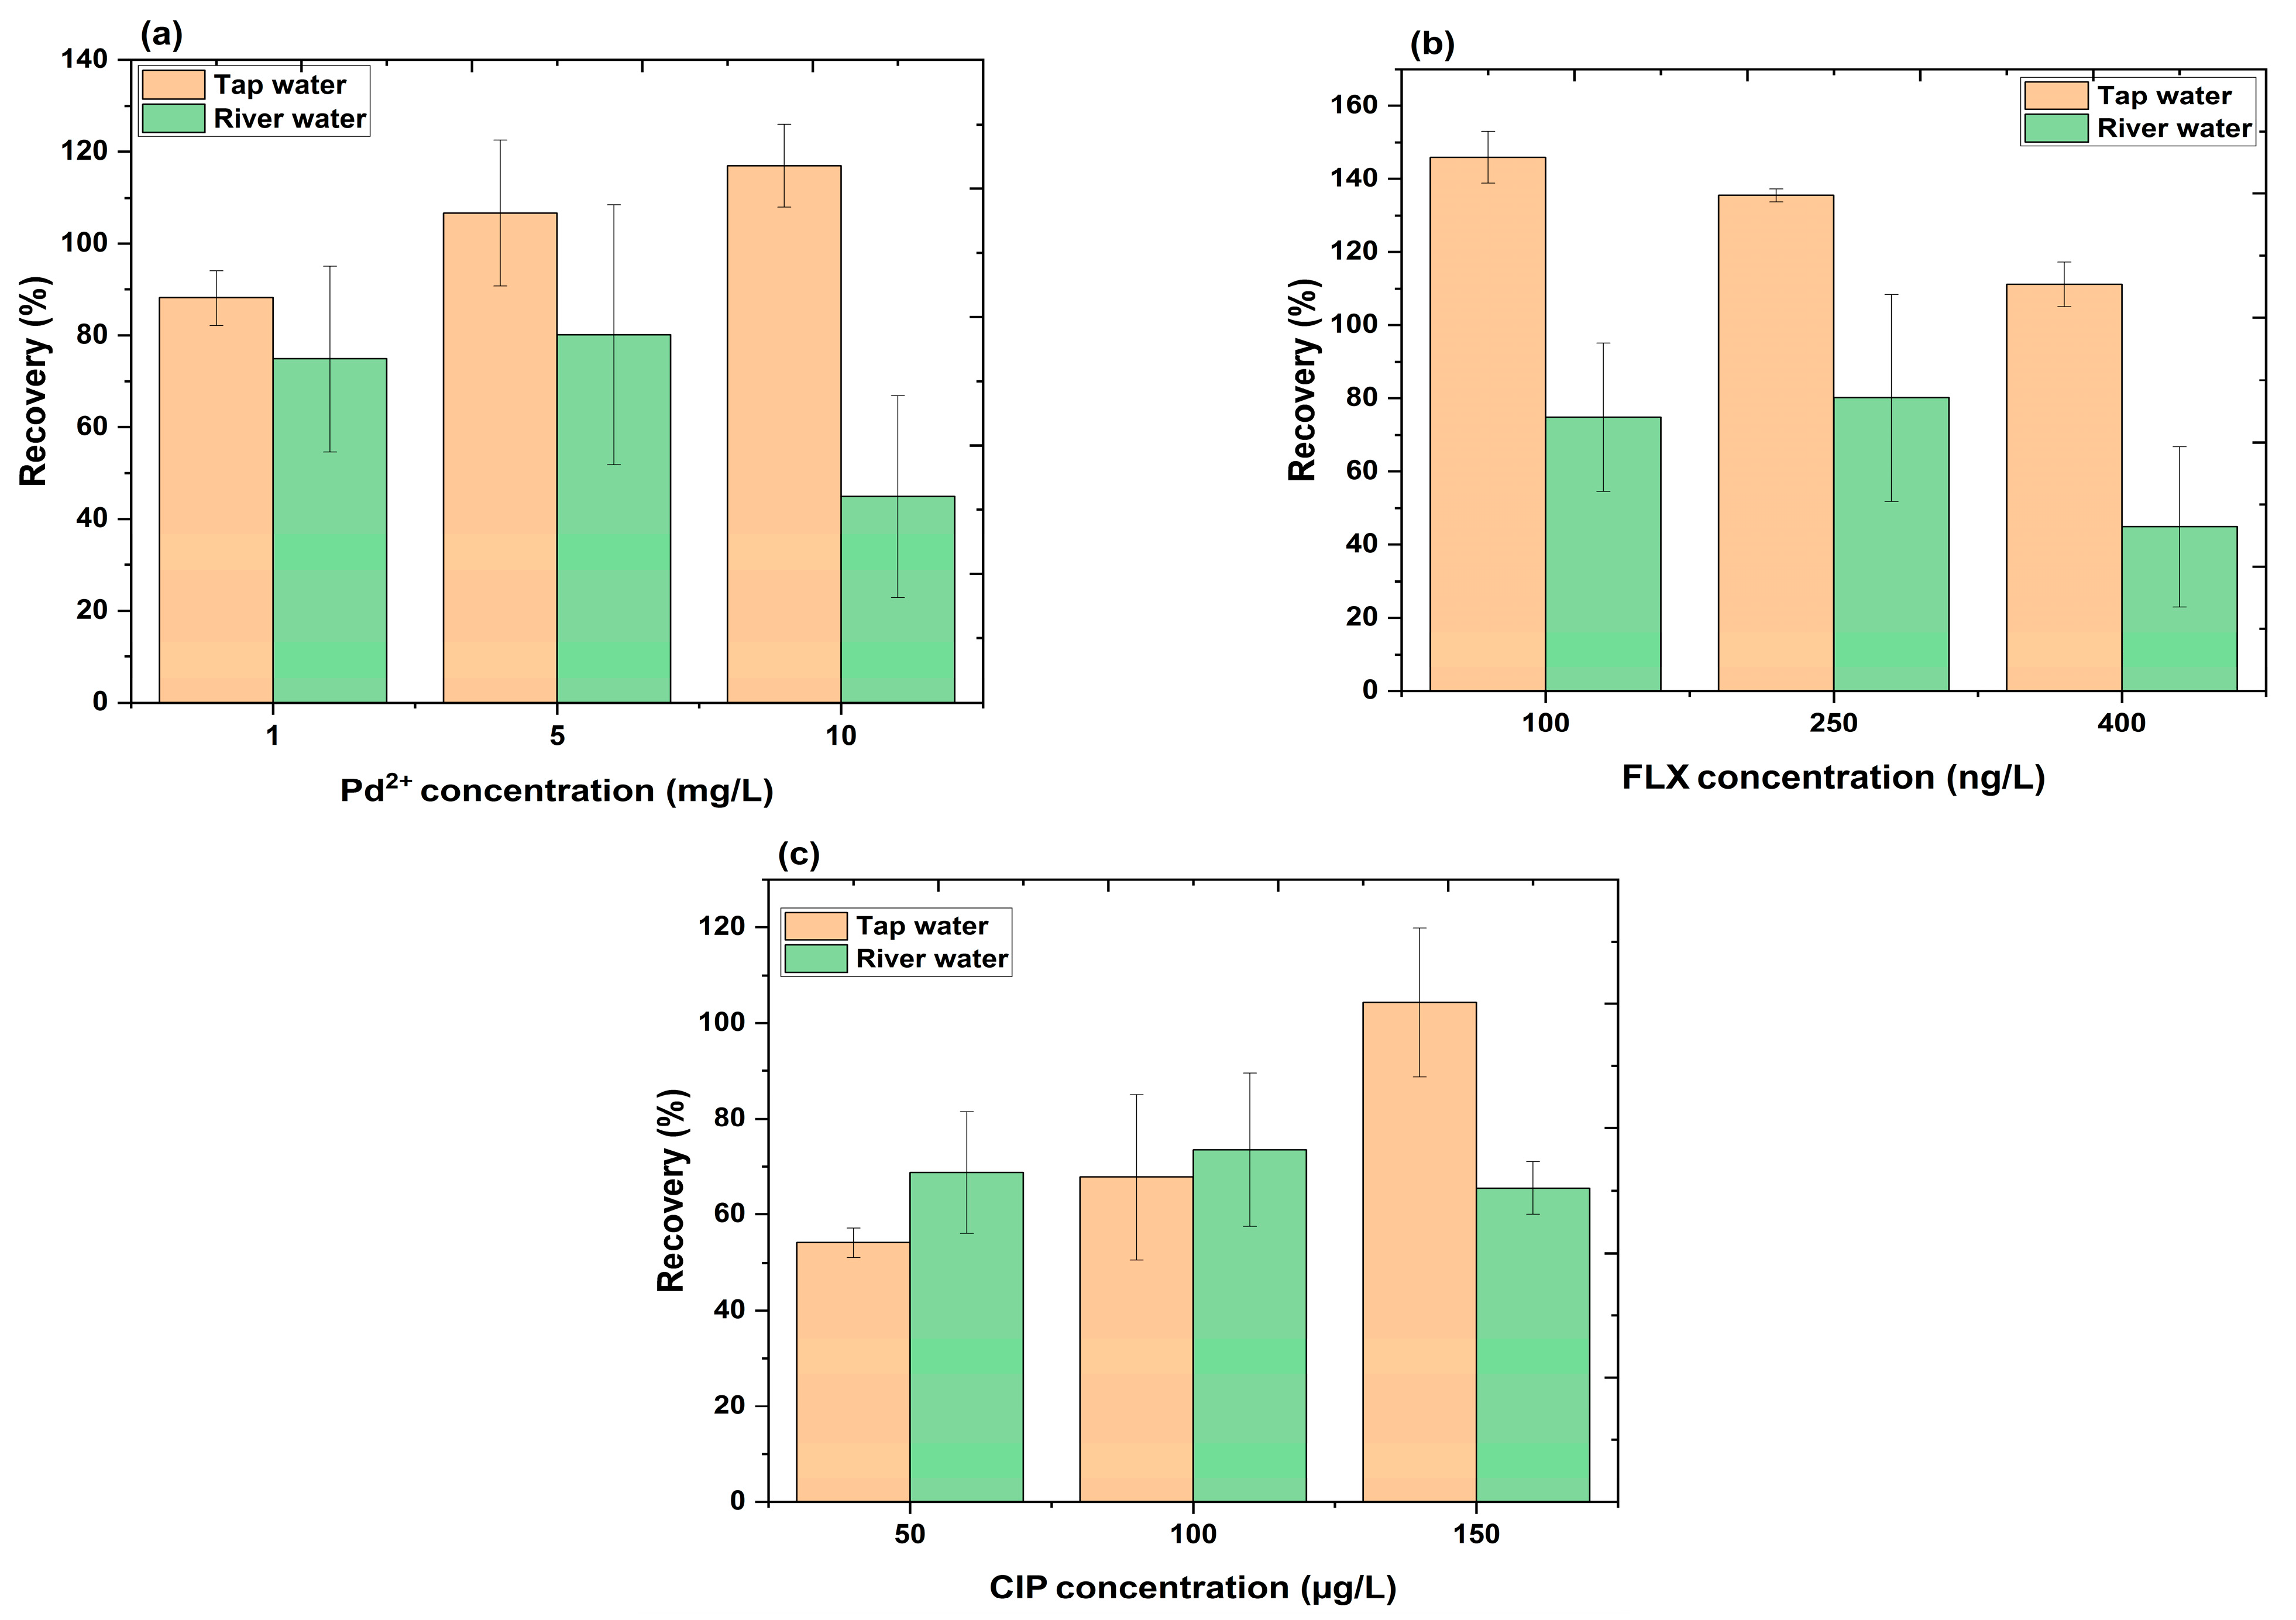
3.6. Analytical Sensing Performance of PET-FCQDs in Real Water Samples

The practical viability of the developed sensor in the area of metal ion and drug sensing has further been checked in the presence of real water samples taken from different sources (tap and river water [Kamogawa river]). The recovery percentages (%) of Pd2+, FLX, and CIP in tap water and river water are provided in Figure 10, providing insight into the accuracy and reliability of the PET-FCQDs-based detection method. The recovery percentages for Pd2+ ranged from 88.16 to 116.97% for tap water and 44.88 to 74.86% for river water (Figure 10a). The significantly lower recovery at 10 mg/L (44.88%) for river water suggests potential interference from the complex river water matrix, such as organic matter, competing ions, or particle interactions. Pd2+ shows the best recovery in tap water, with reasonable results in river water, though performance declines at higher concentrations. For FLX, recoveries ranged from 145.90 to 111.18% for tap water and from 64.03 to 73.78% for river water (Figure 10b). While lower than ideal, the recoveries are within a more acceptable range compared to tap water, suggesting that the PET-FCQDs perform better in the river water matrix for FLX detection. The recovery percentages for CIP ranged from 54.14 to 104.25% for tap water (Figure 10c). The results show a gradual improvement in recovery as the CIP concentration increases, indicating better performance at higher levels. However, values at lower concentrations (54.14% for 50 µg/L) suggest possible underestimation or inefficiencies in CIP detection. For river water, the CIP recovery percentages ranged from 68.76 to 65.50% (Figure 10c). The recoveries are relatively consistent but remain below 100%, suggesting moderate performance in river water. The complex matrix may affect the efficiency of CIP recovery. Generally, CIP showed consistent but suboptimal recoveries across both matrices, with improved results at higher concentrations. The differences in recovery between tap water and river water highlight the impact of the sample matrix on detection efficiency. The results generally suggest that the method may require further optimization to address the interferences in tap and river water matrices and to enhance sensitivity, accuracy, and robustness for environmental and practical applications.

4. Conclusions

In this study, fluorescent carbon quantum dots (PET-FCQDs) were successfully synthesized using a green, one-step approach from recycled PET waste based on pyrolysis. By lowering the cost of necessary raw materials, the current approach has provided a straightforward method for the creation of beneficial advanced nanomaterials. One of the most interesting topics in science is the upcycling of plastic trash into valuable nanomaterials because of its positive effects on the environment. With negligible weight loss up to about 300 °C, the PET-FCQDs demonstrate thermal stability at lower temperatures. They also include a variety of functional groups, including -CO, -COOH, and -OH, on their external surface, and they have good water solubility. The synthesized PET-FCQDs exhibited photoluminescent properties and were applied as a dual-mode sensing nanoprobe for Pd2+, ciprofloxacin (CIP), and fluoxetine (FLX) through fluorescence quenching and enhancement mechanisms. The PET-FCQDs demonstrated good sensitivity and selectivity for Pd2+, CIP, and FLX, which were comparable to previously reported systems. The recovery studies in real water samples revealed that the PET-FCQDs performed reliably in both tap water and river water, demonstrating their practical applicability for environmental monitoring. However, variations in recovery rates for certain analytes highlight the need for further investigation into matrix effects and experimental refinements. This work underscores the potential of PET-FCQDs as a cost-effective and environmentally friendly sensor for detecting emerging pollutants, while promoting sustainable waste management strategies through the upcycling of PET plastics. Future efforts should focus on improving sensitivity and expanding the applicability of PET-FCQDs for detecting a broader range of contaminants in complex environmental matrices.

Supplementary Materials

The following supporting information can be downloaded at: https://www.mdpi.com/article/10.3390/surfaces8020024/s1. Figure S1: PET-FCQDs base structure and surface area calculation; Figure S2: Integrated area computation from fluorescence spectra of (a) Rhodamine 6G (reference) and (b) PET-FCQDs. The integrated area was computed using OriginLab pro.; Figure S3: photos of the PET-FCQDs solution above taken at 365 nm with UV light after (a) Pd2+ and (b) FLX and (c) CIP had been added; Figure S4: Absorbance spectra and photos (inset) of the PET-FCQDs solution taken at 365 nm with UV light after 0, 1, 5 and 10 mg/L of Pd2+ had been added.

Author Contributions

C.E.E.: Conceptualization, Methodology, Software, Formal analysis, Validation, Visualization, Investigation, Data curation, Project administration, Writing—Original draft preparation, Writing—Reviewing and Editing. Q.W.: Supervision, Project administration, Funding acquisition, Resources, Writing—Reviewing and Editing. W.W. and M.S.: Data curation, Formal analysis, Software, Visualization. G.M., D.N. and S.L.: Writing—Reviewing and Editing. All authors have read and agreed to the published version of the manuscript.

Funding

This research was supported by the Japanese Society for the Promotion of Science (JSPS KAKENHI Award number: 24KF0131) through a Special Research Fellowship application.

Data Availability Statement

Data is contained within the article or Supplementary Materials.

Conflicts of Interest

The authors declare no conflicts of interest.

References

  1. Chowdhury, T.; Wang, Q.; Enyoh, C.E. Degradation of Polyethylene Terephthalate Microplastics by Mineral Acids: Experimental, Molecular Modelling and Optimization Studies. J. Polym. Environ. 2022, 30, 5211–5227. [Google Scholar] [CrossRef]
  2. Hallaji, Z.; Bagheri, Z.; Ranjbar, B. The role of fluorescent carbon dots in the fate of plastic waste. J. Environ. Chem. Eng. 2023, 11, 110322. [Google Scholar] [CrossRef]
  3. Verla, A.W.; Enyoh, C.E.; Verla, E.N.; Nwarnorh, K.O. Microplastic–toxic chemical interaction: A review study on quantified levels, mechanism and implication. SN Appl. Sci. 2019, 1, 1400. [Google Scholar] [CrossRef]
  4. Enyoh, C.E.; Ovuoraye, P.E.; Rabin, M.H.; Qingyue, W.; Tahir, M.A. Thermal degradation evaluation of polyethylene terephthalate microplastics: Insights from kinetics and machine learning algorithms using non-isoconversional TGA data. J. Environ. Chem. Eng. 2024, 12, 111909. [Google Scholar] [CrossRef]
  5. Miao, Y.; Zhao, Y.; Waterhouse, G.I.; Shi, R.; Wu, L.-Z.; Zhang, T. Photothermal recycling of waste polyolefin plastics into liquid fuels with high selectivity under solvent-free conditions. Nat. Commun. 2023, 14, 4242. [Google Scholar]
  6. Al-Tayeb, M.M.; Zeyad, A.M.; Dawoud, O.; Tayeh, B. Experimental and numerical investigations of the influence of partial replacement of coarse aggregates by plastic waste on the impact load. Int. J. Sustain. Eng. 2021, 14, 735–742. [Google Scholar] [CrossRef]
  7. Lamba, P.; Kaur, D.P.; Raj, S.; Sorout, J. Recycling/reusing plastic waste as construction material for sustainable development: A review. Environ. Sci. Pollut. Res. 2022, 29, 86156–86179. [Google Scholar]
  8. Feng, Z.; Adolfsson, K.H.; Xu, Y.; Fang, H.; Hakkarainen, M.; Wu, M. Carbon dot/polymer nanocomposites: From green synthesis to energy, environmental and biomedical applications. Sustain. Mater. Technol. 2021, 29, e00304. [Google Scholar] [CrossRef]
  9. Yaqoob, L.; Noor, T.; Iqbal, N. Conversion of plastic waste to carbon-based compounds and application in energy storage devices. ACS Omega 2022, 7, 13403–13435. [Google Scholar]
  10. Yuan, X.; Cho, M.K.; Lee, J.G.; Choi, S.W.; Lee, K.B. Upcycling of waste polyethylene terephthalate plastic bottles into porous carbon for CF4 adsorption. Environ. Pollut. 2020, 265 Pt A, 114868. [Google Scholar] [CrossRef]
  11. Damayanti; Wu, H.S. Strategic possibility routes of recycled PET. Polymers 2021, 13, 1475. [Google Scholar] [CrossRef] [PubMed]
  12. Bian, X.; Xia, G.; Xin, J.H.; Jiang, S.; Ma, K. Applications of waste polyethylene terephthalate (PET) based nanostructured materials: A review. Chemosphere 2023, 350, 141076. [Google Scholar] [PubMed]
  13. Aji, M.P.; Rahmawati, I.; Priyanto, A.; Marwoto, P. Novel one-step synthesis of solid-state carbonized polymer dots by heating at around melting point of polyethylene terephthalate (PET) bottle plastic waste. Environ. Nanotechnol. Monit. Manag. 2023, 20, 100892. [Google Scholar] [CrossRef]
  14. Zhou, X.; Deng, J.; Li, Z.; Cheng, Y.; Zhou, J.; Jiang, M.; Dong, W. One-Pot Synthesis of Multicolor Carbon Dots from PET Plastic Waste for White Light-Emitting Diodes. ACS Sustain. Chem. Eng. 2024, 12, 16592–16602. [Google Scholar] [CrossRef]
  15. Enyoh, C.E.; Wang, Q. Box–Behnken design and machine learning optimization of PET fluorescent carbon quantum dots for removing fluoxetine and ciprofloxacin with molecular dynamics and docking studies as potential antidepressant and antibiotic. Sep. Purif. Technol. 2025, 362, 131975. [Google Scholar] [CrossRef]
  16. Soni, V.; Duc Anh, D.; Komal, P.; Rohit, K.; Pardeep, S.; Vinod Kumar, P.; Rangabhashiyam, S.; Archana, S.; Vishal, C.; Sourbh, T.; et al. Upcycling of polyethylene terephthalate (PET) plastic wastes into carbon-based nanomaterials: Current status and future perspectives. Eur. Polym. J. 2024, 215, 113249. [Google Scholar] [CrossRef]
  17. Umemura, T.; Sato, K.; Kusaka, Y.; Satoh, H. Chapter 26—Palladium Handbook on the Toxicology of Metals, 5th ed.; Volume II: Specific Metals; Academic Press: Cambridge, MA, USA, 2022; pp. 649–662. [Google Scholar] [CrossRef]
  18. Hosseini, M.J.; Jafarian, I.; Farahani, S.; Khodadadi, R.; Tagavi, S.H.; Naserzadeh, P.; Mohammadi-Bardbori, A.; Arghavanifard, N. New mechanistic approach of inorganic palladium toxicity: Impairment in mitochondrial electron transfer. Metallomics 2016, 8, 252–259. [Google Scholar]
  19. Laimou-Geraniou, M.; Heath, D.; Heath, E. Analytical methods for the determination of antidepressants, antipsychotics, benzodiazepines and their metabolites through wastewater-based epidemiology. Trends Environ. Anal. Chem. 2023, 37, e00192. [Google Scholar]
  20. Enyoh, C.E.; Wang, Q. Adsorption and toxicity characteristics of ciprofloxacin on differently prepared polyethylene terephthalate microplastics from both experimental and theoretical perspectives. J. Water Process Eng. 2023, 53, 103909. [Google Scholar] [CrossRef]
  21. Fergusson, K.N.; Tanner, J.L.; Brand, J.A.; Hannington, S.L.; Pettersen, A.K.; Sundin, J.; Saaristo, M.; Bertram, M.G.; Martin, J.M.; Wong, B.B.M. Effects of long-term fluoxetine exposure on morphology, but not behaviour or metabolic rate, in male guppies (Poecilia reticulata). Aquat. Toxicol. 2024, 276, 107082. [Google Scholar] [CrossRef]
  22. Fursdon, J.B.; Martin, J.M.; Bertram, M.G.; Lehtonen, T.K.; Wong, B.B.M. The pharmaceutical pollutant fluoxetine alters reproductive behaviour in a fish independent of predation risk. Sci. Total Environ. 2019, 650 Pt 1, 642–652. [Google Scholar] [CrossRef] [PubMed]
  23. Tymoshuk, O.S.; Fedyshyn, O.S.; Oleksiv, L.V.; Rydchuk, P.V.; Matiychuk, V.S. Spectrophotometric Determination of Palladium(II) Ions Using a New Reagent: 4-(N’-(4-Imino-2-oxo-thiazolidine-5-ylidene)-hydrazino)-benzoic Acid (p-ITYBA). J. Chem. 2020, 2020, 8141853. [Google Scholar] [CrossRef]
  24. Chowdhury, T.; Wang, Q. Study on Thermal Degradation Processes of Polyethylene Terephthalate Microplastics Using the Kinetics and Artificial Neural Networks Models. Processes 2023, 11, 496. [Google Scholar] [CrossRef]
  25. Coats, A.W.; Redfern, J.P. Kinetic Parameters from Thermogravimetric Data. Nature 1964, 201, 68–69. [Google Scholar] [CrossRef]
  26. Snee, P.T. DFT Calculations of InP Quantum Dots: Model Chemistries, Surface Passivation, and Open-Shell Singlet Ground States. J. Phys. Chem. C 2021, 125, 11765–11772. [Google Scholar] [CrossRef]
  27. Enyoh, C.E.; Toochukwu, M.; Wang, Q.; Islam, M.R. In Silico Screening of Active Compounds in Garri for the Inhibition of Key Enzymes Linked to Diabetes Mellitus. ACS Food Sci. Technol. 2022, 2, 1597–1611. [Google Scholar] [CrossRef]
  28. Parr, R.G.; Pearson, R.G. Absolute Hardness: Companion Parameter to Absolute Electronegativity. J. Am. Chem. Soc. 1983, 105, 7512–7516. [Google Scholar] [CrossRef]
  29. Pearson, R.G. Absolute Electronegativity and Hardness: Application to Inorganic Chemistry. Inorg. Chem. 1988, 27, 734–740. [Google Scholar] [CrossRef]
  30. Wang, B.; Lu, S. The light of carbon dots: From mechanism to applications. Matter 2022, 5, 110–149. [Google Scholar] [CrossRef]
  31. Wang, Y.; Hu, A. Carbon quantum dots: Synthesis, properties and applications. J. Mater. Chem. C 2014, 2, 6921–6939. [Google Scholar] [CrossRef]
  32. Brouwer, A. Standards for photoluminescence quantum yield measurements in solution (IUPAC Technical Report). Pure Appl. Chem. 2011, 83, 2213–2228. [Google Scholar] [CrossRef]
  33. Chan, K.; Zinchenko, A. Aminolysis-assisted hydrothermal conversion of waste PET plastic to N-doped carbon dots with markedly enhanced fluorescence. J. Environ. Chem. Eng. 2022, 10, 107749. [Google Scholar] [CrossRef]
  34. Cruz, M.I.S.D.; Thongsai, N.; de Luna, M.D.G. Preparation of highly photoluminescent carbon dots from polyurethane: Optimization using response surface methodology and selective detection of silver (I) ion. Colloids Surf. A Physicochem. Eng. Asp. 2019, 568, 184–194. [Google Scholar]
  35. Wu, Y.; Wang, R.; Xie, W.; Ma, G.; Zhang, A.; Liu, B.; Huang, H.; Gao, L.; Qu, M.; Wei, Y.; et al. Solvent-thermal preparation of sulfur and nitrogen-doped carbon dots with PET waste as precursor and application in light-blocking film. J. Nanoparticle Res. 2023, 25, 18. [Google Scholar]
  36. Chaudhary, S.; Kumari, M.; Chauhan, P.; Ram Chaudhary, G. Upcycling of plastic waste into fluorescent carbon dots: An environmentally viable transformation to biocompatible C-dots with potential prospective in analytical applications. Waste Manag. 2020, 120, 675–686. [Google Scholar] [CrossRef]
  37. Egorova, M.N.; Tomskaya, A.E.; Kapitonov, A.N.; Smagulova, S.A.; Alekseev, A.A. Investigation of luminescence quantum yields of carbon dots synthesized from ethylene glycol, citric acid and berries. J. Phys. Conf. Ser. 2018, 1124, 081002. [Google Scholar] [CrossRef]
  38. Karami, M.H.; Abdouss, M.; Rahdar, A.; Pandey, S. Graphene quantum dots: Background, synthesis methods, and applications as nanocarrier in drug delivery and cancer treatment: An updated review. Inorg. Chem. Commun. 2024, 161, 112032. [Google Scholar] [CrossRef]
  39. Aji, M.P.; Wati, A.L.; Priyanto, A.; Karunawan, J.; Nuryadin, B.W.; Wibowo, E.; Marwoto, P.; Sulhadi. Polymer carbon dots from plastics waste upcycling. Environ. Nanotechnol. Monit. Manag. 2018, 9, 136–140. [Google Scholar] [CrossRef]
  40. Jayaweera, S.; Yin, K.; Hu, X.; Ng, W.J. Fluorescent N/Al Co-Doped Carbon Dots from Cellulose Biomass for Sensitive Detection of Manganese (VII). J. Fluoresc. 2019, 29, 1291–1300. [Google Scholar] [CrossRef]
  41. Lu, S.; Sui, L.; Liu, J.; Zhu, S.; Chen, A.; Jin, M.; Yang, B. Near-infrared photoluminescent polymer carbon nanodots with two-Photon fluorescence. Adv. Mater. 2017, 29, 1604436. [Google Scholar]
  42. Deka, M.J.; Chowdhury, D. Chiral carbon dots and their effect on the optical properties of photosensitizers. RSC Adv. 2017, 7, 53057–53063. [Google Scholar]
  43. László, K.; Bóta, A.; Dékány, I. Effect of heat treatment on synthetic carbon precursors. Carbon 2003, 41, 1205–1214. [Google Scholar] [CrossRef]
  44. Kaur, P.; Verma, G. Converting fruit waste into carbon dots for bioimaging applications. Mater. Today Sustain. 2022, 18, 100137. [Google Scholar] [CrossRef]
  45. Sherka, G.T.; Berry, H.D. Insight into impact of size and shape on optoelectronic properties of InX (X = As, Sb, and P) semiconductor nanoparticles: A theoretical study. Front. Phys. 2024, 12, 1447997. [Google Scholar] [CrossRef]
  46. Pereira, A.P.; da Silva, M.H.P.; Júnior, É.P.L.; Paula, A.D.S.; Tommasini, F.J. Processing and Characterization of PET Composites Reinforced With Geopolymer Concrete Waste. Mater. Res. 2017, 20, 411–420. [Google Scholar] [CrossRef]
  47. Enyoh, C.E.; Wang, Q. Combined experimental and molecular dynamics removal processes of contaminant phenol from simulated wastewater by polyethylene terephthalate microplastics. Environ. Technol. 2022, 45, 1183–1202. [Google Scholar] [CrossRef]
  48. Tao, S.; Song, Y.; Zhu, S.; Shao, J.; Yang, B. A new type of polymer carbon dots with high quantum yield: From synthesis to investigation on fluorescence mechanism. J. Polym. 2017, 116, 472–478. [Google Scholar]
  49. Gao, Z.; Wang, L.; Su, R.; Huang, R.; Qi, W.; He, Z. A carbon dot-based “off-on” fluorescent probe for highly selective and sensitive detection of phytic acid. Biosens. Bioelectron. 2015, 70, 232–238. [Google Scholar] [CrossRef]
  50. Sun, H.; Wu, L.; Gao, N.; Ren, J.; Qu, X. Improvement of photoluminescence of graphene quantum dots with a biocompatible photochemical reduction pathway and its bioimaging application. ACS Appl. Mater. Interfaces 2013, 5, 1174–1179. [Google Scholar]
  51. Mmelesi, O.K.; Mguni, L.L.; Li, F.-t.; Nkosi, B.; Liu, X. Recent development in fluorescent carbon quantum dots-based photocatalysts for water and energy applications. Mater. Sci. Semicond. Process. 2024, 181, 108661. [Google Scholar] [CrossRef]
  52. Das, S.; Mondal, S.; Ghosh, D. Carbon quantum dots in bioimaging and biomedicines. Front. Bioeng. Biotechnol. 2024, 11, 1333752. [Google Scholar] [CrossRef]
  53. Uchimiya, M.; Ohno, T.; He, Z. Pyrolysis temperature-dependent release of dissolved organic carbon from plant, manure, and biorefinery wastes. J. Anal. Appl. Pyrolysis 2013, 104, 84–94. [Google Scholar] [CrossRef]
  54. Fedunik-Hofman, L.; Bayon, A.; Donne, S.W. Kinetics of Solid-Gas Reactions and Their Application to Carbonate Looping Systems. Energies 2019, 12, 2981. [Google Scholar] [CrossRef]
  55. Enyoh, C.E.; Maduka, T.O.; Suzuki, M.; Lu, S.; Wang, Q. Thermoanalytical and Kinetic Studies for the Thermal Stability of Emerging Pharmaceutical Pollutants Under Different Heating Rates. J. Xenobiotics 2024, 14, 1784–1806. [Google Scholar] [CrossRef] [PubMed]
  56. Brown, M.E. The Prout-Tompkins rate equation in solid-state kinetics. Thermochim. Acta 1997, 300, 93–106. [Google Scholar] [CrossRef]
  57. Muraleedharan, K.; Kannan, M.P.; Gangadevi, T. Effects of dopants on the isothermal decomposition kinetics of potassium metaperiodate. J. Serb. Chem. Soc. 2011, 76, 1129–1138. [Google Scholar] [CrossRef]
  58. Mishra, R.K.; Sahoo, A.; Mohanty, K. Pyrolysis kinetics and synergistic effect in co-pyrolysis of Samanea saman seeds and polyethylene terephthalate using thermogravimetric analyser. Bioresour. Technol. 2019, 289, 121608. [Google Scholar] [CrossRef]
  59. Das, P.; Tiwari, P. Thermal degradation kinetics of plastics and model selection. Thermochim. Acta 2017, 654, 191–202. [Google Scholar] [CrossRef]
  60. Chatzieleftheriou, S.; Adendorff, M.R.; Lagaros, N.D. Generalized Potential Energy Finite Elements for Modeling Molecular Nanostructures. J. Chem. Inf. Model. 2016, 56, 1963–1978. [Google Scholar] [CrossRef]
  61. Benjamin, I.; Ekpong, B.O.; Abdullah, H.Y.; Agwamba, E.C.; Anyambula, I.A.; Adeyinka Adedapo, S.; Louis, H. Surface modification of transition metals (TM: Mn, Fe, Co) decorated Pt-doped carbon quantum dots (Pt@CQDs) nanostructure as nonenzymatic sensors for nitrotyrosine (a biomarker for Alzheimer): Perspective from density functional theory. Mater. Sci. Semicond. Process. 2024, 174, 108245. [Google Scholar] [CrossRef]
  62. Enyoh, C.E.; Duru, C.E.; Prosper, E.; Wang, Q. Evaluation of Nanoplastics Toxicity to the Human Placenta in Systems. J. Hazard. Mater. 2023, 446, 130600. [Google Scholar] [CrossRef] [PubMed]
  63. Muhida, R.; Rahman, M.M.; Chowdhury, M.S.H.; Setiyanto, H.; Zainuddin, H.; Azmi, B.Z.; Kasai, H. Density Functional Study of Spin Polarization on a Carbon Material with a Hexagonal Structure Induced by Iron Atoms. J. Comput. Theor. Nanosci. 2014, 11, 58–61. [Google Scholar] [CrossRef]
  64. Enyoh, C.E.; Wang, Q.; Senlin, L. Optimizing the Efficient Removal of Ciprofloxacin from Aqueous Solutions by Polyethylene Terephthalate Microplastics using Multivariate Statistical Approach. Chem. Eng. Sci. 2023, 278, 118917. [Google Scholar] [CrossRef]
  65. Wei, K.; Liao, F.; Huang, H.; Shao, M.; Lin, H.; Liu, Y.; Kang, Z. Simple Semiempirical Method for the Location Determination of HOMO and LUMO of Carbon Dots. J. Phys. Chem. C 2021, 125, 7451–7457. [Google Scholar] [CrossRef]
  66. Vercelli, B. The Role of Carbon Quantum Dots in Organic Photovoltaics: A Short Overview. Coatings 2021, 11, 232. [Google Scholar] [CrossRef]
  67. Adkins, E.M.; Miller, J.H. Extinction measurements for optical band gap determination of soot in a series of nitrogen-diluted ethylene/air non-premixed flames. Phys. Chem. Chem. Phys. 2015, 17, 2686–2695. [Google Scholar] [CrossRef]
  68. Silva, T.A.; Stefano, J.S.; Janegitz, B.C. Sensing Materials: Nanomaterials. Encycl. Sens. Biosens. 2023, 2, 212–230. [Google Scholar] [CrossRef]
  69. Spanedda, N.; McLaughlin, P.F.; Beyer, J.J.; Chakraborty, A. Investigation of Ionization Potential in Quantum Dots Using the Stratified Stochastic Enumeration of Molecular Orbitals Method. J. Chem. Theory Comput. 2022, 18, 5920–5935. [Google Scholar] [CrossRef]
  70. Xu, D.; Li, M.; Xu, H.; Yu, J.; Wang, Y.; Zhang, P. N,S-doped carbon quantum dots as a fluorescent probe for palladium(II) ions via Förster resonance energy transfer. Results Chem. 2021, 3, 100179. [Google Scholar] [CrossRef]
  71. Zhang, D.-H.; Yang, L.; Li, N.; Su, K.; Li, L.; Li, C.-Y. Detection of ciprofloxacin and pH by carbon dots and rapid, visual sensing analysis. Food Chem. 2024, 459, 140313. [Google Scholar] [CrossRef]
  72. Joshi, D.J.; Jha, S.; Malek, N.I.; Park, T.J.; Kailasa, S.K. Facile synthesis of Eu3+-doped niobium carbide MXene quantum dots for parallel detection of hypoxanthine and fluoxetine via fluorescence quenching and enhancement mechanisms. Microchim. Acta 2024, 191, 621. [Google Scholar] [CrossRef]
  73. Hua, J.; Jiao, Y.; Wang, M.; Yang, Y. Determination of norfloxacin or ciprofloxacin by carbon dots fluorescence enhancement using magnetic nanoparticles as adsorbent. Microchim. Acta 2018, 185, 137. [Google Scholar] [CrossRef] [PubMed]
  74. Tanwar, A.S.; Parui, R.; Garai, R.; Chanu, M.A.; Iyer, P.K. Dual “Static and Dynamic” Fluorescence Quenching Mechanisms Based Detection of TNT via a Cationic Conjugated Polymer. ACS Meas. Sci. Au 2021, 2, 23–30. [Google Scholar] [CrossRef] [PubMed]
  75. Gehlen, M.H. The Centenary of the Stern-Volmer Equation of Fluorescence Quenching: From the single line plot to the SV quenching map. J. Photochem. Photobiol. C Photochem. Rev. 2019, 42, 100338. [Google Scholar] [CrossRef]
  76. Lakowicz, J.R. Principles of Fluorescence Spectroscopy, 3rd ed.; Springer: New York, NY, USA, 2006. [Google Scholar] [CrossRef]
  77. Dong, Y.; Zhang, Y.D.; Zhi, S.M.; Yang, X.Y.; Yao, C. Green synthesized fluorescent carbon dots from momordica charantia for selective and sensitive detectionof Pd2+ and Fe3+. ChemistrySelect 2021, 6, 123–130. [Google Scholar] [CrossRef]
  78. Laghari, S.; Khuhawar, M.Y. Colorimetric detection of fluoxetine using citrate-capped silver nanoparticles. SN Appl. Sci. 2020, 2, 581. [Google Scholar] [CrossRef]
  79. Liu, B.; Huang, Y.; Shen, Q.; Zhu, X.; Hao, Y.; Qu, P.; Xu, M. Turn-on fluorescence detection of ciprofloxacin in tablets based on lanthanide coordination polymer nanoparticles. RSC Adv. 2016, 6, 100743–100747. [Google Scholar] [CrossRef]
  80. Kawde, A.N.; Aziz, M.A.; Odewunmi, N.; Hassan, N.; AlSharaa, A. Electroanalytical Determination of Antibacterial Ciprofloxacin in Pure Form and in Drug Formulations. Arab. J. Sci. Eng. 2014, 39, 131–138. [Google Scholar] [CrossRef]
  81. Muhammad, M.; Behisht, A.; Faiz, A.; Izaz, A.; Hafeez, U. Mn-dopped ZnS quantum dots as sensitive sensor for determination of ciprofloxacin in pharmaceutical and biological samples. J. Chil. Chem. Soc. 2021, 66, 5130–5135. [Google Scholar] [CrossRef]
  82. Awual, M.R.; Hasan, M.M.; Znad, H. Organic–inorganic based nano-conjugate adsorbent for selective palladium(II) detection, separation and recovery. Chem. Eng. J. 2015, 259, 611–619. [Google Scholar] [CrossRef]
  83. Pawar, S.; Kaja, S.; Nag, A. Red-emitting carbon dots as a dual sensor for In3+ and Pd2+ in water. ACS Omega 2020, 5, 8362–8372. [Google Scholar]
Figure 1. Synthesis of PET-FCQDs from PET plastic waste.
Surfaces 08 00024 g001
Figure 2. Optical and fluorescence analysis of PET-FCQDs: (a) under daylight, (b) darkroom, (c) fluorescence observed under UV illumination, (d) UV-Vis absorbance spectrum, and (e) maximum excitation and emission spectrum. All measurements were performed at room temperature.
Surfaces 08 00024 g002
Figure 3. Representative fluorescence images of the as-synthesized PET-FCQDs (a) and size distribution (b).
Surfaces 08 00024 g003
Figure 4. FTIR-ATR spectra (a), thermogram (b), differential thermal analysis (DTA) (c), and conversion factors (d) of PET-FCQDs from recycled PET plastic waste.
Surfaces 08 00024 g004
Figure 5. PET-FCQDs formation mechanism.
Surfaces 08 00024 g005
Figure 6. Model-fitting characteristics for the thermal breakdown process of the PET-FCQDs showing kinetics for (a) Arrhenius equation, (b) Coats–Redfern (CR) and (c) Prout–Tompkins (Autocatalytic) Model and thermodynamics from CR method (d) changes in enthalpy (∆H°, kJ/mol), (e) Gibbs free energy (∆G°, kJ/mol) and (f) entropy (ΔS°, kJ/mol.K), of thermal treatment of PET-FCQDs.
Surfaces 08 00024 g006
Figure 7. PET-FCQDs optimized geometry (a), ellipsoid surface of the optimized geometry (b), highest occupied molecular orbital (HOMO) surface (c), lowest unoccupied molecular orbital (LUMO) surface (d), and quantum chemical parameters of the synthesized PET-FCQDs (e). Red on the structure means oxygen, gray is carbon, and white means hydrogen. The difference in electron densities is demonstrated by the blue and yellow isosurfaces, which show electron loss in the yellow areas and electron accumulation in the blue areas.
Surfaces 08 00024 g007
Figure 8. (a) Emission spectra of PET-FCQDs following the addition of various metals. (b) Emission spectra of PET-FCQDs after exposure to drugs, including ciprofloxacin (CIP), ibuprofen (IBU), and fluoxetine (FLX). (c) Schematic representation of blue-emissive PET-FCQDs used as a fluorescence probe for detecting Pd2+ via fluorescence quenching and for identifying CIP and FLX through fluorescence enhancement (Inset: photos of the PET-FCQDs solution above taken at 365 nm with UV light after (a) Pd2+ and (b) FLX and CIP had been added [larger images are in Figure S3]).
Surfaces 08 00024 g008
Figure 10. Recovery study of PET-FCQDs for (a) Pd2+, (b) FLX, and (c) CIP in the presence of real water samples (tap and river water).
Surfaces 08 00024 g010
Table 1. A comparison of the proposed sensor with previous references for Pd2+, FLX, and CIP detection.
ProbeMethodLinear RangeLOD Reference
Pd2+
Nano-conjugate adsorbentColorimetric2.10–72.10 mg/L0.14 mg/L[82]
nitrogen-doped red-emitting carbon dots (NRCDs)Fluorescence0–3.51 mg/L6.4 × 10−3 mg/L[83]
Blue-emissive CQDsFluorescence0–34.5 mg/L37 × 10−3 mg/L[77]
Green-light-emitting nitrogen-sulfur-doped carbon quantum dots (N,S-GCDs)Fluorescence0–0.15 mg/L12.7 × 10−3 mg/L[70]
PET-FCQDsFluorescence1–10 mg/L1.26 mg/LPresent study
FLX
citrate-capped silver nanoparticles (CIT-AgNPs)Colorimetry6.47–32.3 µM0.582 µM (180 × 103 ng/L)[78]
Eu3+-doped niobium carbide MXene quantum dots
(Eu3+-Nb2C MQDs)
Fluorescence 125–100 × 103 ng/L4.64 ng/L[72]
PET-FCQDsFluorescence100–400 ng/L134 ng/LPresent study
CIP
Lanthanide coordination polymer nanoparticle (LCPNP)Fluorescence1.0 and 40 μM780 nM (258.453 µg/L)[79]
Mn-doped ZnS quantum dots Fluorescence500–1000 µg/L150 µg/L[81]
MPA-CdS quantum dots Fluorescence130–15,000 µg/L4 µg/L[80]
PET-FCQDsFluorescence50–150 µg/L3.3 µg/LPresent study
Disclaimer/Publisher’s Note: The statements, opinions and data contained in all publications are solely those of the individual author(s) and contributor(s) and not of MDPI and/or the editor(s). MDPI and/or the editor(s) disclaim responsibility for any injury to people or property resulting from any ideas, methods, instructions or products referred to in the content.

