3. Results and Discussion
Figure 1 presents the complexed Pt species at a chloride concentration of 3.14 mA constant Pt concentration of 5.14 mM, a potential range of −3 to 3 V, and a pH window of 0 to 14.
Figure 1 shows the presence of PtO
3(s), PtO
2(s), PtO(s), Pt(cr), and PtCl
6 species. Metallic Pt was obtained from the ionic species PtCl
62− within a pH range of 0–5.8 and at a potential of 715 mV vs. SHE (473 mV vs. SCE). After the reduction potentials of metallic Pt, the evolution of H
+ is evident across the entire pH scale.
The brass surface was coated with homogeneous Pt to protect the base metal from the working electrolytes, as a layer of only Pt black could pose a risk due to its high porosity, potentially affecting the structural stability.
Figure 2 presents the voltammogram obtained on the surface-treated brass surface in a Pt solution in 10% hydrochloric acid (HCl) at a concentration of 1000 ppm, in the cathodic direction at a scan rate of 25 mV s
−1 using a Ti/RuO
2 DSA counter electrode and a calomel reference electrode.
The slope change between −260 and −350 mV vs. SCE (−18 and −108 mV vs. SHE) with current density ranging from −0.00098 to −0.0020 A cm
−2 indicates a reduction due to Pt deposition on the brass substrate. Additionally, hydrogen evolution is evident at more cathodic potentials from −350 to −473 mV vs. SCE (−108 and −231 mV vs. SHE), consistent with the Pourbaix diagram (
Figure 1), indicating that Pt electrodeposition occurs before hydrogen evolution.
The voltammetric study indicated that it is not advisable to exceed a potential of −350 mV vs. SCE (−108 mV vs. SHE) or a current density beyond −0.0020 A cm−2, as these energy conditions would strongly activate hydrogen evolution.
Therefore, −295 mV vs. SCE (−53 mV vs. SHE) was selected to validate the Pt electrodeposition, where a higher current density of −0.0015 A cm
−2 was observed to perform chronoamperometry, allowing for a greater amount of Pt deposition on the brass surface.
Figure 3 presents the chronoamperometric study on the brass surface at a constant potential of −295 mV vs. SCE (−53 mV vs. SHE) in a 10% hydrochloric acid (HCl) solution containing 1000 ppm (parts per million) of Pt, equivalent to a total Pt ion concentration of 5.14 mM and a total Cl ion concentration of 3.14 M for 1 h.
Figure 4 presents SEM images of Pt deposition on the brass surface at magnifications of 2000× and 20,000×, respectively (
Figure 4a,b), after 1 h of electrolysis at −295 mV vs. SCE (−53 mV vs. SHE). The images were obtained using secondary electrons with an acceleration voltage of 15 kV, a spot size of 50, and an aperture size of 2.
Figure 4a shows the heterogeneous morphology with the flat surface interrupted by fractures and areas of Pt electrodeposited. The central region has a higher concentration of brighter particles, which may represent a denser Pt deposition compared to other areas. In
Figure 4b, crystalline structures appear as aggregates with irregular morphology, indicating anisotropic growth phases of Pt on the brass substrate with preferential nucleation and growth at specific sites possibly due to potential variations across the electrode surface. The SEM analysis indicates that the Pt electrodeposition on brass presents a mixed structure, with dense and continuous areas of deposition. Additionally, the observed fractures and agglomerations may be associated with the applied potential conditions that affect the uniformity and quality of the electrodeposition.
Figure 5 presents (a) an image of the brass electrode coated with Pt, along with the chemical mapping. Each image provides spatial distribution information for these elements to evaluate the uniformity and composition of the electrodeposition. Mapping of (b) oxygen (O), (c) copper (Cu), (d) zinc (Zn), and (e) platinum (Pt).
The mapped area in
Figure 5a reveals the morphology of the electrodeposition.
Figure 5b shows the homogeneous distribution of oxygen across the surface, attributed mainly to Cu and Zn oxides. Cu is relatively dispersed, indicating that copper oxide is present across the entire surface (
Figure 5c). Likewise, Zn displays a similar homogeneous distribution, suggesting that brass oxides are present on the surface, indicating incomplete Pt coverage (
Figure 5d). This suggests that Cu and Zn oxides migrate to the surface, a common phenomenon in electrodeposits on alloy substrates. Finally, in
Figure 5e, the Pt electrodeposit is shown to be uniformly distributed across the entire surface, indicating effective Pt deposition over the brass substrate. However, it is also suggested that the electrodeposit is porous, allowing partial visibility of the substrate.
Figure 6 presents the EDS results for the metallic Pt deposit formed at −295 mV vs. SCE (−53 mV vs. SHE) on the brass surface, along with the elemental composition in weight percentage (Wt%) and atomic percentage (At%).
The highest peak corresponds to Pt (79.12% by weight and 47.50% in atomic terms) with the other peaks corresponding to the brass constituent elements, Cu and Zn, with weight percentages of 9.98% and 8.27%, respectively. The presence of Cu and Zn suggests that while the Pt electrodeposit covers most of the surface, areas of the brass substrate remain detectable, implying that the Pt deposit is relatively thin or exhibits certain discontinuities. Additionally, there was an oxygen peak (weight percentage of 2.64%) attributed to Cu and Zn oxidation and migration to the surface.
Figure 7 presents the XRD analysis of the Pt deposit on brass generated at −295 mV vs. SCE (−53 mV vs. SHE) on a brass surface.
Two primary phases are observed: one corresponds to Cu, labeled as β, and the other to Pt, labeled as α. In the β (Cu) phase, intense and well-defined peaks appear at 2θ angles of approximately 43.3°, 50.4°, and 89.9°, indicating the presence of Cu as the main component of the brass substrate, with a crystalline structure that remains visible even after electrodeposition. The high intensity of the β peaks suggests that the Pt deposit is not sufficiently thick to completely cover the brass signal. The α (Pt) phase peaks observed near 39.64°, 46.1°, 67.24°, and 80.97° are less intense compared to the β phase peaks, which is consistent with the EDS analysis and chemical mapping results indicating partial Pt coverage of the substrate. The presence of well-defined α peaks confirms the electrodeposition of metallic Pt on the brass surface.
The crystal size of metallic Pt was calculated from the XRD results using the Scherrer equation
where
κ is the shape factor with a value of 0.89,
λ represents the X-ray wavelength (1.540598 Å),
β is the full width at half maximum of the experimental peak obtained using Origin Pro 2019 64bit software, and
θ is the incidence angle [
17].
Table 1 presents the data obtained for calculating the average crystal size of the metallic Pt electrodeposit on brass.
Table 1 shows that for peaks 1, 2, 3, and 4 corresponding to Pt, the crystal sizes are 8.15, 6.27, 6.70, and 5.53 nm, respectively, resulting in an average crystal size of metallic Pt of 5.52 nm.
The chemical mapping, EDS, SEM, and XRD results suggest that the Pt electrodeposition process on brass was successful. The presence of Zn and Cu oxides indicates a thin Pt electrodeposition which does not prevent Cu and Zn migration from the brass surface into the electrolyte. This migration affects the stability of the Pt surface, so generating a thicker Pt layer with a greater electroactive area would provide better long-term benefits.
Therefore, after applying a potential of −295 mV vs. SCE (−53 mV vs. SHE) to achieve a metallic Pt electrodeposit on brass, the mass transformation of the reduced species is fixed by imposing a current density of −500 A cm
−2 (5.5 times the current density achieved at −295 mV vs. SCE (−53 mV vs. SHE),
Figure 3). This current density of −500 A cm
−2 not only facilitates the electrodeposition of Pt but also induces massive hydrogen evolution, resulting in the formation of disoriented Pt black crystal structures. The reduction of Pt ions is coupled with hydrogen evolution, enabling a greater amount of Pt to deposit on the previously deposited Pt layer on the brass substrate.
Figure 8 presents the SEM image of Pt black deposited on the previously formed metallic Pt layer after 1 h at a current density of −500 mA cm
−2. The images were obtained using secondary electrons at 15 kV, a spot size of 50, and an aperture of 2.
In
Figure 8a, at a magnification of 5000×, a highly porous morphology characterized by a cracked formation is observed, likely due to internal stresses induced during the electrodeposition. These cracks in the Pt electrodeposit can significantly enhance its performance by allowing greater electrolyte access to the catalyst surface.
Figure 8b shows globular aggregates formed by nanoparticles distributed and organized within the range of 40–50 nm. This globular structure is required to maximize the catalyst’s specific surface area, as it provides a greater number of active sites available for electrochemical reactions, making it ideal for applications such as fuel cells, hydrogen generation, and oxygen evolution. Finally,
Figure 8c shows the cross-section of the Pt black electrodeposit, revealing a coating with an approximate thickness of 72.2 µm, which suggests a significant growth of the coating on the brass surface.
Figure 9 presents (a) the image of the brass electrode coated with platinum black, along with the chemical mapping of (b) oxygen (O) and (c) platinum (Pt). Each image provides information on the spatial distribution of these elements to evaluate the uniformity and composition of the electrodeposit.
In
Figure 9a, the details of the morphology of the Pt black electrodeposit can be observed. In
Figure 9b, the presence of oxygen is shown to be homogeneously distributed across the surface, attributed to oxygen trapped in the porosities of the Pt black. Finally,
Figure 9c corresponds to the Pt black electrodeposit, which is continuously distributed across the entire surface, indicating successful deposition of Pt black on the metallic Pt previously deposited on the brass substrate. It is also suggested that this electrodeposit has a greater thickness compared to the initial metallic Pt electrodeposit, as the Cu and Zn from the brass substrate are no longer visible.
Figure 10 presents the EDS analysis of the Pt black deposit at −500 mA cm
−2 on the metallic Pt deposited on brass, providing elemental composition in terms of weight percentage (Weight%) and atomic percentage (Atomic%).
The highest peak corresponds to Pt, confirming its presence in the electrodeposit with a weight percentage of 86.24% and an atomic percentage of 33.95%. The other peak corresponds to oxygen (O), with a weight percentage of 13.76% and an atomic percentage of 66.05%, attributed to oxygen trapped within the Pt black pores. The absence of Zn and Cu signals indicates that the Pt black deposit is sufficiently dense to prevent their detection.
Figure 11 presents the X-ray diffraction (XRD) analysis of platinum black deposited on the metallic Pt layer at −500 mA cm
−2 on a brass surface.
In
Figure 11, two main phases are observed: one corresponds to Cu, labeled as β, and the other to Pt, labeled as α. In the β (Cu) phase, defined peaks are observed at 2θ angles of approximately 72° and 88°, indicating the presence of Cu as a main component of the brass substrate. On the other hand, the α (Pt) phase peaks are located at approximately 40.28°, 46.85°, 68.43°, and 82.50°. These peaks are more intense compared to those of the metallic Pt deposit (
Figure 7). This behavior in the intensity of the β peaks is attributed to the formation of a thicker Pt electrodeposit, which also explains the reduction in the Cu signals.
Moreover, the diffractogram reveals an amorphous behavior in the signal, attributed to the presence of nanostructures observed in the scanning electron microscopy (SEM) images. This is due to an increase in the width and height of each characteristic Pt peak, indicating an enhanced surface area.
Table 2 provides the data used to calculate the average crystal size of platinum black using the Scherrer equation. The crystal sizes for peaks 1, 2, 3, and 4 are 4.31 nm, 4.25 nm, 3.25 nm, and 3.07 nm, respectively, resulting in an average crystal size of 3.72 nm for platinum black.
The particle sizes of metallic Pt and Pt black under the applied potential conditions (−295 mV vs. SCE (−53 mV vs. SHE) and current density (−500 mA cm−2) are both within the nanometric range, conferring enhanced catalytic properties due to an increased surface area compared to macroscopic-scale deposits.
The comparison of particle sizes shows that the Pt black particles are smaller (3.72 nm) than metallic Pt (5.52 nm), indicating that Pt black provides more active sites for catalytic electrochemical processes.
Figure 12 compares a brass surface without a Pt black deposit (
Figure 12a) to the same surface after chronopotentiometry at a current density of −500 mA cm
−2 for 1 h (
Figure 12b).
In
Figure 12a, only the brass surface without the Pt black deposit is visible, whereas in
Figure 12b, the Pt black deposit can be observed with a consistent thickness uniformly covering the entire surface. The dark color of the electrodeposit is attributed to the highly porous morphology of Pt black and the light scattering caused by disordered nanocrystals, which reduces reflectivity and gives it its characteristic black appearance.
An important aspect to highlight is the strong adhesion of the electrodeposit, as no visible signs of delamination or detachment are observed. Additionally, the dark appearance of the deposit may be related to the misorientation of the Pt crystals.
It is worth mentioning that Pt black is generated in situ, which provides an advantage over other synthesis methods where Pt black is obtained as a powder and requires additional processing steps for use in electrochemical applications. Furthermore, this in situ process enables the modification of surfaces with complex geometries, making it suitable for specific electrochemical applications [
13].
Figure 13 shows a comparison of the catalysis process in 30% hydrogen peroxide among metallic Pt, a RuO
2 DSA, and Pt black.
In
Figure 13, the decomposition reaction of 30% hydrogen peroxide on the three surfaces is observed. As seen, metallic Pt exhibits good catalytic activity but is not sufficient to raise the temperature beyond 25 °C. Similarly, the RuO
2 DSA, despite having higher catalytic activity than metallic Pt, reaches a maximum temperature of 25 °C. However, with Pt black, as soon as it comes into contact with hydrogen peroxide, a greater spontaneous catalytic process occurs, and over time, a maximum temperature of 72 °C is reached; this validates that Pt black has a much higher surface area for catalytic processes.
4. Conclusions
The thermodynamic results indicate that Pt electrodeposition can be achieved from the ionic species PtCl62− within a potential range of 715 to 16.5 mV vs. SHE (473 to −224.5 mV vs. SCE) and a pH range of 0 to 5.8, prior to hydrogen evolution.
The voltammetric studies determined the optimal voltage (−260 to −350 mV vs. SCE (−18 and −108 mV vs. SHE)) and current density (−0.00098 to −0.0020 A cm−2) conditions for metallic Pt electrodeposition on brass surfaces.
The chronoamperometric study validated the deposition of metallic Pt at −295 mV vs. SCE (−53 mV vs. SHE), achieving a stable current density of −0.090 A cm−2. SEM, chemical mapping, EDS, and XRD analyses confirmed the presence of metallic Pt on the brass surface but also indicated that the Pt deposit is very thin, as oxidized Cu and Zn species from the brass were detected.
The chronopotentiometric study, performed at a current density of −500 mA cm−2, validated the successful formation of platinum black on brass. An SEM analysis confirmed the appearance of globular nanostructures characteristic of platinum black. The broadening and increased intensity of XRD peaks for platinum black indicate a thicker deposit and the significant reduction of Cu and Zn signals, which were no longer detected in EDS and chemical mapping analyses.
The crystal size calculation using the Scherrer equation confirmed nanometric-scale deposits, with an average size of 5.52 nm for metallic Pt and 3.72 nm for platinum black. This indicates that platinum black has a larger electroactive area.
A quick test in hydrogen peroxide demonstrates that the Pt black developed on the brass surface in this work has a higher surface area for catalytic processes.
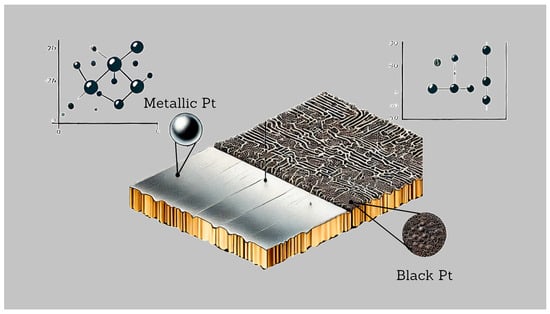
The results of this study demonstrate that a platinum black electrodeposit on brass can be obtained using a 10% HCl solution containing 1000 ppm Pt, following these steps: (i) mechanical and electrochemical polishing of the brass substrate, (ii) electrodeposition of metallic Pt at a constant potential of −295 mV vs. SCE (−53 mV vs. SHE) for 1 h, and (iii) formation of platinum black by applying a current density of −500 mA cm−2 for 1 h.
This study presents a novel approach for the in situ electrodeposition of platinum black directly onto a brass substrate (60% Cu, 40% Zn), offering a cost-effective alternative to conventional Pt-supported carbon catalysts. Unlike commercially available platinum black on Vulcan carbon, which requires additional fabrication steps and support materials, our method enables the direct modification of electrode surfaces while minimizing Pt usage. This approach eliminates the need for additional binders or epoxy resins and provides a stable interface without the risk of unwanted side reactions associated with carbon-based substrates.


 ,
, 


