Miscible CO2 Flooding for EOR in the Presence of Natural Gas Components in Displacing and Displaced Fluids
Abstract
:1. Introduction
2. Materials and Methods
2.1. Experimental Procedure
2.2. Sampling
3. Results and Discussions
3.1. Effect of Temperature on Oil Recovery at a Constant Pressure of 200 Bar
3.2. Effect of Added Light Components to CO2 as a Displacing Fluid on Oil Recovery
3.3. Comparison of the Experimental Compositional Analysis and the Simulation
3.4. Dynamic Composition Change in Experiments and Simulations during Flooding
3.5. Effect of Light Components (C1&C3) in the Displacing Fluid of CO2 on the Recovery of Model and Crude Oils
3.5.1. Model Oil (n-C10) Flooded with CO2/C1/C3
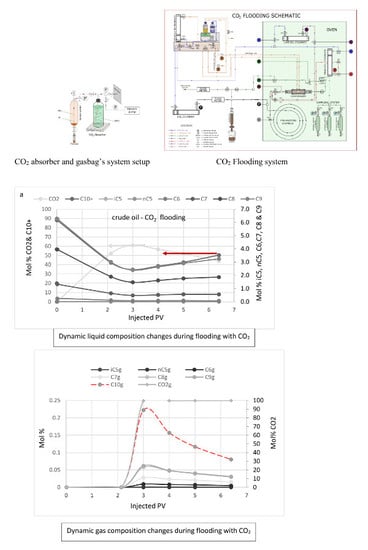
3.5.2. Crude Oil Flooded with CO2
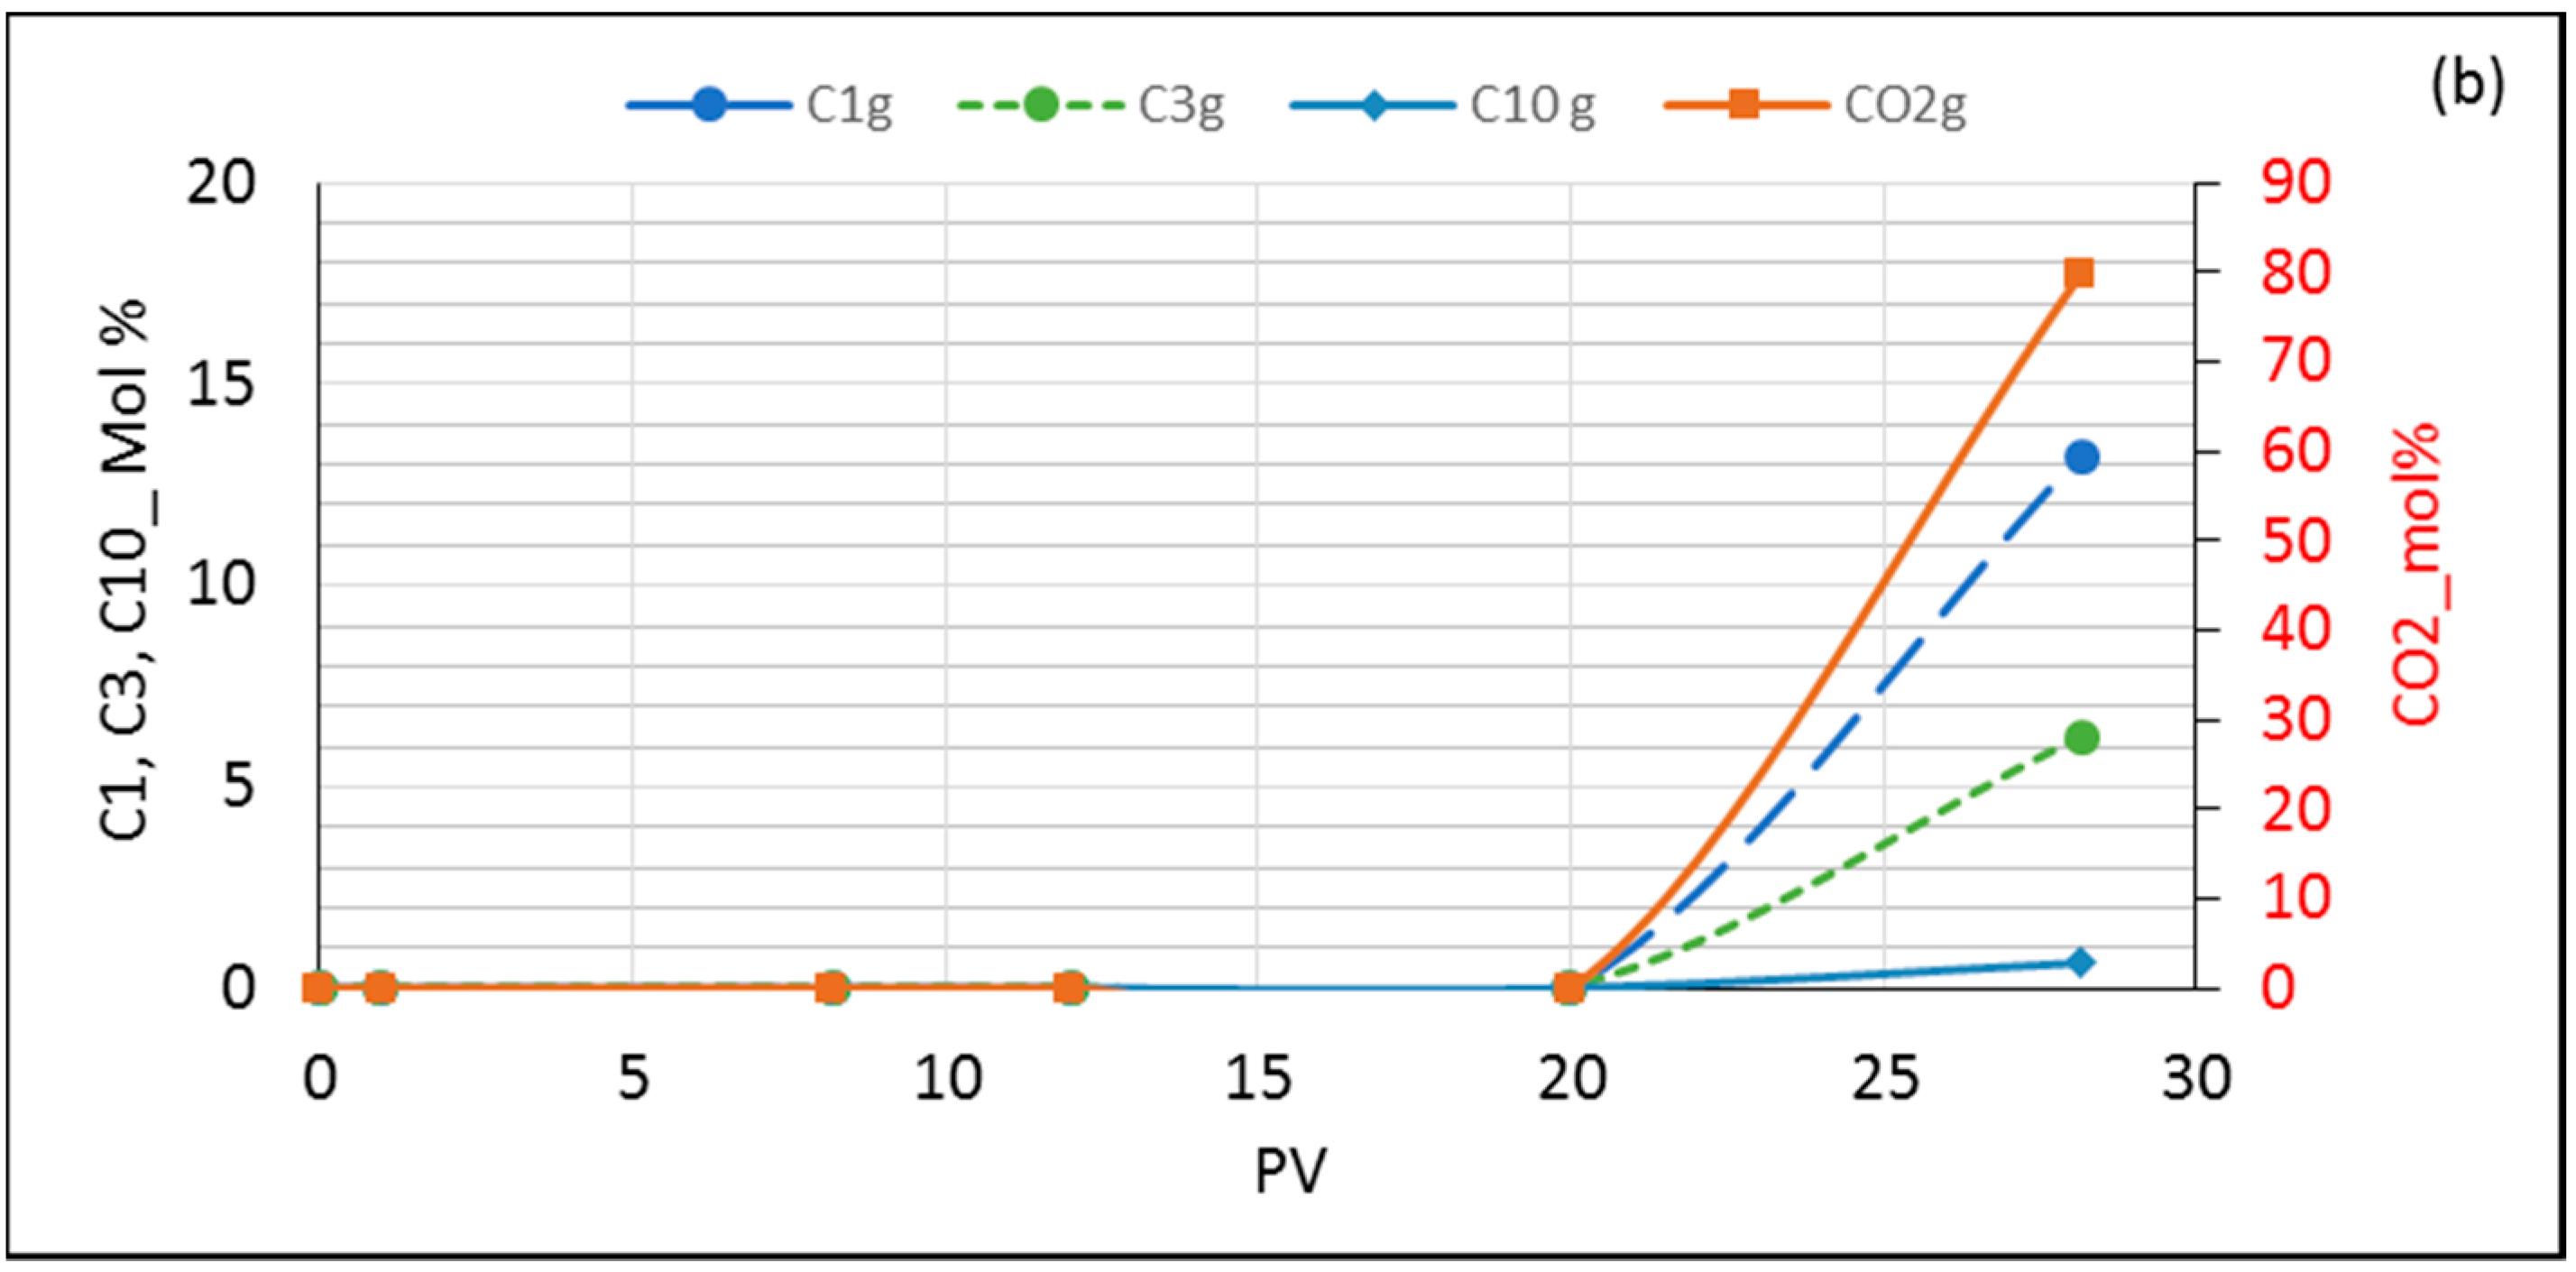
3.5.3. Crude Oil Flooded with CO2/C1/C3
3.5.4. Displacement Mechanisms and the Effect of the Light Components on Recovery
3.5.5. Water Produced from Flooded Dry Sandstone Cores
4. Summary and Conclusions
- In general, as the temperature increases with miscible CO2 flooding at a constant pressure of 200 bar, oil recovery increases. The highest recovery was obtained with model oil (n-C10). The presence of light components in the model oil phase reduced the recovery. Lower recovery was observed in the presence of C1 and C3 (live oil B) compared to only C1 (live oil A). This may be explained by more CO2 diffusing into the oil in the case of live oil A since methane is readily transferred into the vapor phase due to its limited solubility and exchanged with the higher soluble CO2. In turn, the more CO2 available, the larger the increase of the hydrocarbon swelling—that is, more oil recovery compared to oil containing C1/C3 where C3 is more soluble in C10 than in C1; hence less CO2 mass transfer.
- An opposite case was investigated where the light components (C1/C3) were combined with CO2 as displacing fluid (CO2/C1/C3). Comparisons were made of crude oil flooded with the two displacing fluids (CO2 and CO2/C1/C3) and model oil (n-C10) displaced with CO2/C1/C3. In general, recovery from the model oil was higher than from the crude oil, which may be due to the differences between their mobility. There was almost no difference in the recovery of model oil (≈82%) with the two displacing fluids. However, in the case of crude oil, the recoveries were 65 and 76% for the displacing fluids of CO2 and CO2/C1/C3, respectively. As the injected fluid contacts the oil, different processes, such as solubility, dispersion, and condensation/extraction, take place. Transverse dispersion of CO2 helps in eliminating/reducing the effect of viscous instabilities by shortening fingering travel/widening the fingers, as discussed earlier. A sharp decline in viscosity was also shown during the flooding of the crude oil with CO2 compared to a lesser declining slope in the case of CO2/C1/C3. The sharp decline in viscosity may cause the early formation of fingers and promote their growth and hence the lower recovery. In addition, the ultimate recovery with CO2 was reached earlier than that with CO2/C1/C3. Injected light components with CO2 showed a relatively slower rate to reach minimum system viscosity compared to that for CO2 flooding, which may promote transverse dispersion of the displacing fluid and hence less traveling of fingers. A longer flooding time may also promote the lateral growth of fingers.
- An additional interesting observation was the water production in the obtained samples from the flooded dry sandstone cores. This may be explained by the ability of CO2 to penetrate regions containing the inaccessible hydroxyl groups, in addition to the ability of the supercritical CO2 to remove the adsorbed water layer on silica.
Acknowledgments
Author Contributions
Conflicts of Interest
References
- Beeson, D.; Ortloff, G. Laboratory investigation of the water-driven carbon dioxide process for oil recovery. J. Pet. Technol. 1959, 11, 63–66. [Google Scholar] [CrossRef]
- Holm, L.W.; Josendal, V.A. Effect of oil composition on miscible-type displacement by carbon dioxide. Soc. Pet. Eng. J. 1982, 22, 87–98. [Google Scholar] [CrossRef]
- Holm, W.L. Evolution of the carbon dioxide flooding processes. J. Pet. Technol. 1987, 39, 1337–1342. [Google Scholar] [CrossRef]
- Ferguson, R.C.; Nichols, C.; Van Leeuwen, T.; Kuuskraa, V.A. Storing CO2 with enhanced oil recovery. Energy Procedia 2009, 1, 1989–1996. [Google Scholar] [CrossRef]
- Hamouda, A.A.; Pranoto, A. Synergy between low salinity water flooding and CO2 for eor in chalk reservoirs. In Proceedings of the SPE EOR Conference at Oil and Gas West Asia, Muscat, Oman, 20–23 March 2016. [Google Scholar]
- Hamouda, A.A.; Pranoto, A. Innovative approach for maximizing CO2 storage and enhancing oil recovery by co-optimization and late operation stage optimization. Int. J. Res. Comput. Commun. Eng. 2016, 4, 1111–1122. [Google Scholar]
- Fai-Yengo, V.A.; Rahnema, H.; Alfi, M. Impact of light component stripping during CO2 injection in bakken formation. In Proceedings of the Unconventional Resources Technology Conference (URTEC), Denver, CO, USA, 25–27 August 2014. [Google Scholar]
- Jin, L. Impact of CO2 impurity on mmp and oil recovery performance of the bell creek oil field. In Proceedings of the 13th International Conference on Greenhouse Gas Control Technologies, GHGT-13, Lausanne, Switzerland, 14–18 November 2016. [Google Scholar]
- Hamouda, A.; Tabrizy, V.A. The effect of light gas on miscible CO2 flooding to enhance oil recovery from sandstone and chalk reservoirs. J. Pet. Sci. Eng. 2013, 108, 259–266. [Google Scholar] [CrossRef]
- Moortgat, J.B.; Firoozabadi, A.; Li, Z.; Espósito, R.O. CO2 injection in vertical and horizontal cores: Measurements and numerical simulation. SPE J. 2013, 18, 331–344. [Google Scholar] [CrossRef]
- Bagalkot, N.; Hamouda, A.A. Experimental and numerical method for estimating diffusion coefficient of the carbon dioxide into light components. Ind. Eng. Chem. Res. 2017, 56, 2359–2374. [Google Scholar] [CrossRef]
- Yang, Z.; Li, M.; Peng, B.; Lin, M.; Dong, Z. Volume expansion of CO2 + oil at near critical and supercritical conditions of CO2. Fuel 2013, 112, 283–288. [Google Scholar] [CrossRef]
- Jennings, D.W.; Schucker, R.C. Comparison of high-pressure vapor- liquid equilibria of mixtures of CO2 or propane with nonane and C9 alkylbenzenes. J. Chem. Eng. Data 1996, 41, 831–838. [Google Scholar] [CrossRef]
- Gardner, J.; Ypma, J. An investigation of phase behavior-macroscopic bypassing interaction in CO2 flooding. Soc. Pet. Eng. J. 1984, 24, 508–520. [Google Scholar] [CrossRef]
- McCool, B.; Tripp, C.P. Inaccessible hydroxyl groups on silica are accessible in supercritical CO2. J. Phys. Chem. B 2005, 109, 8914–8919. [Google Scholar] [CrossRef] [PubMed]
- Kim, Y.; Wan, J.; Kneafsey, T.J.; Tokunaga, T.K. Dewetting of silica surfaces upon reactions with supercritical CO2 and brine: Pore-scale studies in micromodels. Environ. Sci. Technol. 2012, 46, 4228–4235. [Google Scholar] [CrossRef] [PubMed]


| Exp. No. | Core Type | Porosity (%) | Length (cm) | Saturating Fluid | Displacing Fluid | Flooding Temp. (°C) |
|---|---|---|---|---|---|---|
| 1 | Bentheimer | 21.70 | 5.07 | Live-oil A | CO2 | 50 |
| 2 | Bentheimer | 21.25 | 9.00 | Live-oil A | CO2 | 70 |
| 3 | Berea | 19.30 | 8.96 | Live-oil A | CO2 | 90 |
| 4 | Bentheimer | 23.24 | 9.00 | Live-oil B | CO2 | 50 |
| 5 | Bentheimer | 23.30 | 9.00 | Live-oil B | CO2 | 70 |
| 6 | Berea | 19.60 | 9.09 | Live-oil B | CO2 | 90 |
| 7 | Bentheimer | 20.20 | 8.90 | Dead-oil | CO2 | 50 |
| 8 | Bentheimer | 21.05 | 9.00 | Dead-oil | CO2 | 70 |
| 9 | Bentheimer | 21.97 | 8.90 | Dead-oil | CO2 | 90 |
| 10 | Berea | 21.68 | 9.00 | Model oil (Crude) | CO2 + C1 + C3 | 70 |
| 11 | Berea | 21.88 | 9.00 | Crude-oil | CO2 + C1 + C3 | 70 |
| 12 | Berea | 21.22 | 9.00 | Crude-oil | CO2 | 70 |
| Oil Type | C1 (Mole %) | C3 (Mole %) | n-decane (Mole %) |
|---|---|---|---|
| Live Oil A | 20.14 | - | 79.86 |
| Live Oil B | 9.86 | 11.9 | 78.23 |
| Dead oil | - | - | 100 |
| Component | Mole (%) |
|---|---|
| i-C5 | 0.0018 |
| n-C5 | 0.0117 |
| C6 | 0.0024 |
| C7 | 1.390 |
| C8 | 3.961 |
| C9 | 6.287 |
| C10+ | 88.171 |
| (a) | ||||||||||
| Components | Exp. 1 | Sim. 1 | Exp. 2 | Sim. 2 | Exp. 3 | Sim. 3 | % Diff. 1 | % Diff. 2 | % Diff. 3 | % Avg/Comp. |
| CO2 | 0.1 | 0.198 | 3.7 | 3.93 | 49.3 | 53.47 | 49.5 | 5.9 | 7.9 | 21 |
| C1 | 0.012 | 0.012 | 0.59 | 0.481 | 20.24 | 5.53 | 0 | −22.7 | 72.7 | 32 |
| C3 | 0.02 | 0.015 | 0.573 | 0.58 | 7.8 | 10.3 | −33 | 1.7 | 24.27 | 20 |
| nC10 | 99.8 | 99.8 | 95.1 | 95.0 | 22.7 | 30.7 | 0 | −0.11 | 26.1 | 9 |
| (b) | ||||||||||
| Components | Exp. 1 | Sim. 1 | Exp. 2 | Sim. 2 | Exp. 3 | Sim. 3 | % Diff. 1 | % Diff. 2 | % Diff. 3 | % Avg/Comp. |
| CO2 | 10.48 | 99.0 | 52.64 | 52.61 | 97.1 | 50.2 | 89.4 | −0.03 | −46.9 | 45 |
| C1 | 8.84 | 8.8 | 4.67 | 4.67 | 0.29 | 0.08 | −0.45 | 0 | >−200 | 67 |
| C3 | 10.65 | 10.6 | 5.64 | 5.64 | 0.35 | 0.56 | −0.05 | 0 | 37.5 | 12.6 |
| n-C10 | 70.03 | 69.9 | 37.05 | 37.08 | 2.27 | 49.15 | −0.13 | 0.081 | 95.4 | 31 |
© 2018 by the authors. Licensee MDPI, Basel, Switzerland. This article is an open access article distributed under the terms and conditions of the Creative Commons Attribution (CC BY) license (http://creativecommons.org/licenses/by/4.0/).
Share and Cite
Hamouda, A.A.; Chughtai, S. Miscible CO2 Flooding for EOR in the Presence of Natural Gas Components in Displacing and Displaced Fluids. Energies 2018, 11, 391. https://doi.org/10.3390/en11020391
Hamouda AA, Chughtai S. Miscible CO2 Flooding for EOR in the Presence of Natural Gas Components in Displacing and Displaced Fluids. Energies. 2018; 11(2):391. https://doi.org/10.3390/en11020391
Chicago/Turabian StyleHamouda, Aly A, and Sidra Chughtai. 2018. "Miscible CO2 Flooding for EOR in the Presence of Natural Gas Components in Displacing and Displaced Fluids" Energies 11, no. 2: 391. https://doi.org/10.3390/en11020391
APA StyleHamouda, A. A., & Chughtai, S. (2018). Miscible CO2 Flooding for EOR in the Presence of Natural Gas Components in Displacing and Displaced Fluids. Energies, 11(2), 391. https://doi.org/10.3390/en11020391


