3.1. Visual Inspection, Microstructural and Chemical Analysis
The carbon-steel samples had turned from shiny metal to black in appearance after the corrosion test as seen in
Figure 3, but the titanium alloy samples showed only small discolourization after the testing.
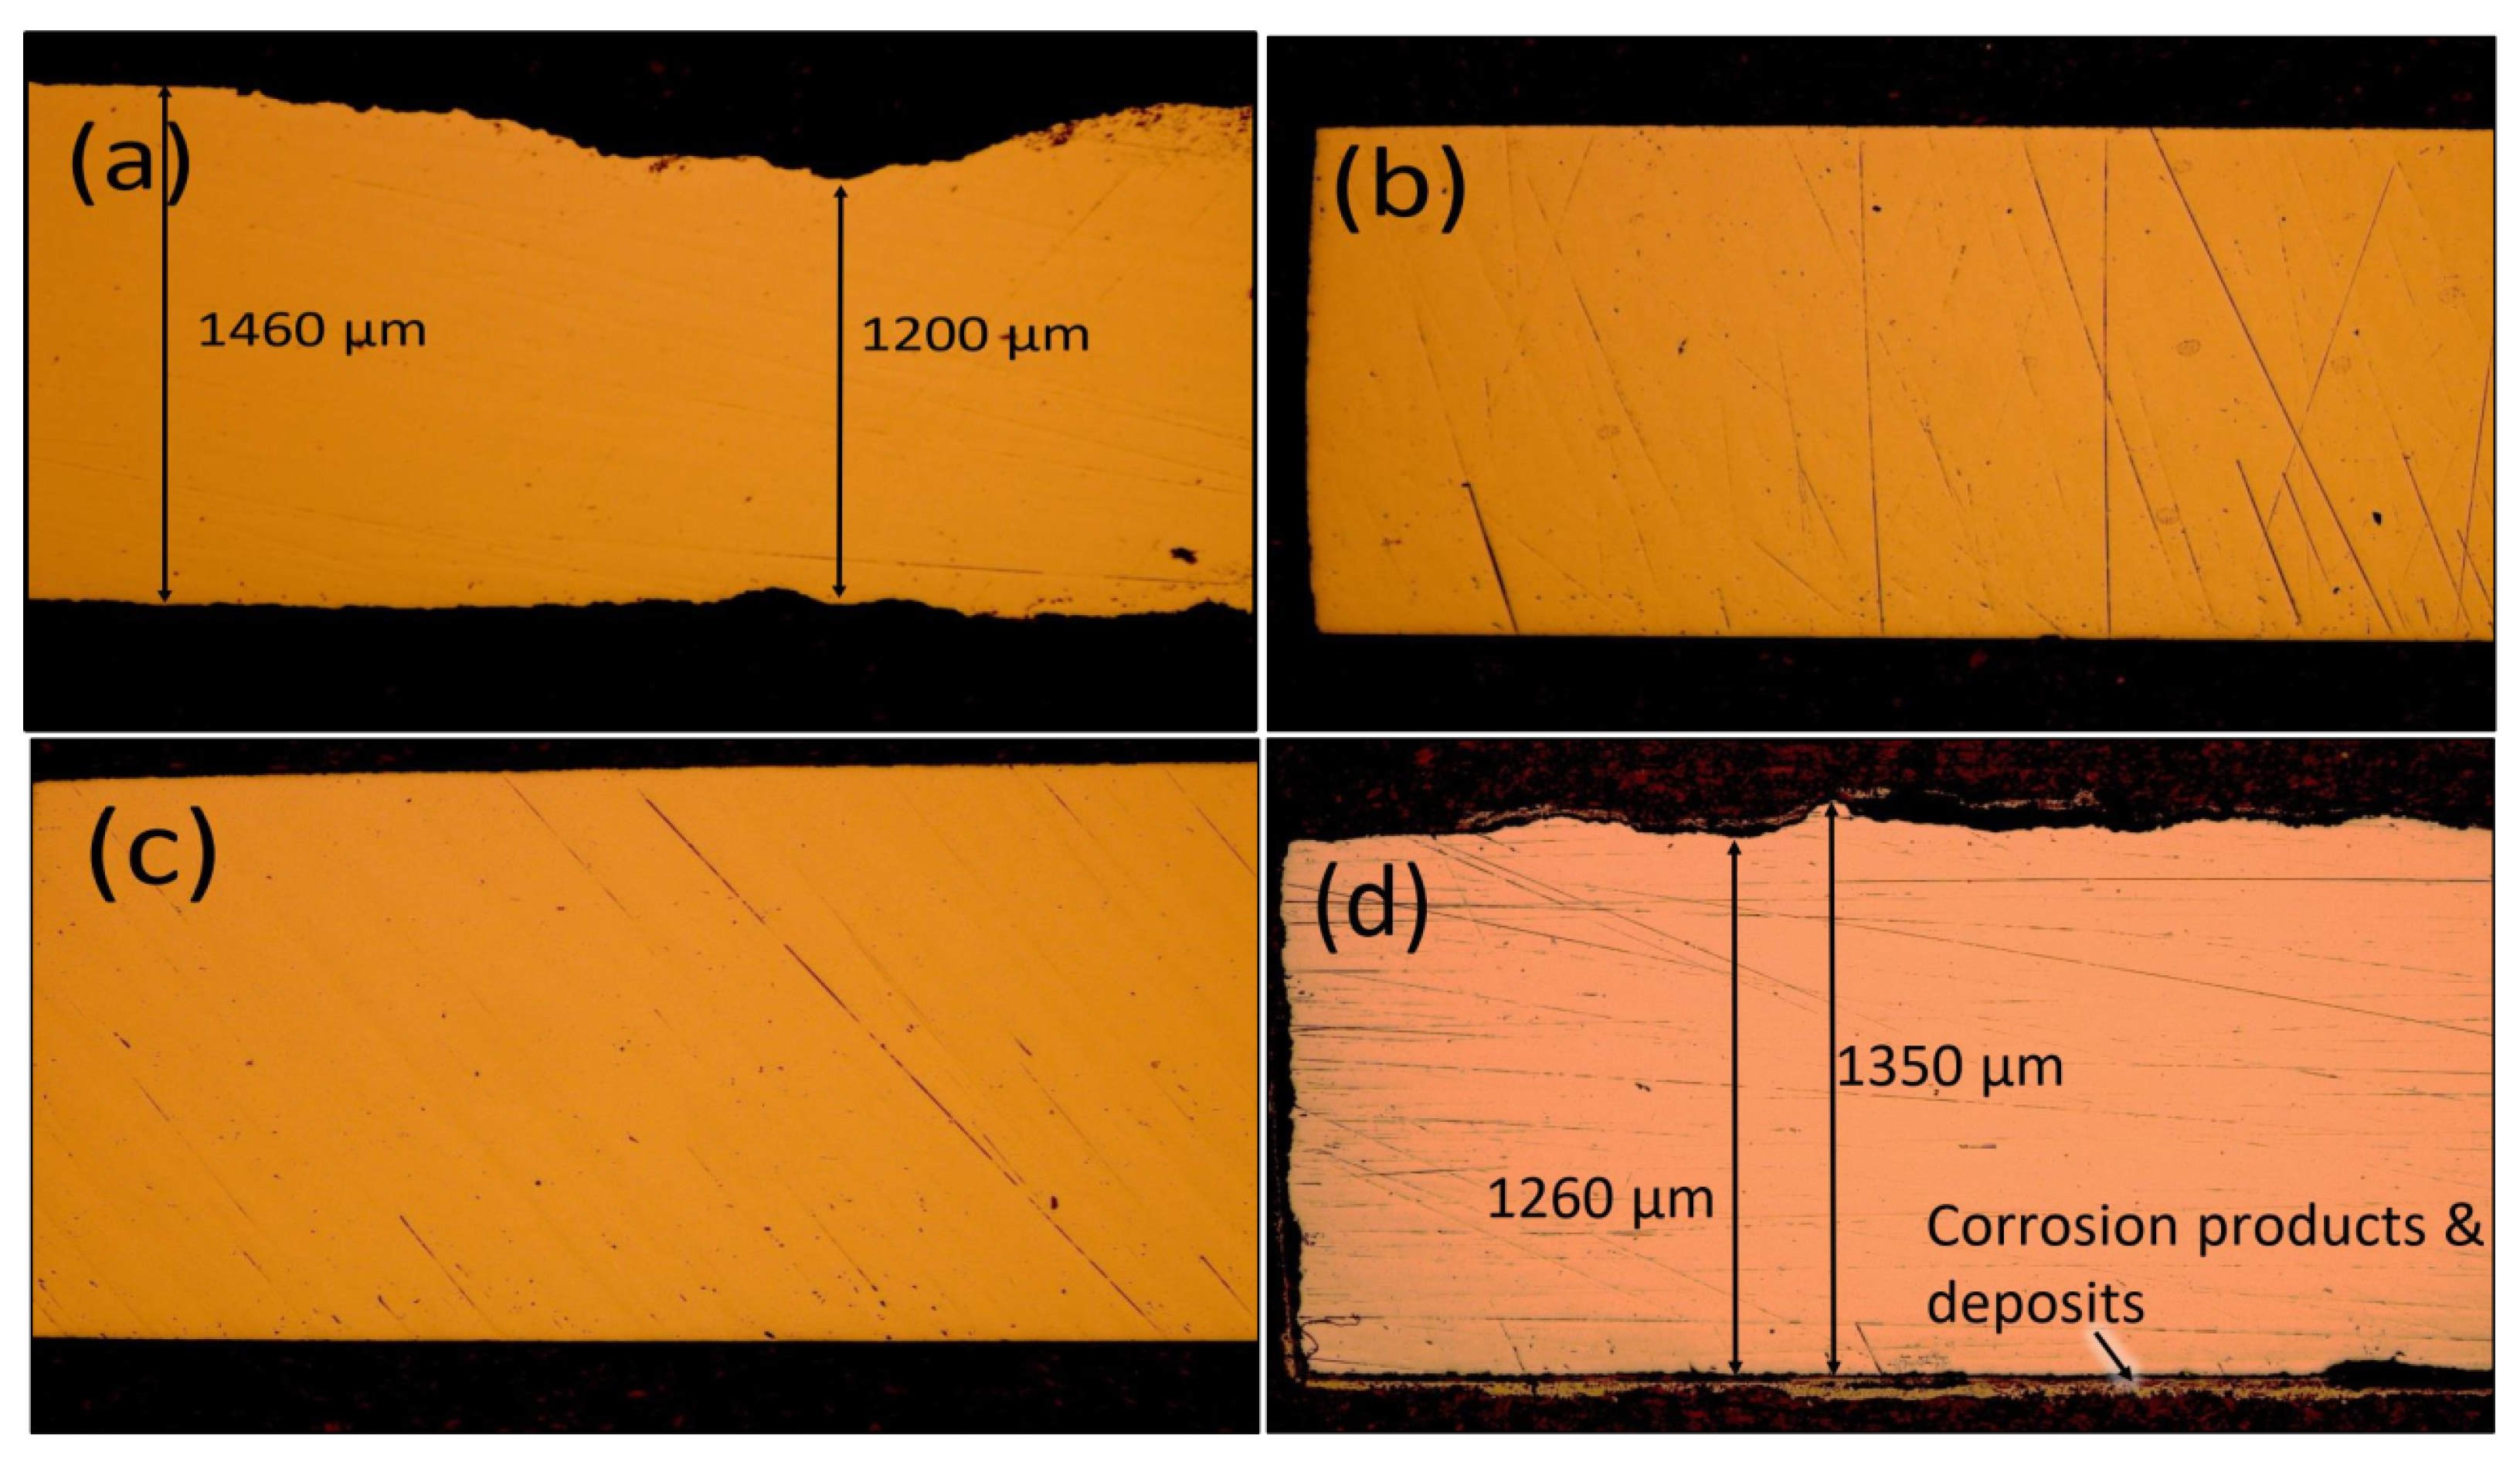
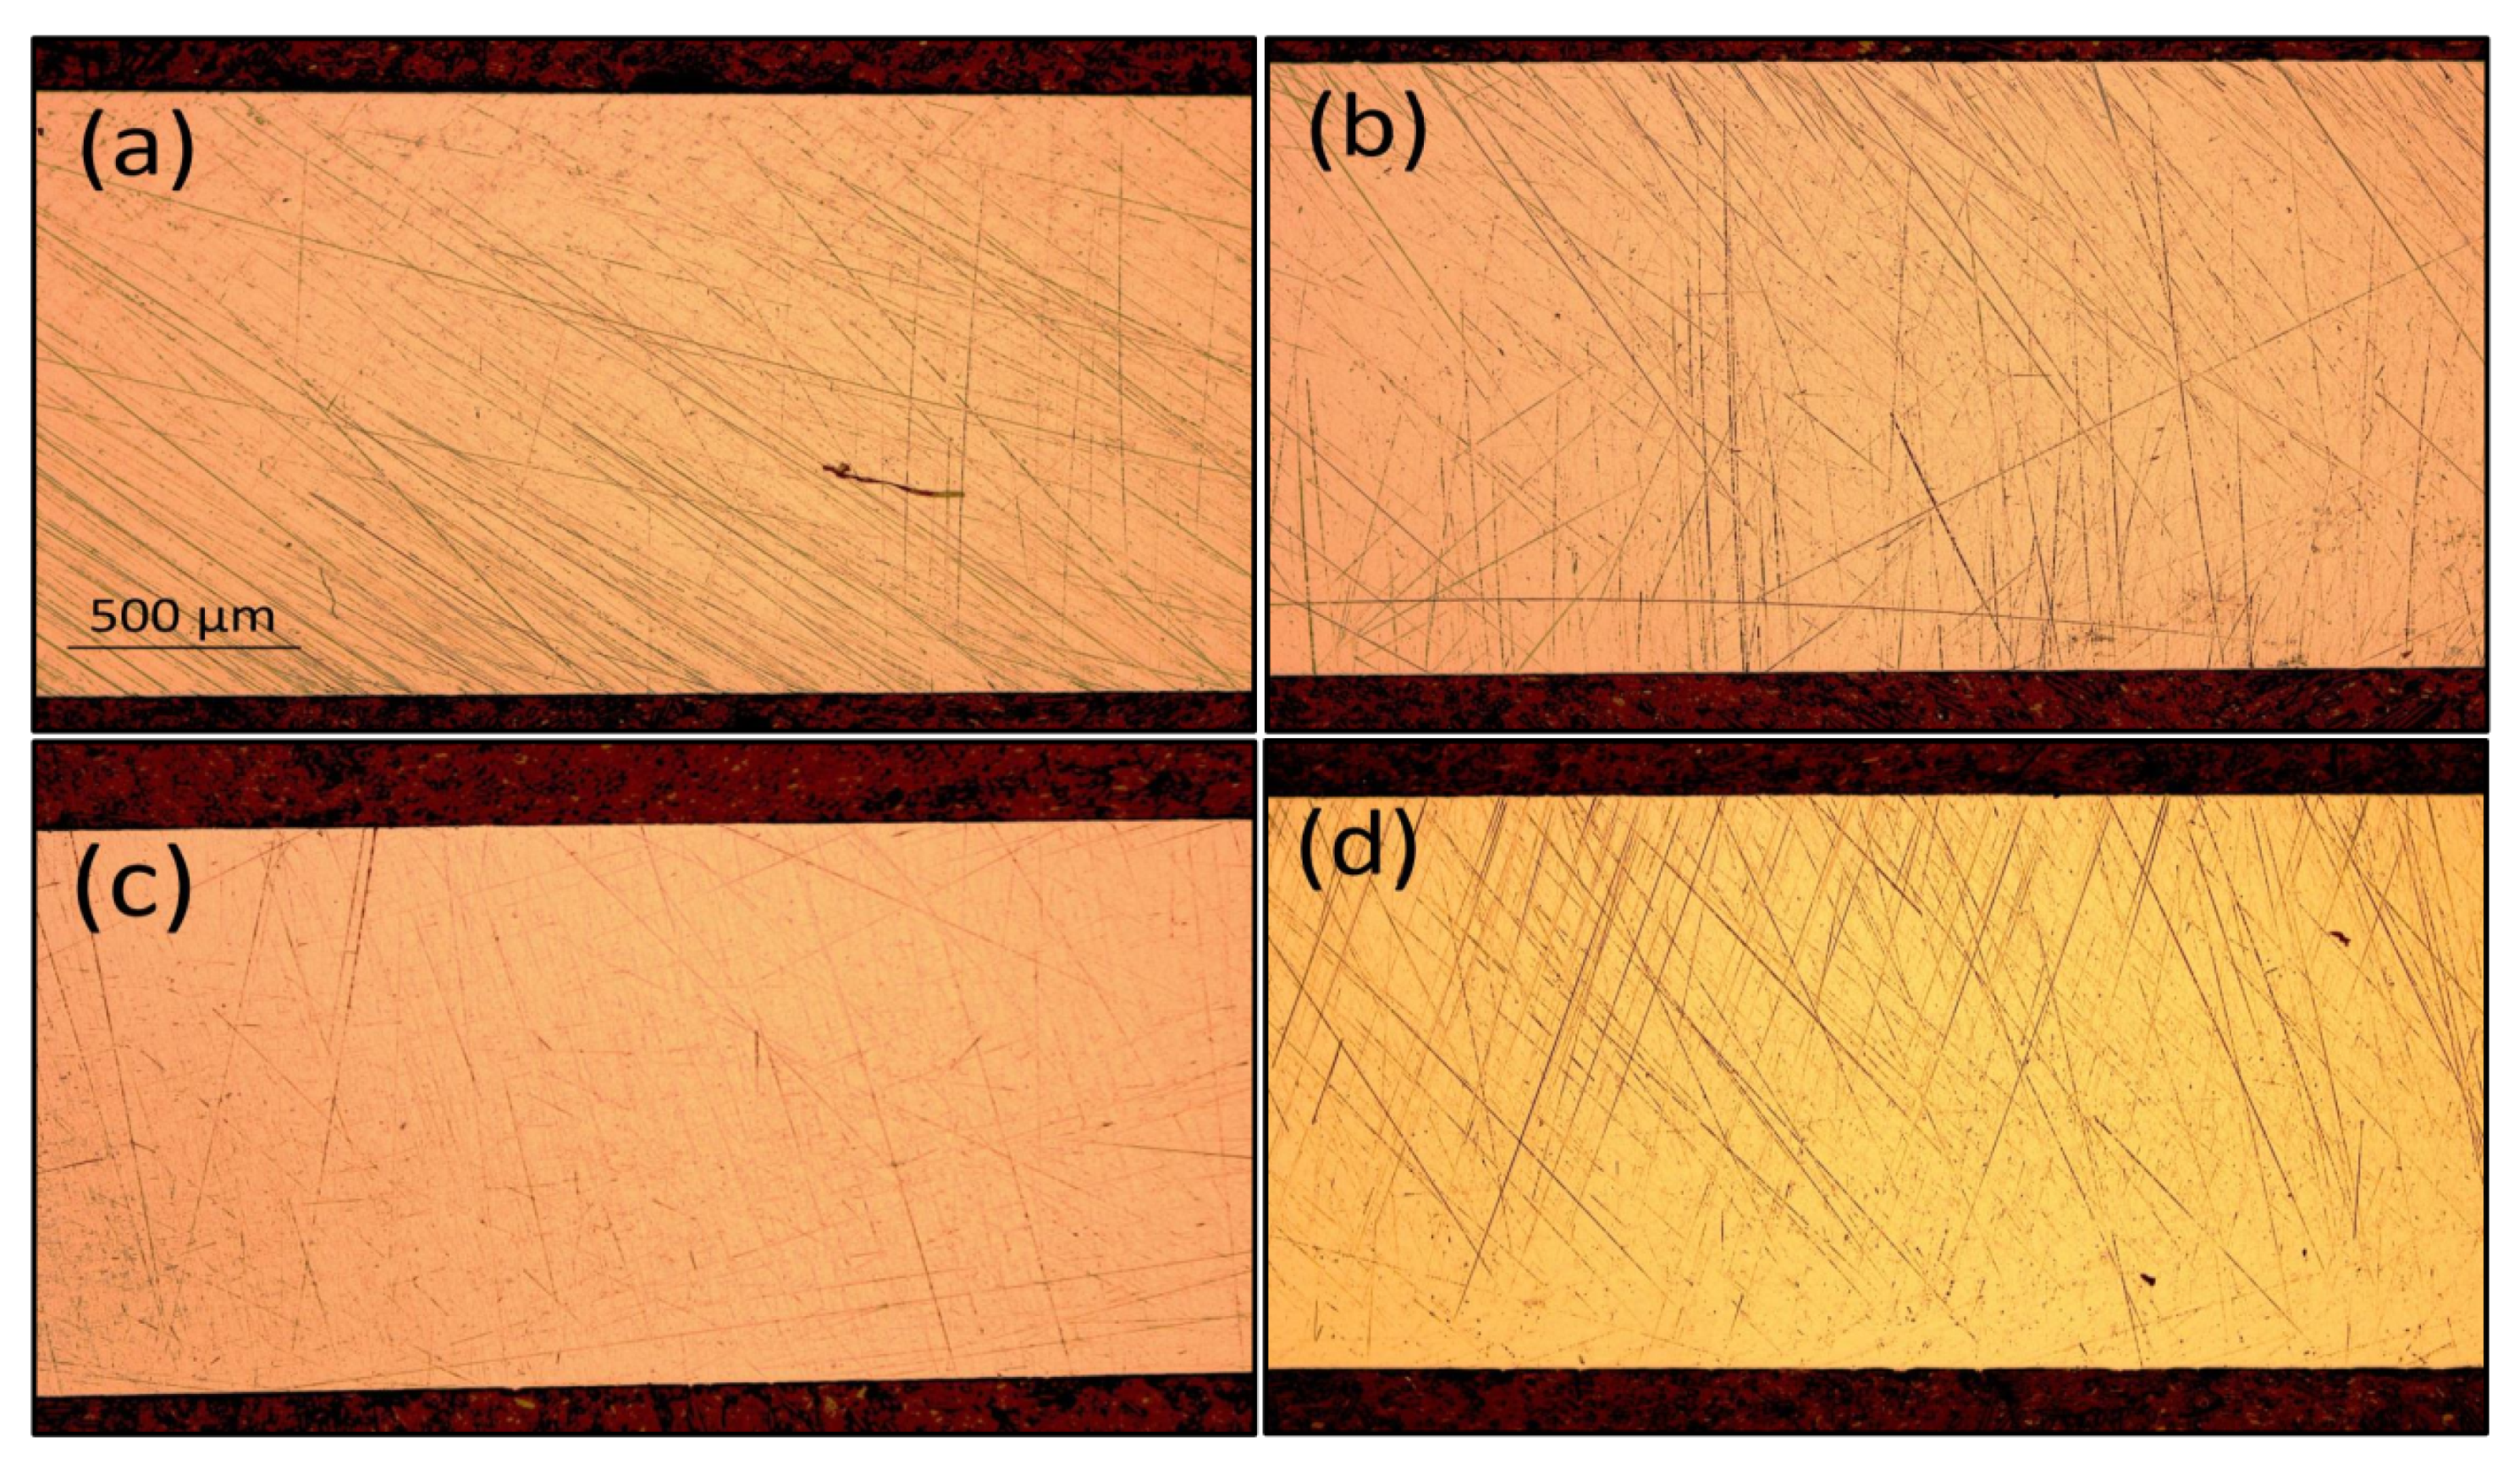
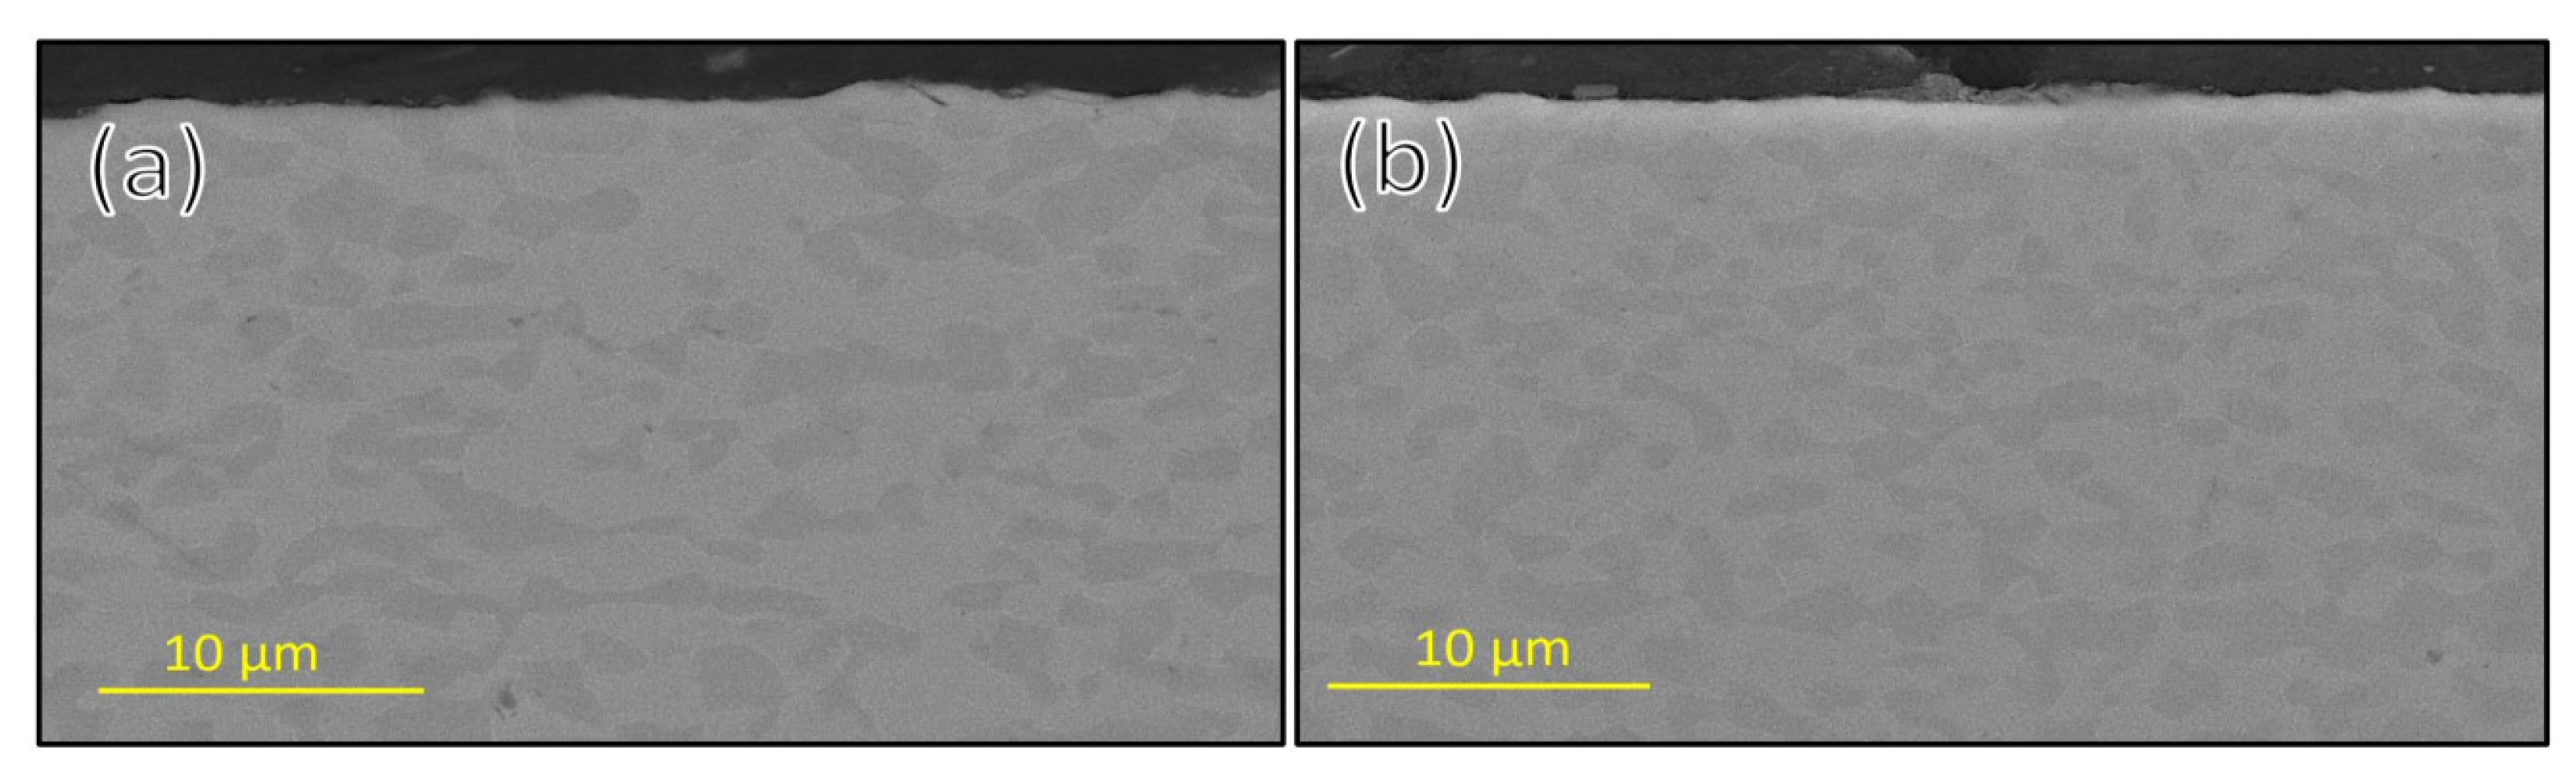
Further visual inspection of the carbon-steel samples after the corrosion testing indicated that some corrosion had occurred on sample 1 at the inlet of the first reactor and sample 9 at the outlet of the third reactor. This observation was evident from the bulk mass removal effect and pitting on the surface; a lower corrosion effect was observed on the samples between these two samples. This observation was strengthened under an optical microscope where the thickness reduction was apparent in a cross-sectional view of the first and last sample in comparison with other samples tested as can be seen in
Figure 4.
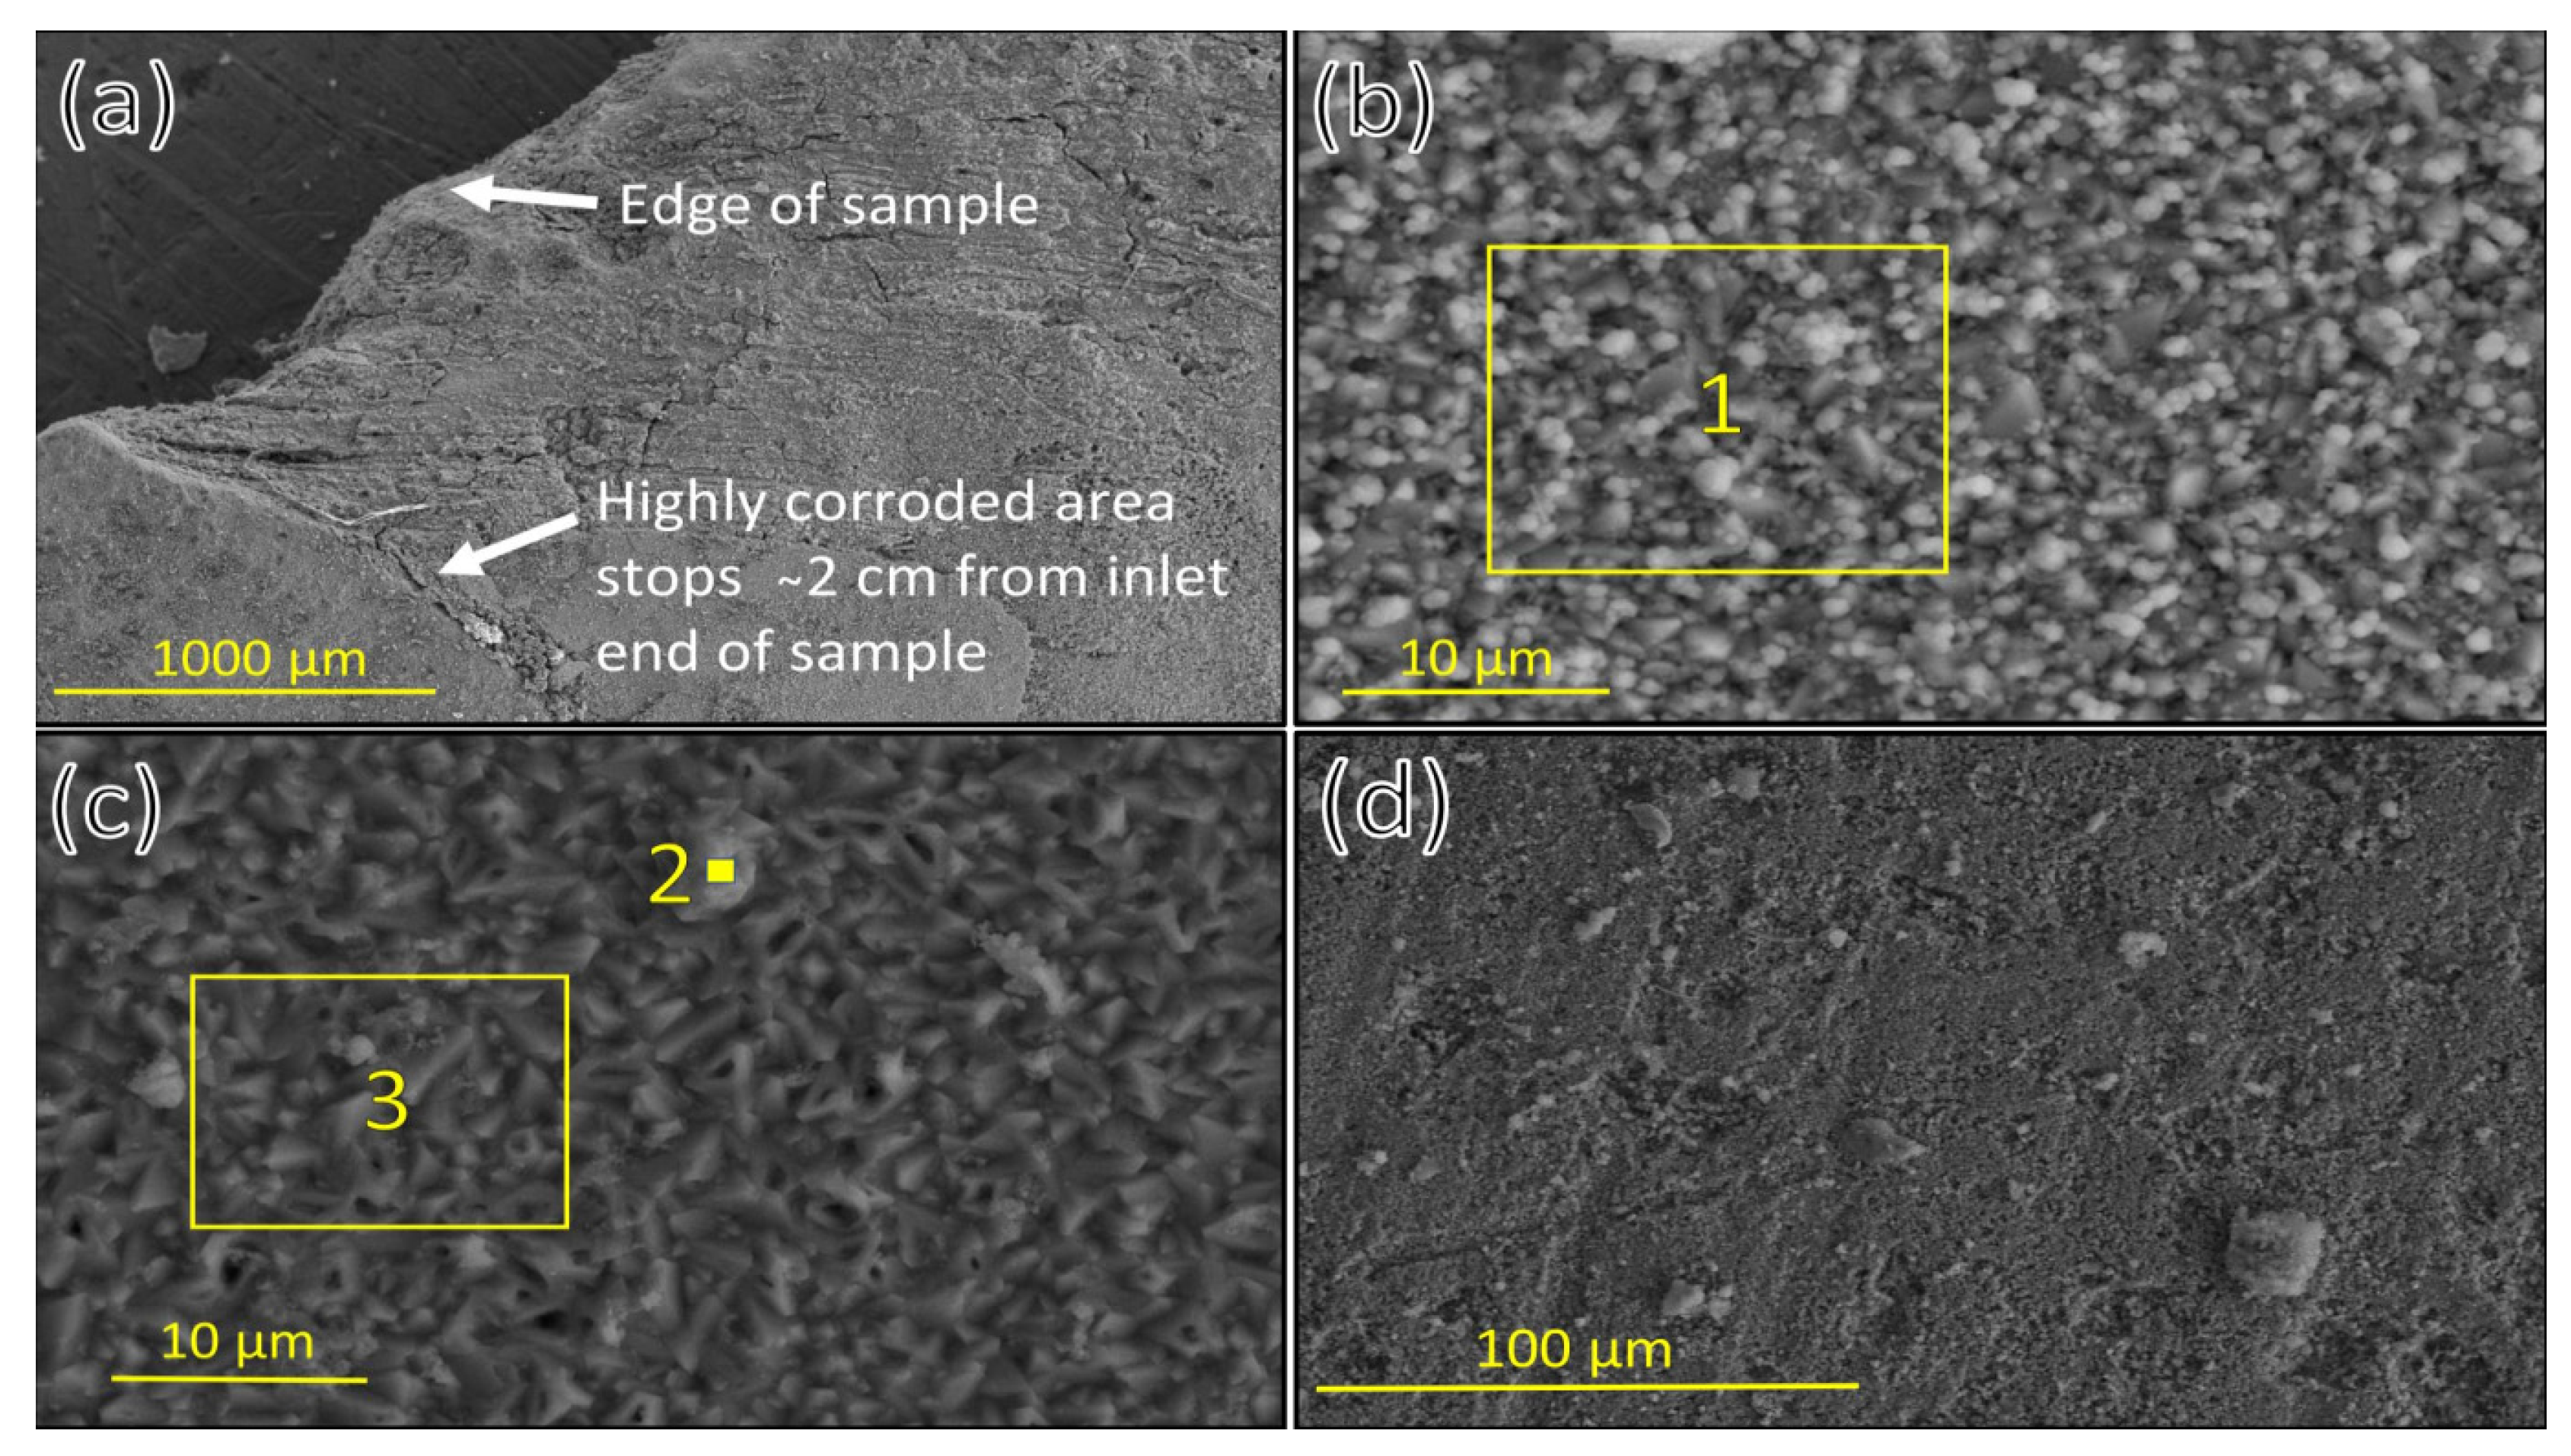
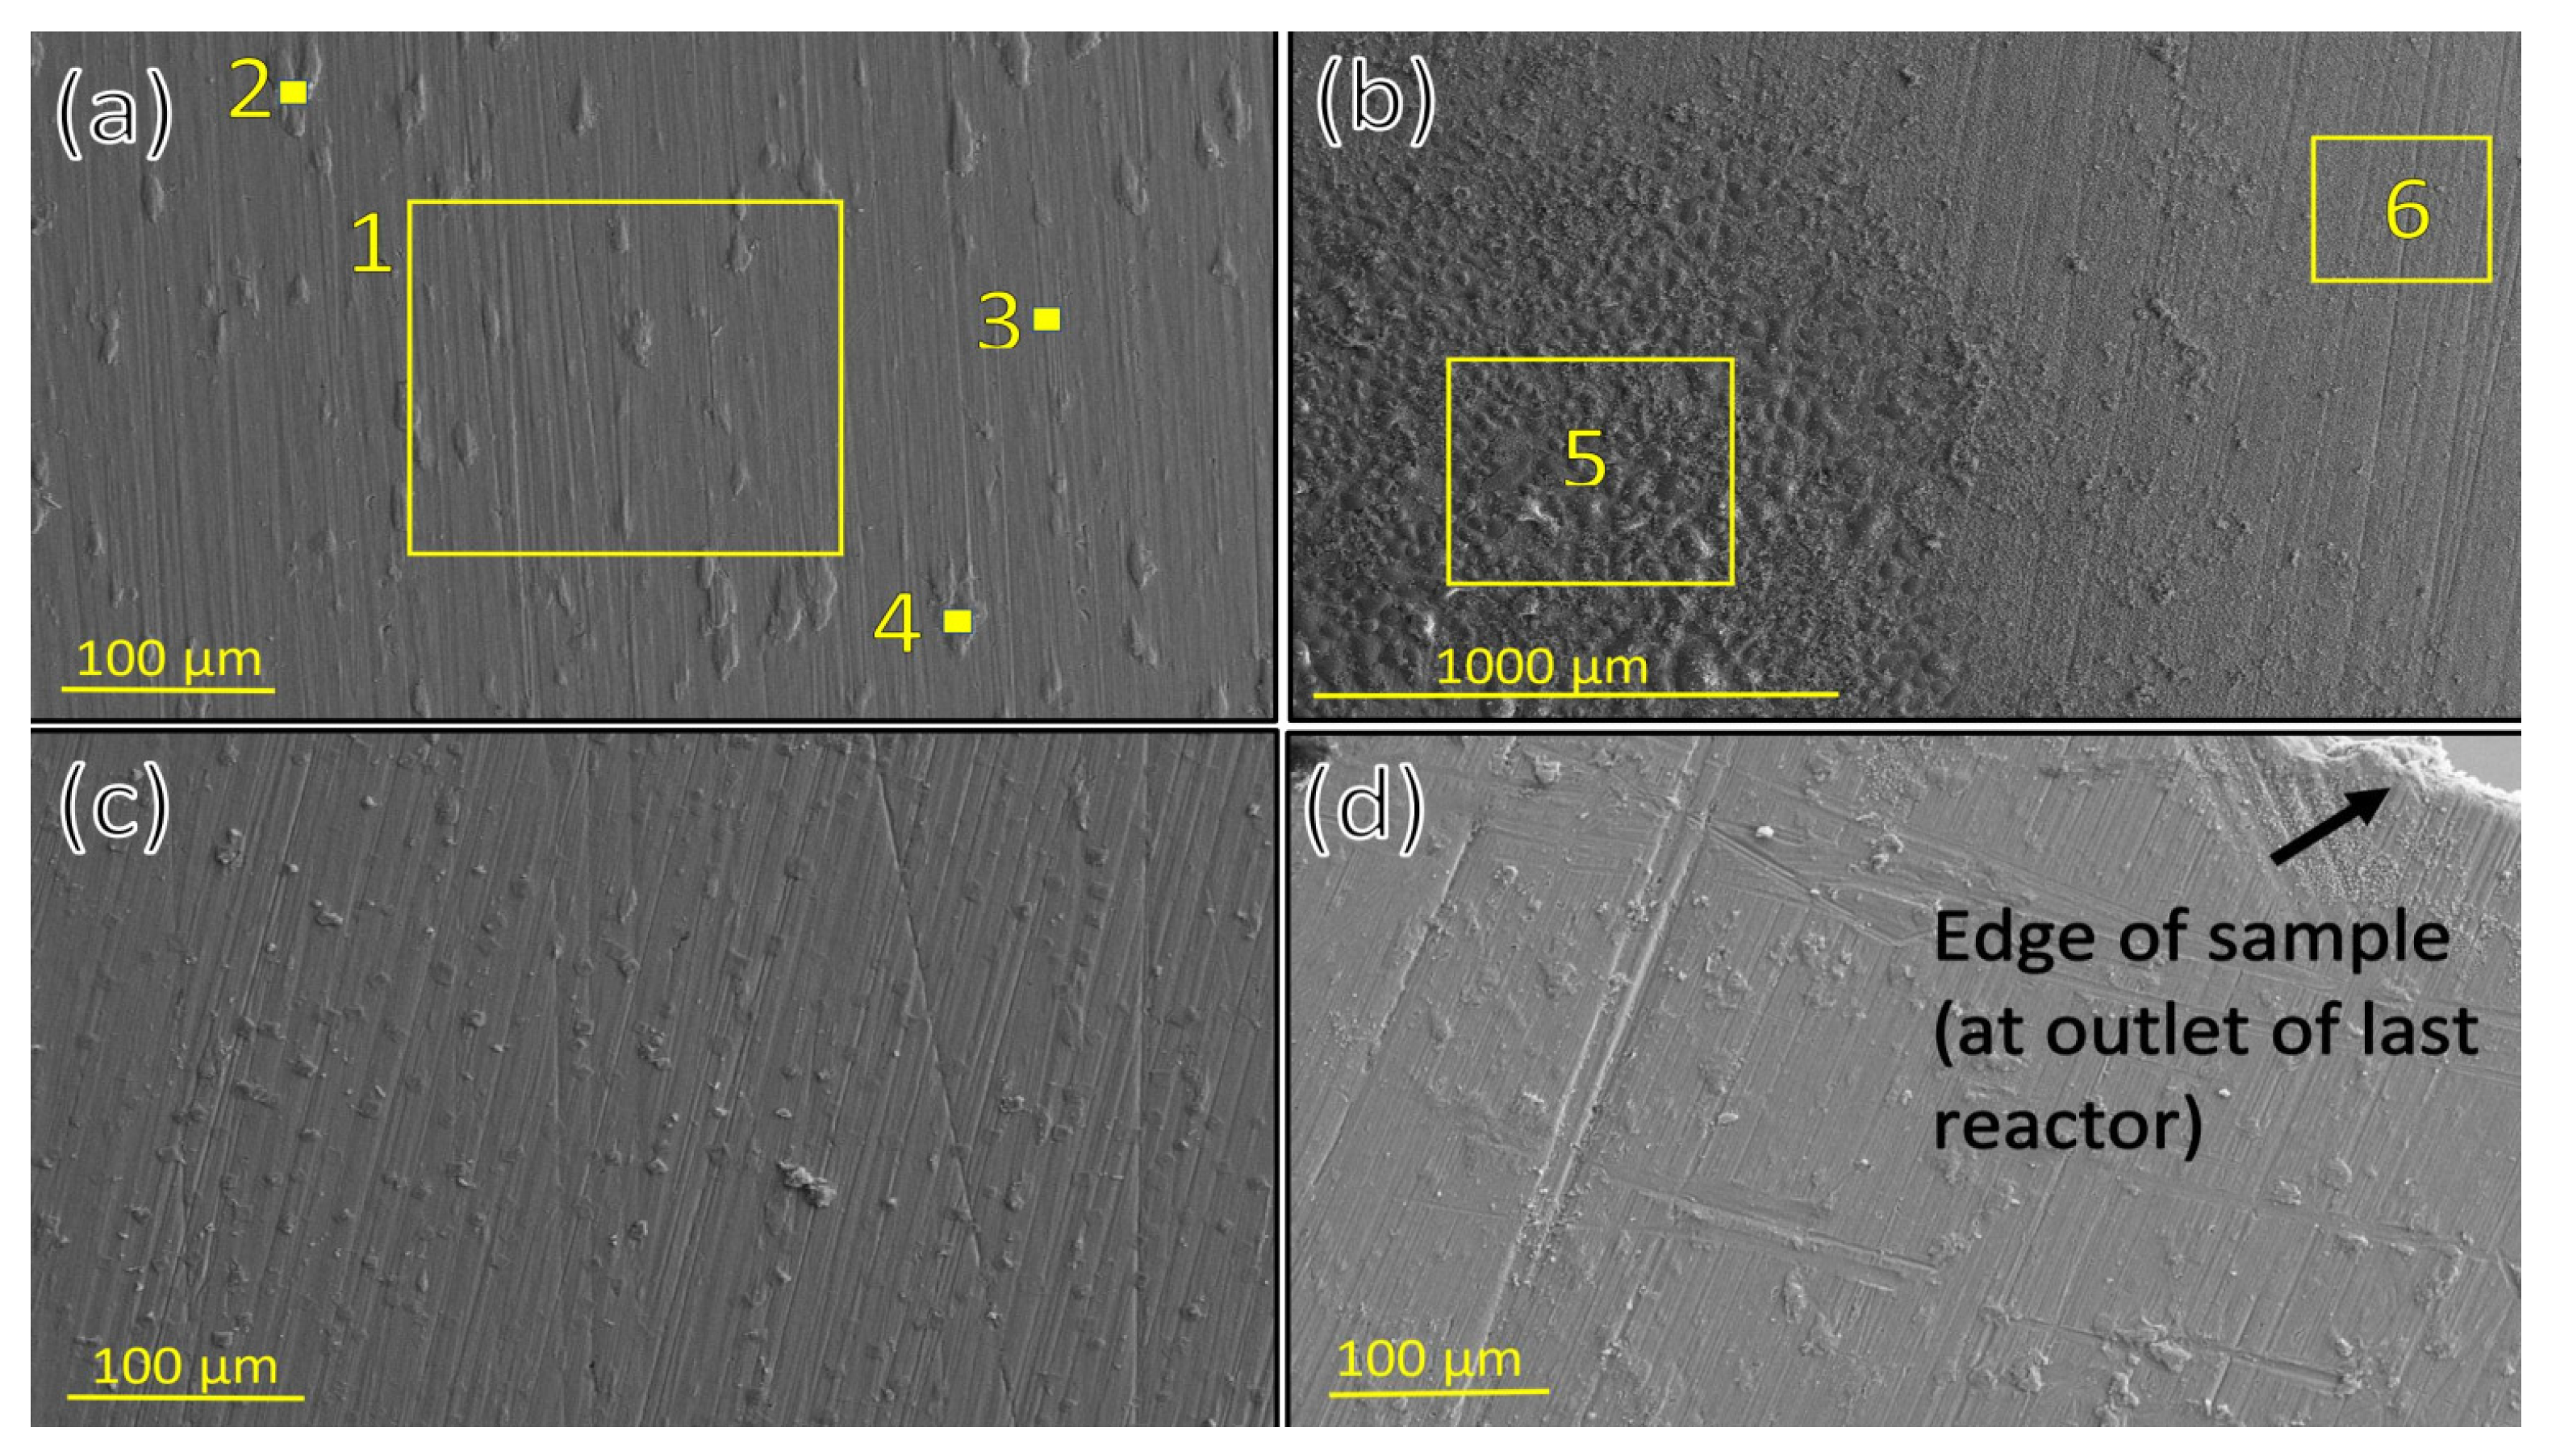
A surface analysis of all the carbon-steel samples showed that corrosion to some extent had occurred on the first few centimetres of sample 1 and sample 9. The first 1 to 2 cm of sample 1 had been prone to apparent corrosion, where part of the samples had been corroded away during the test. The corrosion observed on sample 9 had more micropitting texture rather than bulk mass removal. The samples in between had, to a large extent, surface texture similar to the surface texture characterized by the presence of magnetite (see
Figure 5 and
Table 6). This had been observed in other corrosion tests performed in the same testing equipment (but with different setup) in a superheated environment done by Thorhallsson et al. [
15]. A broad range of corrosion forms was observed on the carbon-steel sample in the first few centimetres of sample 1: some locations had negligible oxide film observed on the surface; other locations had a dense oxide film present.
These findings might indicate that wet (aqueous) corrosion could have occurred at the first few centimetres and at the last centimetre in the testing volume because of boiling at the inlet and condensation at the outlet. Elemental analysis of carbon-steel samples indicated that some corrosion products from the fasteners or the reactor pipes (nickel-based alloy) had likely been transported to the surface of the corroded carbon-steel samples because Ni and Mo were sometimes observed on the corroded samples as seen in
Figure 5 and
Table 7 (and in
Figure 4 and
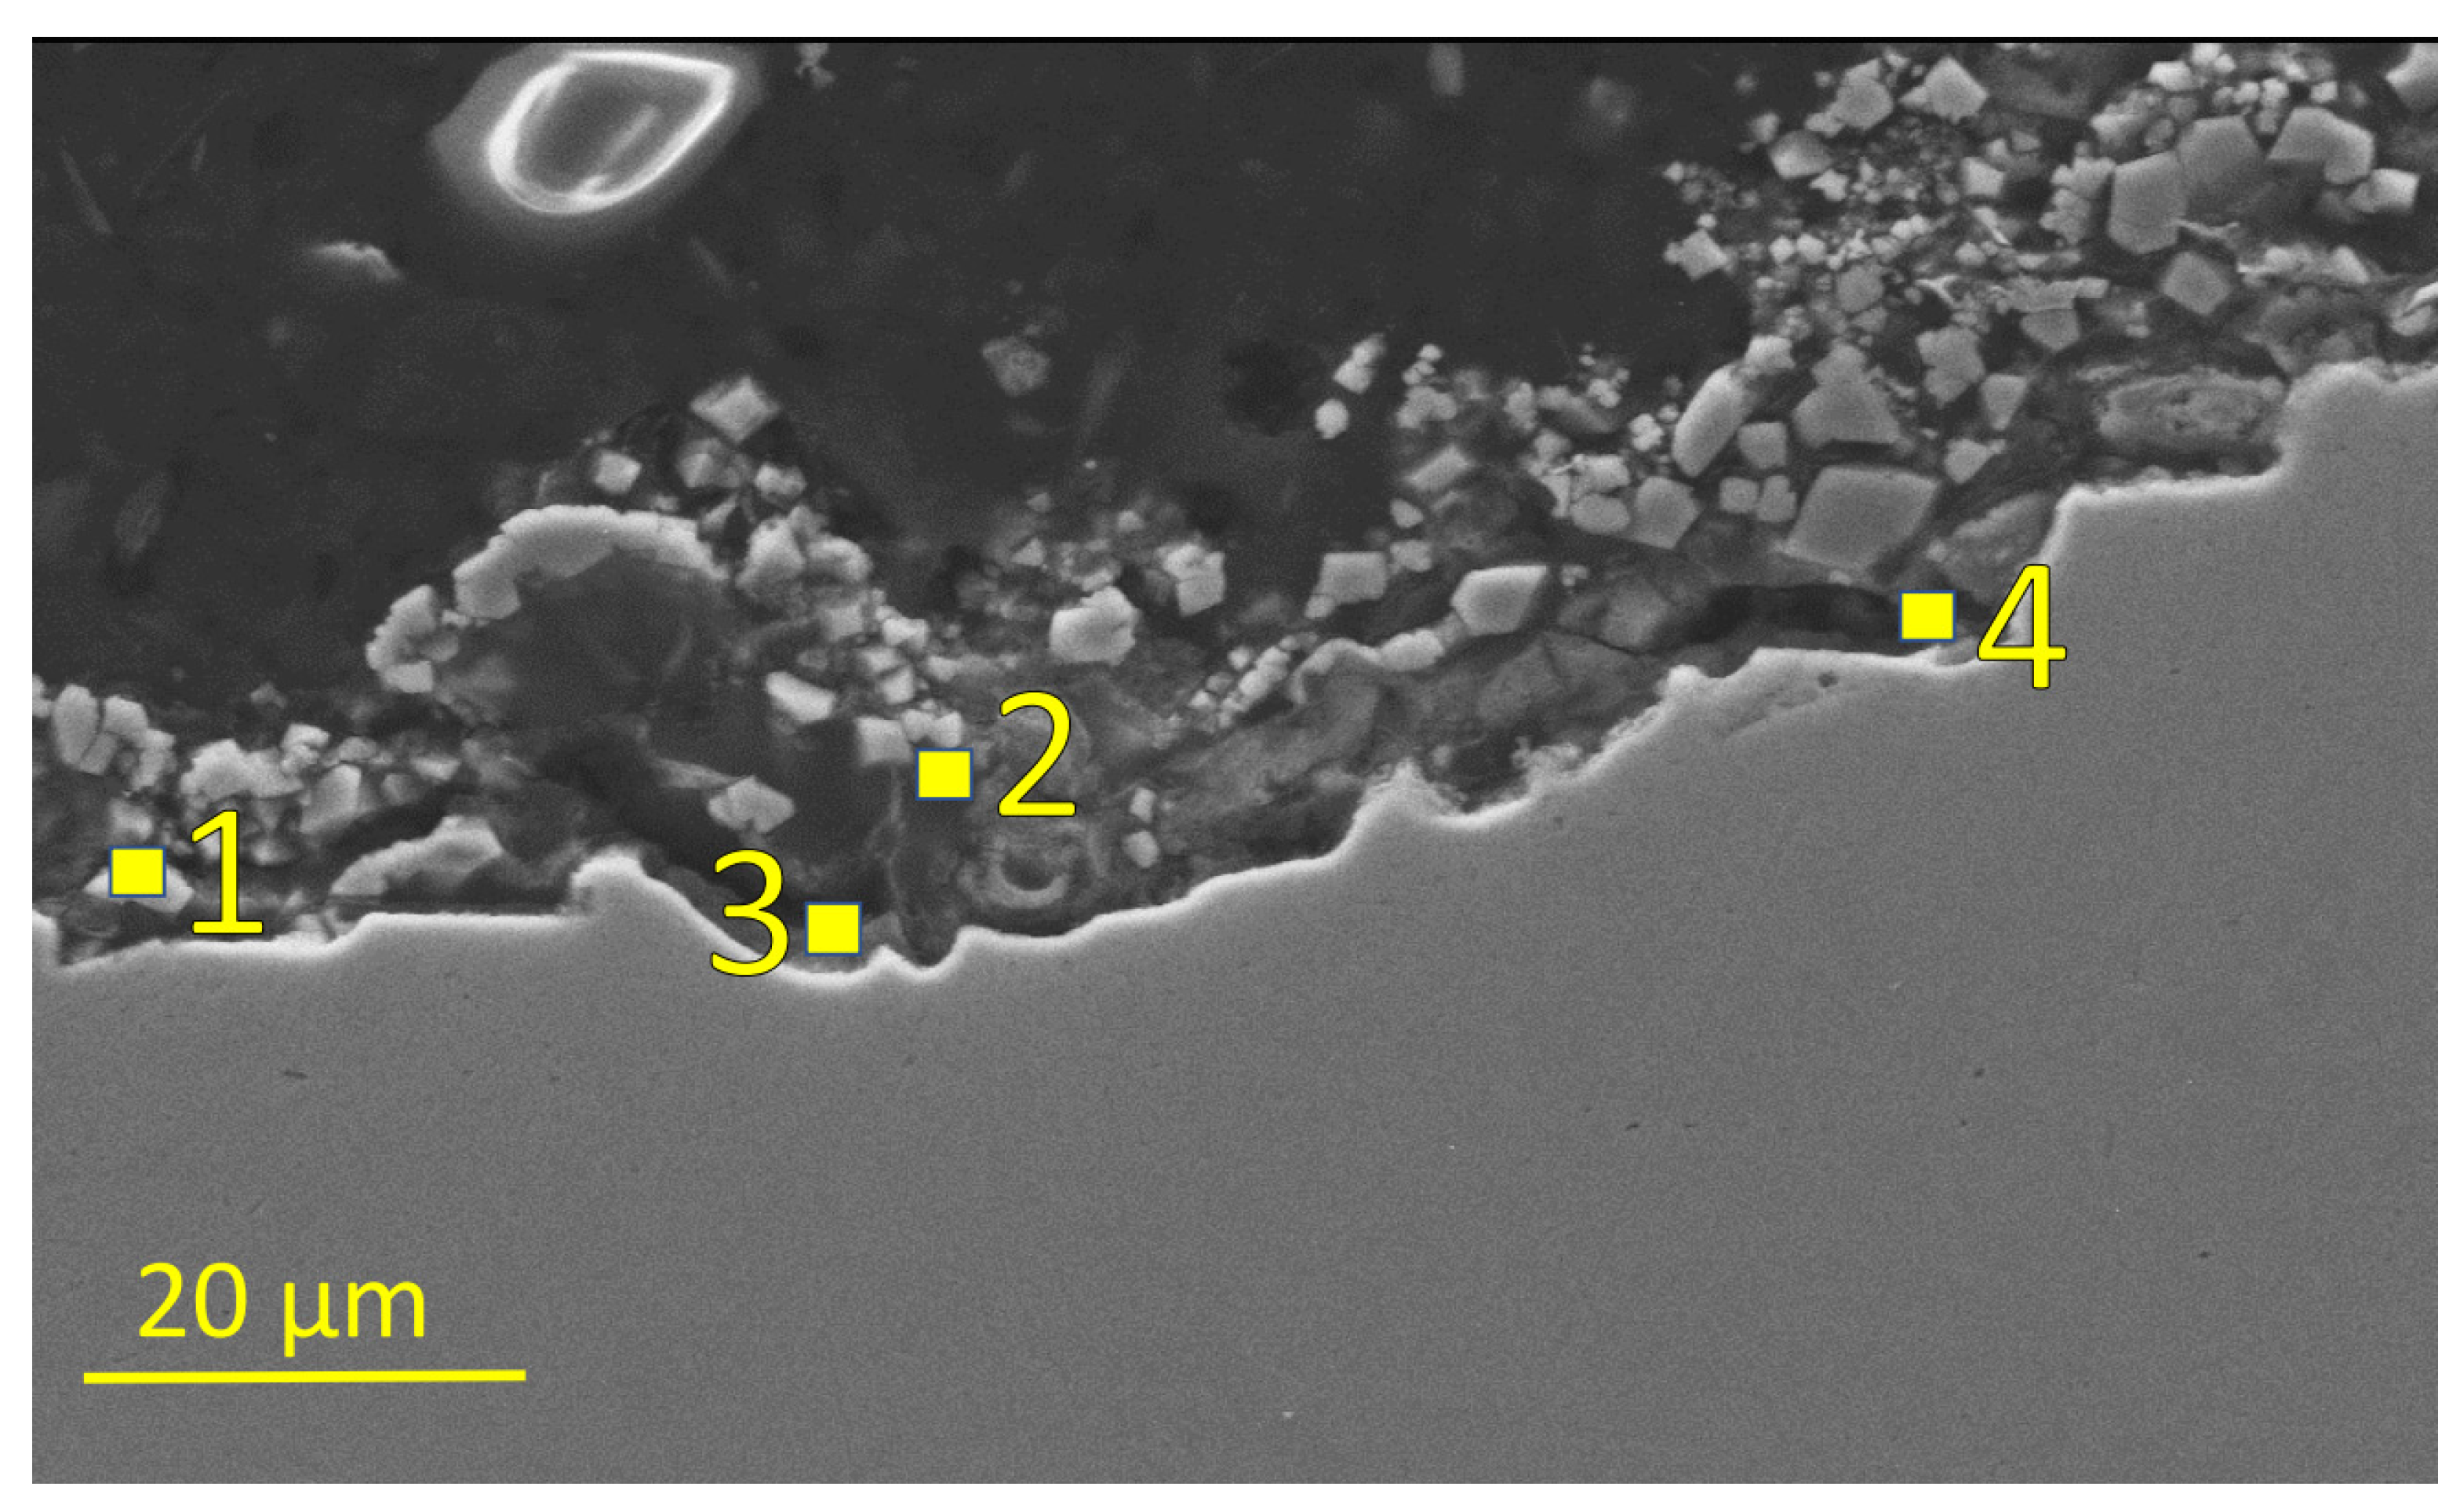
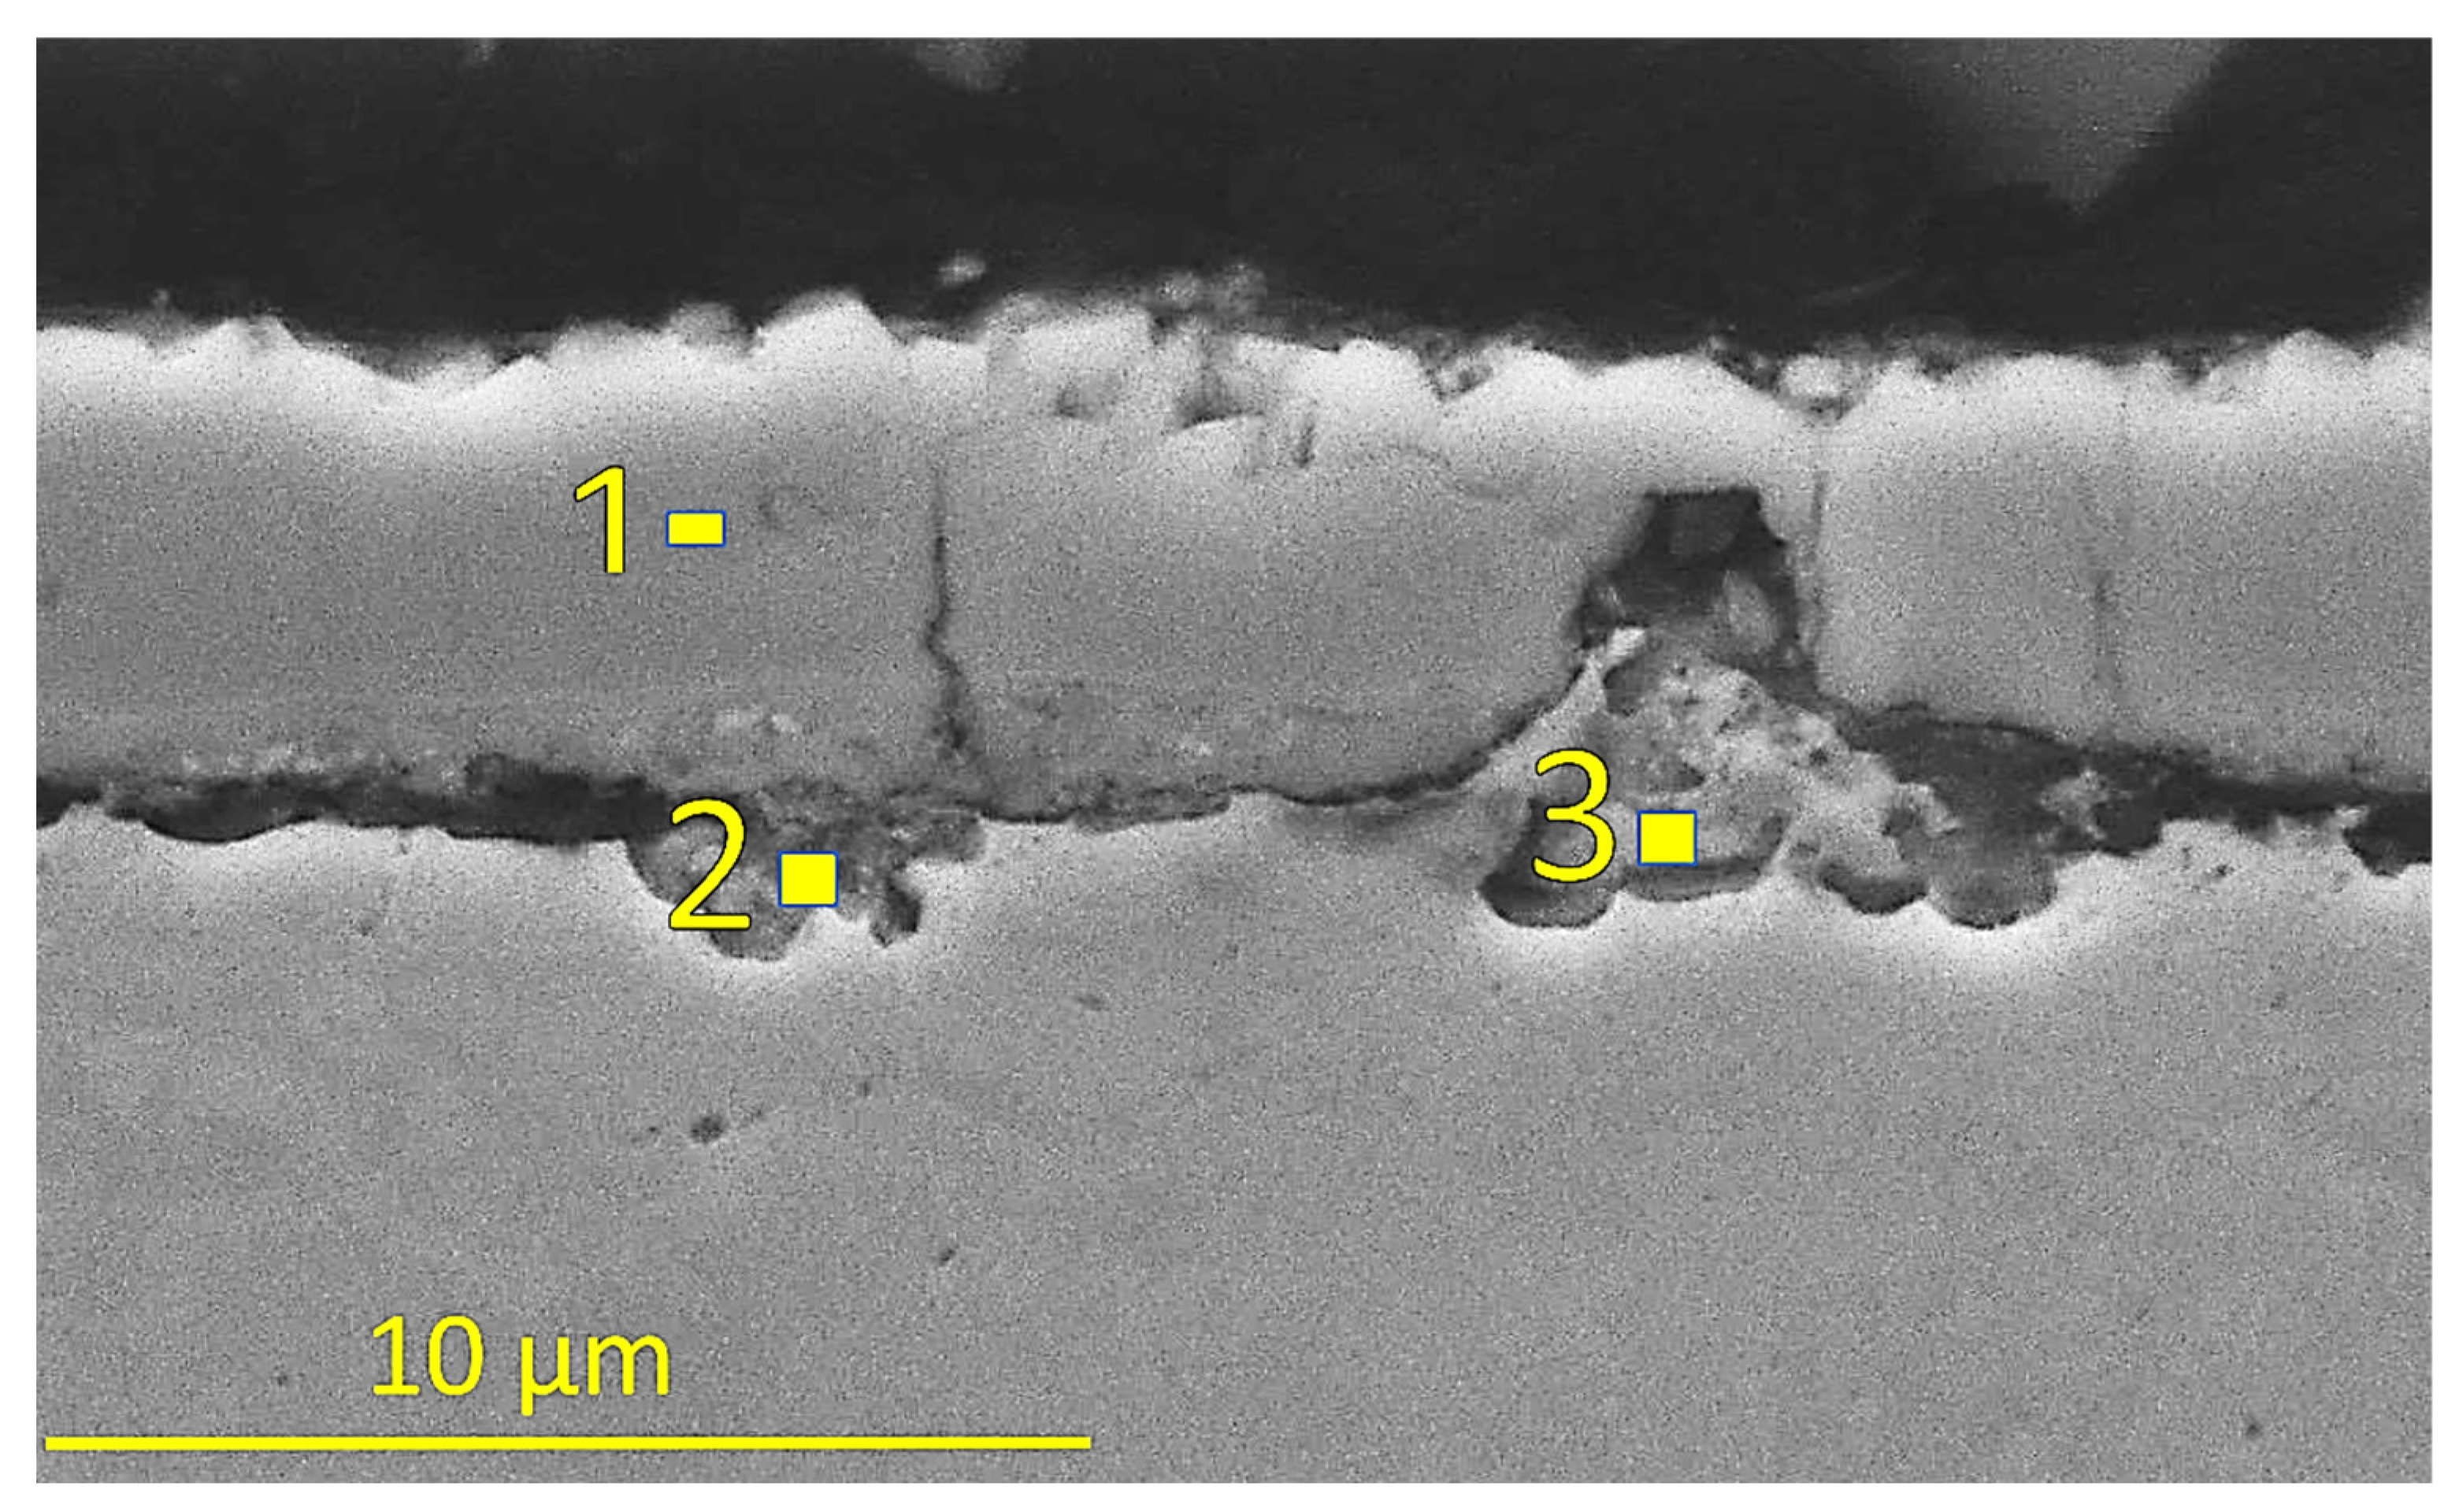
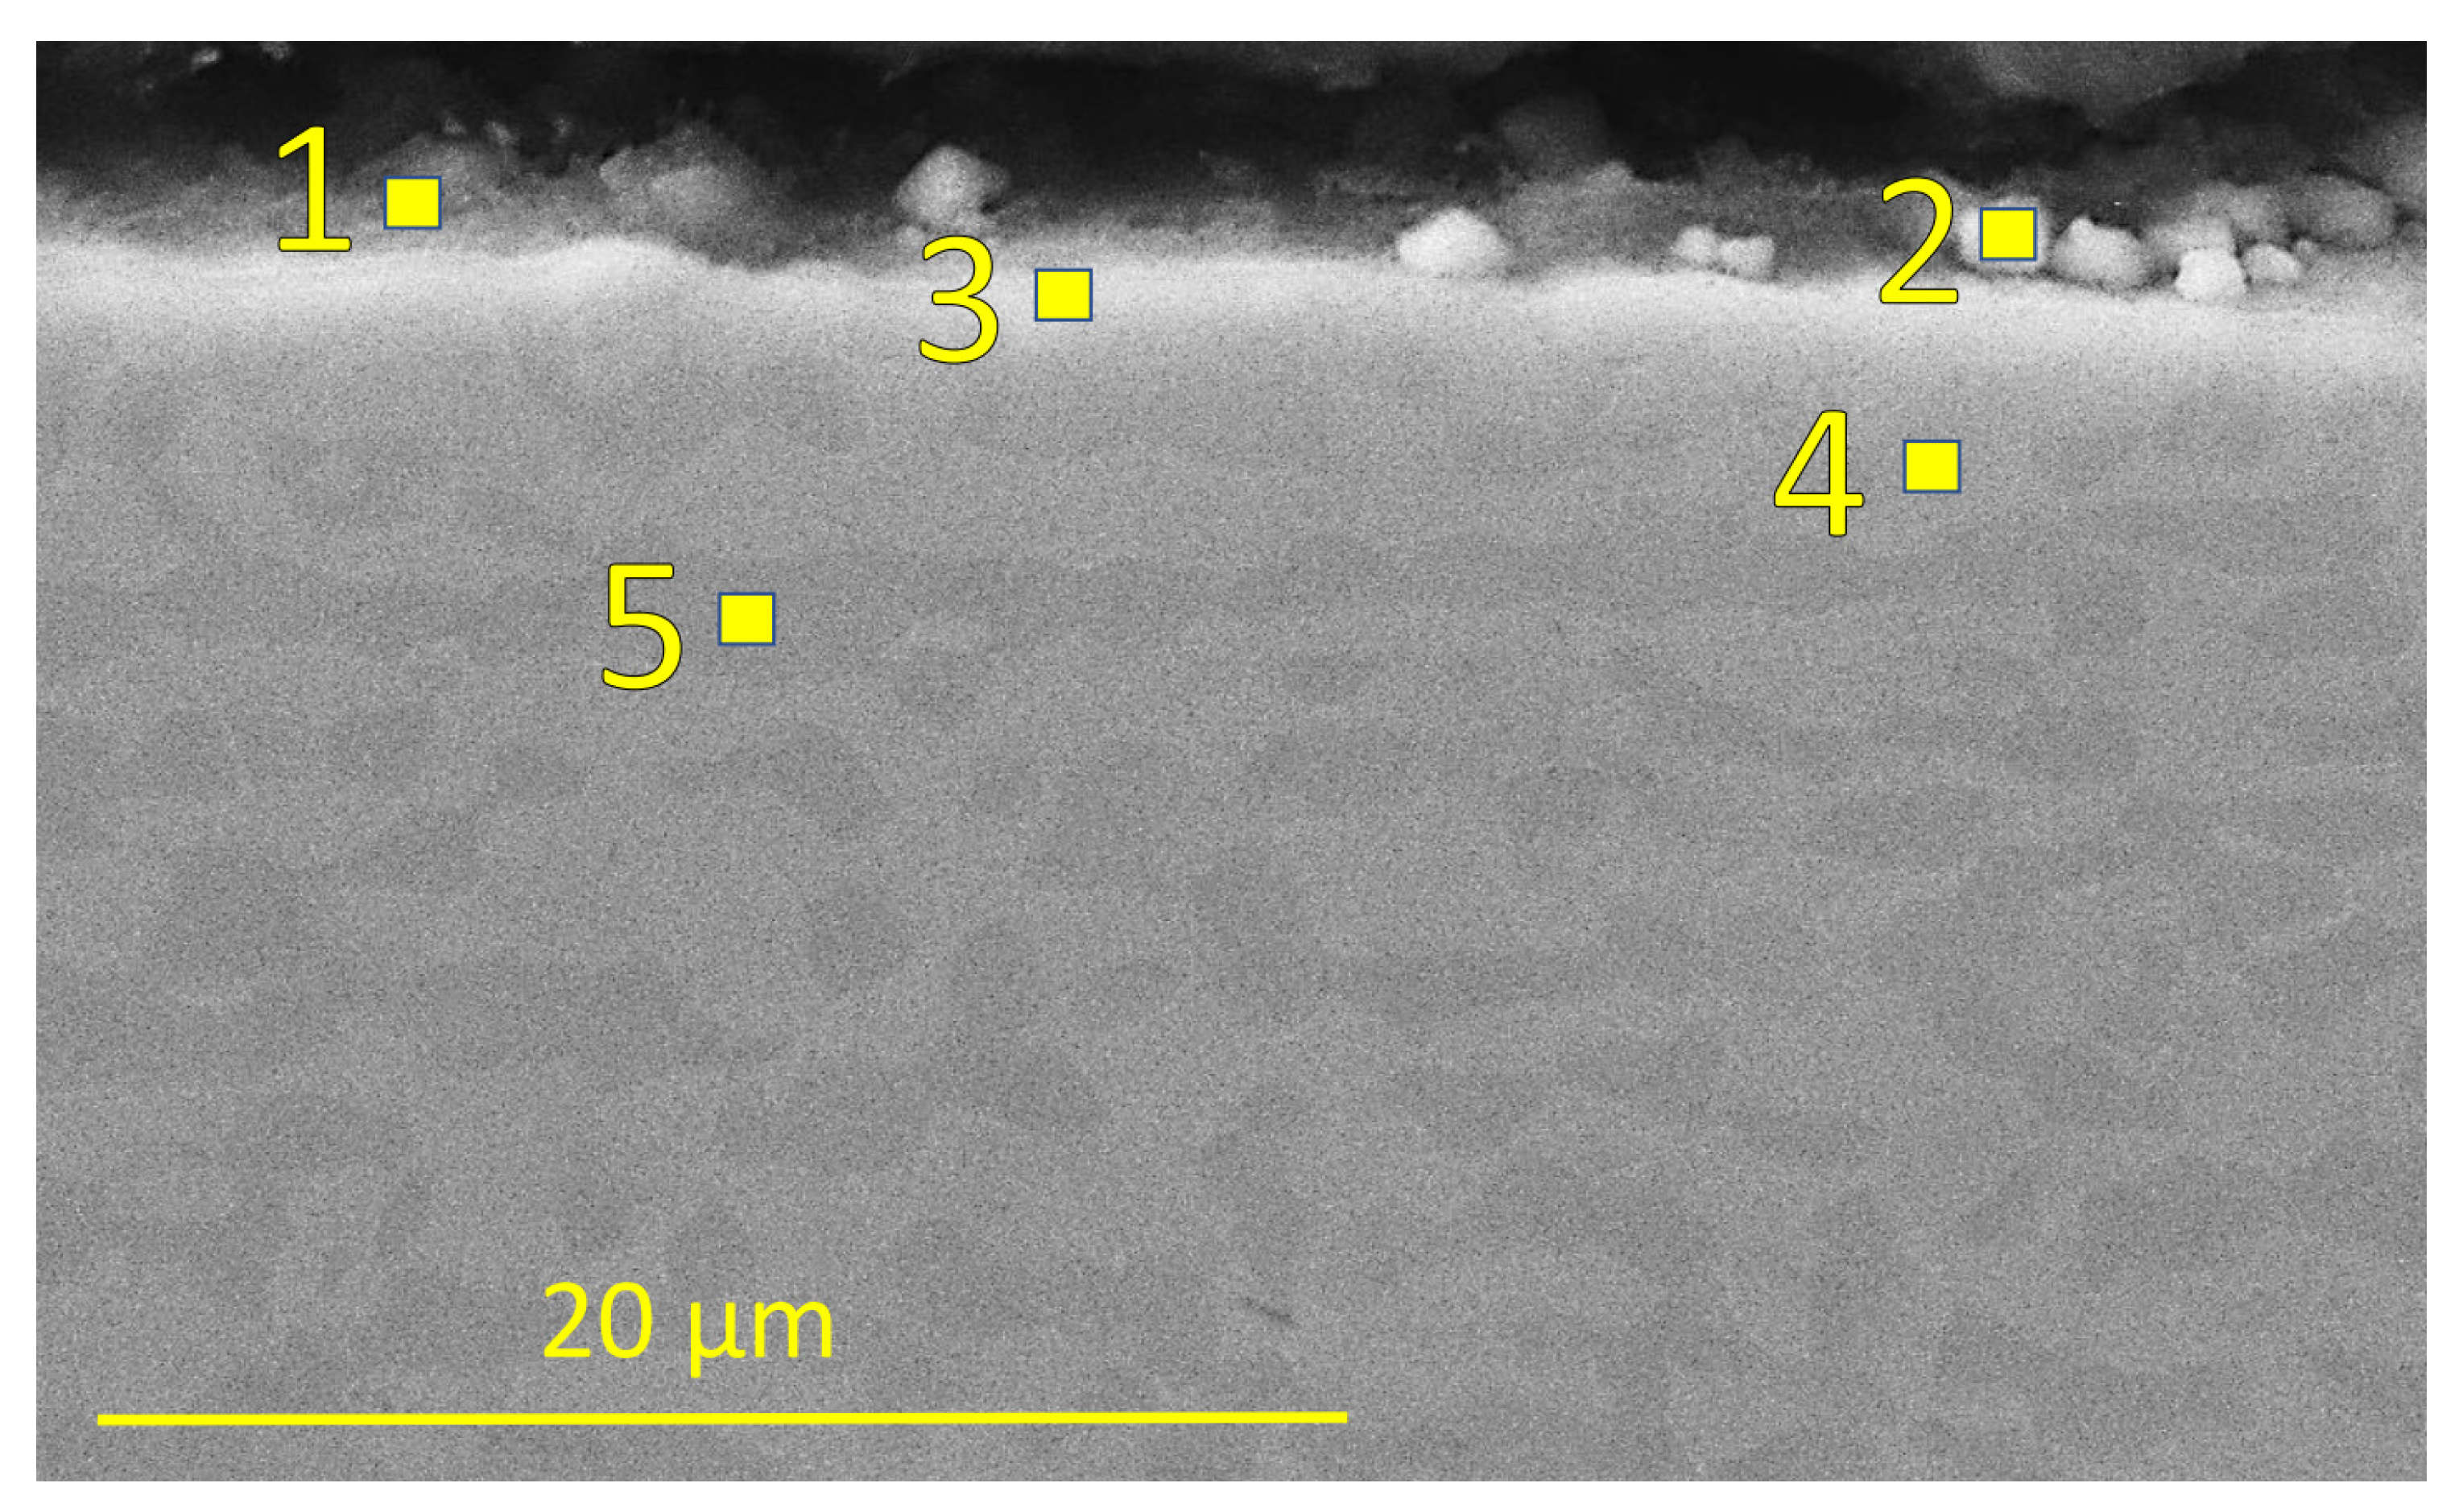
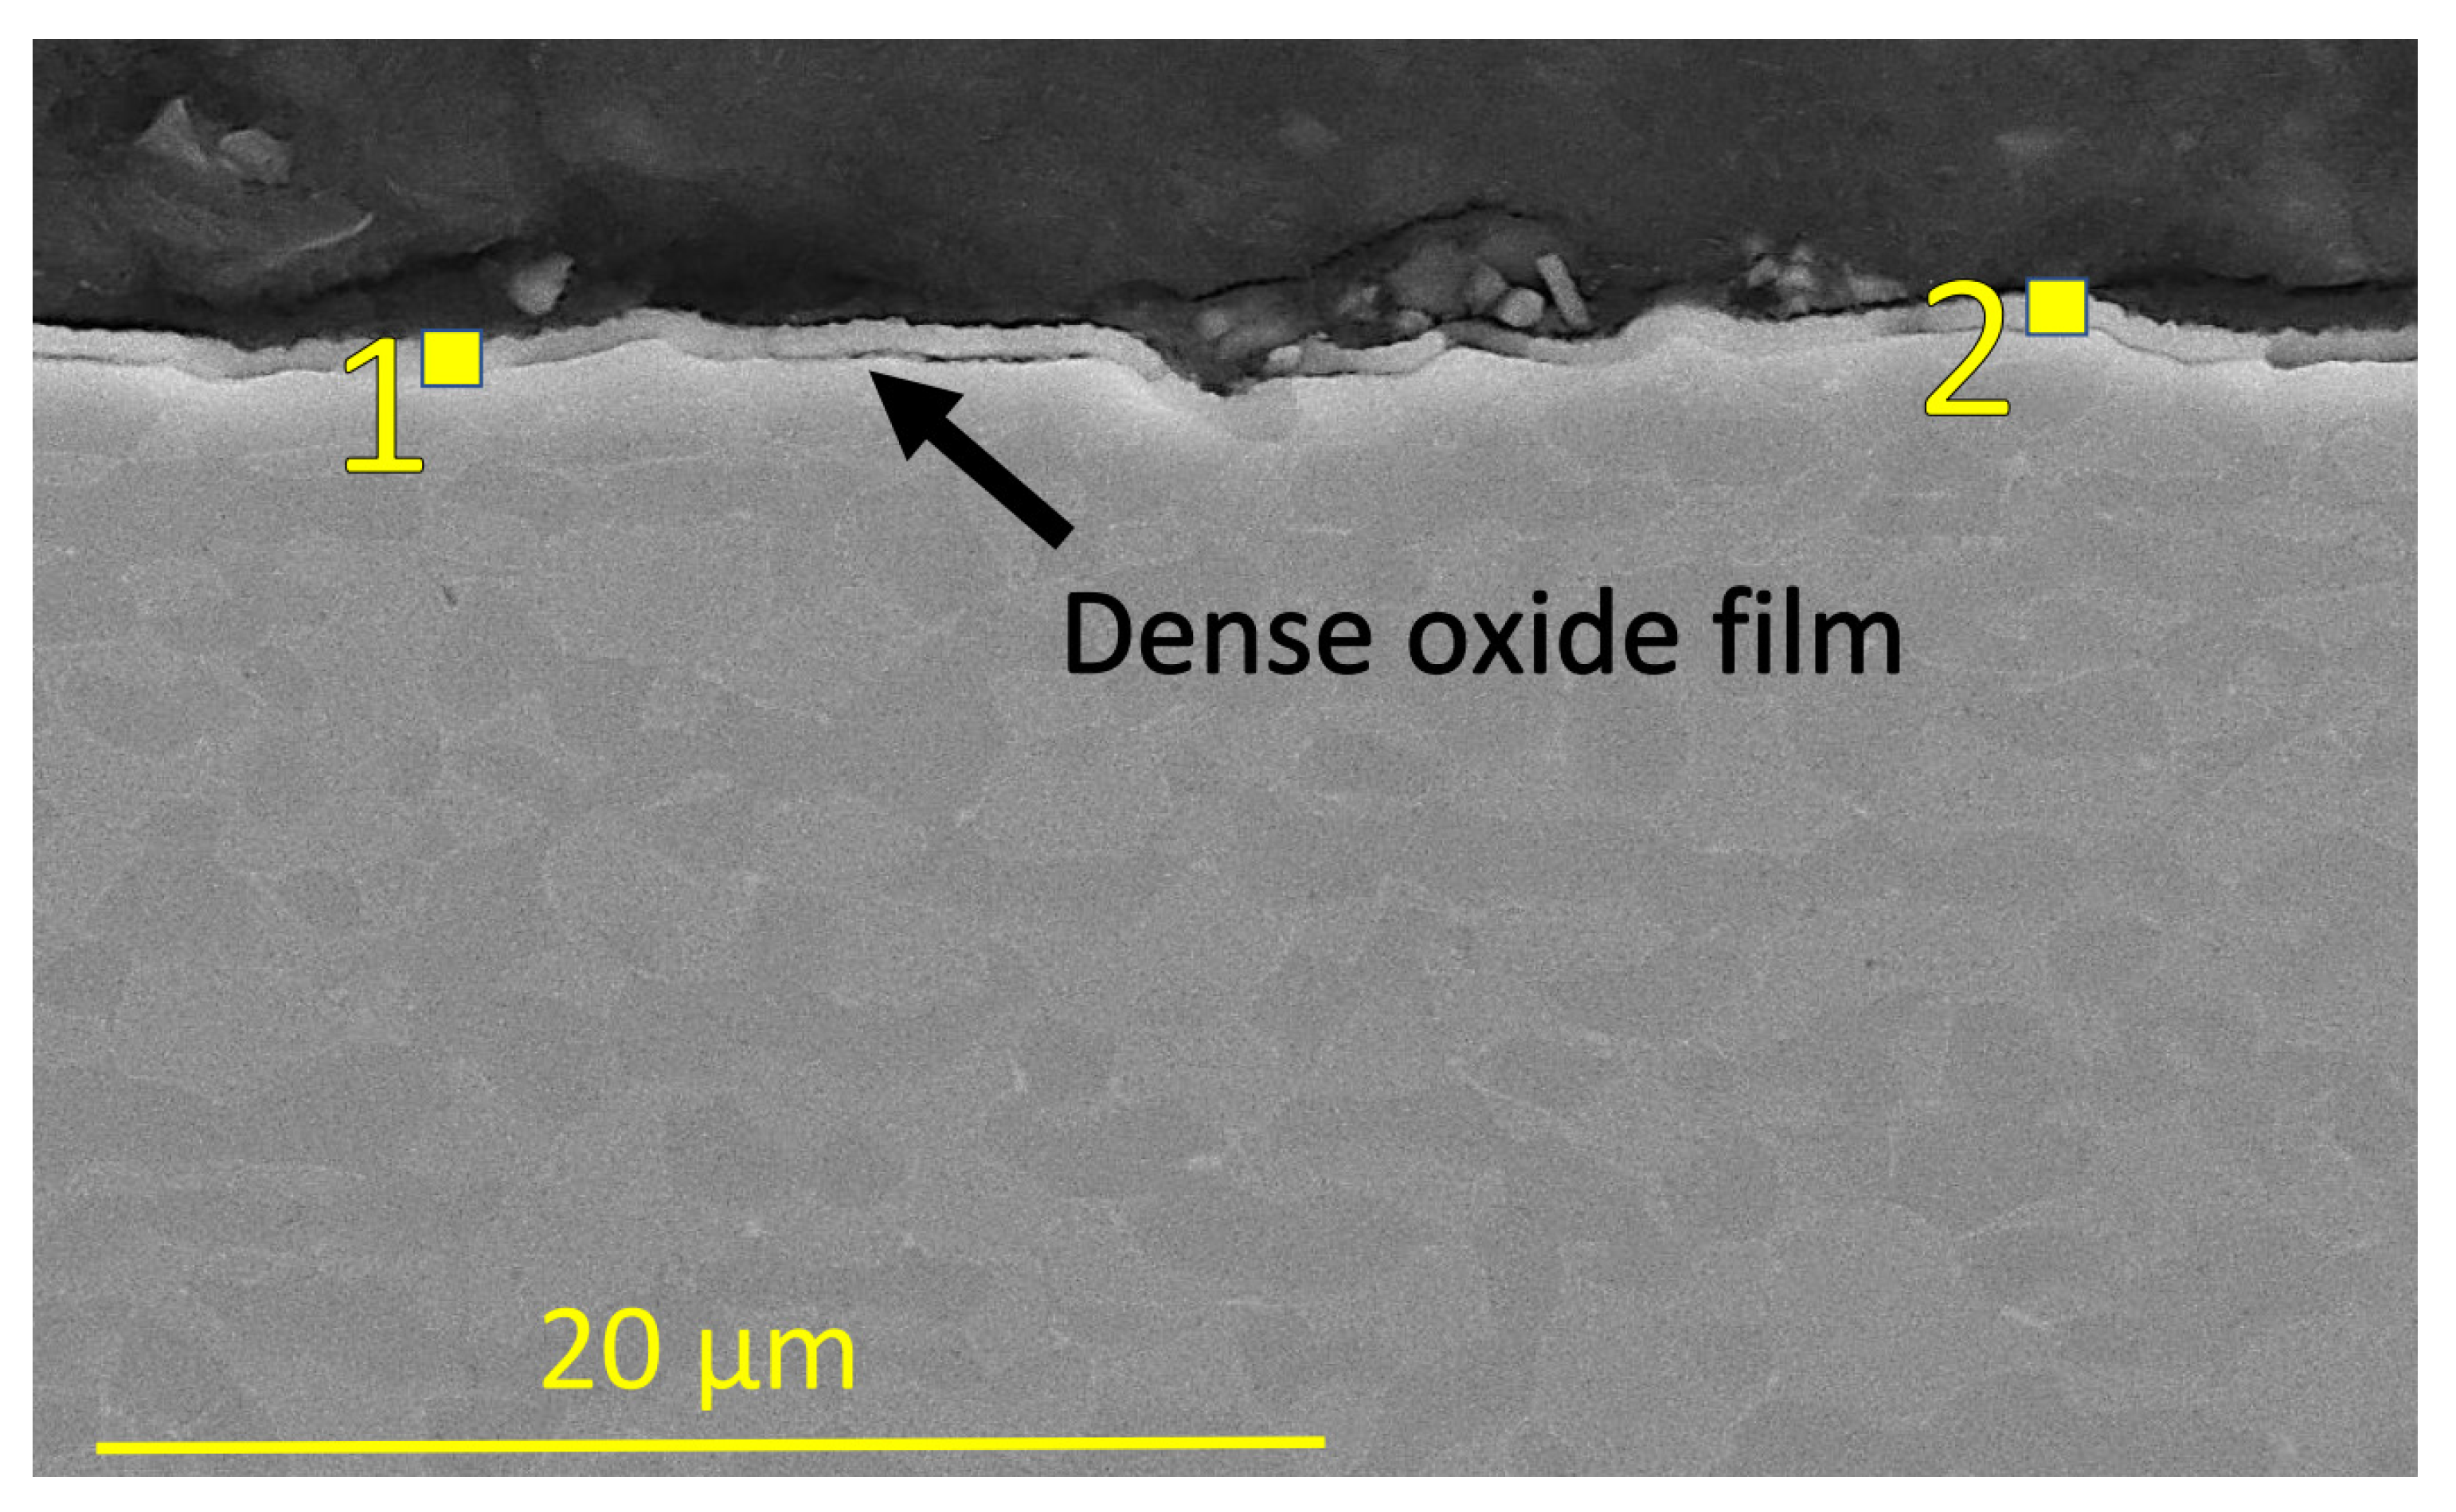
Table 6). When the cross-section of the samples in the three reactors was studied, some corrosion behaviour variability was observed: the first few centimetres of sample 1 had an incident of corrosion damage both where carbon-steel material residuals inside the corrosion film were observed on the sample (
Figure 6 and
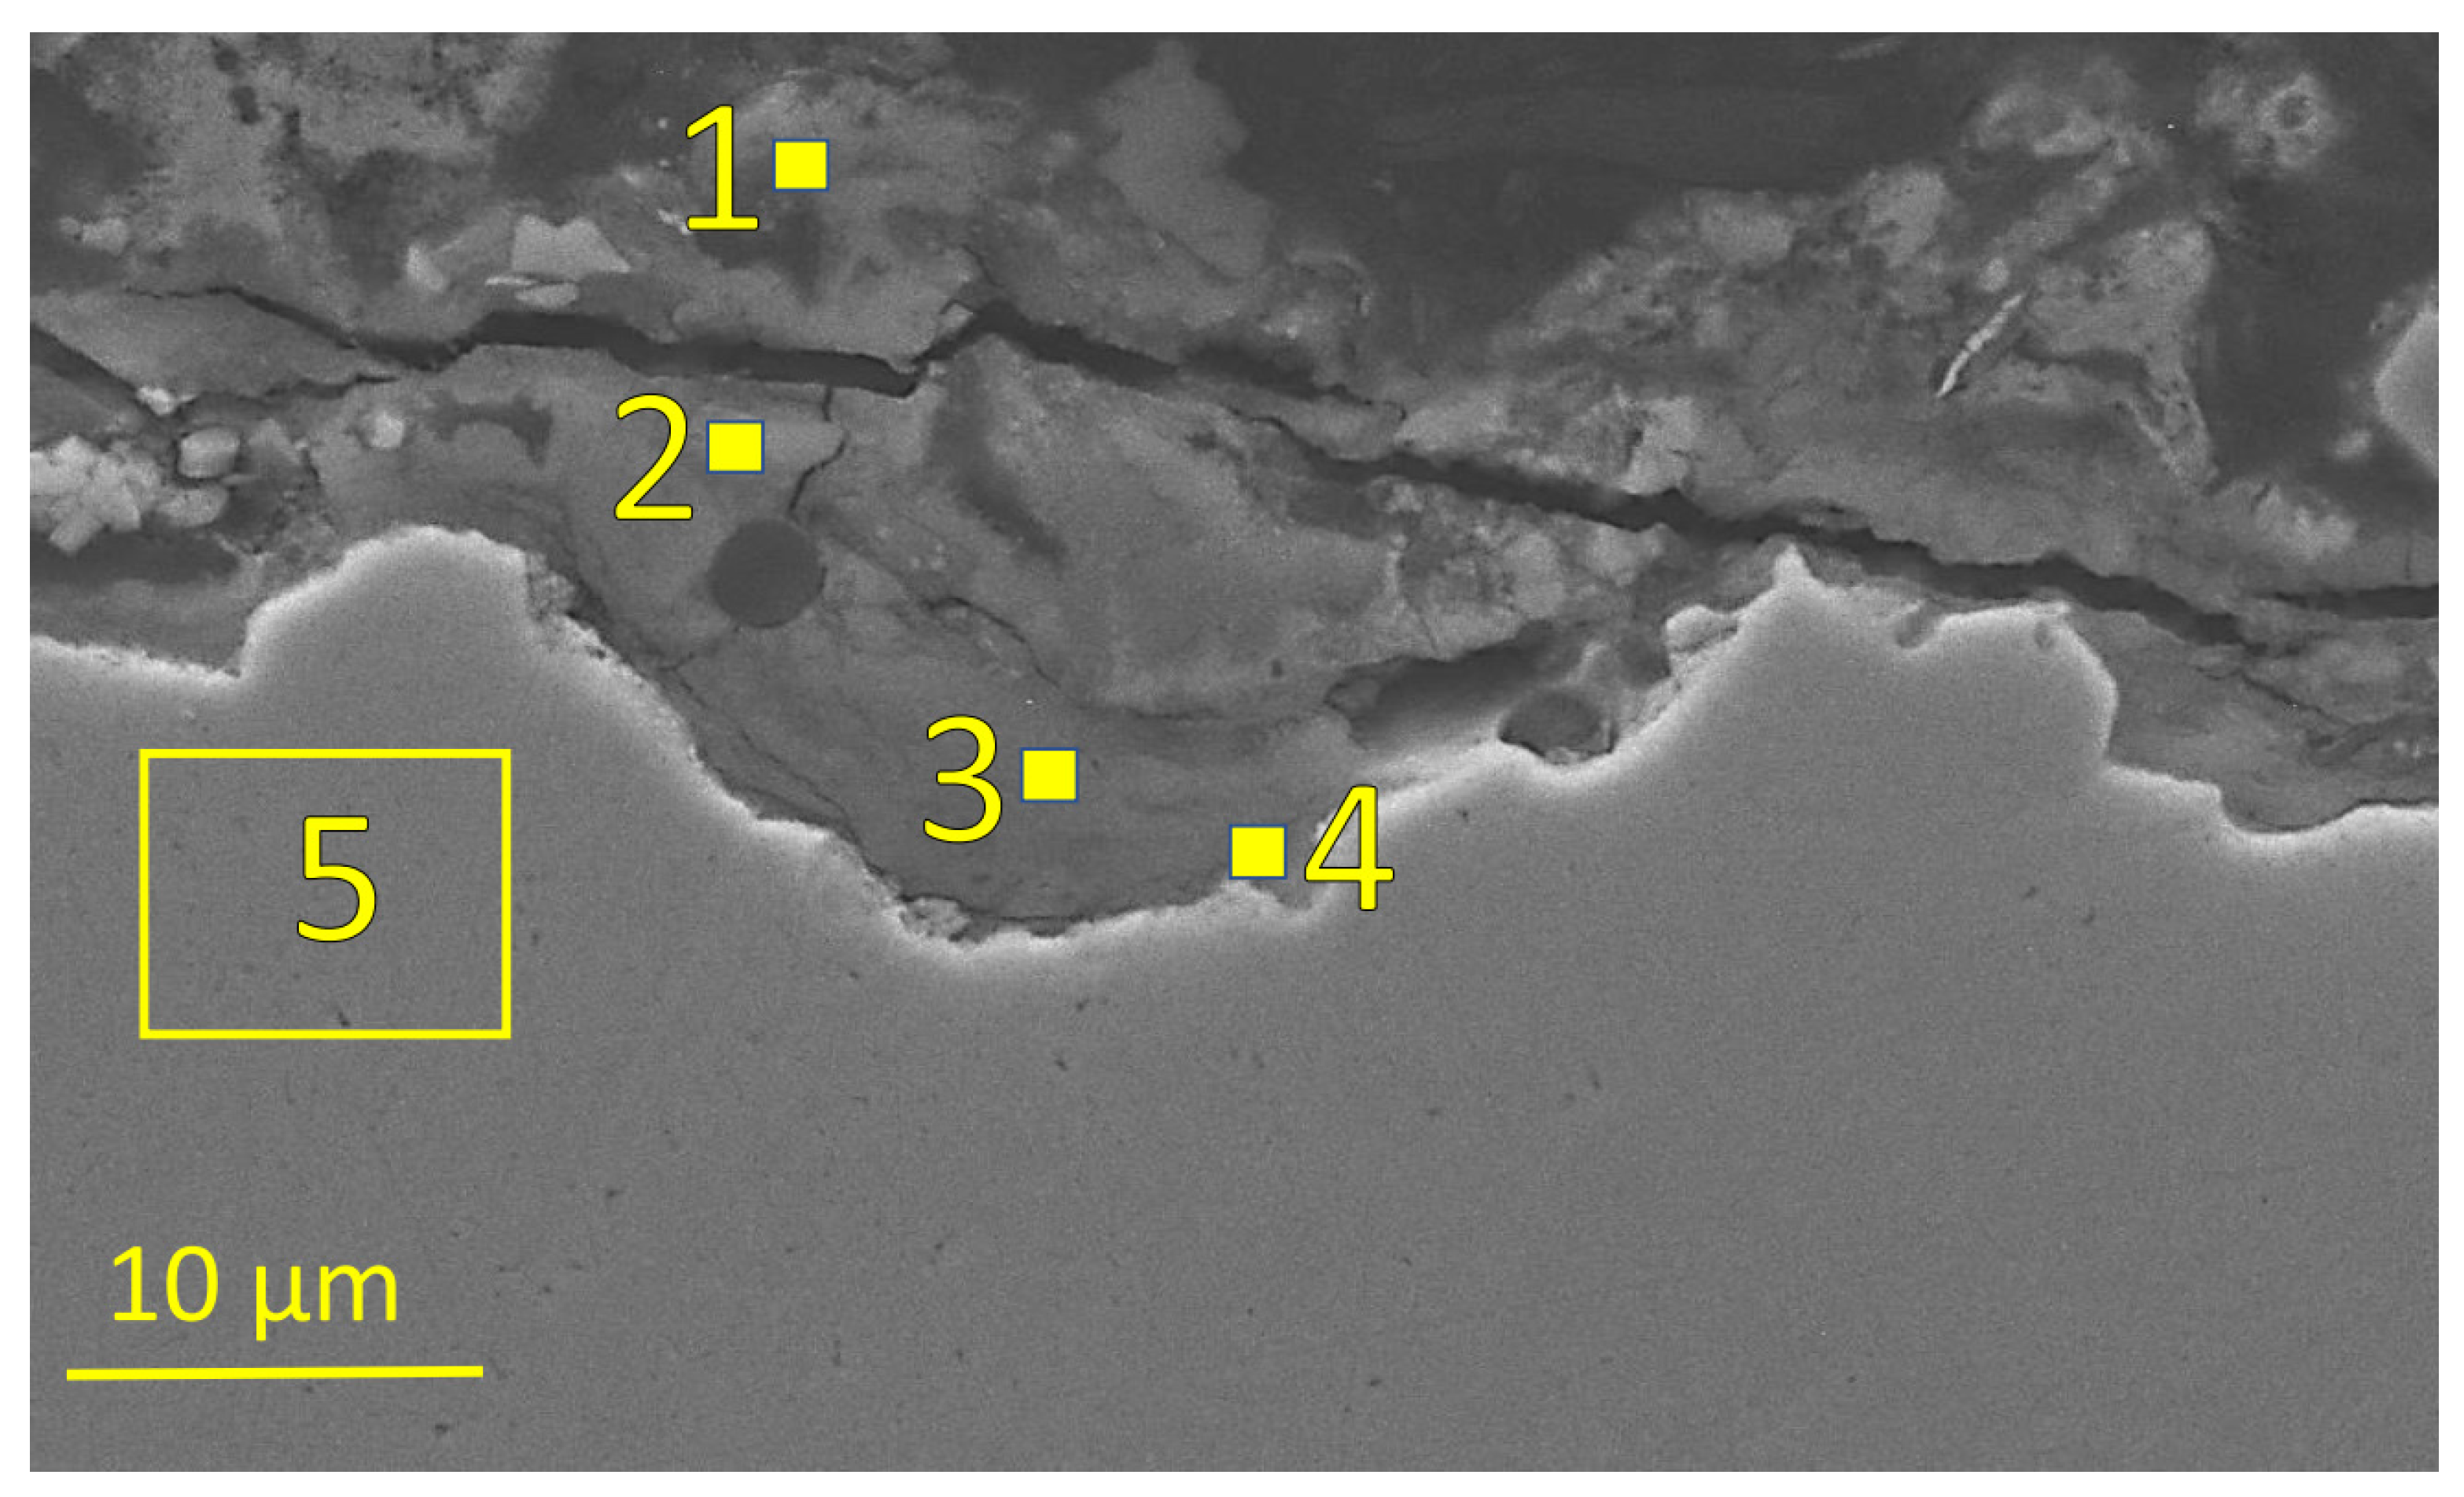
Table 7), and another incident where the thicker corrosion product (oxide film) was observed on the sample (
Figure 7 and
Table 8). The surface profile indicated in both cases that severe corrosion damage had occurred.
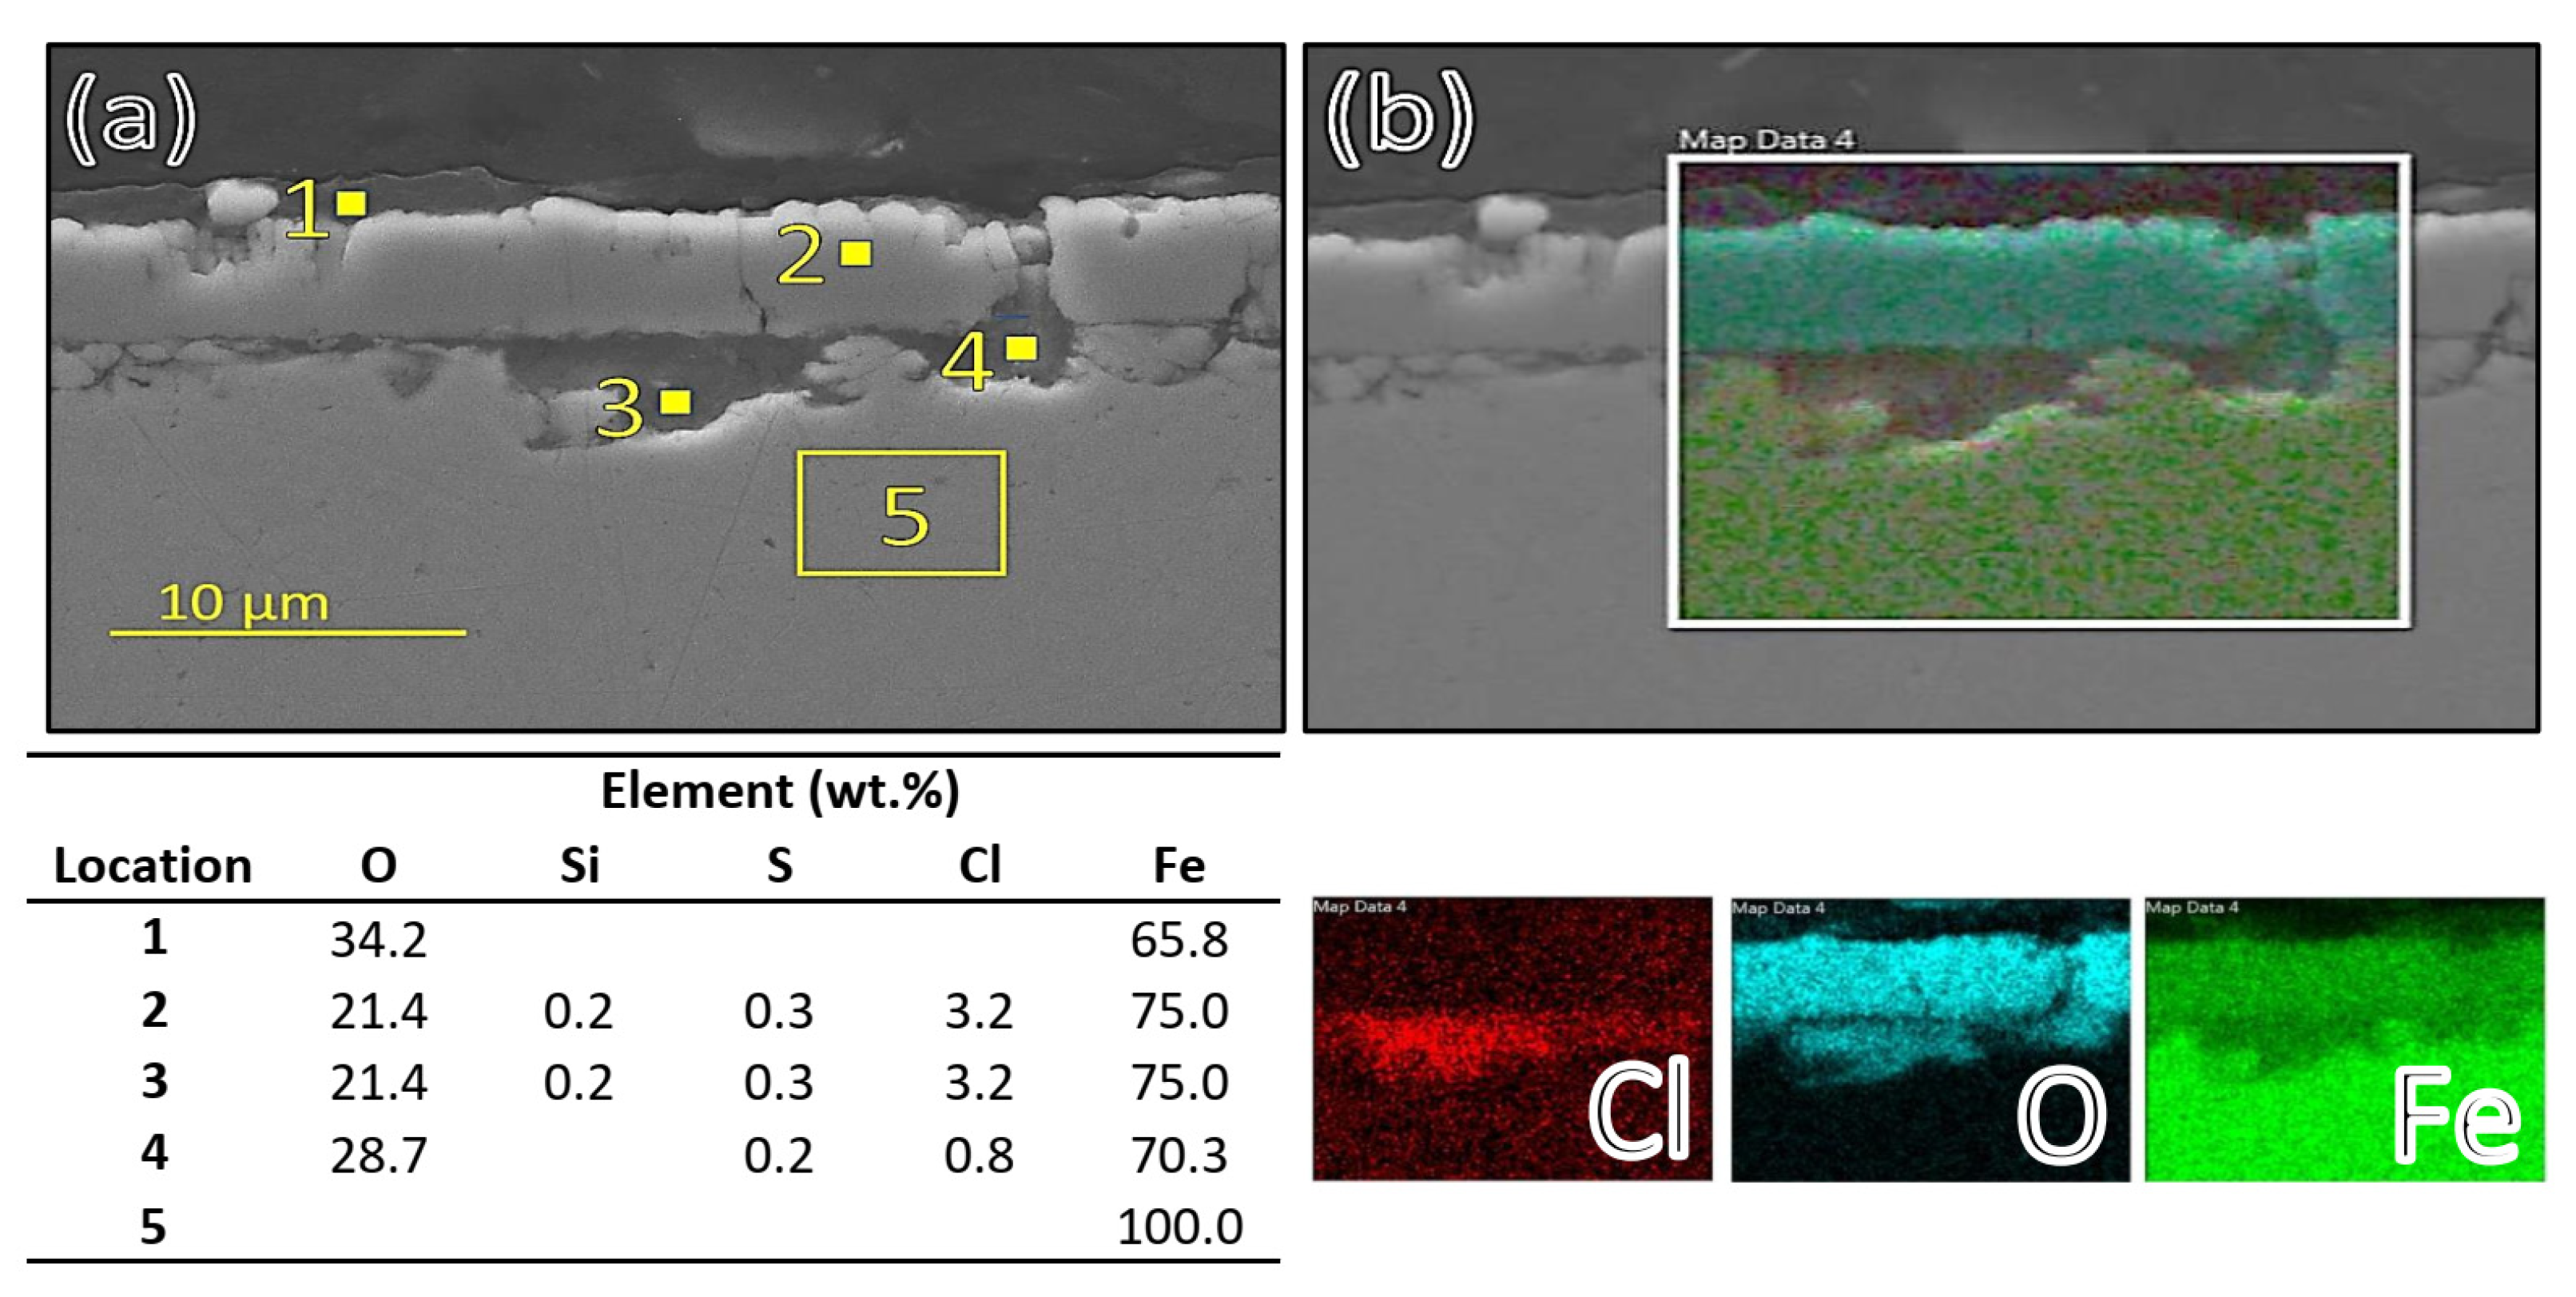
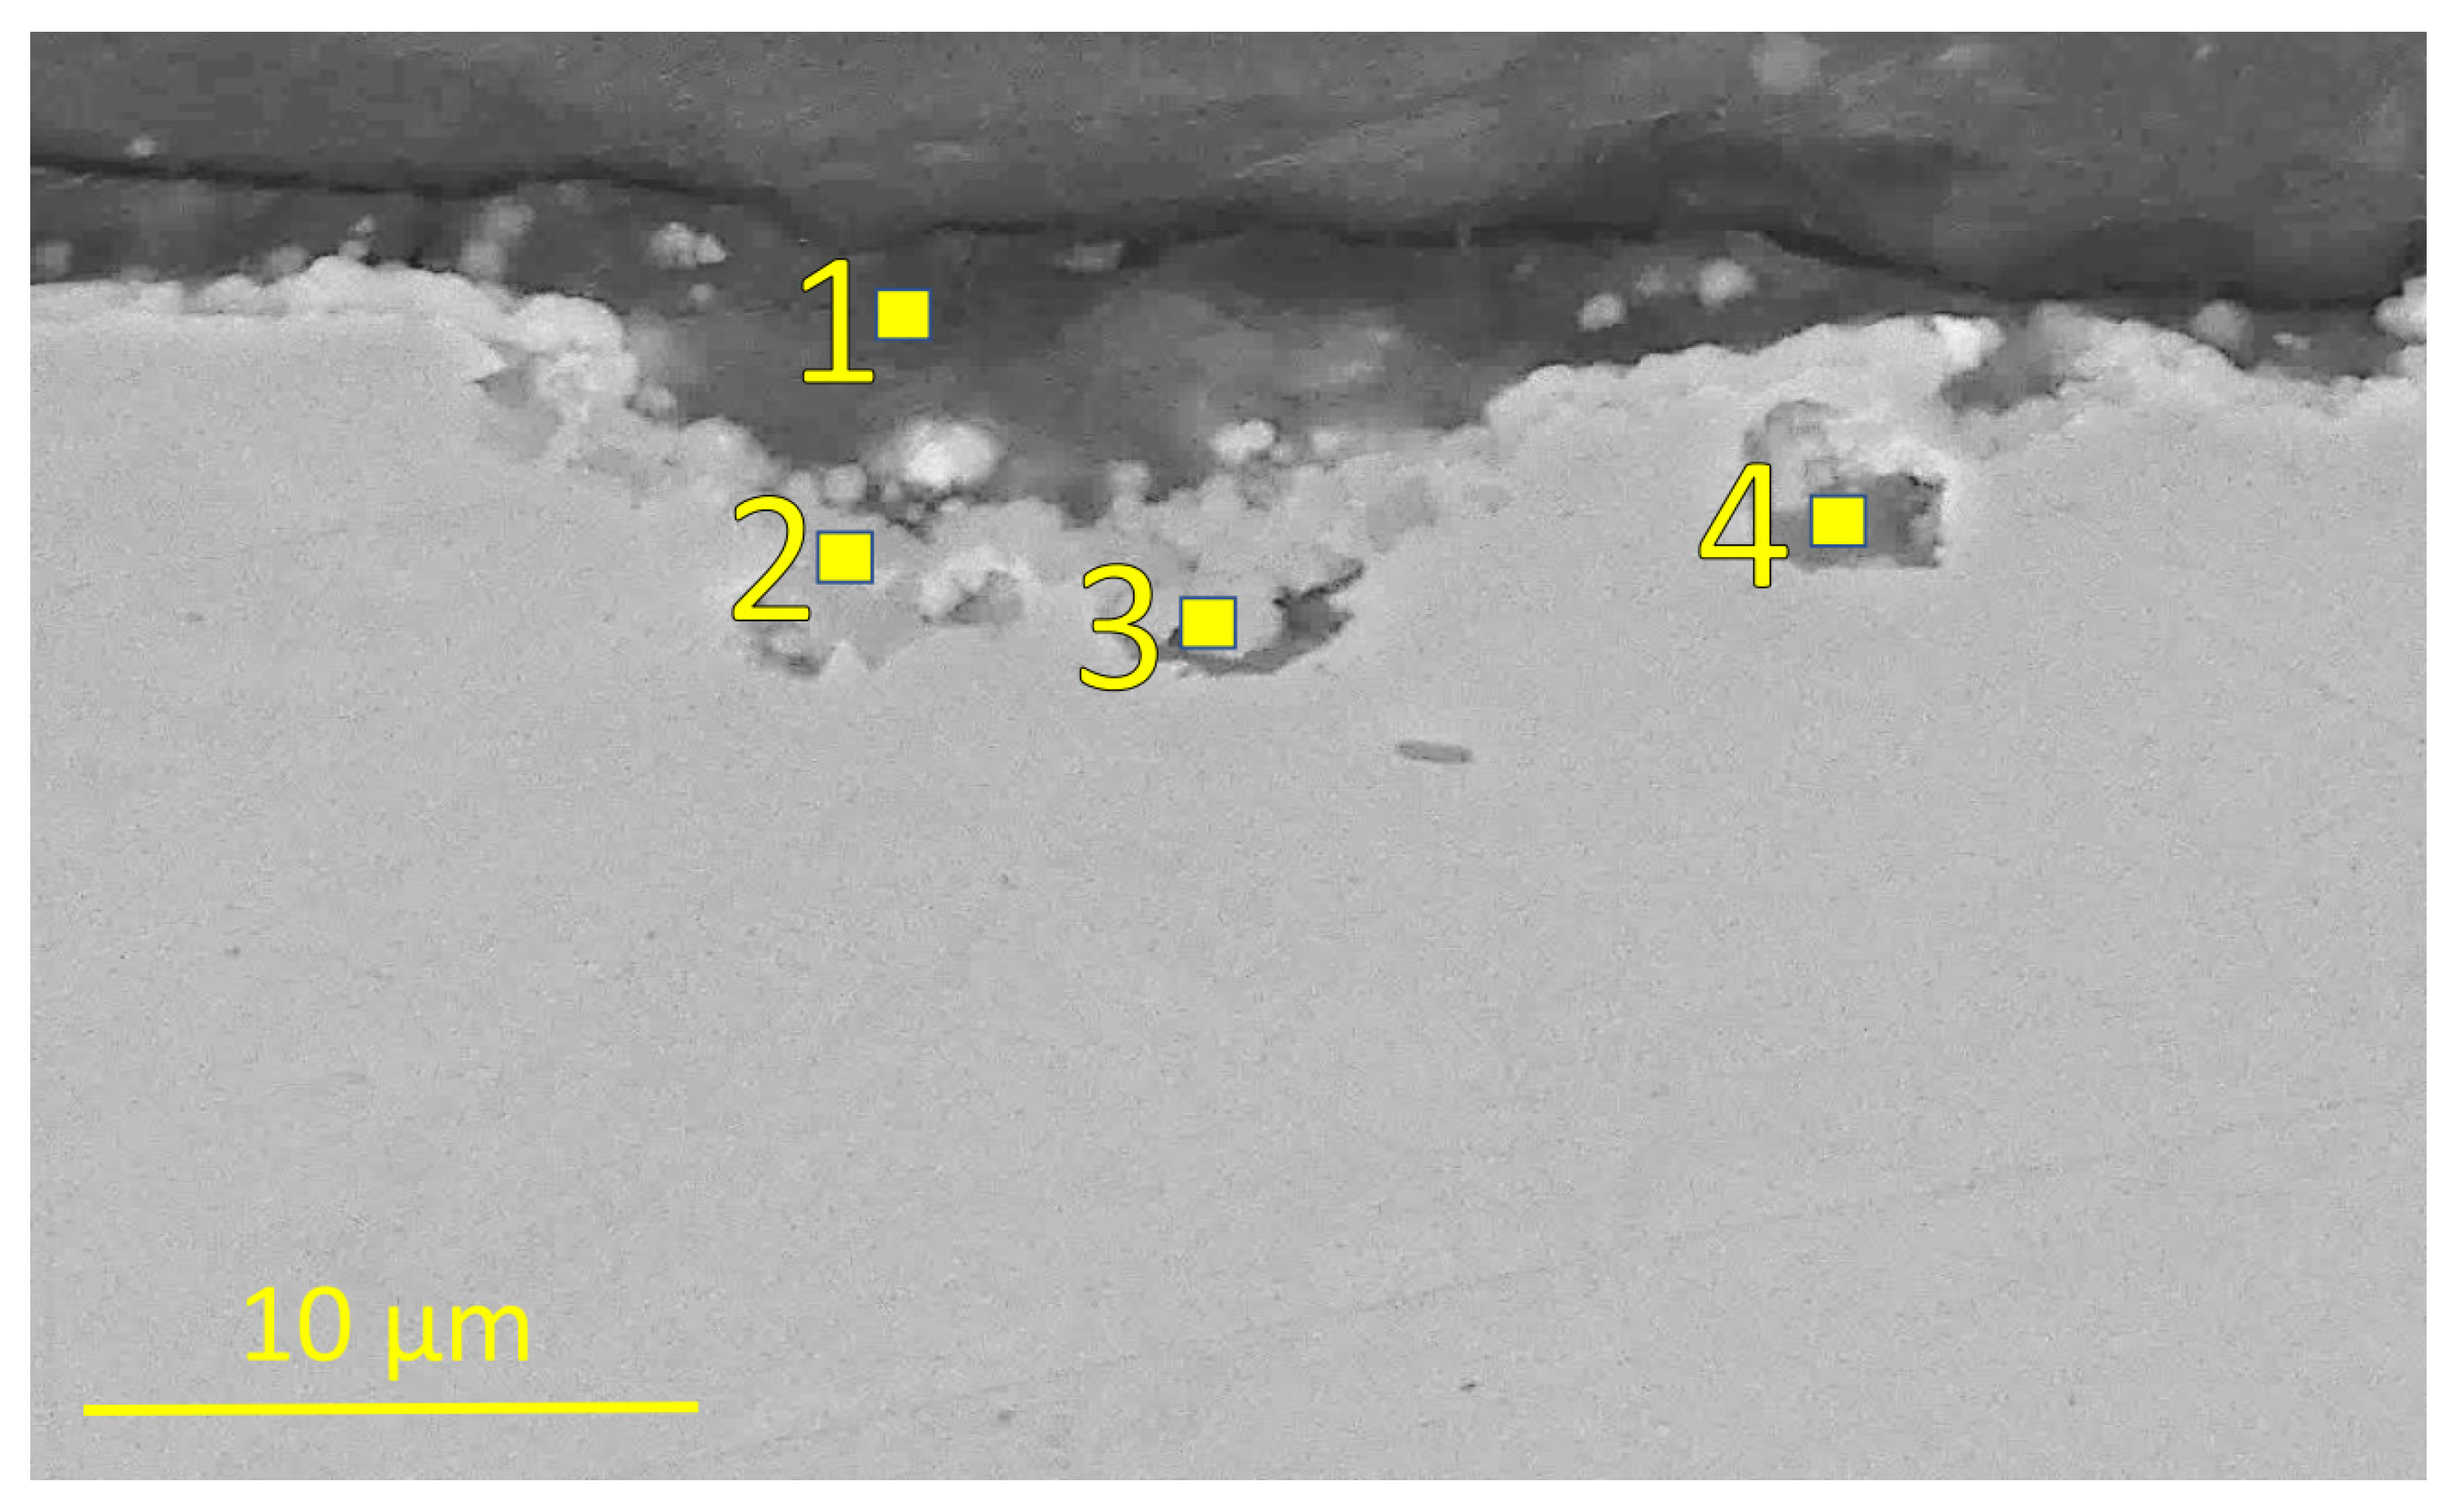
Further into the testing volume or 3 cm from the inlet of the first reactor, the form of the corrosion products changed to a more consistent or homogeneous texture, i.e., chloride rich pits under oxide film were observed more consistently than in the first 1 to 2 cm of sample 1 as can be seen in
Figure 8.
These findings might indicate that the transition from acidic aqueous solution to vapour phase fluid occurred at the first few centimetres of sample 1. The corrosion of carbon steel in an acidic H
2S environment at low and high temperatures showed that the carbon steel was prone to general and localized corrosion damage with an inner magnetite (Fe
3O
4) layer and outer iron sulphide layer in the corrosion film as reported by Gao et al. [
30,
31,
32] in an aqueous environment. A study by Choi et al. showed that H
2S can have an inhibiting effect on the corrosion of carbon steel in an acidic CO
2/H
2S environment at 25 °C [
33], and Mursalov addressed the multifactor dependence and complexity of corrosion of H
2S in an acidic environment [
34]. The lack of an observed sulphide layer in our testing in the first few centimetres of carbon-steel sample 1 might have been due to the very high acidity of the testing fluid, which dissolved the sulphide layer, or to the high concentration of sodium chloride deposits on the corrosion samples that prevented sulphide formation by forming a mass transfer barrier at the surface when the testing fluid boiled in the first few centimetres of the first reactor. Furthermore, the kinetics of iron sulphide layer formation is slow in comparison to those of magnetite formation as concluded by Gao et al. [
31]. In the sulphide layer formation process, magnetite layer forms first and iron sulphide then forms gradually in an acidic H
2S environment at 120 °C. The lack of sulphide film in the first few centimetres of sample 1 could, therefore, have been due to the synergistic effect of slow sulphide-formation kinetics, or to the effect of an enriched concentration of corrosive species and salt deposits on the surface due to boiling of the testing fluid in the first few centimetres of sample 1. The stability of iron sulphide layers, summarized by Gao et al. [
31], showed that the stability of the sulphides was reduced significantly below pH = 4 and was dependent on the reduction potential of the environment. In light of our testing results, low pH = 3 in our testing environment, and the lack of an iron sulphide layer in the corrosion product film, it was likely that the iron sulphide(s) corrosion products were not stable in the aqueous testing environment in the first few centimetres in the first reactor. A low concentration of sodium chloride was, however, detected in the corrosion products in the first few centimetres of sample 1. It likely occurred after the testing period because of the flushing of deionized water through the testing volume after the testing period (to prevent acidic condensation at high temperatures) and before the samples were removed from the reactor. The sodium chloride deposited due to boiling likely dissolved in the flushing water after the testing period and was flushed away with the deionized water through the testing volume at the end of the experiment. The loss of material and the lack of corrosion film on the surface in the first few centimetres of sample 1 indicated that the acidic aqueous solution at high temperature caused the removal of the corrosion products at a rapid rate. The results also indicate that, further into the first reactor, the fluid became less corrosive and the corrosion behaviour trended towards a more localized corrosion attack, as observed in previous study by Thorhallsson et al., for materials tested in superheated conditions [
15]. The corrosion behaviour observed for carbon-steel sample 5 in the second reactor resembled the corrosion behaviour observed for sample 1 after the first few centimetres. The exception was that less chloride was detected in the pits in sample 5 in the second reactor and in sample 8 in middle of the third reactor, as seen in
Figure 9,
Table 9 and
Figure 10 and
Table 10, respectively.
This might also have indicated that the less non-volatile NaCl by-products were transported further into the testing volume. The corrosion products in the superheated testing volume (second reactor) did have a small concentration of sulphide corrosion products or a sulphide-rich layer which Thorhallsson et al. saw to a greater extent in the previous test [
15]. This difference in the extent of sulphide formation could have been attributed to a shorter test period of the carbon steel, i.e., three days of testing in this study compared to 10 days in the previous testing. This observed difference in corrosion behaviour might indicate that the formation of the sulphide layer is a slow process in the superheated fluid containing H
2S.
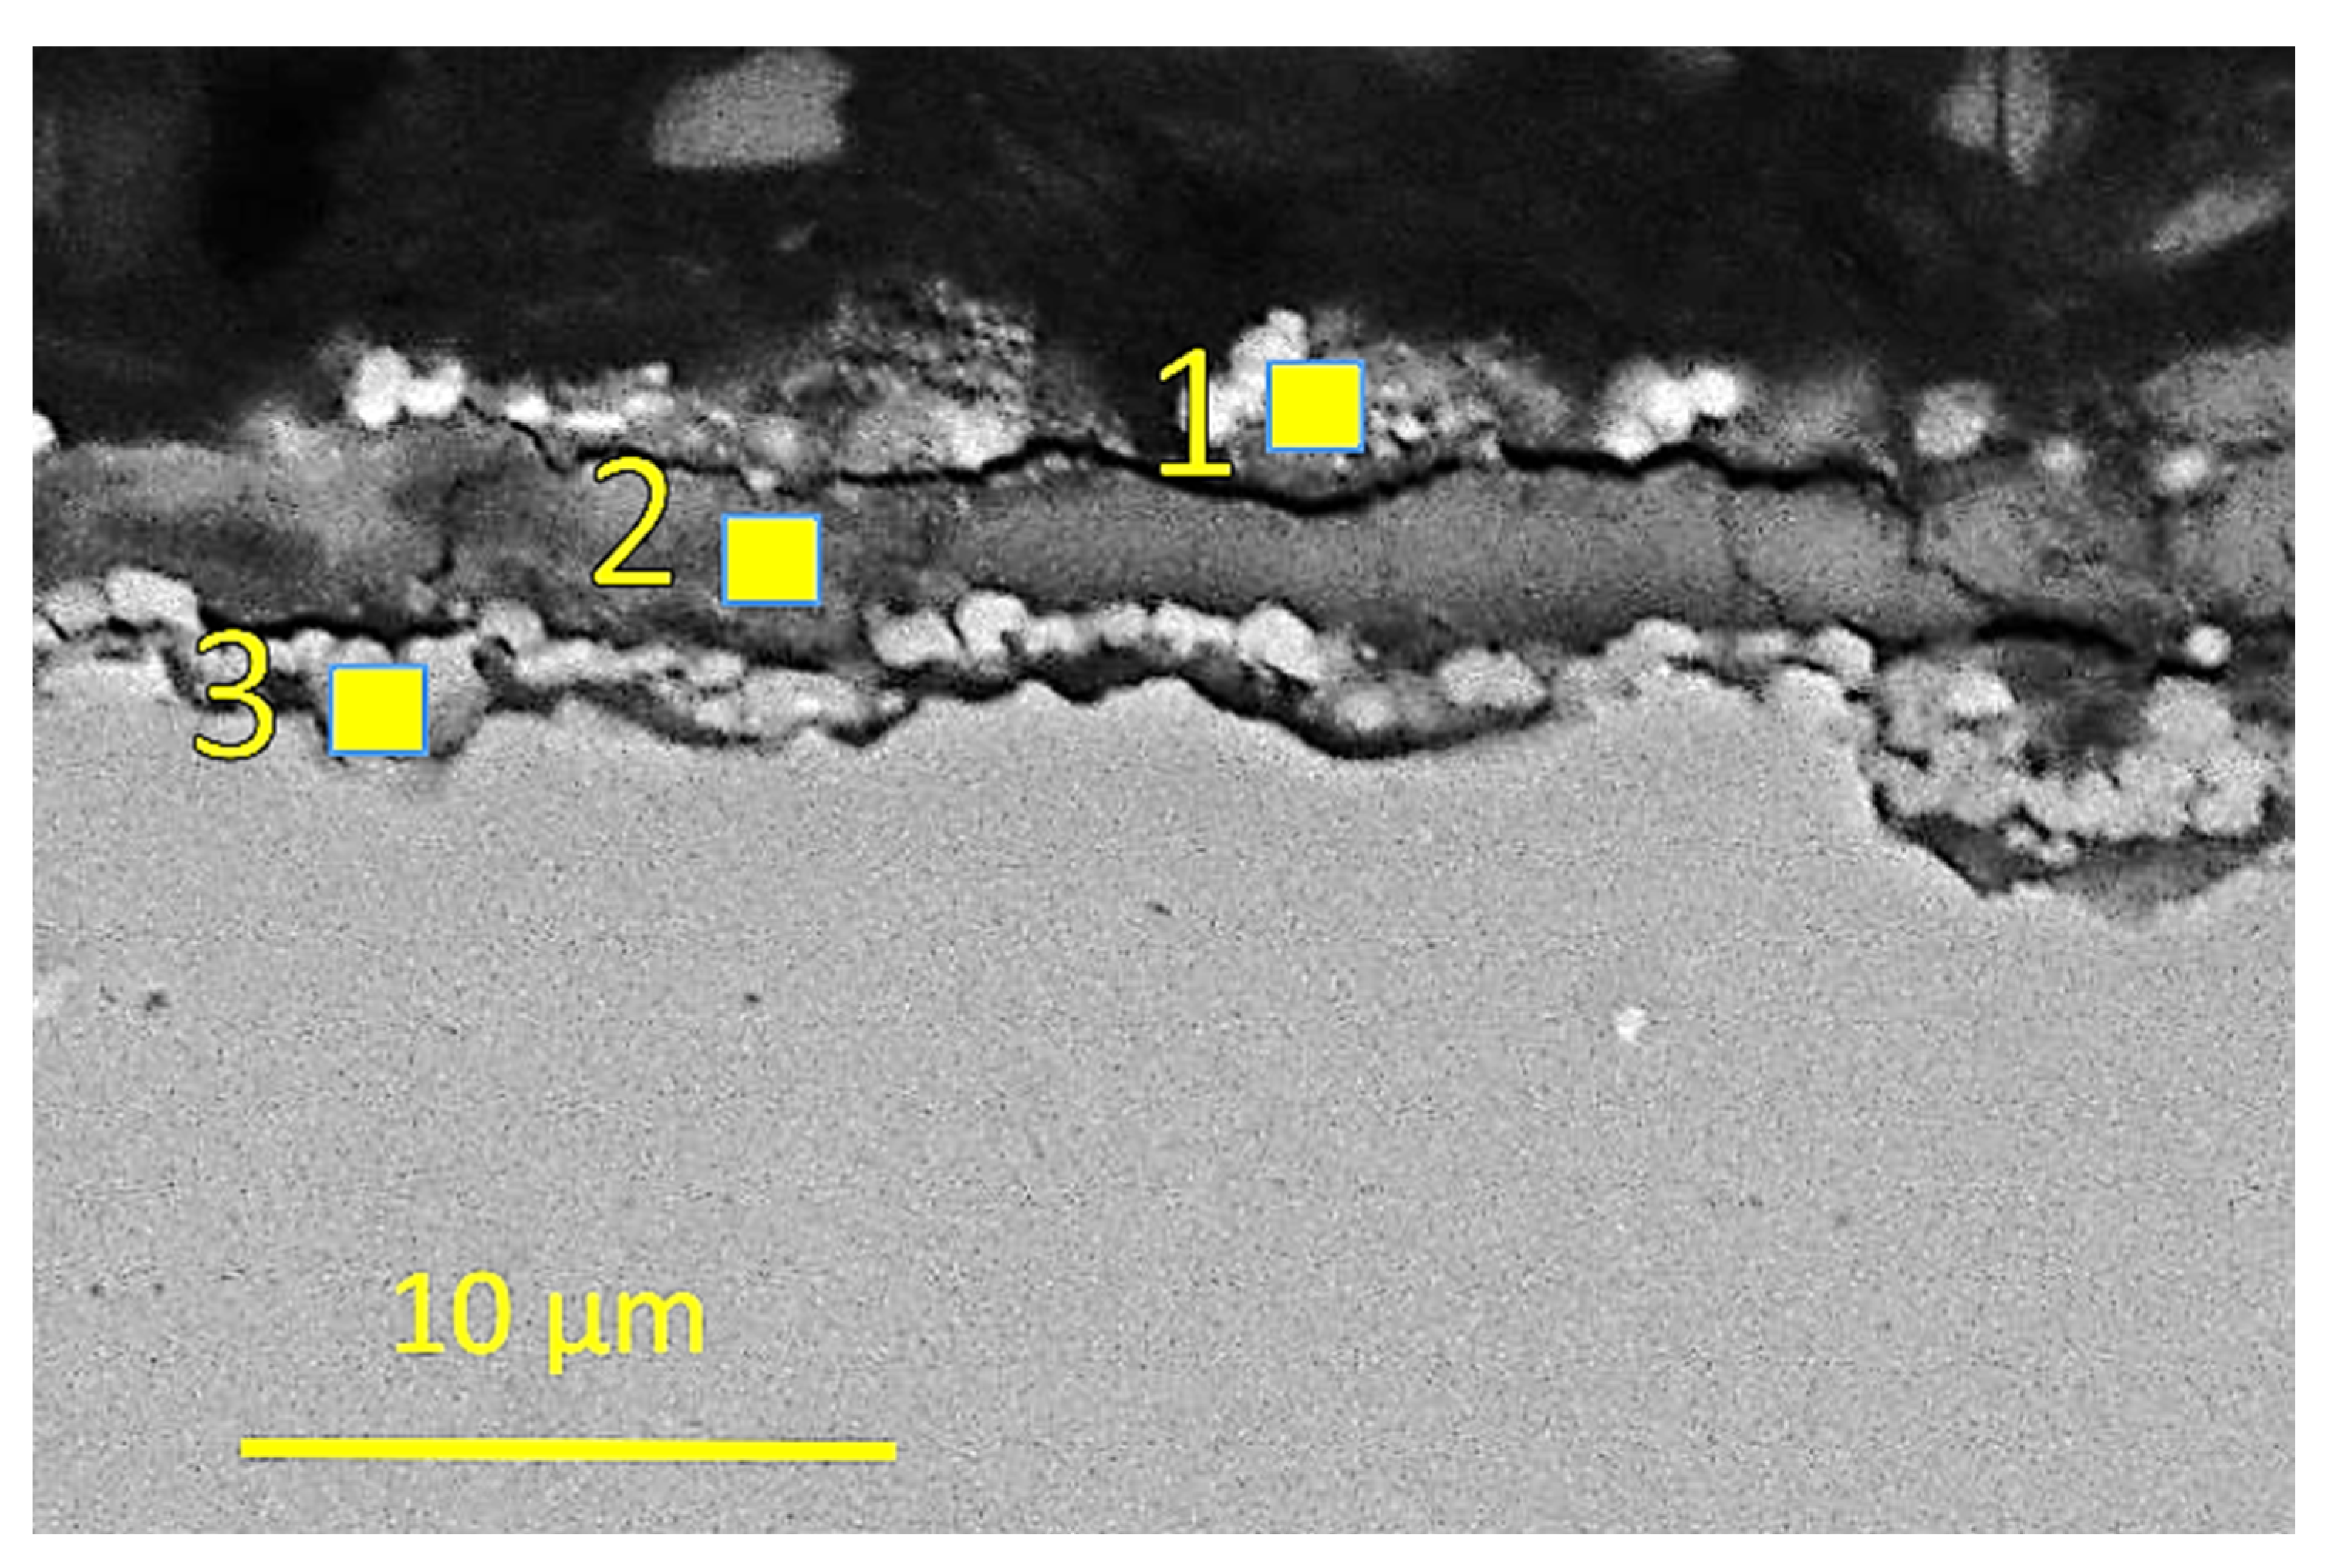
The corrosion behaviour of the carbon steel started to change again in the last sample in the third reactor where the set temperature was 180 °C. The corrosion in sample 9, three centimetres from the outlet, had a corrosion film with multiple layers. In comparison with samples 2–8, some sulphur was detected in the corrosion layers of sample 9, three centimetres from the outlet as seen in
Figure 11 and
Table 11.
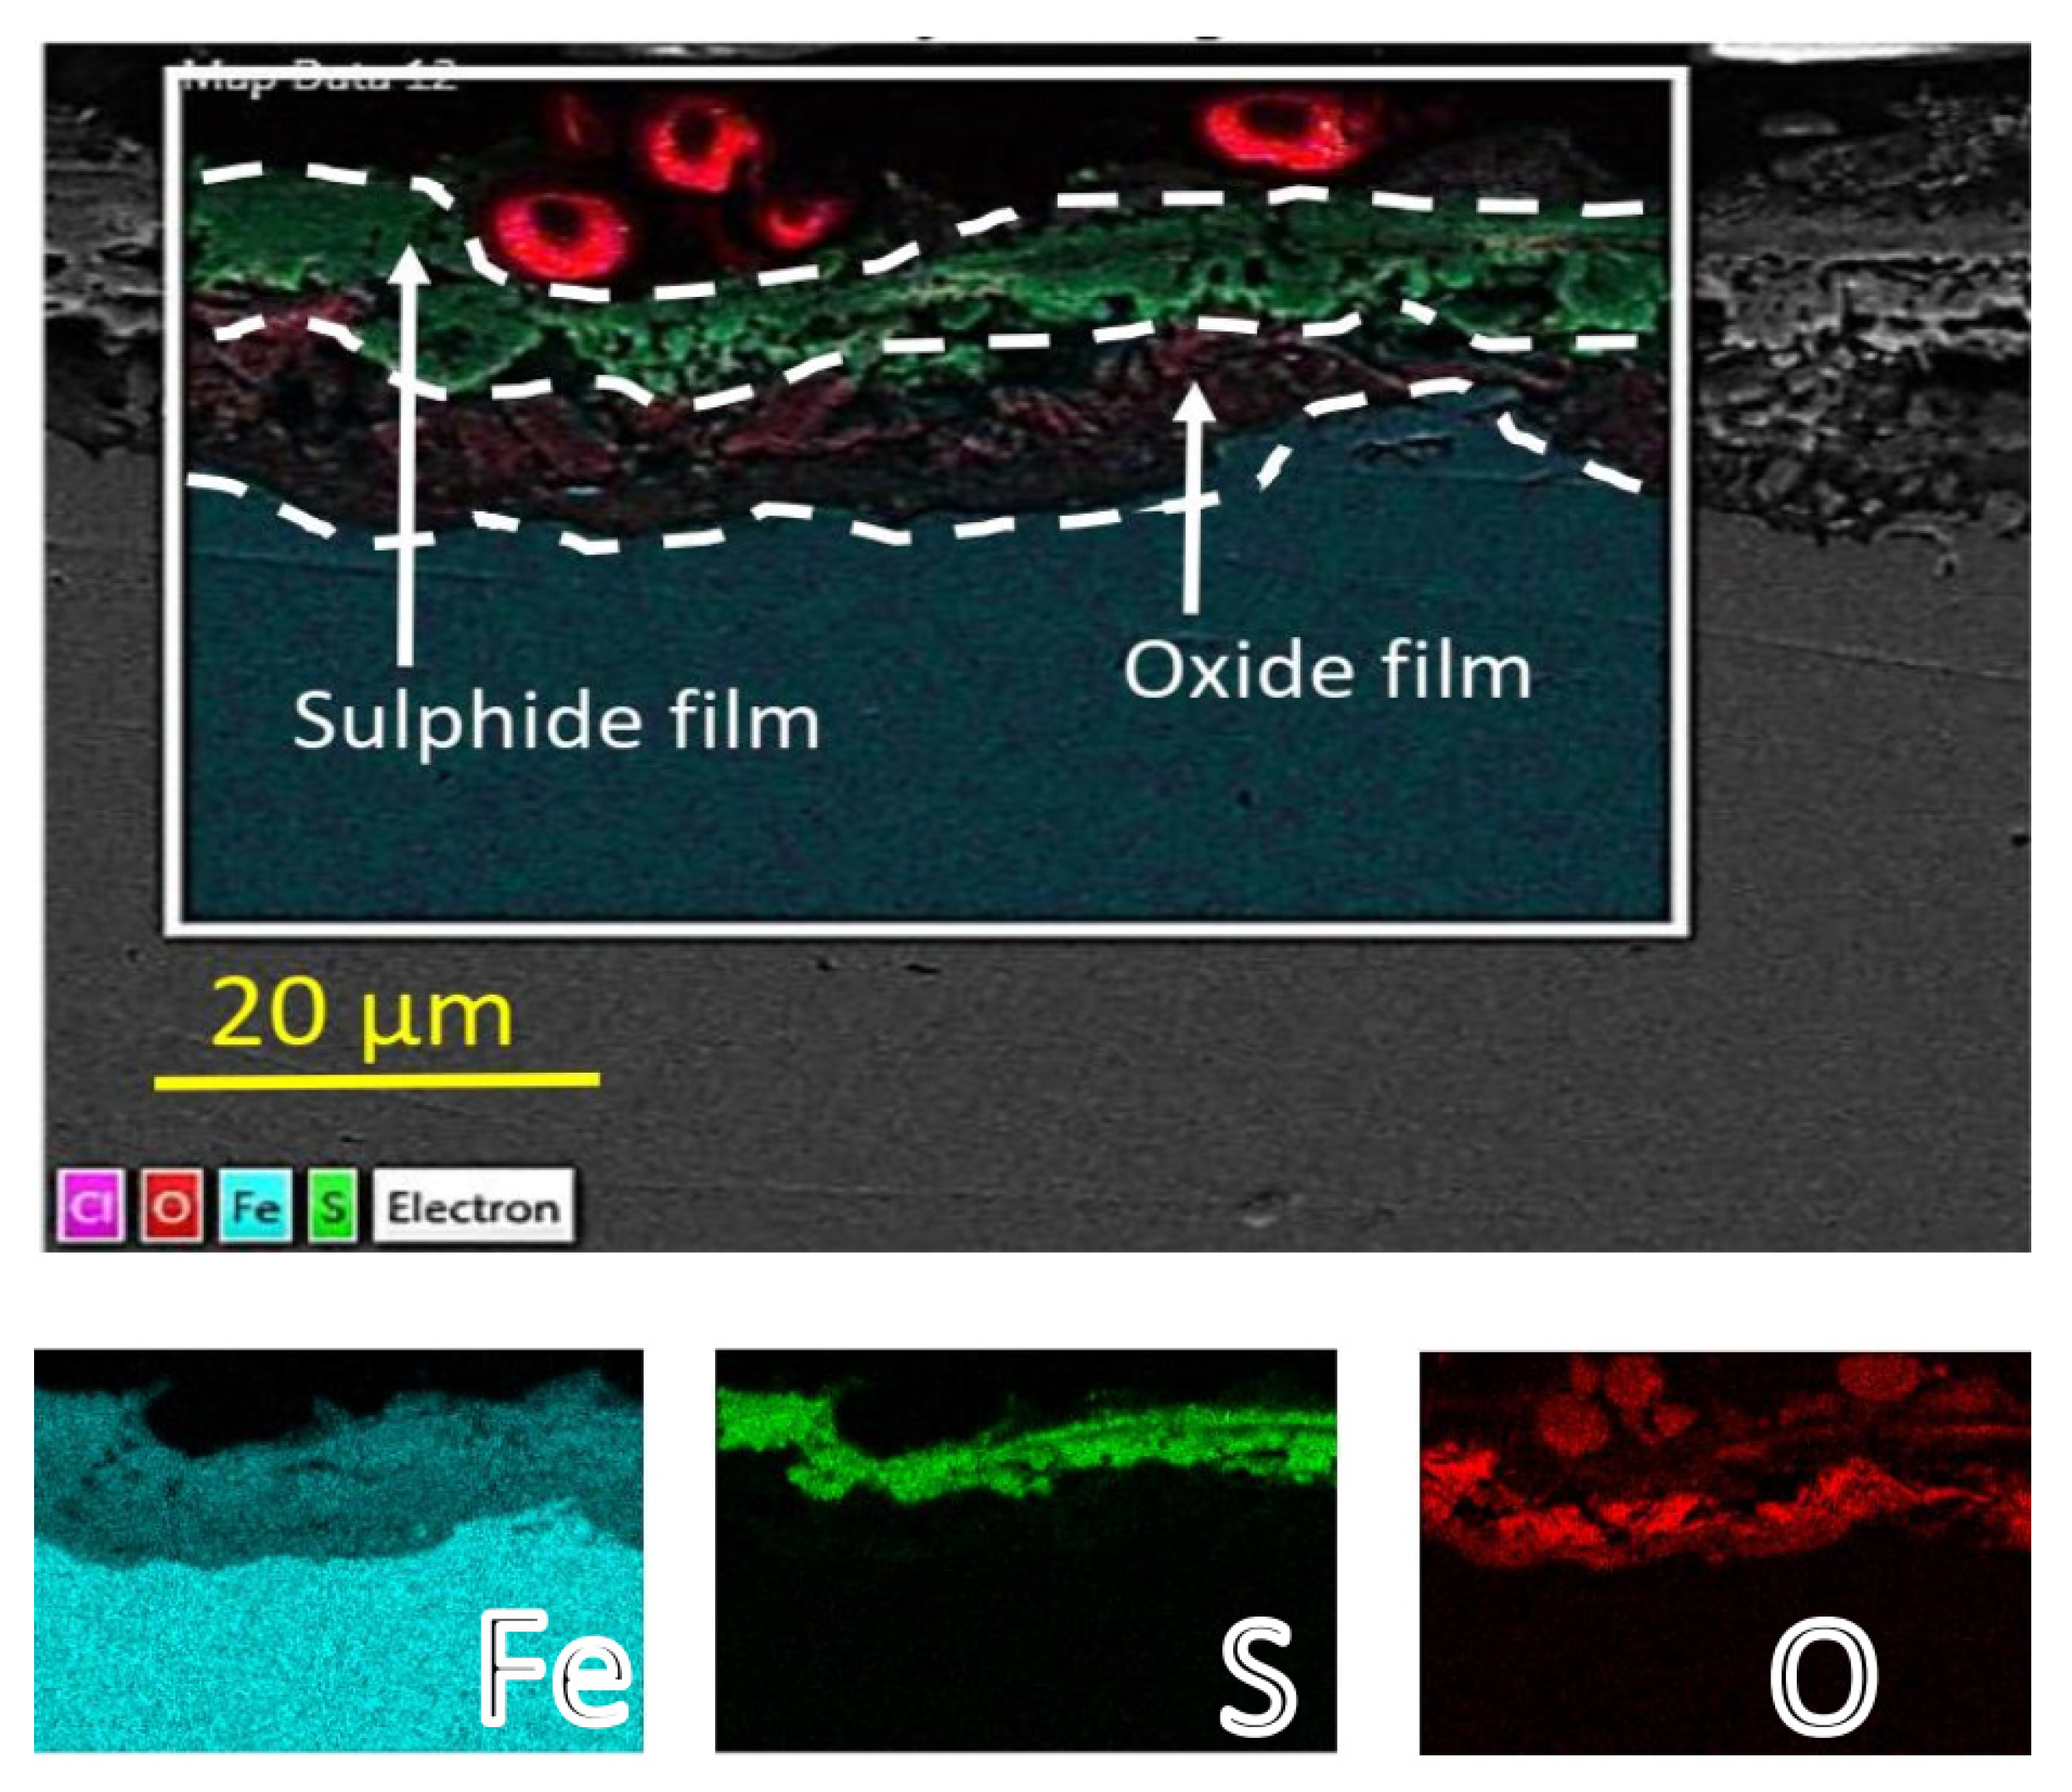
The transition to multiple-layer corrosion film behaviour became more apparent in the last centimetre of sample 9 in the third reactor. A sulphide-rich outer layer and an oxygen-rich sublayer formed, which was in an agreement with other study results of H
2S corrosion of carbon steel in an aqueous environment at high temperatures [
30,
31] (See
Figure 12).
The difference between the corrosion products observed on the carbon steel in the first few centimetres of sample 1 in the first reactor (where the boiling of the testing fluid likely occurred) and those of sample 9 in the last reactor (where condensation of the testing fluid occurred) could be due to different pH conditions and the concentration of the corrosive species (HCl, H2S and CO2) in the testing fluid. The effect of the deposited NaCl by-product in the boiling and NaCl enrichment in the testing fluid in the first few centimetres of the first reactor was also another factor that likely affected the corrosion mechanism, which led to different corrosion behaviour in the testing volume, where boiling and condensation presumably occurred.
The same test setup was applied to testing the titanium-alloy samples. The appearance of the cross-section of the titanium-alloy samples after testing indicated that no corrosion damage was experienced as seen in
Figure 13.
Microstructural and chemical analysis in the SEM with XEDS confirmed the optical microscopy result: no corrosion damage was observed in any of the titanium-based samples tested. Some sulphur deposits were analysed on the surface of the samples and some corrosion products from the washers and the fastener/tubing in the testing equipment, but no indication of localized corrosion damage or general corrosion was observed. A denser oxide layer was observed in sample 5 in the superheated testing volume, indicating that the kinetics of TiO
2 film growth on the surface could be a temperature-dependent mechanism even though the titanium oxide growth rate was constant at high temperatures as reported by Kumagai et al. [
35]. Microstructural and elemental analysis of both surface and the cross-section of the titanium alloy samples can be seen in
Figure 14 (with
Table 12),
Figure 15 (with
Table 13),
Figure 16 (with
Table 14) and
Figure 17. Titanium and titanium alloys are known to perform well in various corrosive environments [
36,
37], which is consistent with results observed in this study.
3.2. Weight Loss Analysis
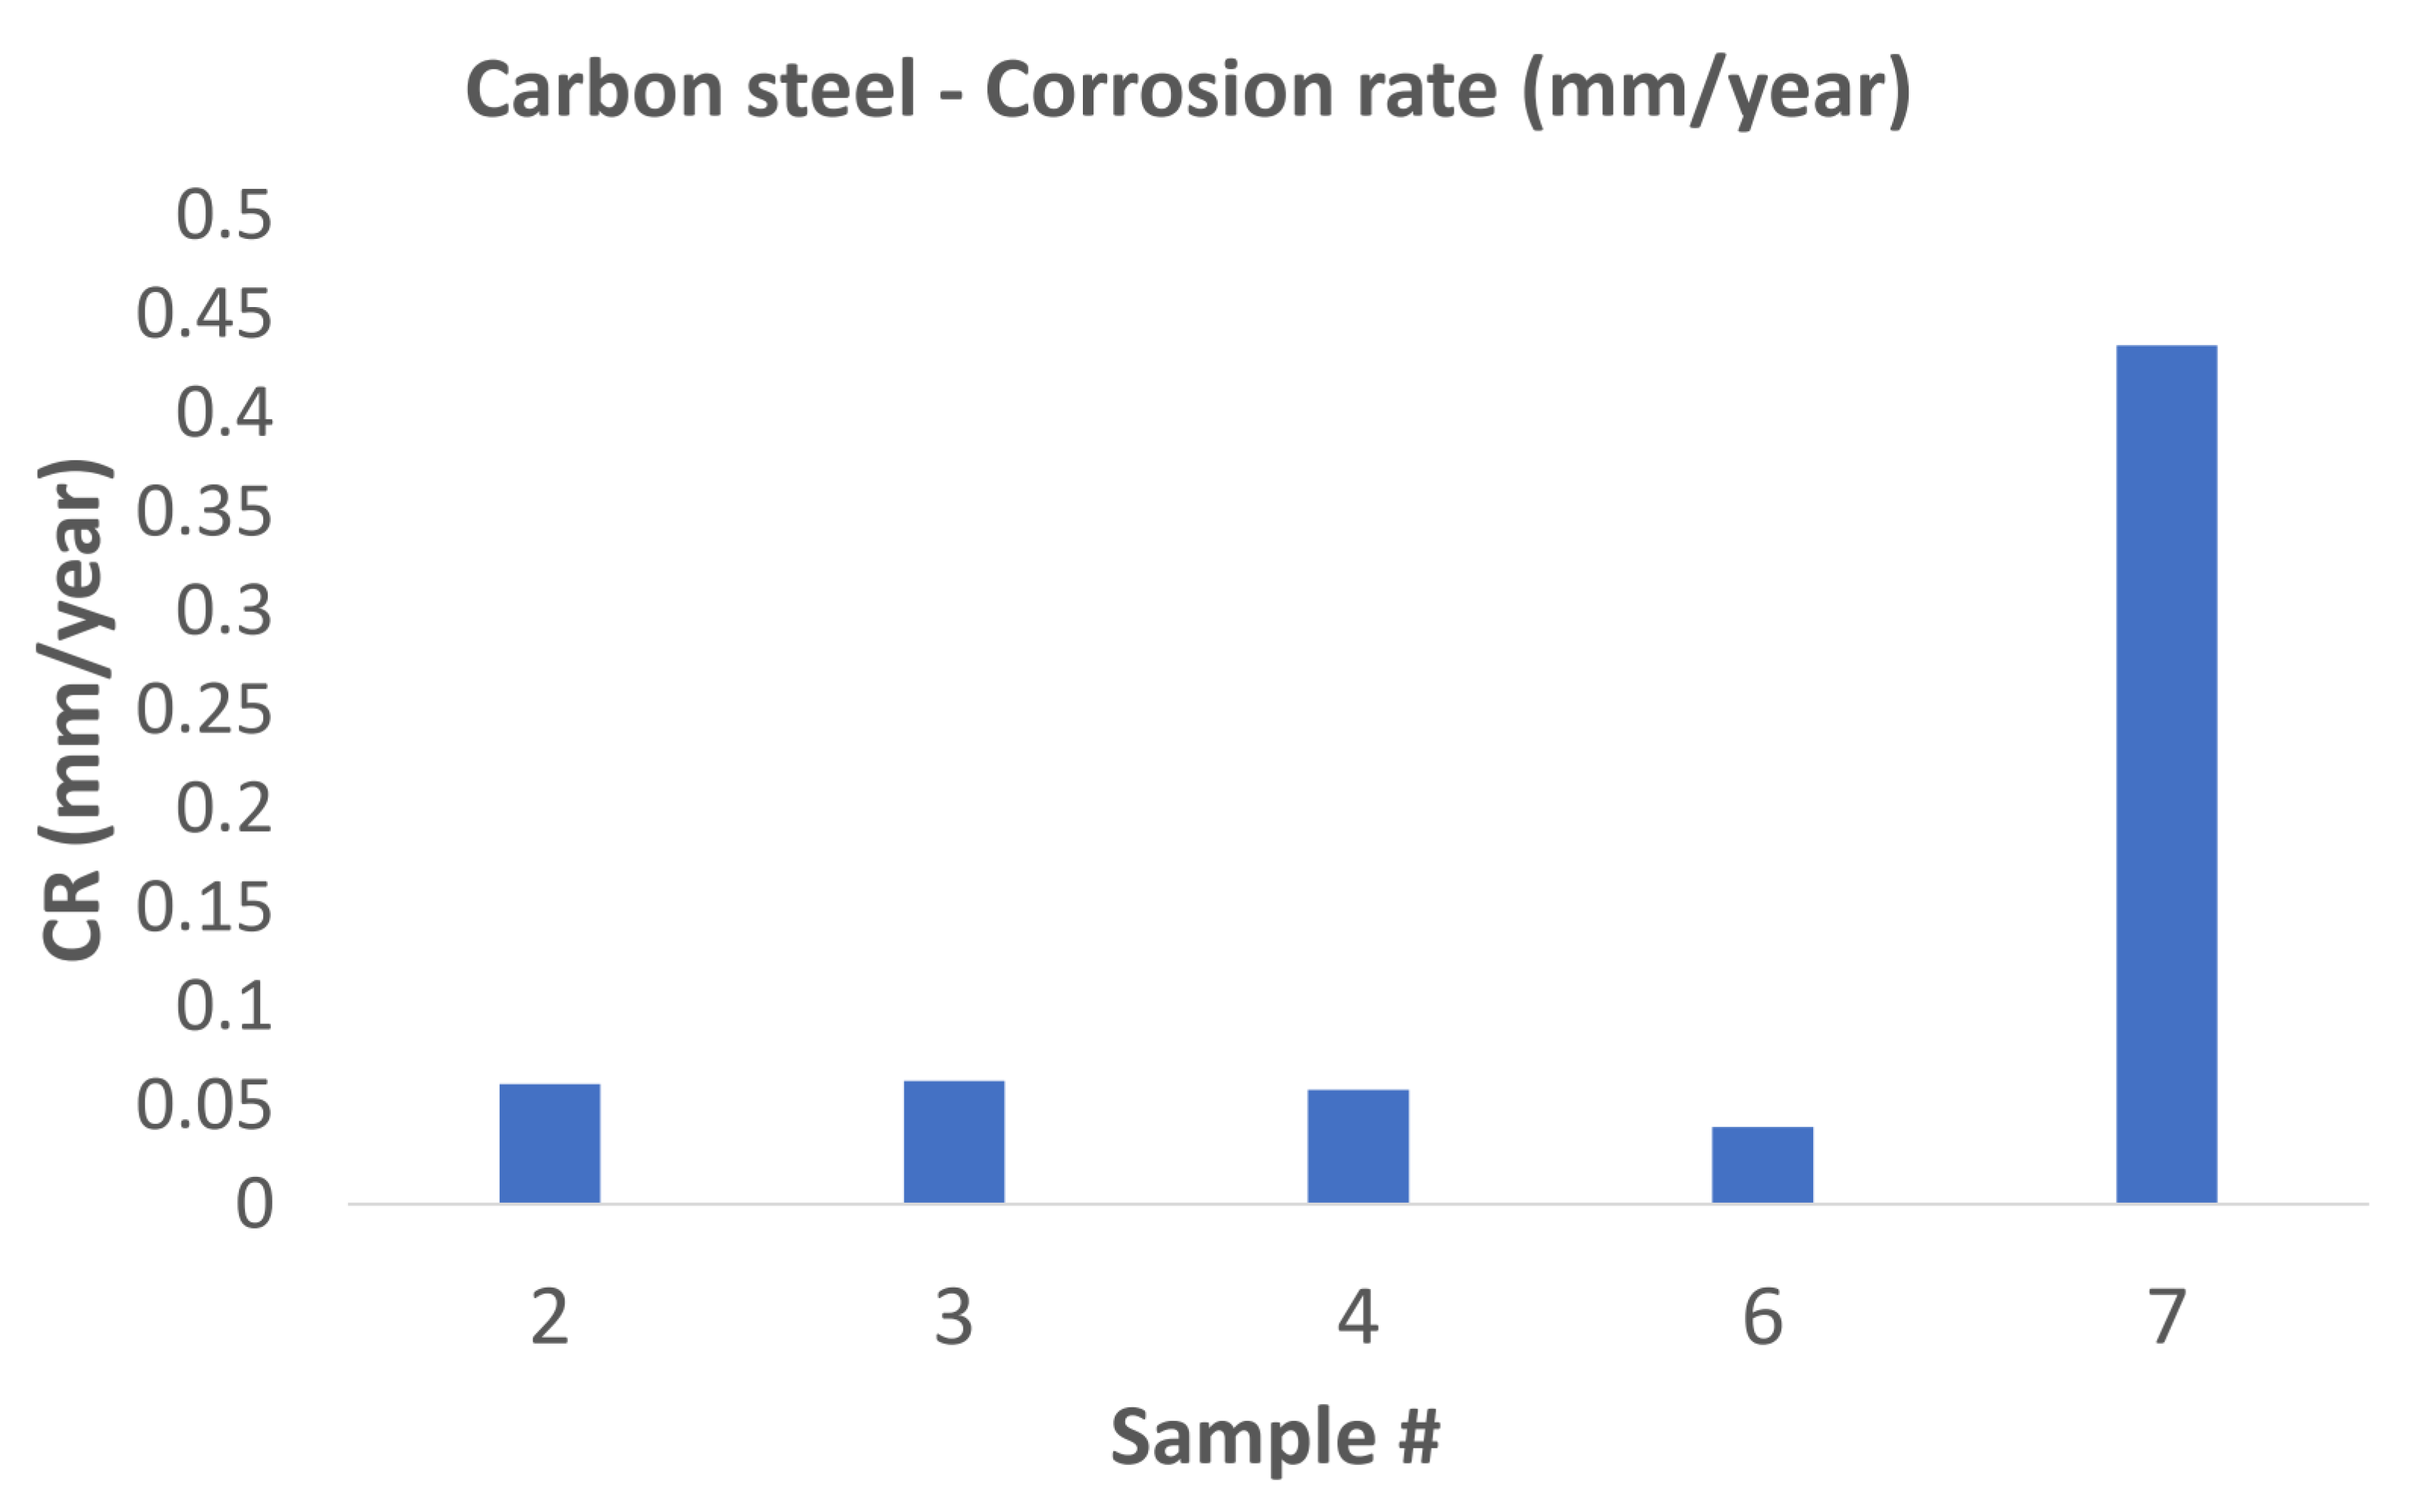
Samples 2, 3, 4, 6, and 7 were used for weight-loss analysis for the tested carbon-steel material. The weight loss, and hence the calculated corrosion rate in the samples accommodated in the first and second reactors, had a corrosion rate of the same order of magnitude as the carbon steel tested in a superheated environment in a study by Thorhallsson et al. [
15]. The first sample in the third reactor had a corrosion rate an order of magnitude higher than all other weight loss samples in the first and second reactor as can be seen in
Figure 18. The increased corrosion rate of sample 7 in the third reactor might indicate that condensation of the testing fluid started at the inlet of the 3rd reactor, resulting in rapid electrochemical corrosion.
As described earlier, the titanium-alloy samples were only cleaned by ethanol in an ultrasonic bath due to the extremely adherent titanium oxide film that formed. Samples 2 and 3 in the first reactor, sample 4 and 6 in the second reactor and samples 7 and 8 in the third reactor were used for weight-loss analysis. Only a negligible weight gain was observed for all the titanium samples except for sample 8, which had a weight loss of 0.001 mm/year, which was insignificant. The weight gain of titanium alloys, however, was well known due to the growth of the titanium dioxide film during exposure.
3.3. XRD Analysis
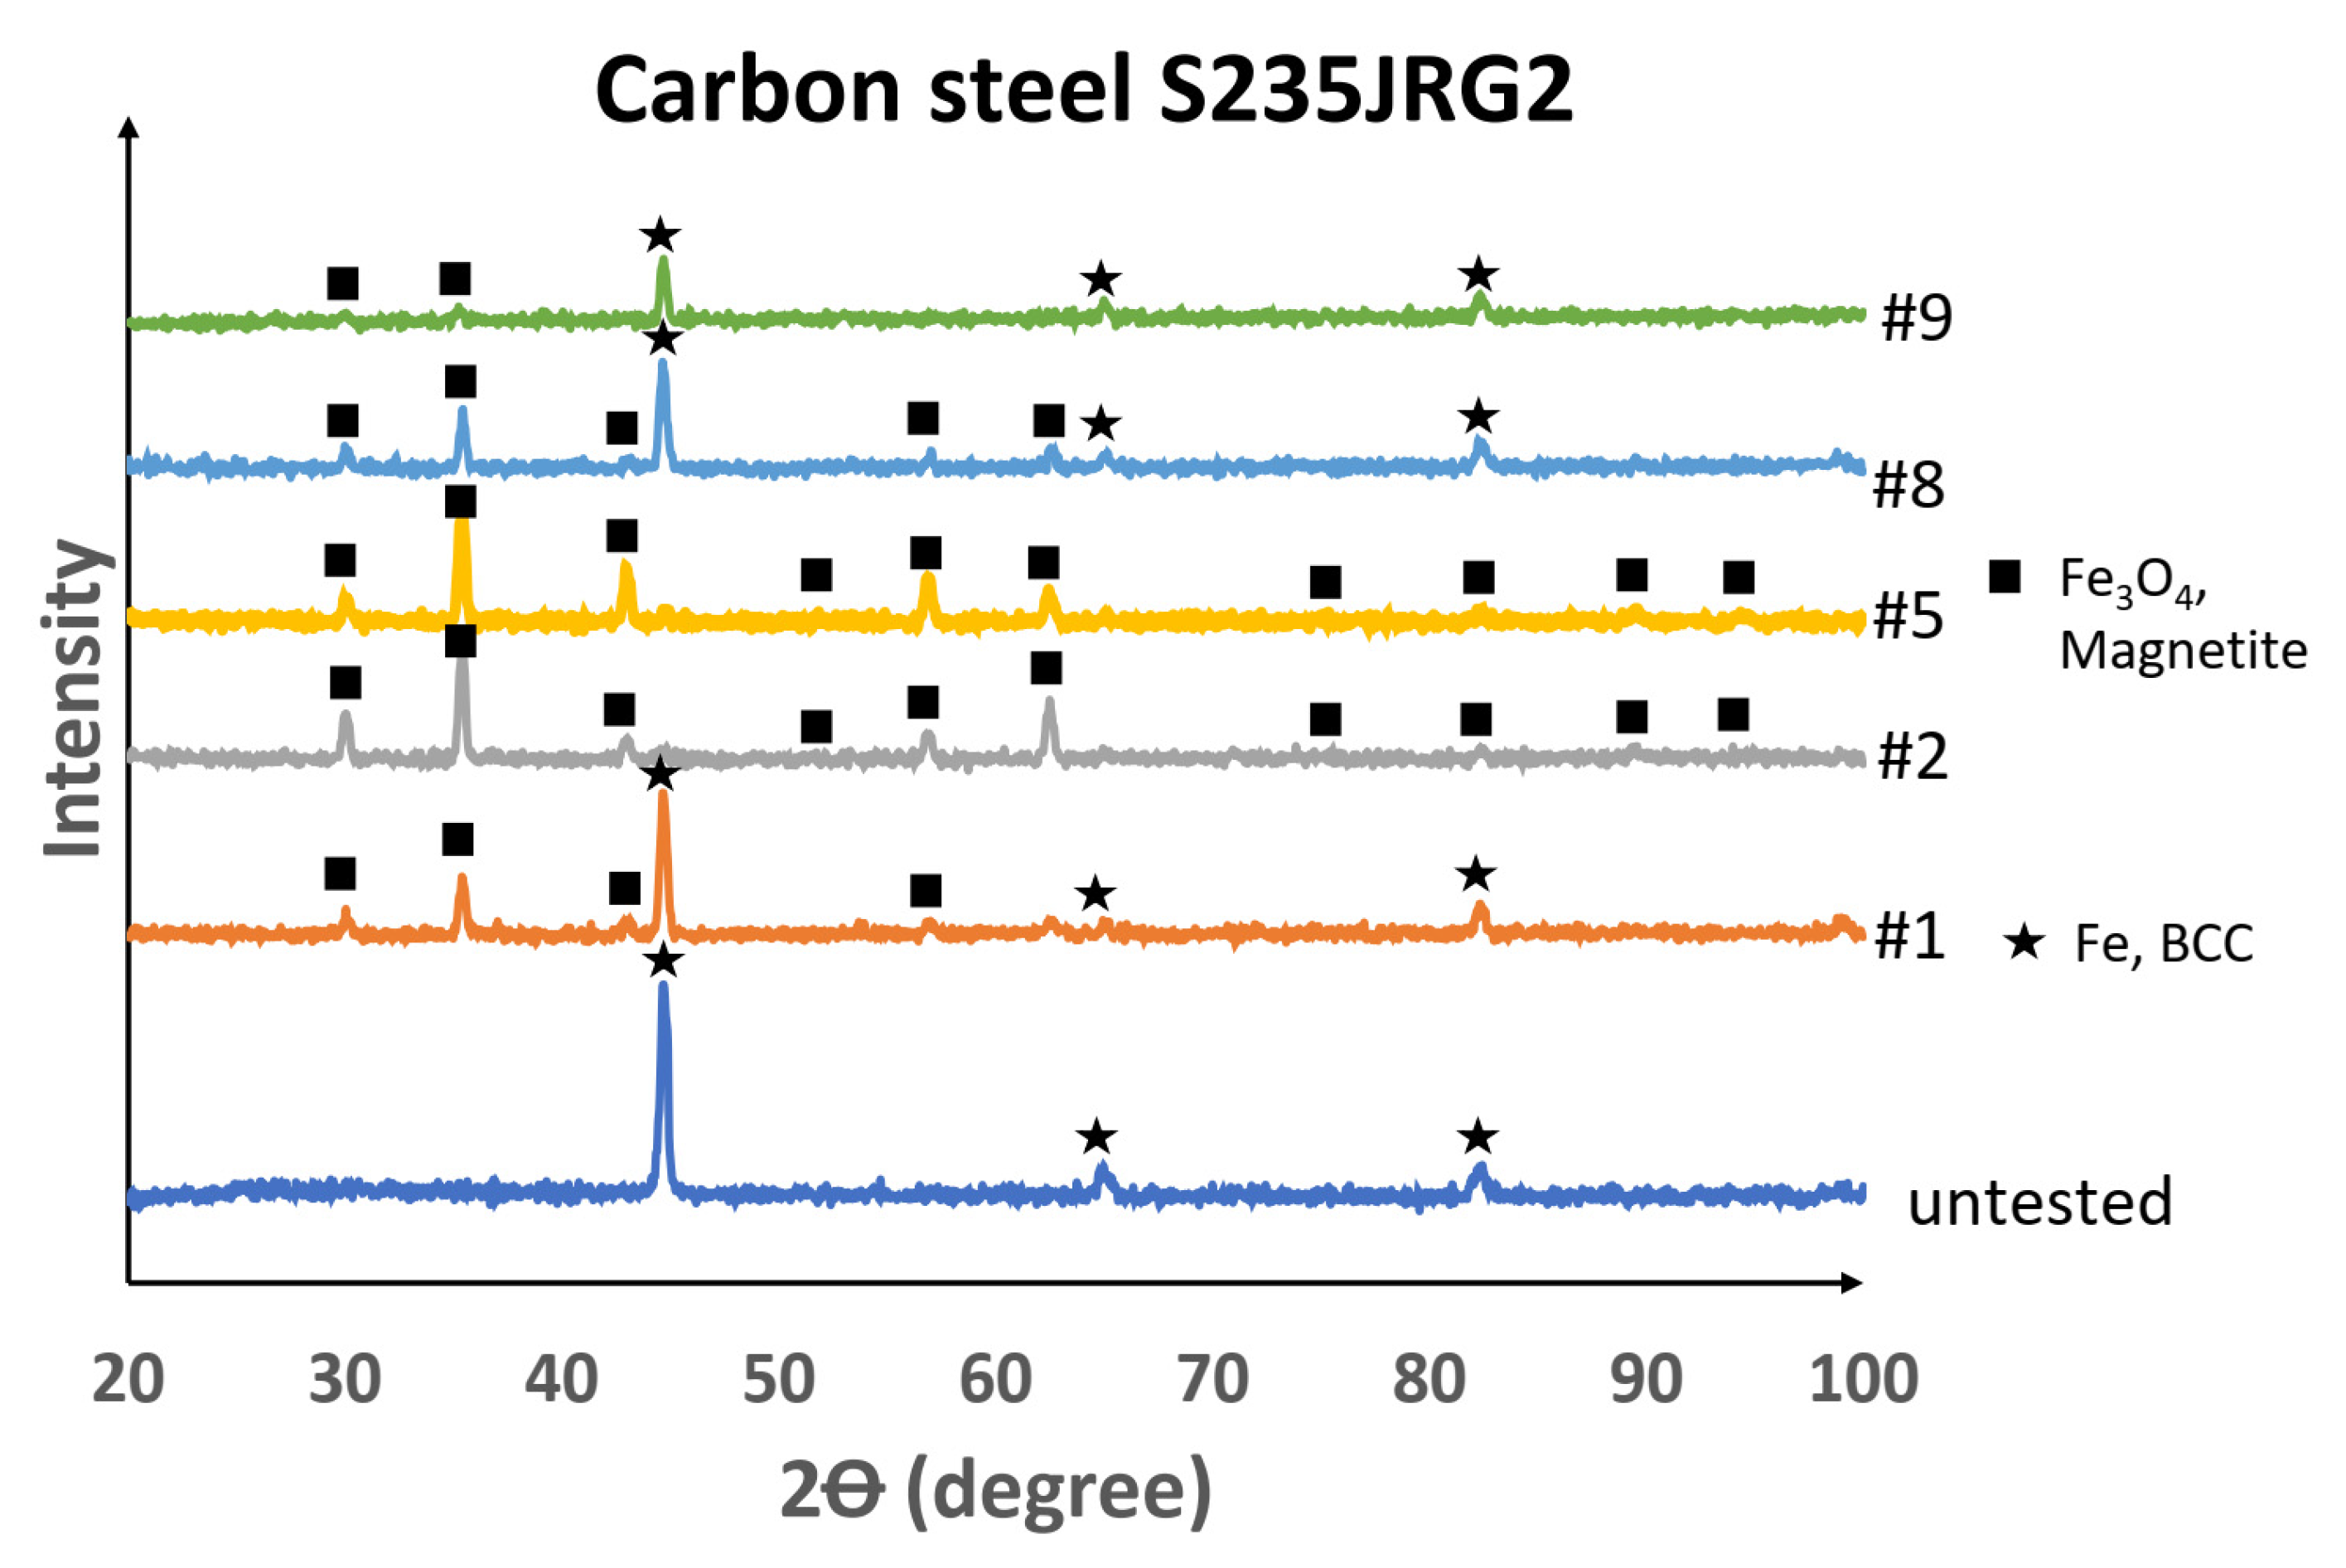
It was necessary to evaluate the XRD results of the untested and corrosion-tested carbon steel in connection with the state of the fluid and with the SEM and XEDS results, which showed that the liquid state or condensation of the testing fluid occurred at the inlet of the first reactor (sample 1) and in all the volume of the third reactor (sample 9). From the XRD pattern of the surface of sample 1, the crystalline phases detected were the body-centred cubic (BCC) system with iron (Fe) and the cubic crystal system with iron oxide in the form of magnetite (Fe
3O
4). The samples in the proposed superheated testing volume, samples 2–5, had magnetite detected on the surface, but in sample 8 the transition from magnetite as a surface covering to an exposed BCC–Fe bulk material likely occurred. Sample 9 then had peaks of BCC–Fe crystal structure identified. From the Pourbaix diagram of iron at high temperatures [
38], it was concluded that magnetite is not stable or present in an acidic (pH < 4) aqueous solution. Since the peaks for magnetite were not present in the XRD pattern for samples 1 and 9, it further strengthened the conclusion that acidic, aqueous conditions were present in the testing volume where sample 1 and sample 9 were located. Weak magnetite scattering from sample 8 indicated that the extent of acidic condensation (condensate) was likely less on sample 8 in comparison with sample 9. The XRD patterns of the untested and tested carbon-steel samples are shown in
Figure 19.
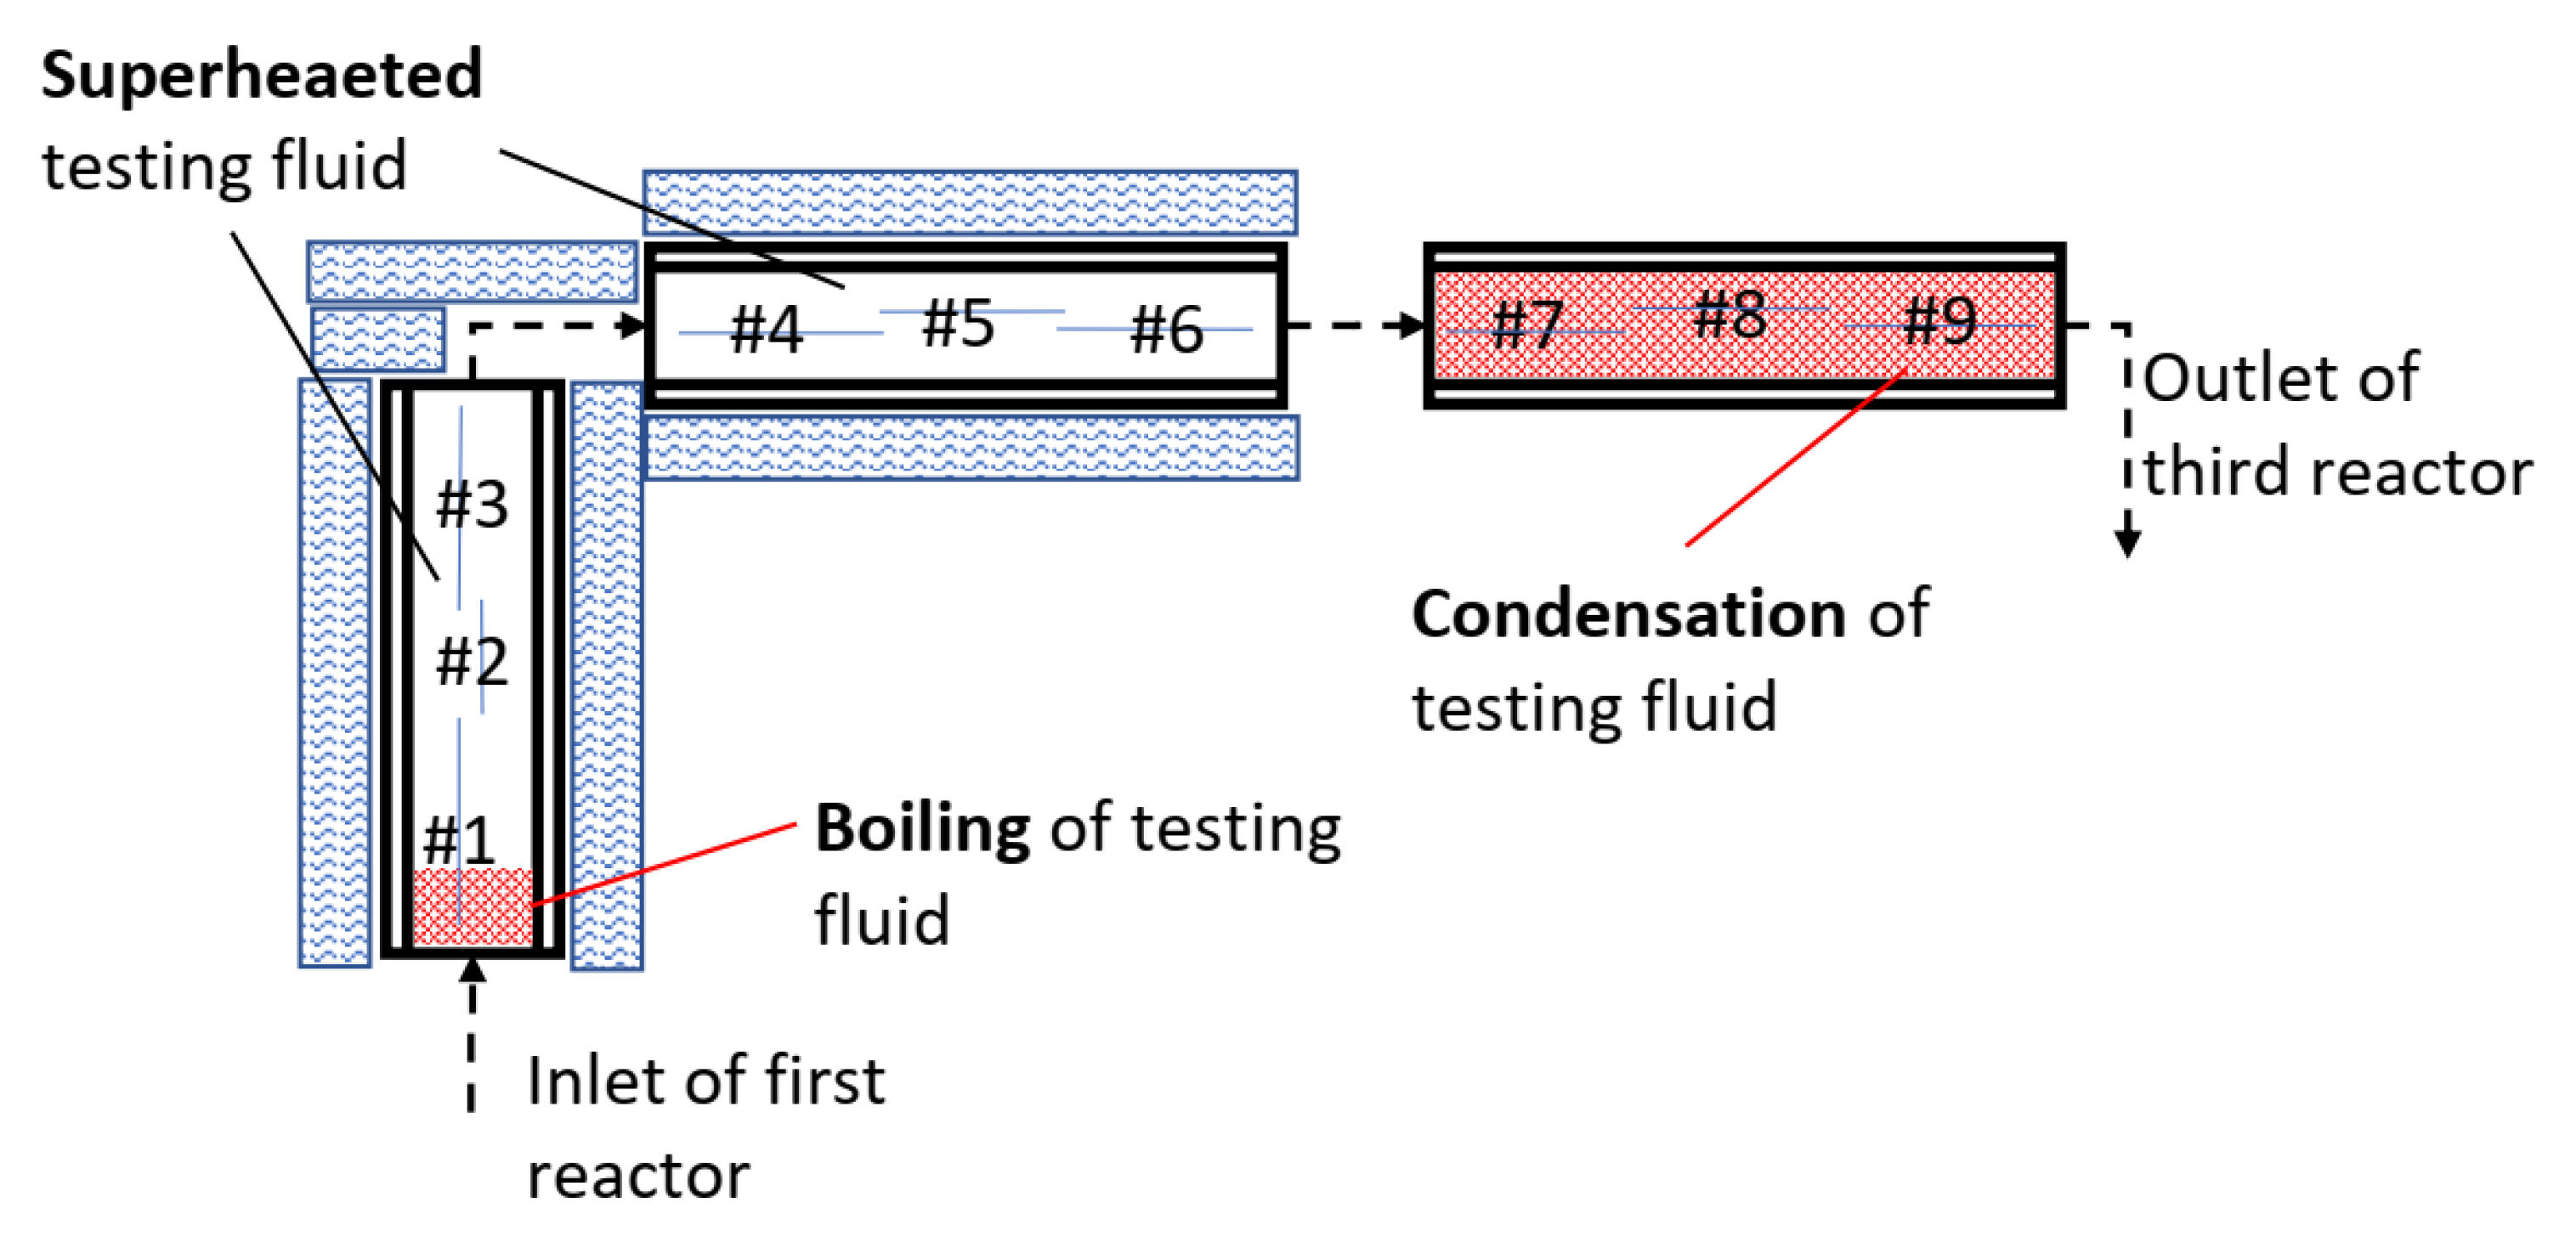
From the microstructural, weight-loss and XRD analysis of the carbon steel, it was concluded that the testing fluid was likely in a two-phase state at the first few centimetres in the inlet of the first reactor and in a two-phase state or condensing condition in the third reactor. The results indicated that the testing fluid was in a superheated state in the testing volume between the two-phase volumes as illustrated in
Figure 20.
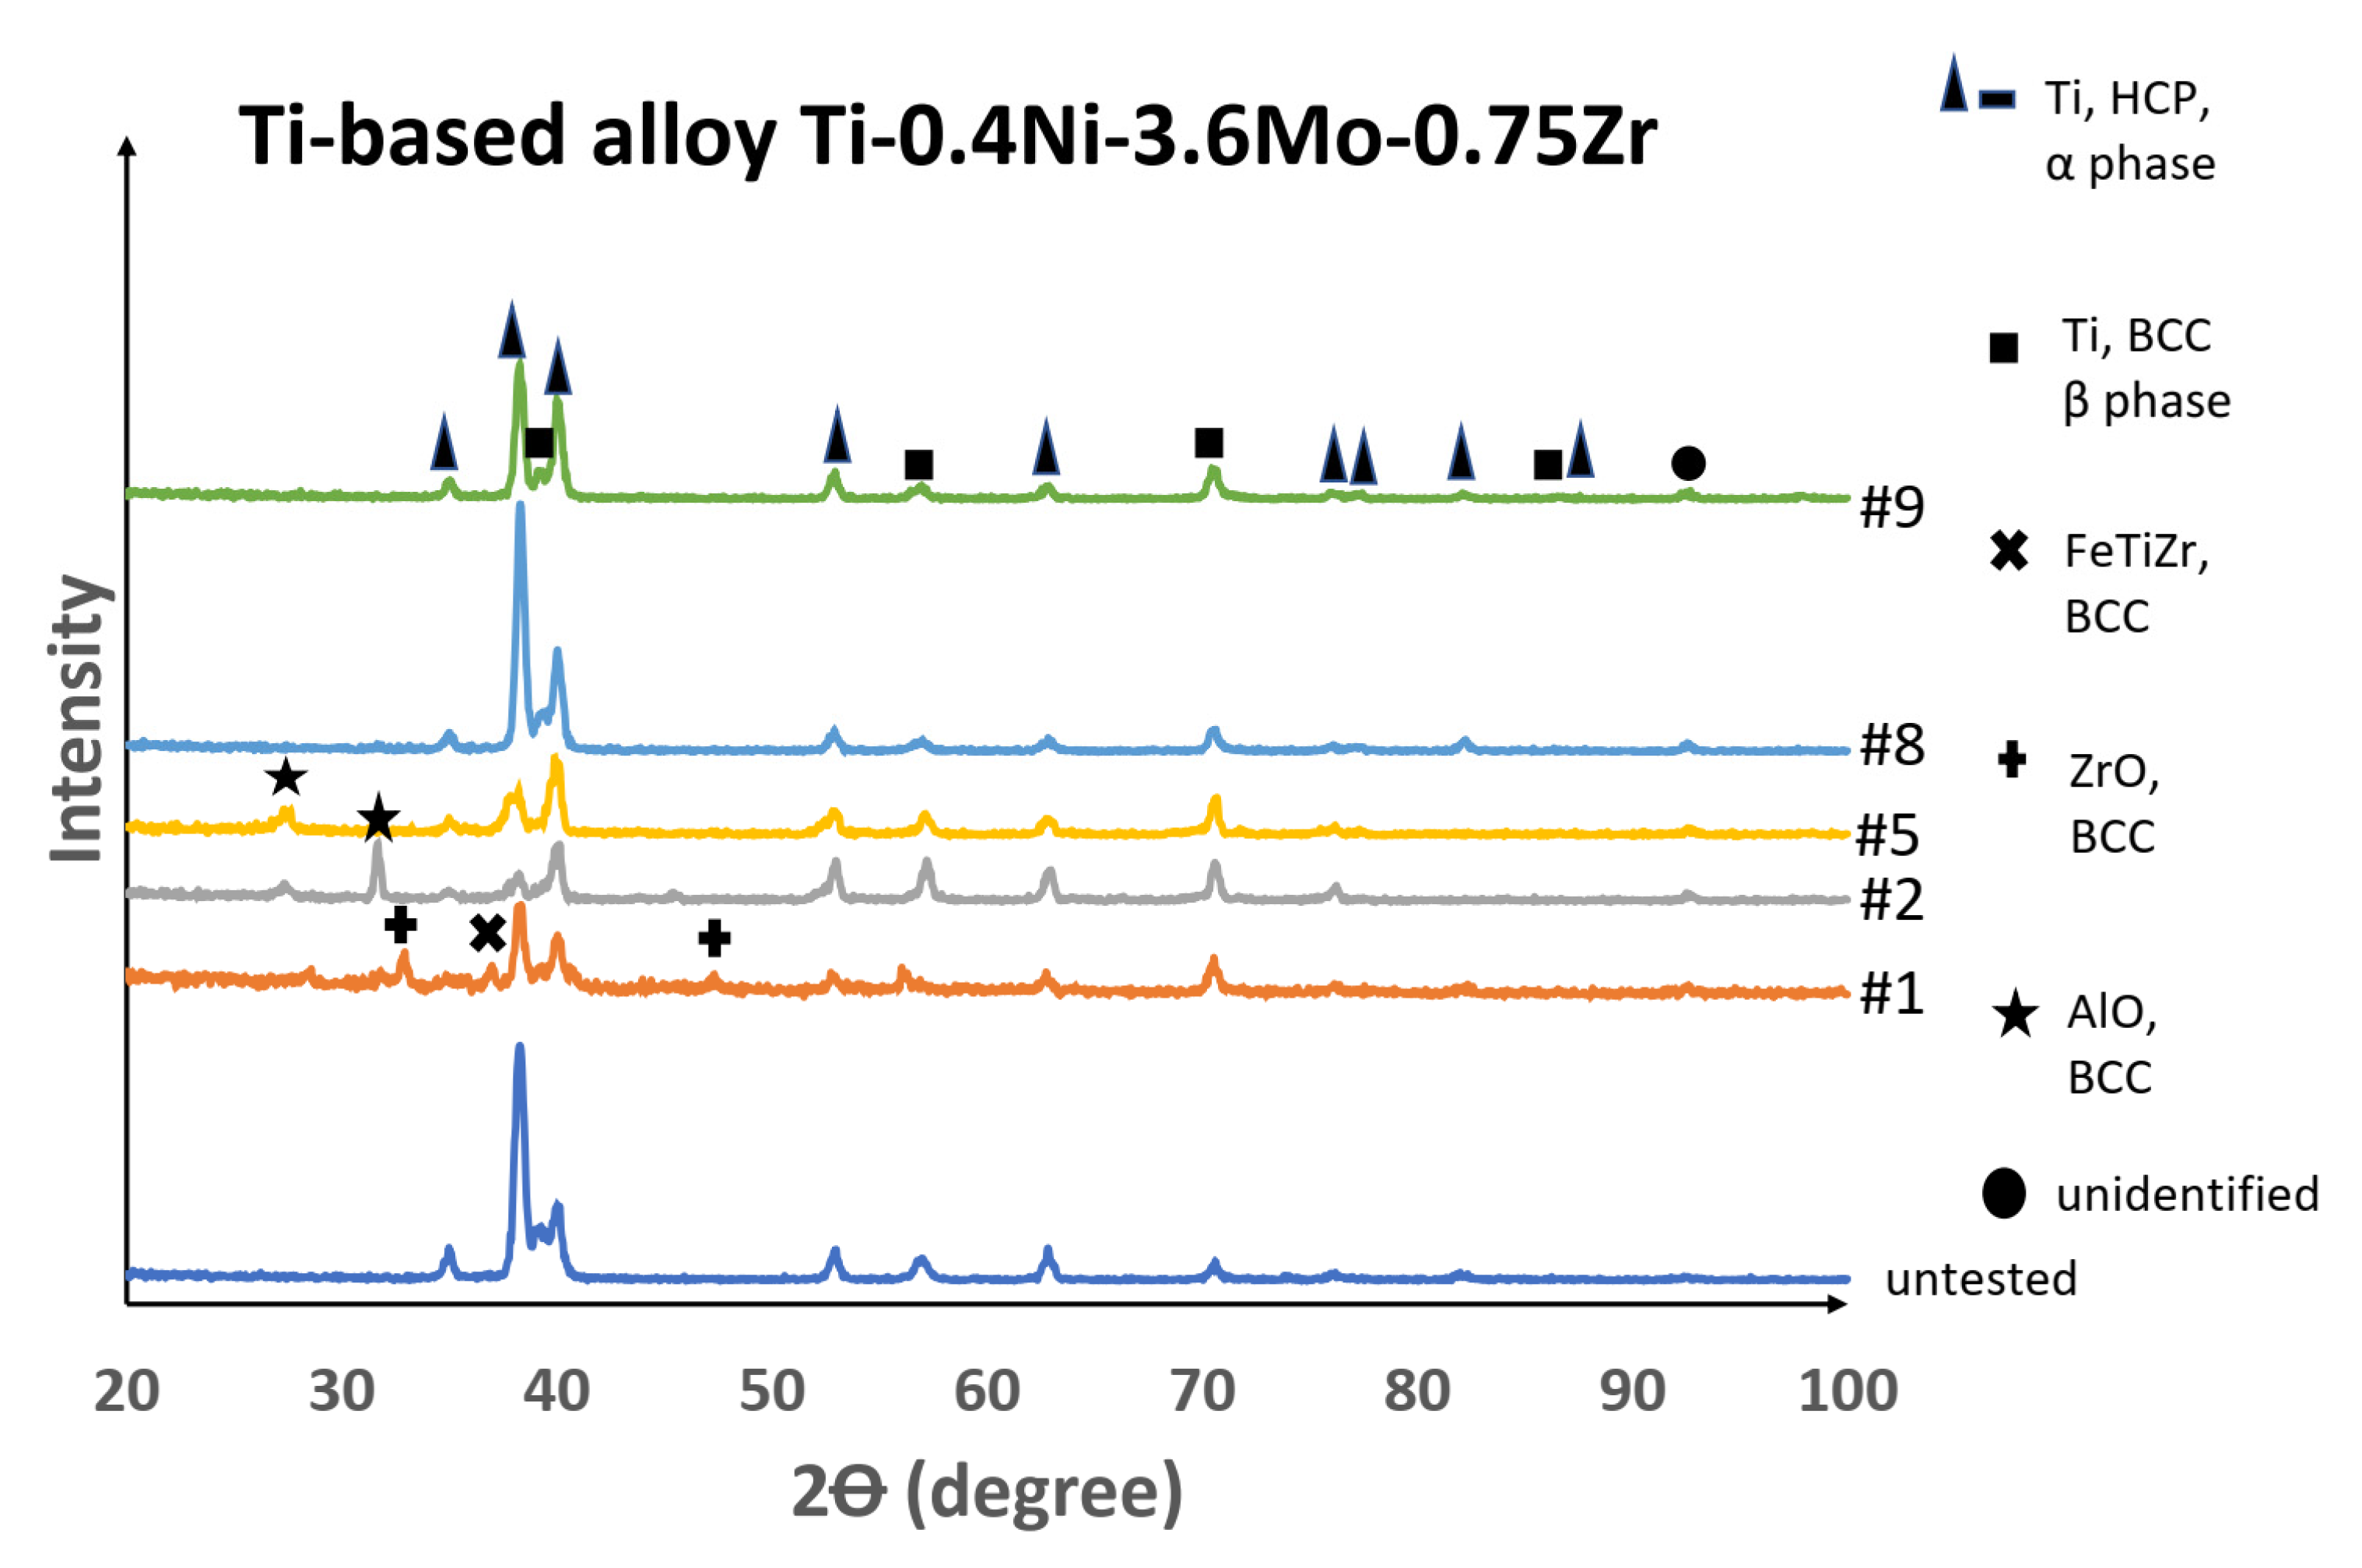
The XRD results of the surface of the titanium alloy samples showed little difference in crystal structure for the tested sample in comparison with the untested sample. Some changes were observed for sample 1 (a zirconium oxide crystal structure), which was not detected in other samples. Alumina oxide–BCC phase was detected on samples 2 and 5, which was likely due to corroded alumina oxide washers’ being transported to the samples. The XRD result for the tested titanium alloy samples was in good agreement with the results from the SEM and XEDS analysis, i.e., an insignificant corrosion effect as illustrated in
Figure 21.


