
Corrosion of Stainless Steel by Urea at High Temperature

 ,
,
Abstract
:1. Introduction
2. Materials and Methods
2.1. Materials
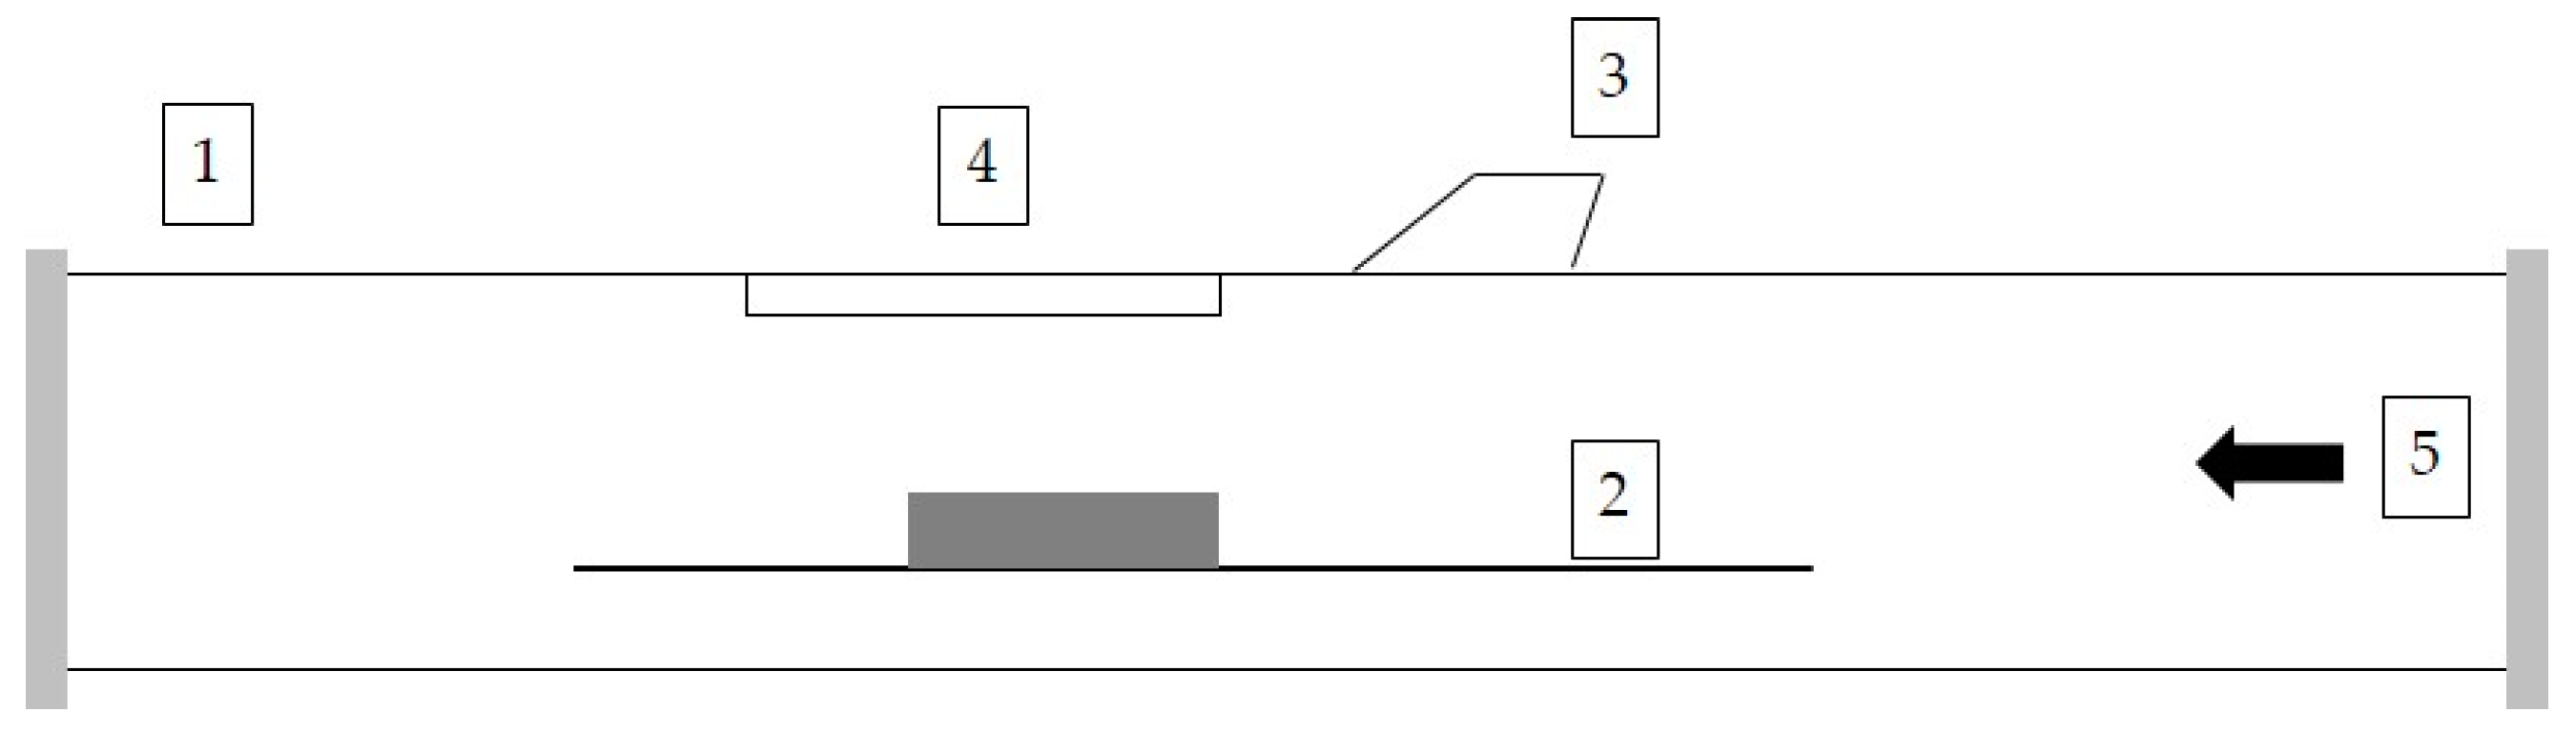
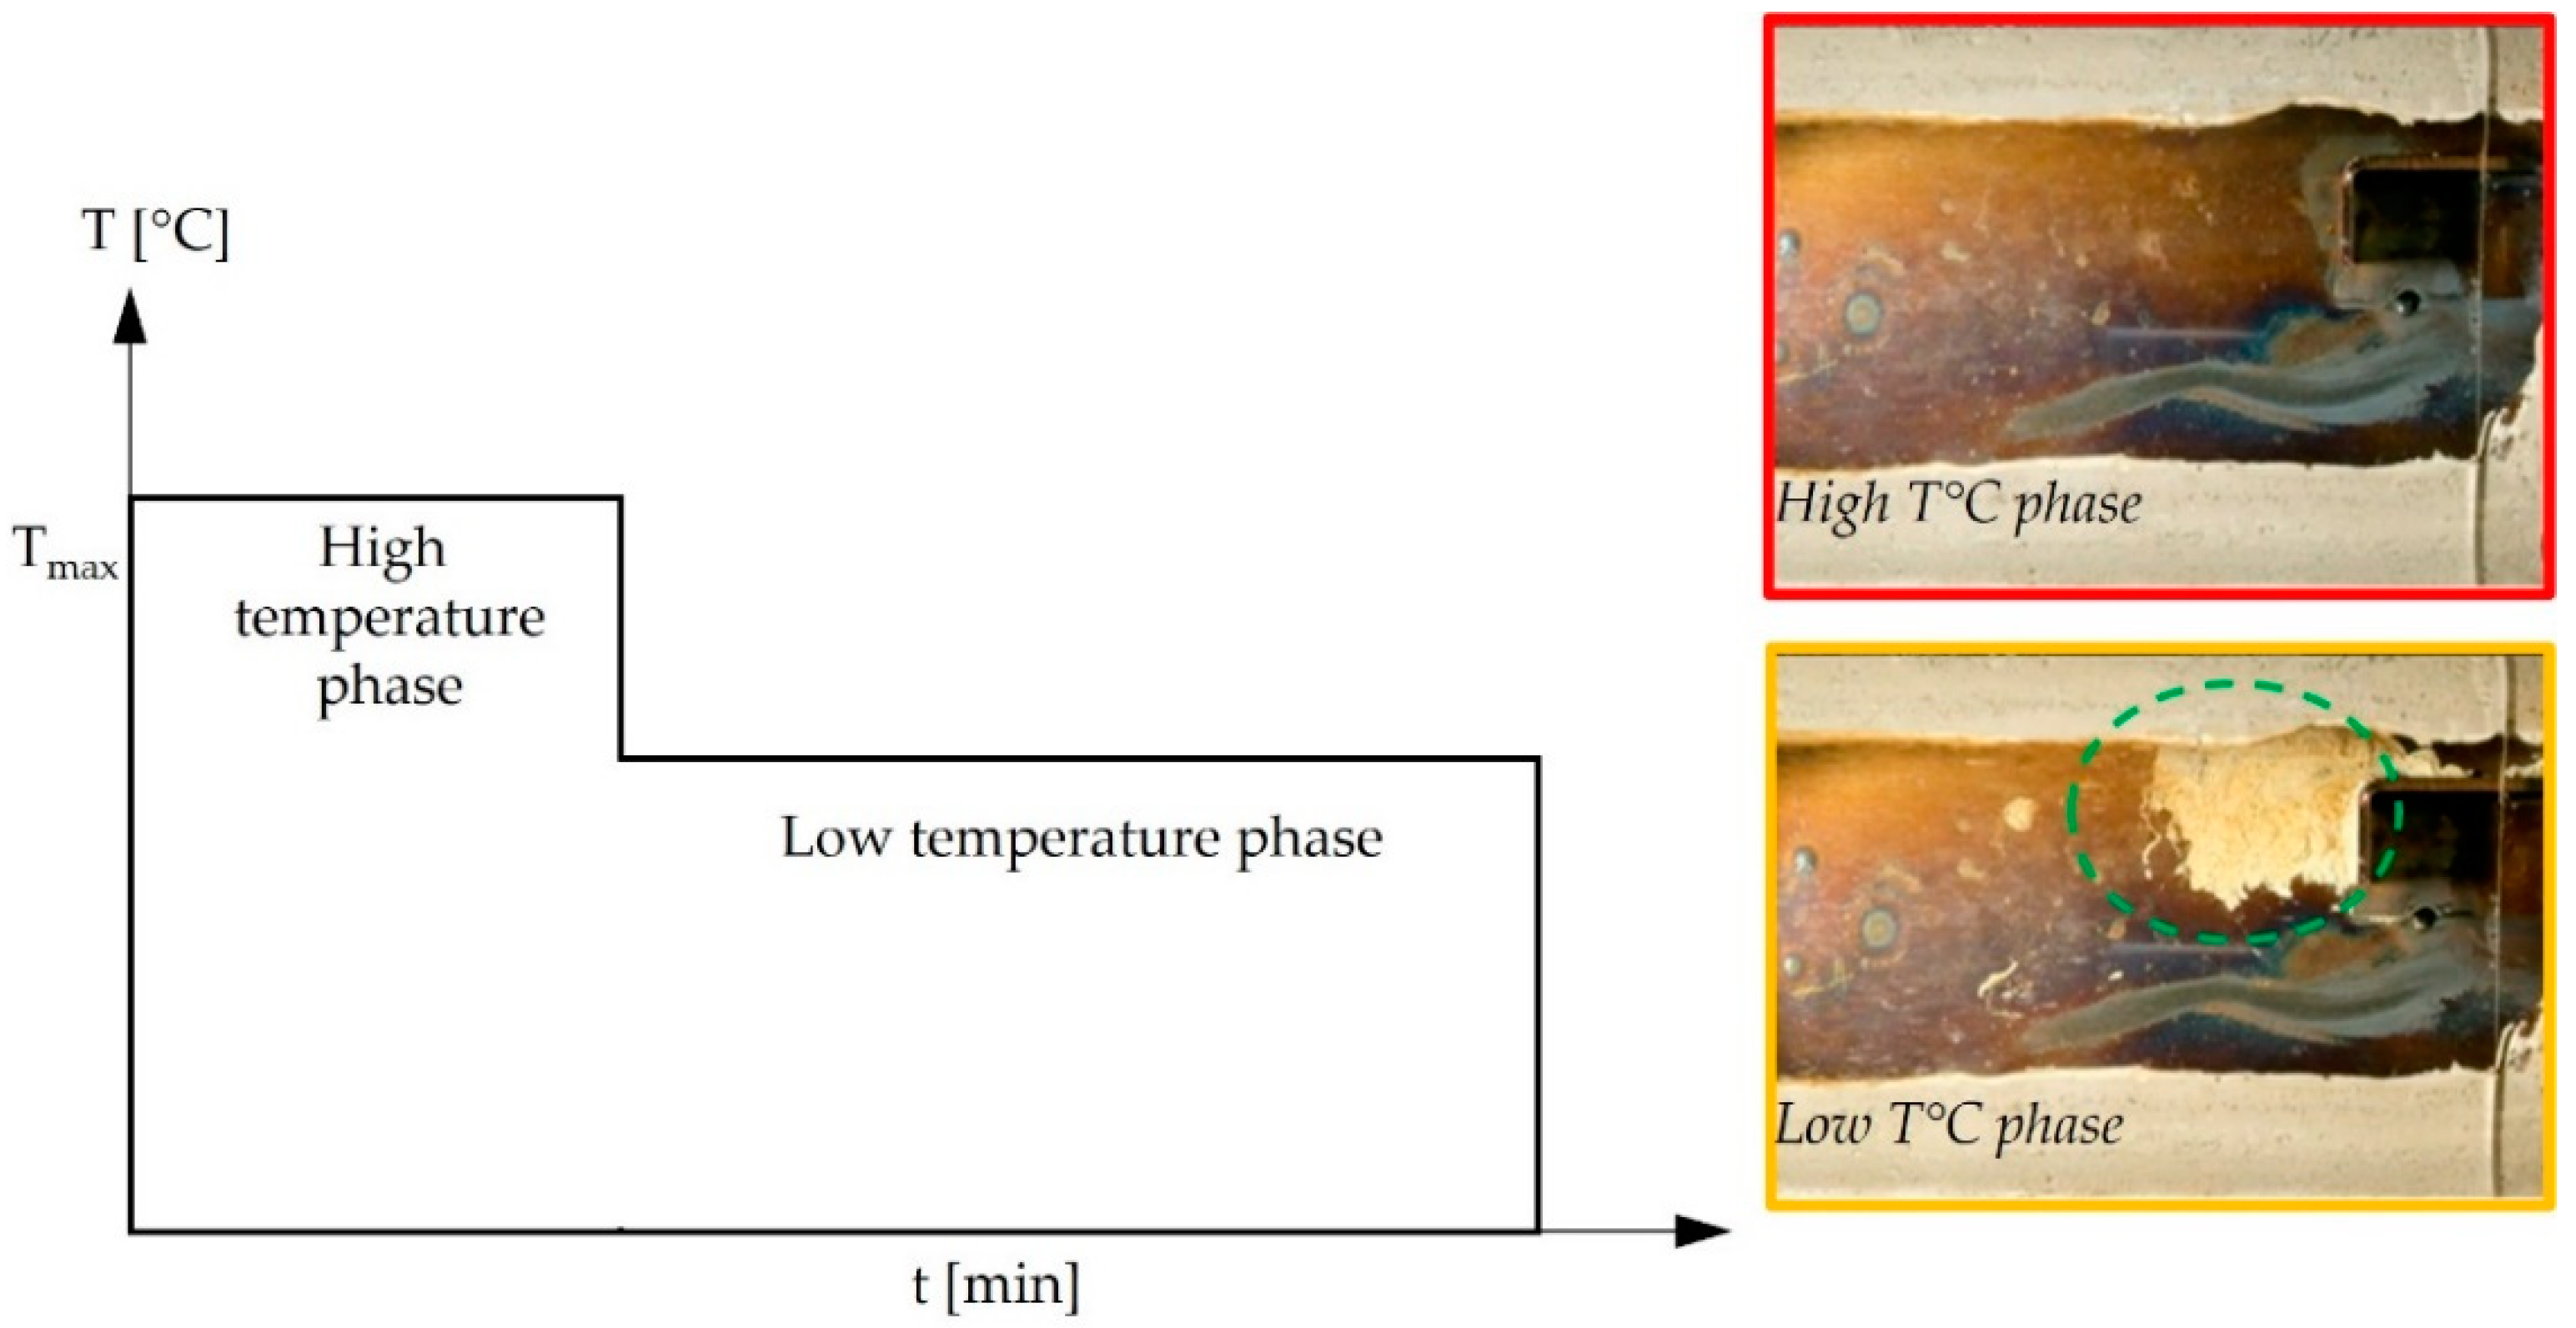
2.2. Corrosion Testing
2.3. Characterization Methods
3. Results
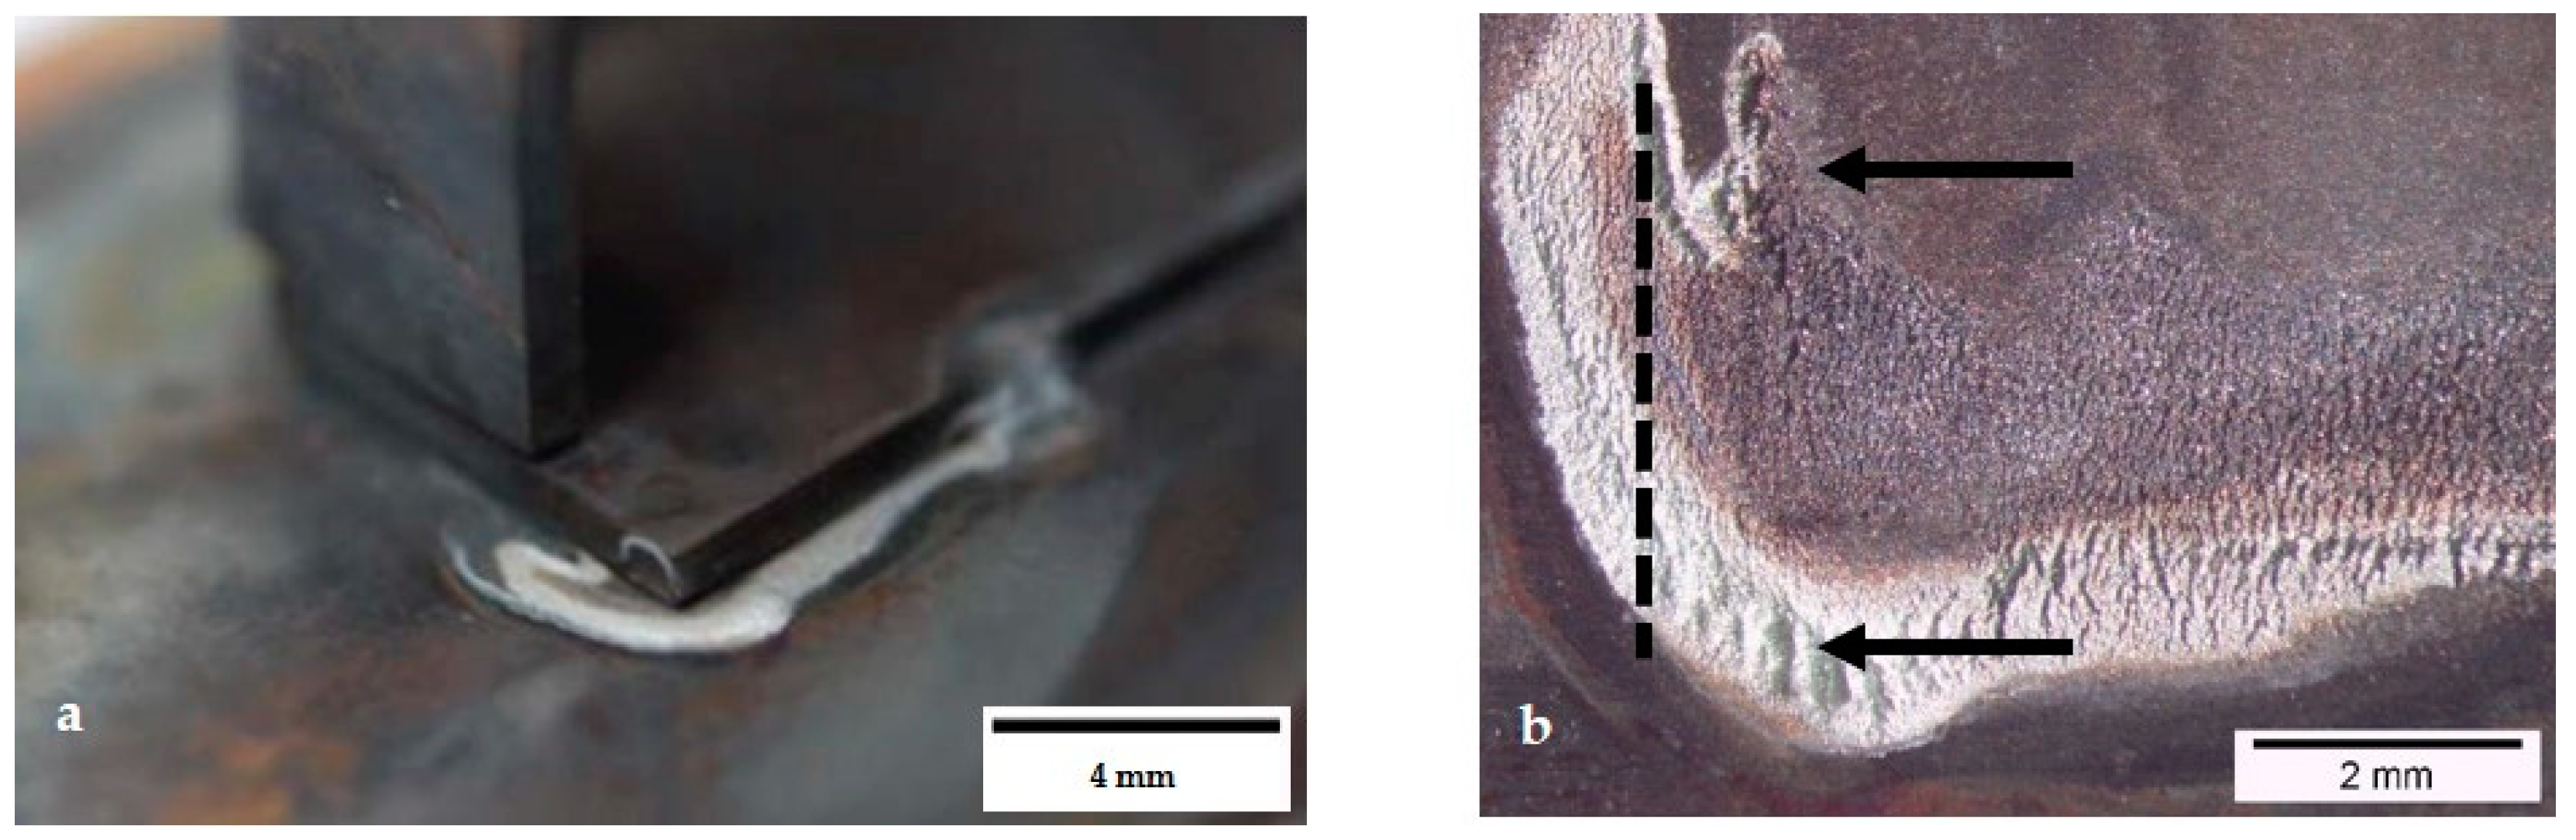
3.1. Characterization of Corroded Specimen 1.4509 Grade 100 h
3.2. Deposit Analysis
3.2.1. Ten-Minute Isothermal Heating of Injected Aqueous Urea Solution
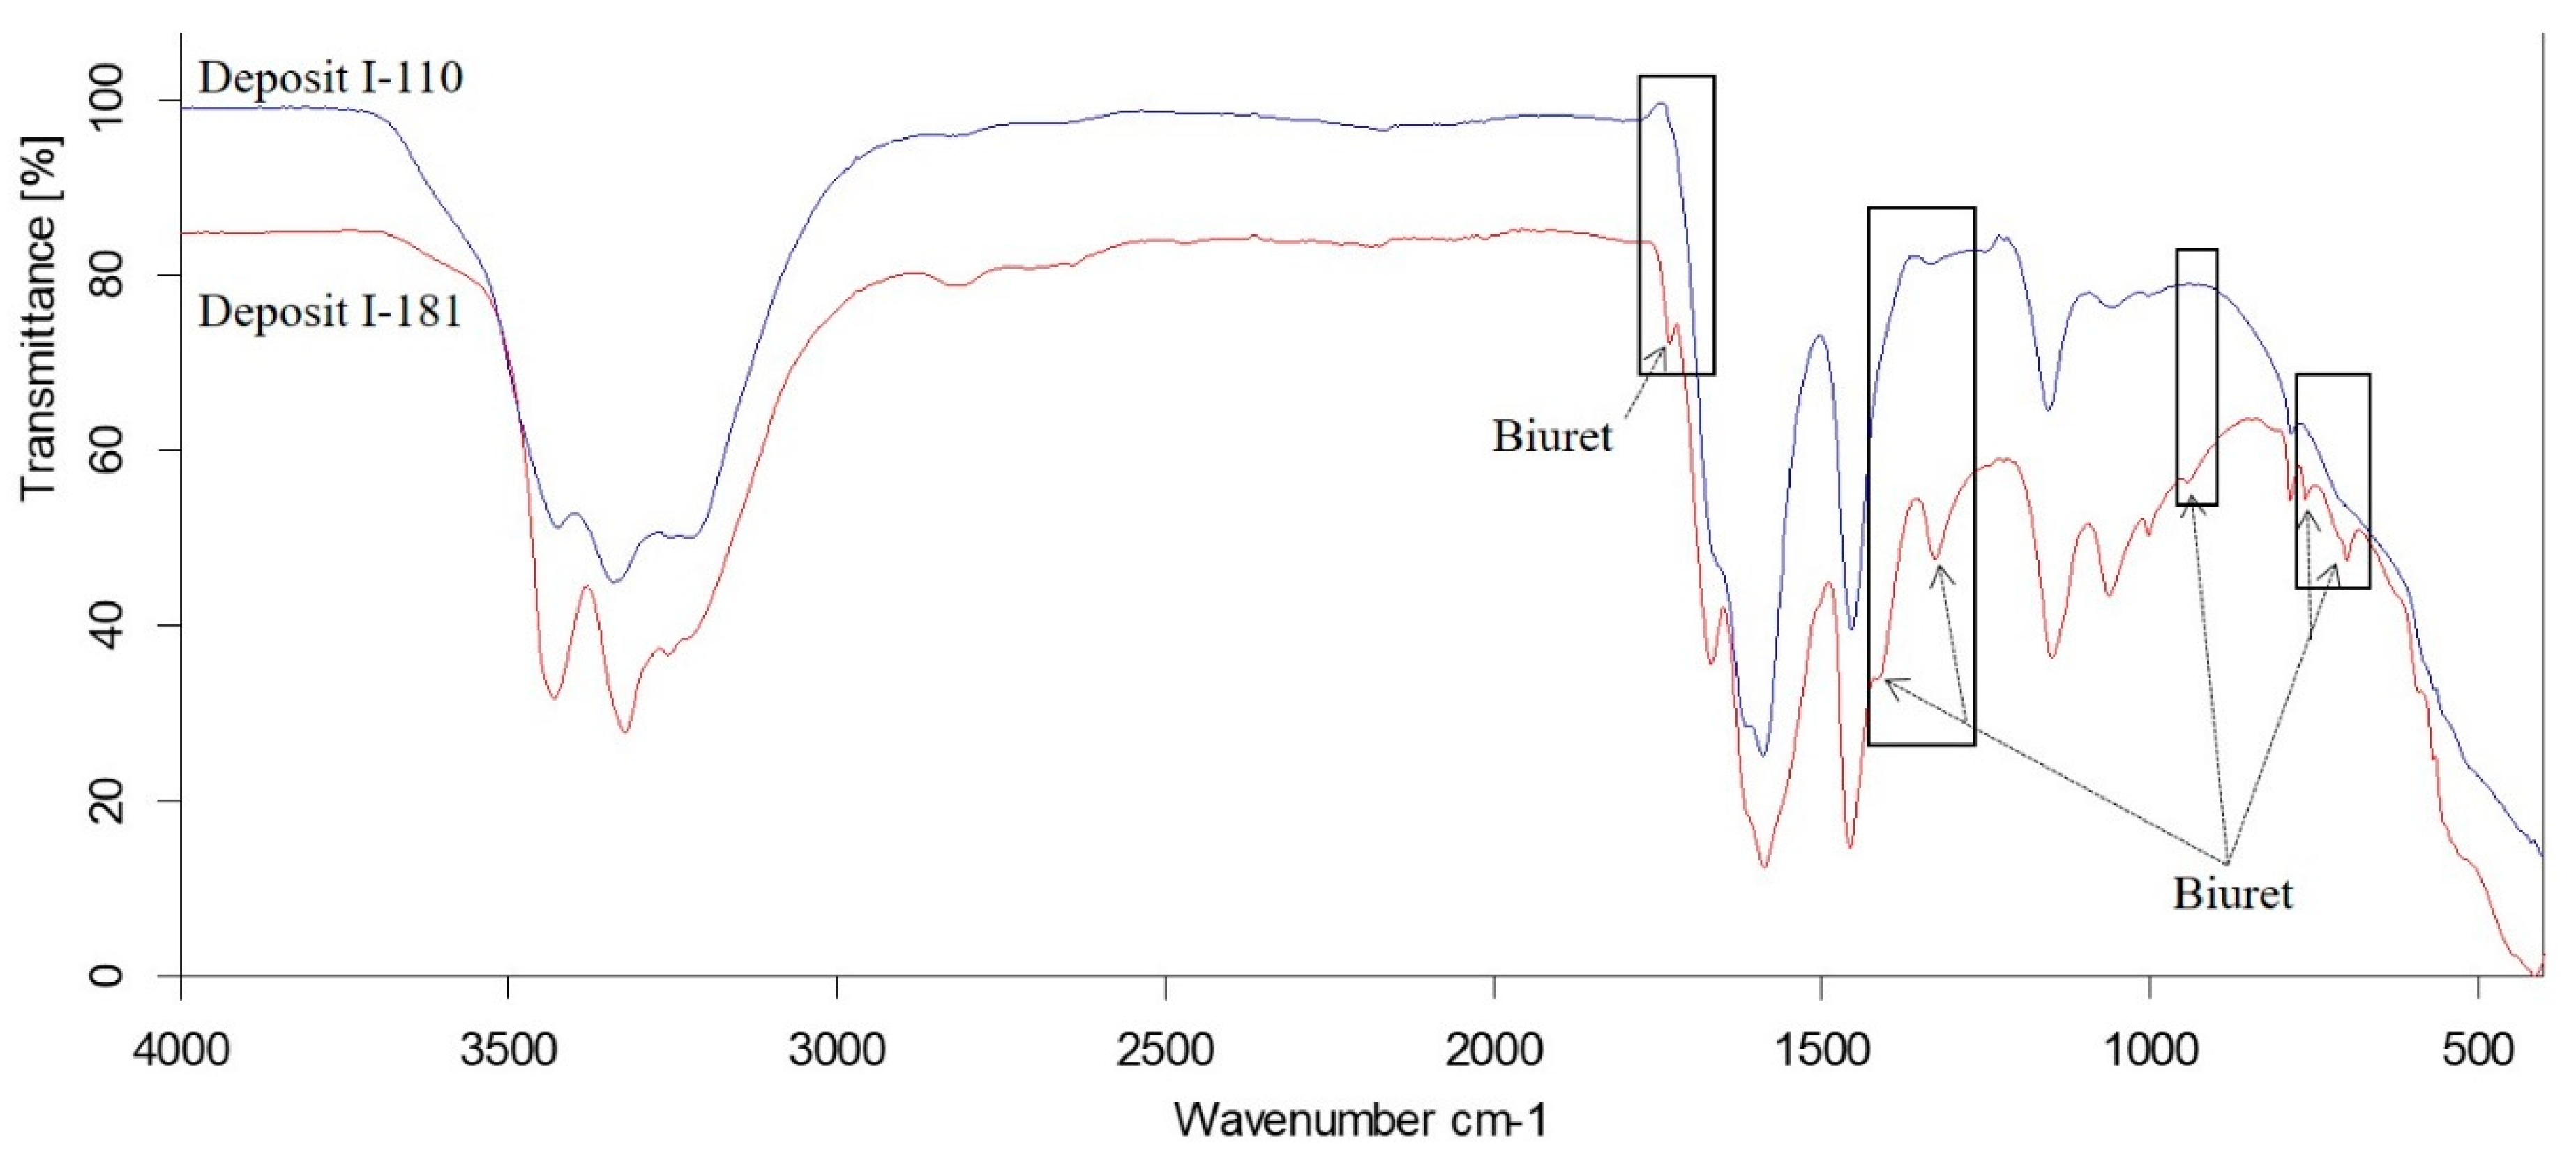
Comparison of FTIR Spectra of Deposits I-110 and I-181
Comparison of FTIR Spectra of Deposits I-208 and I-258
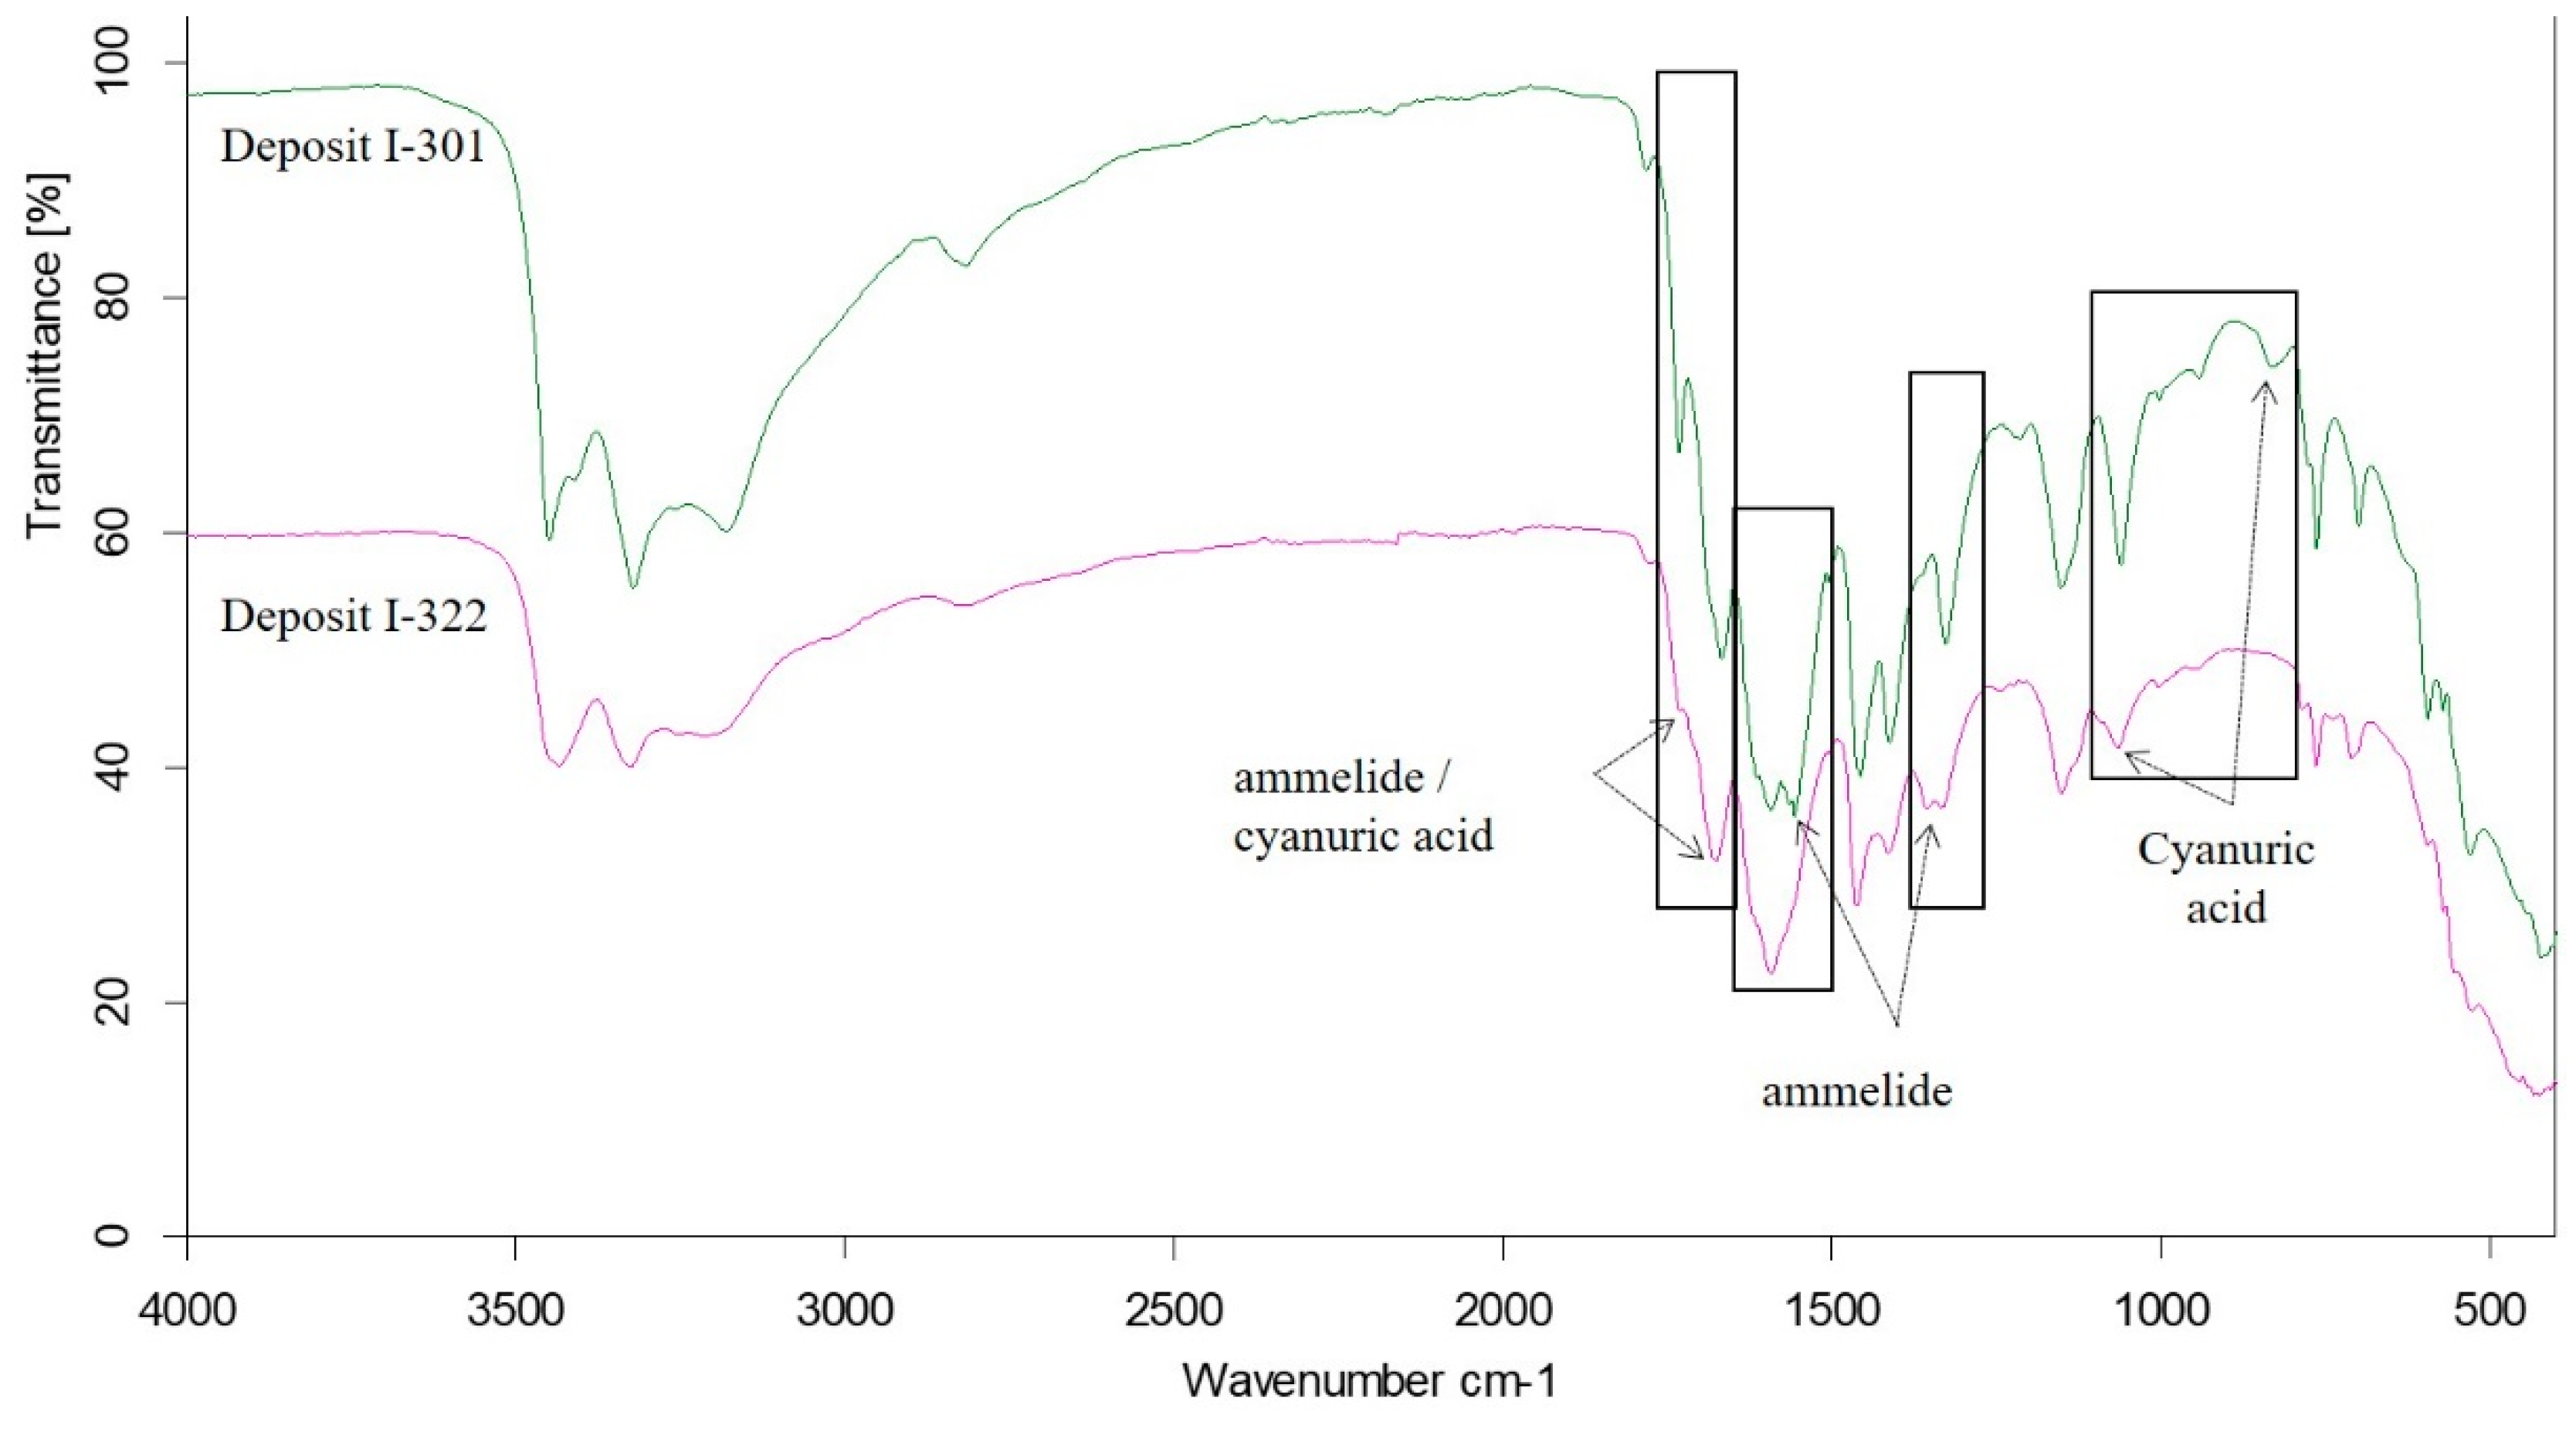
Comparison of FTIR Spectra of Deposits I-301 and I-322
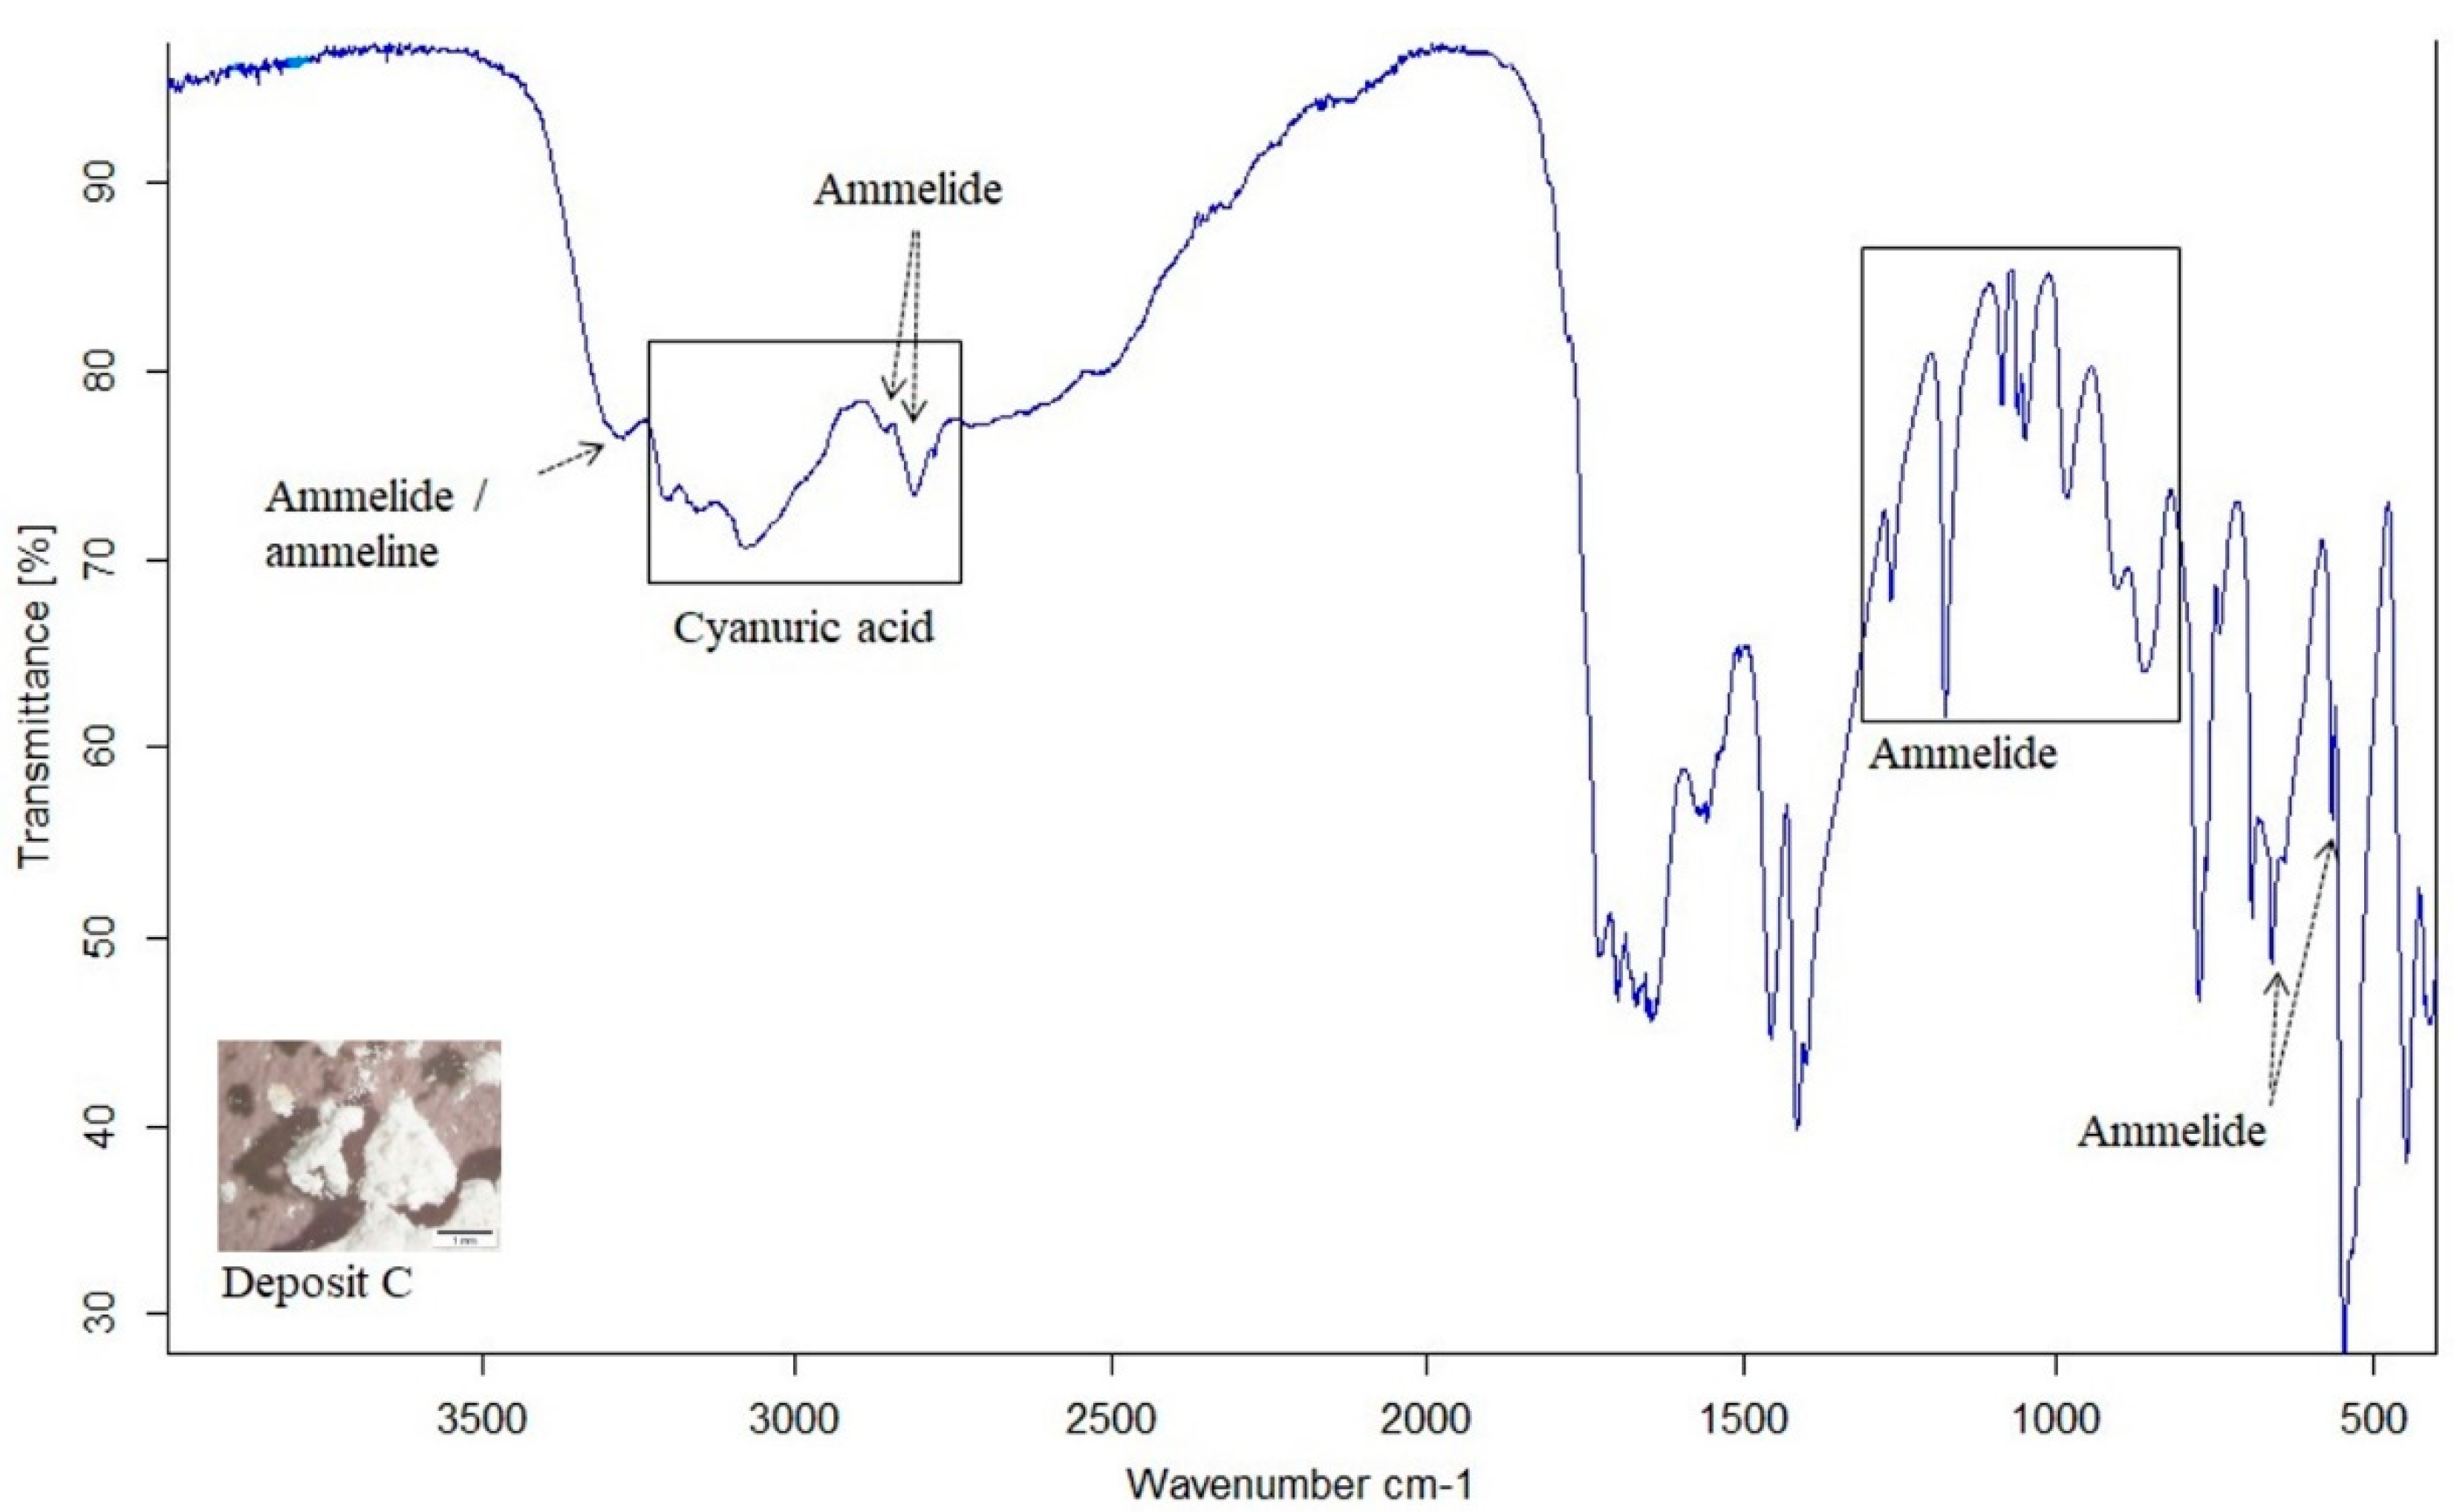
3.2.2. One Hundred Hours Cyclic Heating and Injected Aqueous Urea Solution (Deposit Sample C)
4. Discussion
5. Conclusions
Author Contributions
Funding
Institutional Review Board Statement
Informed Consent Statement
Data Availability Statement
Conflicts of Interest
References
- Jones, D.A. Materials selection and design. In Principles and Prevention of Corrosion, 2nd ed.; Stenquist, B., Kernan, R., Eds.; Prentice-Hall, Inc.: Upper Saddle River, NJ, USA, 1996; pp. 516–517. [Google Scholar]
- Nockert, J.; Nyborg, L.; Norell, M. Corrosion of stainless steels in simulated diesel exhaust environment with urea. Mater. Corros. 2012, 63, 388–395. [Google Scholar] [CrossRef]
- Demuzere, R. High alloying welding products for the urea synthesis process. Stainl. Steel Eur. 1991, 3, 55–62. [Google Scholar]
- Miraval, C.; Saedlou, S.; Evrard, R.; Santacreu, P.; Leseux, J. Influence of selective catalytic reduction (SCR) system on stainless steel durability. REM Rev. Esc. Minas 2013, 66, 153–158. [Google Scholar] [CrossRef]
- Koebel, M.; Strutz, E.O. Thermal and hydrolytic decomposition of urea for automotive selective catalytic reduction systems: Thermochemical and practical aspects. Ind. Eng. Chem. Res. 2003, 42, 2093–2100. [Google Scholar] [CrossRef]
- Shaikh, H.; Subba Rao, R.V.; George, R.P.; Anita, T.; Khatak, H.S. Corrosion failures of AISI type 304 stainless steel in a fertiliser plant. Eng. Fail. Anal. 2003, 10, 329–339. [Google Scholar] [CrossRef]
- Antoni, L.; Herbelin, J.M. Cyclic Oxidation of High Temperature Materials: Mechanisms, Testing Methods, Characterisation and Life Time Estimation. In Proceedings of the EFC-Workshop on Cyclic Oxidation of High Temperature Materials: Mechanisms, Testing Methods, Characterisation and Lifetime Estimation, Frankfurt/Main, Germany, 25–26 February 1999; pp. 187–197. [Google Scholar]
- Won-Jin, B.; Kwi-Suba, Y.; Chan-Jin, P.; Han-Jin, R.; Young-Ho, K. Comparison of influences of NaCl and CaCl2 on the corrosion of 11% and 17% Cr ferritic stainless steels during cyclic corrosion test. Corros. Sci. 2010, 52, 734–739. [Google Scholar] [CrossRef]
- Crum, J.R.; Smith, G.D.; Flower, H.L. Resistance of automotive exhaust flexible coupling alloys to hot salt attack, stress corrosion cracking and high temperature embrittlement. SAE Int. J. Mater. Manuf. 1999, 108, 403–410. [Google Scholar]
- Gümpel, P.; Schiller, D.; Arlt, N.; Bouchholz, D. Simulation des Korrosionsverhaltens von nichtrostenden Stählen in Pkw-Abgasanlagen. ATZ Automob. Z. 2004, 106, 350–356. [Google Scholar] [CrossRef]
- Gümpel, P.; Hoffmann, C.; Artl, N. Corrosion resistance of stainless steels to wet condensates in automotive exhaust systems. In Proceedings of the 6th European Stainless Steel Conference—Science and Market, Helsinki, Finland, 10–13 June 2008; pp. 645–652. [Google Scholar]
- Zhao, H.; Lei, M.; Chen, X.; Tang, W. Facile route to metal nitrides through melamine and metal oxides. J. Mat. Chem. 2006, 16, 4407–4412. [Google Scholar] [CrossRef]
- Lei, M.; Zhao, H.Z.; Yang, H.; Song, B.; Tang, W.H. Synthesis of transition metal carbide nanoparticles through melamine and metal oxides. J. Eur. Ceram. Soc. 2008, 28, 1671–1677. [Google Scholar] [CrossRef]
- Wei, B.; Yang, W.; Wang, J.; Tan, H.; Zhou, S.; Wang, F. Study on reduction mechanism of Fe2O3 by NH3 under SNCR condition. Fuel 2019, 255, 115814. [Google Scholar] [CrossRef]
- Saedlou, S.; Santacreu, P.; Leseux, J. Suitable stainless steel selection for exhaust line containing a Selective Catalytic Reduction (SCR) system. SAE Int. 2011. [Google Scholar] [CrossRef]
- Lu, J.; Yang, Z.; Zhang, B.; Huang, J.; Xu, H. Corrosion Behavior of Candidate Materials Used for Urea Hydrolysis Equipment in Coal-Fired Selective Catalytic Reduction Units. J. Mater. Eng. Perform. 2018. [Google Scholar] [CrossRef]
- Morgan, M.L. Failure analysis of an 18% Cr ferritic stainless steel in a simulated exhaust condensate containing urea. J. Fail. Anal. Prev. 2018, 18, 117–120. [Google Scholar] [CrossRef]
- Wang, X.L.; Huang, A.R.; Li, M.X.; Zhang, W.; Shang, W.; Wang, J.L.; Xie, Z.J. The significant roles of Nb and Mo on enhancement of high temperature urea corrosion resistance in ferritic stainless steel. Mater. Lett. 2020, 269, 127660. [Google Scholar] [CrossRef]
- Nockert, J.; Norell, M. Corrosion at the Urea Injection in SCR-System during Component Test. Mater. Corros. 2013, 64, 34–42. [Google Scholar] [CrossRef]
- Floyd, R.; Kotrba, A.; Martin, S.; Prodin, K. Material Corrosion Investigations for Urea SCR Diesel Exhaust Systems; SAE Technical Paper; SAE: Troy, MI, USA, 2009. [Google Scholar]
- Börnhorst, M.; Langheck, S.; Weickenmeier, H.; Dem, C.; Suntz, R.; Deutschmann, O. Characterization of solid deposits from urea water solution injected into a hot gas test rig. Chem. Eng. J. 2018, 377, 119855. [Google Scholar] [CrossRef]
- Schaber, P.M.; Colson, J.; Higgins, S.; Thielen, D.; Anspach, B.; Brauer, J. Thermal decomposition (pyrolysis) of urea in an open reaction vessel. Thermochim. Acta 2004, 424, 131–142. [Google Scholar] [CrossRef]
- Brack, W.; Heine, B.; Birkhold, F.; Kruse, M.; Schoch, G.; Tischer, S.; Deutschmann, O. Kinetic modeling of urea decomposition based on systematic thermogravimetric analyses of urea and ist most important by-products. Chem. Eng. Sci. 2014, 106, 1–8. [Google Scholar] [CrossRef]
- Tischer, S.; Börnhost, M.; Amsler, J.; Schoch, G.; Deutschmann, O. Thermodynamics and reaction mechanism of urea decomposition. Phys. Chem. Chem. Phys. 2019, 21, 16785. [Google Scholar] [CrossRef] [Green Version]
- Kieke, M.L.; Schoppelrei, J.W.; Brill, T.B. Spectroscopy of hydrothermal reactions. 1. The CO2-H2O system and kinetics of urea decomposition in an FTIR spectroscopy flow reactor cell operable to 725 K and 335 bar. J. Phys. Chem. 1996, 100, 7455–7462. [Google Scholar] [CrossRef]
- Eichelbaum, M.; Farrauto, R.J.; Castaldi, M.J. The impact of urea on the performance of metal exchanged zeolites for the selective catalytic reduction of NOx. Part, I. Pyrolysis and hydrolysis of urea over zeolite catalysts. Appl. Catal. B 2010, 97, 90–97. [Google Scholar] [CrossRef]
- Tempelman, C.; Warning, N.; Geel, J.; Bommel, F.; Lamers, K.; Hashish, M.; Schippers, J.; Gundlach, M.; Luijendijk, E. An infrared and thermal decomposition study on solid deposits originating from heavy-duty diesel SCR urea injection fluids. Reactions 2020, 1, 72–88. [Google Scholar] [CrossRef]


| EN | AISI | Fe | C | Si | Mn | Cr | Ni | Mo | Nb | Ti | P | S |
|---|---|---|---|---|---|---|---|---|---|---|---|---|
| 1.4509 | 441 | Bal. | 0.017 | 1.0 | 1.0 | 17.990 | 0.233 | 0.075 | 0.391 | 0.115 | 0.040 | 0.015 |
| Sample Index | Tsample, °C | Tair, °C | Test Duration |
|---|---|---|---|
| I-110 | 110 | 200 | 10 min |
| I-181 | 181 | 250 | 10 min |
| I-208 | 208 | 300 | 10 min |
| I-258 | 258 | 350 | 10 min |
| I-301 | 301 | 375 | 10 min |
| I-322 | 322 | 400 | 10 min |
| C | cyclic heating | cyclic heating | 100 h |
| Sample Index | Tsample, °C | Tair, °C | FTIR Results | Deposit Image | |
|---|---|---|---|---|---|
| Main Product | Minor Product | ||||
| I-110 | 110 | 200 | urea |  | |
| I-181 | 181 | 250 | urea, biuret |  | |
| I-208 | 208 | 300 | biuret | Urea, cyanuric acid | 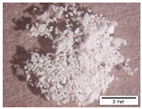 |
| I-258 | 258 | 350 | ammelide | urea, biuret, cyanuric acid, ammeline |  |
| I-301 | 301 | 375 | cyanuric acid, ammelide | melamine, ammeline | 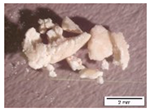 |
| I-322 | 322 | 400 | cyanuric acid, ammelide | biuret |  |
Publisher’s Note: MDPI stays neutral with regard to jurisdictional claims in published maps and institutional affiliations. |
© 2021 by the authors. Licensee MDPI, Basel, Switzerland. This article is an open access article distributed under the terms and conditions of the Creative Commons Attribution (CC BY) license (https://creativecommons.org/licenses/by/4.0/).
Share and Cite
Galakhova, A.; Kadisch, F.; Mori, G.; Heyder, S.; Wieser, H.; Sartory, B.; Burger, S. Corrosion of Stainless Steel by Urea at High Temperature. Corros. Mater. Degrad. 2021, 2, 461-473. https://doi.org/10.3390/cmd2030024
Galakhova A, Kadisch F, Mori G, Heyder S, Wieser H, Sartory B, Burger S. Corrosion of Stainless Steel by Urea at High Temperature. Corrosion and Materials Degradation. 2021; 2(3):461-473. https://doi.org/10.3390/cmd2030024
Chicago/Turabian StyleGalakhova, Anastasiia, Fabian Kadisch, Gregor Mori, Susanne Heyder, Helmut Wieser, Bernhard Sartory, and Simon Burger. 2021. "Corrosion of Stainless Steel by Urea at High Temperature" Corrosion and Materials Degradation 2, no. 3: 461-473. https://doi.org/10.3390/cmd2030024
APA StyleGalakhova, A., Kadisch, F., Mori, G., Heyder, S., Wieser, H., Sartory, B., & Burger, S. (2021). Corrosion of Stainless Steel by Urea at High Temperature. Corrosion and Materials Degradation, 2(3), 461-473. https://doi.org/10.3390/cmd2030024