Article

Correlation Between the Anticorrosive Performance of Protective Coatings Under Neutral Salt Spray Testing and Outdoor Atmospheric and Immersion Exposure

by
Matthias J. Schmid
Federal Waterways Engineering and Research Institute, Kußmaulstr. 17, 76187 Karlsruhe, Germany
Corros. Mater. Degrad. 2024, 5(4), 490-512; https://doi.org/10.3390/cmd5040023
Submission received: 26 September 2024 / Revised: 17 October 2024 / Accepted: 24 October 2024 / Published: 30 October 2024
(This article belongs to the Special Issue Advances in Corrosion Protection by Coatings)

Abstract

:
Anticorrosive organic coatings are usually tested with accelerated weathering methods to assess their anticorrosive performance. The results of lab testing often do not correlate well with results from field testing, which resembles the conditions of actual use more closely. We tested the correlation of the neutral salt spray test (NSS, ISO 9227) and tests for mechanical properties and a 5-year field exposure in four different locations in the atmospheric zone, splash zone and immersion zone using 19 organic coatings for hydraulic steelwork. No correlation was found between the anticorrosive performance under outdoor exposure and the mechanical properties of a coating. The NSS test showed a positive correlation with the results in the field in 6 of 12 cases. For the fresh water testing location in Trier, the correlation proved to be very good. The biggest difference between lab and field testing was observed for zinc-primer-free coatings, which passed in the lab testing and failed in the outdoor testing. This study shows that the NSS test correlates with outdoor exposure only in some cases on a statistically significant level, but the results of NSS testing can be useful in approval testing for protective coating systems using predefined pass/fail criteria.

1. Introduction

Applying organic coatings is one of the main strategies to prevent corrosion in hydraulic steelwork. The usual service lifetime of these coatings is in the order of 25 years, or, in terms of ISO 12944-1 [1], “high” (15–25) years or even “very high” (>25 years). Due to these challenging requirements, in combination with the high costs for paint application and even higher possible costs for damage to the steel structure, organic coatings undergo extensive performance testing, both by the manufacturer and by independent test laboratories. The coatings are exposed to many different effects during their service time, such as natural UV radiation, heat, moisture or immersion and impacts due to traffic or floating debris, leading to material degradation. Laboratory tests aim to reproduce these effects at a higher intensity in order to accelerate degradation. Typical tests are given in, e.g., ISO 12944-6 [2], i.e., resistance against water immersion ISO 2812-2 [3], resistance against condensation ISO 6270-1 [4], the neutral salt spray test ISO 9227 (NSS test) [5] and cycling aging (previously ISO 20340). At the same time, ISO 12944-6 recognizes that it is difficult to emulate natural conditions in accelerated lab testing, which can lead to inaccurate results. The standard recommends that coatings should always be tested using outdoor exposure.
Outdoor exposure experiments, usually in combination with lab testing, are time consuming and require a suitable testing location. Reports of such experiments are therefore much rarer than reports using only lab experiments on coatings. The results of these combined studies often emphasize the necessity of outdoor testing. Usually, outdoor exposure means natural weathering in atmospheric conditions, i.e., UV radiation, temperature, humidity/rain and, to some extent, chlorides, with the intensity of the exposure depending on the location. The corrosivity of atmospheres can be classified with the system defined by ISO 9223 [6], ranging from C1 (very low) to C5 (very high) or even CX (extreme). The classification of a location can be different for different metals, e.g., unalloyed steel, Zinc, Copper and Aluminum, as listed by ISO 9223. Within the context of this study, all classifications relate to unalloyed steel.
The intensity and duration of outdoor exposure usually depend on the studied materials and the possibilities for exposure. Some examples of studies on coatings using outdoor exposure are listed in Table 1.
Field testing with immersion of the sample in natural water is rarer than that with atmospheric immersion, to some extent because operating an immersion test station is more challenging. An older example of an immersion test station in the River Danube and the Balaton in Hungary is described by Csokán [7]. The present study includes outdoor exposure in the splash zone and immersion zone, which has been rarely reported in the literature, as can be seen in Table 1.
Table 1. Overview of studies on coatings using outdoor exposure.
ReferenceCoating on Steel Substrate 1ConditionsISO 9223 Category (Steel)Duration [Years]
Chico et al. [8]Silane pre-treatment, alkyd/polyester aminoplast base paint atmospheric, inlandC21/3
Takeshita et al. [9]Polyethylene terephthalate and polyvinyl butyral resinsatmospheric, inland and coastalnot specified0.5/0.7
Seré et al. [10]Electrogalvanized steel pre-treated with a silane, mercaptopropyltrimethoxysilane
or chromium(III)-based solution (Cr), painted with an alkyd system
atmospheric, inlandnot specified5
Fragata et al. [11]Aluminum polyamine epoxy masticatmospheric, coastal, addition of NaCl solutionC30.9
Fekete and Lengyel [12]Styrene–acrylate waterborne paint systemsatmospheric, inlandnot specified0.3–2.5
De Florian et al. [13]Galvanized steel with Zn and Zn-Al alloys and a urethane chromate primer, a polyester chromate primer, an epoxy chromate primer and a fluoropolymer top coatingatmospheric, inland and coastalnot specified0.1–1
Li et al. [14]Epoxy polysiloxane
coating
atmospheric and tidal, coastalnot specified0.77
Almeida et al. [15]Acrylic, acrylic enamel, epoxy and epoxy polyamide waterborne coatingsatmospheric, inland and coastalC3, CX2, 3
Zhang et al. [16]Epoxy anticorrosion paint, polyurethane paint or fluorocarbon top paintatmospheric, coastalnot specified2
Davalos-Monteiro et al. [17]Polyester, polyester–epoxy and epoxy powder coatingsatmospheric, coastalC51–4
LeBozec et al. [18]Marine paint systemsatmospheric, coastal, atmospheric and splash zone, on a shipC5, CX3, 4
Pélissier et al. [19]Ethyl silicate, epoxy, aliphatic acrylic polyurethane, polyamine epoxy, silicone alkyd, waterborne epoxy and acrylic, aliphatic polyurethane, vinylic epoxy, acrylic, polyamide epoxy, aliphatic acrylic polyurethaneatmospheric, coastal, atmospheric, on a shipC5, CX1–6
Momber et al. [20]Epoxy, polyaspartate, epoxy/siloxane repair coatingsatmospheric, coastalnot specified0.5–5.75
Perrin et al. [21]Modified epoxy, alkyd silicon/TCatmospheric, coastalC3, C54
Knudsen et al. [22]Epoxy, epoxy mastic and polyurethane top coatatmospheric, coastalC51, 2
Binder [23,24]Epoxy and polyurethaneatmospheric, splash and immersion zone, inland and coastalC2, C3, C45
1 The substrate in the respective study was carbon steel if not stated otherwise. Additives such as functional pigments (Zinc, Iron oxide, Aluminum) and high-solid variants are not listed.
There are, however, reports about testing in coastal environments, which includes exposure to humidity and chlorides. Almeida et al. tested the anticorrosive performance of waterborne coatings in Lisboa (C3) and Sines (CX) (Portugal) for 24/30 months, comparing the results with salt spray testing and the prohesion test [15]. Zhang et al. studied the correlation between natural exposure and artificial aging tests for epoxy polyurethane anticorrosion coating systems for marine applications in a marine atmosphere in Sanya, Hainan province (China), with an exposure time of 24 months [16]. Davalos-Monteiro et al. tested powder coatings under cyclic aging and natural exposure in Florida (USA) for 4 years [17]. LeBozec et al. studied the correlation between standardized lab tests, including salt spray testing (ISO 9227) and cyclic aging testing (ISO 20340, now ISO 12944-9 [25]), and field exposure [18]. For this, they tested fifteen anticorrosion coatings for offshore and naval application for 2 years in Brest (France) in a coastal C5 atmosphere and on a container carrier ship in operation. Similarly, Pélissier et al. studied 11 coating systems in Brest and on a ship operating on the French coast [19]. Momber et al. studied the anticorrosive performance of repair coatings for offshore wind power constructions with an exposure of 57 months in Helgoland (German North Sea) [20]. Perrin et al. applied salt spray testing and cyclic aging testing to three anticorrosive coating systems and also exposed samples for 4 years in France and the USA in a C3 and C5 atmosphere [21]. Knudsen et al. evaluated the correlation between standard accelerated tests such as the salt spray test and the cyclic aging test described in ISO 12944-9 and field performance. For this, they exposed samples of 26 epoxy coating systems to a C5 atmosphere in Norway for 1 and 2 years [22].
The Federal Waterways Engineering and Research Institute tests coatings for use on structures of the German Federal Waterways. These tests include, among others, lab methods as given in ISO 12944-6 as well as 5-year outdoor exposure in different natural environments, including the atmospheric zone, the splash zone and full immersion. Results from previous outdoor exposure experiments have been reported by Binder [23,24].
Lab tests are used to identify and reject coatings with a weak performance, while outdoor testing is used to confirm positive lab testing results under more realistic conditions. Coatings are approved when the requirements given in [26] are met in lab testing, under the condition that this approval can be revoked if the coating fails the tests in the natural environment. Obviously, a good agreement between the test results from the lab and from outdoor exposure is needed. Lab testing should ideally identify in advance all coatings that will fail in the field but should not reject coatings with adequate performance in the field. Here, the results of a 5-year outdoor exposure of 19 organic coatings used for hydraulic steel structures are compared with the respective lab results to evaluate the correlation between lab and outdoor testing.

2. Materials and Methods

2.1. Samples

All samples were prepared on mild steel according to EN 10025-2 [27], e.g., S235. The surface of the test panels was Sa 2½ according to ISO 8501-1 [28] and had a profile roughness of grade medium (G) according to ISO 8503-1 [29]. Airless spray was used for coating. In this study, 19 coatings were tested and evaluated. The respective number of coats and their thickness followed the specification given by the manufacturer. More details are given in Table 2.
The size of the samples, as specified in [26], was 340 mm × 400 mm for outdoor exposure, 150 mm × 100 mm for NSS testing and 200 mm × 300 mm for abrasion resistance. For NSS testing, three identical samples of each system were tested. For abrasion testing, two identical samples were tested. Under outdoor exposure, only one sample of each system was tested per exposure zone and location, due to space limitations.
The samples for NSS testing and outdoor exposure received a vertical scribe with a width of 2 mm and a length of 70 mm (NSS) or 200 mm (outdoor exposure) on the front side. The scribe was deep enough to remove the coating, but did not measurably cut into the surface of the steel. This artificial damage was produced in our mechanics workshop using a milling machine.

2.2. Laboratory Testing Methods

2.2.1. NSS Testing

NSS testing was carried out according to ISO 9227 [5]. The samples were tested for 1.440 h at a temperature of 35 ± 2 °C. They were held at an angle of 20 ± 5° to the vertical. The salt (NaCl) spray solution had a concentration of 5% by weight and a pH value of 6.5–7.2.

2.2.2. Pull-Off Adhesion

Pull-off adhesion was tested according to ISO 4624 [30]. After salt spray testing, the samples were left under room conditions for 48 h. Subsequently, three pull-off adhesion tests were performed per sample, from which the average value is used here. Additionally, one pull-off adhesion test was performed on an untested reference sample.

2.2.3. Abrasion Testing

Abrasion resistance was determined as the key mechanical property of a coating in approval testing according to [26]. Abrasion testing was carried out according to the specification given in [26]. The samples were stored in tap water for 6 months. After that, they were mounted to the inner surface of an octagonal rotating steel drum, with each of the eight sides of the drum holding one of the 200 mm × 300 mm plates. A mixture of basalt grit (2.0 kg grain size 8/12 mm, 1.0 kg grain size 5/8 mm and 1.0 kg grain size 3/5 mm) and 8.0 kg water was added as abrasive material. A test cycle consisted of 40,000 turns of the drum at 16 turns per minute. A test included two to five cycles, depending on the abrasion resistance of the coating.

2.3. Outdoor Exposure

The sites for outdoor exposure were in Büsum (North Sea), Kiel (Baltic Sea), Trier (river Moselle, fresh water) and Windheim (river Weser, fresh water with slightly increased salinity). These sites can be differentiated by their corrosivity; Trier and Windheim represent fresh water (Im1 according to ISO 12944-2 [31]), and Büsum and Kiel represent sea water (Im2 according to ISO 12944-2 [31]). The atmospheric corrosivity for steel samples was C2 for the fresh water sites, C3 for Büsum and C4 for Kiel. More details on the properties of the water at the sites can be found in Table 3. The Chloride and Calcium contents and the Carbonate hardness were measured using MQuant titrimetric tests bought from Merck Millipore. The Carbonate hardness is reported in °dH, with 1 °dH corresponding to the equivalent of 10 mg CaO per litre. The Sulfate content was measured using the colorimetric test kit VISOCOLOR bought from Macherey-Nagel. The salinity refers to the salt content of the water and is measured in g (salt) per kg (water). The Wo-value is an index for the corrosion likelihood of metallic materials according to [32]. It is calculated from various factors, including the type of the water body (standing, flowing, coastal), the zone (atmospheric, splash, immersion), Chloride and Sulfate content of the water, pH and others. More negative values indicate higher corrosivity.
Each system was exposed for 5 years at each site in three zones. One sample was fully immersed, one sample was partially immersed in the splash water zone and one was completely above water in the atmospheric zone.

2.4. Evaluation of the Results

After NSS testing, the surface of the coatings was visually evaluated according to ISO 4628-2 [33] (blistering), ISO 4628-3 [34] (rusting), ISO 4628-4 [35] (cracking) and ISO 4628-5 [36] (flaking) immediately after the end of the test. Then, the samples were rinsed with warm tap water, dried using paper towels and dried in the room atmosphere for an hour. To measure the corrosion creep at the scribe, the coating around the scribe was removed using a chisel and a hammer. After drying, the corrosion around the scribe was documented and analyzed digitally using OLYMPUS Stream Motion 2.4 software. The average corrosion creep per side of a sample was calculated by measuring the corroded area, subtracting the area of the scribe, dividing by the length of the scribe and dividing the result by two. For approval according to [26], two of the three samples had to fulfill the following criteria: blistering 0(S0), rusting Ri0, cracking 0(S0), flaking 0(S0) on the surface, corrosion creep ≤ 1.0 mm. For correlation purposes, the average corrosion creep of the three samples is used.
After the outdoor exposure, the samples were retrieved and cleaned of fouling by water jetting. Evaluation of the coating surface and scribe was performed as described above. The approval conditions according to [26] for the coating surface were the same as for the lab testing samples, namely, no blistering, rusting, cracking or flaking. The limit values for corrosion creep are given in Table 4.
During abrasion testing, the coating thickness was measured at defined spots of the sample after each test cycle. The material loss was calculated from the reduction in coating thickness. The result of abrasion testing aW is defined as material loss in µm per 10.000 turns. Values for aW ≤ 40 are considered an indication of strong resistance to abrasion.

3. Results

3.1. NSS Testing and Outdoor Exposure

Table 5 shows the results for the corrosion creep at the scribe after NSS testing and after outdoor exposure.
For most locations and zones, a broad spectrum of values for the corrosion creep was obtained. The corrosion creep of the following systems exceeded the average of all systems in the same location and zone by a factor of 3: System 2 in the Büsum splash zone, System 7 in the Trier immersion zone and Kiel immersion zone and System 18 in the Trier splash zone, the Windheim splash zone and immersion zone, the Kiel immersion zone and the Büsum atmospheric zone. On the other side of the spectrum, Systems 1, 9, 12 and 19 showed corrosion creep values well below the average in multiple locations and zones.
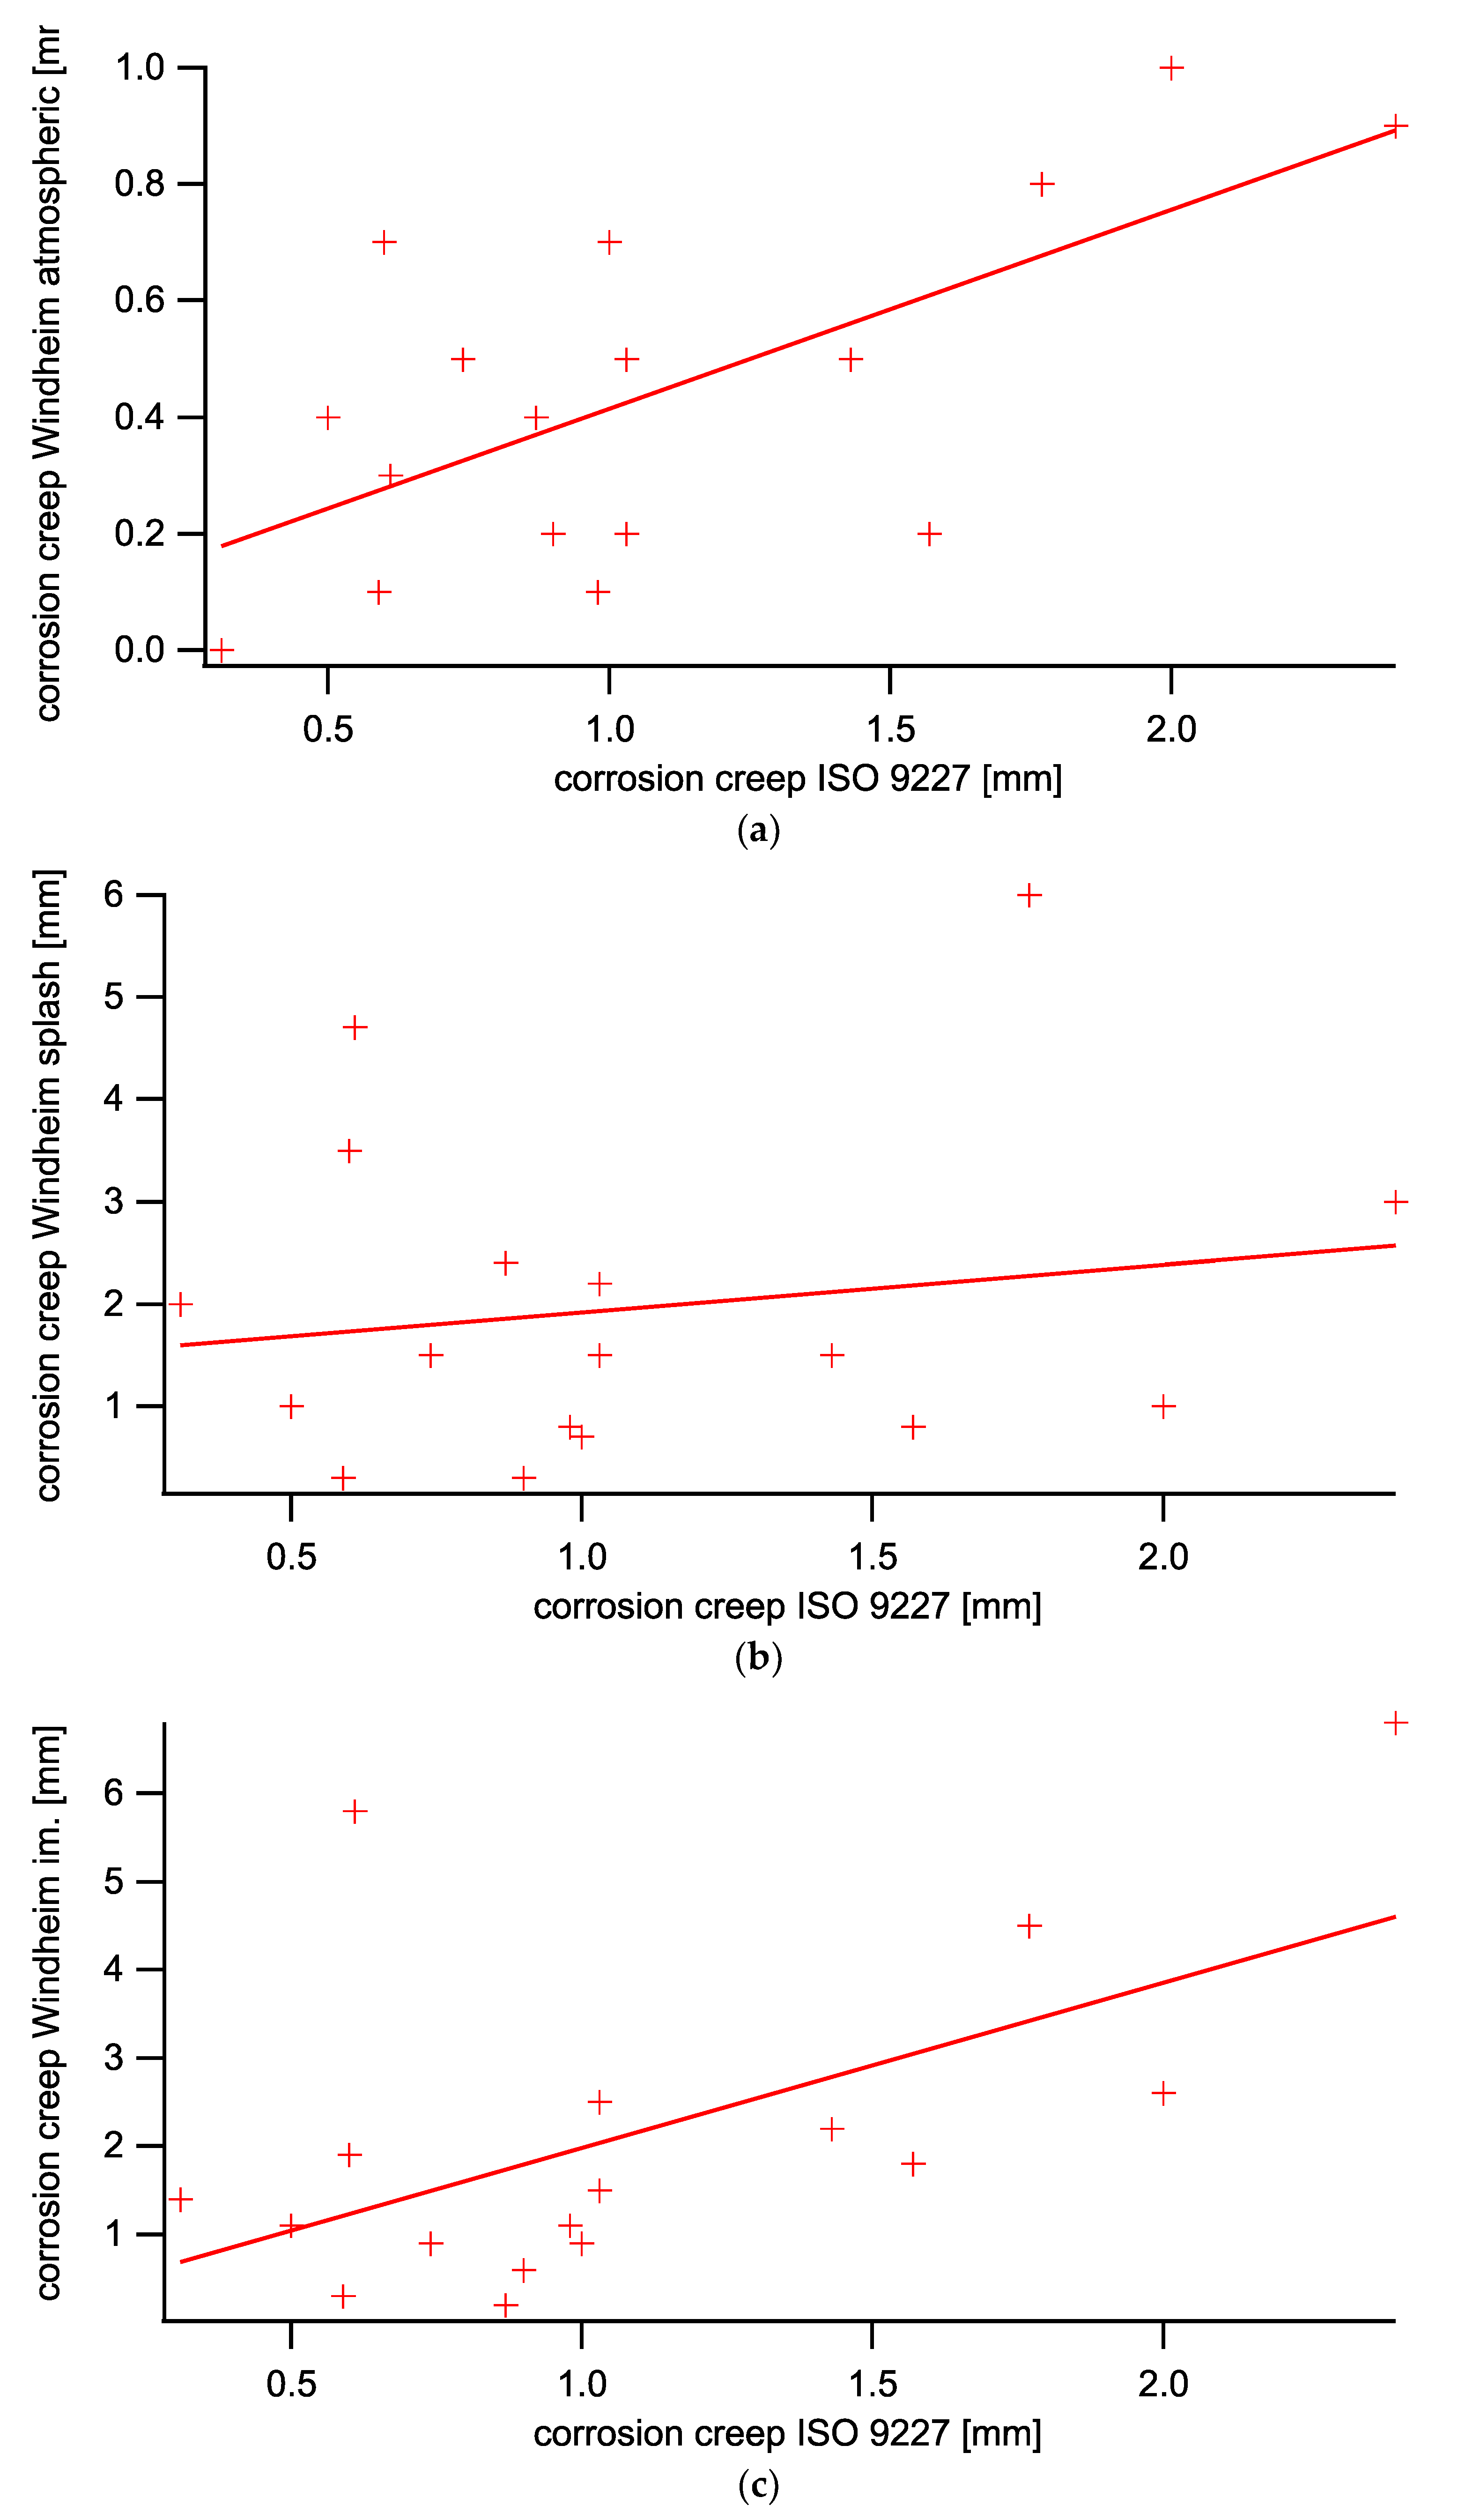
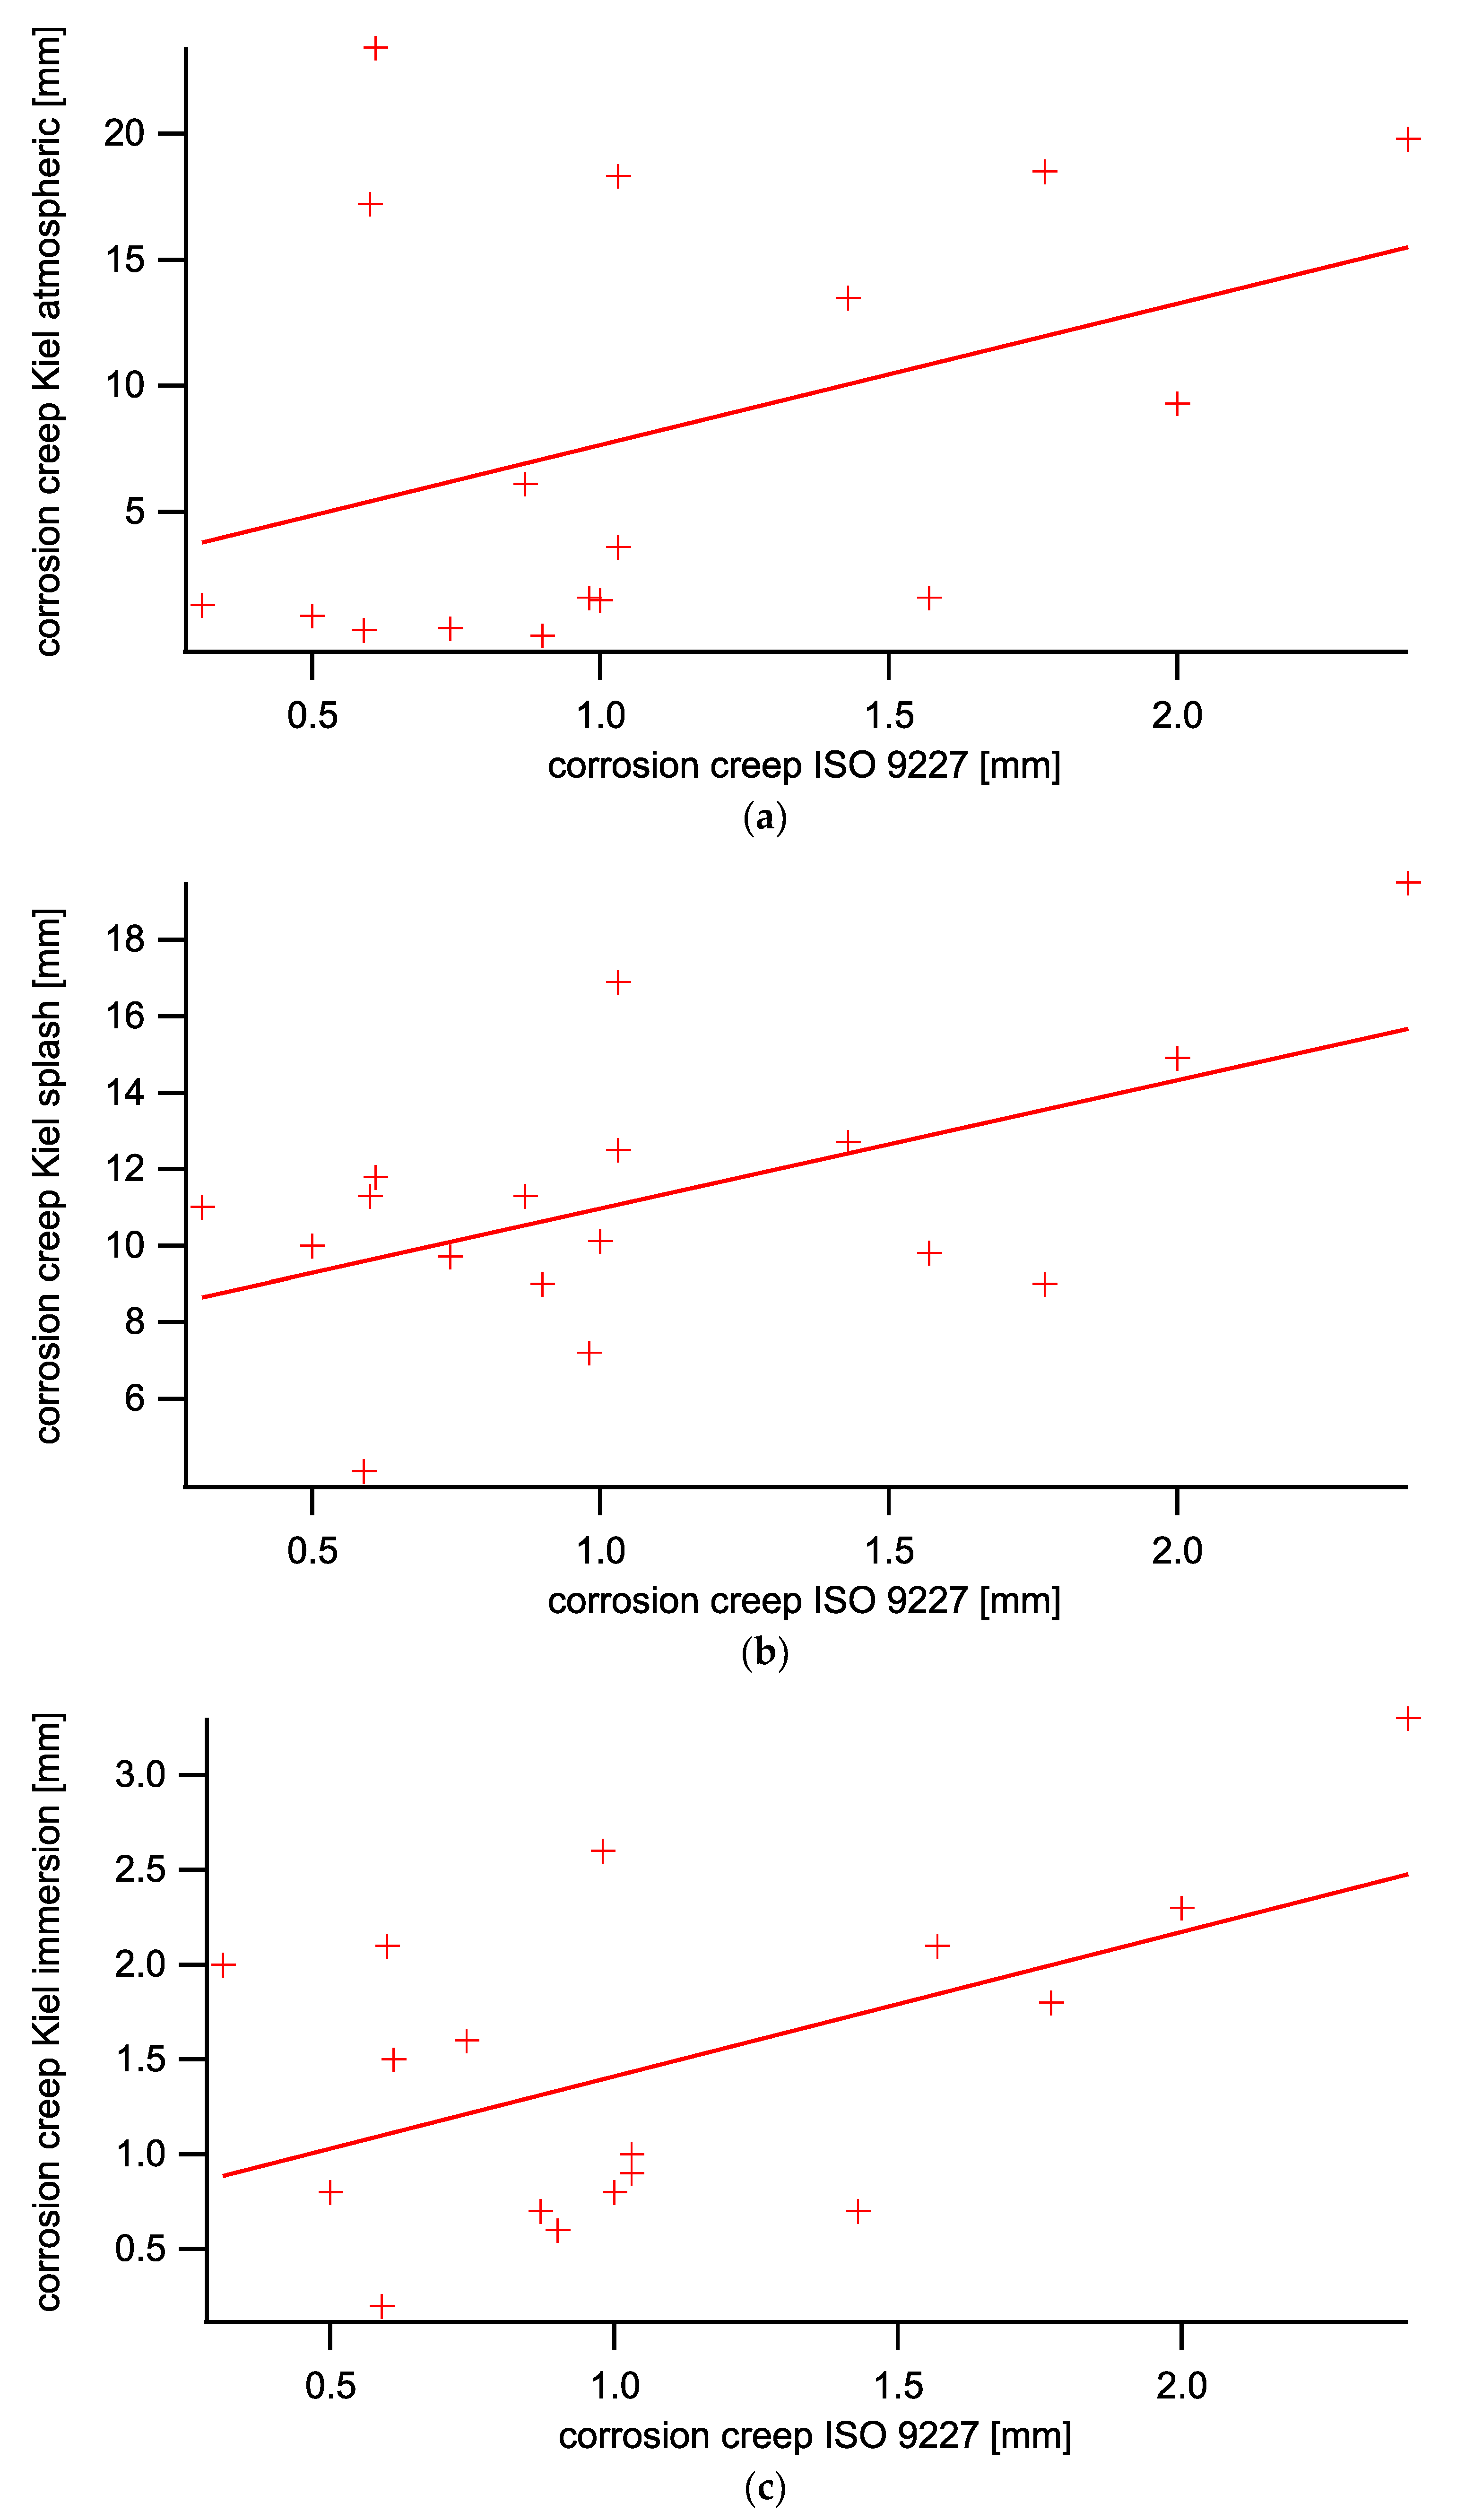
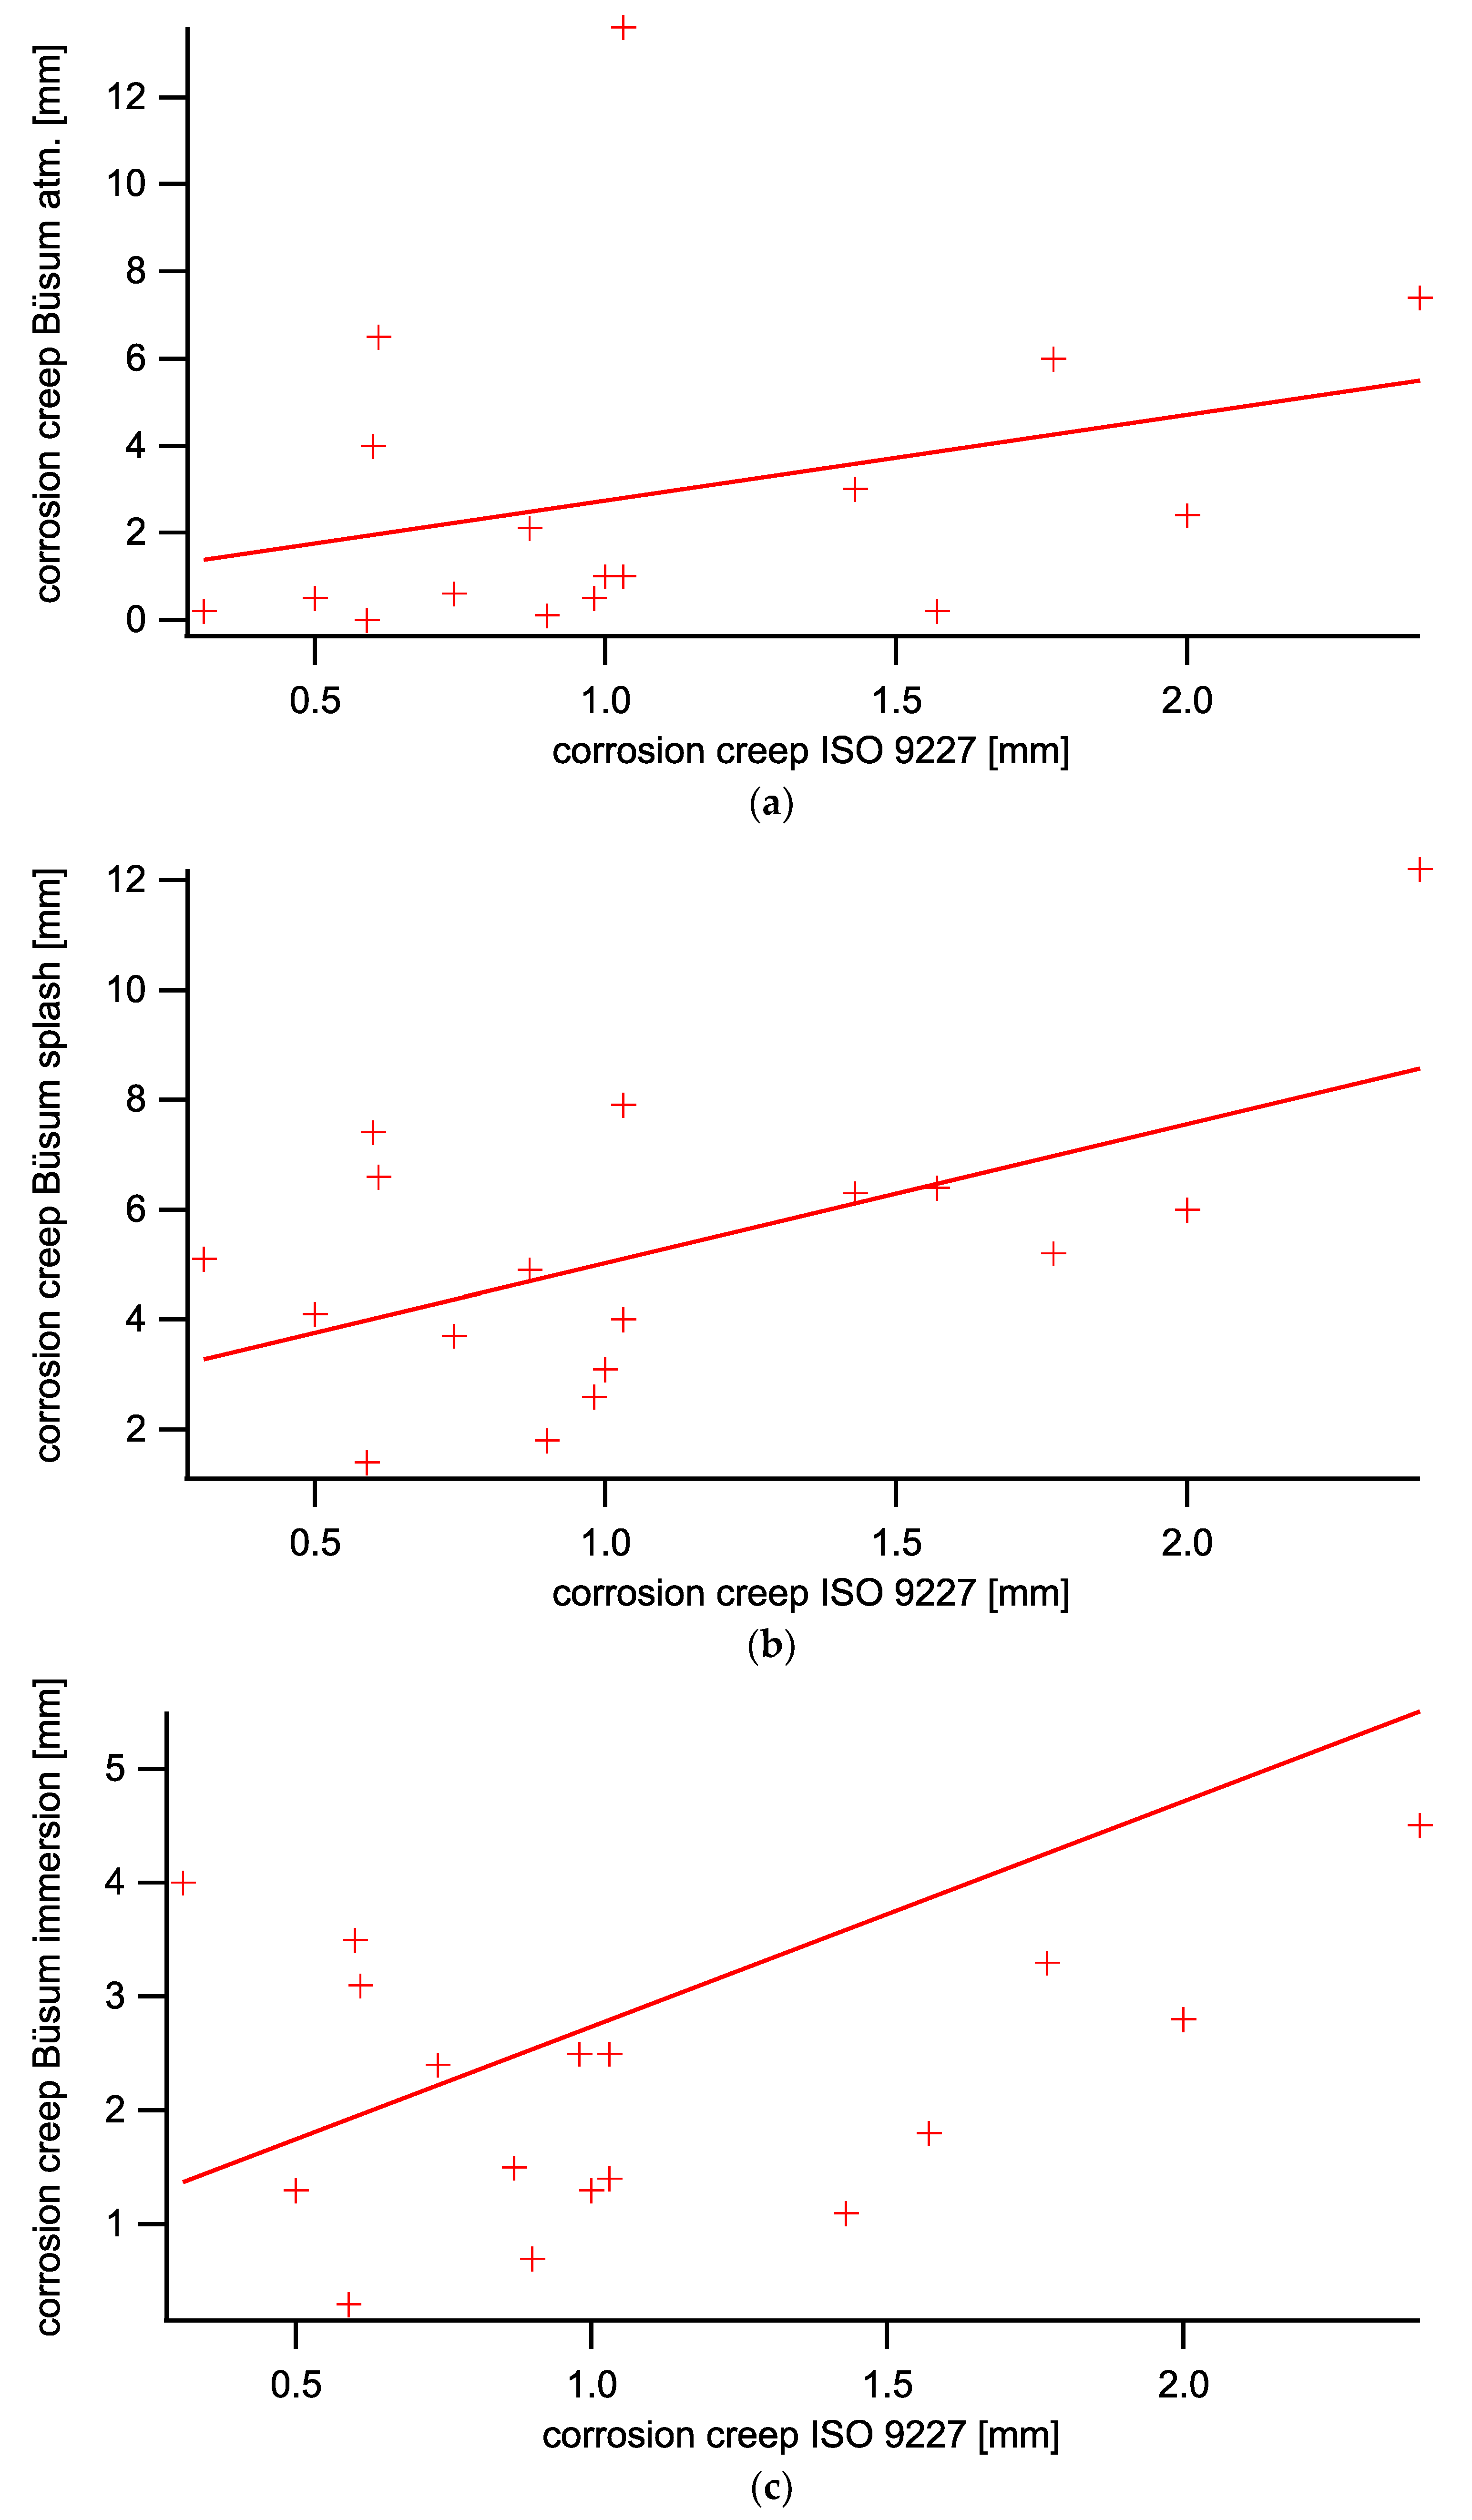
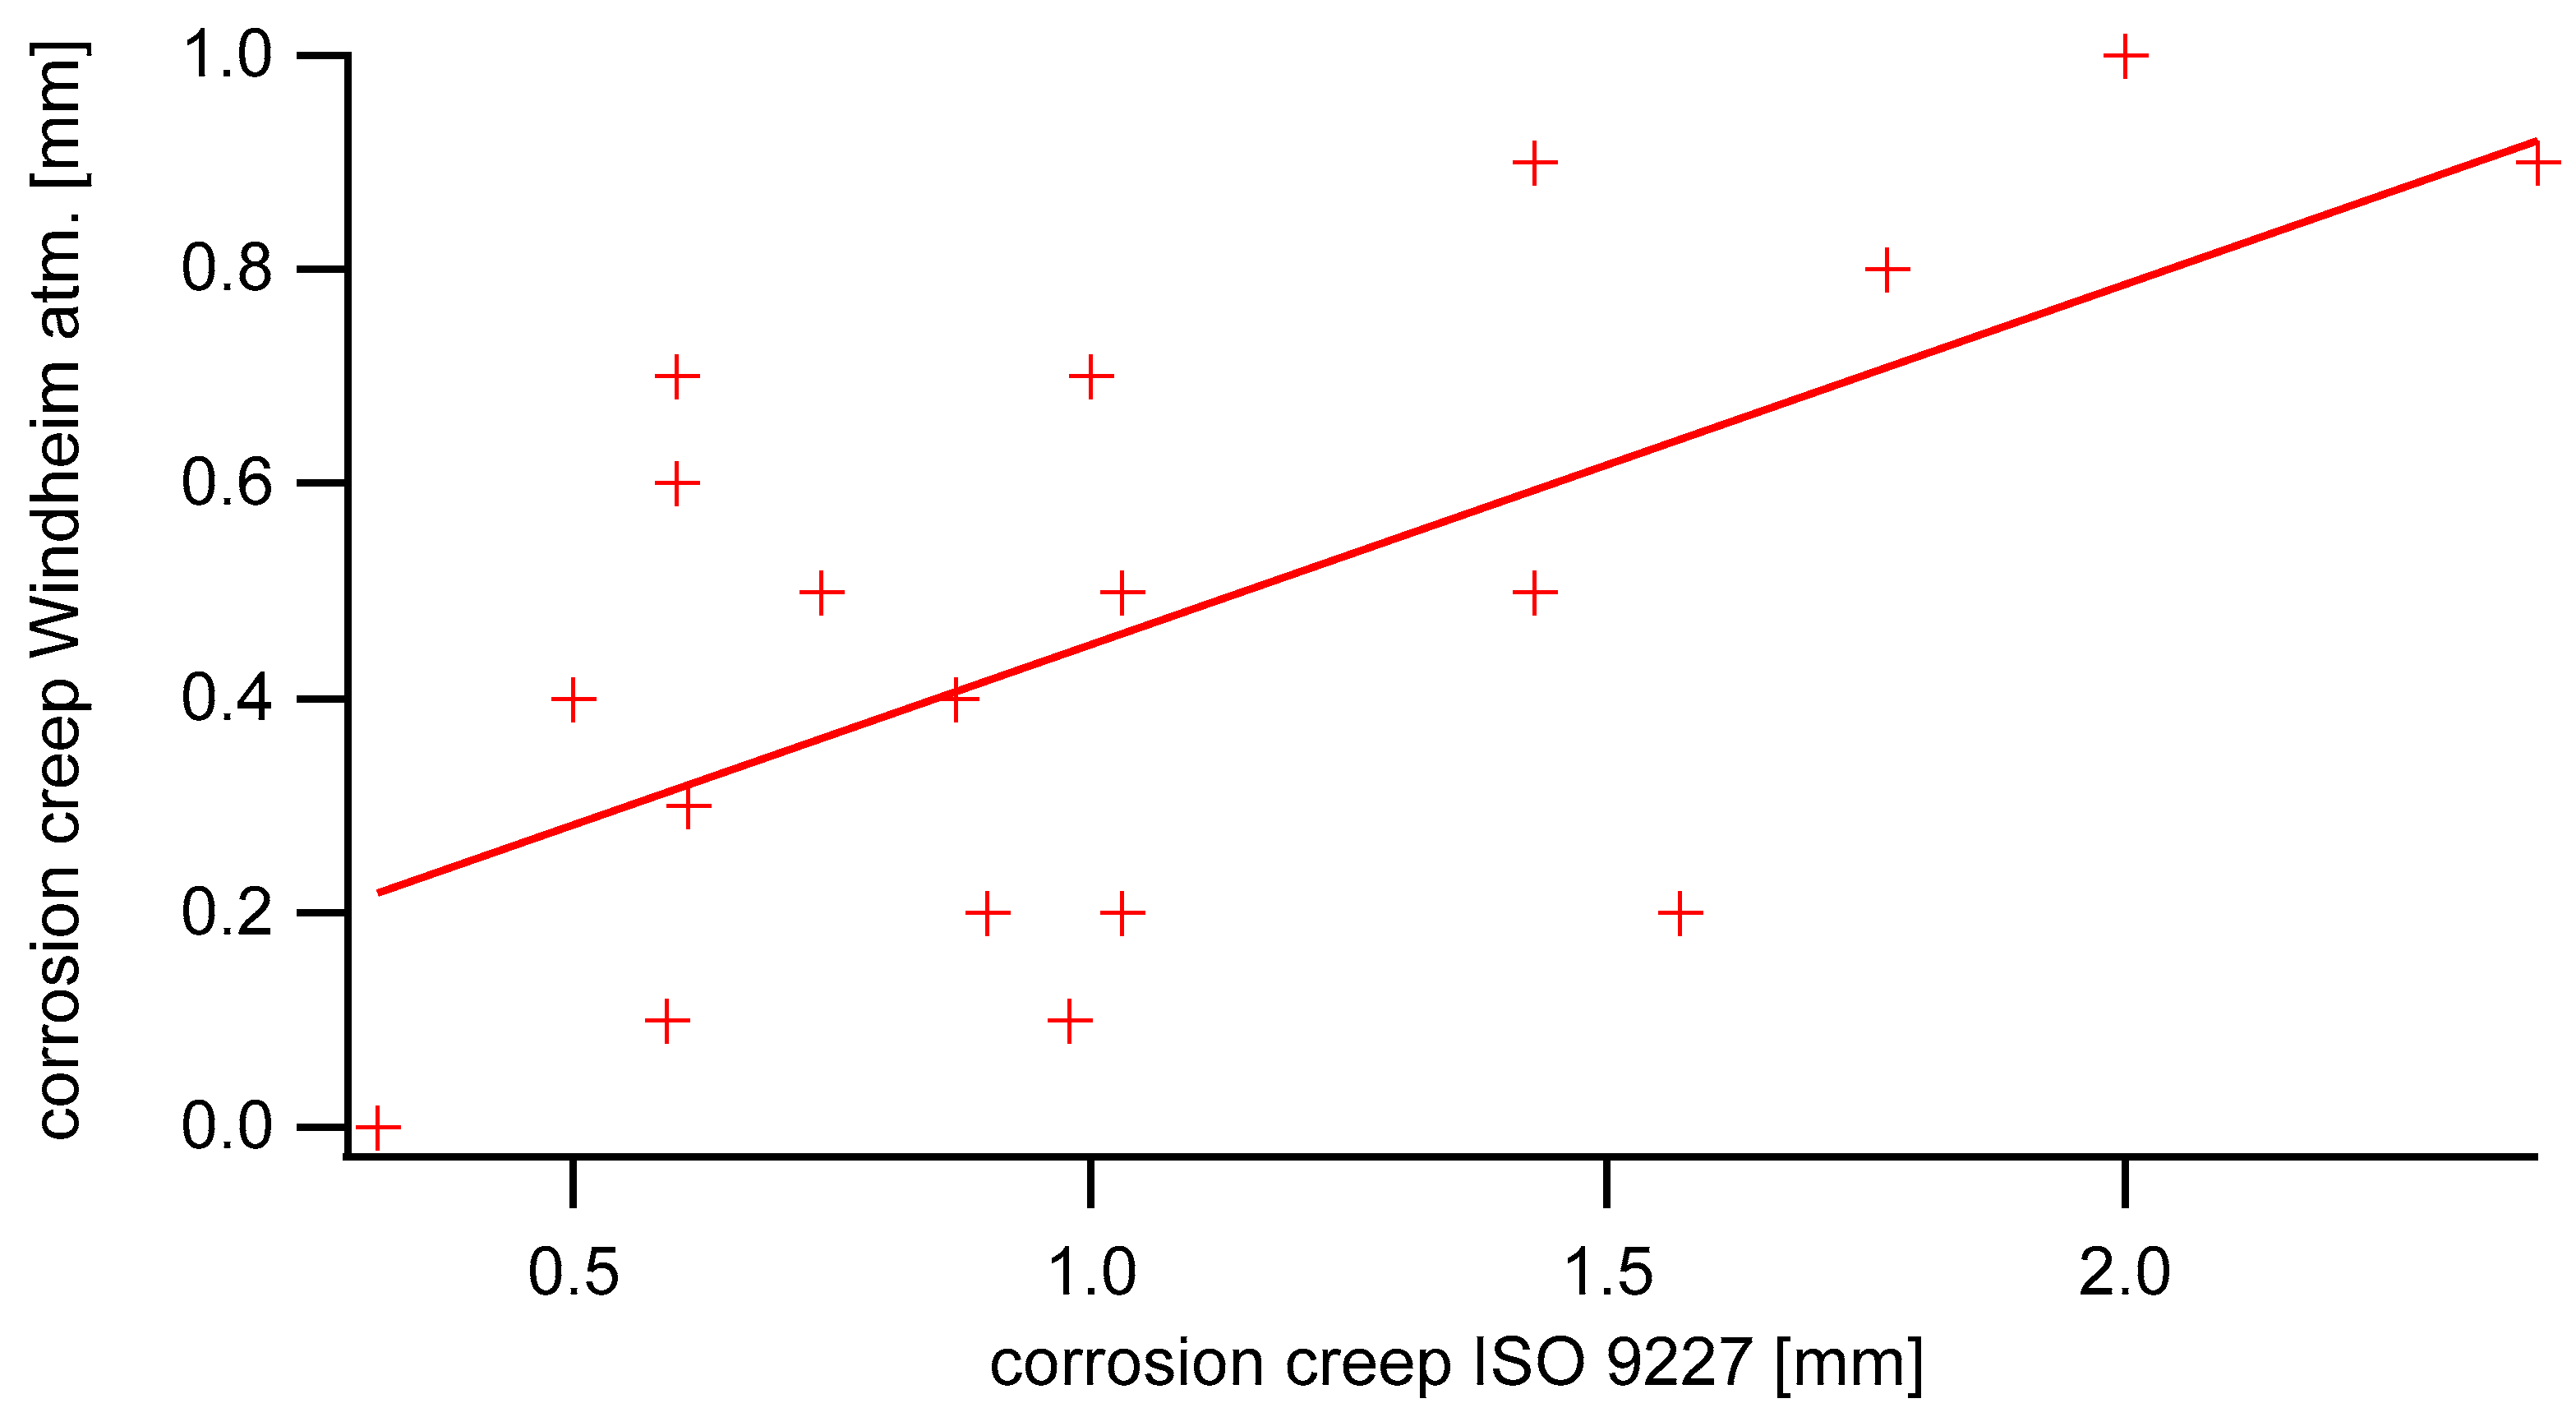
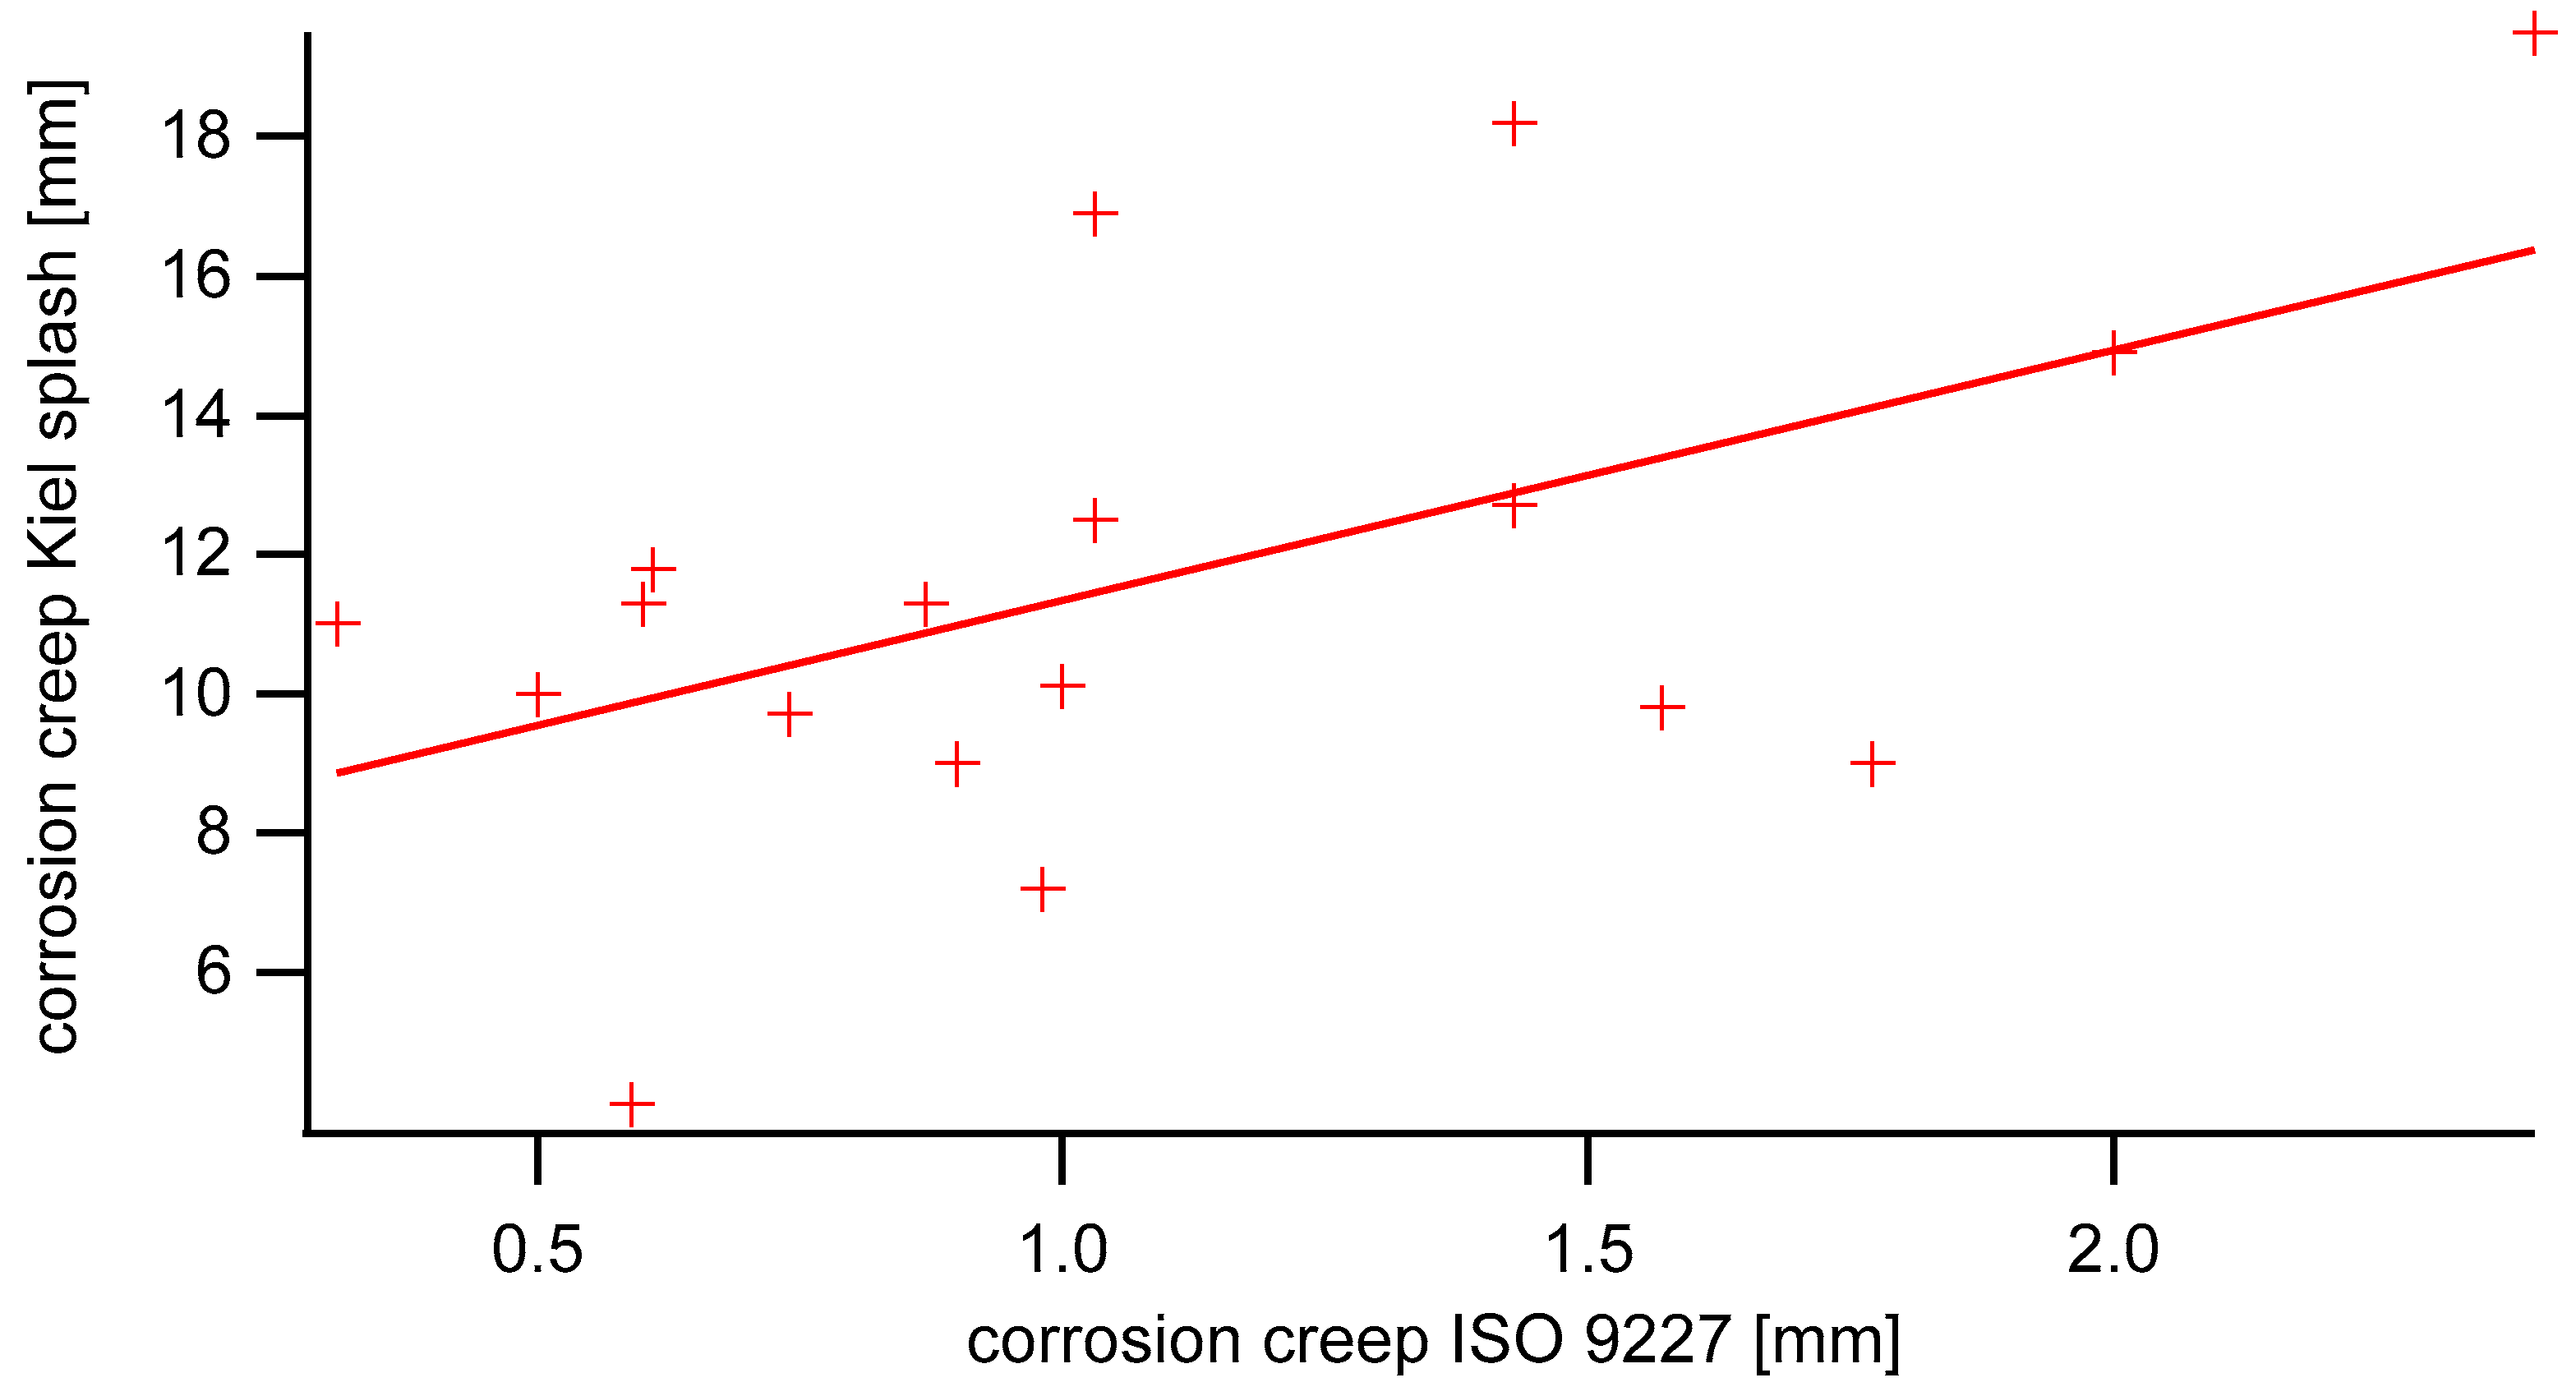
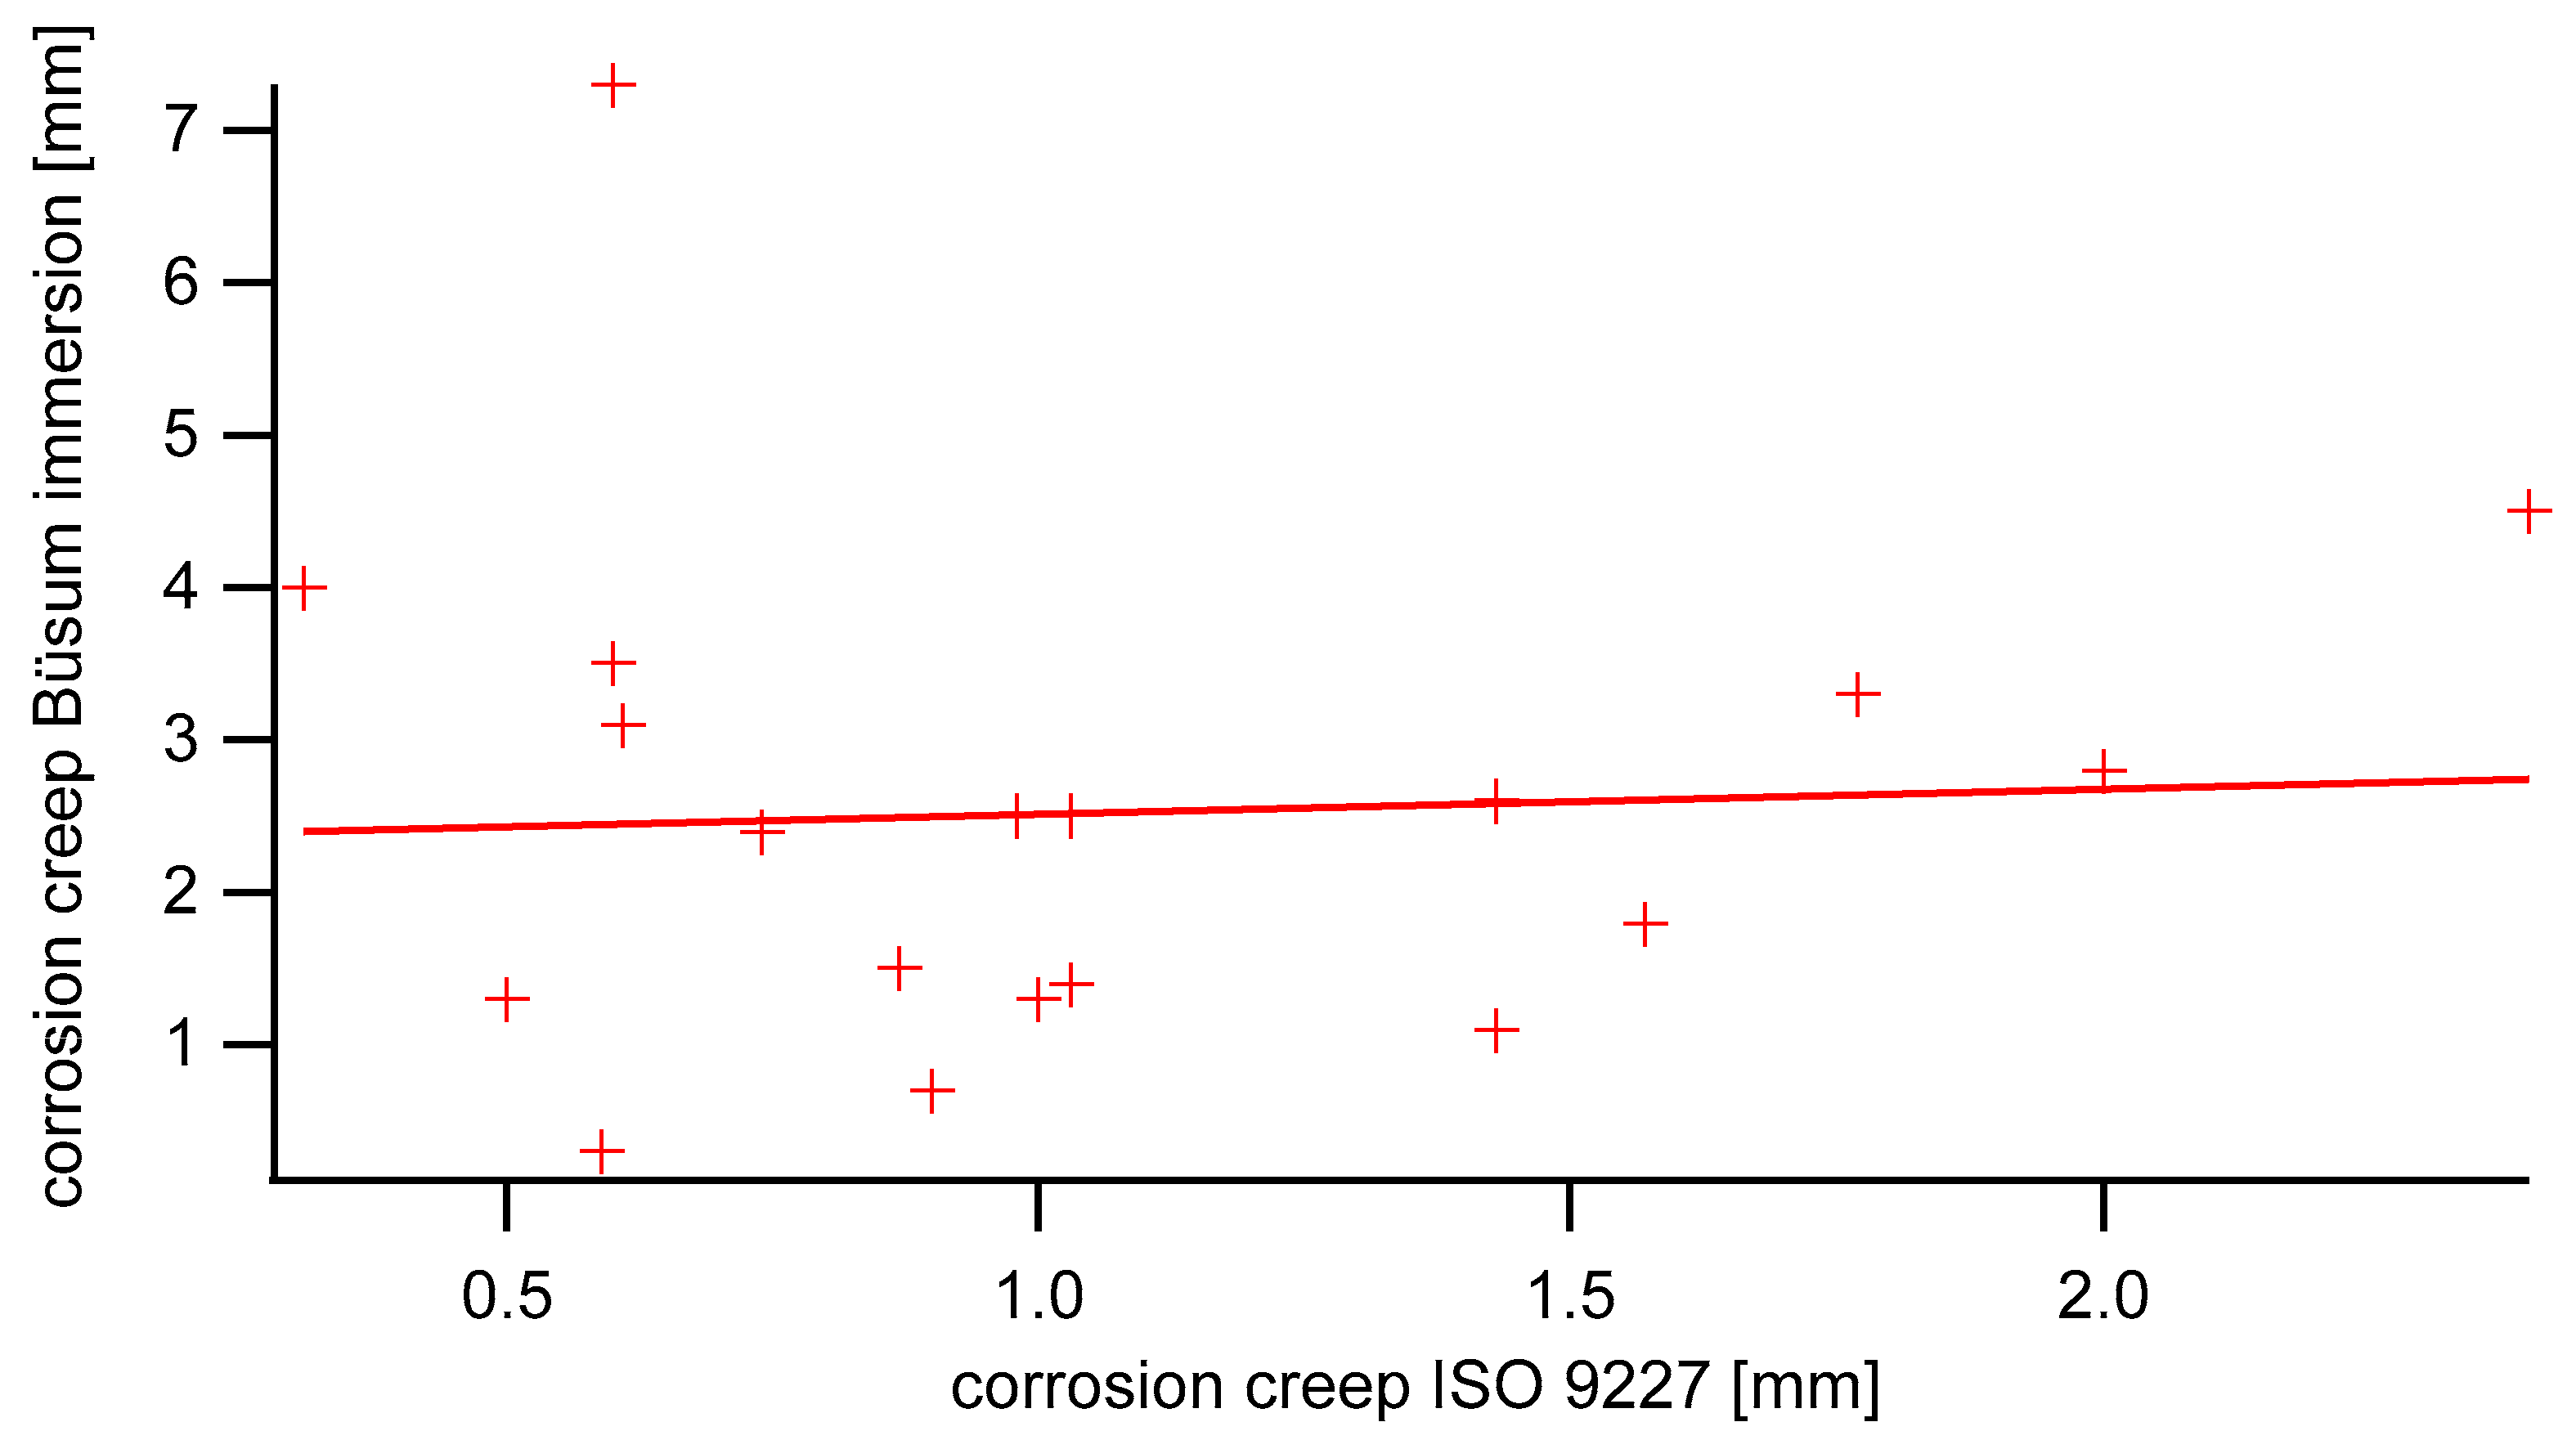
In order to compare the results from NSS testing and outdoor exposure, the data for each location and each zone were plotted and fitted with a linear function (y = a + b∙x). For some examples, see Figure 1, Figure 2, Figure 3 and Figure 4. Table 6 lists the coefficients of the fit function and the results of Pearson correlation. For the correlation of ISO 9227 and the Windheim splash zone and immersion zone, System 7 was not included due to missing data. Although NSS testing is only used for lab approval for Im2, the data from all outdoor locations are used here.
The results for NSS testing and for each zone were tested for normal distribution using the Shapiro–Wilk test. The results for most zones showed values of p smaller than 0.05, indicating that the results were not normally distributed. Only the Trier atmospheric zone, Windheim atmospheric zone, Kiel splash zone, Büsum splash zone and the results of NSS testing showed a normal distribution.
While there is some agreement between the results from NSS testing and outdoor exposure, i.e., systems with high corrosion creep in the NSS test also had high corrosion creep under outdoor exposure, only for the Windheim atmospheric zone, Windheim immersion zone, Kiel splash zone and Büsum splash zone were statistically significant correlations with p < 0.05 found. The strength of these correlation was moderate to good, with r-values between 0.47 and 0.62.
The coefficient b, giving the slope of the fit, was in the range of 0.2–1.3 for Trier and 0.3–2.2 in Windheim (both Im1), with the smallest slope in the atmospheric zone. In Kiel and Büsum (both Im2), the smallest slope was found for the immersion zone. The slope coefficients for the other zones were 3.6 and 5.8 in Kiel and 2.2 and 2.6 in Büsum. This fit parameter can be interpreted as the inverse of the acceleration factor.
Most systems showed no blistering, rusting, cracking or flaking, with the exception of System 1, which showed blistering in the Büsum splash zone, System 4, which showed minor rusting of the surface in the Kiel atmospheric zone, and System 7, which showed blistering in the Trier splash zone. Due to the general good performance, these data could not be used for further analysis.

3.2. Pull-Off Adhesion

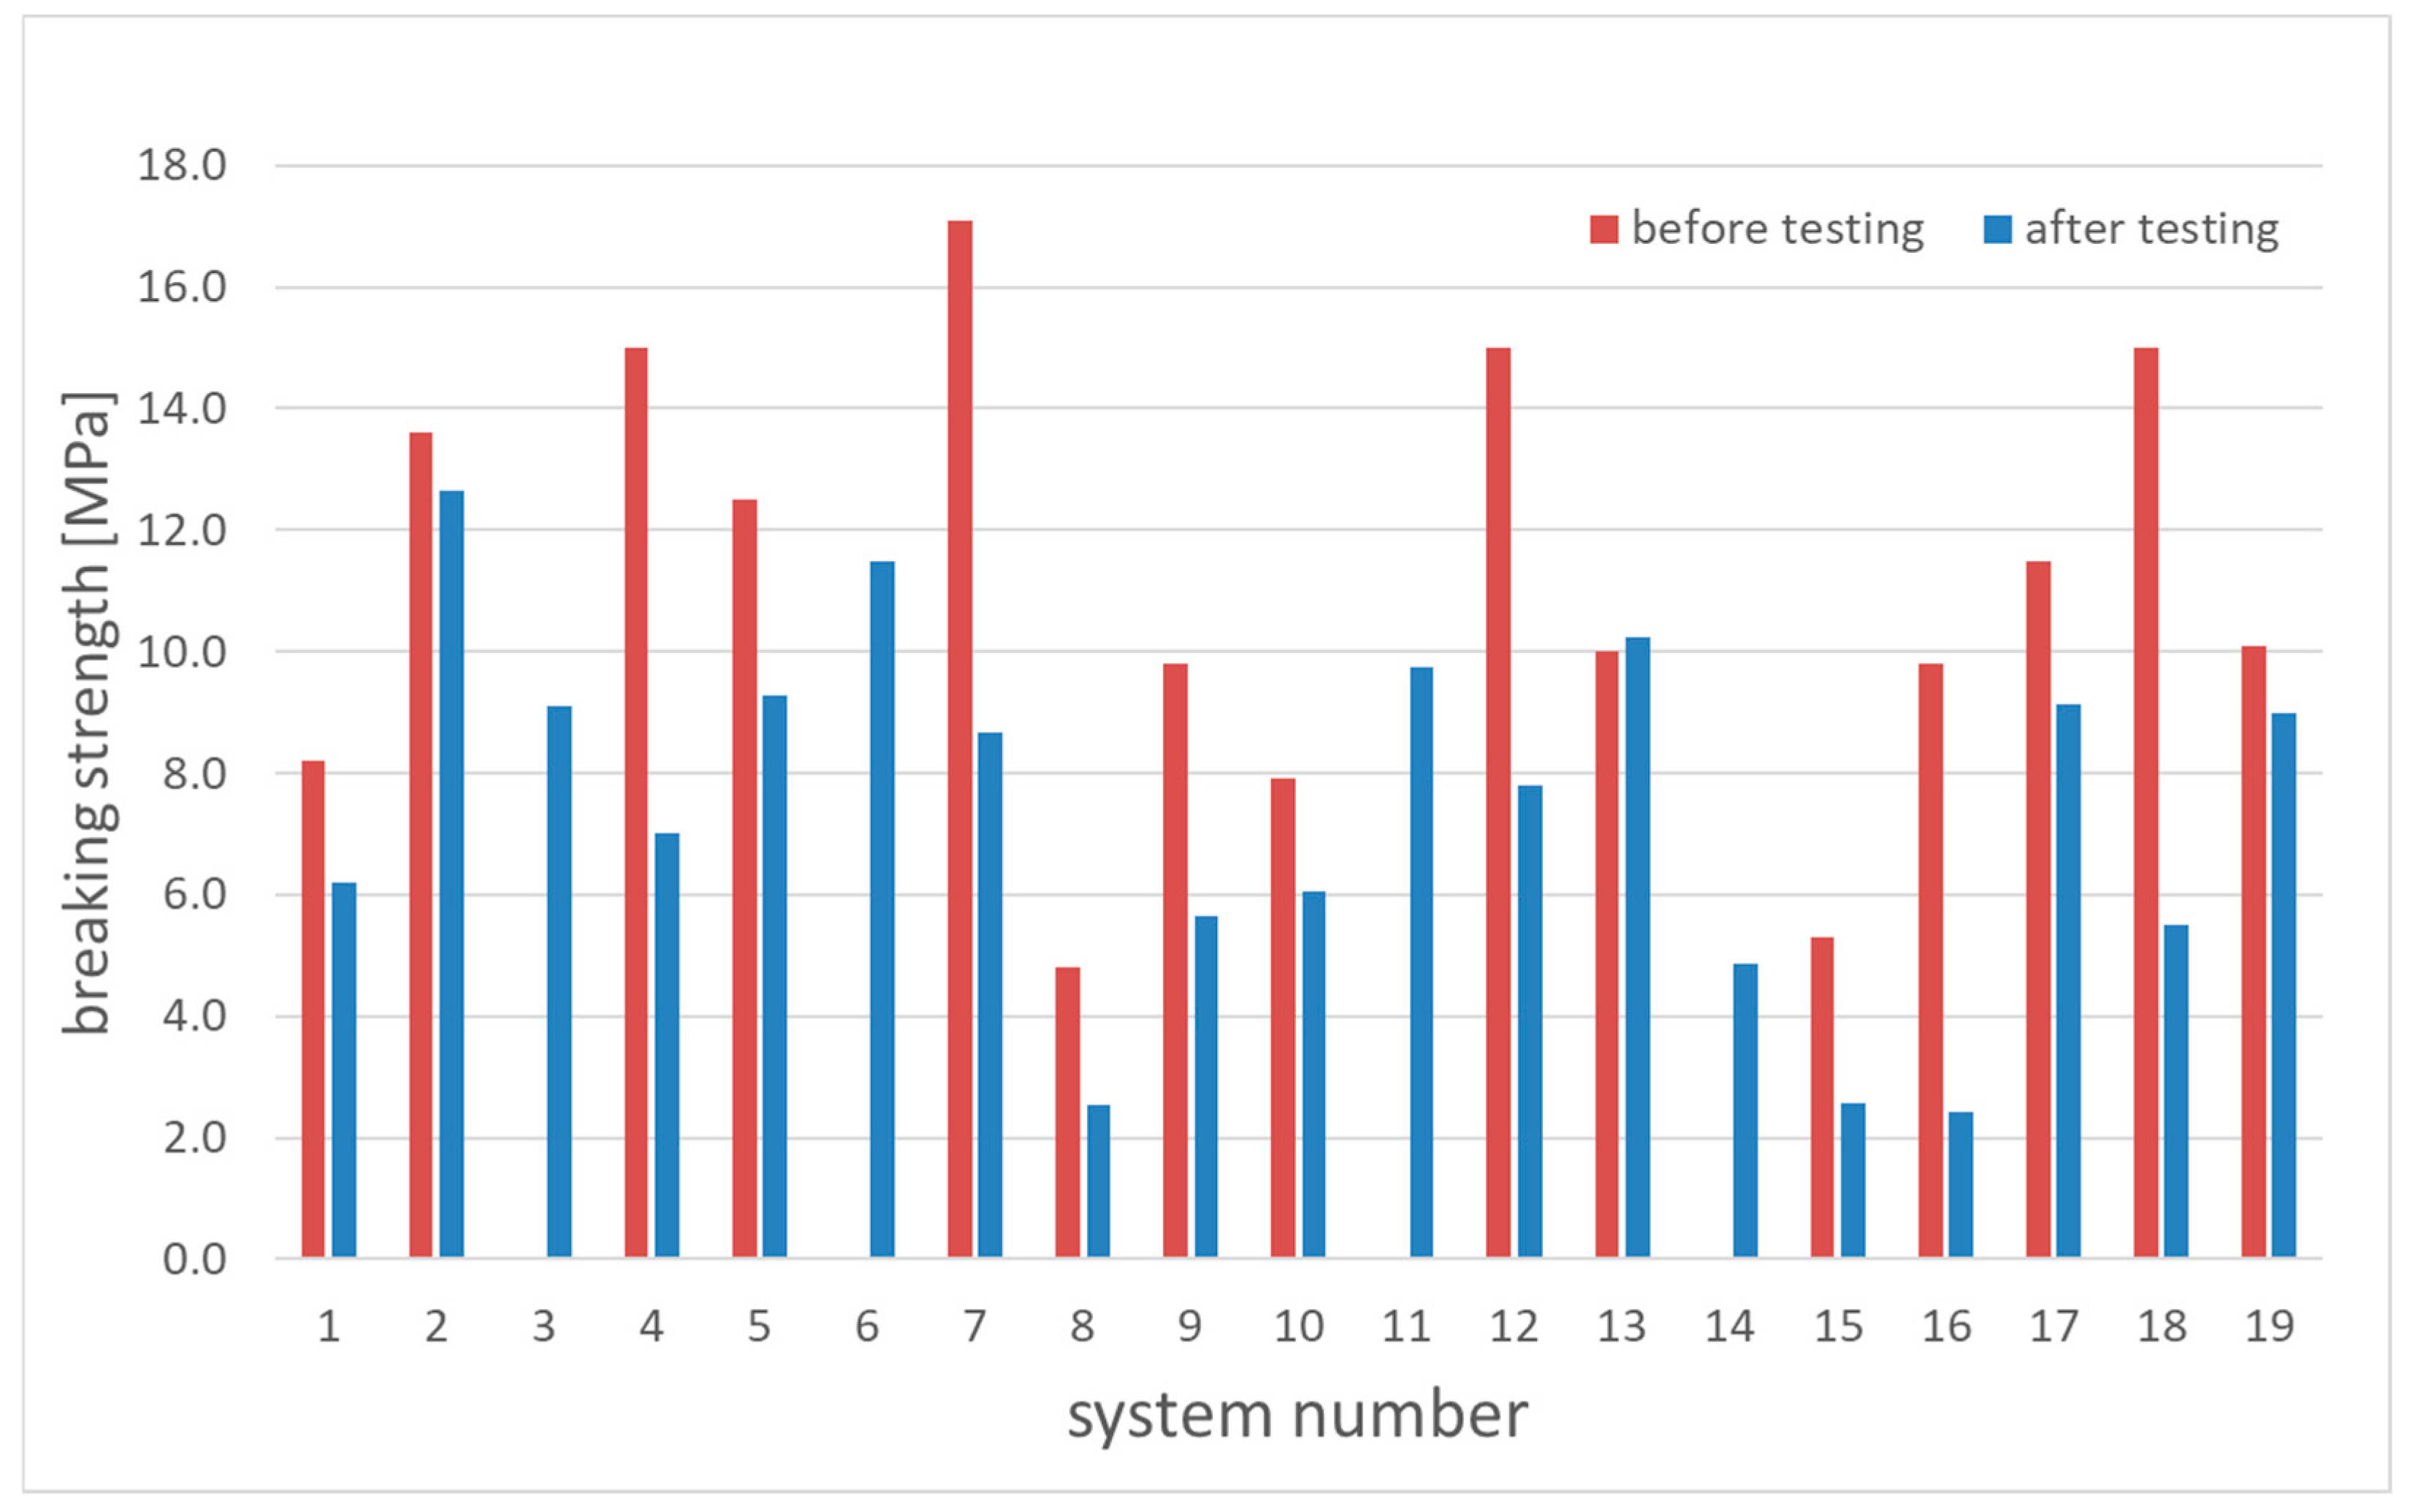
Table 7 gives the breaking strength σ and type of fracture of the pull-off adhesion tests. As described by ISO 4624 [30], B denotes a fracture within the first layer of the coating on the steel surface, C a fracture within the second layer and A/B a fracture between the steel surface and the first layer. Figure 5 shows the comparison of the breaking strength before testing and the average pull-off strength after NSS testing. Unfortunately, no samples were available for adhesion tests after outdoor exposure.
As expected, the breaking strength of most systems was lower after NSS testing, with the exception of System 13, where the breaking strength increased slightly. The breaking strength of Systems 4, 7, 8, 12 and 15 decreased by about 50% after testing and the breaking strength of Systems 16 and 18 decreased even more.
The initial breaking strength σi, the breaking strength after salt spray testing σ, the change in breaking strength Δσ and the change in breaking strength in relation to the initial breaking strength were tested for correlation with the corrosion creep in all four locations and each zone and the corrosion creep in ISO 9227 testing using Pearson correlation. Systems with missing datapoints were excluded. Each of the four datasets passed the test for normal distribution (Shapiro–Wilk) with p > 0.05.
Intuitively, one would expect adhesion to have a major influence on the corrosion creep of a system. Strong adhesion should lead to small values for the corrosion creep by limiting the diffusion of aggressive ions under the coating. Out of all correlations tested, on a statistically significant level, this was only found for the breaking strength after salt spray testing σ in the Trier atmospheric zone, with r = −0.56. All other negative correlations were above the statistical significance level of p = 0.05. It should be noted that this correlation was expected for the breaking strength measured on the respective exposure samples. The comparison of the corrosion creep in NSS testing and the breaking strength after NSS testing showed no statistically significant correlation. Contrarily, statistically significant positive correlations were found for the initial breaking strength σi in the Windheim splash and immersion zone, Kiel atmospheric zone and all zones in Büsum. The correlation coefficients ranged between 0.54 and 0.65. This means that systems showing good adhesion before testing also showed high corrosion creep in outdoor testing.

3.3. Abrasion Testing

Table 8 shows the result of abrasion testing, aW, the average material loss per 10,000 turn. Because the outdoor exposure tested for anticorrosive performance, a systematic correlation between the results of abrasion testing and outdoor exposure was neither expected nor found in the data.

4. Discussion

The aim of lab testing according to the test guideline of the Federal Waterways Engineering and Research Institute [26] is to identify coating systems with a good performance which are suitable for application on the federal waterways. This is ultimately demonstrated by the performance under outdoor exposure, but lab testing should produce these results in advance, as accurately as possible. Table 9 shows approval based on the respective pass/fail criteria after lab testing and after outdoor exposure for each system. The results of NSS testing are used for lab approval for Im2. The lab approval for Im1 uses a cyclic condensation test specified in [26]. These results are not reported here in detail because all systems passed this test.
Of the 19 systems tested in the lab and in outdoor exposure, 11 showed matching results in both immersion categories, 6 showed partial matches with differing results between the two settings in one immersion category and 2 systems showed completely different results in NSS and outdoor testing (see Table 10). Summarized by immersion categories, the results for NSS and outdoor testing agreed for 14 of 19 systems in Im1 and for 14 of 19 systems in Im2. This shows that NSS testing was a good indicator of the outdoor performance for most systems, but that there was still a considerable number of systems that performed different than expected in the field.
Noticeably, all systems passed Im1 lab testing. Any system not passing Im1 outdoor testing is therefore listed as a difference. It can be concluded that, in order to improve the agreement between lab and outdoor testing for Im1, lab testing should be better able to find unsuitable systems. This could be achieved by using longer test times, stricter requirements for the measured values or other testing methods altogether. For Im2, the picture is not as clear as for Im1. Of the five differences, four were due to systems not passing in outdoor testing and one due to not passing in the lab, meaning that lab testing (in this case, NSS) produced in one case a “false negative” result by rejecting a system that was accepted in outdoor testing.
A common cause for the differences can be found in the type of coating. The systems tested can be categorized as epoxy coatings with and without Zn primer and other systems, namely, an epoxy coating with Al primer, a two-component polyurethane coating without primer and a one-component polyurethane coating with Zn primer. Looking at the results for the outdoor testing, it is noteworthy that only three of seven epoxy systems without Zn primer passed Im1 testing, and only one passed Im2 testing. However, all epoxy systems with Zn primer passed Im1 testing and eight of nine systems passed Im2 testing. This trend continued for the two polyurethane coatings tested; the system without primer failed in Im1 and Im2 testing, whereas the system with Zn primer passed in Im1 and Im2. Looking at the differences between lab and outdoor testing in Im2, it is clear that these stem mainly from good test results for systems without primer in lab testing and the corresponding negative test results in outdoor exposure. This is in agreement with previous results from exposure at the same locations [23,24]. LeBozec et al. also found that coatings with a Zn primer showed less corrosion in outdoor testing in a marine C5 environment and on a ship [18]. Similar results were reported by Pélissier et al. [19]. Knudsen et al. recently reported higher corrosion in systems with epoxy mastic primers and lower corrosion with Zn primers after outdoor exposure for 2 years in a C5 atmosphere and similar results for both groups in NSS testing using a horizontal scribe [22]. In order to improve the informative value of lab testing, it would be helpful to better identify unsuitable coatings without Zn primer.
A statistically significant correlation of NSS testing and the respective corrosion creep existed only for some locations and zones. At the same time, the qualitative statement of approval in NSS testing and outdoor testing was in much better agreement, with differences being found in the subgroup of coatings without Zn primer. The data for some of the zones were not normally distributed, which could be because two different sets of coatings were tested that behaved differently. Pearson correlation testing requires normally distributed data and can be disturbed by outliers. Spearman correlation, a different correlation test, only tests for the monotonicity between variables, does not require normal distribution and is more robust with regard to outliers. Table 11 shows the result of Spearman correlation testing of the corrosion creep in NSS testing and outdoor exposure.
Statistically significant correlations with ρ < 0.05 were only found for the Trier splash zone, Windheim atmospheric and immersion zone and Kiel atmospheric zone, i.e., two of the locations/zones found in Pearson testing and two different zones.
Assuming that coatings with and without primer behaved as two different groups, the correlation testing was repeated on these two separate groups. For the group without Zinc primer, only the Trier immersion zone showed a statistically significant correlation with NSS testing (see Table A1, Appendix A). For the group with Zinc or Al primer, only the Windheim atmospheric and immersion zone showed a statistically significant correlation with NSS testing (see Table A2, Appendix A). This suggests that coatings with and without Zn primer did not behave in a fundamentally different way with regard to the correlation between NSS and outdoor testing.
Looking at the data from outdoor exposure, outliers exist both in systems with and without Zinc primer. Another way of examining the correlation between NSS testing and outdoor testing is to remove all outliers in order to obtain normally distributed data, which can be used in Pearson correlation testing. For the following discussion, outliers are identified as showing a corrosion creep of “average corrosion creep of the location/zone + 2.5 times the standard deviation of the location/zone”. As discussed before in Section 2.4, high corrosion creep results were found especially for Systems 7 and 18. By the given definition, the corrosion creep of System 7 in the Trier immersion zone and Kiel immersion zone and of System 18 in the Trier splash zone and Windheim splash and immersion zones are marked as outliers. An alternative method for outlier identification is the Grubbs test, by which the results for System 7 in the Kiel immersion zone and Büsum immersion zone and System 18 in the Trier splash zone and Windheim splash zone are found here. With both methods pointing to the same two systems, these were removed from the data and the evaluation was repeated.
The p-value for the Shapiro–Wilk test for normal distribution increased for most locations/zones, with the Kiel immersion zone and Büsum immersion zone now passing the test. Even after outlier removal, 6 of the 12 locations/zones did not show normal distribution of the data. In Pearson correlation testing, the Trier immersion zone and Kiel immersion zone showed an additional statistically significant correlation. Total outlier removal increased the number of locations/zones with statistically significant correlations from four to six, and resulted in three additional correlations with a p-value between 0.05 and 0.06 (see Table 12). The corresponding plots of the data can be found in Figure A1, Figure A2, Figure A3 and Figure A4, Appendix B. The correlation was best in Trier. One possible reason for these inhomogeneous results could be scattering in the data. Outdoor testing was performed with only one sample per location/zone, increasing the probability of unrepresentative results within the data. It can be assumed that the scattering in the data from NSS testing is smaller, partially because usually three samples are tested. In a recent study on the increase in corrosion creep over time in NSS testing using similar coating systems, we analyzed seven identical samples per system and found a scattering of 0.30 mm for a system without Zn primer and 0.15 for a system with Zinc primer at a test duration of 1440 h [37]. Knudsen et al. reported similar values [22].
Summarizing these results, the correlation between NSS testing and outdoor exposure shows is generally positive but does not overall reach the level of statistical significance. While it is not possible to predict the exact corrosion creep in outdoor testing from NSS testing, the correlation is good enough to be useful in approval testing for systems with Zinc primer.
In accordance with this result, Almeida et al. reported good correlation between the NSS test and outdoor exposure [15]. Predominantly, NSS testing has been criticized for not showing good correlation with outdoor testing [18,38,39].
Knudsen et al. recently studied NSS testing and the cyclic aging test (ISO 12944-9) to perform a systematic investigation of the correlation between these accelerated lab tests and a 2-year field exposure in Kjerringvik (Norway) in a C5 atmosphere [22]. They found a strong negative correlation between NSS testing and field testing for systems without Zn primer and a weaker but also negative correlation for system with Zn primer. This is in contrast to the results found in this study, where the correlation coefficients in all zones were predominantly positive or, in some cases, close to zero (see Table 6). They found no correlation between cyclic aging testing and field testing.
LeBozec et al. compared the correlation of various accelerated corrosion tests, including the NSS test and ISO 12944-9 (previously ISO 20340), with each other and with field exposure on ships and in a marine C5 atmosphere [18]. They concluded that the best correlation was found for cyclic testing according to ISO 16701 [40], while testing according to ISO 12944-9 and the NSS test showed a larger deviation. Based on their results, they recommended not to use the NSS test for prediction of paint performance.
Pélissier et al. studied anticorrosive coatings in the lab using ISO 12944-9 testing and ASTM D5894 and under outdoor exposure in Brest (France) and on a ship operating near the French coast [19]. They found that ISO 12944-9 testing showed no correlation with the results of outdoor testing in Brest, but there was good correlation with the results of outdoor testing on the ship. ASTM D5894 [41] showed an acceptable correlation for both.
Regularly, cyclic aging testing according to ISO 12944-9 (previously ISO 20340) is discussed as an alternative to NSS testing. Recently, Davalos-Monteiro et al. studied the relationship between outdoor exposure testing and cyclic aging testing according to ISO 12944-9 for different types of powder coatings [17]. Comparing the result of 4 years of exposure in a C5 environment (atmospheric) with 4 or 6 months of ISO 12944-9 testing, they did not find a correlation. For some groups of coatings, there was a trend for a negative correlation, i.e., coatings performing better in ISO 12944-9 testing also performed worse in outdoor testing. They identified the freezing step in the ISO 12944-9 cyclic aging testing procedure as a possible reason for this.
Another important factor could be the pre-treatment of the samples tested in the laboratory. Laboratory testing is usually performed soon after coating, while samples in outdoor testing are exposed over a long time, in which the coating properties may change due to UV radiation, moisture or heat. Fekete and Lengyel studied waterborne coatings in outdoor exposure in a mild atmosphere in Budapest (Hungary) for up to 2.5 years and in the lab using salt spray testing (ASTM B 117-03 [42]) and a humidity chamber (ISO 6270) [12]. They found that the anticorrosive performance of samples depended on their pre-treatment before lab testing. Previous outdoor weathering improved the performance significantly, and, to a lesser extent, also indoor storage. From this, it can be assumed that the correlation between lab testing using the NSS test and outdoor exposure could be improved by pre-treatment of the samples under outdoor weathering, but, considering the time constraints in approval procedures, there are limits on the time available for weathering.

5. Summary and Conclusions

In this study the correlation of lab testing and outdoor exposure was studied using 19 different anticorrosive coatings. The abrasion resistance of the coatings showed no correlation with their anticorrosive performance. Pull-off adhesion before testing showed statistically significant negative correlation with the corrosion creep in outdoor testing in some locations and zones. NSS testing (ISO 9227) showed a generally positive correlation with all locations and zones that was statistically significant in 6 of the 12 cases tested after the removal of outliers in the data. Spearman correlation testing came to similar results. This is in contradiction to previous results, where NSS testing showed no or even negative correlation with outdoor testing [18,22]. While the NSS test correlated with outdoor exposure only in some cases on a statistically significant level, this study showed that the results of NSS testing can be useful in approval testing for protective coating systems. Systems without Zn primer were an exception to this, showing much more corrosion in the field, as also reported in other studies [18,19,22,23].

Funding

This research received no external funding.

Data Availability Statement

Data are contained within the article.

Acknowledgments

The author would like to thank Gesine Lomnitzer, Seval Gercken and Shanna Weiher for their work in lab testing and during outdoor exposure, Christiane Becker for help with data processing, the staff of our mechanical workshop and the staff of the Federal Waterway Administration supporting the field testing sites.

Conflicts of Interest

The author declares no conflicts of interest.

Appendix A. Pearson Correlation of NSS Testing and Outdoor Exposure Divided by Subgroups

Table A1. Results of Pearson correlation testing between the corrosion creep in NSS testing and outdoor exposure for systems without Zinc primer (systems 1–6 and 18).
LocationZoner (Pearson)p (Pearson)
TrierAtmospheric0.640.12
Splash0.210.65
Immersion0.810.03
WindheimAtmospheric0.630.13
Splash0.160.72
Immersion0.520.23
KielAtmospheric0.170.72
Splash0.560.20
Immersion0.280.52
BüsumAtmospheric0.190.68
Splash0.500.25
Immersion0.580.17
Table A2. Results of Pearson correlation testing between the corrosion creep in NSS testing and outdoor exposure for systems with Zinc or Al primer (systems 7–17 and 19).
LocationZoner (Pearson)p (Pearson)
TrierAtmospheric0.290.36
Splash<0.01>0.99
Immersion−0.110.73
WindheimAtmospheric0.570.05
Splash−0.160.64
Immersion0.720.01
KielAtmospheric0.310.31
Splash0.460.13
Immersion−0.160.61
BüsumAtmospheric0.150.64
Splash0.300.35
Immersion−0.200.54

Appendix B. Plots of the Corrosion Creep After NSS Testing and Outdoor Exposure

Figure A1. Results for the corrosion creep after outdoor exposure in Trier (Im1) plotted versus the corrosion creep of the same system in NSS testing: (a) atmospheric zone; (b) splash zone; (c) immersion zone. Outliers were removed.
Cmd 05 00023 g0a1
Figure A2. Results for the corrosion creep after outdoor exposure in Windheim (Im1) plotted versus the corrosion creep of the same system in NSS testing: (a) atmospheric zone; (b) splash zone; (c) immersion zone. Outliers were removed.
Cmd 05 00023 g0a2
Figure A3. Results for the corrosion creep after outdoor exposure in Kiel (Im2) plotted versus the corrosion creep of the same system in NSS testing: (a) atmospheric zone; (b) splash zone; (c) immersion zone. Outliers were removed.
Cmd 05 00023 g0a3
Figure A4. Results for the corrosion creep after outdoor exposure in Büsum (Im2) plotted versus the corrosion creep of the same system in NSS testing: (a) atmospheric zone; (b) splash zone; (c) immersion zone. Outliers were removed.
Cmd 05 00023 g0a4

References

  1. ISO 12944-1:2017; Paints and Varnishes—Corrosion Protection of Steel Structures by Protective Paint Systems Part 1: General Introduction. ISO: Geneva, Switzerland, 2017.
  2. ISO 12944-6:2018; Paints and Varnishes—Corrosion Protection of Steel Structures by Protective Paint Systems Part 6: Laboratory Performance Test Methods. ISO: Geneva, Switzerland, 2018.
  3. ISO 2812-2:2018; Paints and Varnishes—Determination of Resistance to Liquids Part 2: Water Immersion Method. ISO: Geneva, Switzerland, 2018.
  4. ISO 6270-1:2017; Paints and Varnishes—Determination of Resistance to Humidity Part 1: Condensation (Single-Sided Exposure). ISO: Geneva, Switzerland, 2017.
  5. ISO 9227:2022; Corrosion Tests in Artificial Atmospheres—Salt Spray Tests. ISO: Geneva, Switzerland, 2022.
  6. ISO 9223:2012; Corrosion of Metals and Alloys—Corrosivity of Atmospheres—Classification, Determination and Estimation. ISO: Geneva, Switzerland, 2012.
  7. Csokán, P. Korrosionsschutzprobleme von hydrotechnischen Stahlbaukonstruktionen. Richtlinien zur Anlegung von Wasserexpositions-Korrosionsprüfstationen. Mater. Corros. 1972, 23, 675–680. [Google Scholar] [CrossRef]
  8. Chico, B.; de la Fuente, D.; Pérez, M.L.; Morcillo, M. Corrosion resistance of steel treated with different silane/paint systems. J. Coat. Technol. Res. 2012, 9, 3–13. [Google Scholar] [CrossRef]
  9. Takeshita, Y.; Kamisho, T.; Sakata, S.; Sawada, T.; Watanuki, Y.; Nishio, R.; Ueda, T. Dual layer structural thermoplastic polyester powder coating film and its weathering resistance. J. Appl. Polym. Sci. 2012, 128, 1732–1739. [Google Scholar] [CrossRef]
  10. Seré, P.R.; Schvezov, C.; Di Sarli, A.R.; Deyá, C. Triplex systems: Accelerated and outdoor tests. Mater. Corros. 2019, 70, 470–480. [Google Scholar] [CrossRef]
  11. Fragata, F.L.; Amorim, C.C.; Ordine, A.P.; Marroig, M.C.; Mota, R.O.; Margarit-Mattos, I.C.P. Influence of surface cleaning by tools made of copper alloys on the painting performance. J. Coat. Technol. Res. 2009, 6, 229–235. [Google Scholar] [CrossRef]
  12. Fekete, É.; Lengyel, B. Accelerated testing of waterborne coatings. Prog. Org. Coat. 2005, 54, 211–215. [Google Scholar] [CrossRef]
  13. Deflorian, F.; Rossi, S.; Fedel, M. Organic coatings degradation: Comparison between natural and artificial weathering. Corros. Sci. 2008, 50, 2360–2366. [Google Scholar] [CrossRef]
  14. Li, Y.; Xu, H.; He, Y.; Xu, Q.; Fan, X.; Liu, C. Study on the correlation between indoor accelerated corrosion testing of concrete epoxy polysiloxane coating and real-sea environmental testing in the East China Sea. Case Stud. Constr. Mater. 2024, 20, e02905. [Google Scholar] [CrossRef]
  15. Almeida, E.; Santos, D.; Uruchurtu, J. Corrosion performance of waterborne coatings for structural steel. Prog. Org. Coatings 1999, 37, 131–140. [Google Scholar] [CrossRef]
  16. Zhang, H.; Dun, Y.; Tang, Y.; Zuo, Y.; Zhao, X. Correlation between natural exposure and artificial ageing test for typical marine coating systems. J. Appl. Polym. Sci. 2016, 133, 43893. [Google Scholar] [CrossRef]
  17. Davalos-Monteiro, R.; D’ambrosio, G.; Zhou, X.; Gibbon, S.; Curioni, M. Relationship between natural exposure testing and cyclic corrosion testing ISO 20340 for the assessment of the durability of powder-coated steel. Corros. Eng. Sci. Technol. 2021, 56, 742–752. [Google Scholar] [CrossRef]
  18. LeBozec, N.; Thierry, D.; Le Calvé, P.; Favennec, C.; Pautasso, J.; Hubert, C. Performance of marine and offshore paint systems: Correlation of accelerated corrosion tests and field exposure on operating ships. Mater. Corros. 2015, 66, 215–225. [Google Scholar] [CrossRef]
  19. Pélissier, K.; Le Bozec, N.; Thierry, D.; Larché, N. Evaluation of the Long-Term Performance of Marine and Offshore Coatings System Exposed on a Traditional Stationary Site and an Operating Ship and Its Correlation to Accelerated Test. Coatings 2022, 12, 1758. [Google Scholar] [CrossRef]
  20. Momber, A.W.; Marquardt, T.; Buchbach, S.; Plagemann, P. The corrosion protection performance of repair coatings for offshore wind power constructions after long-term splash zone site exposure. Mater. Corros. 2022, 73, 526–539. [Google Scholar] [CrossRef]
  21. Perrin, F.; Merlatti, C.; Aragon, E.; Margaillan, A. Degradation study of polymer coating: Improvement in coating weatherability testing and coating failure prediction. Prog. Org. Coatings 2009, 64, 466–473. [Google Scholar] [CrossRef]
  22. Knudsen, O.; Skilbred, A.; Løken, A.; Daneshian, B.; Höche, D. Correlations between standard accelerated tests for protective organic coatings and field performance. Mater. Today Commun. 2022, 31, 103729. [Google Scholar] [CrossRef]
  23. Binder, G. Research on protective coating systems for immersed steel structures. Mater. Corros. 2001, 52, 261–267. [Google Scholar] [CrossRef]
  24. Binder, G. Corrosion Protection in Maritime Environments: Assessing Systems for Offshore Structures. J. Prot. Coat. Linings 2016, 33, 34–36, 38–41. [Google Scholar]
  25. ISO 12944-9:2018; Paints and Varnishes—Corrosion Protection of Steel Structures by Protective Paint Systems Part 9: Protective Paint Systems and Laboratory Performance Test Methods for Offshore and Related Structures. ISO: Geneva, Switzerland, 2018.
  26. Bundesanstalt für Wasserbau. BAW Richtlinie Prüfung von Beschichtungssystemen für den Korrosionsschutz im Stahlwasserbau (RPB); Bundesanstalt für Wasserbau: Karlsruhe, Germany, 2011. [Google Scholar]
  27. EN 10025:2019; Hot Rolled Products of Structural Steels-Part 2: Technical Delivery Conditions for Non-Alloy Structural Steels. British Standards Institution: London, UK, 2019.
  28. ISO 8501-1:2007; Preparation of Steel Substrates before Application of Paints and Related Products—Visual Assessment of Surface Cleanliness-Part 1: Rust Grades and Preparation Grades of Uncoated Steel Substrates and of Steel Substrates after Overall Removal of Previous Coatings. ISO: Geneva, Switzerland, 2007.
  29. ISO 8503-1:2012; Preparation of Steel Substrates before Application of Paints and Related Products—Surface Roughness Characteristics of Blast-Cleaned Steel Substrates—Part 1: Specifications and Definitions for ISO Surface Profile Comparators for the Assessment of Abrasive Blast-Cleaned Surfaces. ISO: Geneva, Switzerland, 2012.
  30. ISO 4624:2023; Paints and Varnishes—Pull-Off Test for Adhesion. ISO: Geneva, Switzerland, 2023.
  31. ISO 12944-2:2017; Paints and Varnishes—Corrosion Protection of Steel Structures by Protective Paint Systems Part 2: Classification of Environments. ISO: Geneva, Switzerland, 2017.
  32. DIN 50929-3:2018-03; Korrosion der Metalle—Korrosionswahrscheinlichkeit Metallener Werkstoffe bei äußerer Korrosionsbelastung—Teil 3: Rohrleitungen und Bauteile in Böden und Wässern. Beuth Verlag GmbH: Berlin, Germany, 2018.
  33. ISO 4628-2:2016; Paints and Varnishes—Evaluation of Degradation of Coatings—Designation of Quantity and Size of Defects, and of Intensity of Uniform Changes in Appearance Part 2: Assessment of Degree of Blistering. ISO: Geneva, Switzerland, 2016.
  34. ISO 4628-3:2016; Paints and Varnishes—Evaluation of Degradation of Coatings—Designation of Quantity and Size of Defects, and of Intensity of Uniform Changes in Appearance Part 3: Assessment of Degree of Rusting. ISO: Geneva, Switzerland, 2016.
  35. ISO 4628-4:2016; Paints and Varnishes—Evaluation of Degradation Of Coatings—Designation of Quantity and Size of Defects, and of Intensity of Uniform Changes in Appearance Part 4: Assessment of Degree of Cracking. ISO: Geneva, Switzerland, 2016.
  36. ISO 4628-5:2022; Paints and Varnishes—Evaluation of Quantity and Size of Defects, and of Intensity of Uniform Changes in Appearance Part 5: Assessment of Degree of Flaking. ISO: Geneva, Switzerland, 2022.
  37. Wetzel, K.S.; Wanner, M.; Schmid, M.J. Weathering tests to investigate the durability of anti-corrosion coatings and on-site repair materials. Transp. Eng. 2024, 17, 100265. [Google Scholar] [CrossRef]
  38. Skerry, B.S.; Simpson, C.H. Corrosion and Weathering of Paints for Atmospheric Corrosion Control. Corrosion 1993, 49, 663–674. [Google Scholar] [CrossRef]
  39. LeBozec, N.; Blandin, N.; Thierry, D. Accelerated corrosion tests in the automotive industry: A comparison of the performance towards cosmetic corrosion. Mater. Corros. 2008, 59, 889–894. [Google Scholar] [CrossRef]
  40. ISO 16701:2015; Corrosion of Metals and Alloys—Corrosion in Artificial Atmosphere—Accelerated Corrosion Test Involving Exposure under Controlled Conditions of Humidity Cycling and Intermittent Spraying of a Salt Solution. ISO: Geneva, Switzerland, 2015.
  41. ASTM D5894-21; Standard Practice for Cyclic Salt Fog/UV Exposure of Painted Metal, (Alternating Exposures in a Fog/Dry Cabinet and a UV/Condensation Cabinet). ASTM: West Conshohocken, PA, USA, 2021.
  42. ASTM B 117-03; Standard Practice for Operating Salt Spray (Fog) Apparatus. ASTM: West Conshohocken, PA, USA, 2003.
Figure 1. Corrosion creep after outdoor exposure in Trier (Im1) plotted versus the corrosion creep of the same system in NSS testing (ISO 9227). The result for the atmospheric zone is shown as an example of a mediocre fit.
Cmd 05 00023 g001
Figure 2. Corrosion creep after outdoor exposure in Windheim (Im1) plotted versus the corrosion creep of the same system in NSS testing (ISO 9227). The result for the atmospheric zone is shown as an example of a good fit.
Cmd 05 00023 g002
Figure 3. Corrosion creep after outdoor exposure in Kiel (Im2) plotted versus the corrosion creep of the same system in NSS testing (ISO 9227). The result for the splash zone is shown as an example of a good fit.
Cmd 05 00023 g003
Figure 4. Corrosion creep after outdoor exposure in Büsum (Im2) plotted versus the corrosion creep of the same system in NSS testing (ISO 9227). The result for the immersion zone is shown as an example of a bad fit.
Cmd 05 00023 g004
Figure 5. Results of the breaking strength in pull-off adhesion testing before (left bar) and after NSS testing (right bar).
Cmd 05 00023 g005
Table 2. Coating systems used in this study.
System NumberNumber of CoatsType of Coat 1Nominal Dry Film Thickness
Per Layer [µm] 2
Measured Total Dry Film Thickness [µm] 3
11Epoxy400470
21Epoxy550540
31Epoxy500540
41Epoxy580570
51Epoxy600610
61Epoxy11001080
72Epoxy, Epoxy300/300550
82Zn–Epoxy, Epoxy60/400430
92Zn–Epoxy, Epoxy50/350480
102Zn–Epoxy, Epoxy70/430520
112Zn–Epoxy, Epoxy50/600550
122Zn–Epoxy, Epoxy80/500550
132Zn–Epoxy, Epoxy60/500590
142Zn–Epoxy, Epoxy50/600620
153Zn–Epoxy, Epoxy, Epoxy50/250/250640
163Zn–Epoxy, Epoxy, Epoxy50/250/250780
173Al–Epoxy, Epoxy, Epoxy170/170/160500
1812C-PUR1200–15001430
1931C-PUR-Zn, 1C-PUR, 1C-PUR100/200/200570
1 2C-PUR: two-component polyurethane, Zn–Epoxy: zinc-rich epoxy primer, Al–Epoxy: epoxy primer with Aluminum pigment, 1C-PUR-Zn: zinc-rich one-component polyurethane primer, 1C-PUR: one-component polyurethane. 2 Nominal dry film thickness of each layer, according to the specification by the manufacturer. In multilayer systems, the first number represents the thickness of the first layer on the steel substrate, and the second number represents the second layer. 3 Average of the front sides of all panels before testing under outdoor exposure. The dry film thickness was measured using an Elcometer 456 Coating Thickness Gauge.
Table 3. Properties of the water at the outdoor exposure sites.
PropertyTrier
(Moselle)
Windheim
(Weser)
Kiel
(Baltic Sea)
Büsum
(North Sea)
Type of waterfresh waterfresh water, slightly increased salinitysea water/brackish watersea water
Conductivity [mS/cm]1.21.527.142.5
Chloride [ppm]250350900016,500
Sulfate [ppm]10011019001700
Calcium [ppm]12172190320
Carbonate hardness [°dH]8777
pH7.87.77.87.7
Salinity [g/kg]0.50.91725
Wo-value 12.21.2−6.4−7.6
Foulingalgae, musselsalgae, musselsalgae, barnacles, oyster musselsbarnacles, oyster mussels
1 according to DIN 50929-3:2018 [32].
Table 4. Limit values in mm for approval [26] of the corrosion creep at the scribe after outdoor exposure.
ZoneTrier
(Moselle)
Windheim
(Weser)
Kiel
(Baltic Sea)
Büsum
(North Sea)
Immersion1.51.52.52.5
Splash zone2.02.010.05.0
Atmospheric zone1.01.06.02.0
Table 5. Results for the corrosion creep at the scribe after NSS testing and outdoor exposure in mm.
System NumberCorrosion Creep [mm]
NSSTrier (Im1)Windheim (Im1)
Atm. ZoneSplash ZoneImmersionAtm. ZoneSplash ZoneImmersion
10.980.00.40.30.10.81.1
21.030.03.10.30.22.22.5
32.400.82.61.90.93.06.8
40.610.10.60.20.34.75.8
51.770.21.11.20.86.04.5
60.600.41.01.00.73.51.9
70.600.62.52.20.6**
81.000.80.80.70.70.70.9
90.590.10.10.10.10.30.3
100.740.20.50.60.51.50.9
111.030.61.10.70.51.51.5
120.310.10.30.60.02.01.4
131.570.20.50.20.20.81.8
140.500.40.50.70.41.01.1
151.430.50.40.40.51.52.2
160.870.30.60.70.42.40.2
172.000.50.91.01.01.02.6
181.430.613.70.70.9138.4
190.900.10.20.20.20.30.6
System NumberCorrosion Creep [mm]
NSSKiel (Im2)Büsum (Im2)
Atm. ZoneSplash ZoneImmersionAtm. ZoneSplash ZoneImmersion
10.981.67.22.60.52.62.5
21.0318.312.50.913.67.92.5
32.4019.819.53.37.412.24.5
40.6123.411.81.56.56.63.1
51.7718.59.01.86.05.23.3
60.6017.211.32.14.07.43.5
70.6016.111.315.05.78.57.3
81.001.510.10.81.03.11.3
90.590.34.10.20.01.40.3
100.740.49.71.60.63.72.4
111.033.616.91.01.04.01.4
120.311.311.02.00.25.14.0
131.571.69.82.10.26.41.8
140.500.910.00.80.54.11.3
151.4313.512.70.73.06.31.1
160.876.111.30.72.14.91.5
172.009.314.92.32.46.02.8
181.4326.518.28.51212.32.6
190.900.19.00.60.11.80.7
* The samples for the Windheim splash zone and immersion zone were lost during outdoor exposure.
Table 6. Fit coefficients and results of Pearson correlation testing between the corrosion creep in NSS testing and outdoor exposure.
LocationZoneabr (Pearson)p (Pearson)
Im1
Trier
Atmospheric0.13900.18950.400.08
Splash0.23631.29710.240.33
Immersion0.38040.31790.320.19
Im1
Windheim
Atmospheric0.11350.33610.62<0.01
Splash1.31741.1380.210.40
Immersion0.03632.2190.530.02
Im2
Kiel
Atmospheric3.30865.75330.350.14
Splash7.74463.5930.540.02
Immersion2.52620.0247<0.010.99
Im2
Büsum
Atmospheric1.15842.19990.300.21
Splash3.02542.55490.470.04
Immersion2.34060.16840.060.81
Table 7. Results of the pull-off adhesion tests: breaking strength σ in MPa and type of fracture.
System NumberSample 1 Sample 2 Sample 3 Average Reference Sample
σType of FractureσType of FractureσType of FractureσσiType of Fracture
15.3100% B6.7100% B6.6100% B6.28.2100% B
210.2100% B15.2100% B12.5100% B12.613.6100% B
310.2100% B6.1100% B11.0100% B9.1**
44.5100% B9.3100% B7.2100% B7.015.0100% B
55.8100% B10.0100% B12.0100% B9.312.5100% C
610.995% A/B
5% B
11.780% A/B 20% B11.980% A/B 20% B11.5**
78.840% B
60% C
8.880% B
20% C
8.480% B
20% C
8.717.130% B
70% C
82.3100% B2.1100% B3.2100% B2.54.8100% B
95.3100% C6100% C5.6100% C5.69.8100% C
105.7100% C5.7100% C6.8100% C6.17.9100% C
1110.3100% C9.7100% C9.2100% C9.7**
125.4100% B8.7100% B9.3100% B7.815100% B
139.340% B
60% C
11.010% B
90% C
10.470% B
30% C
10.210100% C
145.9100% C4.6100% C4.1100% C4.9**
152.7100% B2.8100% B2.2100% B2.65.3100% B
161.6100% B2.8100% B2.9100% B2.49.8100% B
179.490% B
10% D
8.280% B
20% D
9.890% B
10% D
9.111.5100% C
185.6100% B5100% B5.9100% B5.515100% B
199.5100% C9.1100% C8.4100% C9.010.1100% C
* No reference sample was available for Systems 3, 11 and 14.
Table 8. Results of abrasion resistance, aw, in µm.
System Numberaw
158
230
335
432
534
629
729
831
950
1058
1134
1232
1330
1429
1550
1630
1758
1825
1946
Table 9. Results show approval based on lab testing compared to the approval based on outdoor exposure.
System NumberLab
Approval Im1
Lab
Approval Im2
Outdoor
Approval Im1
Outdoor
Approval Im2
1YesYesYesYes
2YesYesNoNo
3YesNoNoNo
4YesYesNoNo
5YesNoNoNo
6YesYesYesNo
7YesYesYesNo
8YesYesYesYes
9YesYesYesYes
10YesYesYesYes
11YesYesYesYes
12YesYesYesYes
13YesNoYesYes
14YesYesYesYes
15YesNoYesNo
16YesYesYesYes
17YesNoYesNo
18YesNoNoNo
19YesYesYesYes
Table 10. Matching and differing results for lab and outdoor testing.
ResultsNumber of Systems
Match11
Approval in Im1 and Im29
Approval in Im1, rejection in Im22
Difference8
Lab: Approval in Im1 and Im2
Outdoor: Rejection in Im1 and Im2
2
Lab: Approval in Im1 and Im2
Outdoor: Approval only in Im1, rejection in Im2
2
Lab: Approval in Im1, rejection in Im2
Outdoor: Rejection in Im1 and Im2
3
Lab: Approval only in Im1, rejection in Im2
Outdoors: Approval in Im1 and Im2 outdoors
1
Table 11. Results of Spearman correlation testing between the corrosion creep in NSS testing and outdoor exposure.
LocationZoneρ (Spearman)p (Spearman)
TrierAtmospheric0.34050.1542
Splash0.45990.0476
Immersion0.2320.3392
WindheimAtmospheric0.53950.0171
Splash0.16490.5133
Immersion0.57910.0118
KielAtmospheric0.46050.0473
Splash0.41550.0769
Immersion0.27790.2493
BüsumAtmospheric0.42440.0702
Splash0.32940.1685
Immersion0.07870.7488
Table 12. Results of Pearson correlation testing between the corrosion creep in NSS testing and outdoor exposure after outlier removal (Systems 7 and 18).
LocationZoner (Pearson)p (Pearson)
TrierAtmospheric0.460.06
Splash0.470.06
Immersion0.600.01
WindheimAtmospheric0.66<0.01
Splash0.170.52
Immersion0.570.02
KielAtmospheric0.380.13
Splash0.540.02
Immersion0.510.03
BüsumAtmospheric0.310.22
Splash0.560.02
Immersion0.290.25
Disclaimer/Publisher’s Note: The statements, opinions and data contained in all publications are solely those of the individual author(s) and contributor(s) and not of MDPI and/or the editor(s). MDPI and/or the editor(s) disclaim responsibility for any injury to people or property resulting from any ideas, methods, instructions or products referred to in the content.