Abstract
Gastrointestinal adverse events (GIAEs) are common in patients with advanced hepatocellular carcinoma (HCC) treated with sorafenib. Diarrhea is a prevalent event responsible for treatment interruptions and dosage modifications. Our study evaluates the role of baseline blood L-glutamine (L-Gln) levels in the prediction of gastrointestinal adverse events development early during treatment (eGIAE). Blood L-Gln was measured in 135 patients with advanced HCC prior to starting sorafenib. Any adverse events developed during therapy were registered in a prospective database. We used Mann–Whitney U and Fisher’s exact tests to compare quantitative or categorical variables, respectively, Kaplan–Meier method to analyze time to event variables, log-rank test for the survival functions and Cox regression models to estimate hazard ratios (HR). Fifteen per cent of patients developed eGIAE, with diarrhea as the most frequent one. Patients displaying the lowest L-Gln levels presented a significant higher risk of eGIAE, while those with the highest levels were protected from eGIAE and achieved better survival. Our study shows for the first time the association of baseline blood L-Gln levels with eGIAE development in HCC patients during sorafenib treatment. Low L-Gln concentrations might reflect a potentially compromised intestinal barrier that becomes clinically relevant early after treatment start.
1. Introduction
Patients with advanced hepatocellular carcinoma (HCC) who are treated with sorafenib can experience a series of treatment-related adverse events [1]. Although early dermatologic adverse events (eDAE) are well-known predictors of treatment efficacy and distinct prognosis, this is not proven for other adverse events, such as gastrointestinal adverse events (GIAEs). GIAEs include different entities. Mild–moderate diarrhea is the most frequent followed by increased bowel movements, abdominal pain or discomfort and even more severe grades of diarrhea [1]. Although grade II and grade III GIAEs are not very frequent (8% for grade III diarrhea in SHARP trial), their appearance might seriously jeopardize treatment implementation in those patients [2]. The mechanisms and impact of diarrhea in sorafenib treated patients is not well understood. Absorption of nutrients depends on the integrity of the intestinal barrier. When this is compromised, the gut permeability increases, and this may prime the development of gastrointestinal complications [3]. In addition, a study published in 1991 by Déchelotte and collaborators clearly established that enteral glutamine administration induced a dose-dependent increase in plasma glutamine levels [4] in healthy humans.
In an unpublished observation from our group, we registered that baseline blood L-Gln levels showed a trend to be associated with poorer outcomes in sorafenib treated patients. This prompted our interest about the involvement of this amino acid in HCC patients treated with sorafenib and specifically in its relevance in the development of diarrhea. Indeed, it is known that L-Gln is key in maintaining the intestinal barrier function by modulating the expression of tight junction proteins, claudin-1, occludin and ZO-1 [5,6]. In vitro studies have demonstrated that glutamine restriction increases epithelial cell permeability [7]. In addition, L-Gln promotes enterocyte proliferation and survival as healthy mammalian intestine undergoes turnover every 3–5 days [8], or even less in certain stressful conditions.
The aim of the present study is to evaluate if plasma concentrations of L-Gln prior to starting sorafenib treatment could be a predictor of early GIAE development during treatment (first 60 days) and of long-term survival. We did not study GIAEs at a later time point as they could be related to several confounders unable to be controlled, such as tumor progression, impairment of liver function and concomitant medications initiated during follow-up.
2. Results
2.1. Baseline Characteristics of the Patients
One-hundred and seventeen of the patients were male (86.7%) and the vast majority (87.4%) exhibited a good performance status (PS 0). Almost half corresponded to Barcelona Clinic Liver Cancer (BCLC) B (49%) following the treatment stage migration concept [9] and 51% to the BCLC C stage. The high rate of BCLC B patients considered for systemic therapy in this study is because other treatment options, such are surgical resection, percutaneous ablation or chemoembolization, may have failed or may not be applicable because of tumor characteristics or patients’ comorbidities. Vascular invasion was present in one third of the patients. A total of 31% of patients had not received any prior treatment for HCC, 30% had underwent trans-arterial chemoembolization (TACE) and 10.3% had received prior surgery. Table 1 summarizes the baseline characteristics and clinical variables of the 135 patients.

Table 1.
Baseline characteristics and clinical variables of patients.
The median follow-up of the cohort was 11.70 months (IQR 5.85–23.18) and the median treatment time was 7.13 months (interquartile range (IQR) 2.5–14.76). Median time to progression was 6.84 months (IQR 4.9–13) and actuarial median survival after 111 deaths was 13.3 months.
2.2. Adverse Events
A total of 20 patients developed 22 eGIAEs during the first 60 days after sorafenib initiation; 2 patients developed 2 eGIAEs each. Diarrhea was the most frequent (5.2% at 30 days and 7.4% at 60 days), followed by abdominal pain (3.7%) and hemorrhoidal pain (1.5%). The majority of the eGIAEs appeared within the first 30 days. The type of eGIAEs and its grading are summarized in Table 2. Treatment was interrupted because of eGIAEs in 22 instances, 2 eGIAEs required definitive treatment interruption due to diarrhea and abdominal pain, while interruption was temporary in 13 and dose-adjusted without interruption in 7.
Table 2.
Number and type of GIAE at 30 and 60 days.
Development of eGIAEs was not associated to clinical profile, biochemical parameters, tumor stage or performance status (Supplementary Table S1).
2.3. L-Gln Concentration and Incidence of GIAEs and Survival
2.3.1. Risk of eGIAE Development
The median L-Gln concentration in HCC patients prior to starting sorafenib treatment was 19.23 mgr/mL (IQR 16.21–22.17). The Cox regression models dividing patients according to the median concentration value identified a protective role of higher L-Gln concentration in developing eGIAE at 30 days, with a hazard ratio (HR) of 0.77 (95% CI 0.65–0.91, p = 0.0022) when adjusted for the BCLC stage and performance status (PS). This protective role was also demonstrated at 60 days with a HR of 0.88 (95% CI 0.78–0.98, p = 0.02) (Table 3).
Table 3.
Cox regression models.
Since we were able to identify a potential protective role of higher L-Gln circulating levels, we wanted to further establish the importance and impact of low L-Gln levels in the development of eGIAEs. To do this, we divided blood L-Gln concentration values in terciles. This allowed us to establish the tercile cut-off values and to analyze the data without reducing excessively the number of patients in each group. Cox regression models confirmed the protective role of L-Gln, as they identified that patients in the low tercile of L-Gln (n = 48) were at a higher risk of developing eGIAE with HR values of 4.97 (95% CI 1.53–16.18) when adjusted for BCLC staging and PS (p = 0.0076) (Table 3). Figure 1 shows the probability of eGIAE development divided by terciles at 30 days (Panel A) and 60 days (Panel B).
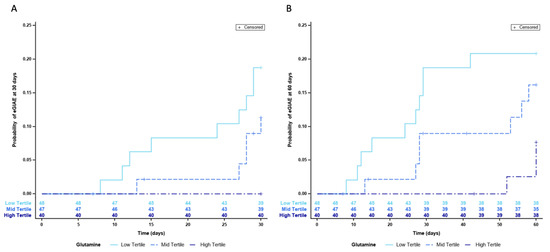
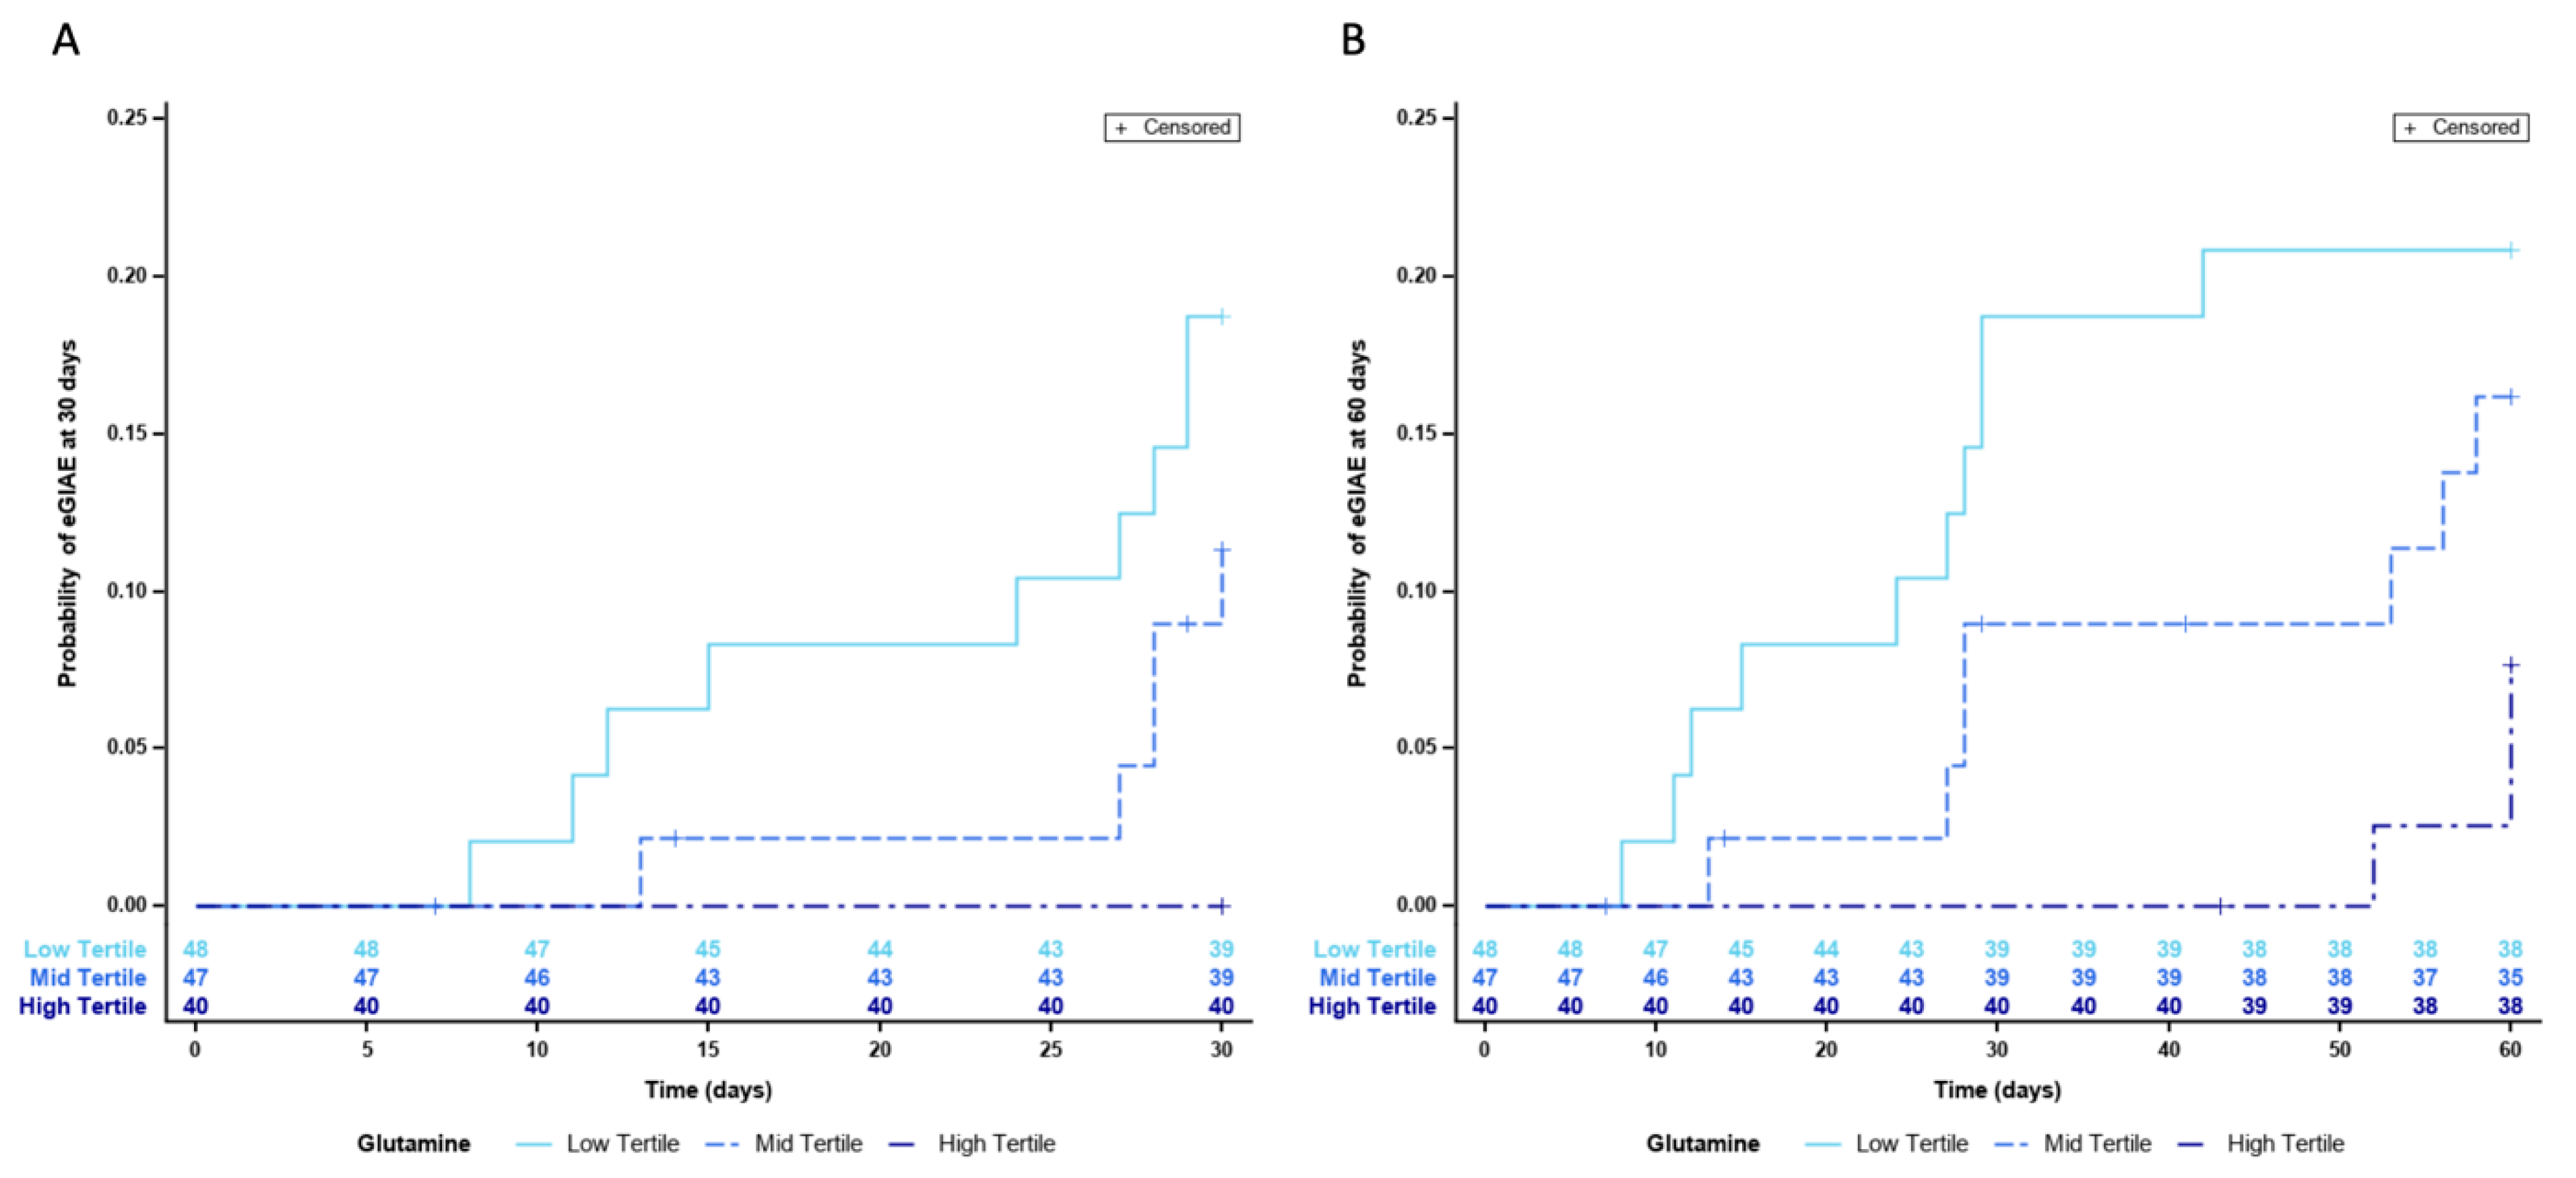
Figure 1.
Risk of GIAE development according to blood L-Gln levels divided in terciles, (A) at 30 days and (B) at 60 days.
Although treatment duration was not significantly different between the low–mid and high terciles (7.6; 5.3 and 8.7 months), the majority (45.4%) of sorafenib-treatment modifications were found in patients from the low tercile group, while 36.4% cases corresponded to the mid tercile and 18.2% cases to the high tercile group.
2.3.2. Risk of Death
Cox regression models did not identify an association with the risk of death. However, when stratifying patients by terciles, those in the high tercile (n = 40) were at a lower risk of death with a HR value of 0.59 (95%CI 0.38–0.93) when adjusted for BCLC staging and PS with a p value <0.01 (Table 4).
Table 4.
Death risk compared by terciles independently and grouped strata.
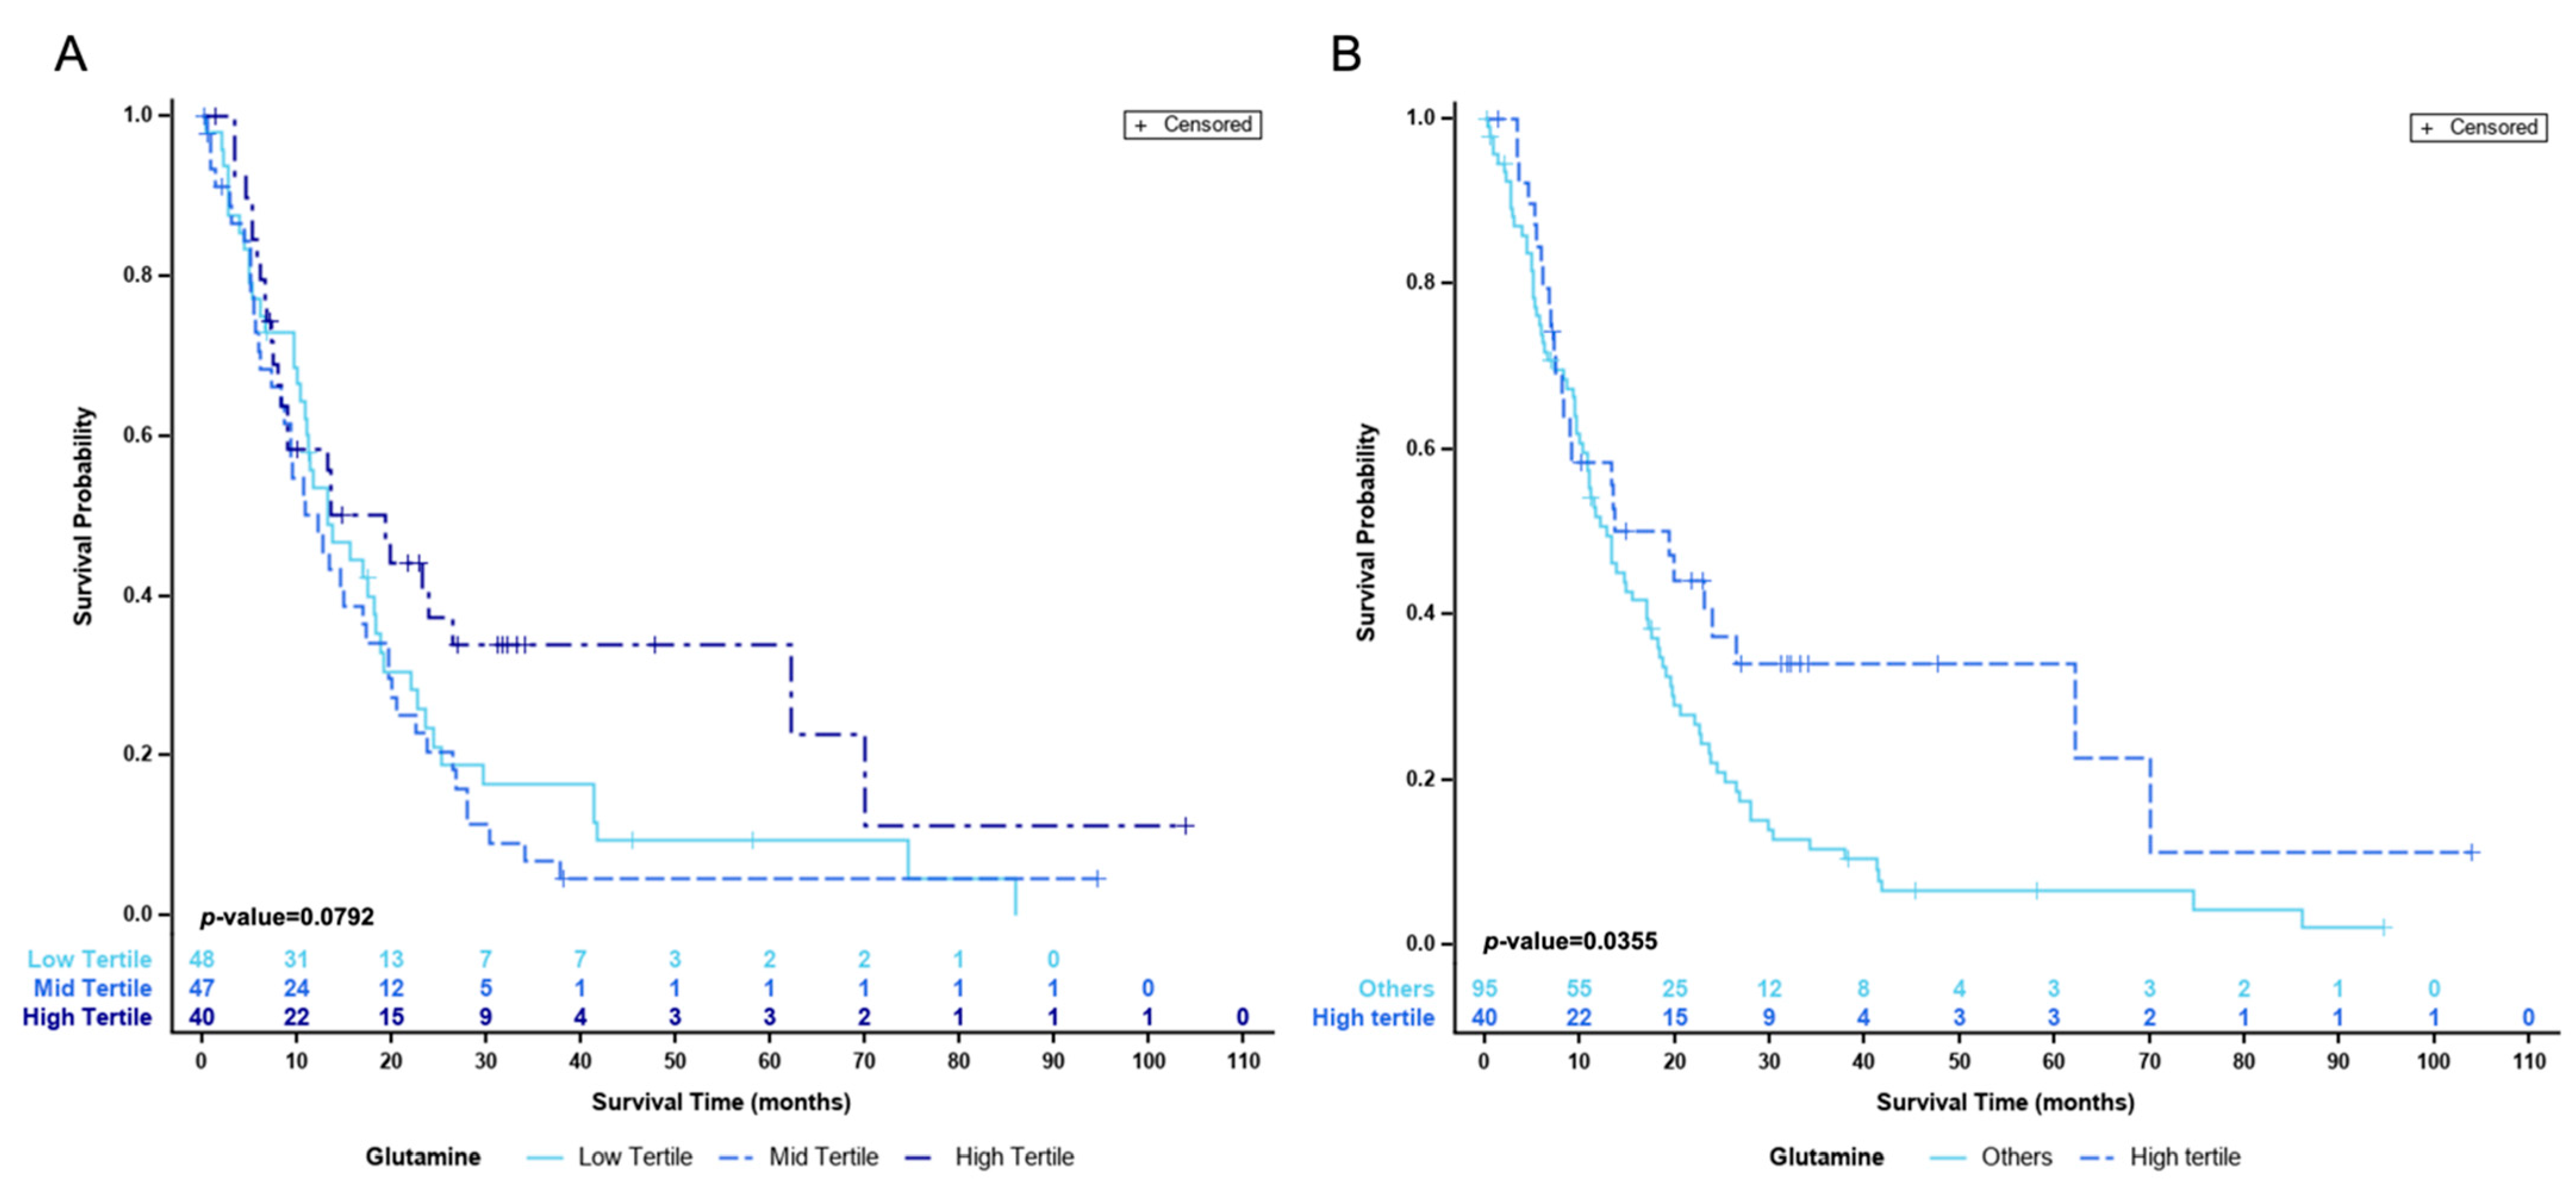
Figure 2 shows the actuarial survival of the patients divided by terciles (Panel A) and the comparison between high vs. mid and low terciles (Panel B). As shown, the median survival of patients with high L-Gln is significantly better than that of patients with low or median values (p-value = 0.04). Table 4 displays the comparison by terciles either independently or when grouping strata.
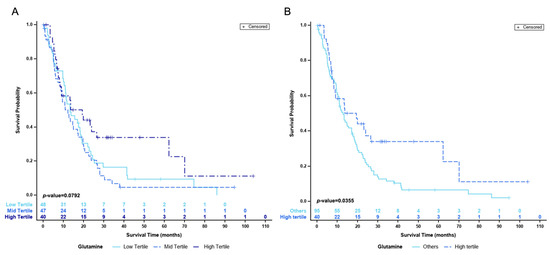
Figure 2.
Actuarial survival curves (A) divided by terciles (B) comparing high tercile against mid and low groups.
Since the development of dermatology adverse events (DAEs) is associated with better outcomes, we checked if such an event would confound our findings; thirty-eight patients (28.2%) also developed DAEs at sixty days and their incidence was not different across the three groups of L-Gln levels (Table 5).
Table 5.
Early dermatological adverse events (eDAE) in the three L-Gln groups.
Finally, we checked if liver function impairment could be associated to low L-Gln levels, despite the narrow selection criteria according to the Child–Pugh stage. Patients in the lowest L-Gln tercile showed significantly higher levels of direct bilirubin, higher AST, higher alkaline phosphatase, and lower albumin concentrations. However, differences were clinically meaningless, and the values of bilirubin and albumin were within normal ranges (Table 6).
Table 6.
Comparison of baseline and clinical variables between low tercile vs. high and mid terciles.
3. Discussion
Our results show that low baseline levels of L-Gln are associated with a higher incidence of GIAEs (almost half of them corresponding to diarrhea) early (first 2 months) after starting treatment with sorafenib. The mechanism for such an association is not completely understood but might be related to the involvement of L-Gln in the maintenance of intestinal tissue homeostasis, as we commented in the introduction. Moreover, plasma L-Gln levels are known to be the result of correct intestinal mucosa absorption but also its metabolization in the intestinal compartment [4]. Thus, the lowest L-Gln levels identify those patients with potential intestinal barrier fragility that might be aggravated during sorafenib treatment. Several studies have demonstrated that gut function depends greatly on L-Gln availability in healthy individuals, but it becomes an essential element under stress conditions or gastrointestinal disorders [10]. Along the same lines, sorafenib might disrupt intestinal homeostasis by acting directly on enterocytes as it is described for other drugs [11], as well as in in vivo models [12]. Those patients with suboptimal L-Gln levels prior to starting treatment might not be able to endure the acute intestinal toxicity induced by sorafenib and develop GIAE in the early days of therapy.
These findings are relevant as GIAEs are one of the frequent complaints of HCC patients treated with sorafenib and in some settings, it may prime the interruption of treatment with loss of the therapeutic benefit. Treatment with other tyrosine kinase inhibitors, such as lenvatinib, cabozantinib or regorafenib, is also associated to GIAEs, mostly diarrhea, and it is likley that low levels of L-Gln may emerge as a relevant predictive factor of such unpleasant AE that may significantly impair the quality of life of the patients and their willingness to adhere to treatment. Loperamide therapy or sorafenib dose reduction may control symptoms, but reduction and definitive interruption may induce a loss of treatment benefit.
Interestingly, our study shows that there is an association between L-Gln concentration and patients’ outcome, even when the most relevant confounders were controlled. Some authors have suggested that diarrhea under sorafenib may be associated with a better outcome [13], but this observation may be unreliable as diarrhea may also occur later during follow-up under treatment. Evidently, a long follow-up implies a better outcome as patients that die earlier have shorter follow-ups. Thus, the observation of adverse events in the long term should not be understood as a predictor of a better outcome but rather because of the longer survival period of the patient under the treatment. Indeed, the preliminary results from a study of our group [14] describe that when diarrhea under sorafenib is evaluated according to the time of appearance, only early diarrhea is associated to a worse outcome.
Our observations somehow are in line with a study published by Naganuma and colleagues [15] in which they found that prophylactic beta-hydroxy-beta-methyl butyrate, L-arginine and L-Gln supplementation effectively prevented sorafenib-associated hand foot skin reaction in patients with advanced HCC. Thus, our study exposes the need to engage in research about what drives higher or lower L-Gln concentration, since it appears to be relevant and probably, not only for patients diagnosed with HCC. L-Gln is the most abundant amino acid in human blood and is mainly produced and stored in skeletal muscle [16], although liver [17], brain and adipose tissue have tissue-specific glutamine synthesis activity and can also contribute to plasmatic L-Gln levels [18,19]. In healthy individuals, L-Gln storage is enough to fulfil the body requirements, but this situation changes quickly during infections, sepsis or cancer development, since its consumption increases significantly and the body reserves cannot supply the needed amounts of L-Gln [20,21,22]. Thus, reduced availability of glutamine is associated with increased morbidity and mortality [23]. For the gut, L-Gln is the most relevant energy substrate in terms of quantity consumed and it is supplied to the enterocyte through the diet and via the bloodstream. L-Gln’s critical role in the gut is to maintain both tissue integrity and correct nutrient absorption [24] and does so by contributing to the homeostasis of the enterocyte compartment. In that sense, circulating levels of citrulline and intestinal fatty acid-binding protein (I-FABP) have been proposed as suitable markers of intestinal barrier dysfunction [25]. Since citrulline is synthesized by enterocytes and released into portal circulation, a reduction in plasma citrulline levels is associated with a reduction in the functional enterocyte compartment [26]. However, it is known that 80% of citrulline has plasma L-Gln as its precursor [27]. As for I-FABP, it is normally present in the enterocyte cytoplasm and undetectable in the blood of healthy individuals. So, detection of I-FABP in plasma accounts for enterocyte necrosis [28]. Most published studies regarding the adequacy of biomarkers of intestinal barrier dysfunction have been validated in critically ill patients and this would render them as non-validated markers and thus unreliable, when determined in our patients. It is well documented that plasmatic L-Gln levels are significantly lower in cirrhotic patients compared to healthy individuals, due to diminished glutamine and urea synthesis by 80% in patients with impaired hepatic function [29]. Moreover, HCC, as with many other cancers, relies on glutamine catabolism to support rapid cell growth. This added to the fact that HCC cells display increased glutamine transporter activity [30] would result in net glutamine consumption and might explain why HCC patients exhibit lower plasmatic L-Gln levels [31]. Thus, lower L-Gln blood concentrations could also expose both increased tumor burden or worse hepatic function in those patients. We checked if this confounder would explain our results, but we did not detect any difference in tumor burden. The biochemistry data could suggest a role for liver function impairment, but it must be recalled that the differences observed in albumin concentration occurred when the values were still within the normal range. Hence, the meaning of such an observation is not understood. The differences in AST and alkaline phosphatase are clinically irrelevant, but could suggest a role for cholestasis, but it would be expected to show a difference in gamma-glutamyl-transpeptidase that is more sensitive to cholestasis detection. Hence, we prefer to avoid such a speculation. However, the importance of adequate L-Gln levels points out the need to increase the research activity in the field of nutrition, dietary intervention, sarcopenia, and frailty in patients with severe conditions, such as cirrhosis and superimposed cancer. Indeed, low L-Gln concentration was also associated with poorer survival rates in our patients. This finding coincides with the already reported impact of low L-Gln levels in the survival of patients with cirrhosis. Since more than 90% of our patients had underlying cirrhosis, we are unable to ascertain the role of it in the outcome prediction and simply remark the association of low L-Gln values and development of eGIAEs.
4. Patients and Methods
4.1. Patients
One hundred and thirty-five patients with advanced HCC who were candidates to start treatment with sorafenib were consecutively included in the study. Patient inclusion and exclusion for sorafenib treatment followed the already published policy at the BCLC [1]. In brief, the inclusion criteria were as follows:
- (1)
- HCC diagnosed according to American Association for the Study of Liver Diseases (AASLD) guidelines;
- (2)
- Adequate liver function (albumin > 2.8 g/dL; total bilirubin < 3 mg/dL; and alanine and aspartate aminotransferases < 5 times the upper limit of the normal range), and Child–Pugh score 6–7 points;
- (3)
- Performance status (PS) 0–1;
- (4)
- Controlled arterial hypertension and stable peripheral vascular disease;
- (5)
- Adequate hematologic profile (platelet count > 60 × 109/L; hemoglobin > 8.5 g/dL; and prothrombin time > 50%);
- (6)
- Adequate renal function (serum creatinine < 1.5 times the upper limit of the normal range).
The exclusion criteria were as follows:
- (1)
- Myocardial infarction in the past year or active ischemic heart disease;
- (2)
- Acute variceal bleeding in the past month;
- (3)
- Severe peripheral arterial disease;
- (4)
- Cardiac arrhythmia under treatment with drugs other than beta-blockers or digoxin;
- (5)
- Uncontrolled ascites;
- (6)
- Encephalopathy;
- (7)
- Unfeasibility to fulfil the follow-up schedule.
The study was reviewed and approved by Hospital Clinic Barcelona Board on Clinical and Experimental Research (HCB/2013/8351 and HCB/2017/1016) and complied with the provisions of the Good Clinical Practice guidelines and the Declaration of Helsinki. All patients provided written informed consent before enrolment.
4.2. Sorafenib Treatment
Sorafenib was initiated at full dose (400 mg twice a day), which was modified upon the development of adverse events according to the manufacturer’s recommendations [32]. Treatment was continued until symptomatic progression, unacceptable adverse events, inclusion in a second-line trial or death.
4.3. Follow up under Sorafenib Treatment
Clinical and laboratory assessments were carried out monthly and radiological tumor evaluation at week 4 and afterwards every 8 weeks. Unscheduled visits due to adverse events were conducted according to the patients’ needs.
4.4. Adverse Events
All AEs of grade > II that occurred between treatment initiation and 30 days after the last dose were recorded in a prospective database. AEs were classified according to the Common Terminology Criteria for Adverse Events version 4.03 (CTCAE 2009 9) [33].
4.5. Blood Sample Collection
Blood sampling was performed prior to starting treatment under fasting conditions. Blood samples were drawn in inert gel barrier, clot activator coating tubes. Plasma was aliquoted and stored at −80 °C until the moment of analysis. All samples were thawed for the first time at the moment of analysis.
Plasma L-Gln was determined using the Glutamine Assay Kit (ref KA1627 Abnova Corporation) following the manufacturer’s instructions. Briefly, the assay was based on an enzyme-catalyzed kinetic reaction, the hydrolysis of glutamine to glutamate and colorimetric determination of the product at 565 nm wavelength. The intensity of the product color was proportional to the glutamine concentration in the sample, calculated through a standard curve of known L-Gln concentrations.
4.6. Statistical Analysis
Quantitative variables were expressed as median and interquartile range (IQR 25th–75th percentiles). Categorical variables were described as absolute frequencies and percentages (%). Comparisons between groups for quantitative or ordinal variables were assessed by Mann–Whitney U test. Fisher’s exact test was used for comparing categorical variables. Time to event variables were described using the Kaplan–Meier method [34] with medians and their 95% CI, and the survival functions was compared with the log-rank test.
The hazard ratios (HR) with their 95% CI were estimated using Cox regression univariate and multivariate models [35]. In the quantitative variables, the HR describes the effect associated with increasing a unit.
All tests were two-sided with a significant level of 0.05, which was considered statistically significant, and all calculations were performed with SAS V.9.4 software (SAS Institute, Cary, North Carolina, USA).
5. Conclusions
We have shown the association of low concentrations of circulating L-Gln with the development of gastrointestinal adverse events early after the start of sorafenib in patients with HCC. Diarrhea is the most frequent of these events and it is important to stress that their control may prime rapid dose adjustments or even treatment interruption that may prevent the expected survival benefits of sorafenib.
Supplementary Materials
The following supporting information can be downloaded at: https://www.mdpi.com/article/10.3390/gidisord4030014/s1, Table S1: Baseline characteristics of patients who developed GIAEs at 30 days and of those who did not.
Author Contributions
Conceptualization: L.B., J.B. and M.R.; Formal Analysis: V.S., A.F. and J.B.; Funding Acquisition: L.B., J.B. and M.R.; Investigation: E.S., N.L., G.I. and L.B.; Methodology: L.B., Á.D.-G., L.G.D.F. and M.S.-Z.; Supervision: J.B. and M.R.; Writing—Original Draft Preparation: L.B., V.S., J.B. and M.R.; Writing—Review and Editing Visualization: A.F., Á.D.-G., L.G.D.F., M.S.-Z., J.B. and M.R. All authors have read and agreed to the published version of the manuscript.
Funding
This study has been funded by Centro de Investigaciones Biomédicas En Red de Enfermedades Hepáticas y Digestivas (CIBERehd) and project number PI18/00768 jointly from Instituto de Salud Carlos III together with Fondo Europeo de Desarrollo Regional (FEDER), European Union.
Institutional Review Board Statement
The study was reviewed and approved by the Hospital Clinic Barcelona Board on Clinical and Experimental Research (HCB/2013/8351 and HCB/2017/1016) and complied with the provisions of the Good Clinical Practice guidelines and the Declaration of Helsinki. All patients provided written informed consent before enrolment in the study.
Informed Consent Statement
Informed consent was obtained from all subjects involved in the study.
Data Availability Statement
The original contributions presented in the study are included in the article/supplementary material; further inquiries can be directed to the corresponding author.
Acknowledgments
AD-G has been supported by the following grants: ISCIII (CM15/00050), Societat Catalana de Digestologia Ajuts per a la iniciació a larecerca 2017, and Asociación Española Contra el Cáncer Ayuda Clínico Junior 2018 (CLJUN18016DIAZ). MS-Z is supported by “Ajuts per a la iniciació a la recerca 2019 from Societat Catalana de Digestologia (SCD)” and FI19/041958 from Instituto de Salud Carlos III. AF received grant support from Instituto de Salud Carlos III (PI18/0542). JB received grant support from Instituto de Salud Carlos III (PI18/00768), AECC (PI044031), Secretaria d’Universitats i Recerca del Departament d’Economia i Coneixement (2014 SGR 605) and WCR (AICR) 16-0026. MR received grant support from Instituto de Salud Carlos III (PI15/00145 and PI18/0358). Special thanks to the patients and families that participated in the study. Investigators are indebted to the CERCA Program from Generalitat de Catalunya and Fondo Europeo de Desarrollo Regional (FEDER) from the European Commission. This work was developed at Centro Esther Koplowitz building in Barcelona.
Conflicts of Interest
L.B.: None. V.S.: Travel funding from Bayer. E.S.: None. N.L.: Travel funding and consultancy for Bayer and consultancy for AstraZeneca. G.I.: None. A.D.-G.: Speaker fees and travel funding from Bayer. Travel funding from BTG and GILEAD. L.G.d.F.: Speaker fees and travel funding from Bayer. M.S.-Z.: Speaker fees and travel funding from Bayer. Travel grant from BTG. A.F.: Consultancy fees from Bayer, Guerbert and AstraZeneca. Speaker fees from Bayer, MSD-Eisai and Gilead. J.B.: Consultancy fees from Arqule, Bayer, Novartis, BMS, BTGBiocompatibles, Eisai, Kowa, Terumo, Gilead, Bio-Alliance/Onxeo, Roche, AbbVie, Merck, Sirtex, Ipsen, Astra-Medimmune, Incyte, Quirem, Adaptimmune, Lilly, Basilea and Nerviano. Research grants from Bayer and BTG. Educational grants from Bayer and BTG. Lecture fees from Bayer, BTG-Biocompatibles, Eisai, Terumo, Sirtex and Ipsen. M.R.: Consultancy fees from Bayer, BMS, Roche, Ipsen, AstraZeneca and Lilly. Lecture fees from Bayer, BMS, Gilead, and Lilly. Research grants from Bayer and Ipsen.
References
- Reig, M.; Torres, F.; Rodriguez-Lope, C.; Forner, A.; Llarch, N.; Rimola, J.; Darnell, A.; Ríos, J.; Ayuso, C.; Bruix, J. Early dermatologic adverse events predict better outcome in HCC patients treated with sorafenib. J. Hepatol. 2014, 61, 318–324. [Google Scholar] [CrossRef] [PubMed]
- Llovet, J.M.; Ricci, S.; Mazzaferro, V.; Hilgard, P.; Gane, E.; Blanc, F.; de Oliveira, A.C.; Santoro, A.; Raoul, J.L.; Forner, A.; et al. Sorafenib in advanced hepatocellular carcinoma. N. Engl. J. Med. 2008, 359, 378–390. [Google Scholar] [CrossRef] [PubMed] [Green Version]
- Arrieta, M.C.; Bistritz, L.; Meddings, J.B. Alterations in intestinal permeability. Gut 2006, 55, 1512–1520. [Google Scholar] [CrossRef] [PubMed] [Green Version]
- Déchelotte, P.; Darmaun, D.; Rongier, D.; Hecketsweiler, B.; Rigal, O.; Desjeux, J.F. Absorption and metabolic effects of enterally administered glutamine in humans. Am. J. Physiol. 1991, 260, G677–G682. [Google Scholar] [CrossRef] [PubMed]
- Matter, K.; Balda, M.S. Signalling to and from tight junctions. Nat. Rev. Mol. Cell. Biol. 2003, 4, 225–236. [Google Scholar] [CrossRef]
- Prasad, S.; Mingrino, R.; Kaukinen, K.; Hayes, K.L.; Powell, R.M.; MacDonald, T.T.; Collins, J.E. Inflammatory processes have different effects on claudins 2, 3 and 4 in colonic epithelial cells. Lab. Investig. 2005, 85, 1139–1162. [Google Scholar] [CrossRef]
- Seth, A.; Basuroy, S.; Sheth, P.; Rao, R.K. L-Glutamine ameliorates acetaldehyde-induced increase in paracellular permeability in Caco-2 cell monolayer. Am. J. Physiol. Gastrointest. Liver Physiol. 2004, 287, G510–G517. [Google Scholar] [CrossRef]
- Camilleri, M.; Madsen, K.; Spiller, R.; Greenwood-van Meerveld, B.; Verne, G.N. Intestinal barrier function in health and gastrointestinal disease. Neurogastroenterol. Motil. 2012, 24, 503–512. [Google Scholar] [CrossRef]
- Reig, M.; Forner, A.; Rimola, J.; Ferrer-Fàbrega, J.; Burrel, M.; Garcia-Criado, A.; Kelley, R.K.; Galle, P.R.; Mazzaferro, V.; Salem, R.; et al. BCLC strategy for prognosis prediction and treatment recommendation: The 2022 update. J. Hepatol. 2022, 76, 681–693. [Google Scholar] [CrossRef]
- Wu, G. Functional amino acids in nutrition and health. Amino Acids 2013, 45, 407–411. [Google Scholar] [CrossRef] [Green Version]
- Treinen-Moslen, M.; Kanz, M.F. Intestinal tract injury by drugs: Importance of metabolite delivery by yellow bile road. Pharmacol. Ther. 2006, 112, 649–667. [Google Scholar] [CrossRef] [PubMed]
- Beutheu, S.; Ouelaa, W.; Guérin, C.; Belmonte, L.; Aziz, M.; Tennoune, N.; Bôle-Feysot, C.; Galas, L.; Déchelotte, P.; Coëffier, M. Glutamine supplementation, but not combined glutamine and arginine supplementation, improves gut barrier function during chemotherapy-induced intestinal mucositis in rats. Clin. Nutr. 2014, 33, 694–701. [Google Scholar] [CrossRef]
- Howell, J.; Pinato, D.J.; Ramaswami, R.; Bettinger, D.; Arizumi, T.; Ferrari, C.; Yen, C.; Gibbin, A.; Burlone, M.E.; Guaschino, G.; et al. On-target sorafenib toxicity predicts improved survival in hepatocellular carcinoma: A multi-centre, prospective study. Aliment. Pharmacol. Ther. 2017, 45, 1146–1155. [Google Scholar] [CrossRef] [PubMed]
- Díaz-González, Á.; Sapena, V.; Boix, L.; Torres, F.; Sanduzzi-Zamparelli, M.; Da Fonseca, L.G.; Llarch, N.; Iserte, G.; Guedes, C.; Muñoz-Martínez, S.; et al. Early diarrhoea under sorafenib as a marker to consider the early migration to second-line drugs. United Eur. Gastroenterol. J. 2021, 9, 655–661. [Google Scholar] [CrossRef]
- Naganuma, A.; Hoshino, T.; Ohno, N.; Ogawa, Y.; Murakami, T.; Horiguchi, S.; Uehara, D.; Suzuki, Y.; Hatanaka, T.; Kudo, T.; et al. b-Hydroxy-b-methyl butyrate/L-Arginine/L-Glutamine supplementation for preventing Hand-Foot SkinReaction in sorafenib for advanced hepatocellular carcinoma. In Vivo 2019, 33, 155–161. [Google Scholar] [CrossRef]
- Newsholme, E.A.; Parry-Billings, M. Properties of glutamine release from muscle and its importance for the immune system. J. Parenter. Enter. Nutr. 1990, 14, 63S–67S. [Google Scholar] [CrossRef] [PubMed]
- Häussinger, D.; Schliess, F. Glutamine metabolism and signaling in the liver. Front. Biosci. 2007, 12, 371–391. [Google Scholar] [CrossRef] [PubMed] [Green Version]
- Young, V.R.; Ajami, A.M. Glutamine: The emperor or his clothes? J. Nutr. 2001, 131, 2449–2459. [Google Scholar] [CrossRef]
- Patterson, B.W.; Horowitz, J.F.; Wu, G.; Watford, M.; Coppack, S.W.; Klein, S. Regional muscle and adipose tissue amino acid metabolism in lean and obese women. Am. J. Physiol. Endocrinol. Metab. 2002, 282, E931–E936. [Google Scholar] [CrossRef] [Green Version]
- Lacey, J.M.; Wilmore, D.W. Is glutamine a conditionally essential amino acid? Nutr. Rev. 1990, 48, 297–309. [Google Scholar] [CrossRef] [PubMed]
- Smith, R.J. Glutamine metabolism and its physiologic importance. JPEN J. Parenter. Enteral. Nutr. 1990, 14 (Suppl. 4), S40–S44. [Google Scholar] [CrossRef]
- Karinch, A.M.; Pan, M.; Lin, C.M.; Strange, R.; Souba, W.W. Glutamine metabolism in sepsis and infection. J. Nutr. 2001, 131, 2535S–2538S. [Google Scholar] [CrossRef]
- Boelens, P.G.; Nijveldt, R.J.; Houdijk, A.P.; Meijer, S.; van Leeuwen, P.A. Glutamine alimentation in catabolic state. J. Nutr. 2001, 131, 25695–25775, 25905. [Google Scholar] [CrossRef]
- Kim, M.H.; Kim, H. The roles of glutamine in the intestine and its implication in intestinal diseases. Int. J. Molec. Sci. 2017, 18, 1051. [Google Scholar] [CrossRef] [Green Version]
- Piton, G.; Capellier, G. Biomarkers of gut barrier failure in the ICU. Curr. Opin. Crit. Care 2016, 22, 152–160. [Google Scholar] [CrossRef] [PubMed]
- Crenn, P.; Messing, B.; Cynober, L. Citrulline as a biomarker of intestinal failure due to enterocyte mass reduction. Clin. Nutr. Edinb. Scotl. 2008, 27, 328–339. [Google Scholar] [CrossRef] [PubMed]
- van de Poll, M.C.; Ligthart-Melis, G.C.; Boelens, P.G.; Deutz, N.E.; van Leeuwen, P.A.; Dejong, C.H. Intestinal and hepatic metabolism of glutamine and citrulline in humans. J. Physiol. 2007, 581, 819–827. [Google Scholar] [CrossRef]
- Schelleckens, D.H.; Grootjans, J.; Dello, S.A.; van Bijnen, A.A.; van Dam, R.M.; Dejong, C.H.; Derikx, J.P.; Buurman, W.A. Plasma intestinal fatty acid binding protein levels correlate with morphologic epithelial intestinal damage in a human translational ischemia-reperfusion model. J. Clin. Gastroenterol. 2013, 48, 253–260. [Google Scholar] [CrossRef] [PubMed]
- Kaiser, S.; Gerok, W.; Häussinger, D. Ammonia and glutamine metabolism in human liver slices: New aspects on the pathogenesis of hyperammonaemia in chronic liver disease. Eur. J. Clin. Investig. 1988, 18, 535–542. [Google Scholar] [CrossRef]
- Bode, B.P.; Souba, W.W. Glutamine transport and human hepatocellular transformation. J. Parenter. Enter. Nutr. 1999, 23 (Suppl. 5), S33–S37. [Google Scholar] [CrossRef]
- Hirayama, C.; Suyama, K.; Horie, Y.; Tanimoto, K.; Kato, S. Plasma amino acid patterns in hepatocellular carcinoma. Biochem. Med. Metab. Biol. 1987, 38, 127–133. [Google Scholar] [CrossRef]
- Sorafenib Product Characteristics. Available online: http://www.nexavar.com/home/pdf/SmPC-Jan-2015.pdf (accessed on 5 October 2015).
- National Cancer Institute. Common Terminology Criteria for Adverse Events (CTCAE), v4.0; 2009. Available online: https://ctep.cancer.gov/protocoldevelopment/electronic_applications/docs/ctcae_4_with_lay_terms.pdf (accessed on 10 May 2022).
- Kaplan, E.L.; Meier, P. Nonparametric estimation from incomplete observations. J. Am. Stat. Assoc. 1958, 53, 457–481. [Google Scholar] [CrossRef]
- Cox, D.R. Regression models and Life-Tables. J. R. Stat. Soc Ser. B (Methodol.) 1972, 34, 187–220. [Google Scholar] [CrossRef]
Publisher’s Note: MDPI stays neutral with regard to jurisdictional claims in published maps and institutional affiliations. |
© 2022 by the authors. Licensee MDPI, Basel, Switzerland. This article is an open access article distributed under the terms and conditions of the Creative Commons Attribution (CC BY) license (https://creativecommons.org/licenses/by/4.0/).