Article

The Effects of a Morphed Trailing-Edge Flap on the Aeroacoustic and Aerodynamic Performance of a 30P30N Aerofoil

by
Joseph Watkins
* and
Abdessalem Bouferrouk
*
School of Engineering, University of the West of England, Bristol BS16 1QY, UK
*
Authors to whom correspondence should be addressed.
Acoustics 2022, 4(1), 248-267; https://doi.org/10.3390/acoustics4010015
Submission received: 19 December 2021 / Revised: 27 February 2022 / Accepted: 28 February 2022 / Published: 3 March 2022

Abstract

:
This paper presents initial results on the aeroacoustic and aerodynamic effects of morphing the trailing-edge flap of the 30P30N aerofoil, over five flap deflections (5–25°), at an 8° angle of attack and a Reynolds number of R e = 9.2 × 10 5 . The Ffowcs-Williams–Hawkings acoustic analogy estimates the far-field noise, whilst the flow field is solved using URANS with the four-equation Transition SST model. Aerodynamic and aeroacoustic simulation data for the 30P30N’s full configuration compare well with experimental results. A Courant number (C) ≤ 1 should be used for resolving tonal noise, whilst a C of up to 4 is sufficient for broadband noise. Sound pressure level results show an average 11% reduction in broadband noise across all flap deflections and frequencies for the morphed configuration compared with the conventional, single-slotted flap. The morphed flap eliminates the multiple tonal peaks observed in the conventional design. Beyond 15° flap deflection, the morphing flap achieves higher stall angles, but with increased drag, leading to a maximum reduction of 17% in Cl/Cd ratio compared with the conventional flap. The methodology reported here for the 30P30N is a quick tool for initial estimates of the far-field noise and aerodynamic performance of a morphing flap at the design stage.

1. Introduction

Aircraft engine noise has been reduced significantly through innovations, resulting in the mass production of high-bypass-ratio turbofan engines such as the Rolls Royce Trent engine line. Airframe noise—of most significance at take-off and landing, where engines operate at low thrust—has thus become a much larger contributor to overall aircraft noise than it used to be. In particular, a significant proportion of this noise is a direct consequence of the deployment of high-lift devices in the form of leading-edge slats and trailing-edge flaps. Projects such as the work presented in this paper have increased in relevance recently because residential areas surrounding airports are becoming more densely populated. Past research has shown the damaging effects of aircraft noise near residential areas due to disturbing sleep patterns (Chen et al. [1]), leading to increased stress levels, damage to surrounding ecosystems, and reduced wildlife populations. For these reasons, projects such as NASA’s Quiet Aircraft Technology (QAT) project have appeared, with the aim of improving the quality of life for those most impacted by aircraft noise (Whitfield [2]).
The 30P30N aerofoil geometry, as shown in Figure 1, is widely used for studying the aerodynamic and aeroacoustics of high-lift devices, including noise reduction techniques. Murayama et al. [3] tested the 30P30N aerofoil in a 2-metre x 2-metre JAXA wind tunnel test section; they placed a series of unsteady pressure transducers on the surface of the wing to analyse the near-field sound propagation, and an array of microphones on the walls of the test section to assess the far-field noise.
The authors concluded that the 30P30N aerofoil has multiple narrow broadband peaks across all angles of attack tested, and whose amplitude decreases as the angle of attack is increased. They also found that broadband noise for this aerofoil configuration is highest at low angles of attack (i.e., 0 and 3.5 degrees). Using data from the near-field pressure transducers around the aerofoil geometry, they realised that the highest contributor to the overall wing section noise originated from the leading-edge slat.
More recently, research by Jawahar et al. [4] investigated the aeroacoustic effects of using various designs of fillers for the cove regions on the slat and flap gaps of the 30P30N aerofoil. Their results showed that there was no significant change in lift-to-drag ratio unless the full slat cove filler was used. The acoustic results also demonstrated that the full cove filler configuration could reduce the overall broadband noise across a wide spectrum by 4–5 dB, and the tonal noise generated by the sharp trailing edge of the slat was almost eliminated.
The work of Choudhari and Lockard [5] aimed to improve the benchmark for experimental acoustic analysis, and to determine best practices for numerical acoustic simulations when analysing noise generated by high-lift devices. They explained that slat and flap noise is a complex problem, with multiple noise-generation mechanisms. This can make it hard to identify specific noise sources to begin to create any kind of noise reduction technique.
Streett et al. [6] tested a large swept-wing model in NASA’s Langley Research Centre subsonic wing tunnel. They investigated the noise sources located at the flap side edges (FSEs), slat cove region, and the near-inboard slat tip, and then tested various noise-reduction techniques to analyse their effectiveness. Figure 2 shows a noise source map of the baseline model at a 10° angle of attack for both (a) 6500 Hz and (b) 14,500 Hz frequencies.
The noise from the flap side edges is essentially caused by additional flap-tip vortices mixing with the flow from the flap’s slot region. One can see from Figure 2 that there is little effect from the trailing edge of the flap. The authors introduced a ‘continuous mould-line link’ (CML) to delay the streamwise vortex shedding, as shown in Figure 3.
The findings of Streett et al. [6] showed a significant reduction in higher frequency broadband noise, with 5–15dB less recorded sound pressure level (SPL) above 2.5 kHz. The CML design ‘virtually eliminated’ the noise generated by the inboard and outboard flap side edges. The authors emphasised the importance of reducing acoustic noise without negatively impacting the aerodynamic performance of the wing too much.
Three-element high-lift Fowler-type flaps can be very sensitive to passive flow-control techniques, and so the aerodynamic impact should always be thoroughly investigated before further acoustic research or implementation occurs. It is expected that in the wake of the flap, the shedding vortices may interact with the incoming turbulent flow from the main wing—particularly in situations when the high-lift device operates at sufficiently high flap-deflection angles. According to Li et al. [7], the sources and characteristics of noise mechanisms from single-slotted flaps remain poorly understood, despite their importance for developing reliable airframe noise-prediction tools and noise-reduction technologies.
It can be seen from the literature that most studies on the 30P30N aerofoil have mainly considered the noise aspects resulting from the leading-edge slat, with little focus on the potential of trailing-edge flaps (TEFs) for noise abatement. In comparison with experimental studies on noise for this configuration, there is comparatively much less numerical work. In terms of morphing, most studies to date have focused solely either on the aerodynamic or structural aspects of trailing edge flaps, and so there is a gap to fill for the potential effects of a TEF on the noise. There is a general belief amongst researchers that a morphing TEF would reduce both noise and drag compared with a conventional flap but, surprisingly, there are few data to support such claims. Morphing has recently been studied in many papers, and this particular work supplements some research on morphing TEFs (e.g., Evans et al. [8], Loudon et al. [9], Abdessemed et al. [10]). References [8] and [9] both demonstrated that a morphing TEF improves the aerodynamic performance of the NACA 0012 aerofoil, whilst in [10] the authors showed that a harmonically morphing TEF can enhance the L/D ratio by up to 3%, and that it shifts the tonal peaks to higher frequencies, with a maximum reduction in the predicted noise level of 1.5 dB.
The aim of this paper was to discover, via a preliminary simulation study, what impact the morphing of the trailing-edge flap has on aeroacoustics, and whether it negatively affects the aerodynamics (or otherwise) for a range of flap deflections of 5–25° and a fixed angle of attack of 8° for the main wing. This was done using unsteady 2D simulations suitable for the initial design stage (i.e., without the penalties of large computational cost of 3D ultrasmall-timestep simulations). Nearly all aircraft utilize flaps, but not necessarily leading-edge slats; therefore, improvements in high-lift flaps can be applied to a wide range of aircraft. The geometry of the 2D problem proposed in this paper has a cross-sectional view similar to the configuration of Streett et al. [6] at the flap location, but the LE slat was not modelled in the current study. Additional data on the 30P30N aerofoil will be generated, helping future research projects to further validate their work if desired. The influence of timestep on acoustic data was also investigated, with a view to producing reliable computational data for high-lift aeroacoustics.

2. Materials and Methods

2.1. Governing Equations and Numerical Schemes

In this work, the two-dimensional incompressible flow (M = 0.088) around a 30P30N aerofoil was computed using Ansys Fluent (version 2021-R2). The governing equations were the Navier–Stokes (NS) equations, representing the conservation of mass and the conservation of momentum. The equations were solved using a coupled pressure-based solver. The gradients of solution variables at cell centres were computed using a least squares cell-based algorithm. The convective and spatial discretisation schemes used in the present study were all second-order accurate. The temporal discretisation was also second-order accurate, with implicit time-stepping.

2.2. Geometry and Computational Domain

This paper used Ansys Fluent—a cell-centred computational fluid dynamics (CFD) software—to model a 2D planar geometry of the 30P30N aerofoil. The morphing shape for the trailing-edge flap was achieved using a series of B-splines, where the external contours of the conventional geometry were traced to create a smooth, continuous, morphed configuration, in such a way that there was no gap between the main wing and the flap. The gap seen on conventional TEFs is there to accelerate the flow coming from the wing’s bottom surface in order to create additional suction effects on the flap, thereby helping it to generate additional lift. The flow coming through the flap gap from the lower surface, however, forms a vortex that increases pressure drag, and interacts with the flow from the wing’s trailing edge, which is a known source of noise in this configuration. With the morphing flap, the flow from the wing and that from underneath the flap will meet at the flap’s trailing edge, so one would expect this interaction to create a source of noise. The morphing approach used in this paper was different to the one seen in some recent studies—where acoustic fillers were used along the inner wall surface of the slat and flap gaps, such that the gap was only partially filled (e.g., Jawahar et al. [4]). The overall chord length was kept exactly the same between the morphed and conventional configurations. Testing was carried out at an 8° angle of attack for the wing, across five flap deflections: 5, 10, 15, 20, and 25°. The conventional and the morphed configurations are shown in Figure 4 at a 15° flap deflection. The same tracing technique was applied to create all morphed flap deflections.
In terms of flow unsteadiness and, therefore, sources of noise, Li and Liu [11] summarised some key flow physics for a single-slotted flap similar to that depicted at the top of Figure 4a. On the lower side of the main wing, the boundary layer separates at the cut edge of the flap cove and forms a shear layer inside the cove. This shear layer then interacts with the boundary layer generated from the upper surface of the main wing. Such interaction and impingement forms an unstable mixing layer in the wake of the main wing, which may lead to vortex shedding. Some flow separation typically exists on a portion of the flap’s upper surface near the trailing edge. At sufficiently high flap deflection angles, this separated flow may interact with the shedding vortices from the main wing. Finally, the flap’s trailing edge generates its own shear layer, which travels into the wake. All of these flow physics are the source of significant aerodynamic noise coming from the unsteady flow itself, and the interaction of this unsteady flow with solid boundaries. It is easy to notice, therefore, that by morphing the flap as in Figure 4 (bottom), the mixing layer is eliminated, and the vortex shedding behaviour from the main wing is altered.
The C-shaped computational domain boundaries are located at 13 chord lengths in front, above, and below the aerofoil, and 25 chord lengths behind. The boundaries perpendicular to the flow can generate a blockage ratio of around 2% according to past research (e.g., Badshah et al. [12]). In the present work, it was found that when blockage is below 10% there is little or no effect on results, but when blockage increases above 10%, rapid changes in results occur. The boundary conditions used for the flow domain were as follows: the front and bottom boundaries were set as velocity inlets with specified velocity components and standard mean sea level values for pressure and temperature; turbulent intensity was set at 0.25% (similar to what was used by Jawahar et al. [4]); solid surfaces were defined as no-slip stationary walls with zero heat flux, and the top and downstream boundaries were set as pressure outlets.

2.3. Mesh

Meshing was done using a hybrid approach, with structured inflation layers near to the wall to resolve the boundary layer, and unstructured triangular elements for the rest of the computational domain. The first layer height (FLH) of 6.45 × 10 6 m was calculated using a (retracted) chord length of 0.45m, and a target y + of 1. This was imposed to create a mesh with sufficiently small near-wall element size to accurately capture the turbulent boundary layer growing perpendicular to the wall, as well as in the flow direction (which is where the additional accuracy is gained from using the 4-equation Transition SST turbulence model). The total number of inflation layers (45) was calculated using Blasius’ turbulent boundary layer height equation, and a geometric growth rate of 1.2 was used to create the inflation layers.
The rest of the domain element size was determined by a wall element size of 9.7 × 10 4 m and a small element growth rate of 1.03, to an outer domain size of 0.4m. These values were arrived at by trial and error, and are justified by the good agreement of numerical data with experiments upon validation (see Section 3.1). This ensured a gradual phasing out of the acoustic pressure waves in a way that ensured that they were captured accurately by the receiver but were nearly eliminated before reaching the domain boundaries. Doing this reduced the impact of the acoustic waves reflecting off the boundaries and, thus, prevented them from being detected twice by the receiver.
The mesh (Figure 5) had good skewness (average value 0.12) and orthogonal quality (an average value of 0.97) when triangular elements were used to discretise sharp-cornered geometry (such as on the trailing edge of the main body in the conventional case). The final mesh and domain can be seen in Figure 5. The same mesh parameters were used across all configurations. The maximum wall y + across all meshes was 1.2, and there were around 200,000 elements. The method of meshing was kept constant for morphed and conventional cases.

2.4. Solver Method

The computational acoustic analogy used consisted of firstly allowing the simulation to run as steady for around 2000 iterations; this served as a good initialisation for the transient simulation to speed up convergence. When the simulation was changed to transient, a timestep was calculated using Equation (1). A second-order accurate implicit time-stepping scheme was used. For most calculations, the timestep (of the order of 10−5 s) was chosen to achieve a Courant number of ~1. There were 10 inner iterations per timestep. A Courant number of 1 was used (refer to Timestep Study, Section 2.5), flow velocity was 30 m/s, and ∆x was the smallest mesh element size in the flow-wise direction; this gives Δ t = 1.07 × 10 5 seconds.
T i m e   s t e p   ( Δ t ) = C × Δ x U
The simulation was then run until a statistically steady-state solution was achieved (this is defined as the flow having no overall up- or downtrend in parameters such as lift and drag coefficients). Next, data sampling for time statistics in the software was exploited to obtain data averaged over time for easier comparisons. The Ffowcs-Williams–Hawkings (FWH) acoustic analogy was used to predict the far-field acoustic noise propagation. In calculating the sound pressure levels in dB, a standard reference pressure of 2 × 10 5 Pa was used (the lowest threshold of human hearing). Acoustic measurements using the FWH model only began once the flow was established and was considered to be statistically steady. The source correlation length was set to 0.53m, as was used by Jawahar et al. [4], whose wind tunnel acoustic data were used for validation. The receiver was located at 1.5m below the leading edge of the aerofoil (in the far field). According to guidance from the International Organization for Standardization [13], the near field ends at a point defined as a wavelength of sound, or equal to a distance of three times the largest geometric dimension (here, the aerofoil chord was 0.45m, and so three times this distance was rounded to 1.5m for simplicity).
The coupled pressure–velocity solver was used for all unsteady simulations, along with a second-order upwind scheme for all flow variables. Meanwhile, the PRESTO! solution method was also used for pressure in order to achieve greater accuracy for computing pressure fluctuations by solving instead of interpolating at the boundaries, although this is more computationally expensive (Ansys Fluent [14]). The simulation runtime, with the acoustic model (FWH) used, was determined using Equation (2); this is based on running 5 periods for the corresponding minimum resolved frequency, as advised in Ansys Fluent’s theory manual (Ansys Fluent [14]), ensuring statistical stationarity.
( t e n d t s t a r t ) = 5 f m i n

2.5. Timestep Study

In unsteady (or transient) numerical simulations, the non-dimensional Courant number is used in the timestep calculation, and is usually the determining factor of how far the information, or numerical calculation, advances across the computational domain from cell to cell with time. The formulation for the Courant number C is shown in Equation (3), where U is the free stream velocity, Δt is the timestep, and Δx is the smallest mesh element in the flow-wise direction:
C = U Δ t Δ x
A stability requirement which that be met by all numerical simulations when solving time integration schemes is the CFL condition (Courant et al., 1967 [15]), as stated in Equation (4):
C = U Δ t Δ x C m a x
where, typically, C m a x   1 .
A virtual spatial discretisation grid to graphically show the CFL condition on a simplified computational grid is shown in Figure 6 [16]. From Figure 6, when using a C value of greater than 1, we can see that significant resolution is lost when trying to capture the sinusoidal graph depicted in the centre. Abiding by the CFL condition (C ≤ 1) will usually generate a very small timestep, leading to very high computational costs. Higher order numerical schemes supposedly allow for a Courant number of greater than 1 to be used to achieve good results accuracy; however, great care must be taken to have a mesh with relatively small grid spacing and low skewness, as the absence of these can rapidly lead to incorrect solution convergence.
For this paper, a short study was carried out to determine the influence of changing the Courant number on acoustic results. This was done using a constant mesh and flow velocity between test cases. There were around 250,000 elements in the mesh, with the smallest grid spacing in the x-direction of 3.22 × 10 4 m, and a free stream velocity of 30 m/s. The Courant number was varied, as the independent variable, to alter the timestep. Four different time steps were tested on the 30P30N aerofoil with no slat, at an 8° angle of attack and a flap deflection of 10°. Courant numbers of 4, 2, 1, and 0.7 were tested with corresponding timesteps of 4.29 × 10 5 s, 2.15 × 10 5 s, 1.07 × 10 5 s, and 7.51 × 10 6 s, respectively. The acoustic results of these tests are shown in Figure 7 in the form of sound pressure levels (SPLs).
Assuming that the more accurate data are those generated when C ≤ 1 (the CFL condition), the aim of this short test was to assess whether any accuracy is lost when increasing C above 1 (i.e., increased timestep).
From the data in Figure 7, it can be observed that when using a CFL number of 1 and above, the simulation tends to underpredict noise at low frequencies and overpredict it at higher frequencies. Although the maximum difference was 13% between the SPL at 1 kHz for CFLs of 2 and 0.7, all of the timesteps tested did generally predict similar levels of broadband noise. However, there were two tonal peaks near 4.5 kHz and 9 kHz, which were only detected when using Courant numbers of 1 and 0.7 (this can be seen in the plot of raw sound pressure level shown in Figure 8), although there was a slight shift in these peaks to higher frequencies for C = 0.7. Whilst this slight shift might be indicative of the need for a finer mesh (and, thus, further experimenting with lower values of C might be needed), it is clear that such peaks are only detected when using a sufficiently small timestep (with C of 1 or less). As the CFL number decreases (decreased timestep), the maximum frequency resolved increases, as expected by the Nyquist criterion. The differences in lift and drag coefficients between timesteps are negligible (not shown), and accurate aerodynamic parameters are obtained even with a C of 4. This is perhaps unsurprising, because aerodynamic coefficients are integral quantities, and for aerodynamic studies CFL numbers in the order of 10 are not uncommon.
Overall, it can be concluded from Figure 7 and Figure 8 that when analysing the aeroacoustic performance of an aerofoil, a C value of 1 or less must be used in order to accurately detect both broadband and tonal noise. However, a good approximation can be made on broadband noise with reduced computational effort, even with a C value of up to 4. When deciding whether to use a CFL of 1 or less, the added accuracy of using a C of 0.7 is sufficient considering the additional computational time and cost. Thus, where possible, a C value of 1 should be used to produce accurate aeroacoustic data. However, when increasing the Courant number above 1, great care must be taken when making any conclusions based on tonal noise, as this is where significant inaccuracies of larger timesteps tend to arise. It is worth mentioning in passing that further research into optimising numerical schemes to predict aeroacoustic wave propagation was done by Gracia et al. [17], who proposed a mapping technique that allows for a coarser grid to be used without a significant reduction in acoustic prediction accuracy.

3. Results and Discussion

In this section, the numerical results are presented and analysed, along with validation of the simulation technique using the aerodynamic data of Murayama et al. (2014) [3] and the far-field acoustic data of Jawahar et al. [4]. Both sets of validation data were obtained via controlled wind tunnel experiments. Following validation, the aerodynamic and acoustic effects of a morphing trailing-edge flap were analysed and compared with those for a conventional single-slotted flap.

3.1. Validation

The geometric configuration used for validation was the default 30P30N aerofoil (three elements at 30° flap and slat deflection). All experimental conditions of the wind tunnel experiments, replicated in Ansys Fluent—with a Reynolds number Re = 1.71 × 10 6 (Mach number M = 0.17)—were used for pressure and aerodynamic performance validation, whereas conditions of Reynolds number Re = 7 × 10 5 (Mach number of M = 0.089) were used for aeroacoustic validation. Firstly, pressure plots from Murayama et al. [
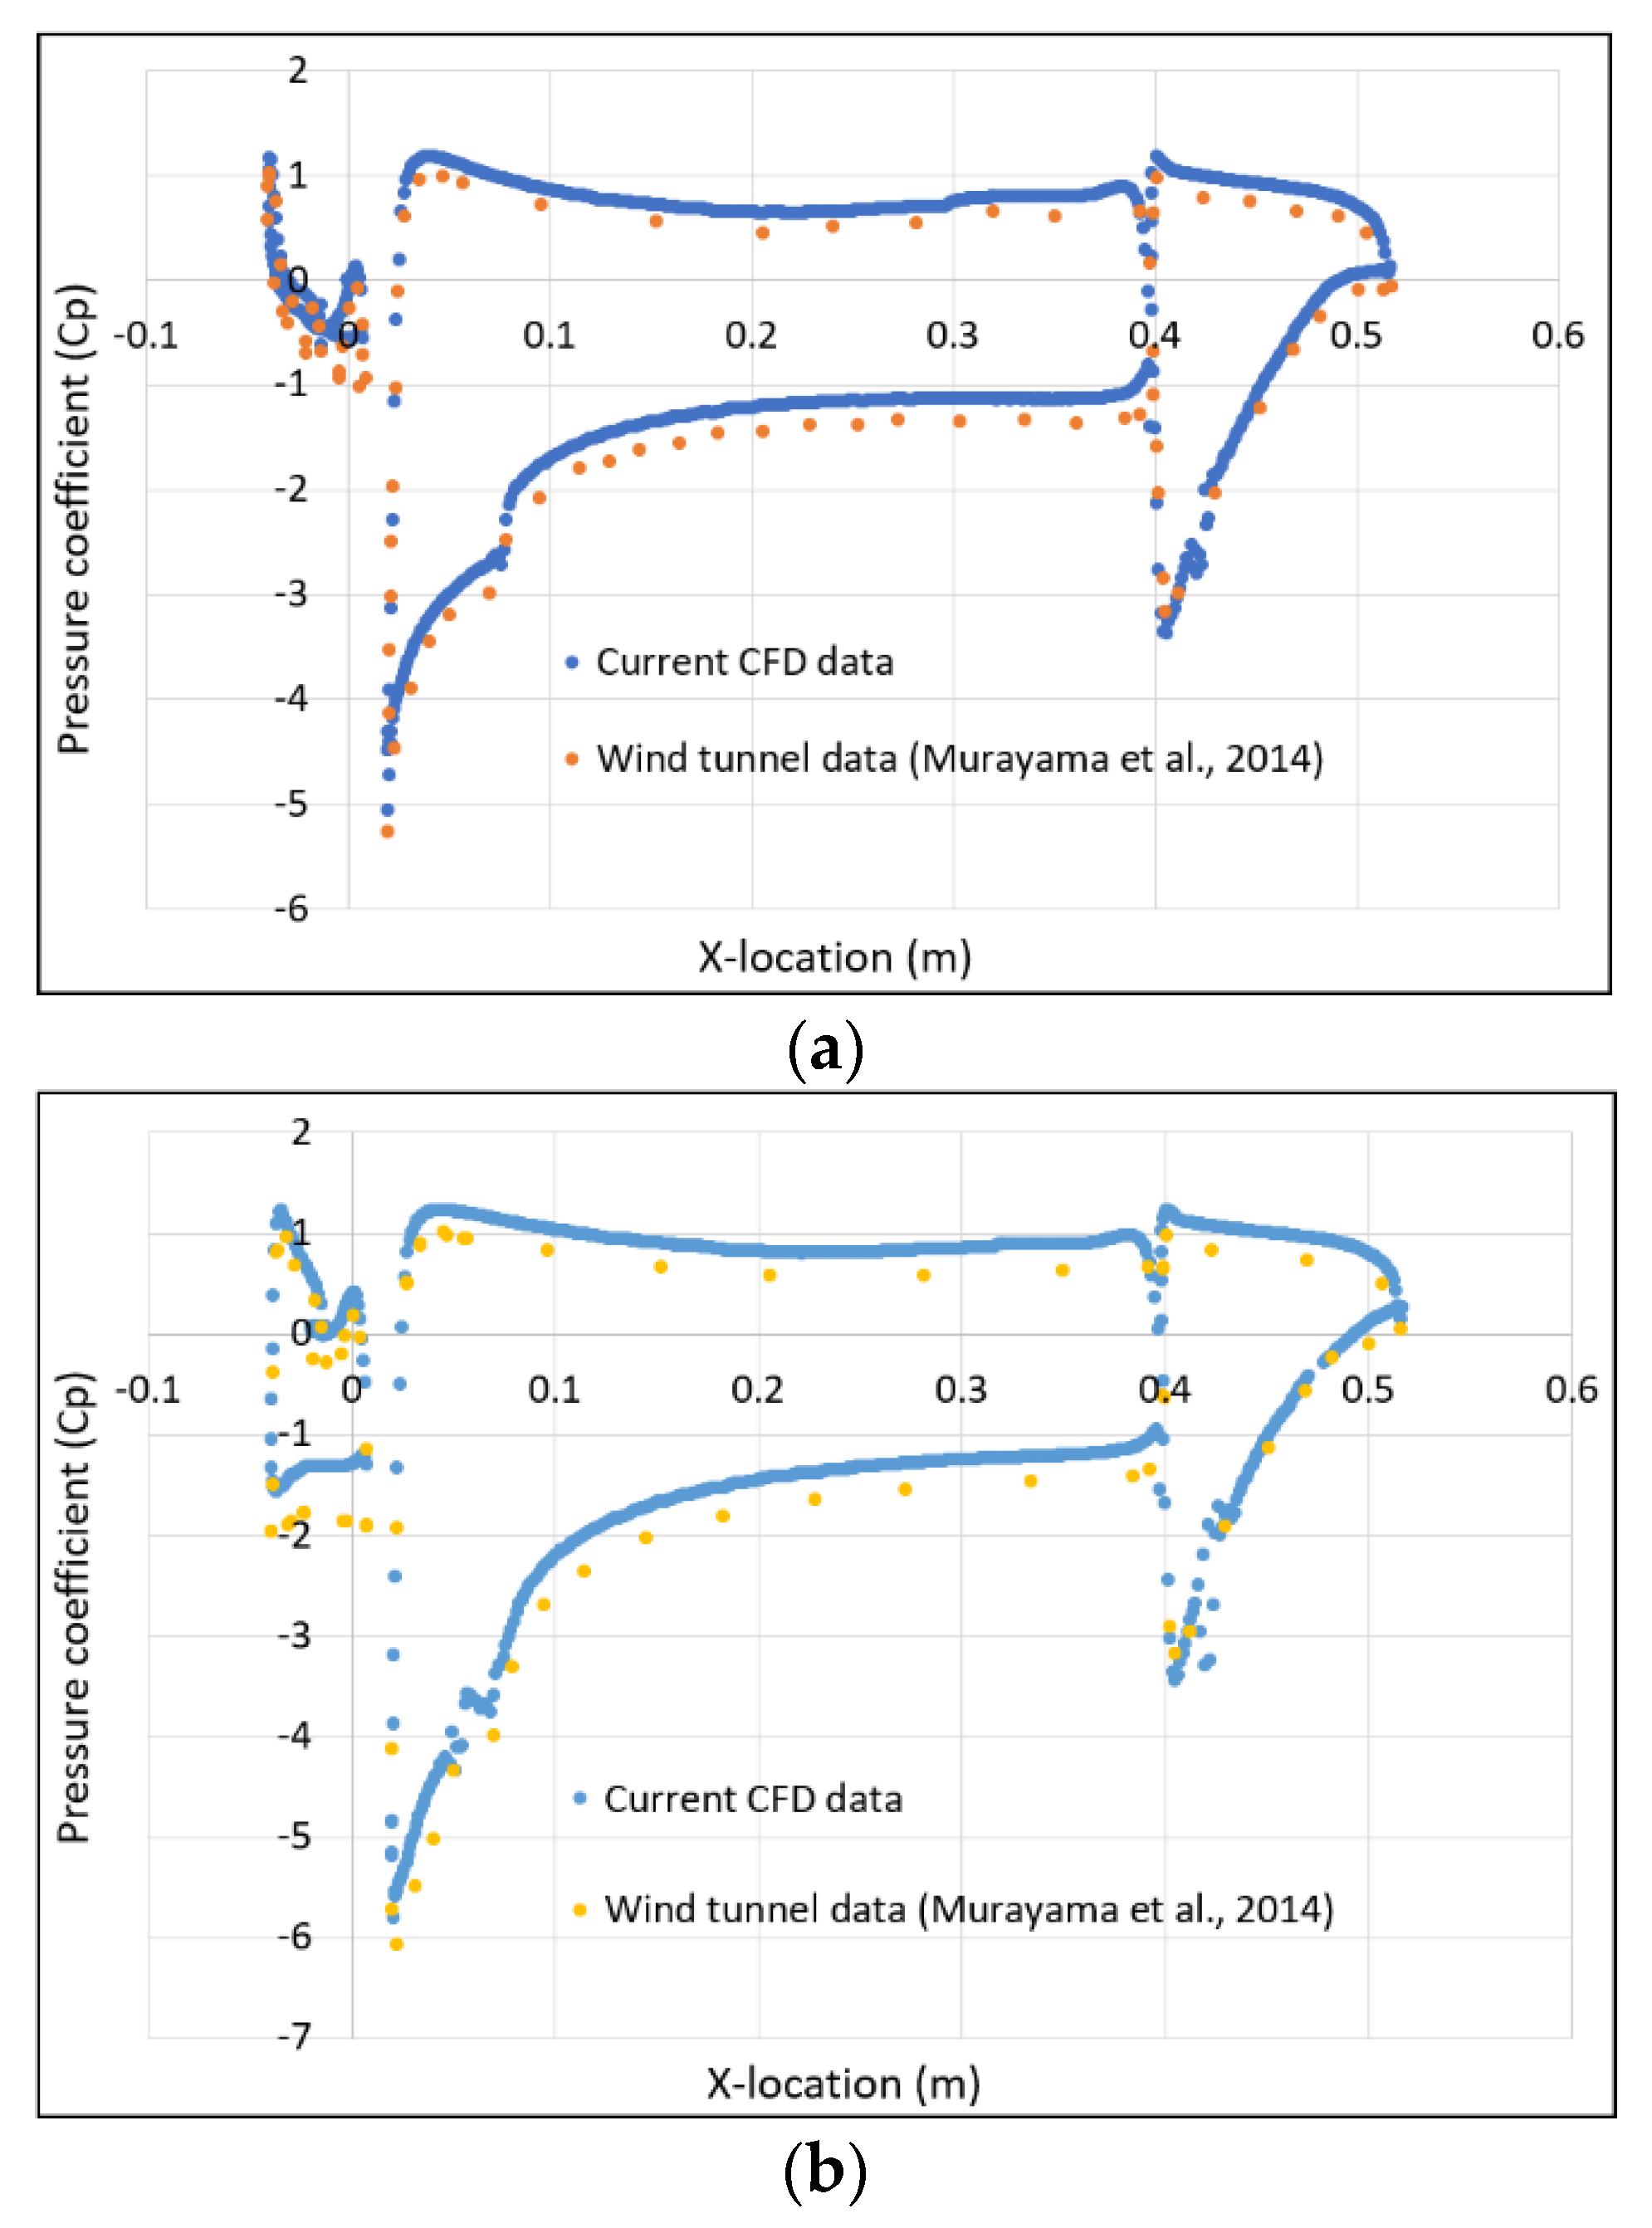
3] were used to validate the CFD methodology, as shown in Figure 9 for both 3° and 8° angles of attack (AoAs). The X-location in Figure 9 was measured starting from the slat’s leading edge and ending at the flap’s trailing edge.
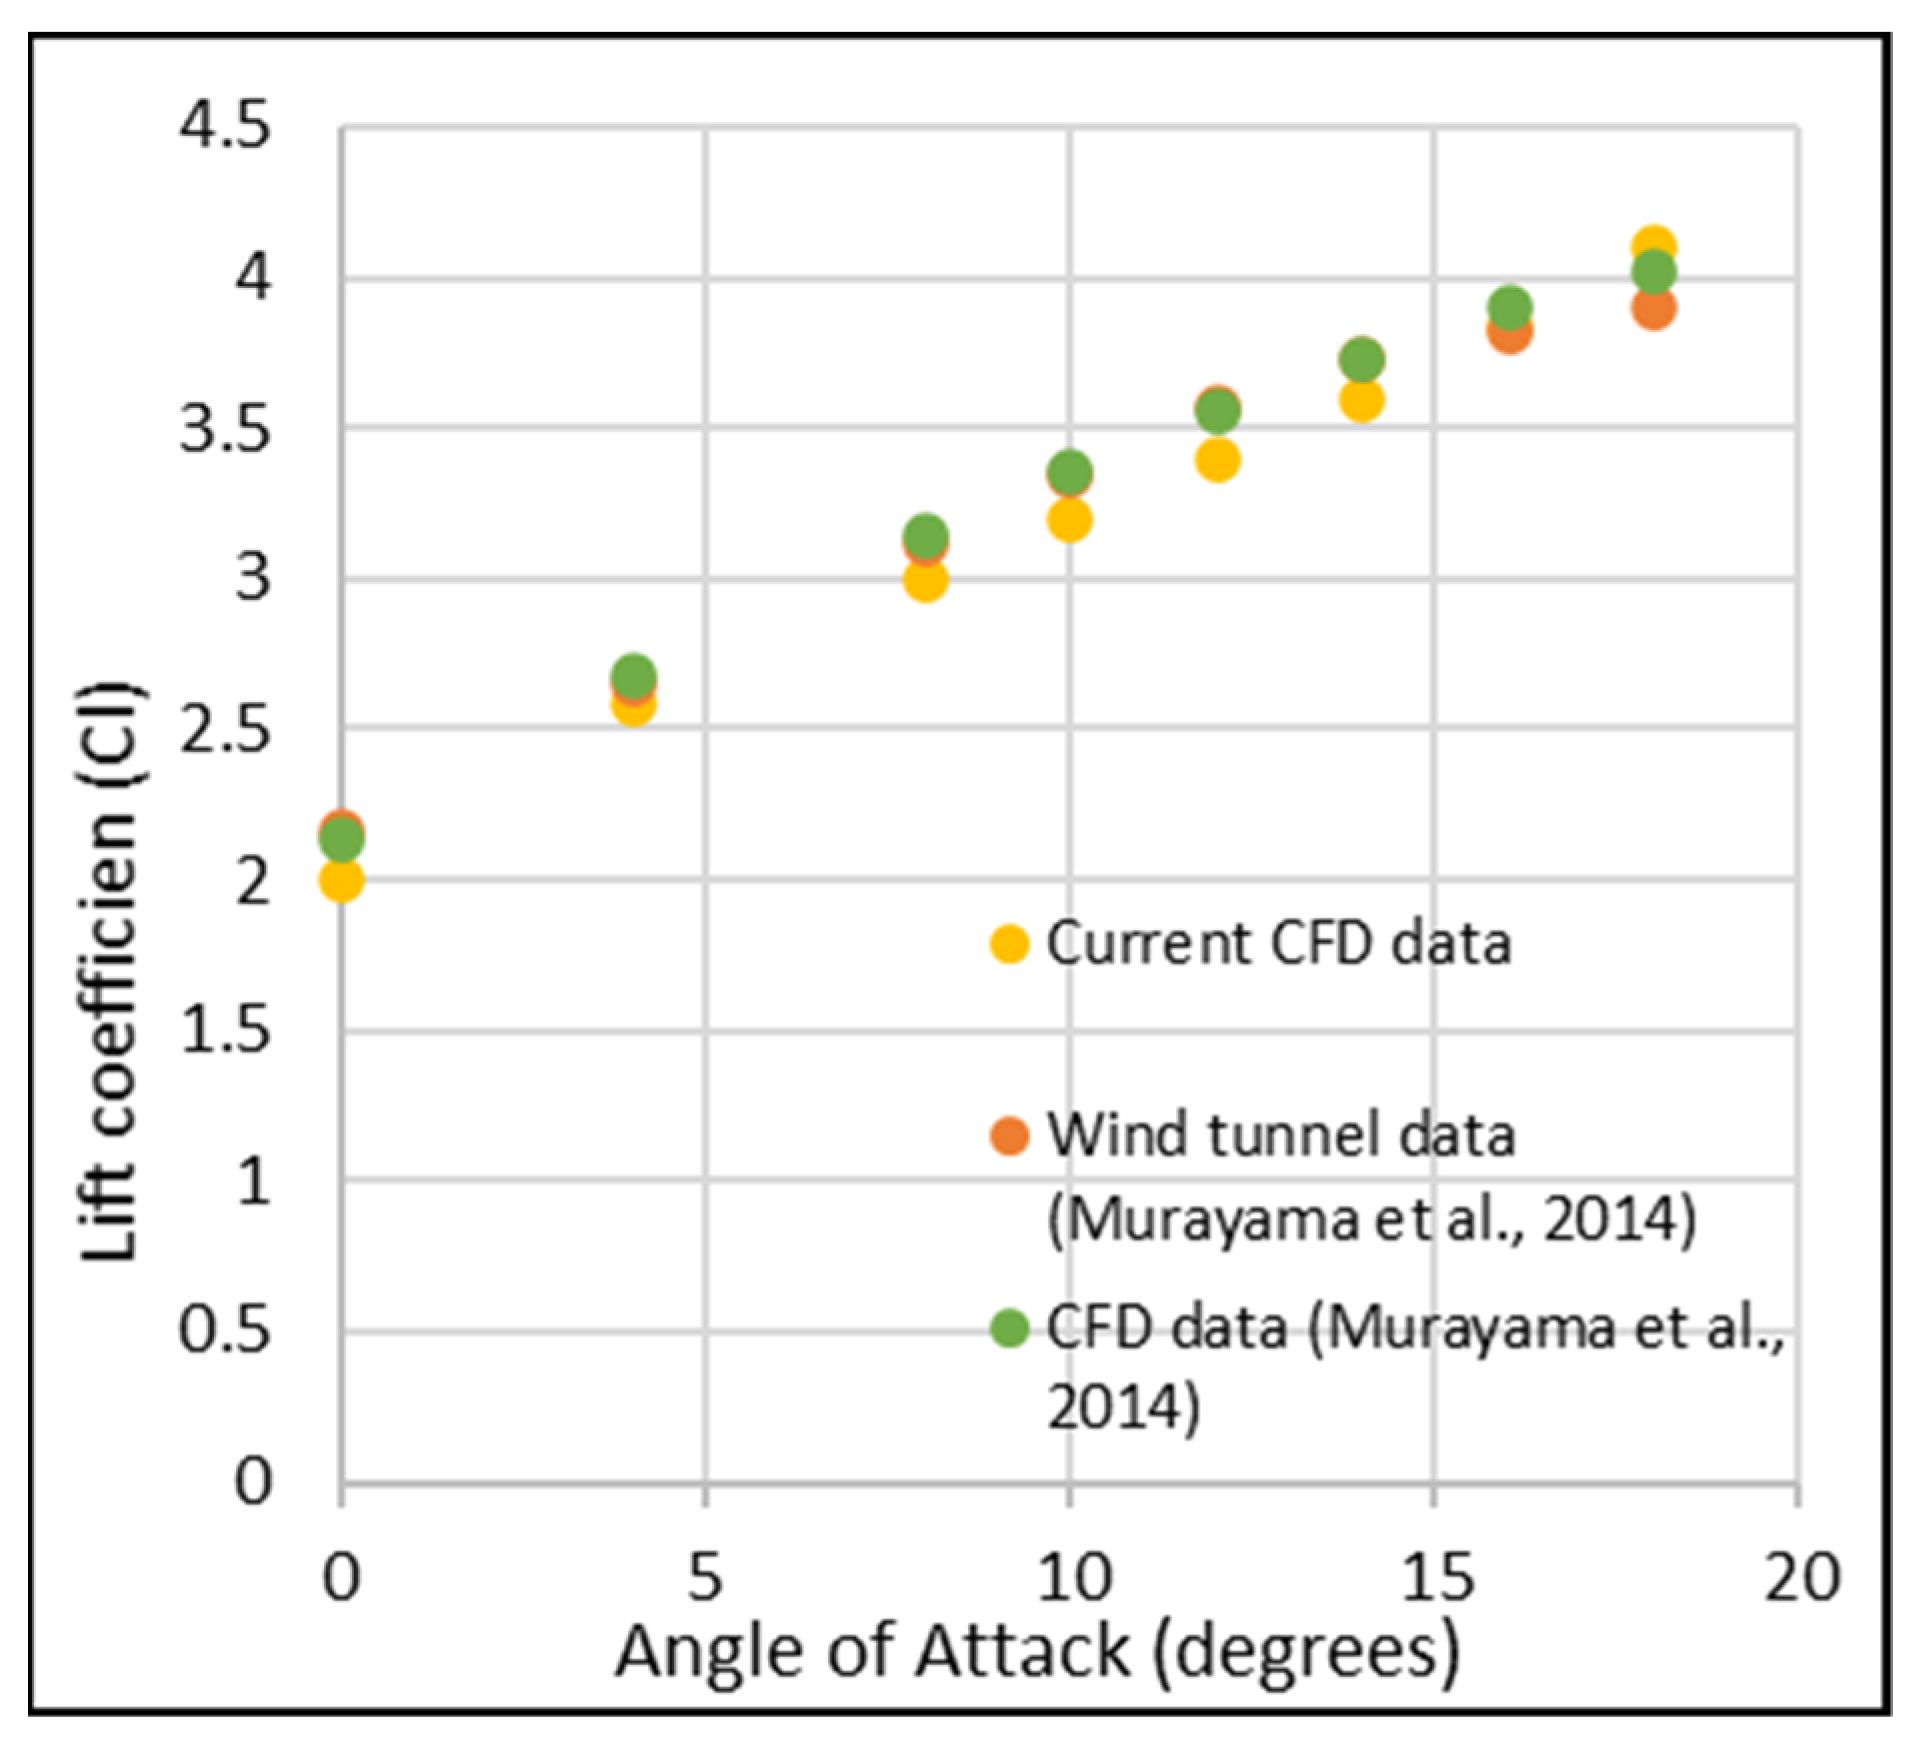
The segments of the plots show the slat, main body, and flap pressure coefficient distributions going from left to right. At the leading edge of each component, there is a large pressure difference between the upper and lower surfaces, where a large amount of the lift is generated. The pressure coefficient plots show good correlation with the wind tunnel data at both angles of attack, but slightly overpredict the pressure across all surface locations. Overall, the numerical data show nearly the same trend as the wind tunnel data, with exceptionally close amplitudes. Following this, the lift coefficient was plotted against both the wind tunnel data and the CFD data of Murayama et al. [3], as seen in Figure 10.
The data were nearly the same up to 18°, with an error of only around 5%. Murayama et al. [3] did not show experimental lift coefficient data beyond 18°; however, they stated that they found that their CFD data predicted stall at a much higher angle of attack than the wind tunnel. The current results follow the same trend as the CFD data of Murayama et al. [3], and show good correlation with their experimental data.
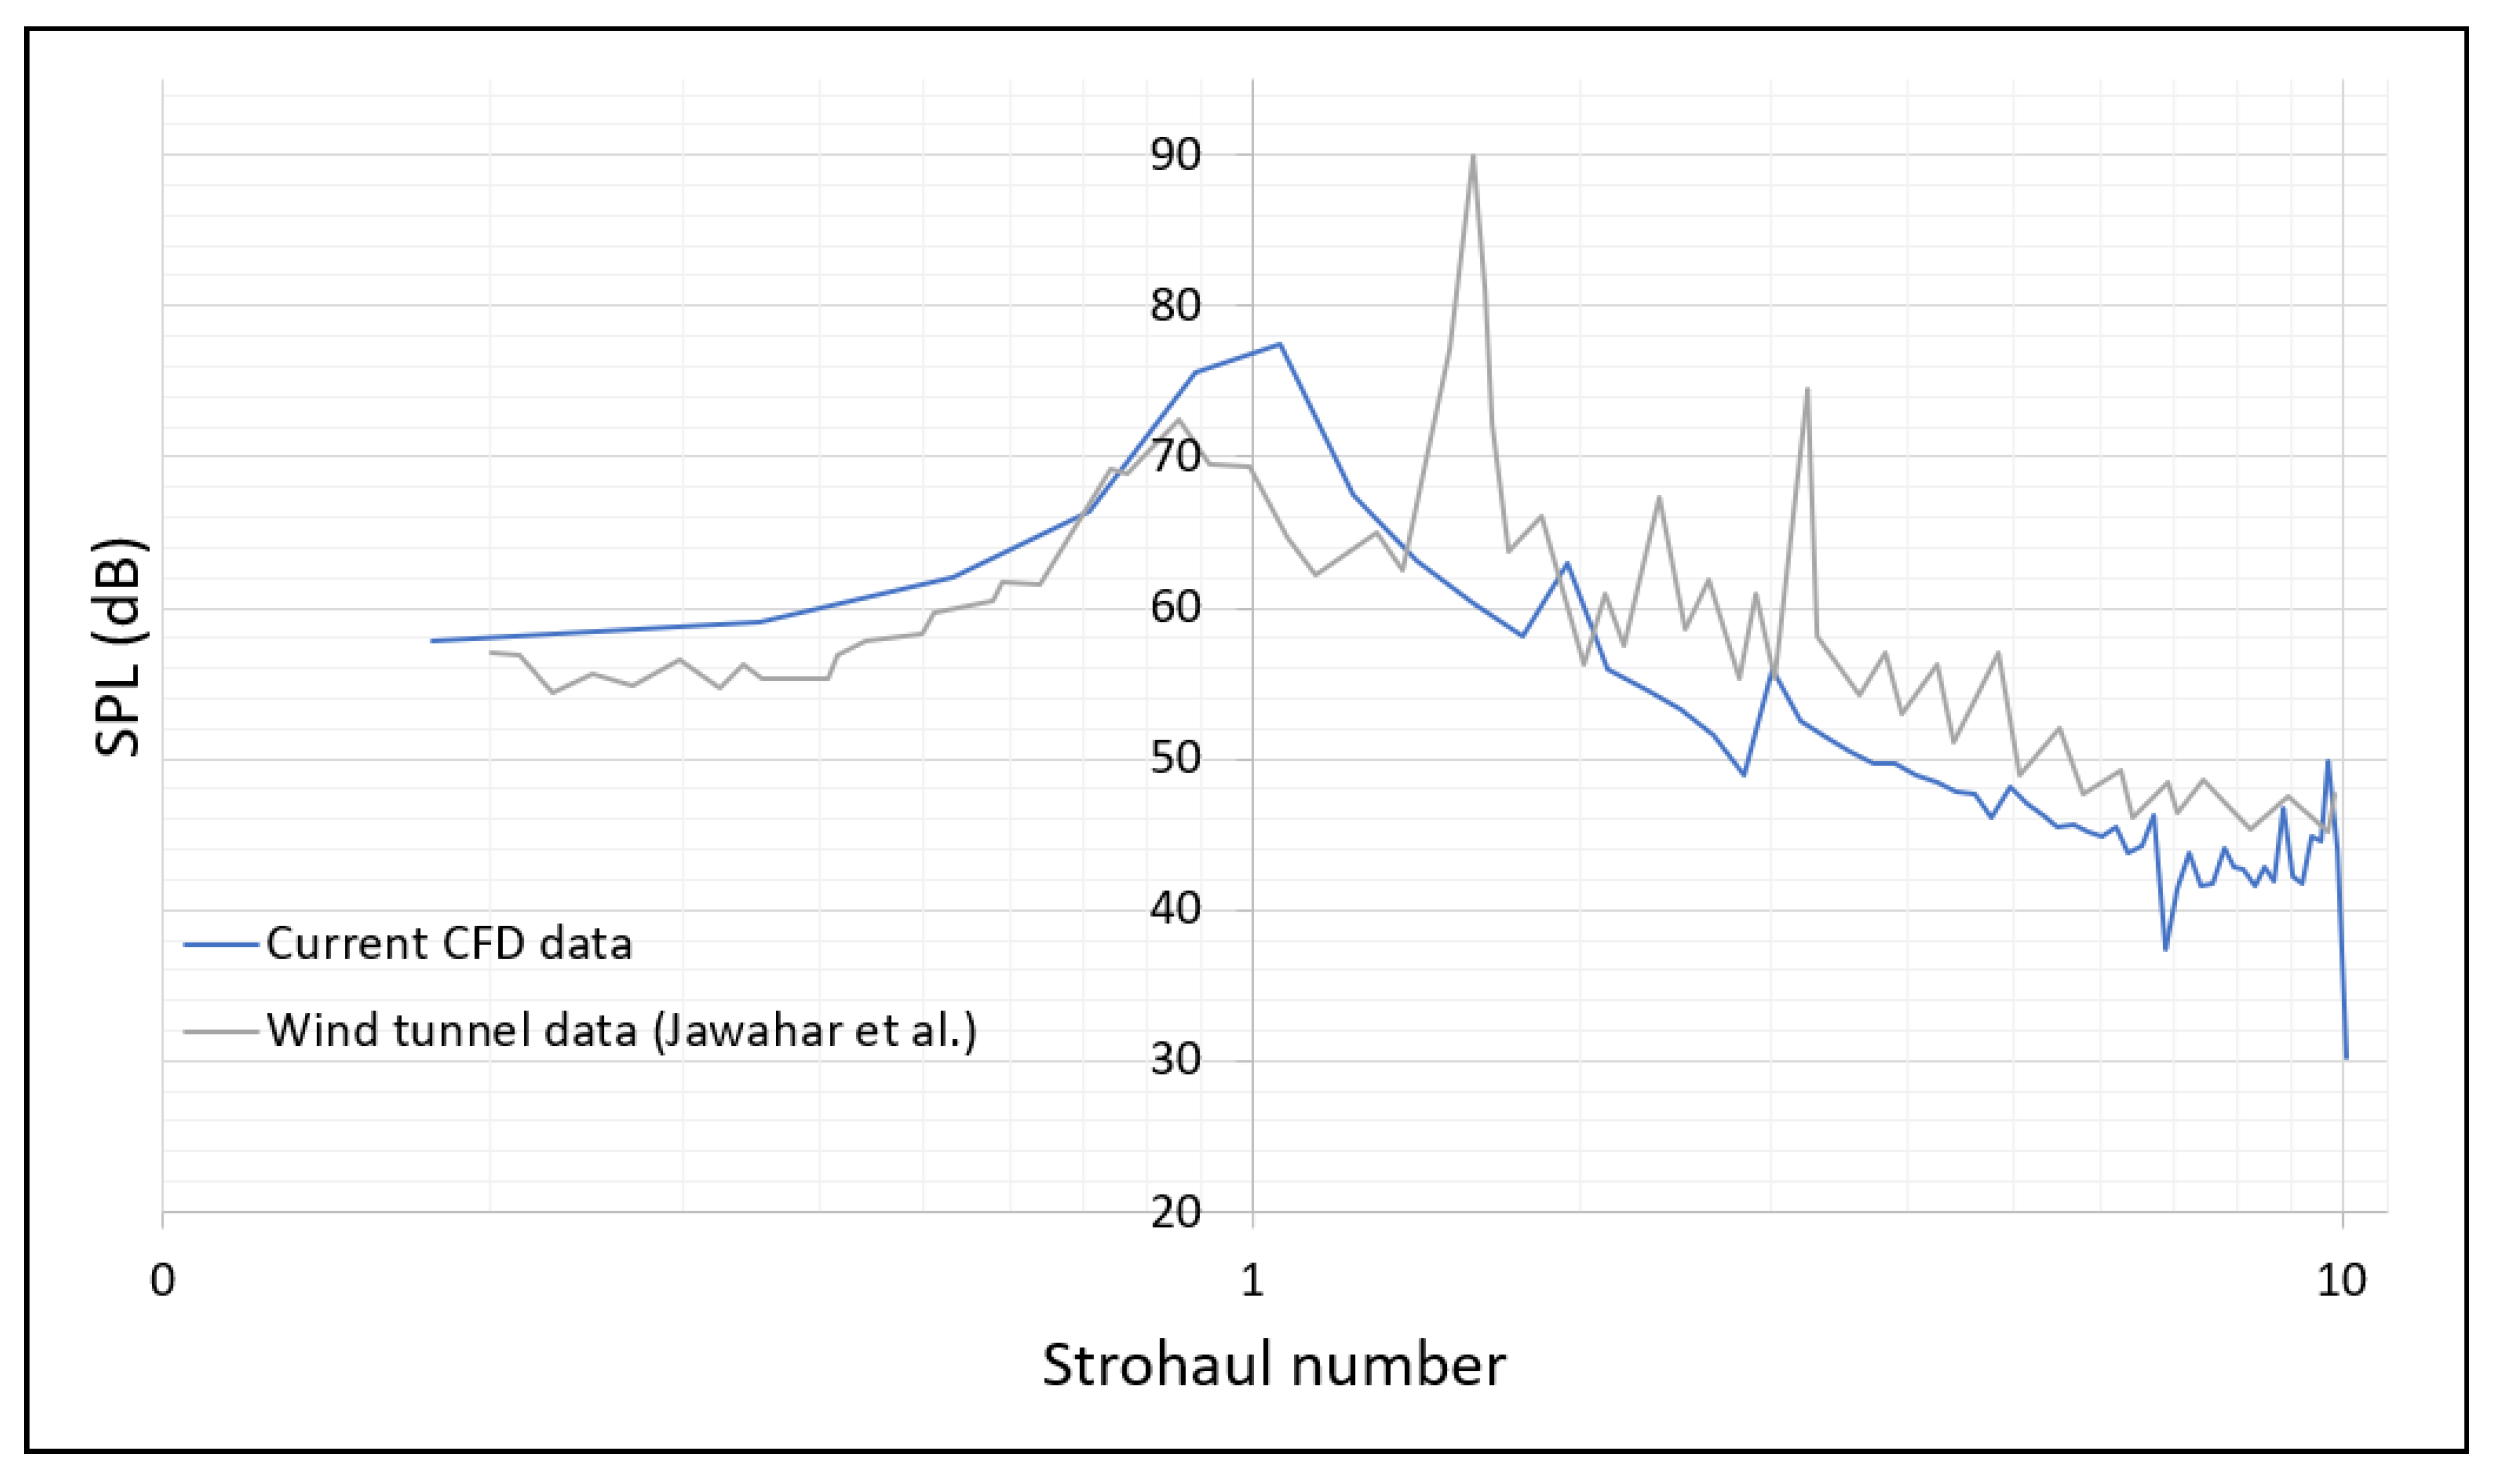
Finally, the acoustic simulation methodology was validated against the wind tunnel experiments of Jawahar et al. [4]. Results are shown in Figure 11 for the sound pressure level (SPL) in dB versus Strouhal number, defined as:
S t = f · c U
where f is the vortex shedding frequency, c is the chord, and U is the freestream velocity.
There was generally a reasonable agreement between the two datasets in the SPL noise levels across the range of Strouhal numbers shown, from 0.2 to 10. Lower Strouhal numbers were mostly the same, with the CFD data predicting noise to be slightly higher than wind tunnel data. Peaks across all Strouhal numbers occurred later in the CFD data, with the wind tunnel tonal peaks at Strouhal numbers of 1.6 and 3.2 being much smaller and at a higher frequency compared with the numerical data. The current CFD simulation did not fully resolve all tonal peaks, and primarily predicted the incorrect amplitude of the wind tunnel peaks at Strouhal numbers of 1.6 and 3.2. Due to a variety of measurement uncertainties that may be encountered in a wind tunnel, validating numerical acoustic data against experiments is always challenging. Despite this, the numerical methodology overall produces reasonably accurate results, including the general trend, compared with those from the wind tunnel tests.

3.2. Results of Morphed and Conventional Flap Design

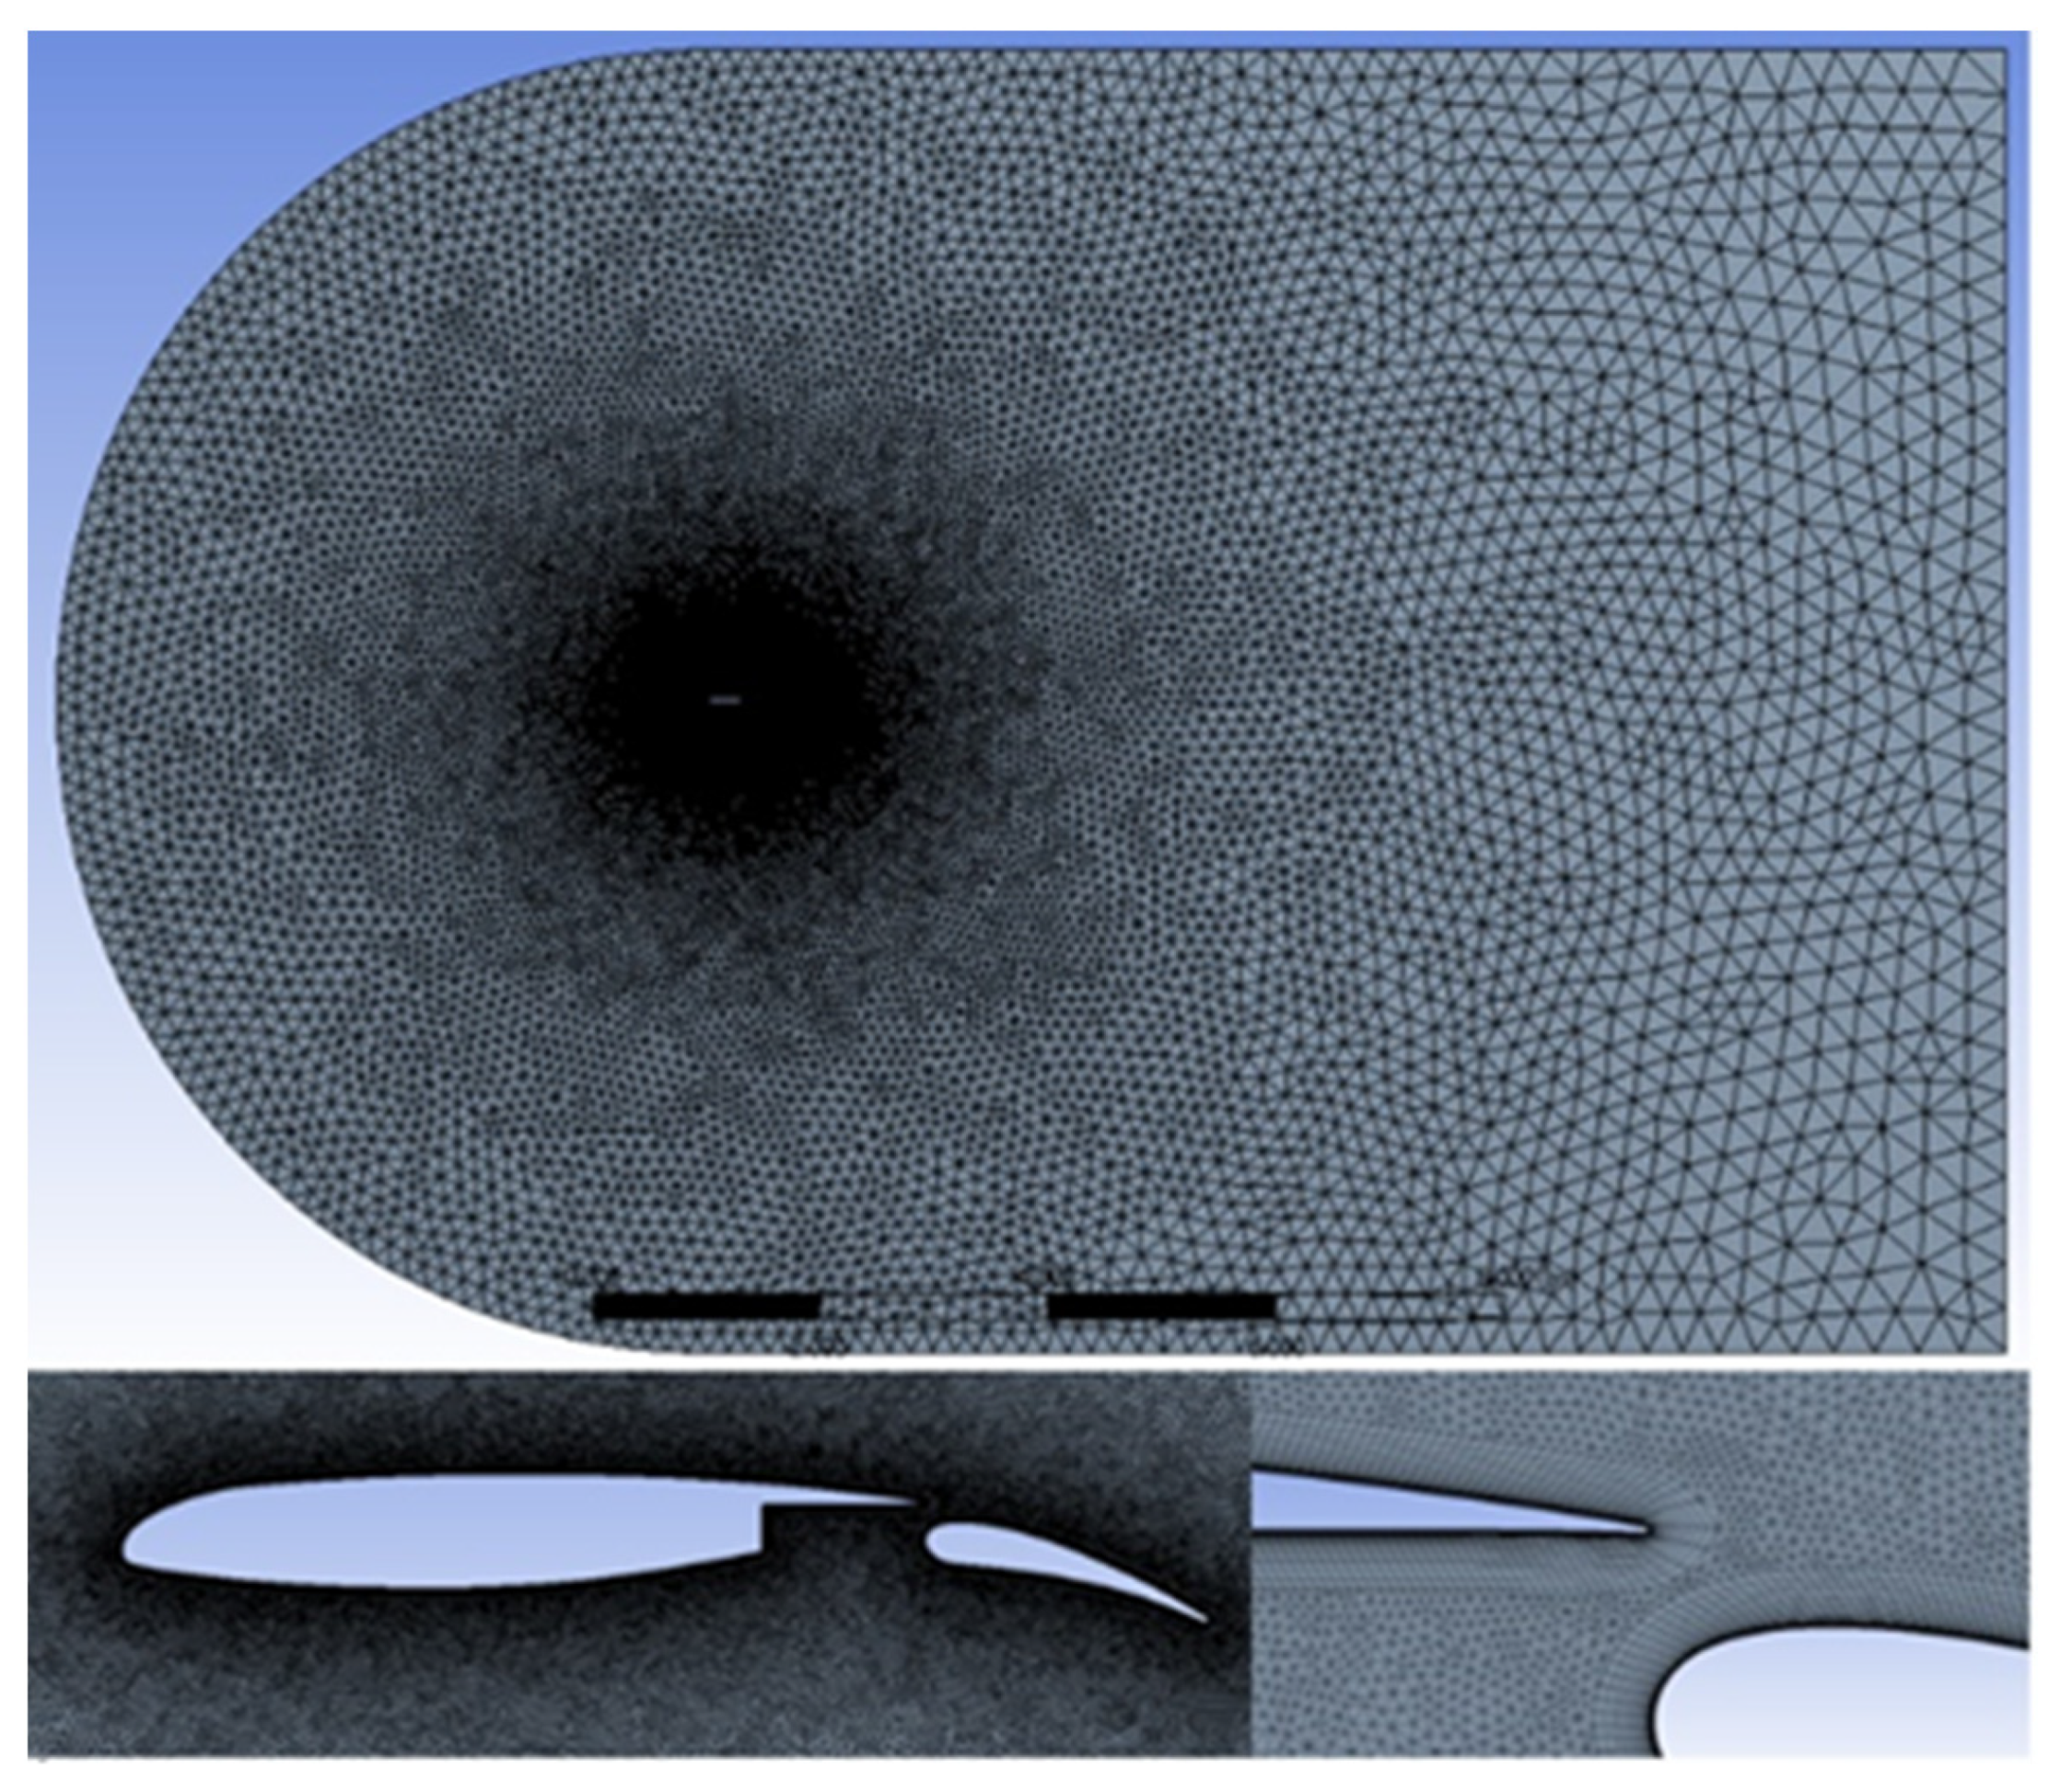
Results for both conventional and morphed flap designs are now presented. The focus was on the far-field acoustic noise generated by the fluid interaction with the high-lift aerofoil, along with aerodynamic performance analysis. All simulations were carried out at an 8° angle of attack and a Reynolds number of 9.2 × 10 5 (the same conditions as in the validation study, except there was no leading-edge slat). When calculating the time-averaged and unsteady flow characteristics, the initial transients were disregarded.
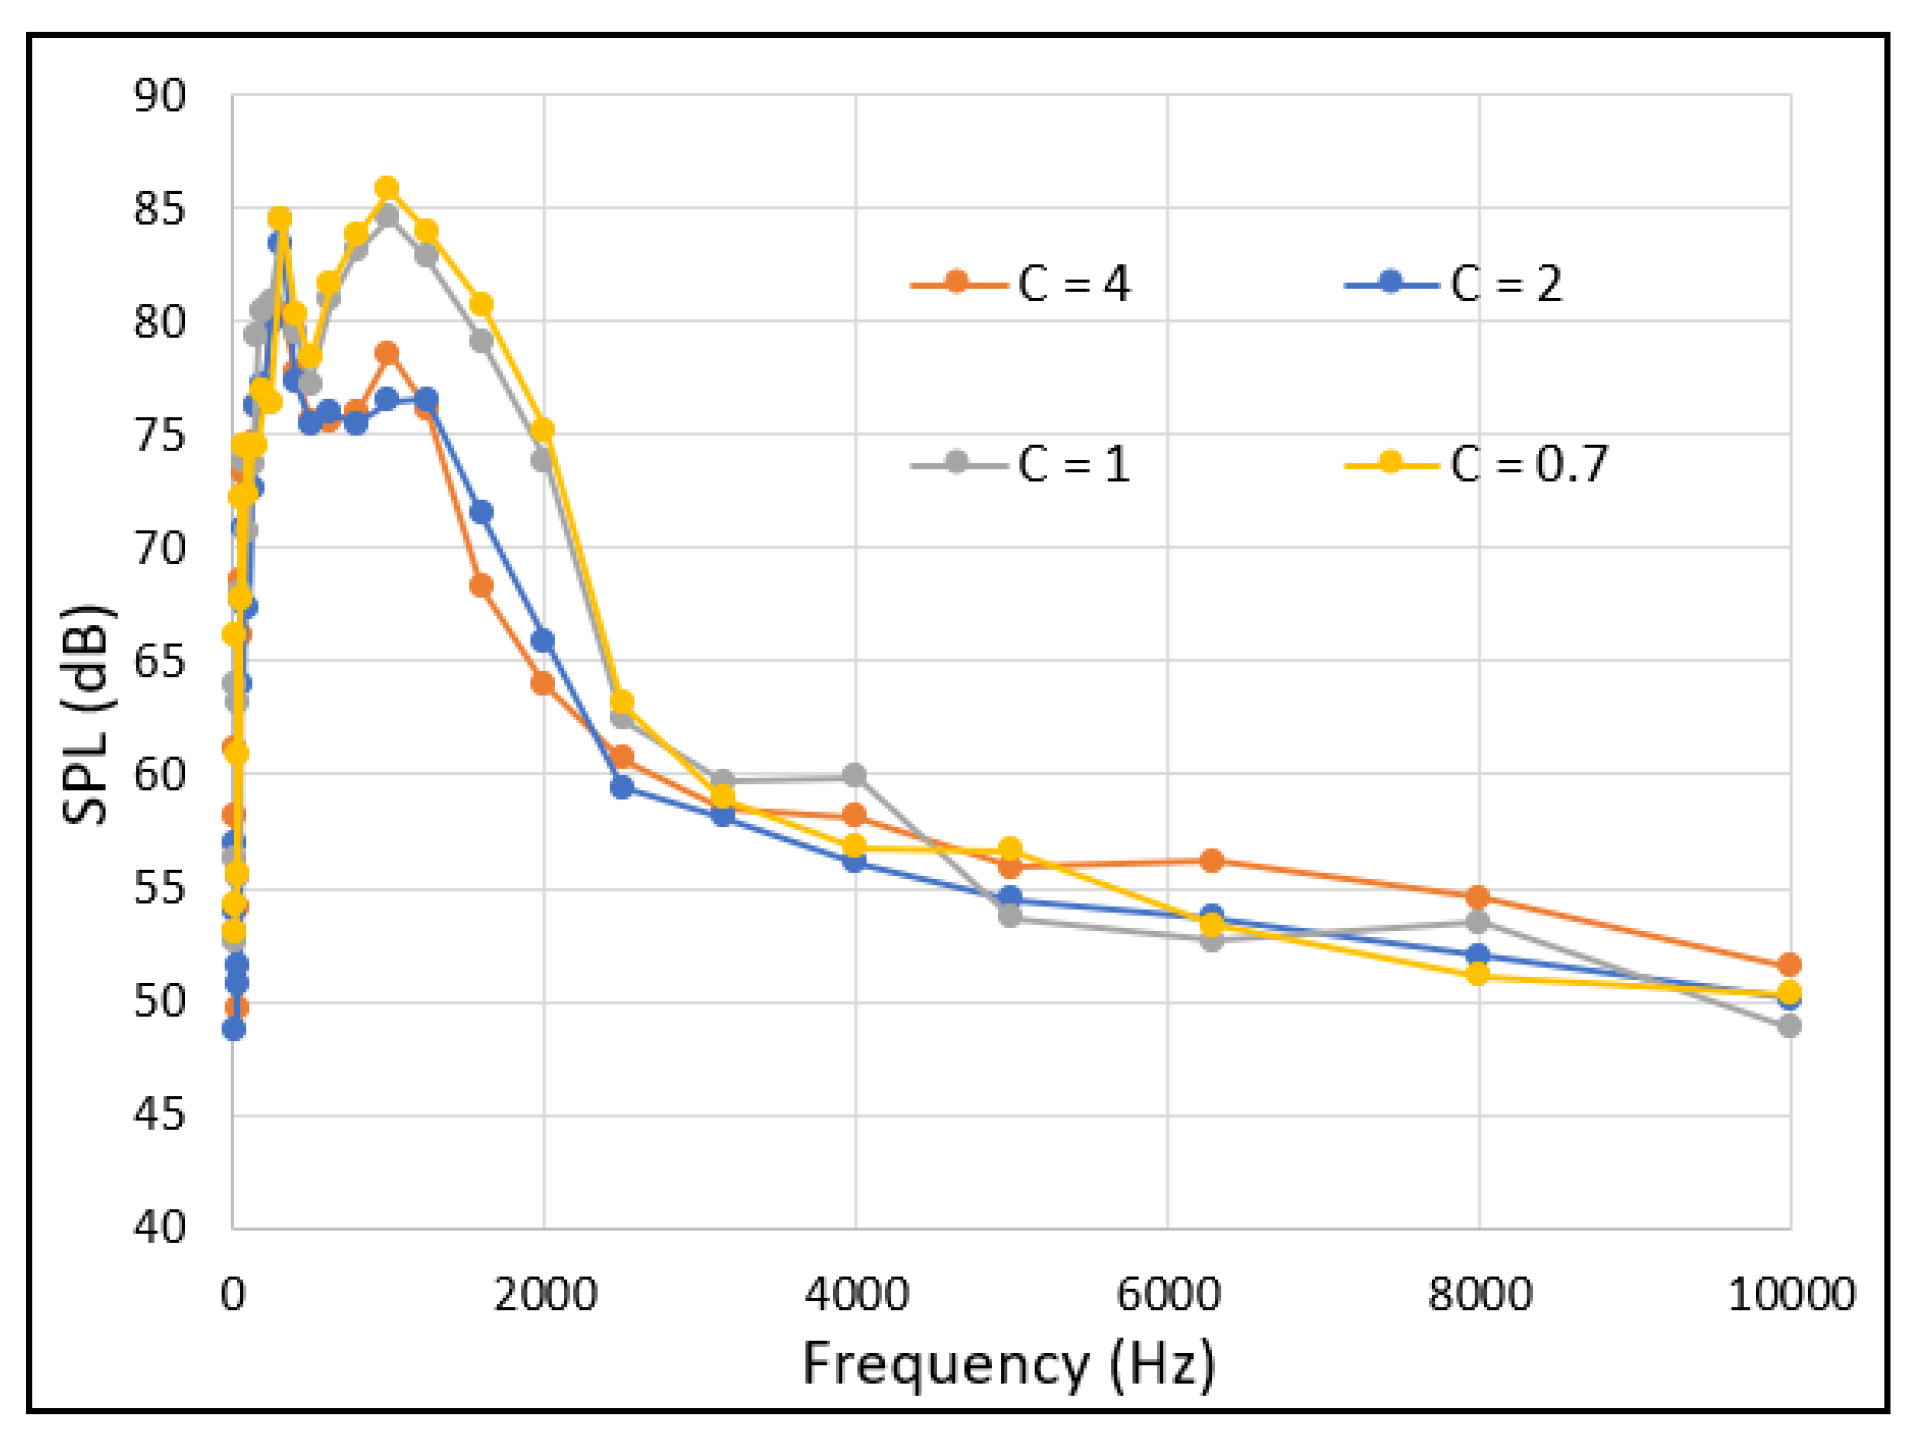
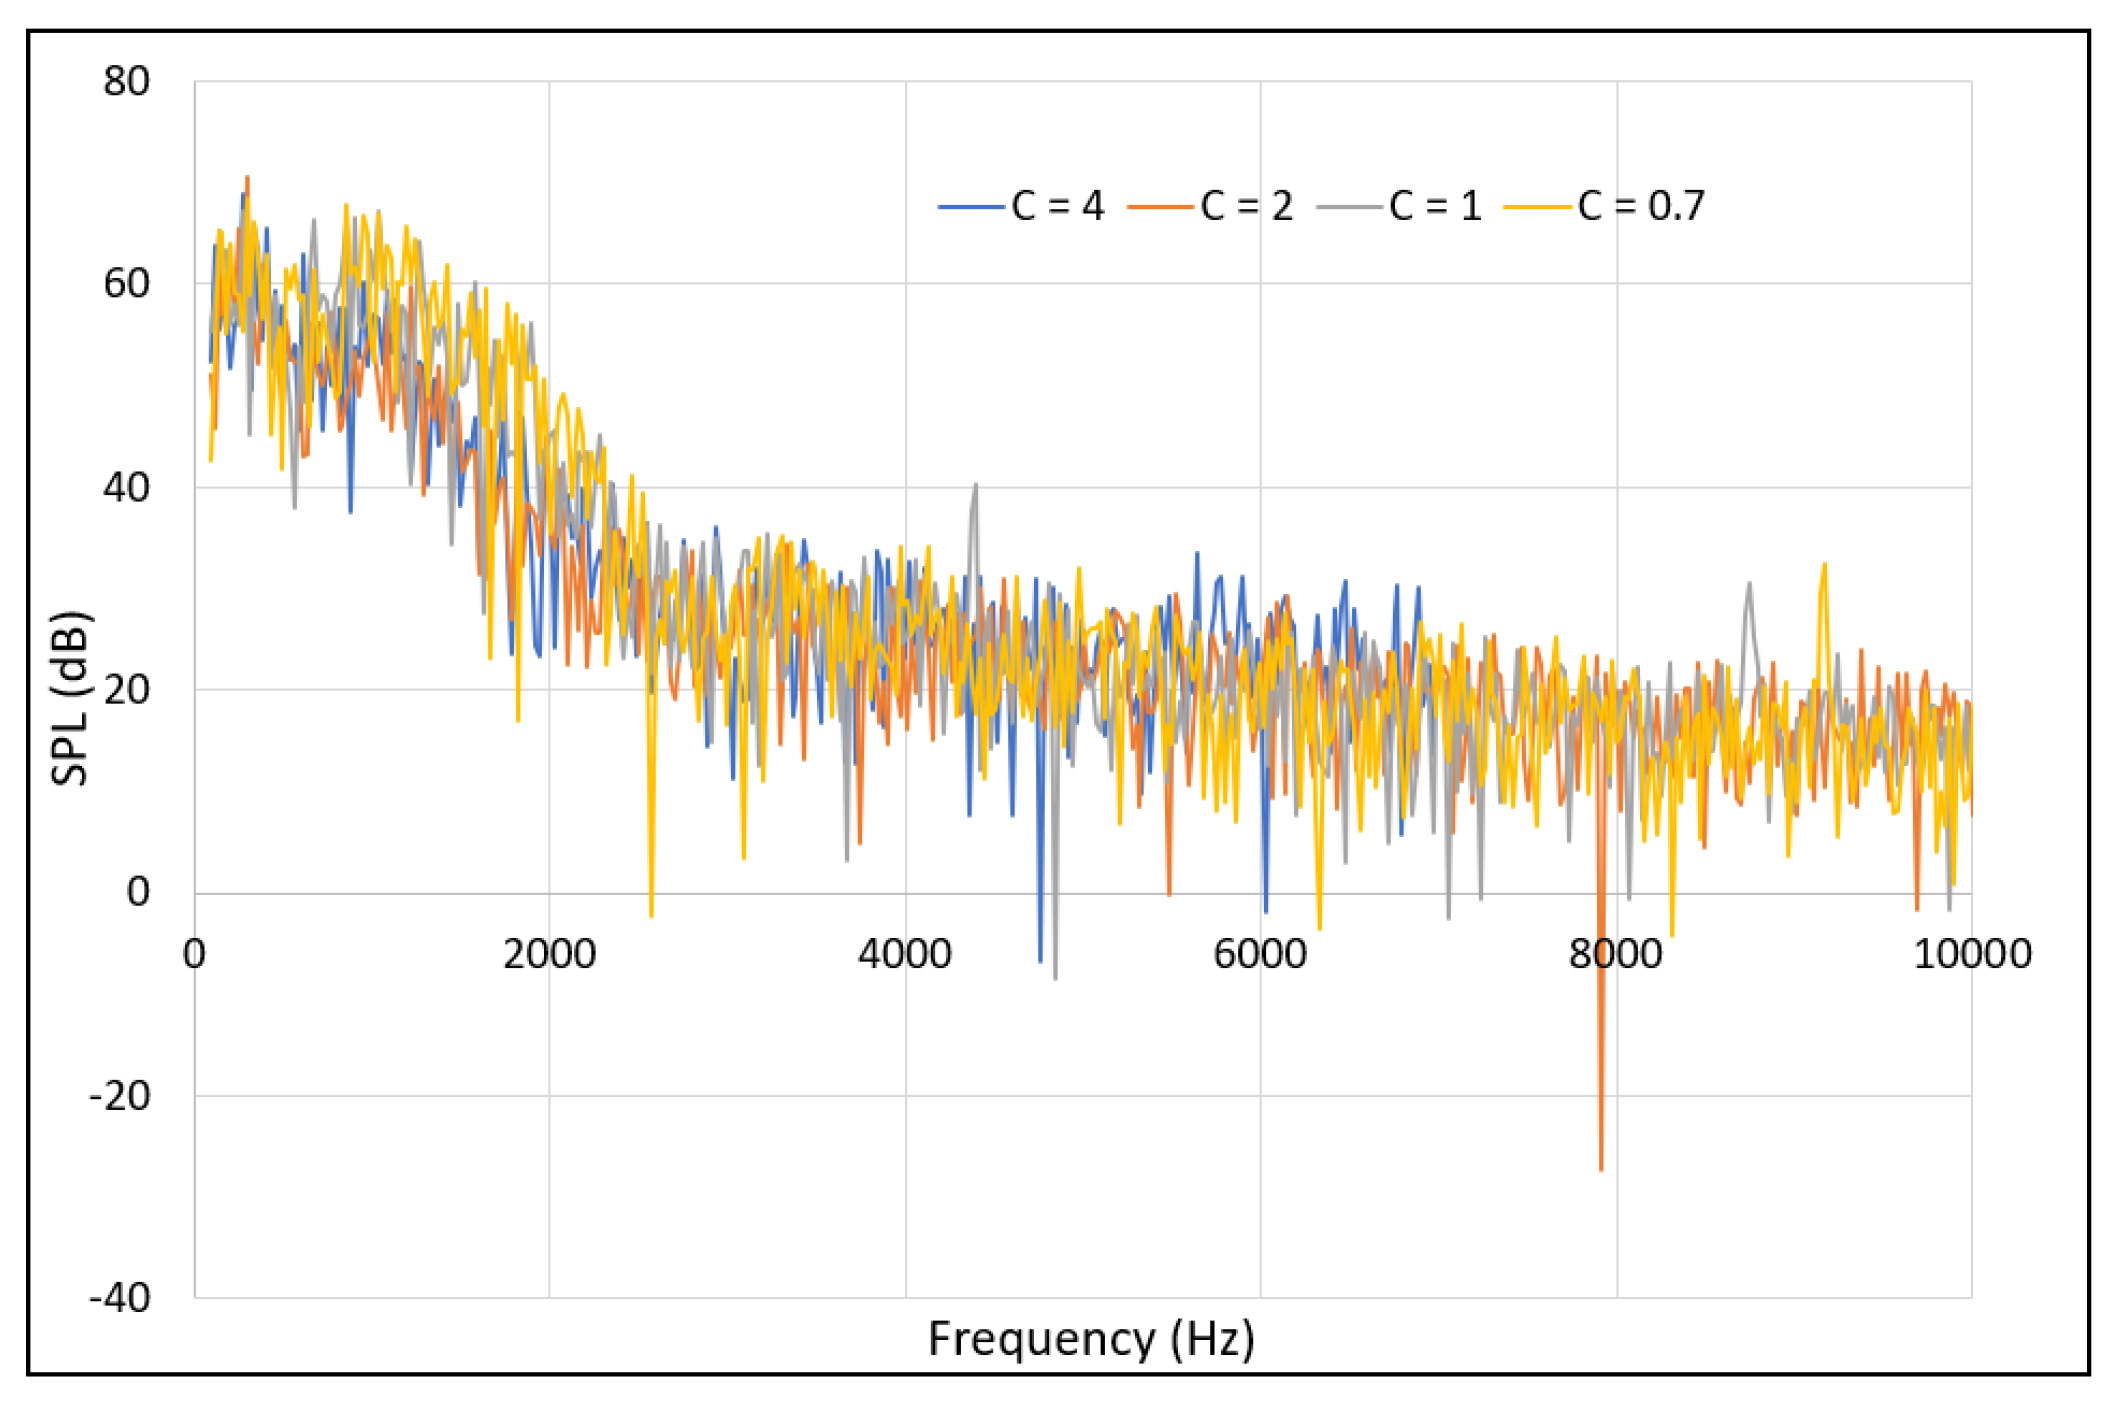
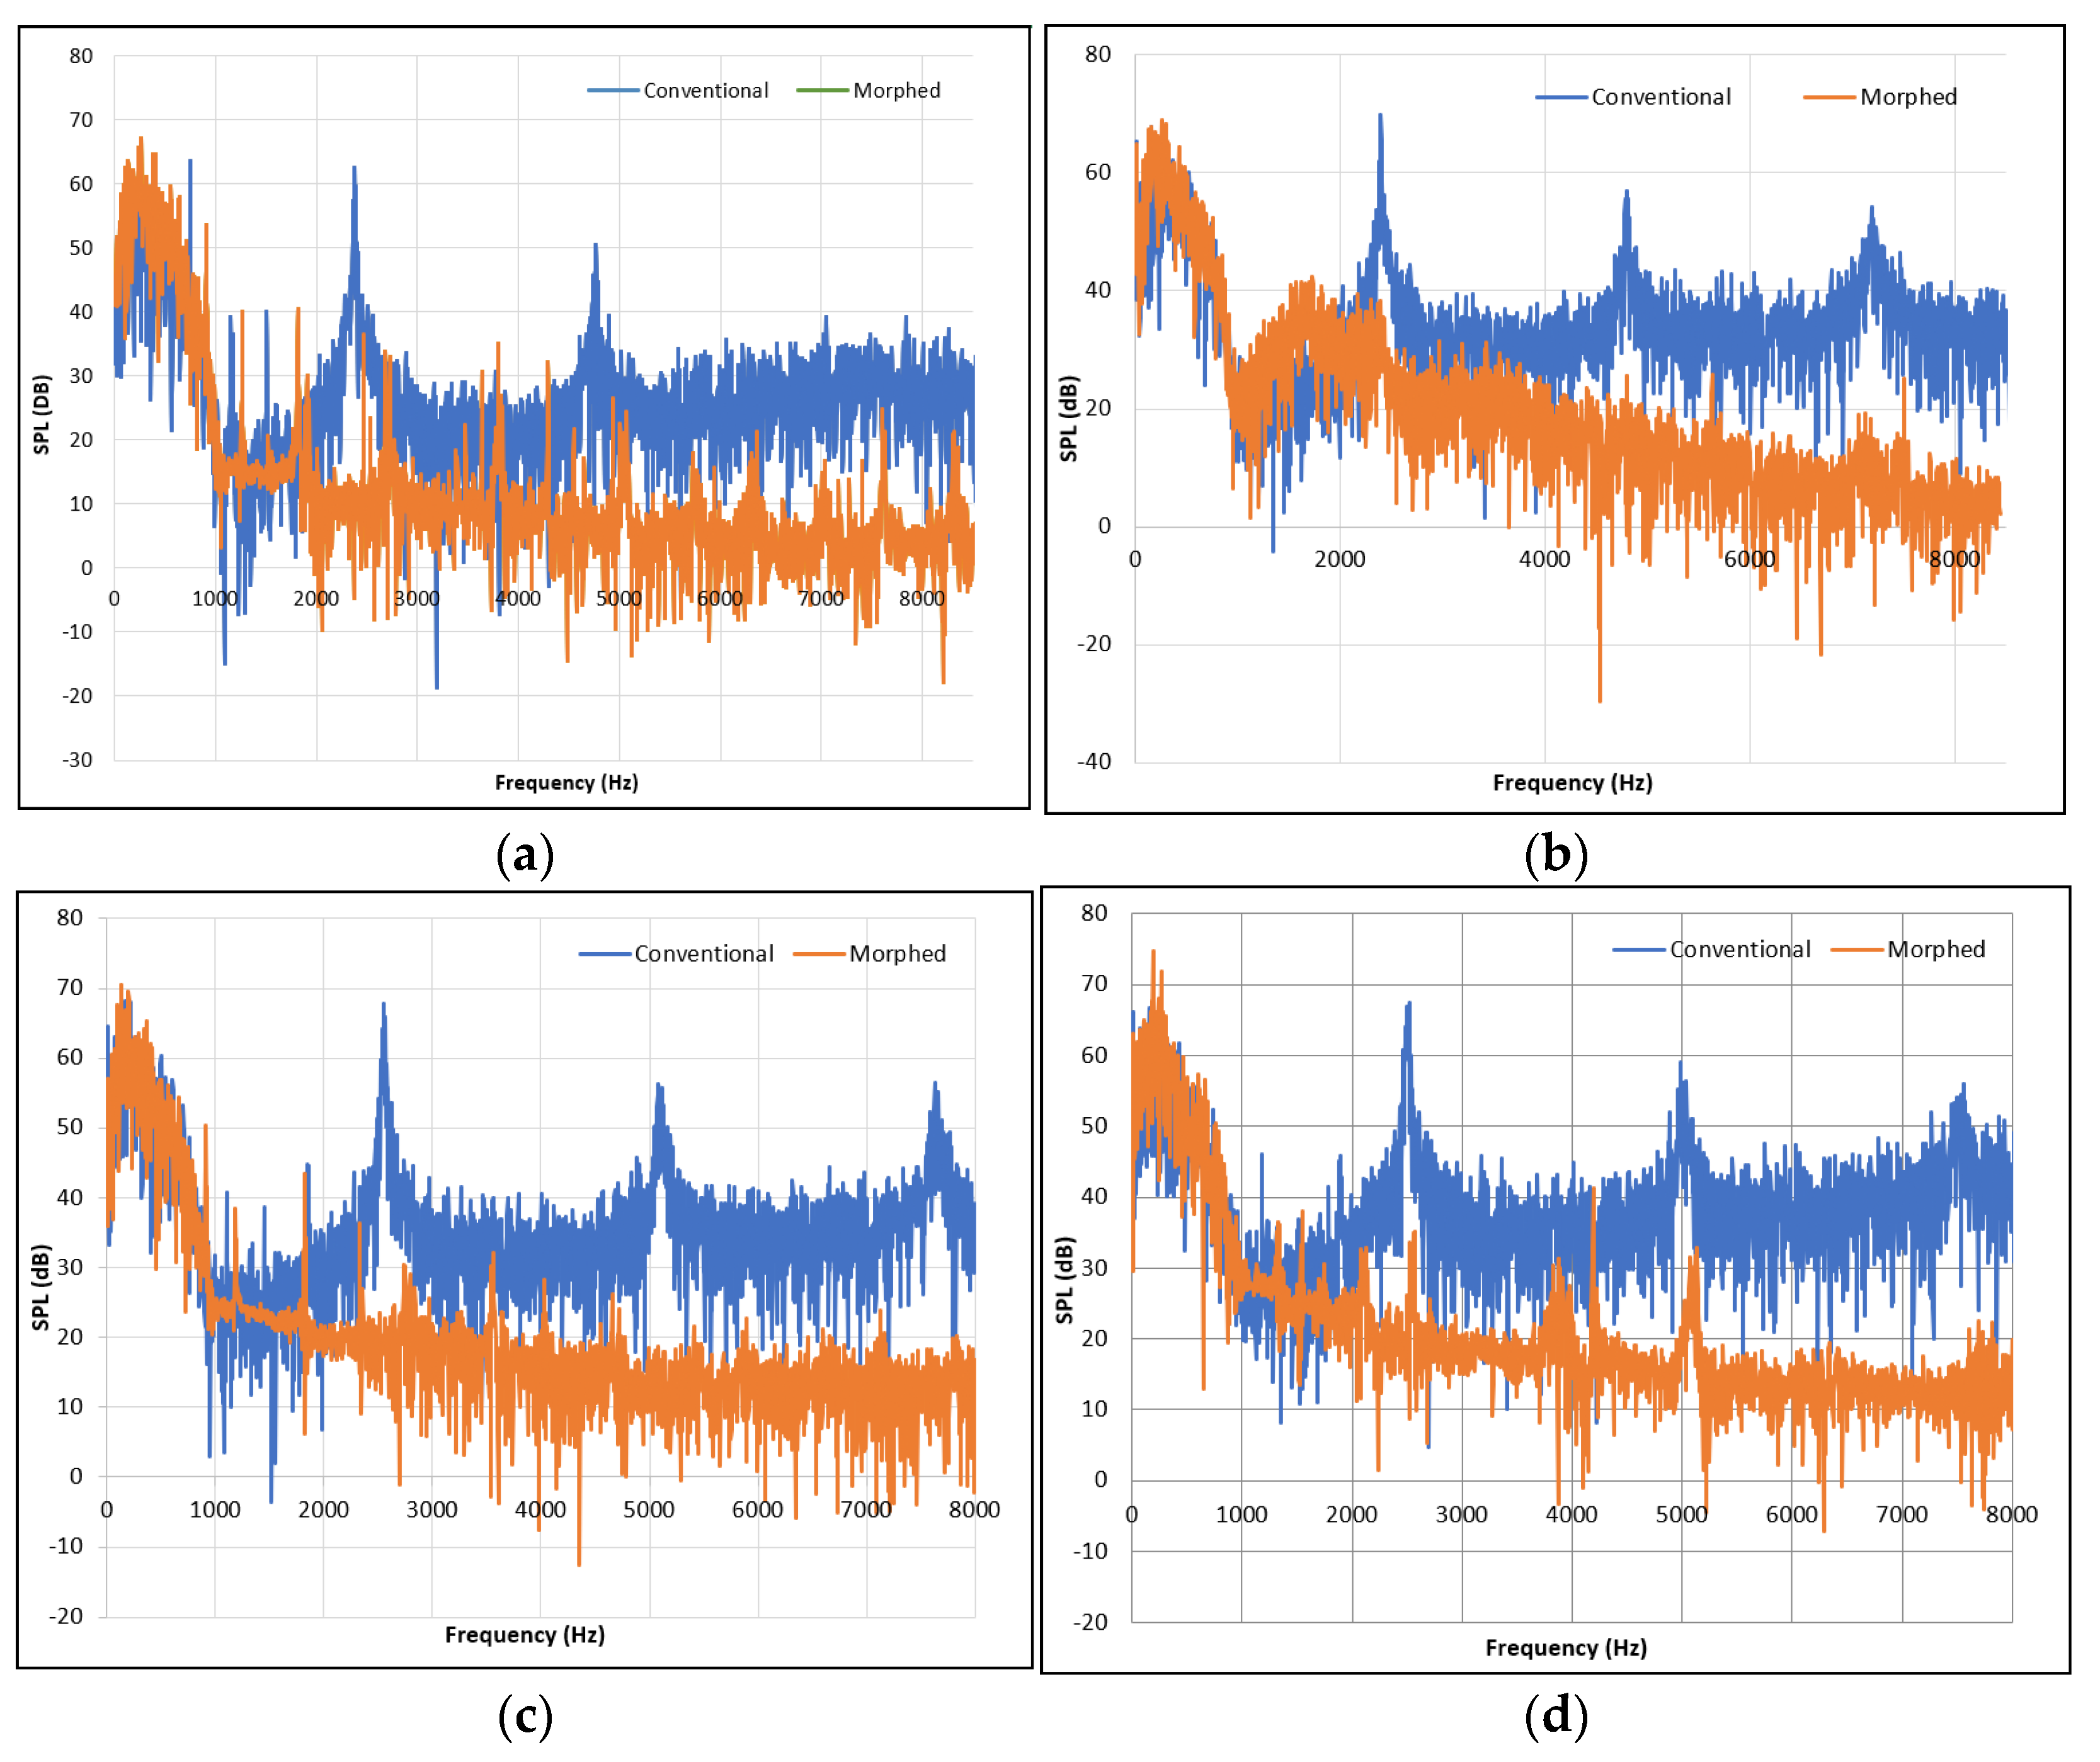
Although the meshes for all cases were kept more or less the same, there were bound to be small changes in the smallest mesh element size—especially with different flap deflections—and with the condition to keep the Courant number at 1, there were slight changes in the timestep used (due to the smallest mesh element being in the timestep calculation); hence, there were very slight variations in the maximum frequency resolved (according to the Nyquist criterion). For the SPL results in Figure 12, this slight change in the upper frequency has no bearing on the noise level at high frequencies, and the reason the plots are shown for the same upper frequency cutoff is purely for convenience. For all computations of SPL in Figure 12, a C value of 1 was used.
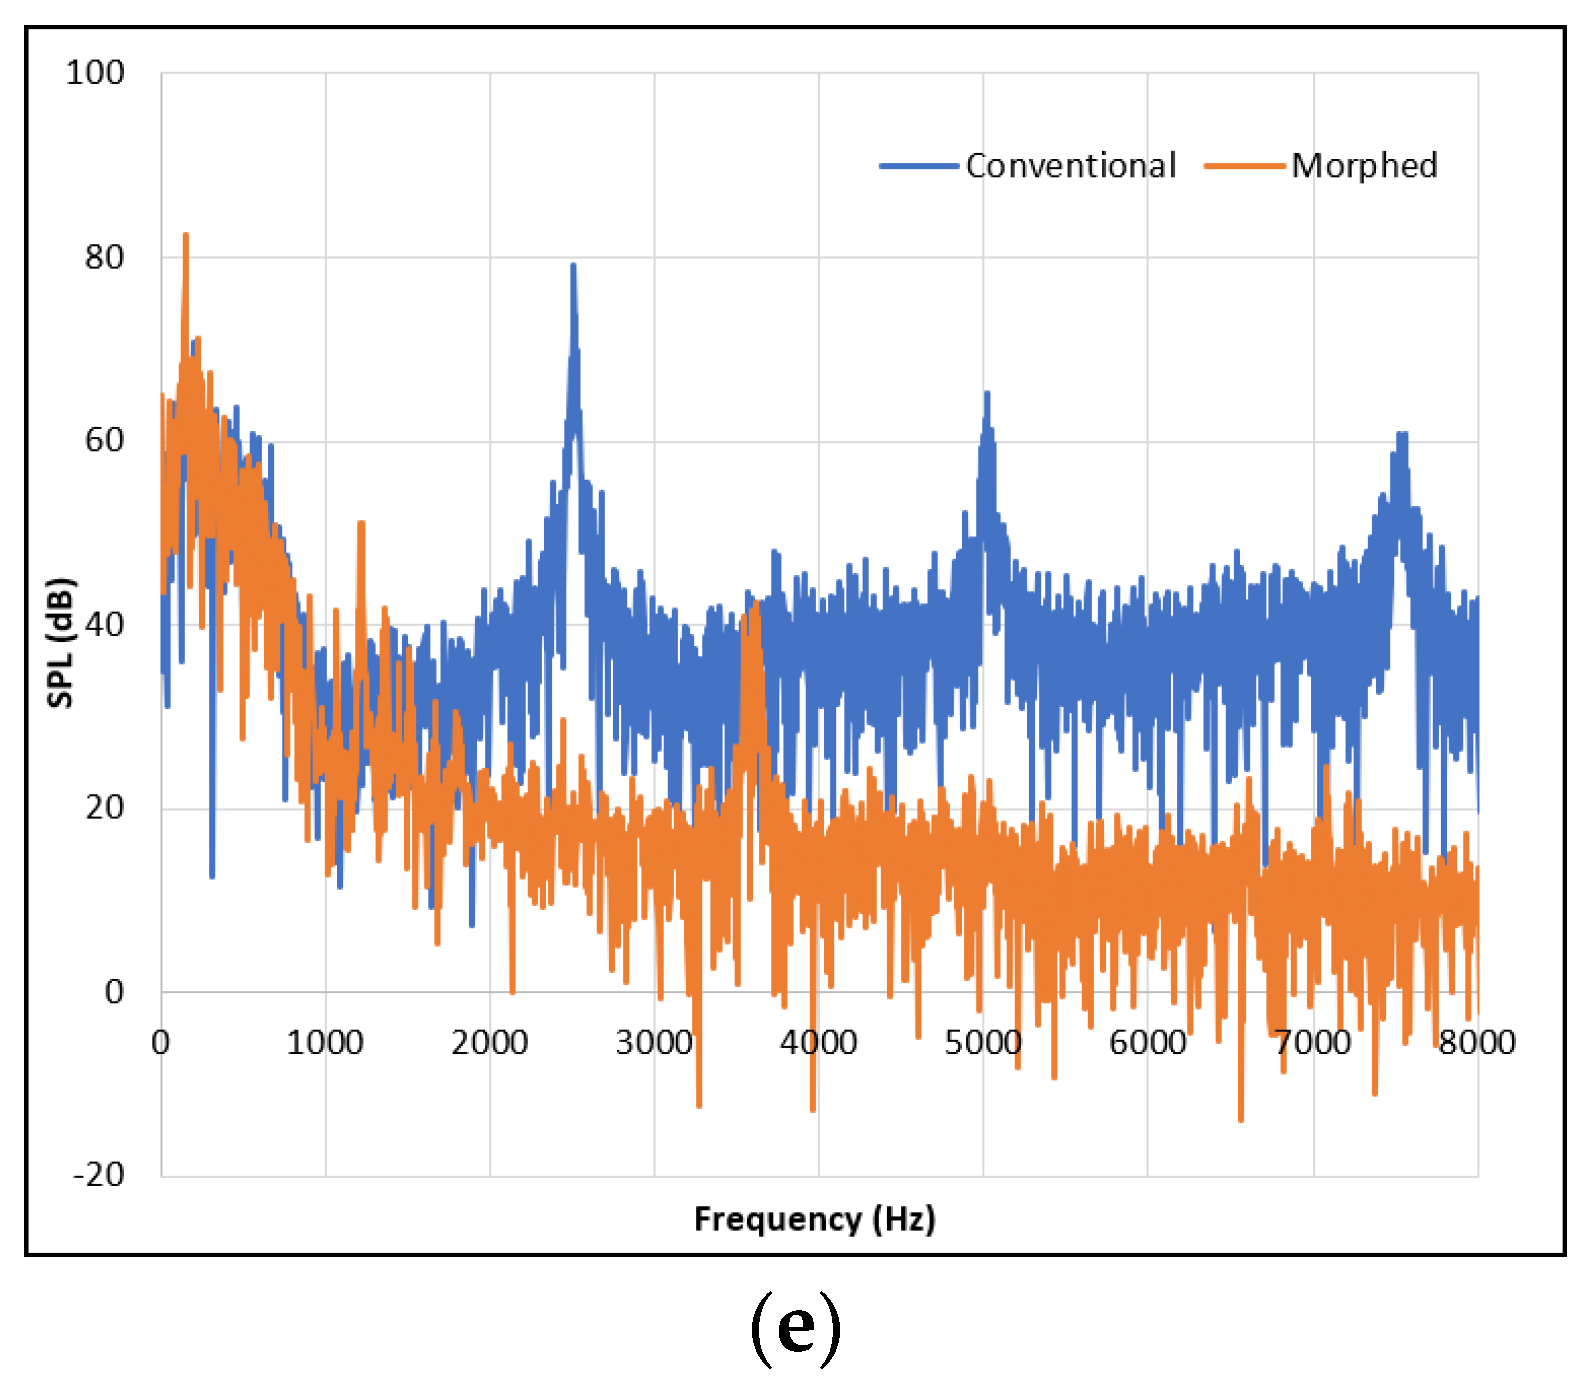
The main low-frequency acoustic feature, which is present in both the morphed and conventional aerofoil designs, can be seen in Figure 12 between 0 and 1 kHz frequency at all flap deflections. Generally, low-frequency noise is caused by larger eddies, as they require much more energy to rotate at a higher frequency. This low-frequency peak may be associated with regular vortex shedding from the trailing edge of the flap. It can be seen that the level of noise in the low-frequency peak of the morphed configuration increases slightly with the flap deflection angle, presumably due to increased interaction of the main wing’s flow with the flap. However, for the conventional design, the low-frequency peak remains almost the same for all flap deflections. Both flaps have the same chord length and operate at the same flap deflection and flow velocity, and will therefore have similar-sized vortex shedding at their trailing edge.
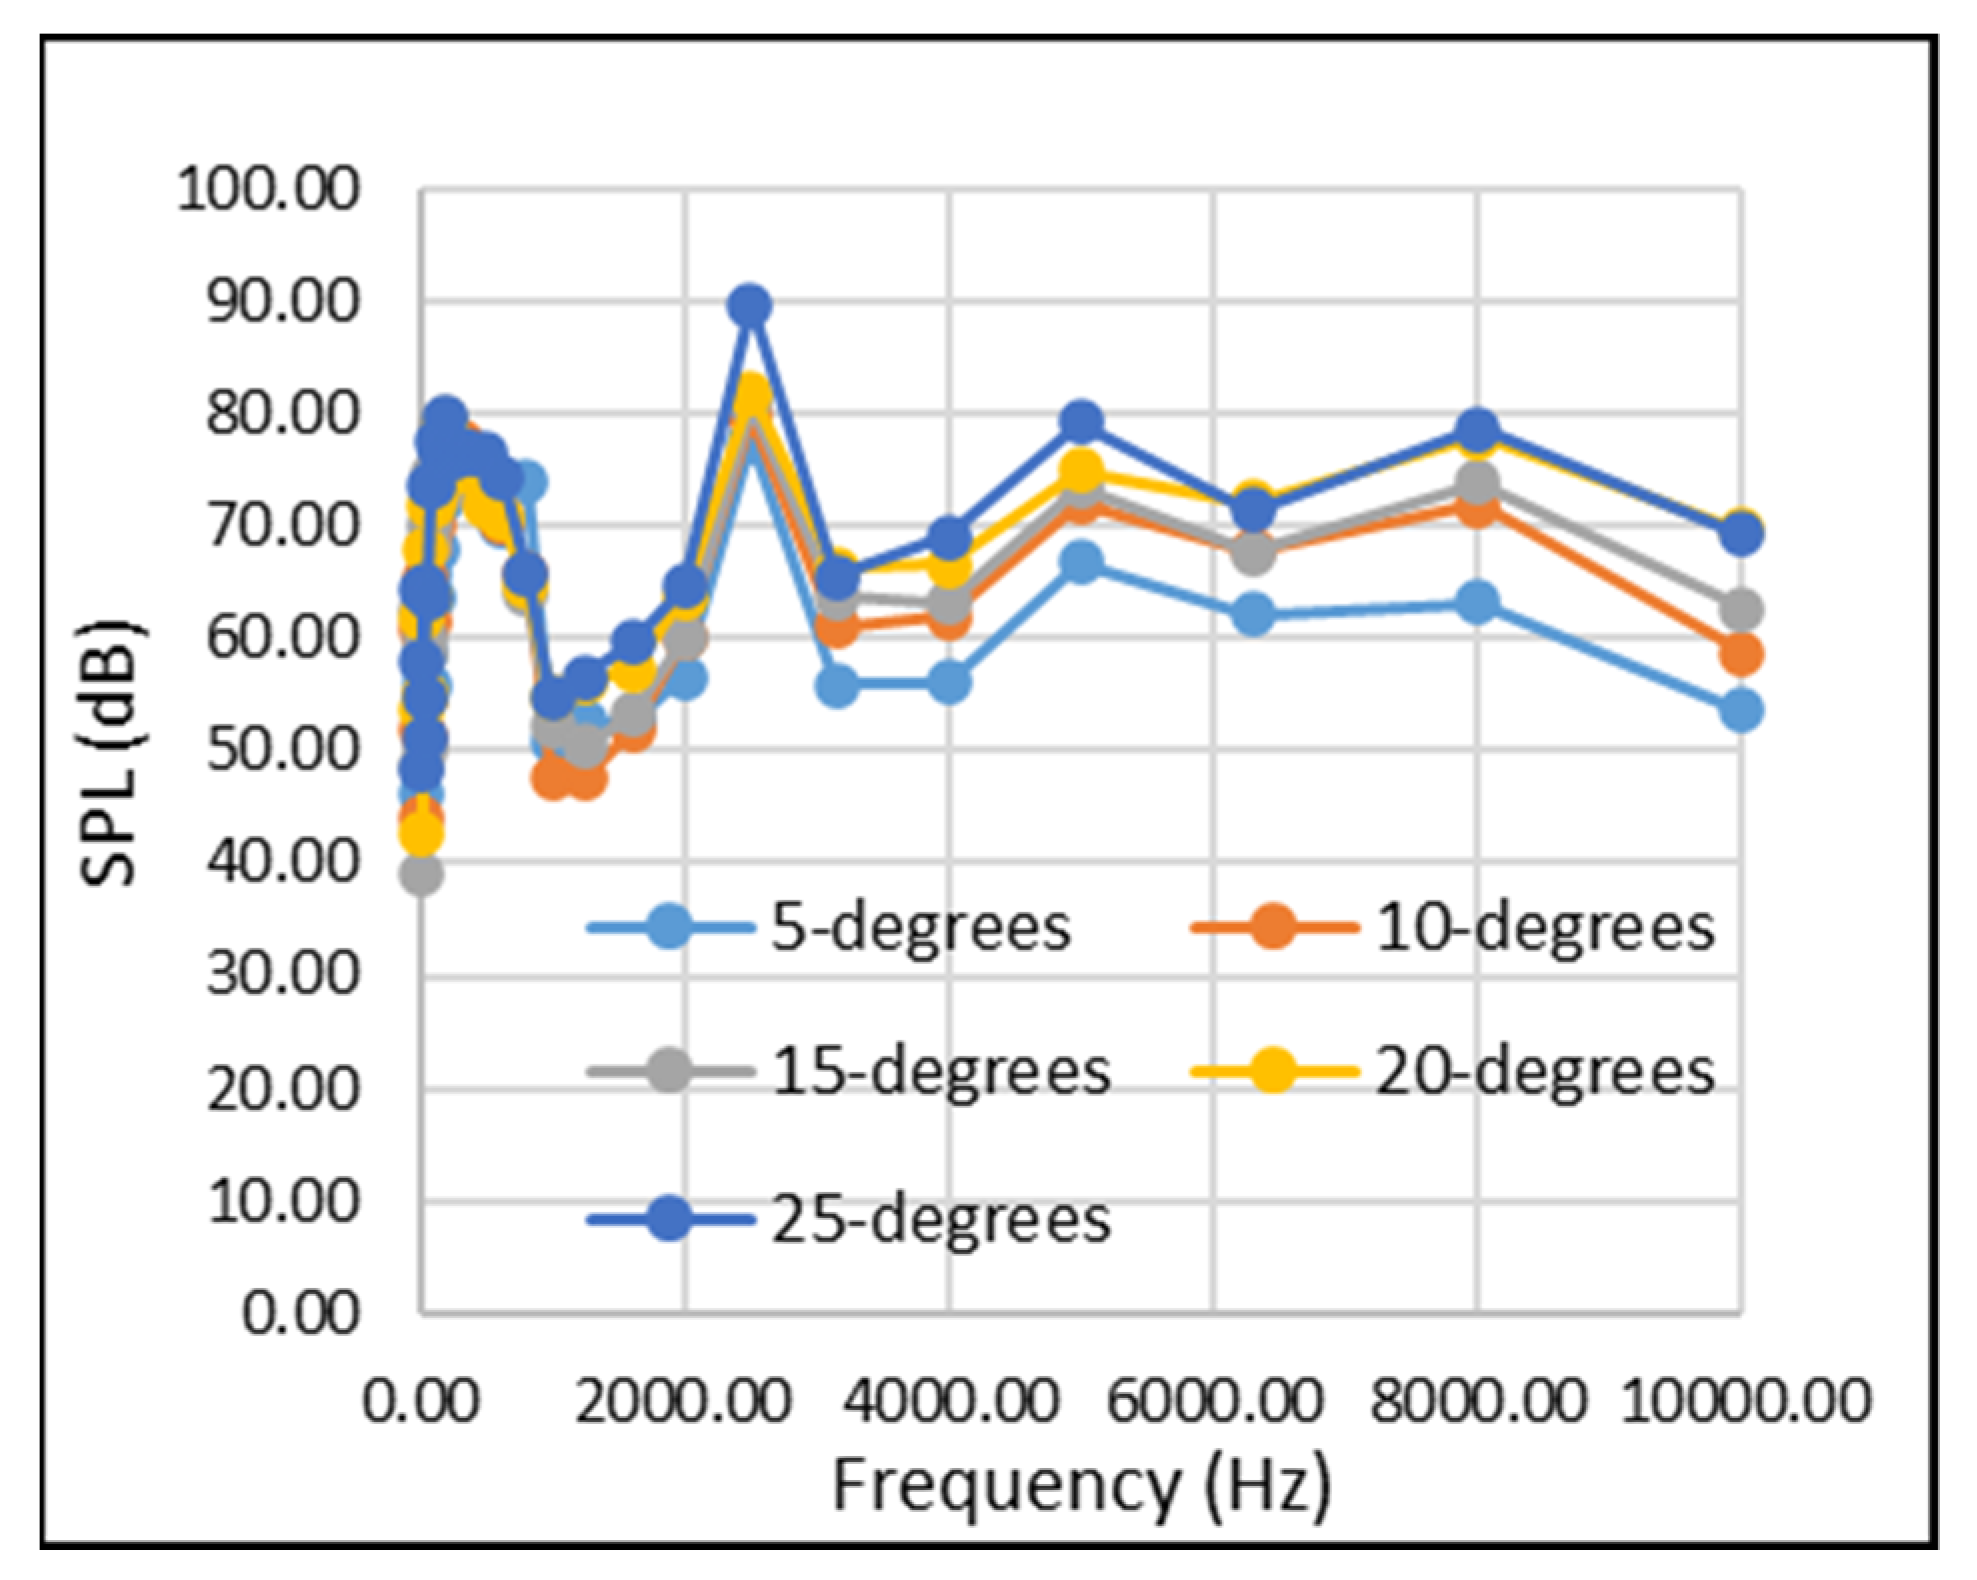
Across all five flap deflection angles tested in the conventional flap design case, there were three large tonal peaks, which occurred at frequencies of 2.5 kHz, 5 kHz, and 7.5 kHz (apart from the 5° deflection, where there were only two tonal peaks at 2.5 kHz and 5 kHz). These tonal peaks increased in amplitude as the flap deflection was increased. The conventional flap’s tonal peak amplitude increase with flap deflection is possibly caused by the increased pressure difference between the upper and lower surfaces at higher flap deflections which, when the gap shear layer and wing trailing-edge boundary layer mix, create a much louder tonal peak as the combined flow sheds downstream [11]. These tonal peaks are not present at low deflection angles in the morphed case, but do form at 20 and 25° flap deflection, although they are still relatively small.
The actual cause of these small tonal peaks that form in the morphed case at higher flap deflections is unclear, and is a little surprising given that the contoured flap surface is connected smoothly to the outer main wing. It seems that the morphed flap causes surface pressure fluctuations at its trailing edge that are higher than those generated at the trailing edge of the conventional flap. A similar observation was reported by Jawahar et al. [18] for their comparison of the noise generated by a conventional hinged flap and by a morphed flap of a NACA 0012 aerofoil.
In addition to the absence of mid-to-high-frequency tonal peaks, the morphed configuration has a much lower level of broadband noise across all flap deflections tested. One aerodynamic mechanism that is usually associated with broadband noise generation is flow separation. The conventional flap design, due to its cove region, experiences much larger areas of flow separation than the morphed configuration. It is expected that the flow separation in these cove regions is the cause of the higher levels of broadband noise seen in Figure 12 in the conventional flap.
The broadband noise for both the conventional and morphed flap designs can be more easily compared when looking at the 3rd octave band plots, as shown in Figure 13 (conventional flap) and Figure 14 (morphed flap).
In 
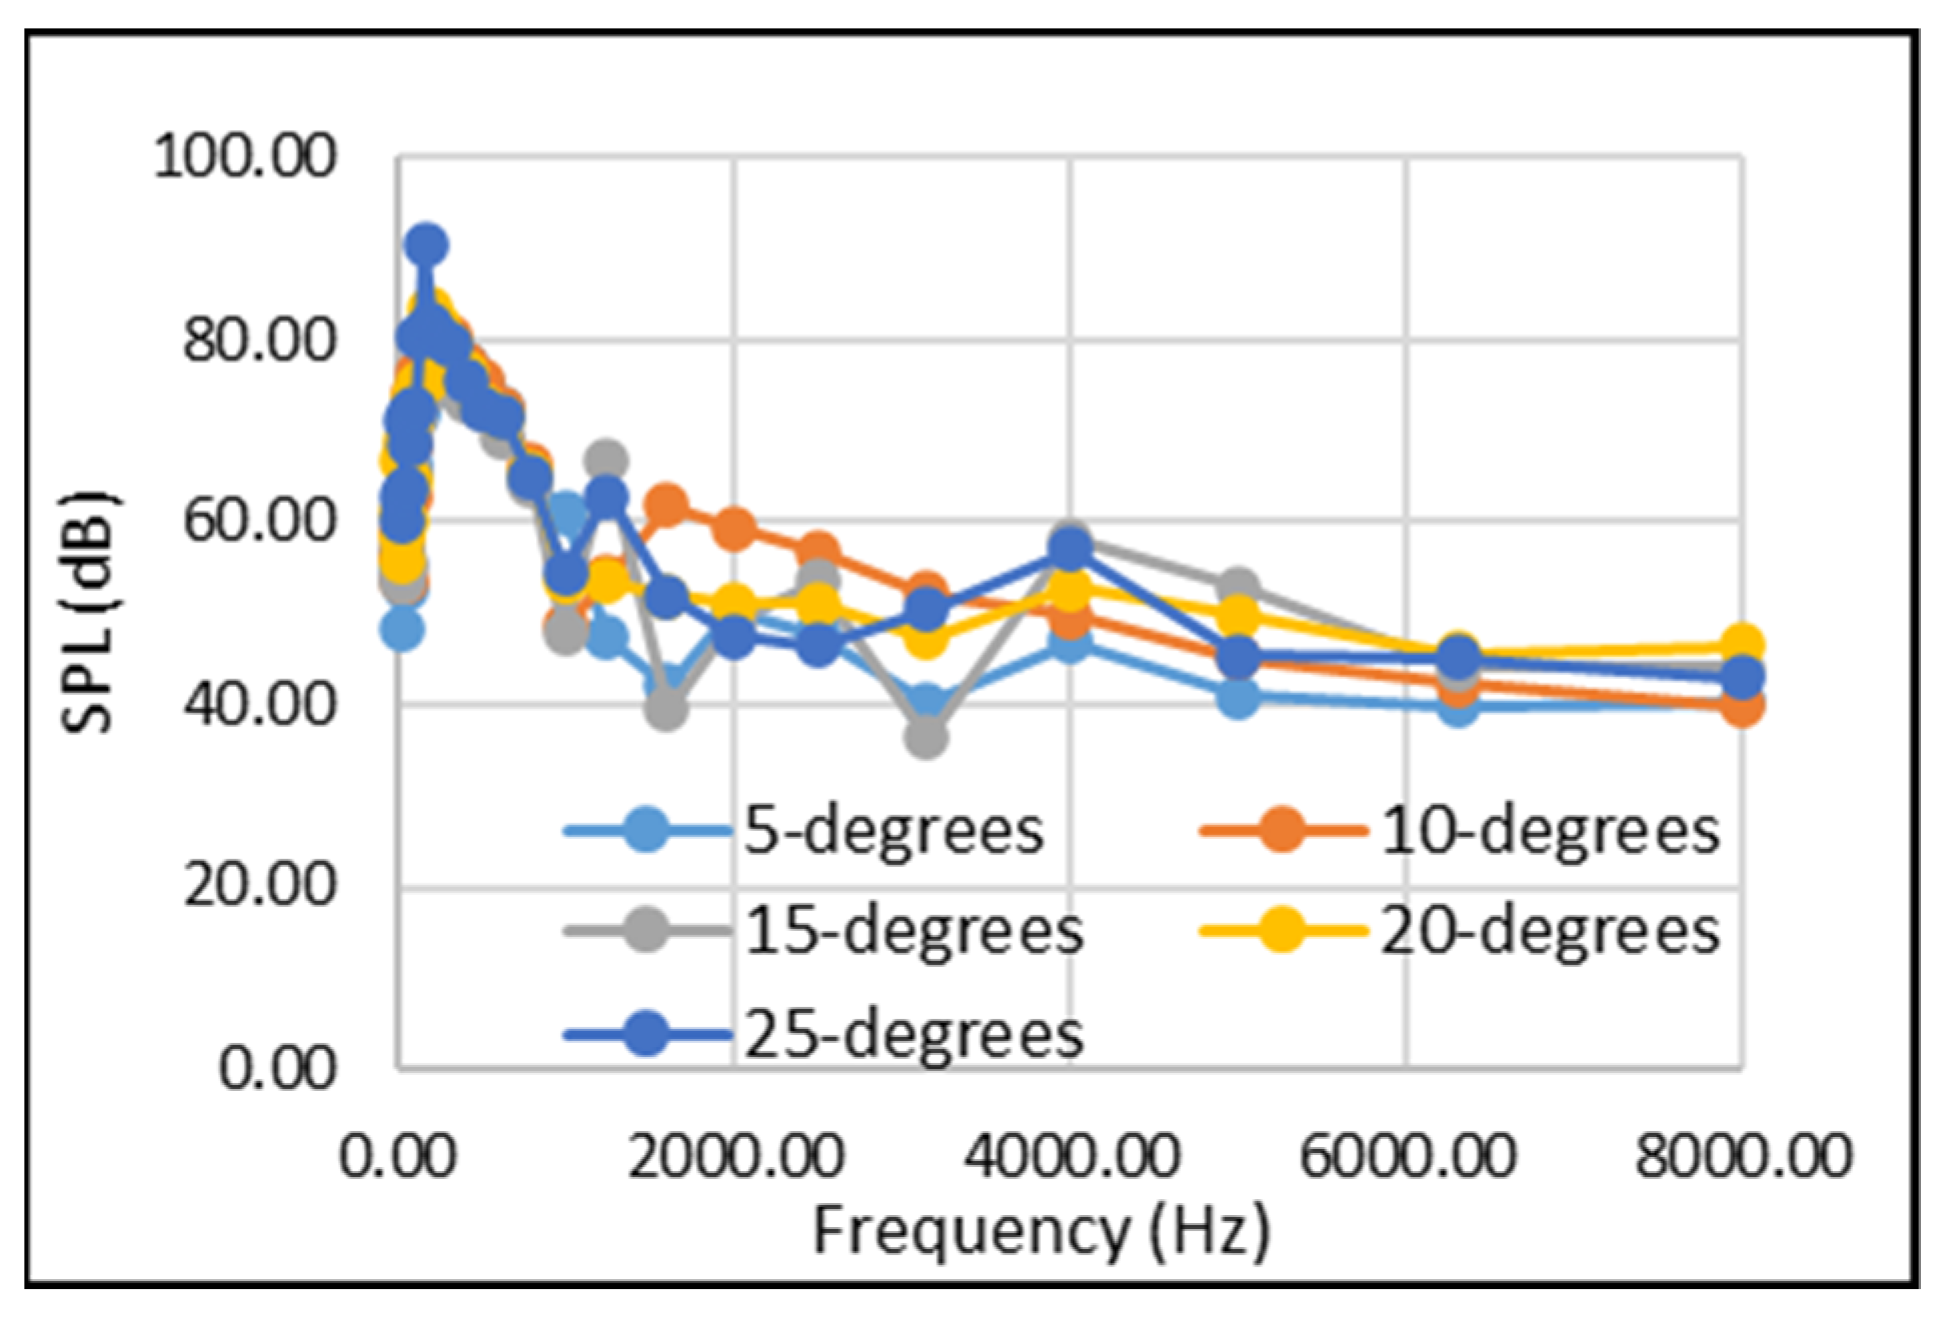
Figure 13, it can be observed that as the flap deflection increases, the level of broadband noise and the amplitude of the tonal peaks increases; this is characterised by the higher levels of flow separation and flow unsteadiness caused by the unsteady mixing shear layer from the main body’s trailing edge. The 3rd octave band plot in the morphed configuration (
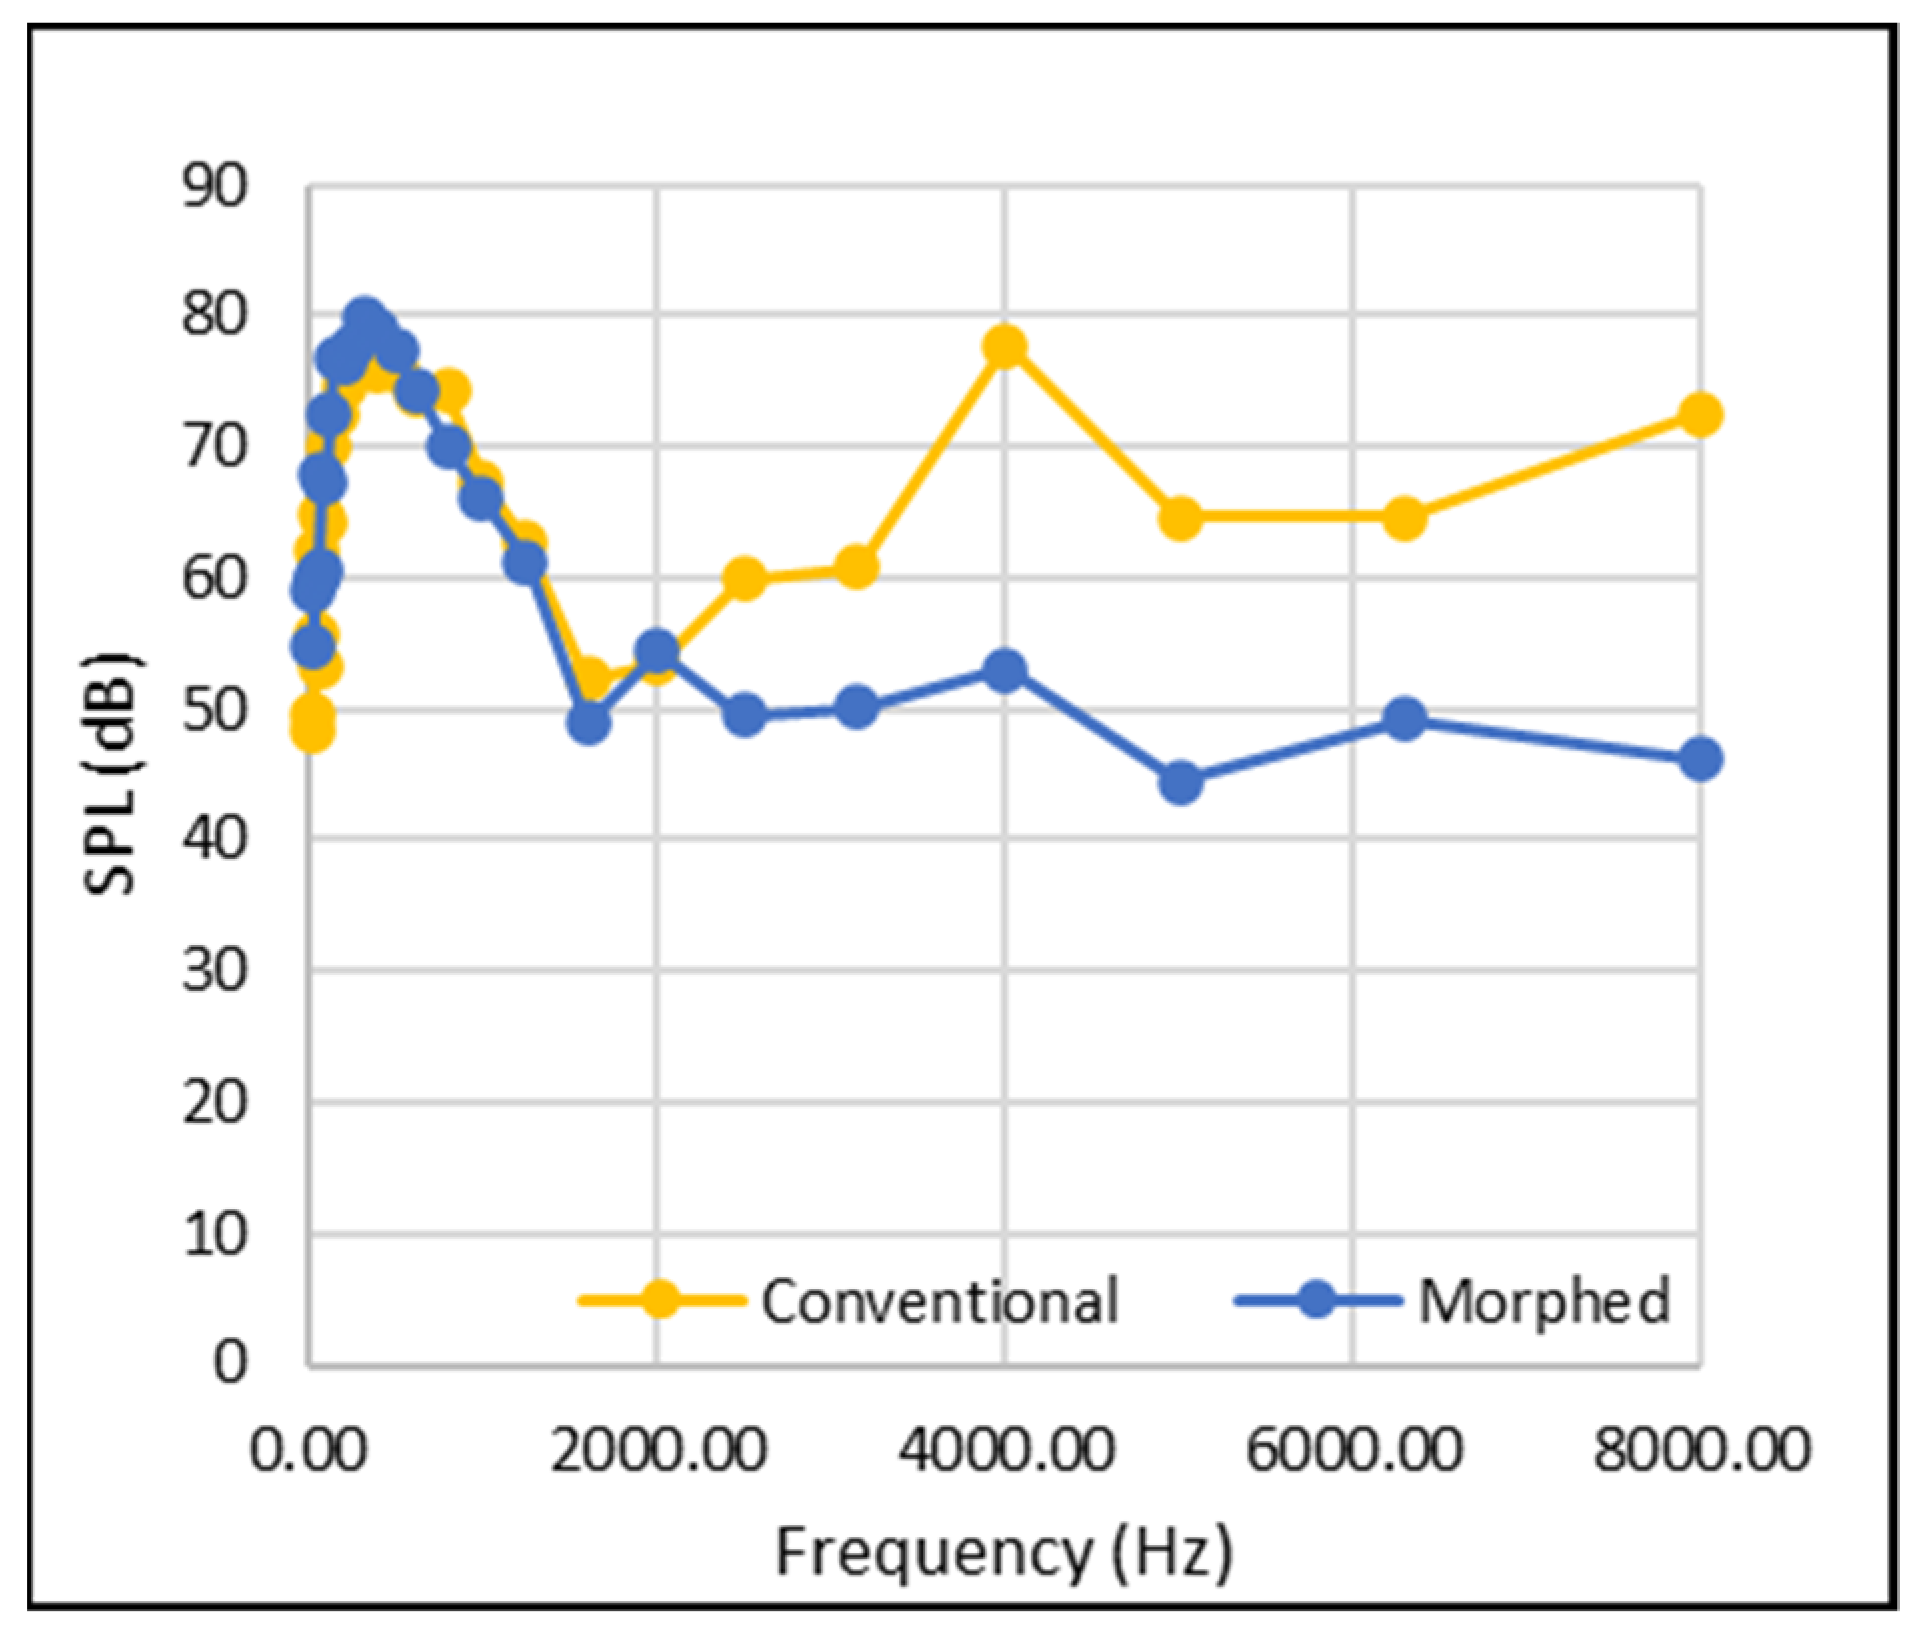
Figure 14) does not have such a straightforward and obvious trend. It is not clear which flap deflection generates the least levels of broadband noise, as the sound pressure level at any given frequency range varies so much with flap deflection. However, when a mean sound pressure level is computed for each frequency band across all flap deflections, it gives a better picture of the overall noise generation, and it can be seen that the morphed configuration still has a significantly lower broadband noise than the conventional one. The plot in Figure 15 shows an average of 11% less noise across all frequencies obtained, and 20% less broadband noise when considering only the frequency bands above 1250–1600 Hz.
Overall, the morphed-flap design clearly holds the most preferred characteristics when it comes to the aeroacoustic performance, with an average of 11% less broadband noise, and the elimination of tonal peaks present in the conventional case. However, as Whitfield [2] stated in 2004, after noise-generation mechanisms have been identified and noise-reduction techniques developed, the key is to implement them without having to compromise extensively on aerodynamic performance.
The aerodynamic characteristics of lift and drag coefficients ( C l ,   C d ) and their combined ratio C l / C d are shown in Table 1 and Table 2 for the conventional and morphed flap configurations, respectively, for the range of flap deflections studied.
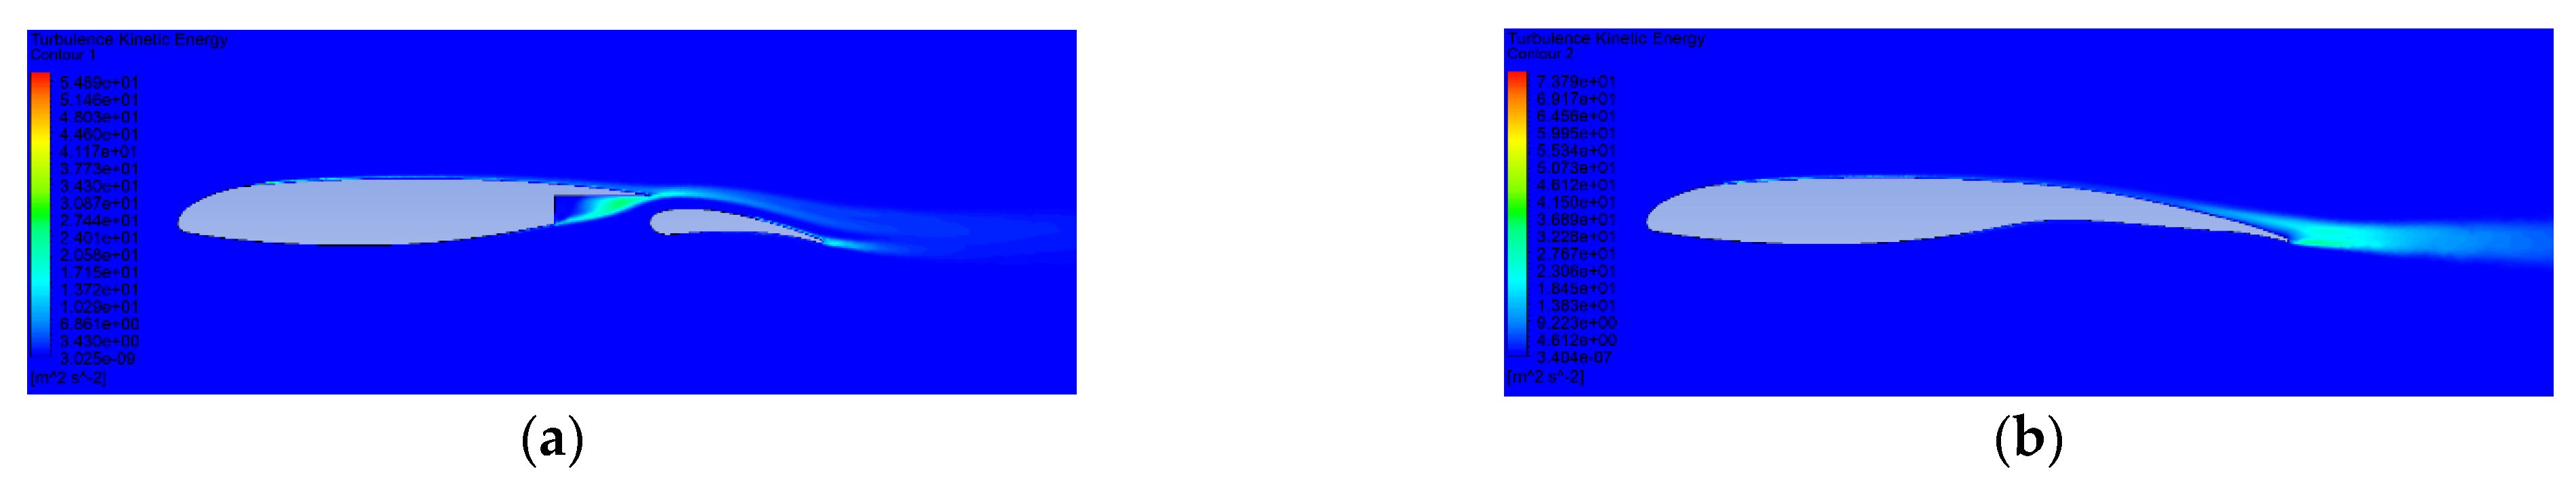
Whilst the conventional flap stalls at around 20°, the morphed flap does not stall until after 25° flap deflection. Evidence of the delayed stall in the morphed flap is supported by Figure 16 for the case of 5 ° flap deflection, where the flow seems to be more effectively attached to the upper surface towards the trailing edge of the flap than in the conventional case. The flow’s ability to remain attached for longer on the morphed configuration is due to the continuous surface, leading to smooth flow. Flap stall occurring earlier in the conventional flap design is due to increased flow separation, which impairs the aerofoil’s ability to maintain low pressure on the upper surface, leading to decreased lift generation.
In terms of the lift-to-drag ratio, the morphed flap exhibits a superior aerodynamic performance at flap deflections below 15°; after this flap deflection, however, and due to the rapid increase in pressure drag relative to the conventional flap, the conventional flap design has a higher lift-to-drag ratio.
In the conventional flap design, some pressure difference between the upper and lower surfaces is equalised at the cove region, as depicted by the relatively high levels of turbulent kinetic energy (TKE) in the cove region of the conventional flap in Figure 16. Therefore, there is less turbulence and overall energy in the flow as the upper and lower surface shear layers mix at the trailing edge to form the unsteady downstream flow. In the morphed case, however, all of the pressure difference and turbulent kinetic energy is released at the flap’s trailing edge as the shear layers mix, creating a much more turbulent region after the trailing edge—especially at high flap deflections. The relatively large amounts of TKE immediately after the trailing edge of both configurations are also due to the 30P30N flap having a squared trailing edge (with a thickness); this feature is commonly known to be detrimental for aerodynamics, and has been studied thoroughly in past literature. For example, Thomareis and Papadakis [19] stated that blunt trailing edges can cause periodic vortex shedding, and can create a spanwise pressure gradient, which is responsible for the development of a secondary flow pattern in the spanwise direction.
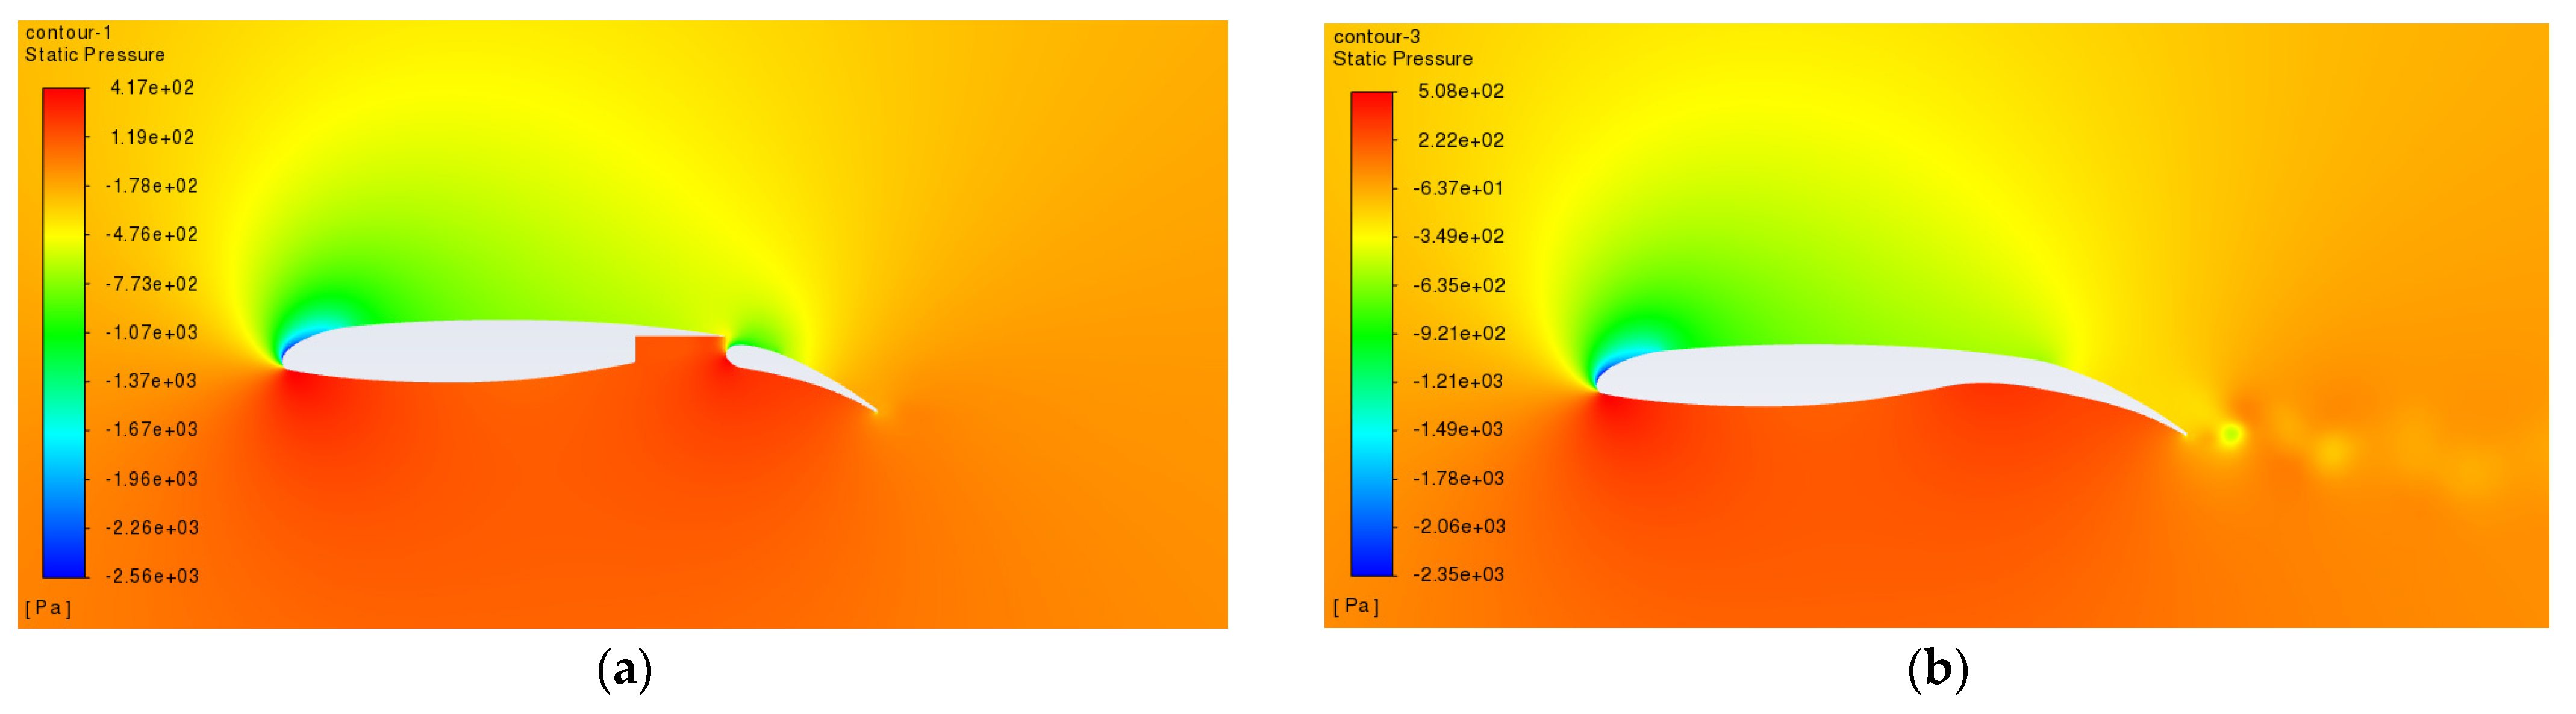
To discuss some differences in flow physics between the morphed and the conventional designs, and in support of the initial quantitative results obtained, Figure 17 and Figure 18 are presented for the case of 20° flap deflection. The static pressure contours are plotted in Figure 17 for both the morphed and conventional gapped configurations. It is evident that there is some form of vortex-shedding pattern appearing downstream of the morphing TEF, which is not seen in the conventional setup. It seems that the shear layer formed off the trailing edge of the main wing (as a result of the wing’s TE boundary layer interacting with the shear layer coming from the gap) does not interact with the shear layer forming at the flap’s trailing edge. The two layers flow separately, and only interact and mix further downstream in the wake, by which time the energy dissipated in both flows is not sufficient to cause vortex shedding. One can observe that the shear layer from the main wing’s trailing edge is initially pushed upwards above the flap—presumably due to the high-energy flow from the gap—before it flows downstream almost undisturbed and parallel to the flap. In contrast, for the morphing design, the trailing edge boundary layer flow from the main wing interacts with the flow near the flap’s trailing edge, creating a vortex roll-up and subsequent shedding in the wake. In such a case of 20° flap deflection, one would expect higher pressure drag and lower lift for the morphed configuration (i.e., lower Cl/Cd ratio, see Table 2), compared with a higher Cl/Cd ratio for the conventional reference design (see Table 1).
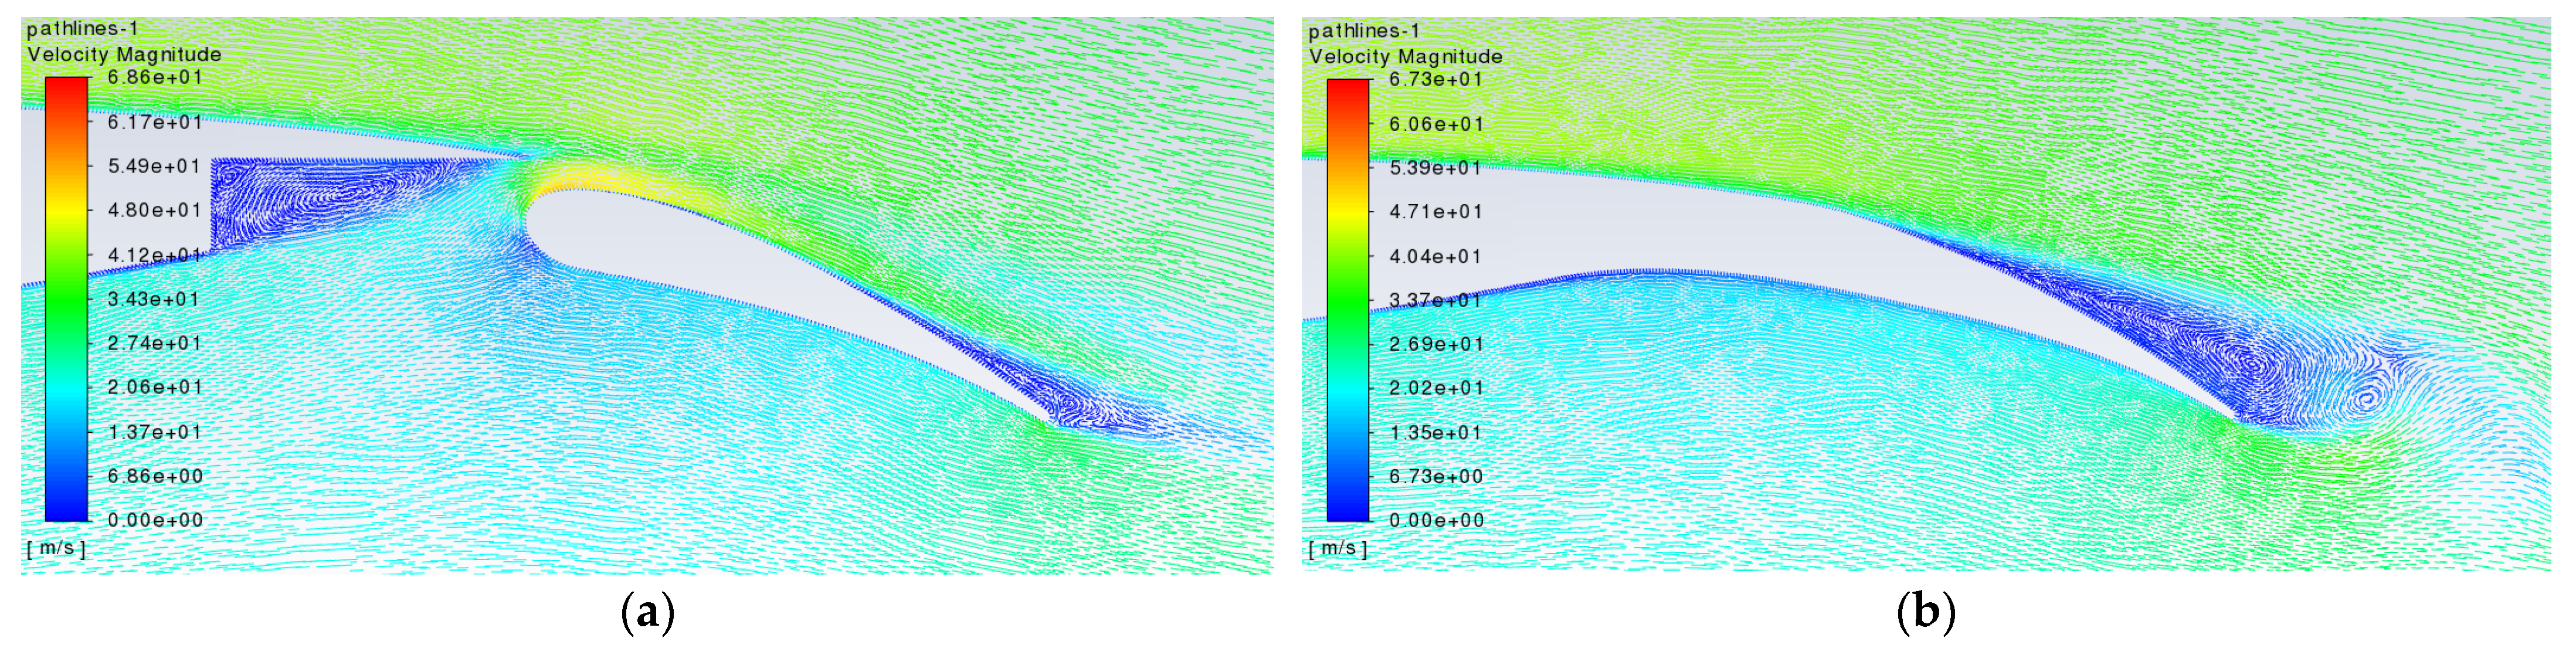
Figure 18 shows the flows streamlines (with velocity magnitudes) near the morphed trailing edge and the trailing edge flap gap for the reference configuration for the case of 20° flap deflection. For the gapped configuration, the streamlines clearly show a large, low-speed, recirculating flow bubble occupying the majority of the gap region, except in the gap’s corner, where there is a much smaller, secondary, recirculating vortex flow. In the simulations, such a recirculation zone seemed to remain steady at various flap deflections, with the secondary zone near the gap corner reducing in size with increasing flap deflection. The flow from the gap interacts smoothly with the main wing’s trailing edge flow, creating a stream of flow that smoothly convects downstream above the flap. Figure 18 clearly illustrates the speeding effect of the flow in the gap—particularly nearer to the flap’s leading-edge region. It is this speed-up effect that helps energise the flap’s boundary layer and keep it attached over most of its upper surface. It can be seen in the simulations that with higher flap deflection angles, the boundary layer on the flap near the trailing edge becomes thicker, and the first signs of vortex sheet roll-up start to appear. For the morphed configuration, the gap flow is eliminated as expected, and with it the speed-up effect over the flap’s leading edge. However, the flap experiences vortex roll-up and shedding, as explained previously from the results of Figure 17.

4. Conclusions and Future Work

The preliminary results presented in this paper contribute to understanding how, at the initial design stage, morphing the trailing edge flap of a 30P30N high-lift configuration affects acoustic noise generation compared with a traditional Fowler flap design, and how this morphing affects aerodynamic performance. Using fast Fourier transforms (FFTs) of pressure data to provide SPL plots, the results show that morphing flap technology holds significant benefits in terms of noise for flap deflections between 5 and 15°. The morphed trailing-wedge flap generated around 11% less broadband noise across all frequencies, and at higher frequencies there was a mean noise reduction of 20% in the range 1600–8000 Hz. This was down to the morphed flap having no cove region, and so less flow separation occurred, leading to reduced high-frequency broadband noise.
The conventional flap design causes multiple large tonal peaks for all flap deflections tested, due to the shedding vortices emanating from the main body’s trailing edge, as well as the trailing edge of the flap. Furthermore, the morphed flap design, with its continuous surface, demonstrates significantly prolonged flow attachment on the upper surface at high angles of flap deflection. Therefore, stall is delayed, and the aerofoil can continue achieving high levels of lift at greater flap deflections, whilst also generating much lower levels of noise than a conventional flap design. The morphed flap also virtually eliminated tonal peaks compared to the conventional flap design. There was, however, a better lift-to-drag ratio performance in the conventional flap design at flap deflections above 15°. This was caused by the rapid increase in drag in the morphed aerofoil after 15° flap deflection. This was likely caused by the gap between the main body and the flap, which allows flow to pass around the leading edge of the conventional flap as well as the trailing edge, not just the trailing edge for the morphed design.
The acoustic benefits of morphing discovered from the 2D simulations in this paper are substantial, and past research from the likes of Streett et al. (2012) [6] shows that further benefits are exhibited by morphing the flap in 3D, as other flow features such as flap side edge noise can be significantly reduced or even eliminated. The reduction in noise will particularly benefit airports surrounded by densely populated residential areas, and even the wildlife surrounding airports. Follow-up work could consider a wider range of geometric parameters, including flap angle, flap position, and flap length for the morphing configuration. Furthermore, in future work, the authors will investigate a wide range of angles of attack, as well as the full 30P30N aerofoil with the leading-edge slat. In the long term, further research should consider the design of a structure or mechanism that can morph the flap, whilst still withstanding the aerodynamic loads of high flap deflections and angles of attack, and still leave space in the wing structure for other subsystems in the wingbox, such as fuel storage, landing gear, and engines. Advancements in morphing technology will likely be helped by new advancements in materials science taking place, which can be integrated into morphing wing technology for greater aeroacoustic and aerodynamic performance improvements.
The preliminary nature of this study means that higher fidelity methods and finer meshes will be required for a detailed analysis of the aeroacoustic effects of a morphing TE flap on the 30P30N configuration. Although the flow was solved as unsteady, the modelling of the morphing TEF was not; in the future, the dynamic motion of the flap itself will need to be considered, similarly to what has been done recently in a number of studies, e.g., by Abdessemed et al. [20]. The effect of flap size and morphing frequency will be important considerations for a detailed understanding of a morphing TEF’s influence on the aerodynamic and aeroacoustic performance of a baseline 30P30N aerofoil.
Some of the content has been used from a conference paper that the two authors (J.W. and A.B.) produced previously [21].

Author Contributions

Conceptualisation, J.W. and A.B.; methodology, J.W.; software, J.W and A.B.; validation, J.W.; formal analysis, J.W.; investigation, J.W.; resources, A.B.; data curation, J.W.; writing—original draft preparation, J.W.; writing—review and editing, J.W. and A.B.; visualisation, J.W. and A.B.; supervision, A.B.; project administration, A.B, funding acquisition, J.W. and A.B. All authors have read and agreed to the published version of the manuscript.

Funding

This research received no external funding.

Acknowledgments

This research was funded by The University of the West of England, via the use of multiple high-end computers, over the course of several months.

Conflicts of Interest

The authors declare no conflict of interest.

References

  1. Chen, T.-J.; Chen, S.-S.; Hsieh, P.-Y.; Chiang, H.-C. Auditory Effects of Aircraft Noise on People Living Near an Airport. Arch. Environ. Health Int. J. 1997, 52, 45–50. [Google Scholar] [CrossRef] [PubMed]
  2. Whitfield, C. Nasa’s quiet aircraft technology project. In Proceedings of the 24th Congress of the International Council of the Aeronautical Sciences (ICAS 2004), Hampton, VA, USA, 1 January 2004. [Google Scholar]
  3. Murayama, M.; Nakakita, K.; Yamamoto, K.; Ura, H.; Ito, Y.; Choudhari, M.M. Experimental Study on Slat Noise from 30P30N Three-Element High-Lift Airfoil at JAXA Hard-Wall Lowspeed Wind Tunnel. In Proceedings of the 20th AIAA/CEAS Aeroacoustics Conference, Atlanta, GA, USA, 16–20 June 2014. [Google Scholar] [CrossRef] [Green Version]
  4. Jawahar, H.K.; Ali, S.A.S.; Azarpeyvand, M.; da Silva, C.R.I. Aerodynamic and aeroacoustic performance of high-lift airfoil fitted with slat cove fillers. J. Sound Vib. 2020, 479, 115347. [Google Scholar] [CrossRef]
  5. Choudhari, M.M.; Lockard, D.P. Assessment of Slat Noise Predictions for 30P30N High-Lift Configuration from BANC-III Workshop. In Proceedings of the 21st AIAA/CEAS Aeroacoustics Conference, Dallas, TX, USA, 22–26 June 2015. [Google Scholar] [CrossRef] [Green Version]
  6. Streett, C.; Casper, J.; Lockard, D.; Khorrami, M.; Stoker, R.; Elkoby, R.; Wenneman, W.; Underbrink, J. Aerodynamic Noise Reduction for High-Lift Devices on a Swept Wing Model. In Proceedings of the 44th AIAA Aerospace Sciences Meeting and Exhibit, Reno, NV, USA, 9–12 January 2006. [Google Scholar] [CrossRef]
  7. Li, L.; Liu, P.; Guo, H.; Hou, Y.; Geng, X.; Wang, J. Aeroacoustic measurement of 30P30N high-lift configuration in the test section with Kevlar cloth and perforated plate. Aerosp. Sci. Technol. 2017, 70, 590–599. [Google Scholar] [CrossRef]
  8. Evans, C.; Harmer, M.; Marks, O.; Tiley, S.; Willis, T.; Bouferrouk, A.; Yao, Y. Development and testing of a varia-ble camber morphing wing mechanism. In Proceedings of the International Symposium of Sustainable Aviation (ISSA), Istanbul, Turkey, 29 May–1 June 2016. [Google Scholar]
  9. Loudon, K.; Bouferrouk, A.; Coleman, B.; Hughes, F.; Lewis, B.; Parsons, B.; Cole, A.; Yao, Y. Further development of a variable camber morphing mechanism using the direct control airfoil geometry concept. In Proceedings of the International Symposium of Sustainable Aviation, Rome, Italy, 9–11 July 2018. [Google Scholar]
  10. Abdessemed, C.; Bouferrouk, A.; Yao, Y. Aerodynamic and aeroacoustic analysis of a harmonically morphing air-foil using dynamic meshing. Acoustics 2021, 3, 177–199. [Google Scholar] [CrossRef]
  11. Li, W.; Liu, H. Noise Generation in Flow over a Full-Span Trailing-Edge Flap. AIAA J. 2017, 55, 561–571. [Google Scholar] [CrossRef]
  12. Badshah, M.; VanZwieten, J.; Badshah, S.; Jan, S. CFD study of blockage ratio and boundary proximity effects on the performance of a tidal turbine. IET Renew. Power Gener. 2019, 13, 744–749. [Google Scholar] [CrossRef]
  13. ISO. Acoustics—Noise Emitted by Machinery and Equipment—Rules for the Drafting and Presentation of a Noise Test Code; ISO 12001; ISO: Geneva, Switzerland, 1996. [Google Scholar]
  14. ANSYS. Ansys Fluent Theory Guide; ANSYS, Inc.: Canonsburg, PA, USA, 2019. [Google Scholar]
  15. Courant, R.; Friedrichs, K.; Lewy, H. On the Partial Difference Equations of Mathematical Physics. IBM J. Res. Dev. 1967, 11, 215–234. [Google Scholar] [CrossRef]
  16. IdealSimulations, Courant Number. Available online: www.idealsimulations.com/resources/courant-number-cfd/ (accessed on 19 December 2021).
  17. Gracia, M.; Vanelderen, B.; De Roeck, W.; Desmet, W. Accurate interfacing schemes for the coupling of CFD data with high order DG methods for aeroacoustic propagation. In Proceedings of the 26th Conference on Noise and Vibration Engineering (ISMA2014), Leuven, Belgium, 15–17 September 2014; pp. 1333–1346. [Google Scholar]
  18. Jawahar, H.K.; Vemuri, S.; Azarpeyvand, M. Aerodynamic noise characteristics of airfoils with morphed trailing edg-es. Int. J. Heat Fluid Flow 2022, 93, 108892. [Google Scholar] [CrossRef]
  19. Thomareis, N.; Papadakis, G. Effect of trailing edge shape on the separated flow characteristics around an airfoil at low Reynolds number: A numerical study. Phys. Fluids 2017, 29, 014101. [Google Scholar] [CrossRef] [Green Version]
  20. Abdessemed, C.; Yao, Y.; Bouferrouk, A. Near Stall Unsteady Flow Responses to Morphing Flap Deflections. Fluids 2021, 6, 180. [Google Scholar] [CrossRef]
  21. Watkins, J.C.; Bouferrouk, A. Evaluating the Effects of a Morphed Trailing Edge Flap for Aeroacoustics Applications. In Proceedings of the International Symposium on Aircraft Technology (ISATECH), Budapest, Hungary, 28–30 June 2021; Available online: https://2021.isatech.org/ (accessed on 19 December 2021).
Figure 1. The standard 30P30N high-lift configuration.
Acoustics 04 00015 g001
Figure 2. Noise source location map: (a) 6500 Hz; (b) 14,500 Hz. From Streett et al. [6].
Acoustics 04 00015 g002
Figure 3. CML flap design (CML circled in blue): wind tunnel model from (a) pressure side and (b) suction side (Streett et al. [6]).
Acoustics 04 00015 g003
Figure 4. The 15° flap deflection for (a) conventional and (b) morphed configurations.
Acoustics 04 00015 g004
Figure 5. Domain mesh and geometry configuration for a conventional flap at 15° flap deflection.
Acoustics 04 00015 g005
Figure 6. Representation of CFL condition and Courant number (C), and their effects on timestep across grid spacing (each red square is the next data point).
Acoustics 04 00015 g006
Figure 7. SPL vs. frequency, 3rd octave—timestep testing.
Acoustics 04 00015 g007
Figure 8. SPL vs. frequency plot of varying CFL numbers. Tonal peaks at 4.5 kHz and 9 kHz only detectable with C = 0.7 and C = 1.
Acoustics 04 00015 g008
Figure 9. Pressure coefficient plots of numerical data against experimental data for the 30P30N aerofoil, from the work of Murayama et al. (2014) [3]: (a) 3° AoA; (b) 8° AoA.
Acoustics 04 00015 g009
Figure 10. Lift coefficient vs. angle of attack comparison of current numerical data with the experimental and numerical data of Murayama et al. [3].
Acoustics 04 00015 g010
Figure 11. SPL vs. Strouhal number comparison of numerical data with the experimental data of Jawahar et al. [4].
Acoustics 04 00015 g011
Figure 12. SPL vs. frequency at an 8° AoA for conventional and morphed flap designs across all flap deflections tested: (a) 5° flap deflection; (b) 10° flap deflection; (c) 15° flap deflection; (d) 20° flap deflection; (e) 25° flap deflection.
Acoustics 04 00015 g012aAcoustics 04 00015 g012b
Figure 13. 3rd octave bands for conventional flap design across all tested flap deflections.
Acoustics 04 00015 g013
Figure 14. 3rd octave bands for morphed flap design across all tested flap deflections.
Acoustics 04 00015 g014
Figure 15. 3rd octave band plot for morphed and conventional flap configurations, where a mean value is made for each frequency band, representing all flap deflections in one plot.
Acoustics 04 00015 g015
Figure 16. Turbulent kinetic energy (TKE) plot at 5° flap deflection: (a) conventional design; (b) morphed design.
Acoustics 04 00015 g016
Figure 17. Static pressure contour plots at 20° flap deflection for: (a) conventional configuration; (b) morphed configuration.
Acoustics 04 00015 g017
Figure 18. Plots of velocity magnitude on streamlines around the trailing edge region at 20° flap deflection: (a) conventional configuration; (b) morphed configuration.
Acoustics 04 00015 g018
Table 1. Aerodynamic performance of conventional flap design at corresponding flap deflections.
Flap Deflection
(°)
C l C d C l / C d
51.240.075816.37
101.510.087317.34
151.80.11415.81
202.020.12715.95
251.910.13913.77
Table 2. Aerodynamic performance of morphed flap design at corresponding flap deflections.
Flap Deflection
(°)
C l C d C l / C d
51.330.073418.08
101.660.091918.05
151.690.11015.41
201.940.14613.25
252.060.18211.30
Publisher’s Note: MDPI stays neutral with regard to jurisdictional claims in published maps and institutional affiliations.

