Article

Development and Assessment of a Miniaturized Test Rig for Evaluating Noise Reduction in Serrated Blades Under Turbulent Flow Conditions

by
Andrei-George Totu
1,2,
Cristian-Teodor Olariu
1,
Andrei-Tudor Trifu
1,
Andreea-Cătălina Totu
1 and
Grigore Cican
1,2,*
1
Romanian Research & Development Institute for Gas Turbines COMOTI, Iuliu Maniu Ave. 220D, 061136 Bucharest, Romania
2
“Elie Carafoli” Department of Aerospace Science, Faculty of Aerospace Engineering, Polizu Campus, National University of Science and Technology POLITEHNICA Bucharest, Splaiul Independenței 313, 060042 Bucharest, Romania
*
Author to whom correspondence should be addressed.
Acoustics 2024, 6(4), 978-996; https://doi.org/10.3390/acoustics6040054
Submission received: 3 September 2024 / Revised: 25 October 2024 / Accepted: 6 November 2024 / Published: 11 November 2024
(This article belongs to the Special Issue Vibration and Noise (2nd Edition))

Abstract

:
The implementation of serrated stator blades in axial compressor and fan stages offers significant advantages, such as enhanced performance and reduced noise levels, making it a practical and cost-effective solution. This study explores the impact of serrated blade design on noise reduction under specific engine operating conditions. A small-scale experimental test setup with a turbulence-inducing grid was designed for testing multiple grid sizes in order to identify the most promising configuration which replicates rotor–stator interaction. Numerical simulations and early experimental tests in an anechoic chamber using a four-blade cascade configuration at an airflow speed of 50 m/s revealed a small but notable noise reduction in the 1–6 kHz range for a partially matched grid–blade geometry. Serrated blades demonstrated an overall sound pressure level reduction of 1.5 dB and up to 12 dB in tonal noise, highlighting the potential of cascade configurations to improve acoustic performance in gas turbine applications.

1. Introduction

The interaction between the turbulent airflow and serrated blades manifests in various aspects, influencing aerodynamic properties, noise generation, structural loading, and overall efficiency. Turbulence alters the flow field around serrated blades, leading to changes in lift, drag, and stall characteristics. Recent studies have demonstrated that turbulent fluctuations can enhance aerodynamic performance by promoting flow attachment and delaying stall onset [1].
Turbulence interacting with serrated blade edges can result in increased noise levels due to flow separation, vortex shedding, and pressure fluctuations. Understanding and controlling turbulence-inducing structures are crucial for mitigating noise emissions from serrated blade systems [2,3]. Turbulence-induced fluctuations in pressure and velocity impose dynamic loads on the serrated blades, affecting their fatigue life and structural integrity. Proper design considerations accounting for turbulence effects are essential to ensure the durability and reliability of the blade attachment system [4]. The influence of turbulence on serrated blade aerodynamic performance ultimately impacts the overall system efficiency and energy consumption. Serrated vane geometries can be optimized so that the effects of turbulent jet interaction with solid surfaces can lead to lower sound pressure levels, lower stage pressure loss and/or increased incidence to stall. Recent research has focused on elucidating the complex interaction between turbulence and serrated blades to drive advancements in blade design and aerodynamic performance optimization. Computational Fluid Dynamics (CFD) simulations have emerged as powerful tools for studying turbulence–blade interactions with high fidelity. Advanced numerical techniques, such as Large Eddy Simulation (LES) and Direct Numerical Simulation (DNS), enable detailed investigations into turbulent flow phenomena around serrated blades [1]. RANS (Reynolds-Averaged Navier–Stokes equation)-based solvers [5] featuring unsteady flow analysis, shear–stress transport and Ffowcs–Williams and Hawking’s model; ref. [6] featuring RANS using OpenFOAM opensource code and the Spalart-Allmaras turbulence model; ref. [7] featuring k-l Smith and k-ω Menter SST-based RANS solvers which fed a Ffowcs–Williams and Hawkings (FWH) solver using Goldstein’s formulation; ref. [8] featuring incompressible steady-state Reynolds Averaged Navier–Stokes from CFX and transient RANS using FW-H; ref. [9] featuring in house SST-based RANS solver with Amiet-like far field sound model) in which the inflow turbulent motion is characterized with an average velocity and a fluctuation component [10] can also be used at least as a preliminary alternative for commercially available [10,11,12] or in-house developed LBM (Lattice Boltzmann Method) or Navier–Stokes-based LES (Large Eddy Simulation) code/software (e.g., CAA and Wiener–Hopf methods [13], high-order methods for direct computation of 3D aerofoil–gust interaction noise [14], an in-house parallelized Navier–Stokes flow solver [15] or analytical in-house fan tonal and broadband noise prediction tool for rotating blades [16]). To a certain extent, RANS can also be used in describing the aerodynamic characteristics of coupled cylinder/grid flows for a variety of NACA airfoils [17,18] or just for an isolated airfoil with a modified trailing edge [19]. Experimental studies utilizing state-of-the-art measurement techniques, such as Particle Image Velocimetry (PIV) and Hot-Wire Anemometry (HWA), provide valuable insights into the flow physics and turbulence characteristics near serrated blade surfaces [2,3]. Multi-disciplinary approaches integrating fluid dynamics, structural mechanics, and acoustic analysis have been employed to comprehensively assess the performance of serrated blades in real-world operating conditions [20].
Furthermore, advancements in materials science and manufacturing technologies have facilitated the development of innovative blade designs with enhanced durability, efficiency, and noise reduction capabilities. Understanding the intricate interplay between turbulence characteristics and blade geometry is essential for optimizing aerodynamic performance, reducing noise emissions, enhancing structural integrity, and maximizing overall efficiency. Recent research efforts leveraging advanced computational and experimental techniques have provided valuable insights into turbulence–blade interactions, paving the way for continued innovation and improvement in blade design and performance.
The paper aims at investigating the design and fabrication of a miniaturized stand for testing serrated blades placed in a turbulent jet and then instrumenting it. The mechanism by which noise arising in the rotor–stator stages can be generated and attenuated is analyzed by numerical simulations (using a parameter that depends on TKE). It is possible to “simulate” the existence of a rotor by placing an element that introduces velocity fluctuations in the flow similar to those coming from a rotor. Preliminary RANS simulations are performed to identify possible geometries associated with the flow characteristics. Preliminary tests are carried out in an anechoic chamber on the four-bladed cascade configuration at 50 m/s.

2. Materials and Methods

2.1. Experimental Setup

Turbulence can be generated either with rods (where the tonal component predominates and the behavior of the serration can be identified on certain frequencies of interest—usually multiples of BPF) or with grids, which lead to a more uniform spectrum in the broadband. Future research will be directed toward both methods in order to better characterize each solution analyzed.
As regards the setup producing such controlled turbulence, several installations have been identified in the literature consisting of a converging section along which a grid is placed (at certain axial positions), in some cases even with a rod at the outlet to generate the tonal component. Among the installations/configurations identified are the 10 to 120 m/s open-jet wind tunnel from ISVR [21,22], which provides an available testing section of 0.15 m × 0.45 m. Similarly, the tests conducted at Beihang University [23] for a test section of 0.25 m × 0.15 m highlighted the rod–airfoil interaction at low Mach numbers (~0.1). The Ecole Centrale de Lyon’s high-speed subsonic anechoic wind tunnel [24,25] can also be mentioned, where experiments up to Mach 0.34 can be performed. In line with the open-jet type installations which facilitate both aerodynamic testing and sound field data acquisition, Jacob [26] also mentions the installations at ISAE-SUPAERO (Toulouse), DLR-Braunschweig, ONERA-Cepra 19, and several others or grid–airfoil interaction noise. The low-speed open-type wind tunnel at the department of Power System Engineering, University of West Bohemia [2] is capable of reaching 90 m/s for a test section of 0.2 m × 0.3 m (and 0.75 m length where the pressure or hot wire probes can be fitted). On a slightly larger scale, one can mention the industrial wind tunnel (XNJD-1) at Southwest Jiaotong University, Chengdu, where airspeed from 0.5 to 45 m/s can be achieved with tests on turbulence grids being completed in [12] at ~10 m/s. The anechoic open jet wind tunnel at Ecole Centrale de Lyon [27] is an example of a cascade-type test rig with interchangeable turbulence grids (air provided on a 0.56 × 0.56 m2 by a 800 kW centrifugal fan). Moreover, the installations mentioned in [14] for the calibration of their mathematical model are notable, as they work with low (2–20 m/s and Re~104..105 [28] for small, serrated airfoils) or medium airspeeds (Re~105…106 for wind turbines [29]). Ito [28] has included load cell equipment capable of measuring aerodynamic components up to 1.2 kg using a three-component load cell. In [30], a comprehensive study integrating aerodynamics, acoustics, and bionics was conducted (Re = 105) to explore new mechanisms for reducing noise associated with aircraft flight. The study focused extensively on the Strigiformes order of birds, which were chosen for their silent flight characteristics. As a result of this research, three mechanisms with potential for acoustic reduction were identified: vortex sheet generators, compliant surfaces, and distributed wing porosity. In [31], there were reports on an experimental investigation into the noise reduction capabilities of sawtooth trailing edge serrations on a flat plate at low to moderate Reynolds numbers (1.6 × 10⁵ < Rec < 4.2 × 10⁵). Acoustic and aerodynamic measurements were carried out using a flat plate with both sharp and serrated trailing edges in the anechoic wind tunnel at the University of Adelaide. The serrations on the trailing edge were found to reduce noise levels by up to 13 dB in the narrowband range without altering the directionality of the emitted noise. Ref. [32] investigates the effectiveness of flow-permeable comb-type trailing edges in reducing turbulent boundary-layer trailing-edge noise to Reynolds numbers [1.1–7.9] × 106, demonstrating that they can significantly lower noise compared to solid edges, with design requirements including a minimum device length and a narrow slit width. Ref. [2] investigates the impact of shape errors on turbulence evolution behind a 3D-printed NACA 64-618 airfoil with predefined shape inaccuracies. Using a high-precision optical 3D scanner and hot-wire anemometry, the study assessed the shape and surface quality of the airfoil and measured its aerodynamic performance with a custom force balance device. Experiments were conducted at attack angles of +10°, 0°, and −10°, and across Reynolds numbers ranging from 5.3 × 10⁴ to 2.1 × 10⁵. The findings indicate that blunt trailing edges and rough surfaces degrade aerodynamic performance and reveal a strong sensitivity of the Taylor microscale Reynolds number to shape inaccuracies, particularly at Re ≈ 1.7 × 10⁵. In [33], the authors experimentally examine the aerodynamic characteristics and flow fields of a smooth, owl-inspired airfoil without serrations or velvet structures, showing that it achieves high lift performance due to a separation bubble on the suction side and demonstrates notable Reynolds number [2.3–6] × 104 insensitivity in lift curves, although the drag differences are pronounced at high angles of attack, indicating its potential for enhancing aerodynamic performance in low-Reynolds-number applications.
In reference [34], a rigorous characterization of the aeroacoustics and aerodynamic performance of wind tunnel facilities is presented, comparing the flow quality and acoustic performance of the new wind tunnel with other aeroacoustics facilities worldwide. Several wind tunnels used for experiments are described, including details on the nozzle exit area, the maximum flow velocity, the emission angle with respect to the normal direction of the nozzle’s exit plane, and the exponent of the power law k.
Analyzing the specialized literature, it was found that only in works [35,36] are there studies on turbomachine blades arranged in a grid with their geometry modified, but these blades are turbine blades.
Based on these examples, the aim of this work is to finally design and 3D print a convergent section so that it can provide a speed of more than 50 m/s in the outlet (test) section. In this way, new relevant data can be generated and the results can be compared with those already existing in the literature. The starting point was the existing air source in the anechoic chamber of the COMOTI acoustics department (Măgurele, Romania) that can reach a flow velocity up to 100 m/s attached to a similar section (for an outlet section of 0.14 m × 0.047 m). By a simple scaling, taking into account also that one or more vanes should be placed in the exit section (on different orientations), 0.15 m width and 0.075 m height was chosen for the test section. Having established the outlet section and knowing the air parameters (in the 305 mm diameter inlet section to minimize the losses proportional to the velocity squared), it only remains to determine what the convergent passage between the two sections looks like. Figure 1 shows a vertical plane section along the converging section.
Several criteria were imposed for the validation of this form:
  • The transition should not be so abrupt that significant detachments occur.
  • It must be modular so turbulence-generating elements can be introduced between these sections (axial sectioning is also relatively uniform).
  • To be able to incorporate measuring instruments (it is possible to provide at certain instrumentation points/areas for mounting pressure/temperature probes).
  • Can be easy to manufacture (3D-printable).
  • Have good mechanical strength (both the section and the turbulence-generating elements to be inserted in the flow path).
To highlight the turbulence–blade interaction, the rationale behind the design of the installation in Figure 2 is presented in this paper. The bench is intended to be able to integrate either an isolated vane or a configuration of four cascade vanes on which flow and surface measurements (pressures, temperatures, velocity profiles) can be made both inside and outside the convergent channel as well as force measurements using load cells mounted on the outlet side areas.
As the overview shows, the designed flow section provides the transition from a circular to a rectangular section, the expected velocity in the outlet section being ~50 m/s (and ~80 m/s if pressurized air supply from an external source—a buffer tank is used).
Identifying the “optimal” convergent path–turbulence grid combination starts with determining the dimensions of the vanes to be placed in the flow. Since the flow section is 150 mm × 75 mm, in a cascade configuration, 75–150 mm long vanes could be inserted, which are limited by the ratio of chord to vane spacing (solidity σ, which is usually between 0.8 and 1.2). Considering existing experiments in the literature, which recommend that the maximum amplitude should not exceed 20% of the chord length, and taking into account that the ratio of amplitude to pitch should be within the range of 1..2, while the pitch-to-ILS ratio should ideally be around 4, we aim for an amplitude Λ of 2.5 mm at this scale [22,36,37,38,39].

2.2. Mathematical Methods and Numerical Simulation

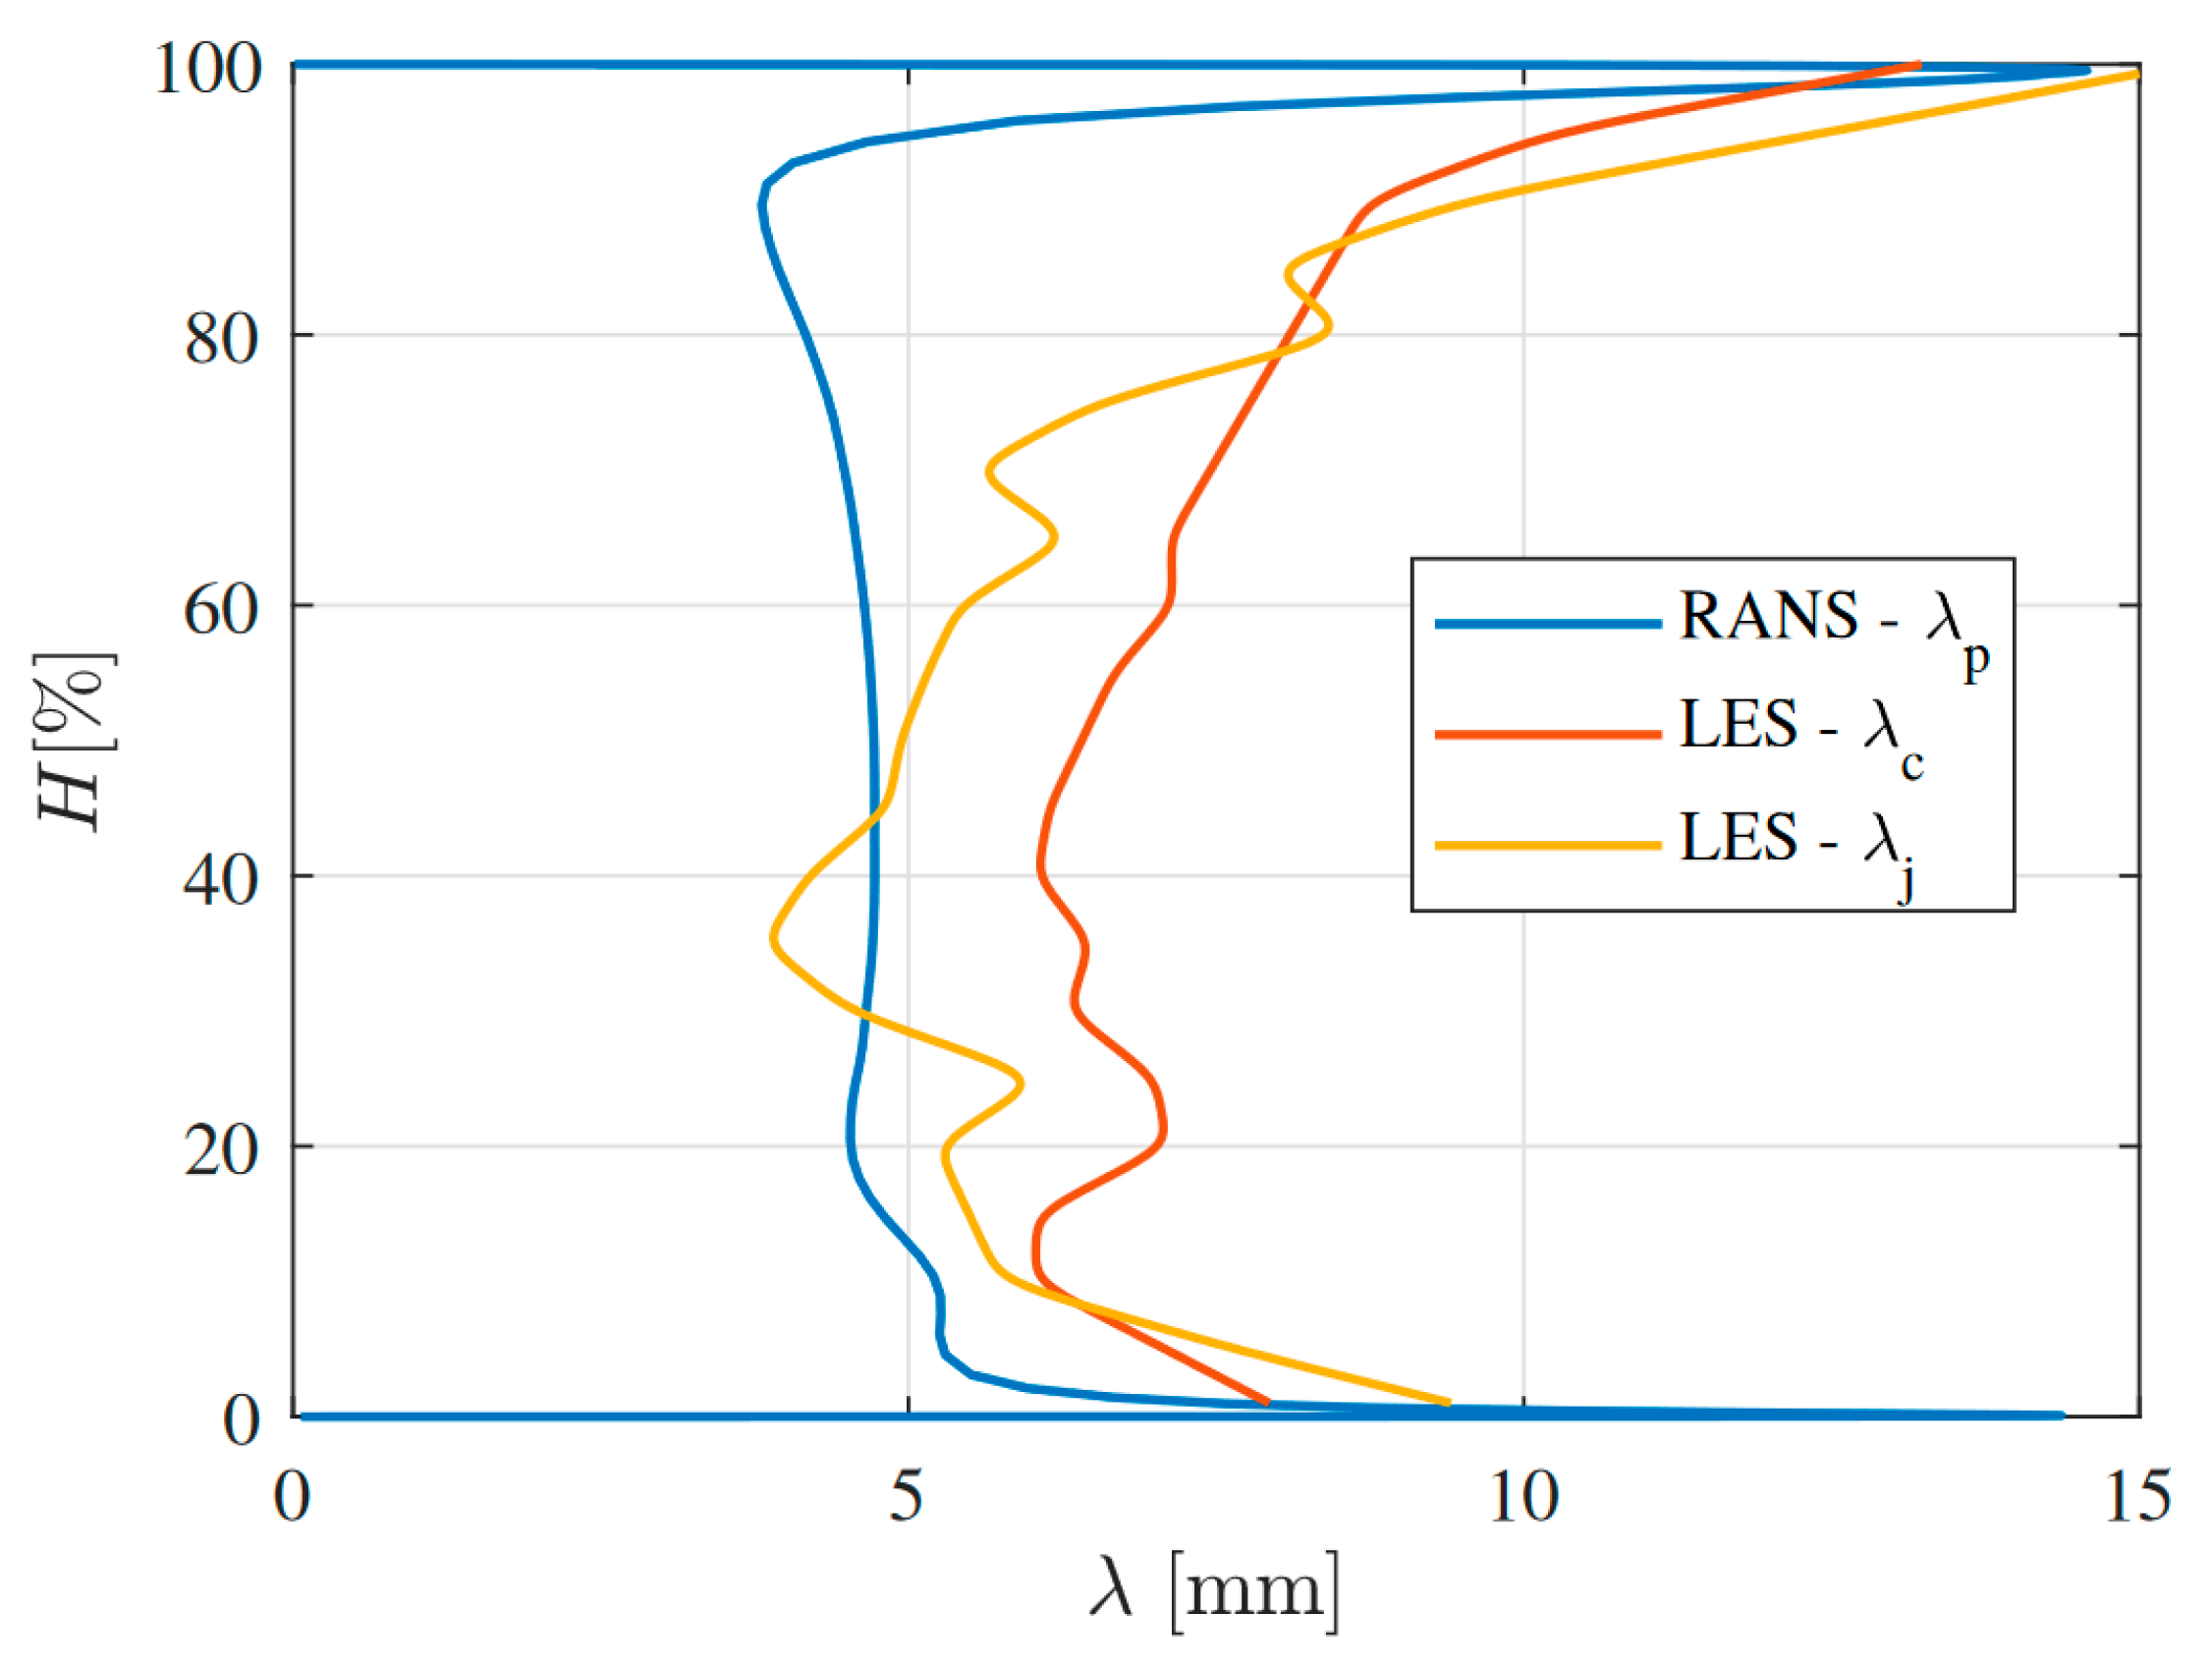
The first step in defining acoustic performance is to identify the correlation parameter between serration characteristics and turbulence. Either a rod (for a tonal component: 0.1 c diameter for a tonal component starting at St ~0.19 [40], 6 mm diameter for a tonal component at St ~0.1 [23], 10 mm diameter (0.1 c) for tonal noise at St ~0.2 [11] or 10/16 mm rod for St ~0.19 [41]) or a grid (for a broadband noise [1,12,21]) can be used to generate the fluctuating component in the flow in the 1:1 variant (within a stage placed in the axial compressor), the properties of the fluid incident on the vane being those corresponding to the rotor downstream. Thus, the reference parameter, as is usual for solutions with serrations, is a function containing as variables the turbulent kinetic energy (TKE) and the energy dissipation rate (TED). Figure 3 shows this parameter of interest, the turbulence length scale, 0.03 c upstream of the stator leading edge. The authors point out that the distribution of this parameter can also be obtained with simpler models, the three curves (λp, λc and λj) [42] having different formulations depending on the type of simulation. For a standard RANS, the ILS parameter can be determined numerically using a function defined later in post-processing, which is written according to (1).
Λ = C μ 3 / 4 k 3 / 2 ϵ
where Cμ = 0.09. The same parameter can also be written as (2) from the k-l Smith and k-ω Menter SST turbulence models [13].
Λ = C R e C μ k 1 / 2 ω C R e C μ l
Also, one can write the relation Λ = 0.21   L w   [13], where L w is the size of a vortex (“Gaussian wake width”). As pointed out by several authors ([4] up to 3 mm, [13] up to 10 mm or even higher, [43] up to 7 mm or even 20 mm [44] depending on application), this parameter varies mainly between 0 (near the hub/shroud) and ~10 mm in two distinct regions, which are determined by vortex source formations occurring in the hub and rotor blade tip area.
As identified in the literature, there must be a correlation between Λ and λ, so several recommendations have been considered. Among these (experimentally validated) recommendations are those in Table 1.
If we consider most of the sources that also present experimental data, we observe that the optimal geometry should have a pitch (λ) 4 times larger than Λ. At the same time, the amplitude of the serration cannot be, however, large either. It has been found that amplitudes above 10% of the chord do not bring major acoustic benefits and aerodynamically tend to disturb the flow. In this regard, a serration respecting the incidence of the reference is desired for the blade geometry tested, a pitch correlated with turbulence keeping (ideally) in section (in radial direction) the chord length of the original profile.
As identified in the literature, the transition from a straight leading edge vane to a twisted one with variable pitch and sinusoidal serration is quite complicated. The vane could have several approaches, but the most correct one must also take into account, to a large extent, the streamlines so that serrations do not represent an obstacle for the fluid. A (parametric) study in this direction can be identified in [13] where a few parametric combinations were used, such as constant pitch and amplitude serration, variable pitch while keeping the amplitude constant, and amplitude placement on the leading edge depending on the Λ value. The no-action areas (leading edge locations where either very high amplitude serrations can lead to significant aerodynamic penalties or structural strength problems) resulted from the quantitative analysis of acoustic benefits versus aerodynamic penalties (Figure 4).
In order to determine the parameters of the model, it was necessary to run a series of numerical simulations. For the setup without a turbulence grid, a structured mesh was used near the wall (convergent path) and an unstructured one was used in the larger domain, as can be seen in Figure 5. The turbulence model used is the SST (Shear Stress Transport) implemented in Ansys CFX. Figure 5 shows the meshes for the simulation without the turbulent grid. An inlet was prescribed with a bulk velocity of Ub = 13.46 m/s; constant turbulent kinetic energy was obtained using a medium turbulent intensity TI = 5% and a total inlet temperature of 293 K with zero pressure gradient. The same settings were used for the turbulence grid cases. As mentioned by Alkhalifa et al. [8], the governing equations that the solver addresses are the following:
The conservation of mass
ρ t + ρ v r = 0
And the conservation of momentum
ρ v t + ρ v r   v + ρ ω a ^ × v v t   = p + · τ
where v t , v , ω , τ and a ^ define the transitional velocity, absolute velocity, angular velocity, viscous stress, and axis of rotation.
For a non-stationary problem such as that of the noise radiated by the dipole source, one can use the FW-H equation, an extension of Lighthill’s acoustic analogy, which for a point in the far-field, the acoustic pressure can be written (according to Barakat et al. [5]):
p x i , t = x i y j 4 π r 2 c 0 1 M r 2 F i t + F i 1 M r F i t τ
where M r = x i y j r v i c 0 , in which x is the observer location, y is the source location, r is the distance between the noise and the observer, and Fi is the force acting on fluid (from the flow analysis). Also, Polacsek et al. [13] mention a correction to be made for the FWH model in the case of propagation in a tube. For a serrated blade in a turbulent flow, Fischer et al. [9] propose a formula for the far-field sound pressure (at the observer position) as a function of the convective wavenumber, spanwise wavenumber, radiation function and convection velocity. A similar formulation for the (FW-H) equation is proposed by Lau [14].
The process of determining grid sizes is iterative, starting from values identified in the literature (at least for the size order). Two grid placement areas were also chosen—one at 75 mm from the coupling area with the convergent path and another at 200 mm from the inlet—to highlight whether or not turbulent phenomena dissipate over the total length of ~600 mm between the inlet and outlet. In the following, the grids used will be referred to by an order number, and all dimensions used will be tabulated. Grids were modeled using tetrahedrons, since it is tricky to apply a structured mesh blocking on the whole geometry. Small size elements when coupled with low velocity in that area can capture developing large vortices. The analysis started with an unstructured mesh numerical simulation (RANS) using the k-ε model, the number of elements being higher in the wall proximity as well as the grid to capture any detachment. Figure 6 shows the mesh. Its value depends on the turbulence model, and for the following simulations, the Menter [45] SST (“Shear Stress Transport”) model implemented in Ansys CFX was chosen (with total energy heat transfer). The computational grid is structured on the inner walls of the convergent channel and unstructured in the rest of the domain. As convergence criteria, the stabilization of the mass flow rates (in and out) as well as of the solver residuals was monitored.

2.3. Manufacturing

Since the numerical results are satisfactory, the design and manufacture of the setup proceeded. Three-dimensional (3D) printing with a more rugged PLA (rPLA [46]) was used, for which the ultimate tensile strength is 110 MPa, as shown in Figure 7. The printer used is a Creality NEO V3 with maximum printing dimensions of 220 mm × 220 mm × 250 mm. The flow sections were divided into long sections that were a maximum of 220 mm (as in Figure 1 and Figure 2), each section in turn consisting of 1, 2 or 4 components that are assembled using screws.
In addition to the convergent path components (Figure 8), three grid variants were printed for bench testing. These three variants will be positioned in several areas both between the coupling ring with the hose and between the first sections of the flow section. Since at the first position, the grid size is close to a ϕ 305 mm, it had to be “broken” into 4 pieces (Figure 8), which will later be glued and secured with wire.
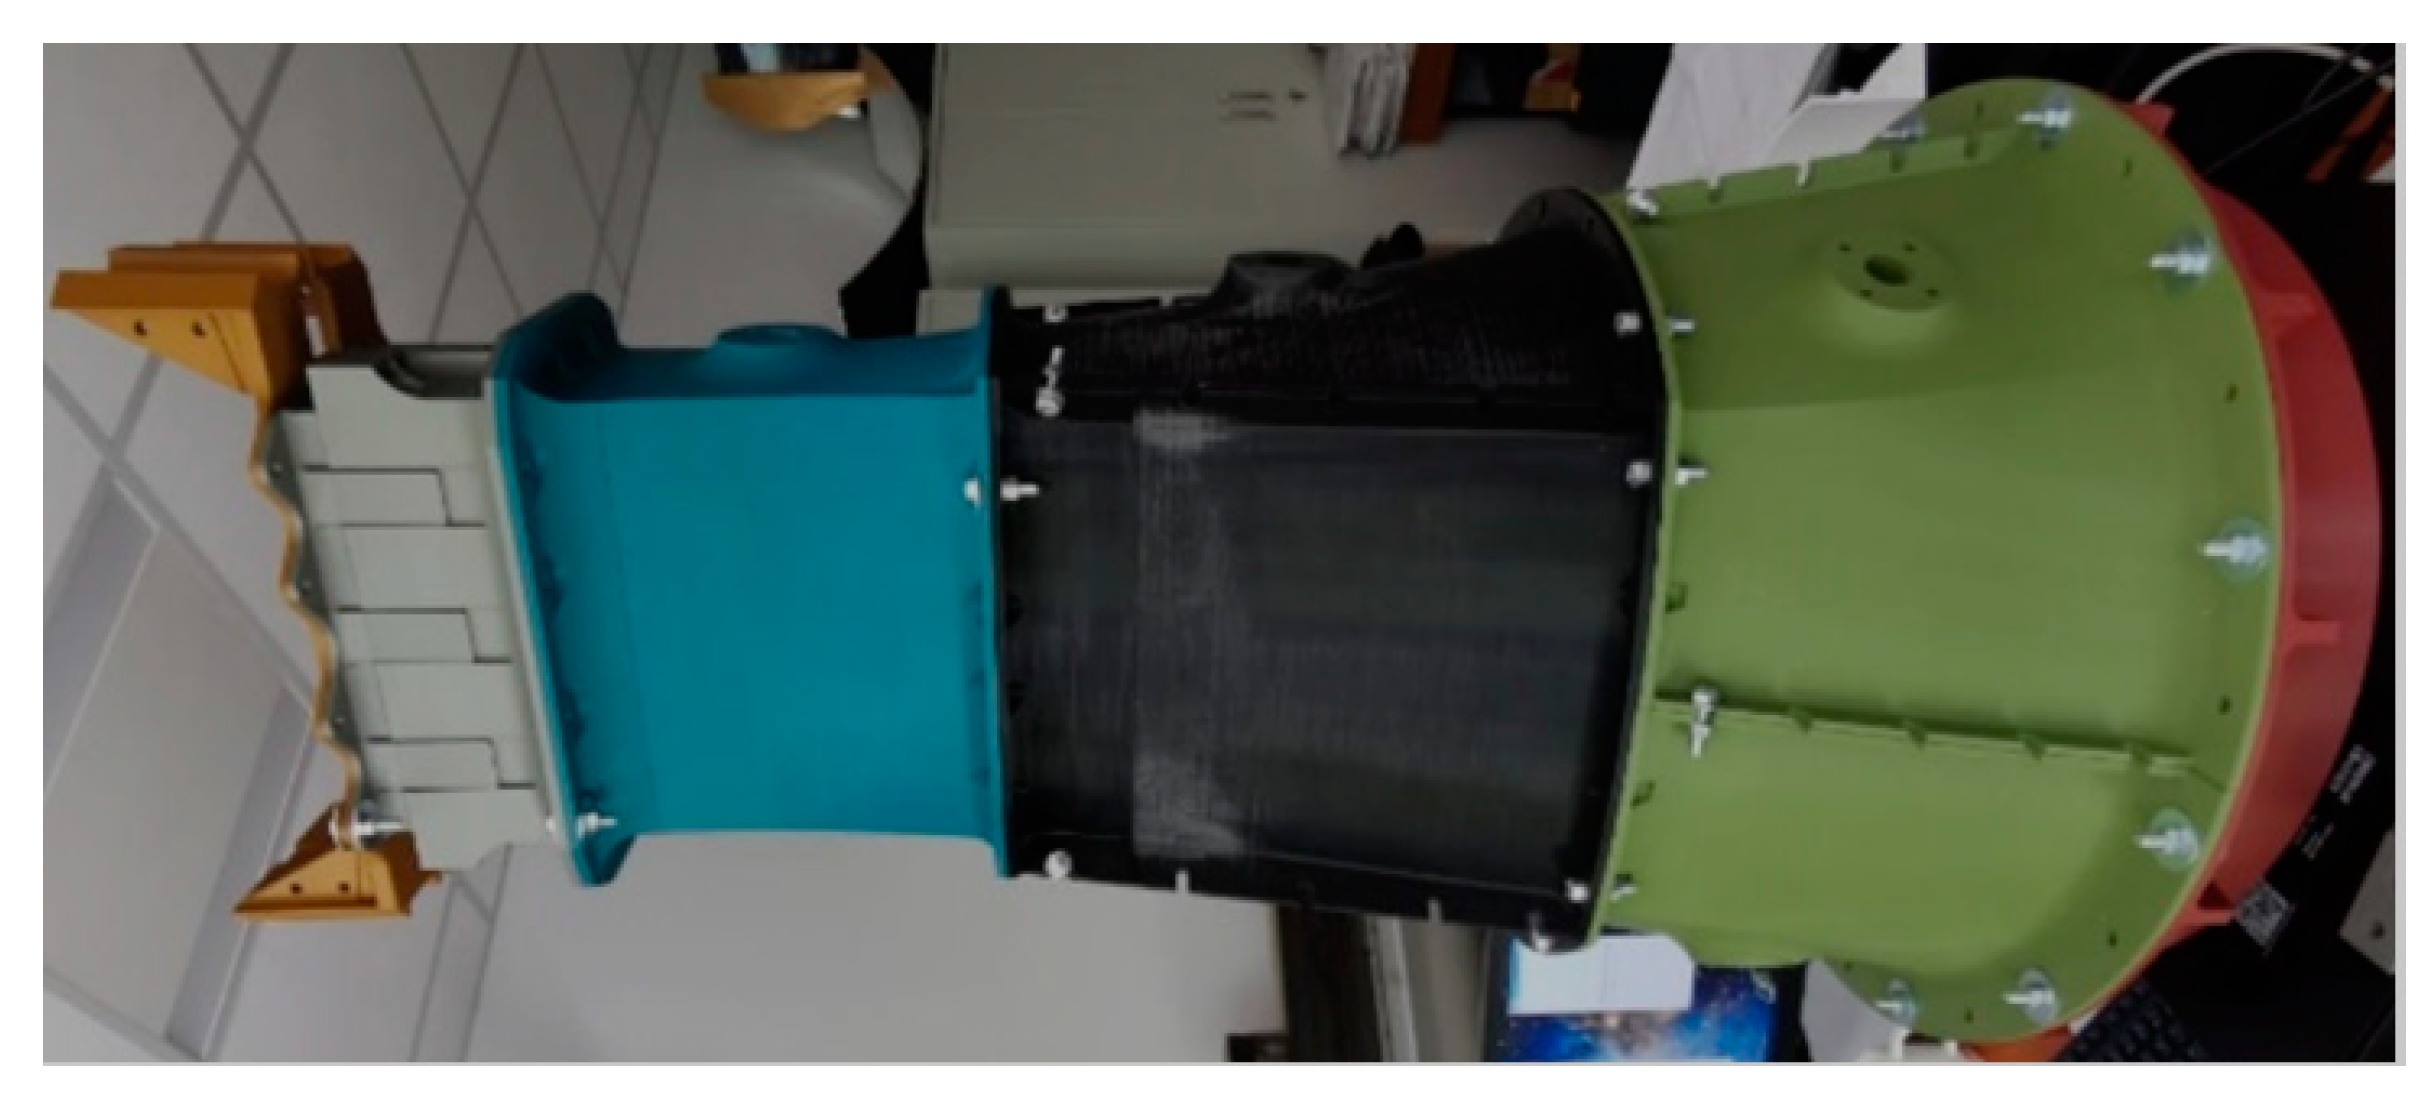
In Figure 9, assembly of the parts forming the flow section is presented.

2.4. Experimental Test Bench

The starting point was the existing air source in the anechoic chamber (designed according to ISO 3745 [47] requirements, with a volume of 1200 m3, 15 × 10 × 8 m and with a wall absorption coefficient of 99%, in a frequency range of 150 Hz up to 20,000 Hz) of the COMOTI Acoustics Department (Măgurele, Romania) [48]. The air source (a 7.5 kW SODECA CA-172-2T-10 IE3 centrifugal fan) can reach 9800 Pa and a flow velocity of up to 100 m/s, which is attached to a similar section (with an outlet section of 0.14 m × 0.047 m). By simple scaling, taking into account that one or more vanes should be placed in the exit section (in different orientations), the test section was chosen to have a width of 0.15 m and a height of 0.075 m. With the outlet section established and knowing the air parameters (in the 305 mm diameter inlet section to minimize losses proportional to the velocity squared), the only remaining task is to determine the design of the convergent passage between the two sections.
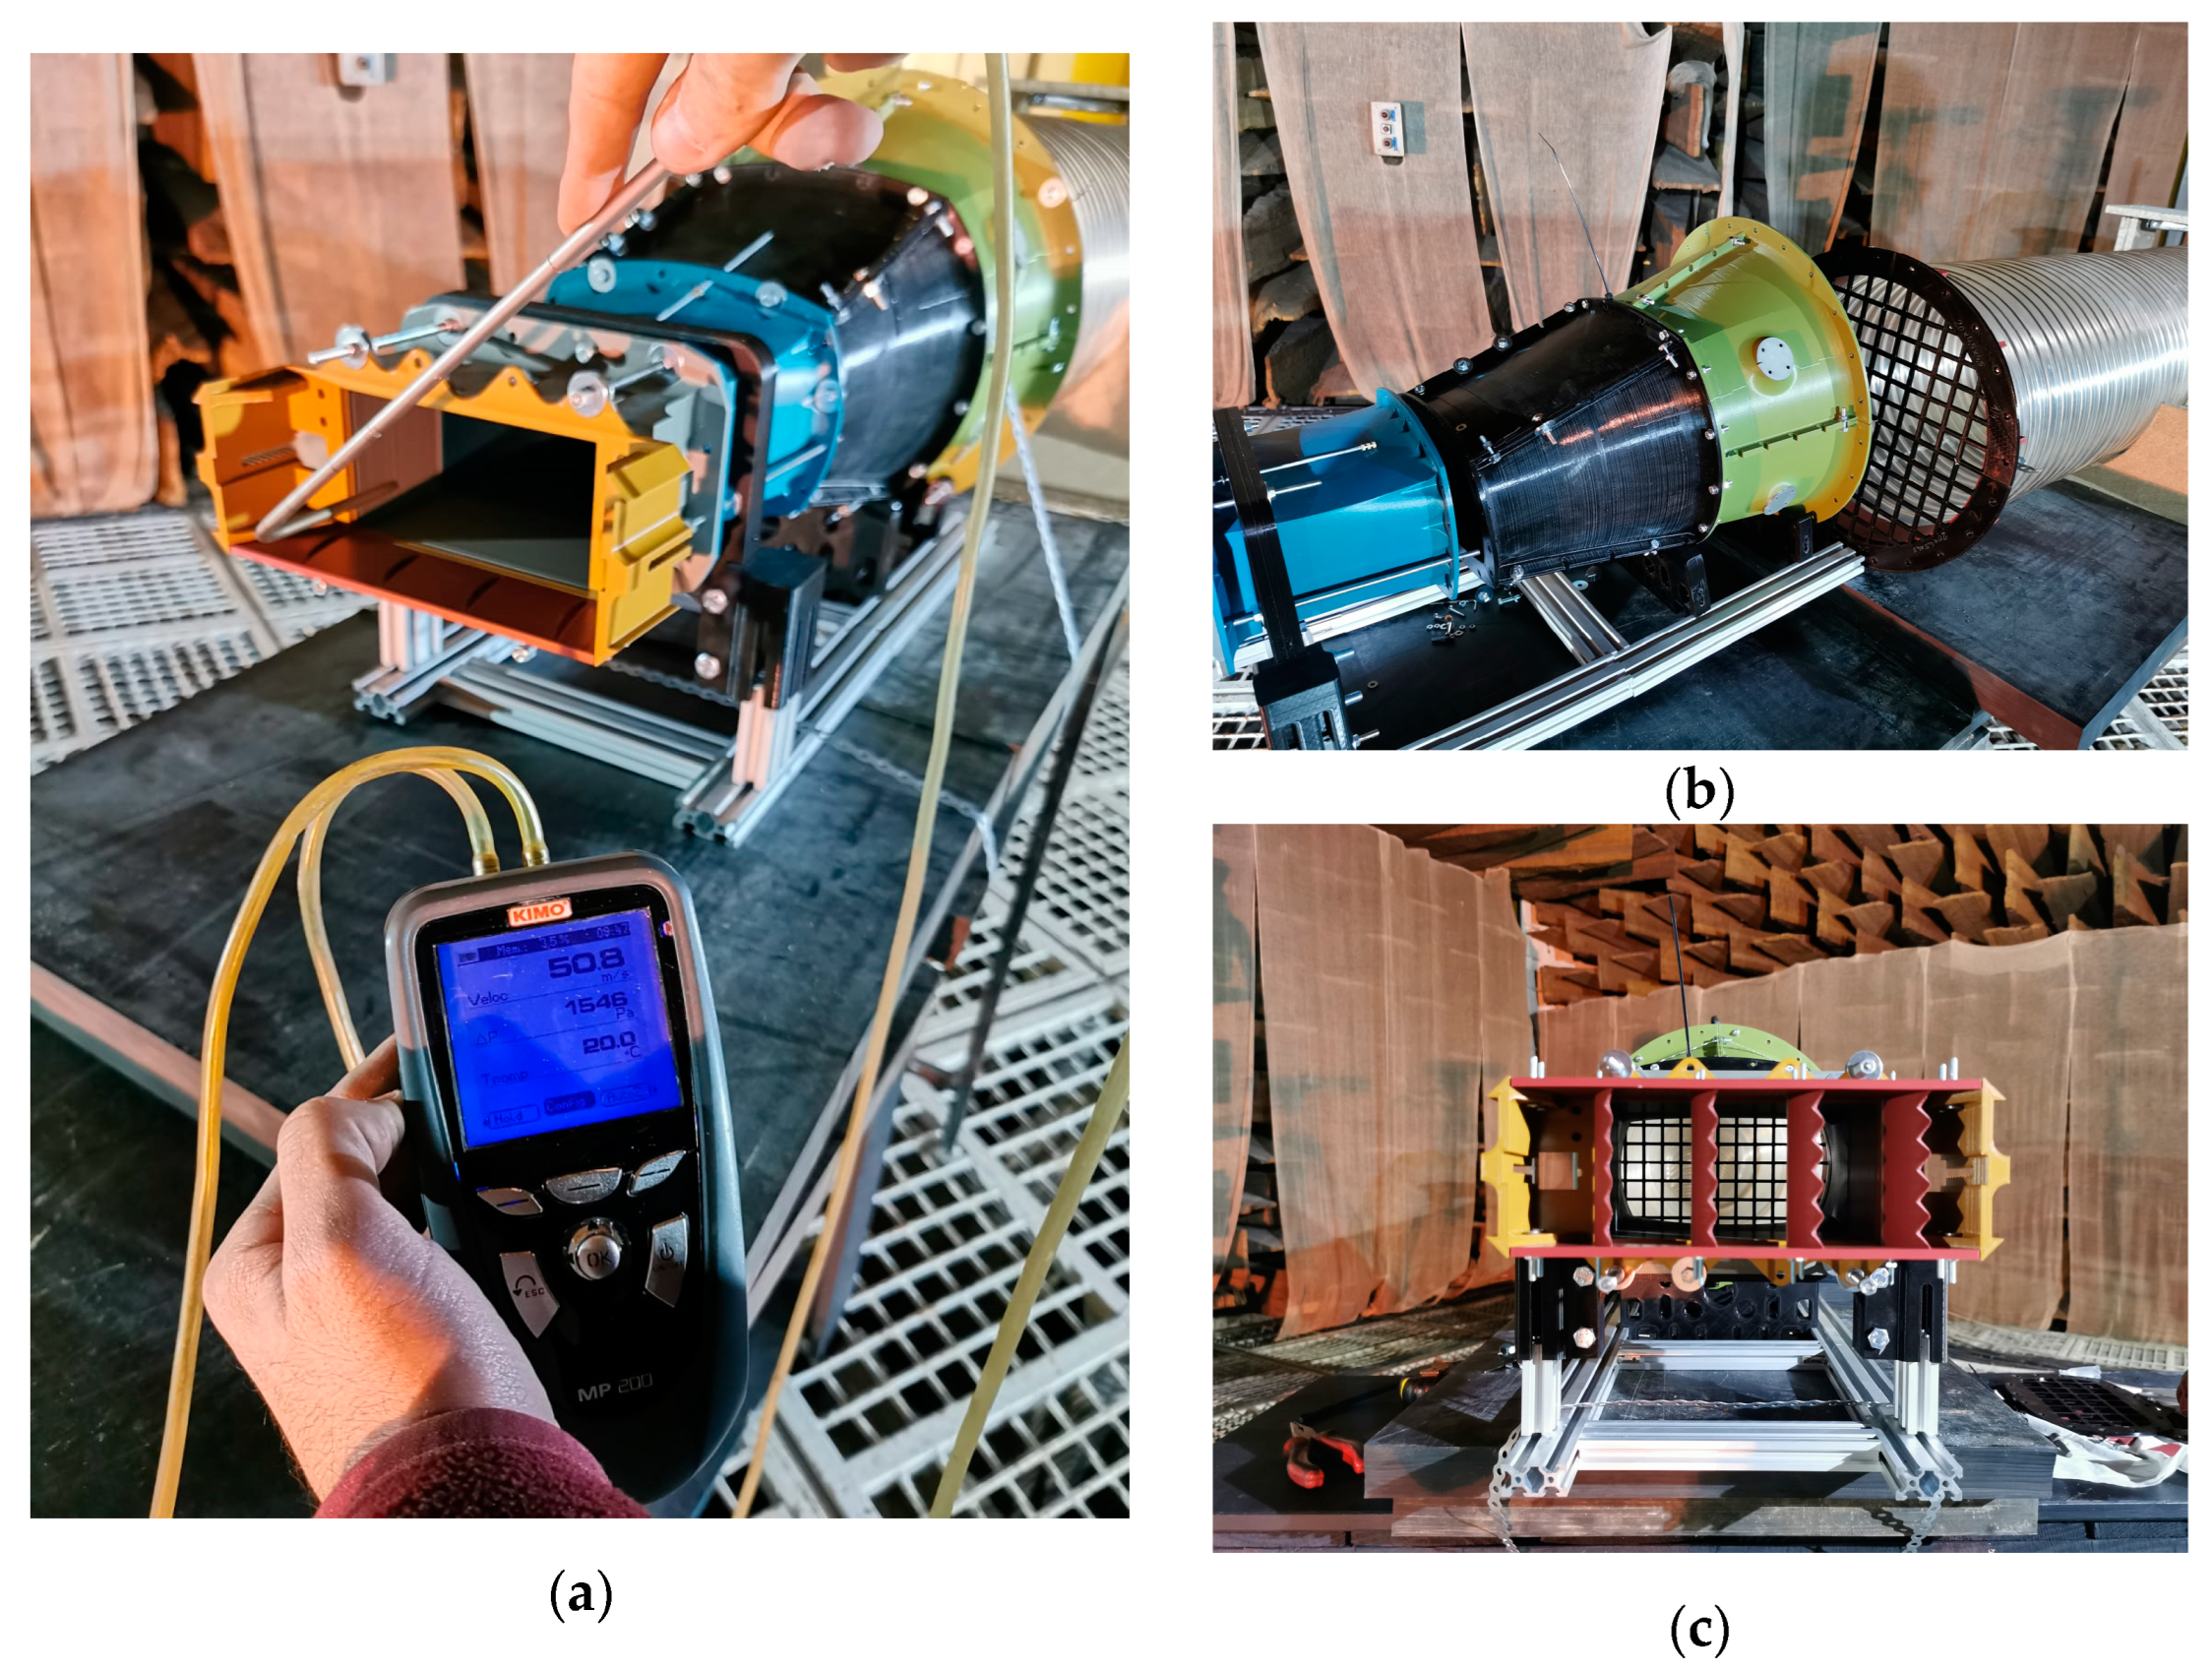
A minimum of 2 instrumentation ports were placed on each section to accommodate pressure/temperature probes. In the outlet area of the nozzle, surfaces have been provided on which force transducers can be mounted so that the force resulting from the lift and drag (flow and perpendicular to it) can be measured. Figure 10 shows the design and instrumentation of the experimental test bench.

3. Results

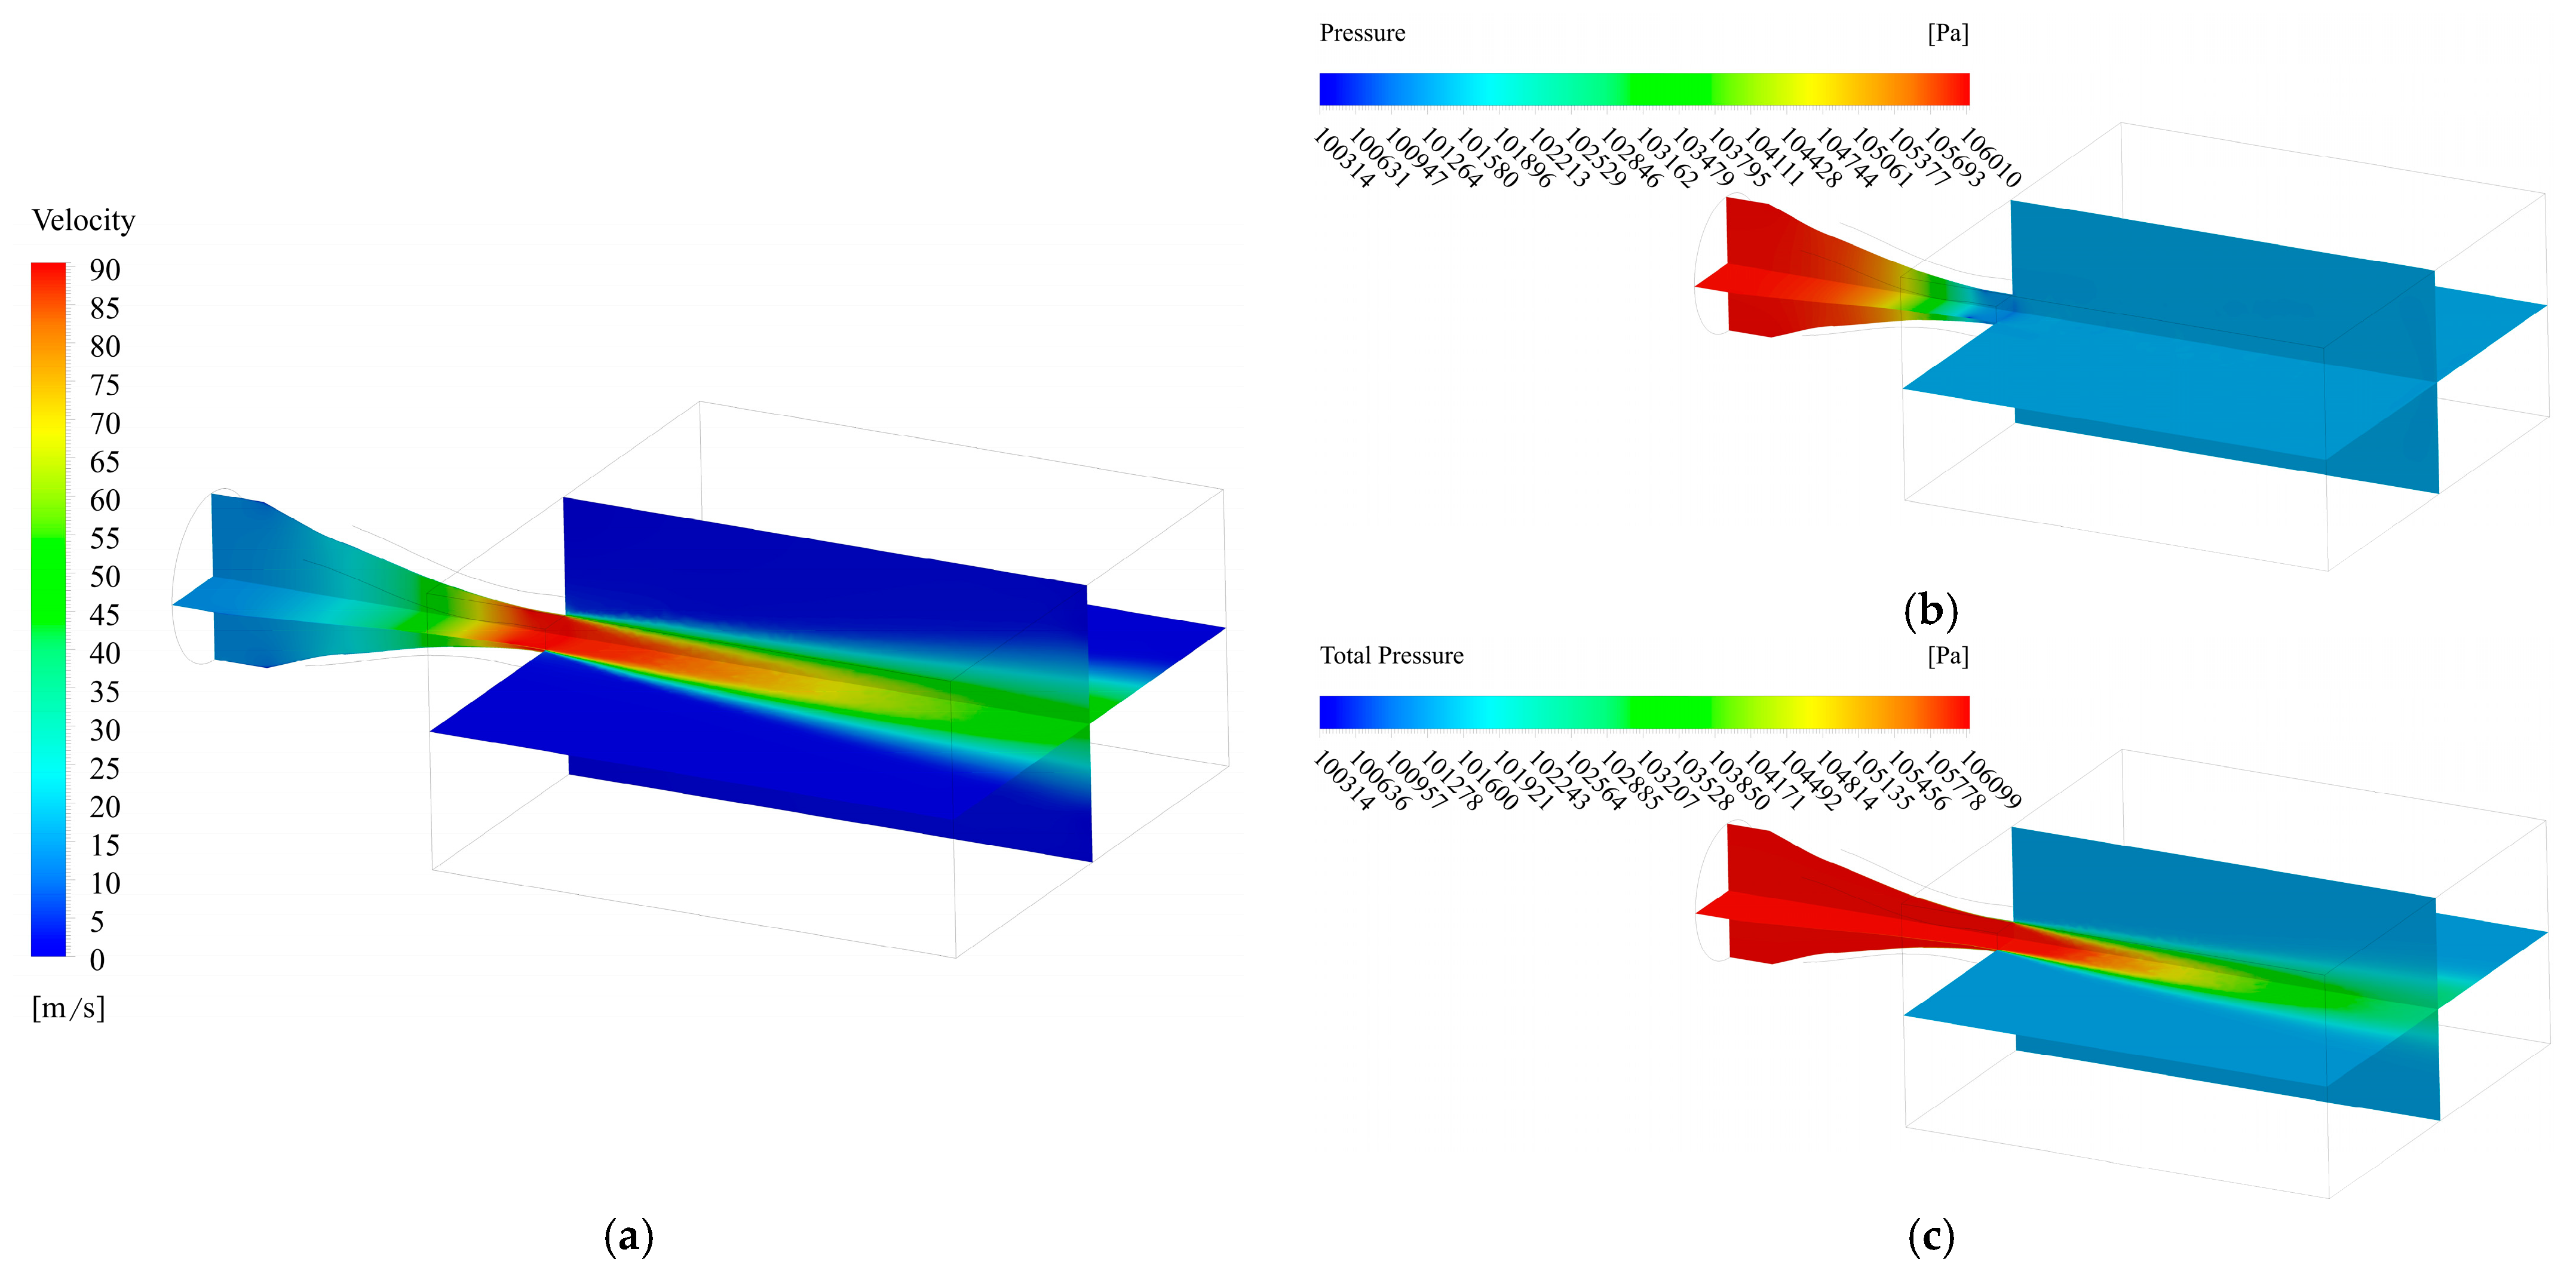
Following the numerical simulations, Figure 11 shows the variation in the main parameters along the simulated domain (initially without turbulence grid, as in Figure 5, to have a baseline for the convergent nozzle).
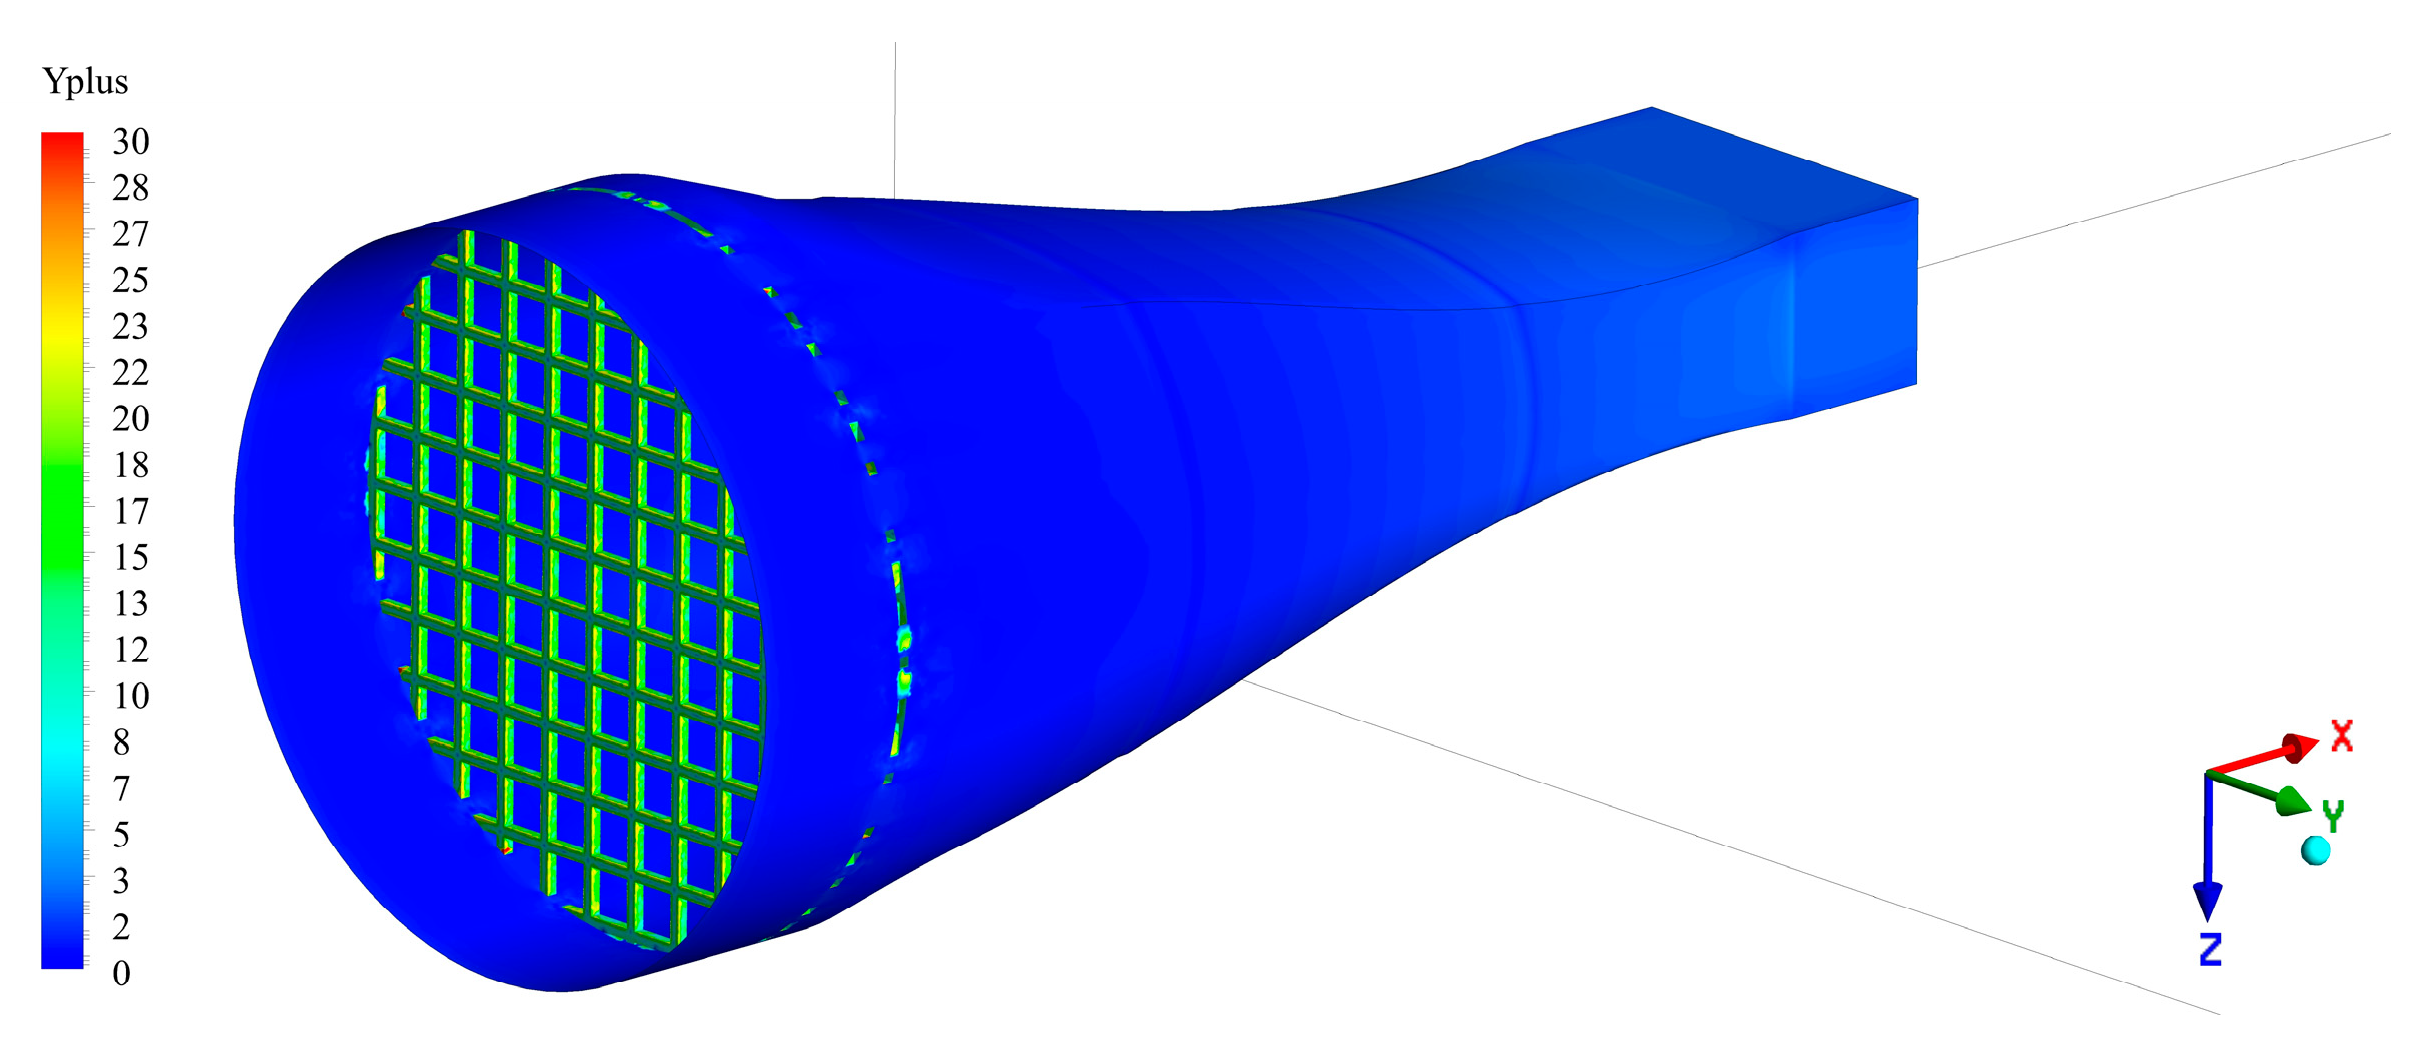
In order to validate the accuracy of the numerical simulations, the variation in y+ has to be checked over the whole simulated domain (especially on grid configuration, Figure 6), and its distribution over the convergent area is shown in Figure 12.
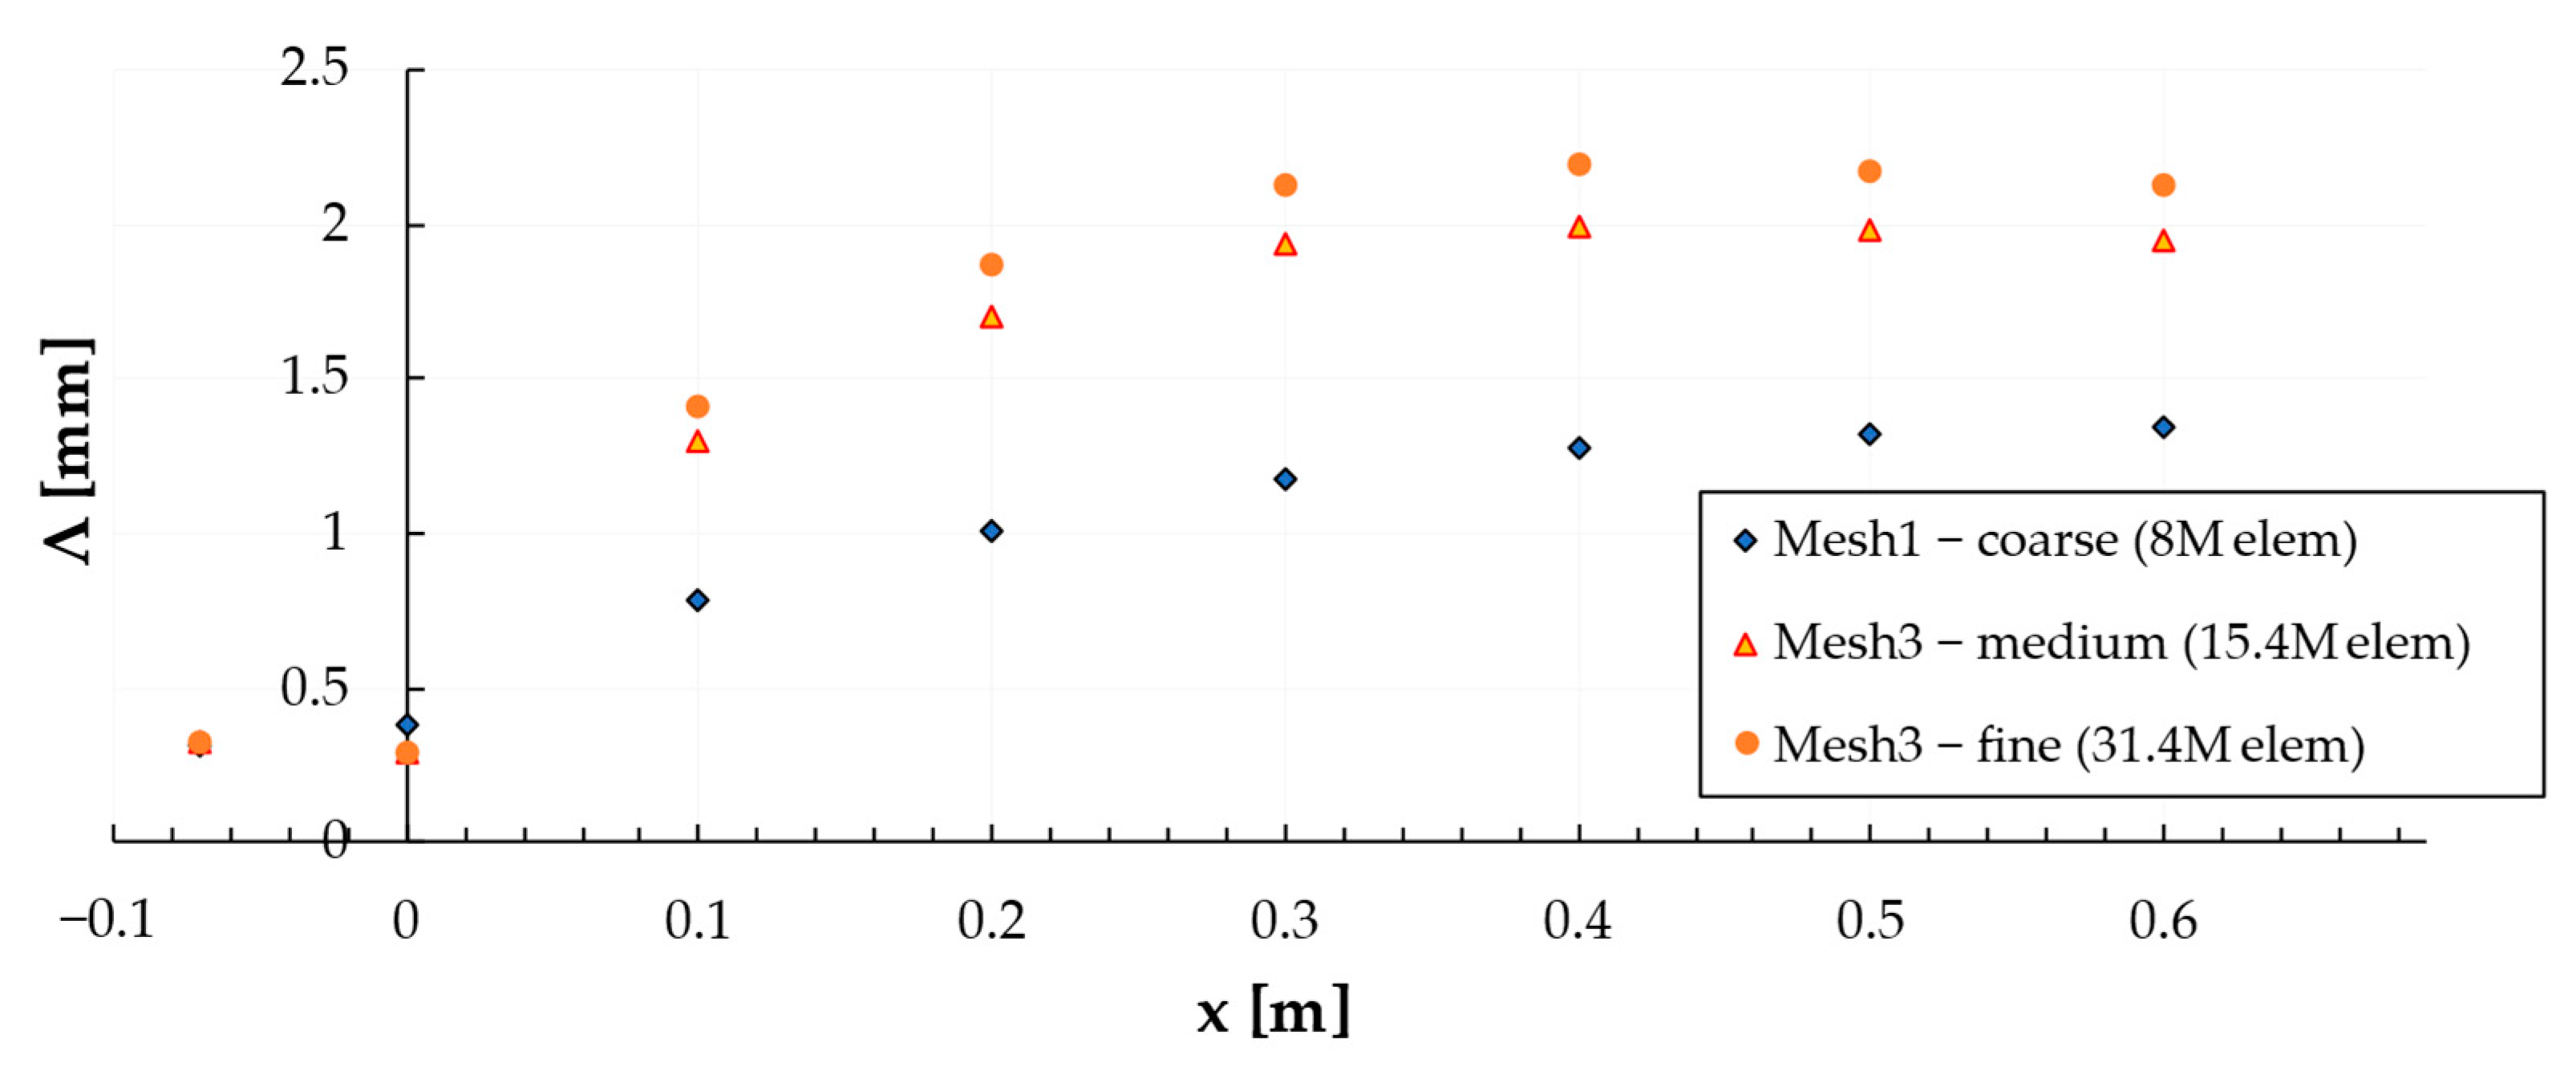
It can be observed that the y+ value falls below 30 as is desirable for the SST model [8,49]. A grid sensitivity analysis (Figure 13) was carried out under these conditions (the first layer height was kept). It was observed that Grid 1 placed at position 1 (75 mm) and subsequently at position 2 (200 mm) has a very small influence on the parameter Λ on the outlet section. It should be noted that similar to the case with 13.7 m/s on the inlet and 85 m/s on the nozzle outlet, for an inlet velocity of 7.8 m/s, 50 m/s is obtained in the exit section (placing the grid at position 1), and the value of Λ is ~2.3 mm.
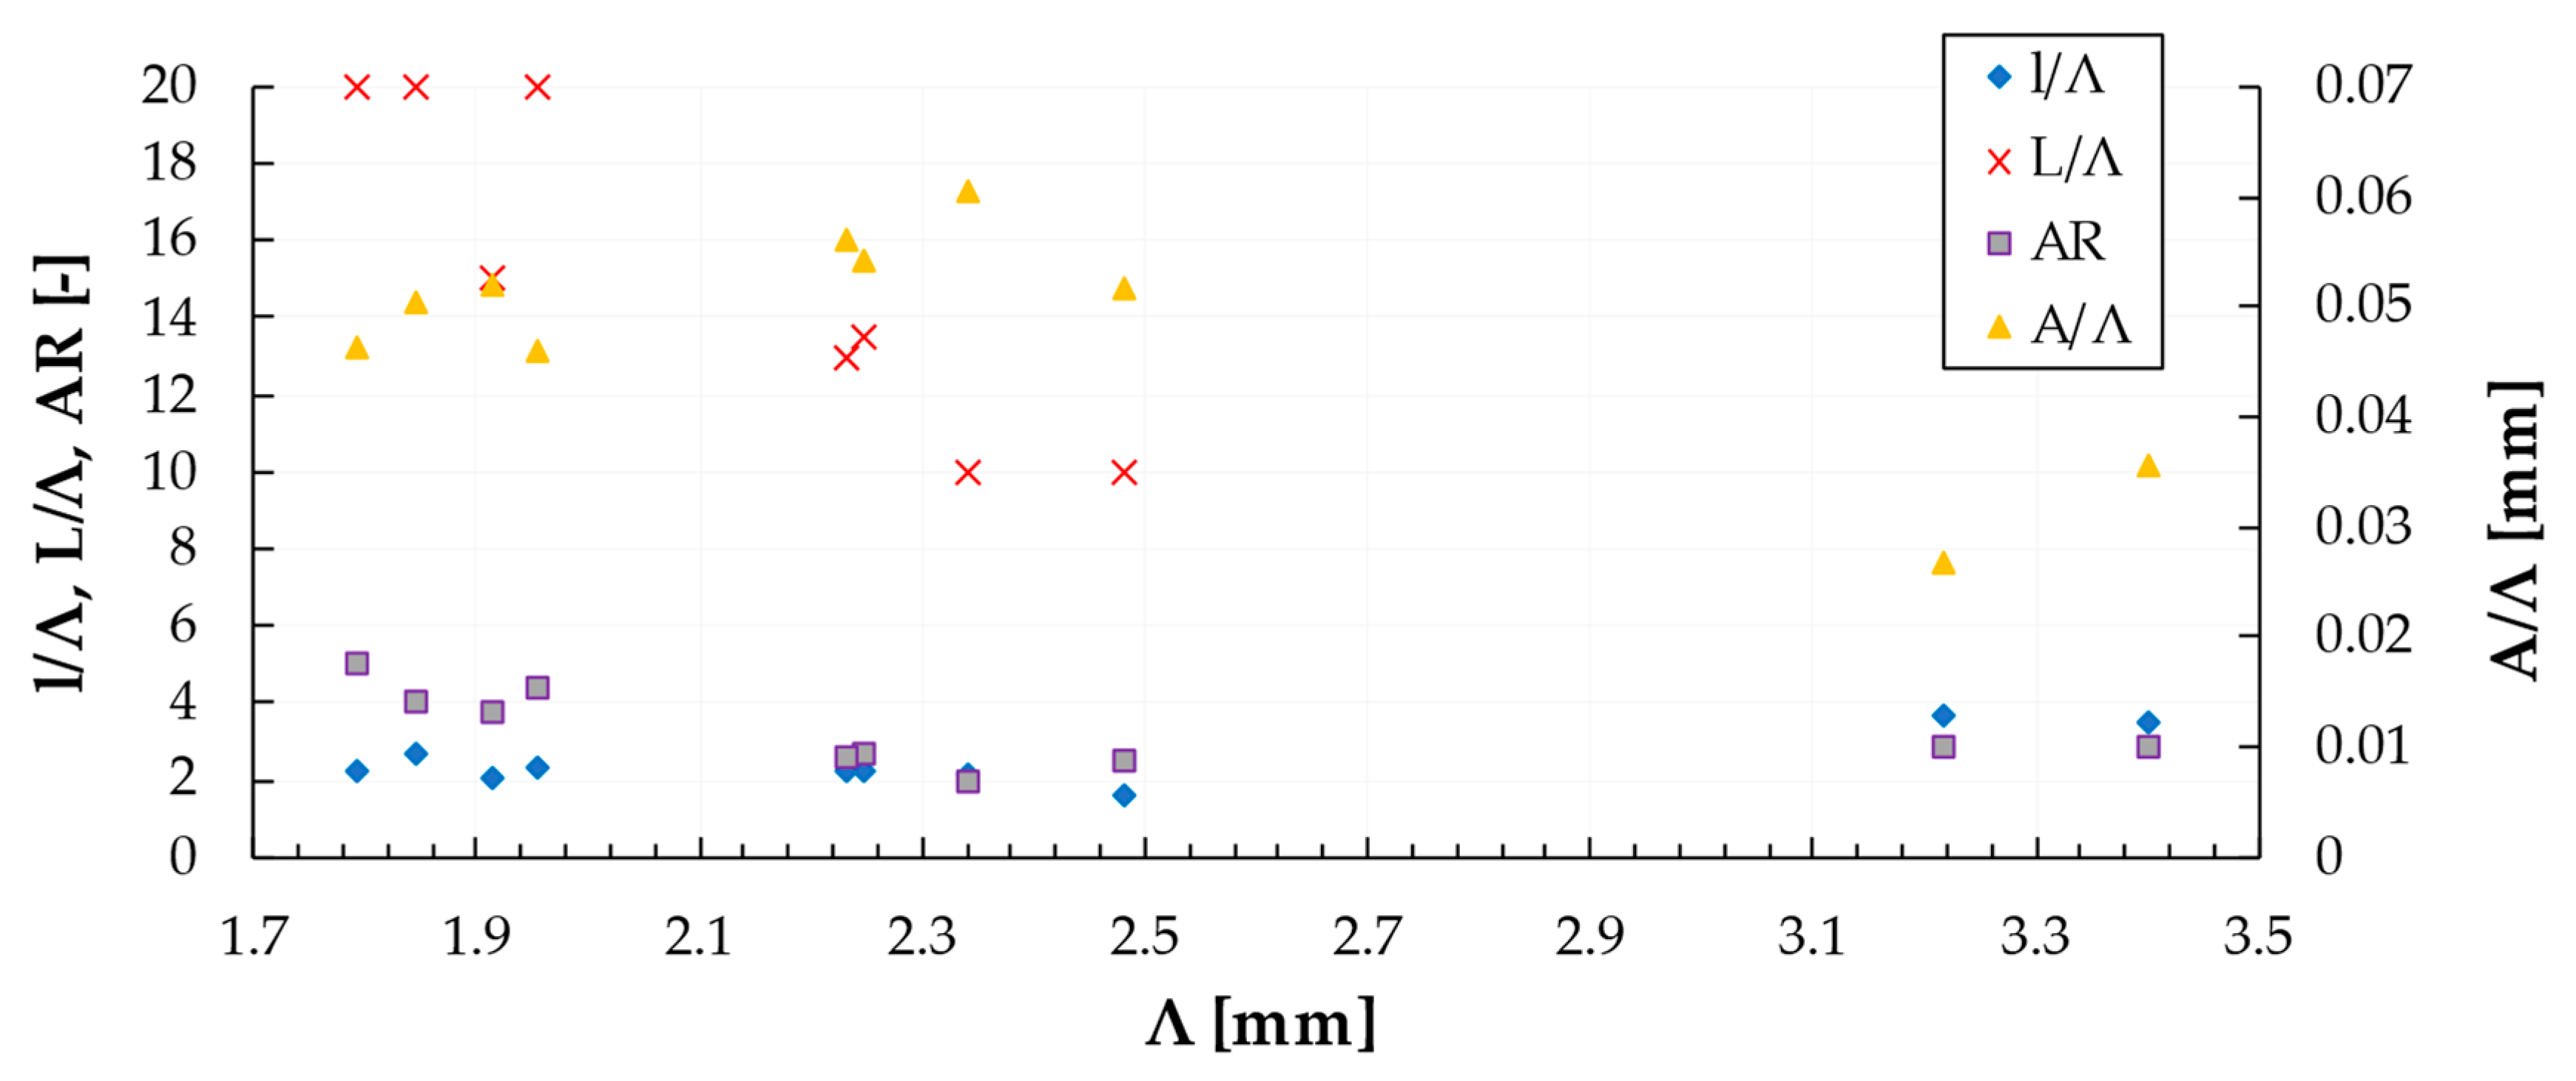
The differences between the results obtained with Mesh 2 and Mesh 3 are minimal, and considering that Mesh 3 has almost twice the number of elements compared to Mesh 2, it was decided to run the simulations with the medium size (Mesh 2) to shorten the calculation time. Preliminary simulations have shown that when placing the same grid on the first and the second position (125 mm downstream), no major differences in TLS are observed. Table 2 shows all the iterations required finding an optimal configuration. The grid thickness was varied, and finally its position was fixed at 75 mm, the uniformity of the flow parameters being good enough (and less abrupt) this way. Other parameters such as the l/Λ, L/Λ, AR and A/Λ ratios that have been identified in the literature were also taken into account (Figure 14).
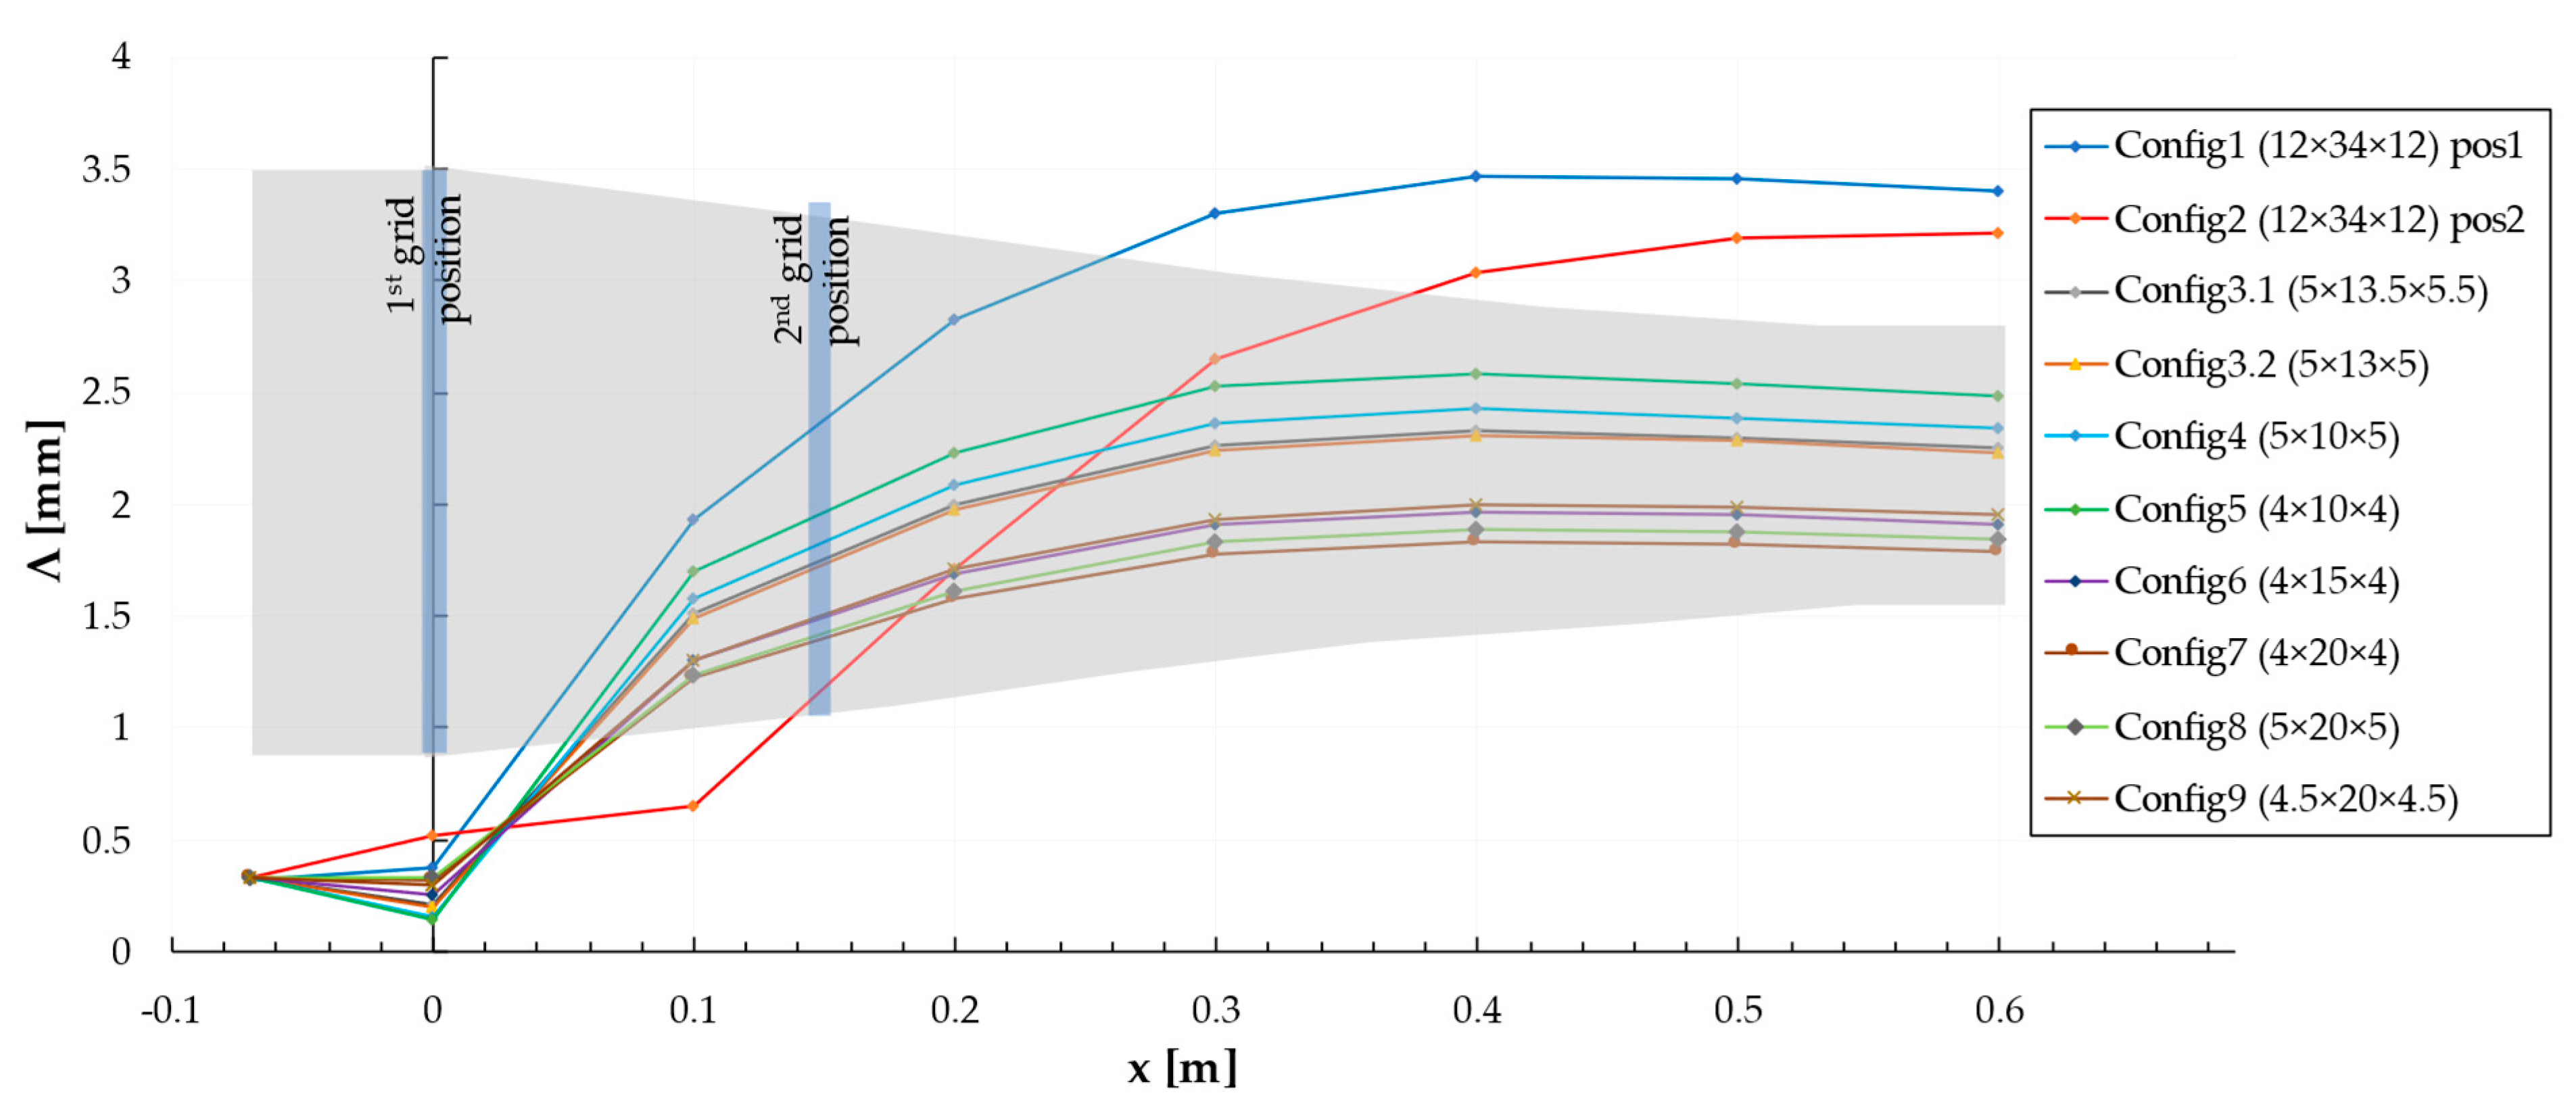
As far as the variation in Λ along the channel is concerned, several combinations that can be used are shown in Figure 15, the closest to the required value being given by configuration 9.
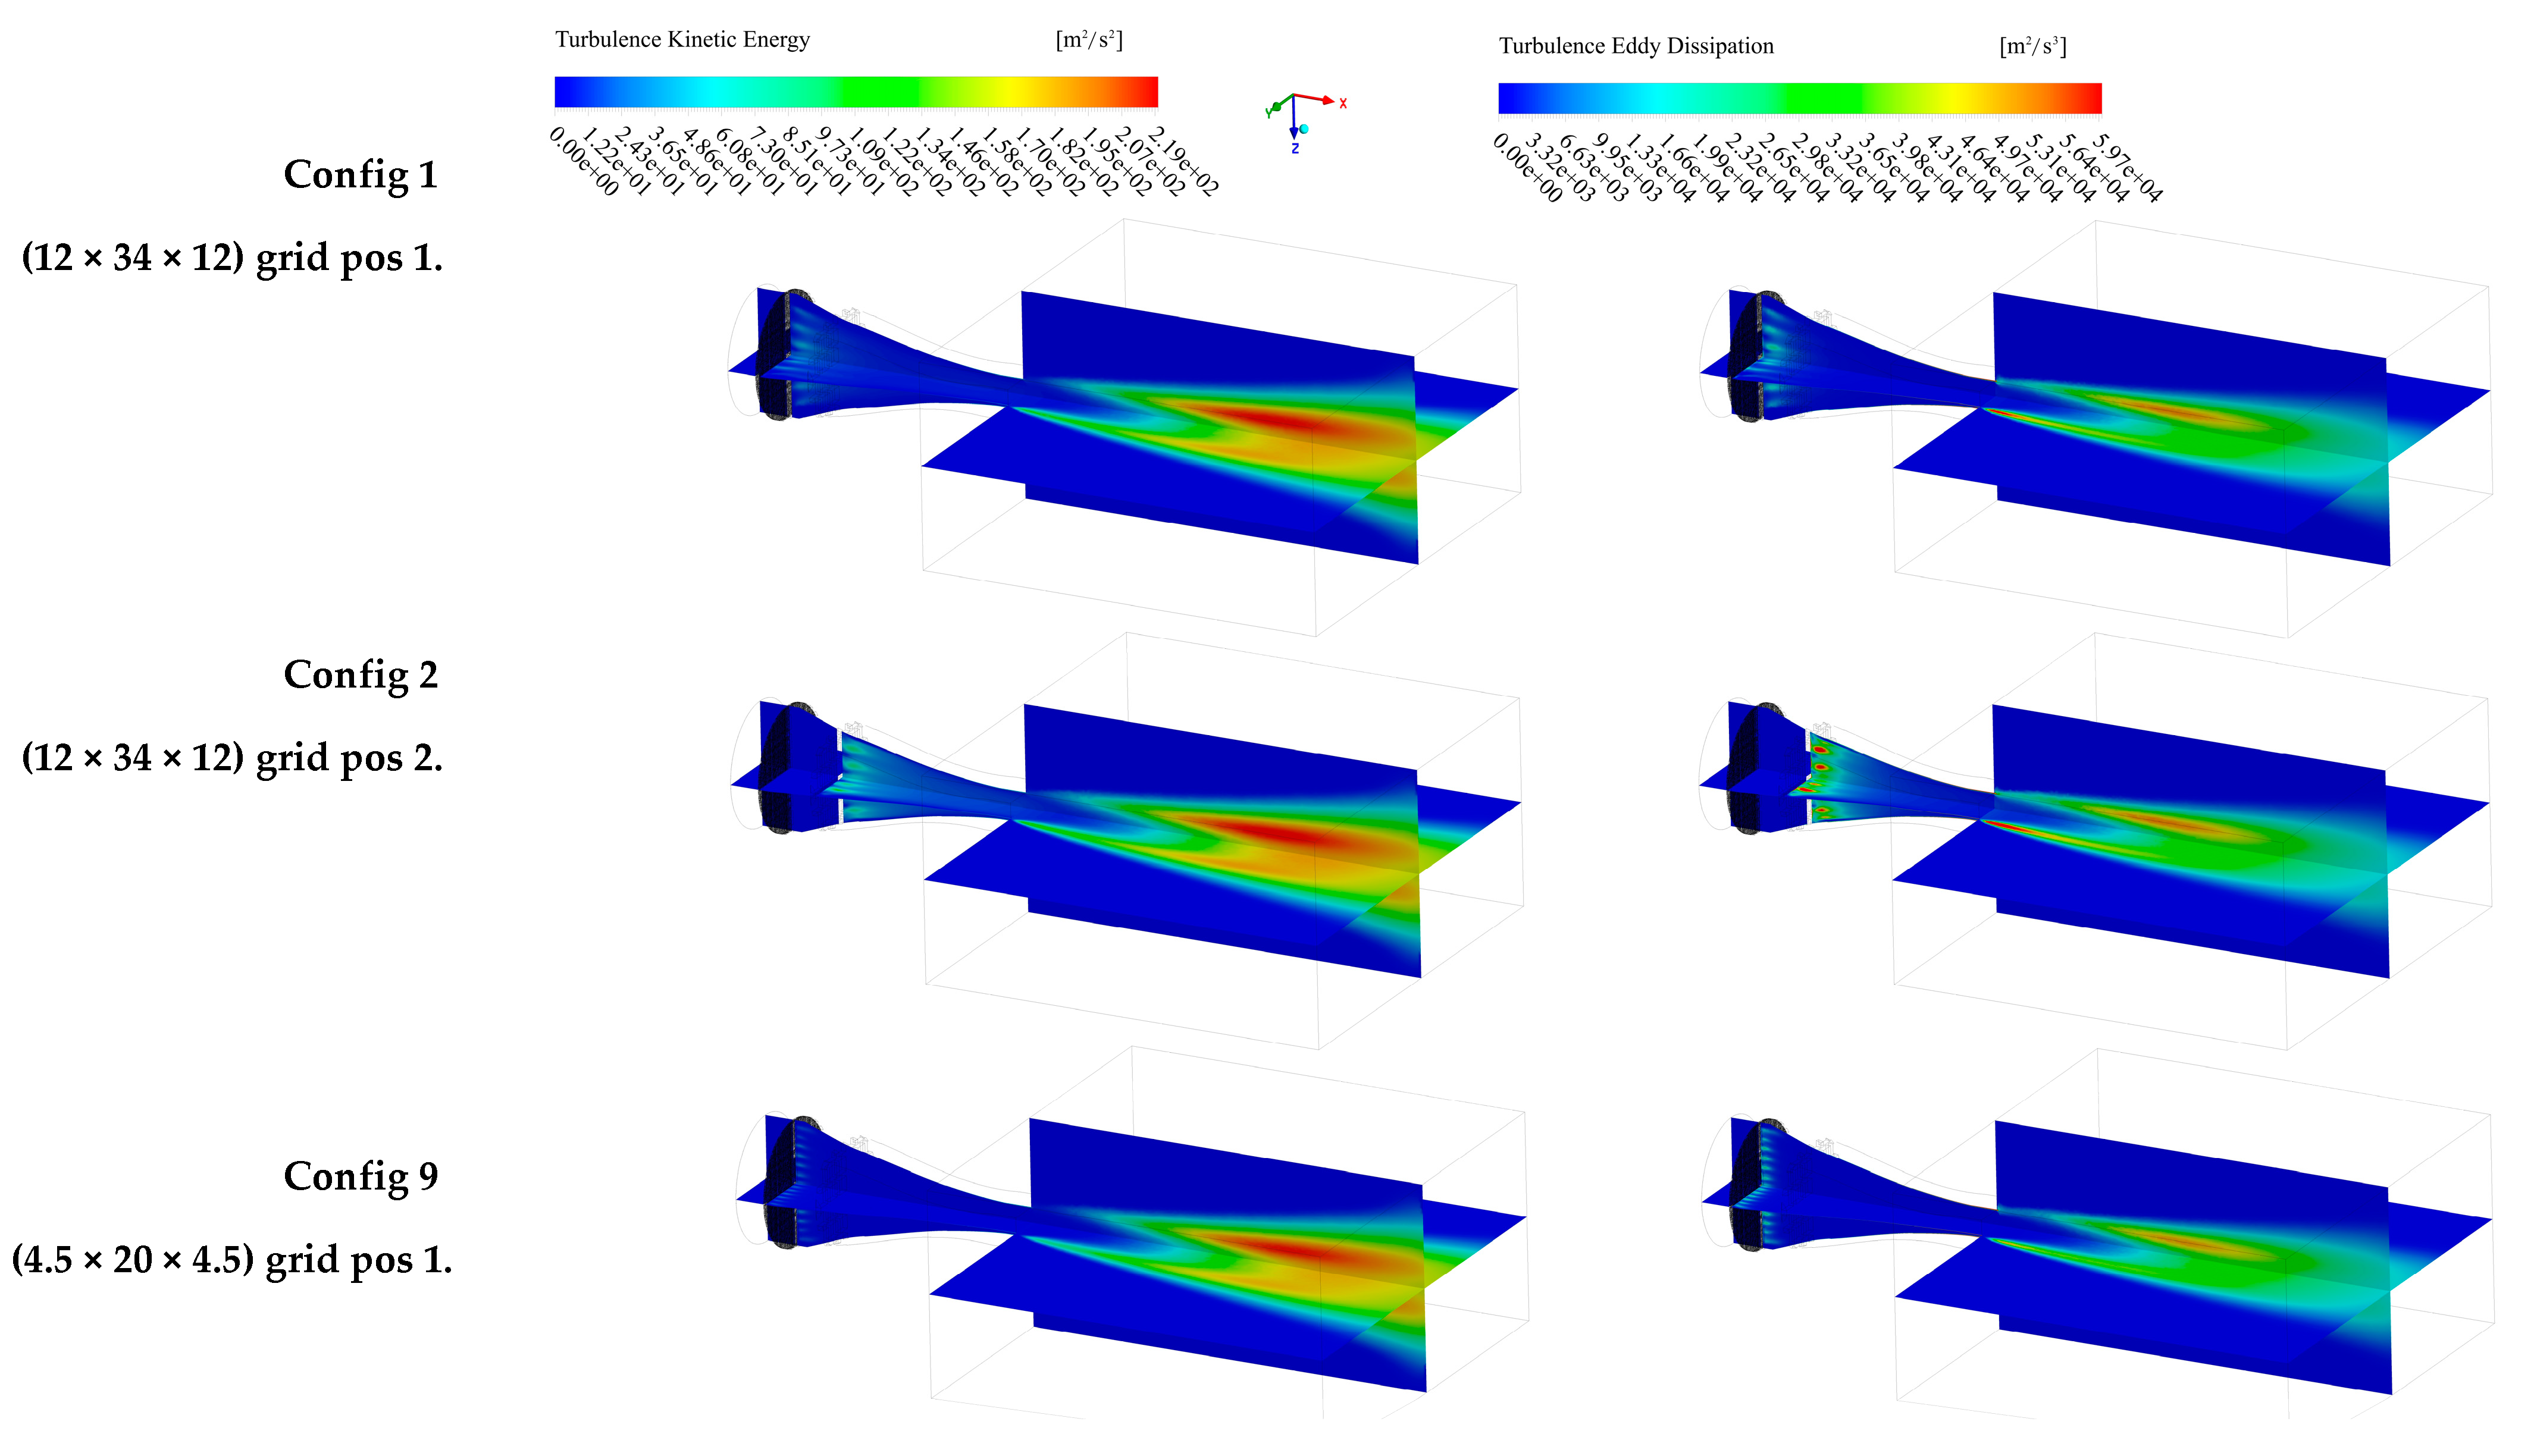
An important aspect, in addition to the Λ values averaged in the outlet section, is the velocity/pressure variation along the channel. The passage used (from inlet to outlet) being one with a relatively small slope, it did not imply the occurrence of large jumps in the flow area, so the thermodynamic parameters varied relatively uniformly. The vortices introduced by the grids pulse locally, and the detachments are slightly dissipated in the fluid mass, the convergent zone also contributing to the uniformity. Figure 16 shows the parameters associated with the turbulence-producing mechanism, TKE and TED.
Regarding the roughness of the 3D-printed parts, which can significantly affect the flow under certain conditions, the average roughness values obtained are as follows: 11.1 μm for the front area of the grids, 14.3 μm for the side faces (grid openings), and 14.6 μm for the inner surfaces of the flow channel. These measurements were taken using a MarSurf PS10 roughness meter. To minimize aerodynamic impacts, the surfaces can be further refined; otherwise, a suitable friction coefficient should be applied in numerical analyses [50,51,52].
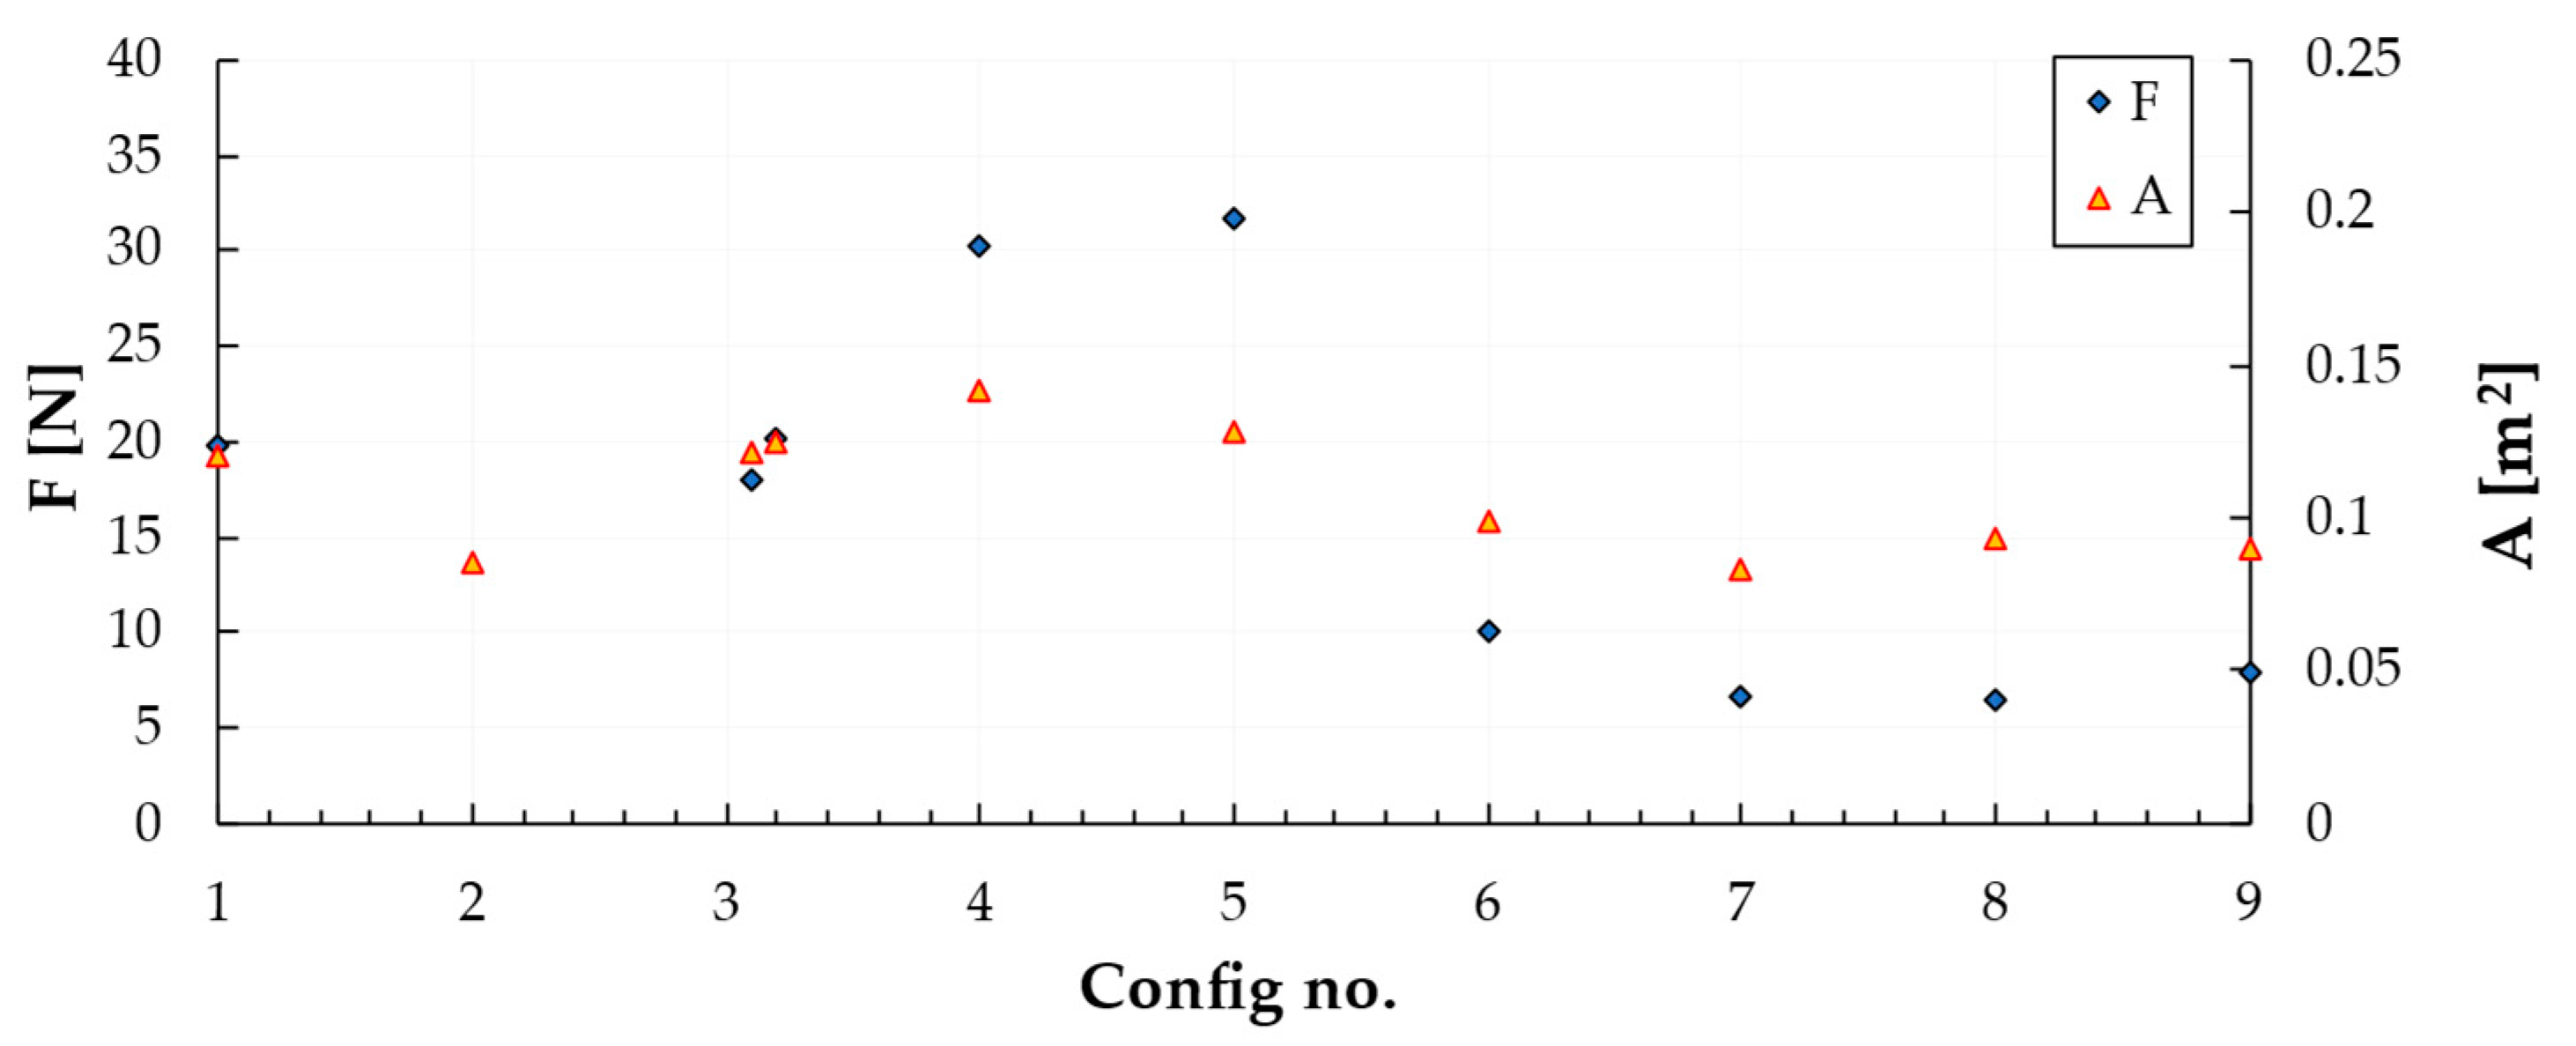
Before conducting any tests, a preliminary strength check of the assembly is recommended. While the pressure does not pose an issue for the walls (which have a total thickness of 6 mm, with 1.2 mm for interior–exterior walls and 30% infill), the same check is needed for the 4.5 mm thick grid with the same internal structure. Numerical simulations were used to estimate the force that would act on the grid when placed in the airflow at the first position (see Figure 17). It was concluded that the configuration is safe for testing at speeds up to 85 m/s.
As preliminary verification tests, we aimed first of all to capture the noise resulting from the placement of the grid in flow. The spectra plotted in Figure 18 capture exactly this, at most in the frequency range 1.5–20 kHz. Two positions of the same previously chosen grid 9 were tried, the best being placed close to the outlet. A best fit for the von Kármán energy spectrum (Equation (6)) was also considered, obtaining a −5/3 slope in the frequency range of interest for general gas turbine engine applications (1–3 kHz, which corresponds to the 1st BPF).
E k = 55 9 π Γ 5 6 u 2 ¯ Γ 1 3 k e k k e 4 1 + k k e 2 17 6
where k is the magnitude of the vector wavenumber, Γ   is the Gamma function and k e = π Λ f Γ 5 6 Γ 1 3 is the wavenumber scale of the largest eddies. The 1D power spectral density of velocity fluctuations ( Φ u u ) and the correlation length ( l r ), as mentioned by Jaron et al. [15] and proposed by Amiet, is
Φ u u f ~ = u 2 ¯ 2 λ W 0 1 + 8 / 3 z 2 1 + z 2 11 / 6
l r f ~ = 8 λ 3 Γ 1 / 3 Γ 5 / 6 2 z 2 1 + z 2 3 + 8 z 2
where z is the reduced frequency as a function of the Strouhal number.
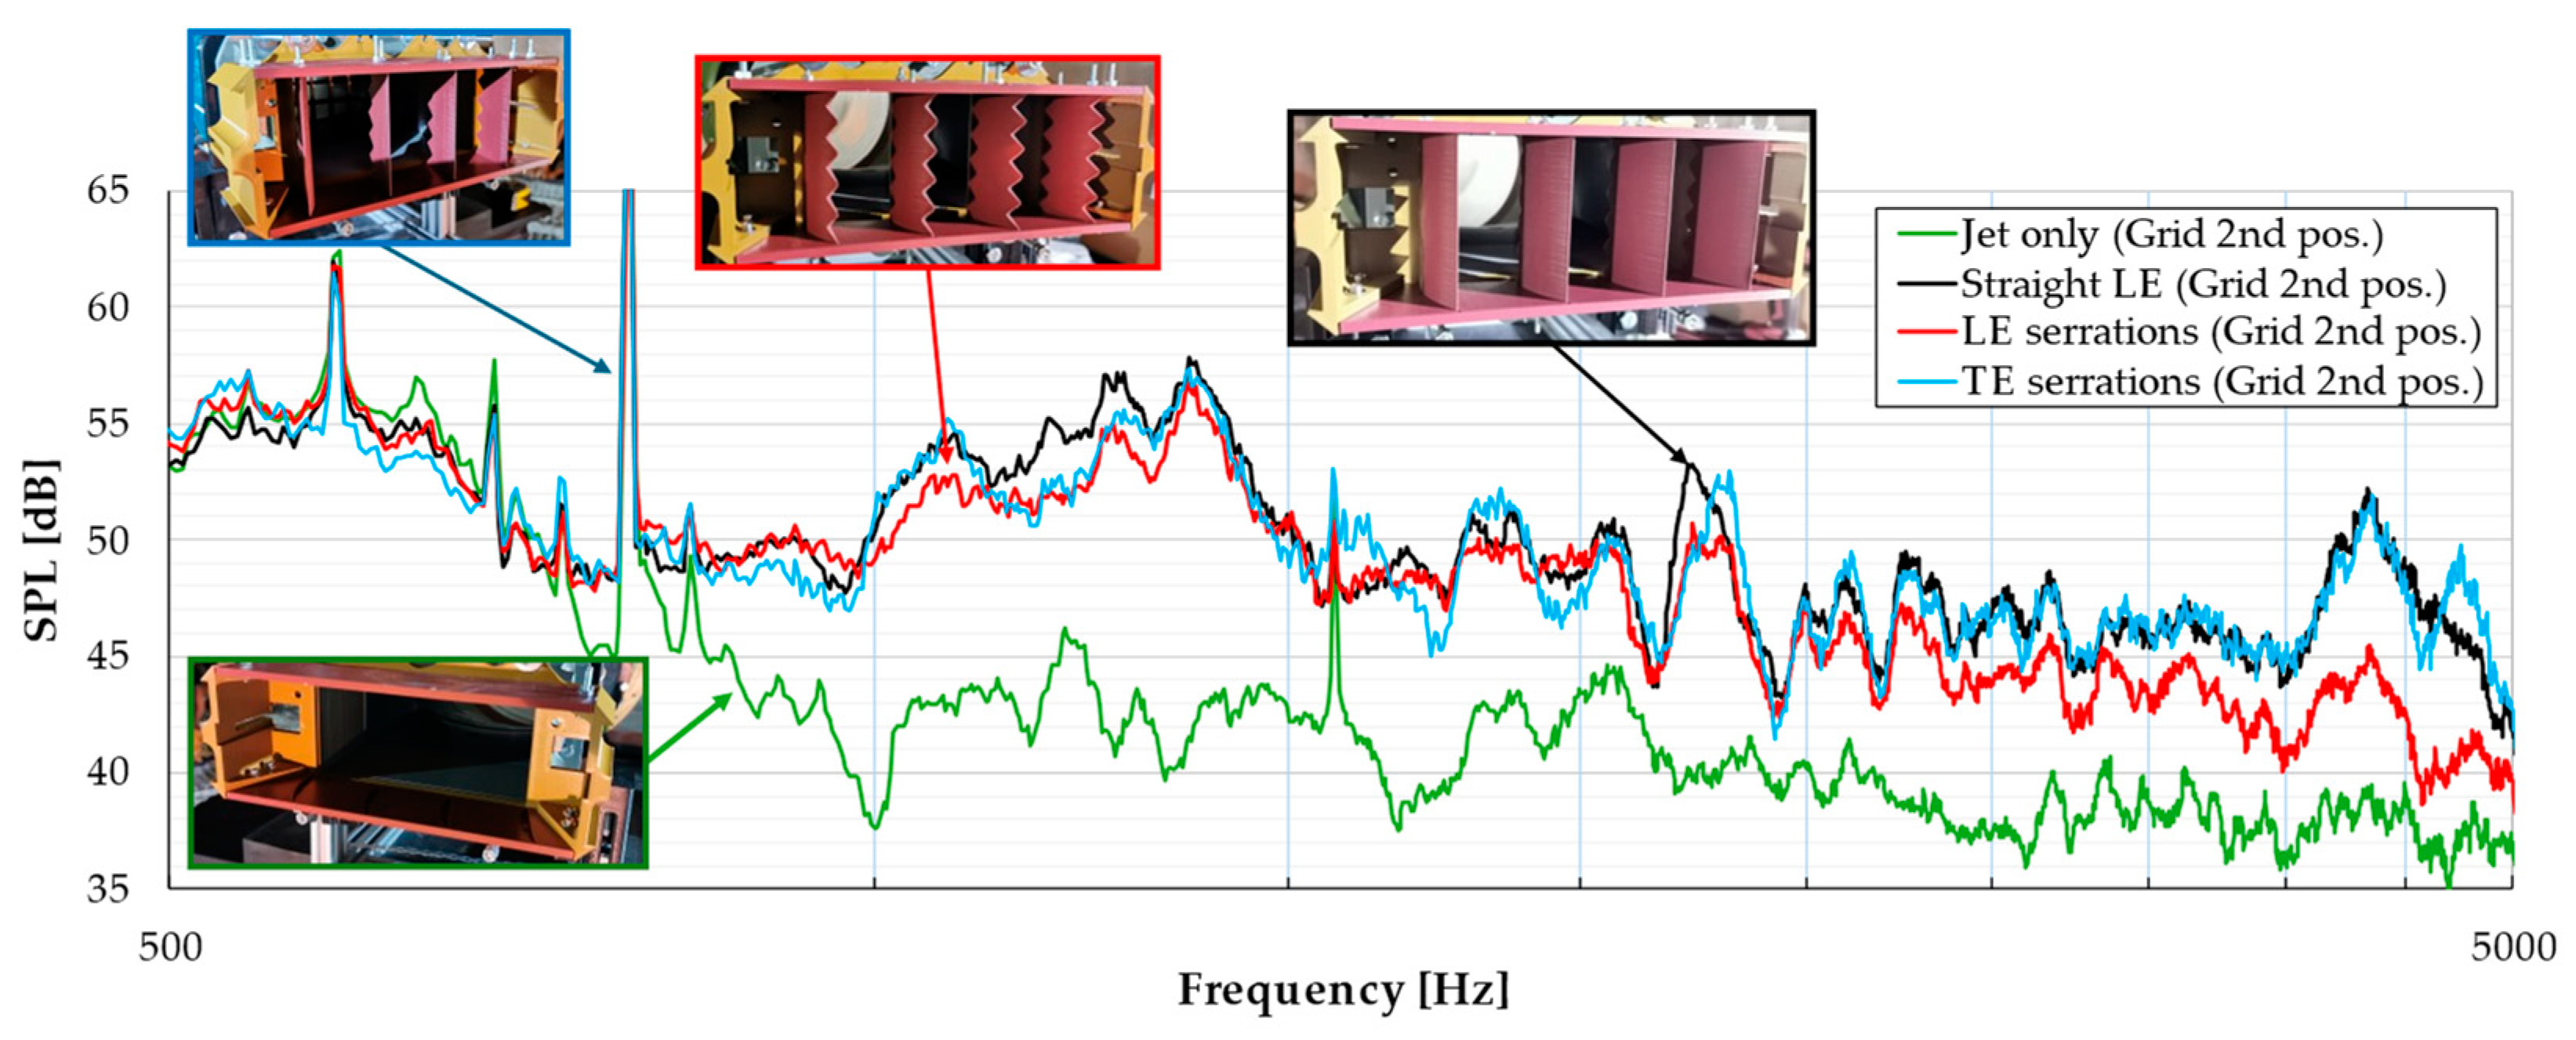
The high-frequency range needs to be investigated; the parasitic noise (spikes resulting from centrifugal impeller operation in the 150–2000 Hz frequency range) will be reduced in future tests by introducing a noise attenuator on the air path. For the same velocity of 50 m/s, three vane geometries with overall dimensions of 5 cm chord × 7.5 cm span (straight LE and LE/TE with 0.1 c amplitude and five triangular serrations per span as in Figure 10c) were also tested. The compressor was placed outside the anechoic chamber; it was connected to the flexible 20 m long tubing. The test section was placed diagonally so that the air tubing was as little curved as possible. Two class 1 sound level meters (Acoem Fusion) were placed within a radius of 1 m, the first roughly in the direction of flow (at ~10 degrees to the longitudinal axis of the nozzle) and the second at 90 degrees to the axis (Figure 2). The noise in Figure 19 is recorded by a class 1 sound level meter (Acoem Fusion) placed at 10 degrees to the flow axis, 1 m from the TE in the horizontal plane of the nozzle to avoid being influenced by the jet. Raw noise signals, the acoustic pressure recorded by the microphone, were recorded at an acquisition rate of 50 ks/s and processed using commercial software, including the Fast Fourier Transform (FFT) function in the frequency domain and averaging over the entire time duration. As the serration parameters were not very well coupled with the turbulence, it is observed that significant attenuations for the LE solution occur at frequencies above 2500 Hz. Overall, at this test scale, reductions of up to 1.5 dB were obtained with the LE solution and just below 1 dB for TE. The desired goal has been achieved, having a starting point for future tests that will require lowering noise and unwanted peaks in jet noise. If the serrations are not tuned to the boundary-layer thickness or a similar quantity, it is not surprising that they have a negligible reduction effect, as confirmed by Figure 19.

4. Discussion

The recent literature indicates that the study of noise remains a significant area of interest, particularly in the last decade, with a focus on reducing critical components such as turbulent fluid–stator blade interactions. Various research institutions have developed test benches to replicate this interaction using scaled-down setups, correlating turbine operation with parameters like flow velocity, profile chord length, and the dimensions of turbulence-generating devices (grids or rods). The proposed and tested geometry emerged from industry concerns aimed at integrating a modular design, easily manufactured through 3D printing, that is suitable for both acoustic and aerodynamic measurements. Notably, the test sections utilize a cascade-type configuration, which is underrepresented in the existing literature. Future experiments will further investigate the local effects of serrated vanes compared to traditional designs as well as the influence of positioning within a vane array in contrast to isolated blades.
Our approach combined initial numerical simulations with experimental investigations of promising geometries, as noted in other studies. The measurements conducted were preliminary, reflecting the capabilities of the setup to capture phenomena at this small scale (most existing installations operate with chords exceeding 100 mm). While the use of two microphones positioned at approximately 90 degrees does not provide a comprehensive assessment, it suffices for qualitative and quantitative preliminary analysis. However, the current configuration does not capture directivity characteristics. Future investigations will employ a polar array of microphones for improved data acquisition. Additionally, more geometries need to be conceptualized and tested in combination with various grid configurations to demonstrate the efficacy of this solution at the current scale. While the aerodynamic aspects are relatively straightforward to address, future studies will need to consider the impact of surface roughness introduced by manufacturing processes, which may pose challenges related to airfoil thickness.

5. Conclusions

This work successfully achieved its aim of designing and manufacturing a miniaturized test stand for evaluating serrated blades placed in a turbulent jet, which will be further instrumented. The mechanisms by which noise is generated and attenuated in rotor-stator stages were examined, demonstrating the possibility of simulating rotor effects by introducing elements that induce flow velocity fluctuations. Preliminary RANS simulations provided insights into potential geometries associated with specific flow characteristics. Tests conducted in an anechoic chamber using a configuration of four cascaded blades at an airflow speed of 50 m/s revealed a reduction in the overall sound pressure level of 1.5 dB and up to 12 dB in tonal noise for serrated leading-edge blades compared to straight-edged ones. Notably, grid noise generation was observed primarily in the 1–6 kHz frequency range with the largest sound pressure level reductions occurring at and above 2500 Hz for tested vanes. To explore tonal noise capabilities further, specific rod configurations will be utilized in future studies. Future work will also focus on identifying acoustic sources at isolated vanes using an acoustic camera and enhancing flow visualization through PIV or Schlieren techniques, aiming to provide a comprehensive understanding of the acoustic and aerodynamic performance of the tested geometries.

Author Contributions

Conceptualization, A.-G.T. and G.C.; methodology, A.-G.T.; software, A.-G.T. and C.-T.O.; validation, A.-G.T., C.-T.O., A.-T.T., A.-C.T. and G.C.; formal analysis, A.-G.T., C.-T.O., A.-T.T. and A.-C.T.; investigation, A.-G.T., C.-T.O., A.-T.T. and A.-C.T.; resources, A.-G.T. and C.-T.O.; data curation, A.-G.T. and A.-C.T.; writing—original draft preparation, A.-G.T. and G.C.; writing—review and editing, A.-G.T., C.-T.O., A.-T.T. and A.-C.T.; visualization, A.-G.T.; supervision, C.-T.O. All authors have read and agreed to the published version of the manuscript.

Funding

This research received no external funding.

Data Availability Statement

The original contributions presented in the study are included in the article, further inquiries can be directed to the corresponding author.

Acknowledgments

The data presented and analyzed in this report were obtained with the help of INCDT COMOTI’s Research and Experiments Center in the field of Acoustic and Vibrations staff and facility, and the work was carried out through the anechoic chamber and measurement equipment.

Conflicts of Interest

The authors declare no conflicts of interest.

Nomenclature

agrid bars thickness
hserration amplitude
kturbulent kinetic energy
lgrid bars width
h/δdimensionless serration amplitude parameter
h/λdimensionless parameter associated with the serration angle
Agrid frontal area
C R e coefficient (0.45)
C μ coefficient (0.09)
Lgrid square side
LwGaussian wake width
U 0 ,W0jet velocity (averaged)
εenergy dissipation rate
λserration pitch
σblade solidity
ωspecific dissipation rate
Λturbulence length scale
BPFblade passing frequency
ILSintegral length scale

References

  1. Arunvinthan, S.; Pillai, S.N.; Cao, S. Aerodynamic characteristics of variously modified leading-edge protuberanced (LEP) wind turbine blades under various turbulent intensities. J. Wind. Eng. Ind. Aerodyn. 2020, 202, 104188. [Google Scholar] [CrossRef]
  2. Yanovych, V.; Duda, D.; Uruba, V.; Tomášková, T. Hot-Wire Investigation of Turbulence Topology behind Blades at Different Shape Qualities. Processes 2022, 10, 522. [Google Scholar] [CrossRef]
  3. Chen, J.; Xie, J.; Lee, H.M. Noise Attenuation by Half Flat tip Serrated Trailing Edge in Rotating Blades. J. Phys. Conf. Ser. 2023, 2489, 012022. [Google Scholar] [CrossRef]
  4. Arce-León, C.A. Modelling of Serrated Trailing Edges to Reduce Aerodynamic Noise in Wind Turbines Using Computational Fluid Dynamics. Master’s Thesis, Uppsala University, Uppsala, Sweden, 2010. [Google Scholar]
  5. Barakat, A.; Sun, B.; Bei, B. Prediction of Aerodynamic Noise in Axial Fan Using Serration Edge Blades. Int. J. Fluid Mach. Syst. 2020, 13, 570–582. [Google Scholar] [CrossRef]
  6. Liu, X.; Jawahar, H.K.; Azarpeyvand, M.; Theunissen, R. Wake Development of Airfoils with Serrated Trailing Edges. In Proceedings of the 22nd AIAA/CEAS Aeroacoustics Conference, Lyon, France, 30 May–1 June 2016; AIAA 2016-2817. American Institute of Aeronautics and Astronautics Inc. (AIAA): Reston, VA, USA, 2016. [Google Scholar] [CrossRef]
  7. Polacsek, C.; Cader, A.; Barrier, R.; de Laborderie, H.; Gea-Aguilera, F. Aeroacoustic Design and Broadband Noise Predictions of a Turbofan Stage with Serrated Outlet Guide Vanes. In Proceedings of the 26th International Congress on Sound and Vibration, Montreal, Canada, 7–11 July 2019. [Google Scholar]
  8. Alkhalifa, A.S.; Uddin, M.N.; Atkinson, M. Aerodynamic Performance Analysis of Trailing Edge Serrations on a Wells Turbine. Energies 2022, 15, 9075. [Google Scholar] [CrossRef]
  9. Fischer, A.; Bertagnolio, F.; Shen, W.Z.; Madsen, J. Noise model for serrated trailing edges compared to wind tunnel measurements. J. Phys. Conf. Ser. 2016, 753, 022053. [Google Scholar] [CrossRef]
  10. Wang, J.; Ishibashi, K.; Ikeda, T.; Fujii, T.; Nakata, T.; Liu, H. Morphological effects of leading-edge serrations on the acoustic signatures of mixed flow fan. Phys. Fluids 2022, 34, 041909. [Google Scholar] [CrossRef]
  11. Teruna, C.; Avallone, F.; Casalino, D.; Ragni, D. Numerical investigation of leading edge noise reduction on a rod-airfoil configuration using porous materials and serrations. J. Sound Vib. 2021, 494, 115880. [Google Scholar] [CrossRef]
  12. Liu, L.; Zhang, L.; Wu, B.; Chen, B.; Aecom, P. Numerical and Experimental Studies on Grid-Generated Turbulence in Wind Tunnel. J. Eng. Sci. Technol. Rev. 2017, 10, 159–169. [Google Scholar] [CrossRef]
  13. Polacsek, C.; Cader, A.; Buszyk, M.; Barrier, R.; Gea-Aguilera, F.; Posson, H. Aeroacoustic design and broadband noise predictions of a fan stage with serrated outlet guide vanes. Phys. Fluids 2020, 32, 107107. [Google Scholar] [CrossRef]
  14. Lau, A.S.; Haeri, S.; Kim, J.W. The effect of wavy leading edges on aerofoil–gust interaction noise. J. Sound Vib. 2013, 332, 6234–6253. [Google Scholar] [CrossRef]
  15. Jaron, R.; Herthum, H.; Franke, M.; Moreau, A.; Guérin, S. Impact of Turbulence Models on RANS-Informed Prediction of Fan Broadband Interaction Noise. In Proceedings of the 12th European Conference on Turbomachinery Fluid Dynamics and Thermodynamics, Stockholm, Sweden, 3–7 April 2017. [Google Scholar] [CrossRef]
  16. Jaron, R.; Moreau, A.; Guérin, S.; Schnell, R. Optimization of Trailing-Edge Serrations to Reduce Open-Rotor Tonal Interaction Noise. In Proceedings of the 16th International Symposium on Transport Phenomena and Dynamics of Rotating Machinery, Honolulu, HI, USA, 10–15 April 2016. [Google Scholar]
  17. Dicholkar, A.; Zahle, F.; Sørensen, N.N. Convergence enhancement of SIMPLE-like steady-state RANS solvers applied to airfoil and cylinder flows. J. Wind. Eng. Ind. Aerodyn. 2022, 220, 104863. [Google Scholar] [CrossRef]
  18. Polacsek, C.; Barrier, R.; Kohlhaas, M.; Carolus, T.; Kausche, P.; Moreau, A.; Kennepohl, F. Turbofan Interaction Noise reduction Using Trailing Edge Blowing: Numerical Design and Assessment and Comparison with Experiments.V2. Aerosp. Lab 2014, 7, 1–9. [Google Scholar] [CrossRef]
  19. Llorente, E.; Ragni, D. Trailing edge serrations effects on the aerodynamic performance of a NACA 643418. Wind. Energy 2019, 22, 392–406. [Google Scholar] [CrossRef]
  20. Zhou, T.; Cao, H.; Zhang, M.; Liao, C. Performance simulation of wind turbine with optimal designed trailing-edge serrations. Energy 2022, 243, 122998. [Google Scholar] [CrossRef]
  21. Narayanan, S.; Joseph, P.; Haeri, S.; Kim, J.W. Noise Reduction Studies from the Leading Edge of Serrated Flat Plates. In Proceedings of the 20th AIAA/CEAS Aeroacoustics Conference, Atlanta, GA, USA, 16–20 June 2014. [Google Scholar] [CrossRef]
  22. Gruber, M. Airfoil Noise Reduction by Edge Treatments. Ph.D. Thesis, University of Southampton, Southampton, UK, 2012. [Google Scholar]
  23. Jiang, M.; Li, X.-D.; Zhou, J.-J. Experimental and numerical investigation on sound generation from airfoil-flow interaction. Appl. Math. Mech. 2011, 32, 765–776. [Google Scholar] [CrossRef]
  24. Bampanis, G.; Roger, M.; Moreau, S. On a three-dimensional investigation of airfoil turbulence-impingement noise and its reduction by leading-edge tubercles. J. Sound Vib. 2021, 520, 116635. [Google Scholar] [CrossRef]
  25. Georgios, B.; Michel, R. Three-dimensional effects in the reduction of turbulence-impingement noise of aerofoils by wavy leading edges. In Proceedings of the Euronoise 2018, Crete, Greece, 27–31 May 2018. [Google Scholar]
  26. Marc, J. Introduction to experimental aeroacoustics, Lecture 1. In Design and Operation of Aeroacoustic Wind Tunnels for Ground and Air Vehicles; Von Karman Institute: Brussels, Belgium, 2017; pp. 1–26. [Google Scholar]
  27. Clair, V.; Salze, E.; Souchotte, P.; Jondeau, E. Turbulence interaction noise from a rectilinear cascade of airfoils and effects of porous material inclusions. In Proceedings of the AIAA AVIATION 2023 Forum, San Diego, CA, USA, 12–16 June 2023. [Google Scholar] [CrossRef]
  28. Ito, S. Aerodynamic Influence of Leading-Edge Serrations on an Airfoil in a Low Reynolds Number. J. Biomech. Sci. Eng. 2009, 4, 117–123. [Google Scholar] [CrossRef]
  29. Sheldahl, R.E.; Klimas, P.C. Aerodynamic Characteristics of Seven Symmetrical Airfoil Sections through 180-Degree Angle of Attack for Use in Aerodynamic Analysis of Vertical Axis Wind Turbines; Technical Report No. SAND80-2114; Sandia National Laboratories: Albuquerque, NM, USA, 1981. [Google Scholar]
  30. Kroeger, R.A. Low Speed Aerodynamics for Ultra-Quiet Flight; Technical Report; DTIC Document: Fort Belvoir, VA, USA, 1972. [Google Scholar]
  31. Moreau, D.; Brooks, L.; Doolan, C. On the noise reduction mechanism of a flat plate serrated trailing edge at low-to-moderate Reynolds number. In Proceedings of the 18th AIAA/CEAS Aeroacoustics Conference (33rd AIAA Aeroacoustics Conference), Colorado Springs, CO, USA, 4–6 June 2012. [Google Scholar] [CrossRef]
  32. Herr, M. A noise reduction study on flow-permeable trailing-edges. In Proceedings of the Eighth ONERA-DLR Aerospace Symposium (ODAS), Göttingen, France, 17–19 October 2007; Volume 17, p. 19. [Google Scholar]
  33. Anyoji, M.; Wakui, S.; Hamada, D.; Aono, H. Experimental Study of Owl-Like Airfoil Aerodynamics at Low Reynolds Numbers. J. Flow Control. Meas. Vis. 2018, 6, 185–197. [Google Scholar] [CrossRef]
  34. Merino-Martínez, R.; Carpio, A.R.; Pereira, L.T.L.; van Herk, S.; Avallone, F.; Ragni, D.; Kotsonis, M. Aeroacoustic design and characterization of the 3D-printed, open-jet, anechoic wind tunnel of Delft University of Technology. Appl. Acoust. 2020, 170, 107504. [Google Scholar] [CrossRef]
  35. Totu, A.-G.; Cican, G.; Crunțeanu, D.-E. Serrations as a Passive Solution for Turbomachinery Noise Reduction. Aerospace 2024, 11, 292. [Google Scholar] [CrossRef]
  36. Smith, E.G.; Sowers, H.D. Cascade Tests of Serrated Leading Edge Blading at High Subsonic Speeds. 1974; NASA CR-2472. Available online: https://ntrs.nasa.gov/api/citations/19750003911/downloads/19750003911.pdf (accessed on 1 May 2024).
  37. Howe, M.S. Noise Produced by a Sawtooth Trailing Edge. J. Acoust. Soc. Am. 1991, 90, 482. [Google Scholar] [CrossRef]
  38. Qiao, W.; Ji, L.; Tong, W.; Chen, W. Application of Phased Array în the Study of Linear Cascade Noise Reduction on the Indoor Test Bed. In Proceedings of the 5th Berlin Beamforming Conference, Berlin, Germany, 19–20 February 2014. [Google Scholar]
  39. Chaitanya, P.; Joseph, P.; Narayanan, S.; Vanderwel, C.; Turner, J.; Kim, J.W.; Ganapathisubramani, B. Performance and mechanism of sinusoidal leading edge serrations for the reduction of turbulence–aerofoil interaction noise. J. Fluid Mech. 2017, 818, 435–464. [Google Scholar] [CrossRef]
  40. Agrawal, B.R. Modeling Fan Broadband Noise from Jet Engines and Rod-Airfoil Benchmark Case for Broadband Noise Prediction. Master’s Thesis, Iowa State University of Science and Technology, Ames, IA, USA, 1 January 2015. p. 14326. Available online: https://lib.dr.iastate.edu/etd/14326 (accessed on 2 September 2024).
  41. Jacob, M.C.; Boudet, J.; Casalino, D.; Michard, M. A rod-airfoil experiment as a benchmark for broadband noise modeling. Theor. Comput. Fluid Dyn. 2005, 19, 171–196. [Google Scholar] [CrossRef]
  42. Al Am, J.; Clair, V.; Giauque, A.; Boudet, J.; Gea-Aguilera, F. Direct noise predictions of fan broadband noise using LES and analytical models. In Proceedings of the 28th AIAA/CEAS Aeroacoustics 2022 Conference, Southampton, UK, 14–17 June 2022. [Google Scholar] [CrossRef]
  43. Guérin, S.; Kissner, C.; Seeler, P.; Blázquez, R.; Laraña, P.C.; de Laborderie, H.; Lewis, D.; Chaitanya, P.; Polacsek, C.; Thisse, J. ACAT1 Benchmark of RANS-Informed Analytical Methods for Fan Broadband Noise Prediction: Part II—Influence of the Acoustic Models. Acoustics 2020, 2, 617–649. [Google Scholar] [CrossRef]
  44. Caldas, L.; Kissner, C.; Behn, M.; Tapken, U.; Meyer, R. Comparison of Techniques for the Estimation of Flow Parameters of Fan Inflow Turbulence from Noisy Hot-Wire Data. Fluids 2021, 6, 372. [Google Scholar] [CrossRef]
  45. Ansys. Best Practice: Scale-Resolving Simulations in Ansys CFD. v2.00, Technical Paper. 2015. Available online: https://www.ansys.com/content/dam/product/fluids/cfd/tb-best-practices-scale-resolving-models.pdf (accessed on 2 September 2024).
  46. Filamentive Limited. PLA/rPLA, Datasheet. Available online: https://www.farnell.com/datasheets/2913593.pdf (accessed on 2 September 2024).
  47. ASRO, SR EN ISO 3745: 2012; Acoustics-Determination of Sound Power Levels and Sound Energy Levels of Noise Sources Using Sound Pressure-Precision Methods for Anechoic Rooms and Semi-Anechoic Rooms. ISO: Bucuresti, Romania, 2012.
  48. Acoustics and Vibrations Laboratory, COMOTI. Available online: http://ftp.comoti.ro/en/laboratoare_experimentari_4_2.htm (accessed on 2 September 2024).
  49. Tyacke, J.; Vadlamani, N.; Trojak, W.; Watson, R.; Ma, Y.; Tucker, P. Turbomachinery simulation challenges and the future. Prog. Aerosp. Sci. 2019, 110, 100554. [Google Scholar] [CrossRef]
  50. Chedevergne, F. Analytical wall function including roughness corrections. Int. J. Heat Fluid Flow 2018, 73, 258–269. [Google Scholar] [CrossRef]
  51. Chedevergne, F.; Aupoix, B. Accounting for wall roughness effects in turbulence models: A wall function approach. In Proceedings of the 7th European Conference for Aeronautics And Aerospace Sciences (EUCASS), Milan, Italy, 3–6 July 2017. [Google Scholar] [CrossRef]
  52. Prakash, A.; Laurendeau, E. Consistent surface roughness extension for wall functions. Int. J. Heat Fluid Flow 2020, 82, 108552. [Google Scholar] [CrossRef]
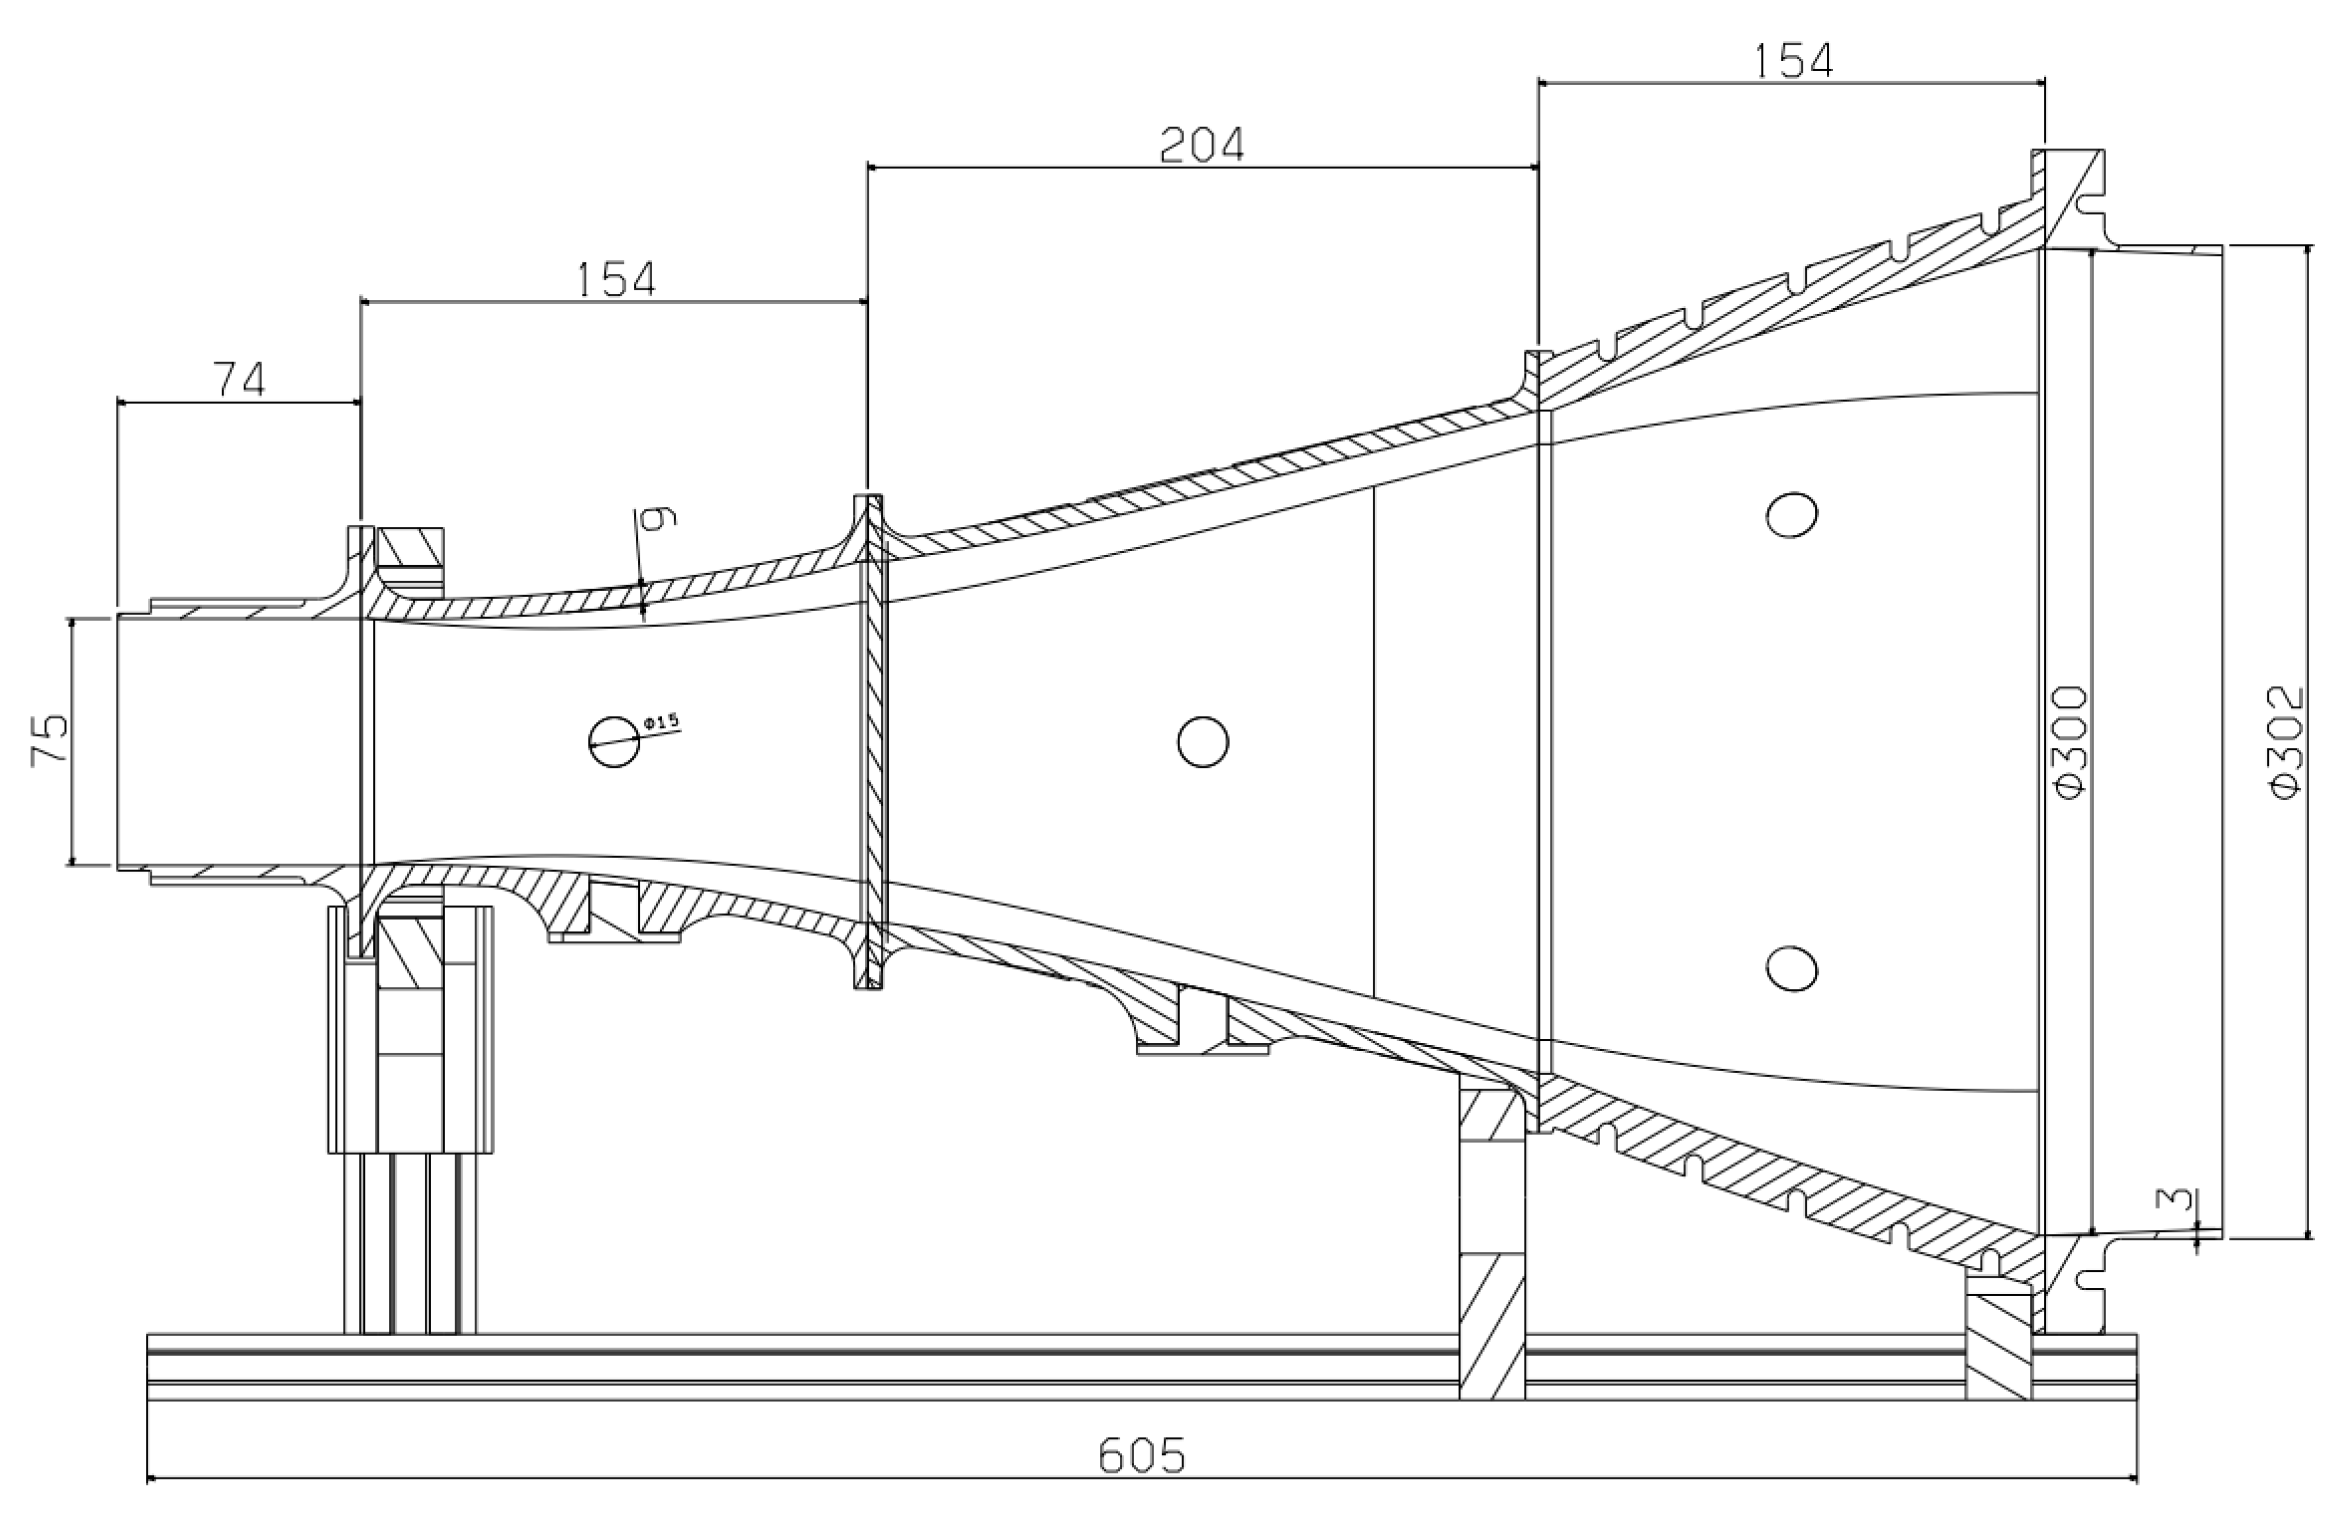
Figure 1. Convergent path (vertical section).
Acoustics 06 00054 g001
Figure 2. Cascade configuration overview: (a) isometric view (flow from right to left); (b) isometric view (outlet); (c) top view.
Acoustics 06 00054 g002
Figure 3. Comparison of different turbulence length scale estimates extracted from LES and RANS simulation (λp—function of TKE and TDE, λc—function of time integral scale using Taylor’s frozen turbulence assumption and λj—function of wake width) [42].
Acoustics 06 00054 g003
Figure 4. Serrations placement patterns after correlation with incident turbulence (flow from left to right) [13].
Acoustics 06 00054 g004
Figure 5. Mesh and boundary conditions (convergent section): (left)—computational domain, (right)—mesh section.
Acoustics 06 00054 g005
Figure 6. Mesh and boundary conditions (convergent section with grid): (left)—computational domain, (right)—mesh section.
Acoustics 06 00054 g006
Figure 7. Three-dimensional (3D) printed components: (a) quarter of the air hose coupling component; (b) final test section; (c) 1/4 of the first section; (d) adaptor part for load cells.
Acoustics 06 00054 g007
Figure 8. Grids for testing.
Acoustics 06 00054 g008
Figure 9. Three-dimensional (3D)-printed assembly of the parts forming the flow section.
Acoustics 06 00054 g009
Figure 10. Experimental test bench: (a) pitot tube measurements; (b) air source connection and one of the grid-mounting positions; (c) view from the blade-mounting area (nozzle).
Acoustics 06 00054 g010
Figure 11. Variation in main parameters: (a) velocity; (b) static pressure; (c) total pressure.
Acoustics 06 00054 g011
Figure 12. Variation in y+ parameter (config. 9).
Acoustics 06 00054 g012
Figure 13. Mesh sensitivity analysis (SST turbulence model).
Acoustics 06 00054 g013
Figure 14. Variation in relevant scaled parameters.
Acoustics 06 00054 g014
Figure 15. Variation in parameter Λ (all configurations).
Acoustics 06 00054 g015
Figure 16. TKE/TED variation along the simulated domain.
Acoustics 06 00054 g016
Figure 17. Axial force variation (on grid) as a function of configuration no.
Acoustics 06 00054 g017
Figure 18. Experimental spectra and best-fit von Kármán spectrum.
Acoustics 06 00054 g018
Figure 19. Spectra of the LE/TE modified blades.
Acoustics 06 00054 g019
Table 1. Correlation between serration parameters and ILS.
RelationReference
A / λ < 1.5 Smith, 1974 [36]
λ h < 4 Howe, 1991 [37]
λ Λ o p t i m u m 4 Howe, 1991 [37]
λ h o p t i m u m ~   1 Qiao, 2014 [38]
λ Λ 4 Chaytanya, 2017 [39]
Λ λ < 0.3 Gruber, 2012 [22]
A Λ > 3 Lau, 2013 [14]
Table 2. Simulated grid sizes.
Grid No.12 (Grid 1 2nd Pos)3.13.2456789
L [mm]343413.513101015202020
l [mm]121255544454.5
a [mm]12128.55544454.5
Disclaimer/Publisher’s Note: The statements, opinions and data contained in all publications are solely those of the individual author(s) and contributor(s) and not of MDPI and/or the editor(s). MDPI and/or the editor(s) disclaim responsibility for any injury to people or property resulting from any ideas, methods, instructions or products referred to in the content.