Article

IoT-Based Sanitizer Station Network: A Facilities Management Case Study on Monitoring Hand Sanitizer Dispenser Usage

1
Department of Architectural Engineering, The Pennsylvania State University, University Park, PA 16802, USA
2
School of Electrical Engineering and Computer Science, The Pennsylvania State University, University Park, PA 16802, USA
3
School of Engineering Design, Technology, and Professional Programs, The Pennsylvania State University, University Park, PA 16802, USA
4
Department of Agricultural Engineering, The Pennsylvania State University, University Park, PA 16802, USA
*
Author to whom correspondence should be addressed.
Smart Cities 2021, 4(3), 979-994; https://doi.org/10.3390/smartcities4030051
Submission received: 31 May 2021 / Revised: 3 July 2021 / Accepted: 6 July 2021 / Published: 8 July 2021
(This article belongs to the Section Energy and ICT)

Abstract

:
Maintaining hand hygiene has been an essential preventive measure for reducing disease transmission in public facilities, particularly during the COVID-19 pandemic. The large number of sanitizer stations deployed within public facilities, such as on university campuses, brings challenges for effective facility management. This paper proposes an IoT sensor network for tracking sanitizer usage in public facilities and supporting facility management using a data-driven approach. Specifically, the system integrates low-cost wireless sensors, LoRaWAN, and cloud-based computing techniques to realize data capture, communication, and analysis. The proposed approach was validated through field experiments in a large building on a university campus to assess the network signal coverage and effectiveness of sensor operation for facility monitoring. The results show that a LoRaWAN created from a single gateway can successfully connect to sensors distributed throughout the entire building, with the sensor nodes recording and transmitting events across the network for further analysis. Overall, this paper demonstrates the potential of leveraging the IoT-based Sanitizer Station Network to track public health mitigation methods in a large facility, which ultimately contributes to reducing the burden of maintaining public health during and post-pandemic.

1. Introduction

Preventive measures are among the critical strategies for reducing the burden of the COVID-19 pandemic. Following the guidance of the Centers for Disease Control and Prevention (CDC) [1] within the U.S. and that of other health agencies around the world, these prevention measures include mask wearing, maintaining physical distance from others (i.e., “social distancing”), hand hygiene, deep cleaning, and disinfection. Recent studies suggest that preventive measures will continue to be important, particularly in the current context of vaccination efforts [2,3,4]. As one of the essential preventive measures performed at an individual level, maintaining good hand hygiene using alcohol-based sanitizers can effectively reduce the spread of the virus, which warrants the scalable deployment of sanitizer stations in public spaces such as hospitals, shopping malls, office buildings, and university campuses. However, deploying a large number of sanitizer stations throughout a large area and in multiple buildings creates challenges for effective facility management. In particular, sanitizer dispensers should be refilled as soon as they empty so that they are available when needed. In this sense, the facilities operations team should be able to (i) monitor the usage of sanitizer stations; (ii) readily identify the locations and number of sanitizer stations that need refilling; and (iii) generate the schedule and route for maintaining the sanitizer stations accordingly. These requirements demonstrate the need for automated usage tracking of sanitizer stations distributed throughout a large area.
Internet-of-Things (IoT)-based monitoring applications have quickly become an important part of our daily lives, and their importance and ubiquity will continue to grow, particularly as they enable large-scale deployments and “smart city” applications [5] such as parking [6] and waste management [7]. Several researchers have described a design framework for these applications (e.g., Fahmideh, et al. [8]) and challenges to implementation (e.g., Syed, et al. [9] and Belli, et al. [10]). IoT devices equipped with Long-Range Wide-Area Network (LoRaWAN) transceivers are now also feasible for monitoring systems to support smart cities, i.e., usage at the city, urban, or rural scale [11,12,13]. Example applications that have demonstrated the use of LoRaWAN in smart city applications include those monitoring traffic systems (car parking [14] and traffic lights [15]), infrastructure (e.g., lighting control [16]), urban environment (e.g., air quality [17,18]), and utility metering [19]. In addition to the monitoring and control of assets, LoRaWAN is also widely used for large-scale human health monitoring as a component of e-health solutions [11]. These include monitoring of both human physical status (such as blood pressure, glucose, and temperature on an urban scale [20]) and location [21,22]. In sum, LoRaWAN-based IoT systems enable solutions for large-scale monitoring for both assets and humans in dense urban areas.
Applications of LoRaWAN-based IoT systems also provide an opportunity for improving public health during the current pandemic. Particularly, IoT techniques can facilitate sanitizer usage tracking within facilities throughout a large area. Recent advances in IoT technologies enable an integrated approach for wireless sensorized infrastructure to monitor public hygiene in real time or near real time. Applying ubiquitous computing, wireless communication, and smart-and-connected devices allows the transfer of data and information rapidly and reliably [23]. A review of recent studies deploying IoT-based sanitizer stations is provided in Table 1.
Applications of IoT-based sanitizer stations have been set up in health facilities [23,24,25] such as hospitals, clinics, and nursing homes. The early-stage adoption of sensorized sanitizer stations aims at ensuring compliance with hand hygiene among the medical staff, which is vital in controlling the spread of disease in medical facilities. Such IoT-based systems typically rely on installing sensors (e.g., infrared sensors [23]) on sanitizer stations and RFID tags on each medical staff, which allows the monitoring of hand hygiene activities of each identifiable staff. Therefore, such systems are more appropriate for deployment in private spaces where regular users of the sanitizer stations can be equipped with ID tags.
In the wake of the COVID-19 pandemic, recent studies have started to apply IoT-based sanitizers for improving public hygiene. Herbert, et al. [26] developed sanitizer stations with UV light and cameras, which provide real-time feedback of hand cleaning performance to users to improve their hand hygiene practices. A study by Sumbawati, et al. [27] also deployed a smart control mechanism on the sanitizer station to reduce sanitizer waste. Despite the importance of enhancing hand hygiene via IoT-based sensors, there is also a need for effective management of sanitizer stations at scale during the pandemic—a scale that is often 10 to 100 times the number compared to pre-pandemic numbers. In this sense, recent works have also explored leveraging sensors for monitoring usage and levels of sanitizer in stations in real time [28,29]. However, such works focus mainly on the design of sensorized sanitizer stations to measure the sanitizer usage. The detected usage data should be converted into actionable information for facility management personnel. However, there has been limited reporting on investigations into the design and development of IoT systems to support facility management of sanitizer stations at scale. Hence, there is a need for a proof-of-concept demonstration of sensorized sanitizer stations for scalable deployment in real-world application scenarios, which is not implemented in related studies [28,29]. Given the vital role of individual-level preventive measures, a scalable IoT-based public sanitizer station network to assess usage at the facility level can benefit broader stakeholders, including the facilities managers, field operators (e.g., janitors), public health professionals, and building occupants.
Table 1. Review of related studies.
StudiesApplication ScenarioDeployed Techniques
Herbert, Horsham, Ford, Wall and Hacker [26]Applying a smart handwashing station to improve hand hygiene compliance with real-time feedback (regarding the effectiveness of handwashing).Camera, UV light, and tablet installed on handwashing station for detecting and displaying unwashed areas of hands.
Chowdhury and De [29]Sensorized sanitizer station to monitor the sanitizer usage and remaining level.Liquid stage sensor installed on sanitizer station, with WiFi for data communication.
Bal and Abrishambaf [23]Sensorized sanitizer station to monitor the compliance with hand hygiene of medical staff.RFID tag and an infrared sensor for monitoring the hand hygiene compliance of each staff; ZigBee and WiFi for data communication.
Meydanci, Adali, Ertas, Dizbay, and Akan [25]Sensorized sanitizer station for monitoring the compliance with hand hygiene of medical staff.RFID tags for monitoring hand cleaning behaviors; ZigBee for data communication.
Tadikonda [28]Sensorized sanitizer station for monitoring the level of sanitizer.Ultrasonic sensor for monitoring the level of sanitizer bottle; WiFi for data communication.
Sumbawati, Chandra, Wrahatnolo, Ningrum, Khotimah, and Fathoni [27]Sensorized dispenser with smart control for automated serving of sanitizer and reducing waste. Ultrasonic sensor for detecting presence of human hands.
In summary, the motivation for the proposed approach is outlined in Figure 1. The need for scalable deployment of sanitizer stations brings challenges for facility management. IoT-based systems can help to overcome the challenge of large-scale facility management for facility managers, operators, and occupants. However, the review of related studies in Table 1 shows a lack of design, development, and field tests of IoT-based sanitizer station systems for supporting effective public facility management. Therefore, as an initial stage of ongoing research, this study developed a proof-of-concept IoT sensor network to track sanitizer usage in a public space and support facility management using a data-driven approach. A case study was conducted in a large building on The Pennsylvania State University’s University Park campus. Specifically, we developed a wireless monitoring unit comprising a commercial-off-the-shelf (COTS) wireless sensor unit and a 3D-printed holder with compliant mechanism to register dispenser interactions. This allows these units to be quickly and easily installed via a “plug-and-play” approach on existing sanitizer dispensers located on campus. We deployed a LoRaWAN gateway for delivering the wireless sensor network (WSN) data to the cloud. A cloud-based platform was developed for data management, analysis, and reporting, with an aim to support the decision-making of the facility management team via an evidence-based approach. In addition to the system design and development, we also tested the system’s operation in a large building on campus.
This paper is organized as follows: Section 2 describes the design, development, and testing of our IoT system. The results of the system test are discussed in Section 3. Finally, conclusions and potential further development paths are described in Section 4.

2. Materials and Methods

Here we describe the design, development, and implementation of the IoT-based Sanitizer Dispenser Network. The overview of the design effort is introduced first, followed by a description of each subsystem. Finally, we discuss the implementation and testing of the prototype system we developed.

2.1. Concept Development

The system we developed (i) tracks usage of sanitizer dispensers in (near) real time on campus; (ii) saves the historical data of sanitizer interactions, and (iii) reports the sanitizer operational status and usage patterns to support facility management (data that can also be assessed by public health professionals). Figure 2 provides a block diagram as an overview of the proposed system. Instead of developing a new IoT-based sanitizer station prototype as in related studies, the existing sanitizer stations on campus are upgraded by installing a sensor module and 3D-printed sensor holder with compliant mechanism, which aims at monitoring dispenser interactions in (near) real time (data are collected and sent every 10 min, which can be set shorter or longer). The captured data from the sensor units are communicated to the cloud-based network server over LoRaWAN. The cloud network server sends the collected data to the application server. The data analysis programs running on the application server transform data from sensors into estimates of sanitizer usage. Such information is presented in real time via dashboards and triggers automated notification (e.g., identified sanitizer dispensers requiring bottle replacement) to the facility management team.

2.2. Sensor Module Selection

The Radio Bridge Dry Contact Sensor (Type: RBS301-CON LoRa [30]) was selected for this study due to the following features.
  • Low-cost: each sensor costs USD 40–45, which is affordable for deployment scale up.
  • Wire-free power supply: the sensors are powered by batteries with a lifetime of up to 5–10 years. The sensors are, therefore, easy to deploy and have no requirement of being near a power source.
  • Wireless data communication: the sensors use LoRaWAN for data communication, which is a low-power solution for long-range communication.
  • Remote configuration and management: the sensor manufacturer provides an accessible network server service (Radio Bridge Console [31]), allowing remote sensor configuration and troubleshooting.
  • Multiple triggering mechanisms: the sensor can detect several different events through three different mechanisms, namely, wire connection/disconnection (Event A), tamper switch for detecting sensor shell open (Event B), and magnetic trigger for sensor status checking (Event C).
We designed our unit to register different dispenser interactions through judicious use of the sensor module’s three triggering mechanisms. These three triggering mechanisms allow the sensor module to detect several different user interactions with the dispenser, such as regular use (i.e., push of the dispenser lever via Event A, wire connection/disconnection), sanitizer bottle replacement by janitorial staff (via Event B, tamper switch), and sensor status checking (via Event C, magnet trigger). As shown in Figure 3, a data packet is sent to the network server containing the events that occurred and their quantity during the reporting interval (set to 10 min in our system). A time-stamp for each data packet captured by the sensors is automatically generated by the sensors, which is used for monitoring sensor operation.

2.3. Sensor Deployment

2.3.1. Existing Sanitizer Dispenser Stations

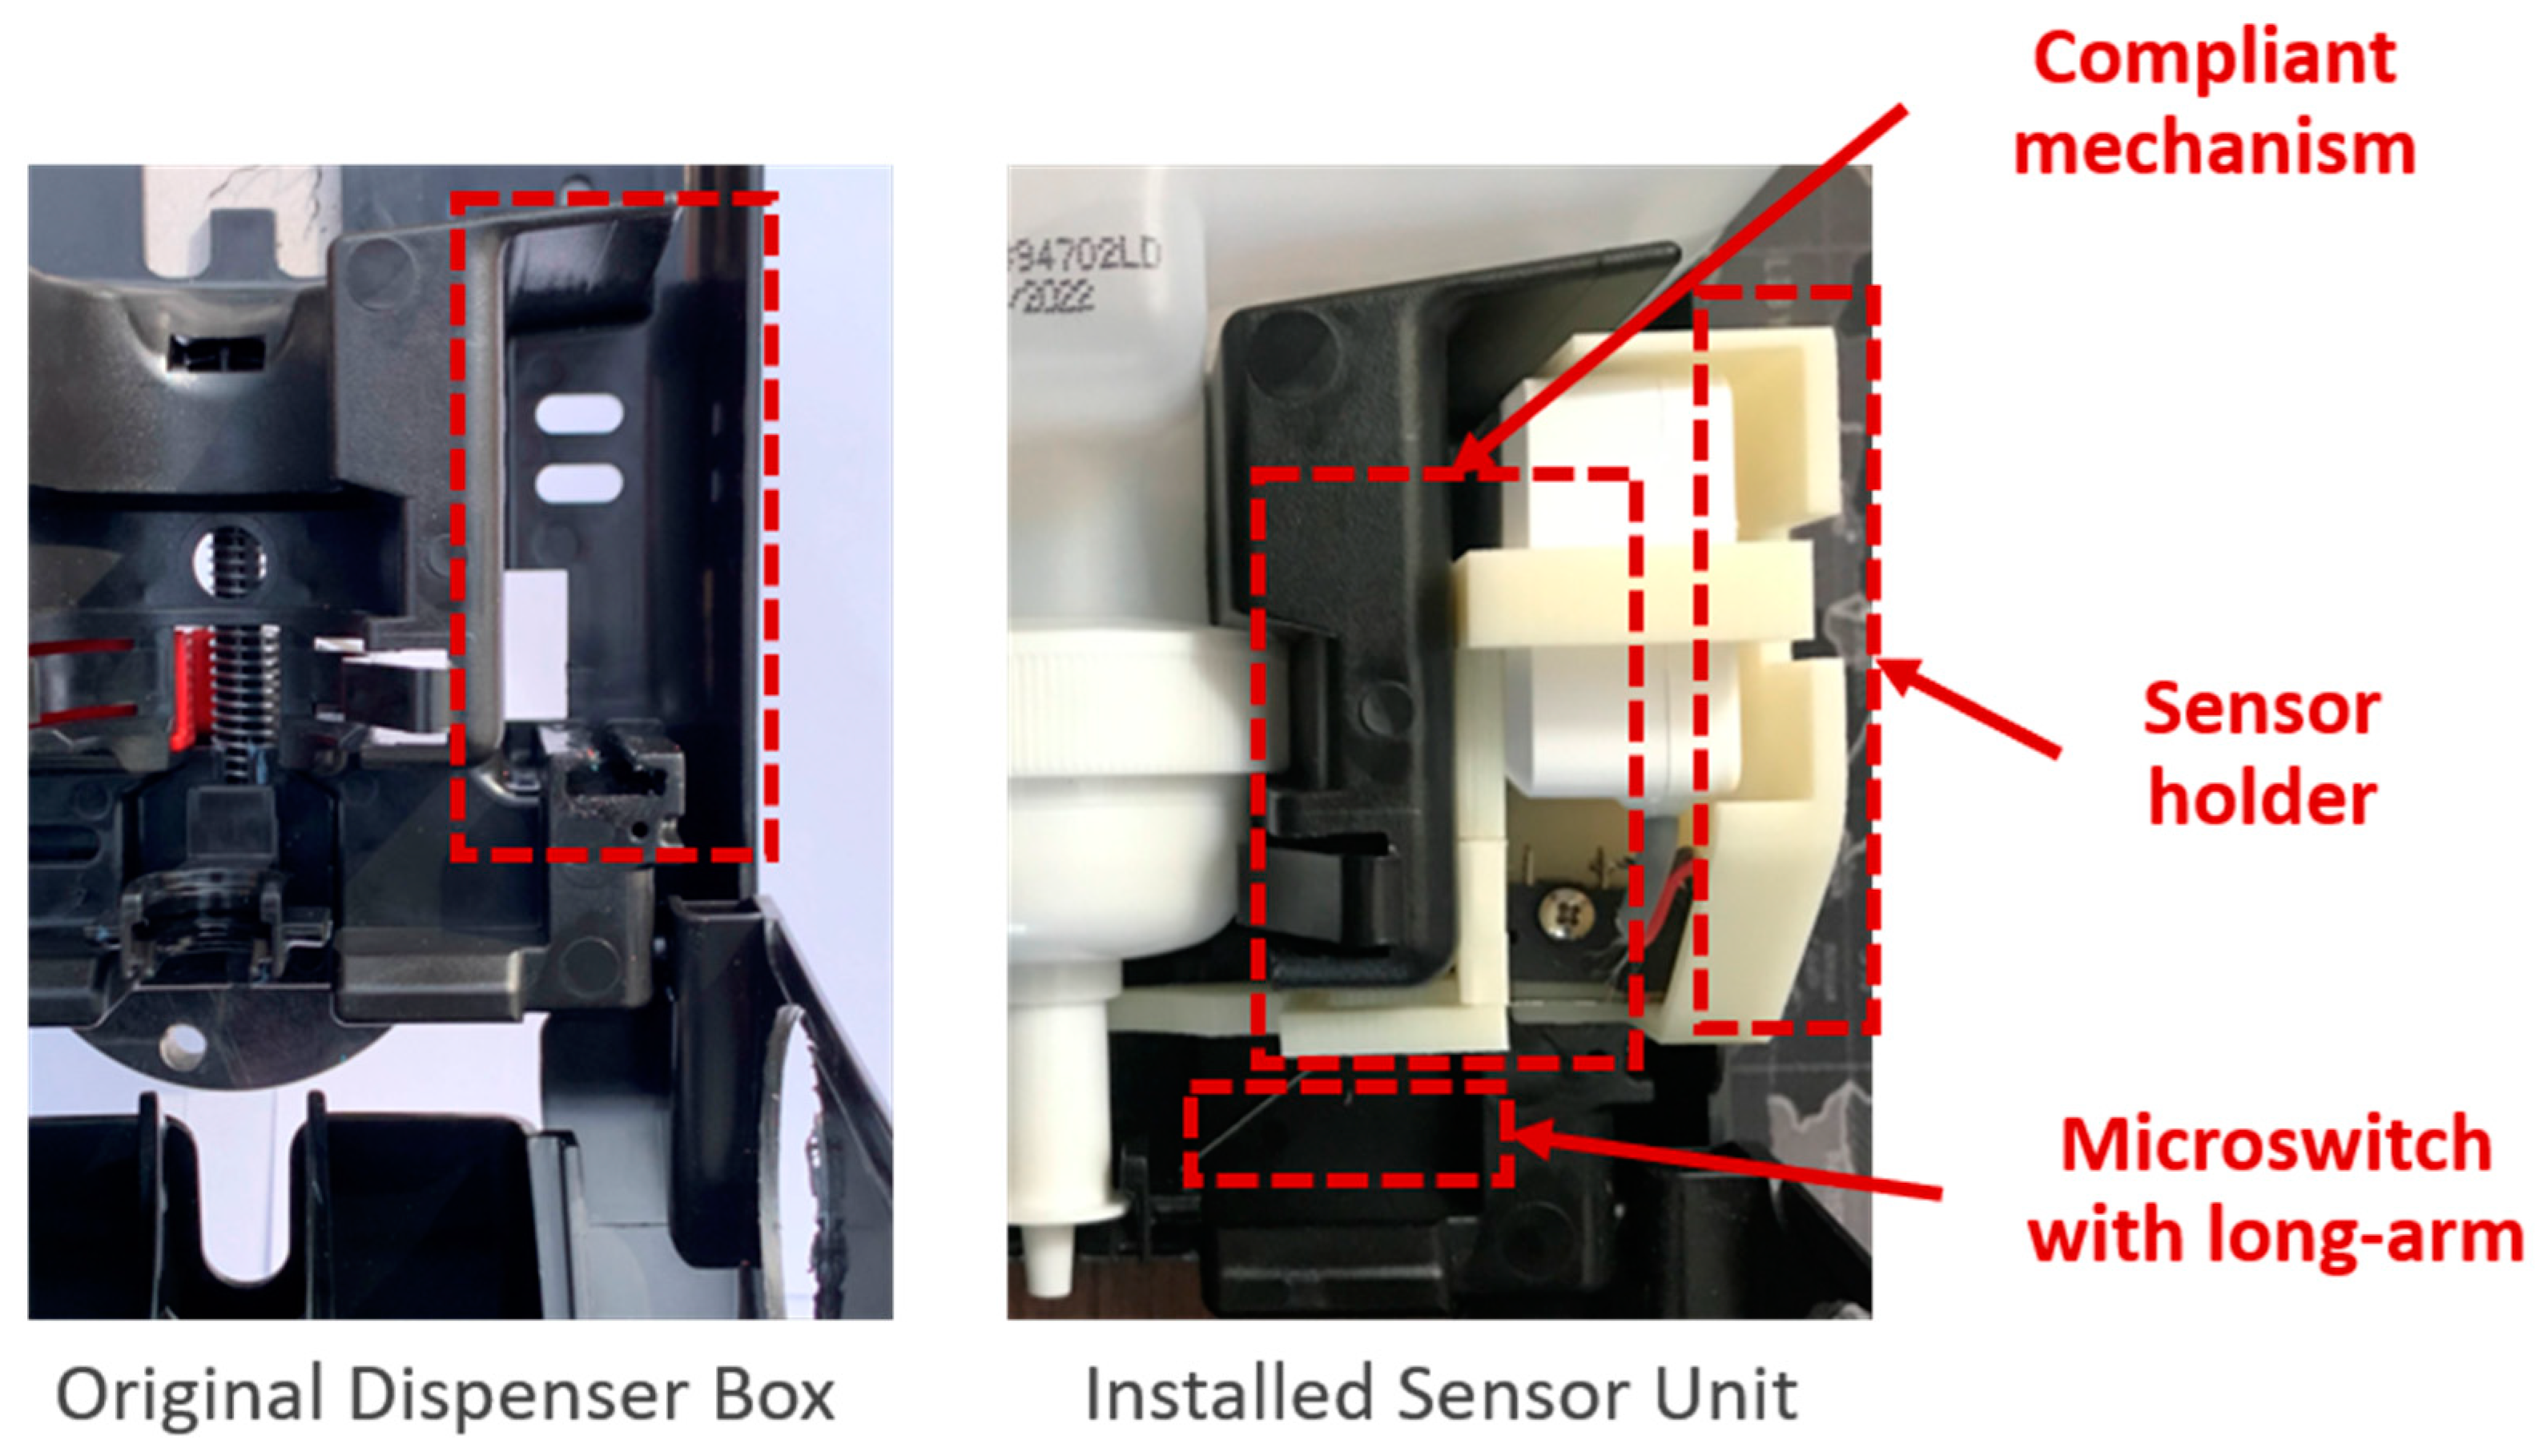
The existing sanitizer station used throughout campus is shown in Figure 4. The sanitizer bottle located inside the dispenser is squeezed and releases sanitizer when the user pushes the lever at the bottom. The dispenser needs to be opened to remove the spent bottle and replace it with a new bottle.

2.3.2. “Plug-and-Play” Sensor Unit Design for Monitoring Dispenser Interactions

The IoT system enables the monitoring of the dispenser and sanitizer usage patterns, and can be used to estimate the volume of sanitizer remaining within the dispenser, which can be used for prediction of which dispensers will be empty and when. By using the dry contact sensor, the system monitors two types of dispenser interaction events: (i) push of the dispenser lever by a user, which indicates when and how much is used (each lever push dispenses a given quantity of sanitizer) and (ii) opening of the dispenser for replacement of the sanitizer bottle. Recording of these two events allows the system to determine the number of “push” events that typically occur between replacement of the sanitizer bottle, which can be used (i) to infer when the dispenser will be empty and (ii) to develop a schedule for dispenser service. To accurately differentiate the two events, we developed two add-on components, a compliant mechanism and sensor module holder, and integrated them with the sensor module for plug-and-play deployment within each dispenser already located in the field.
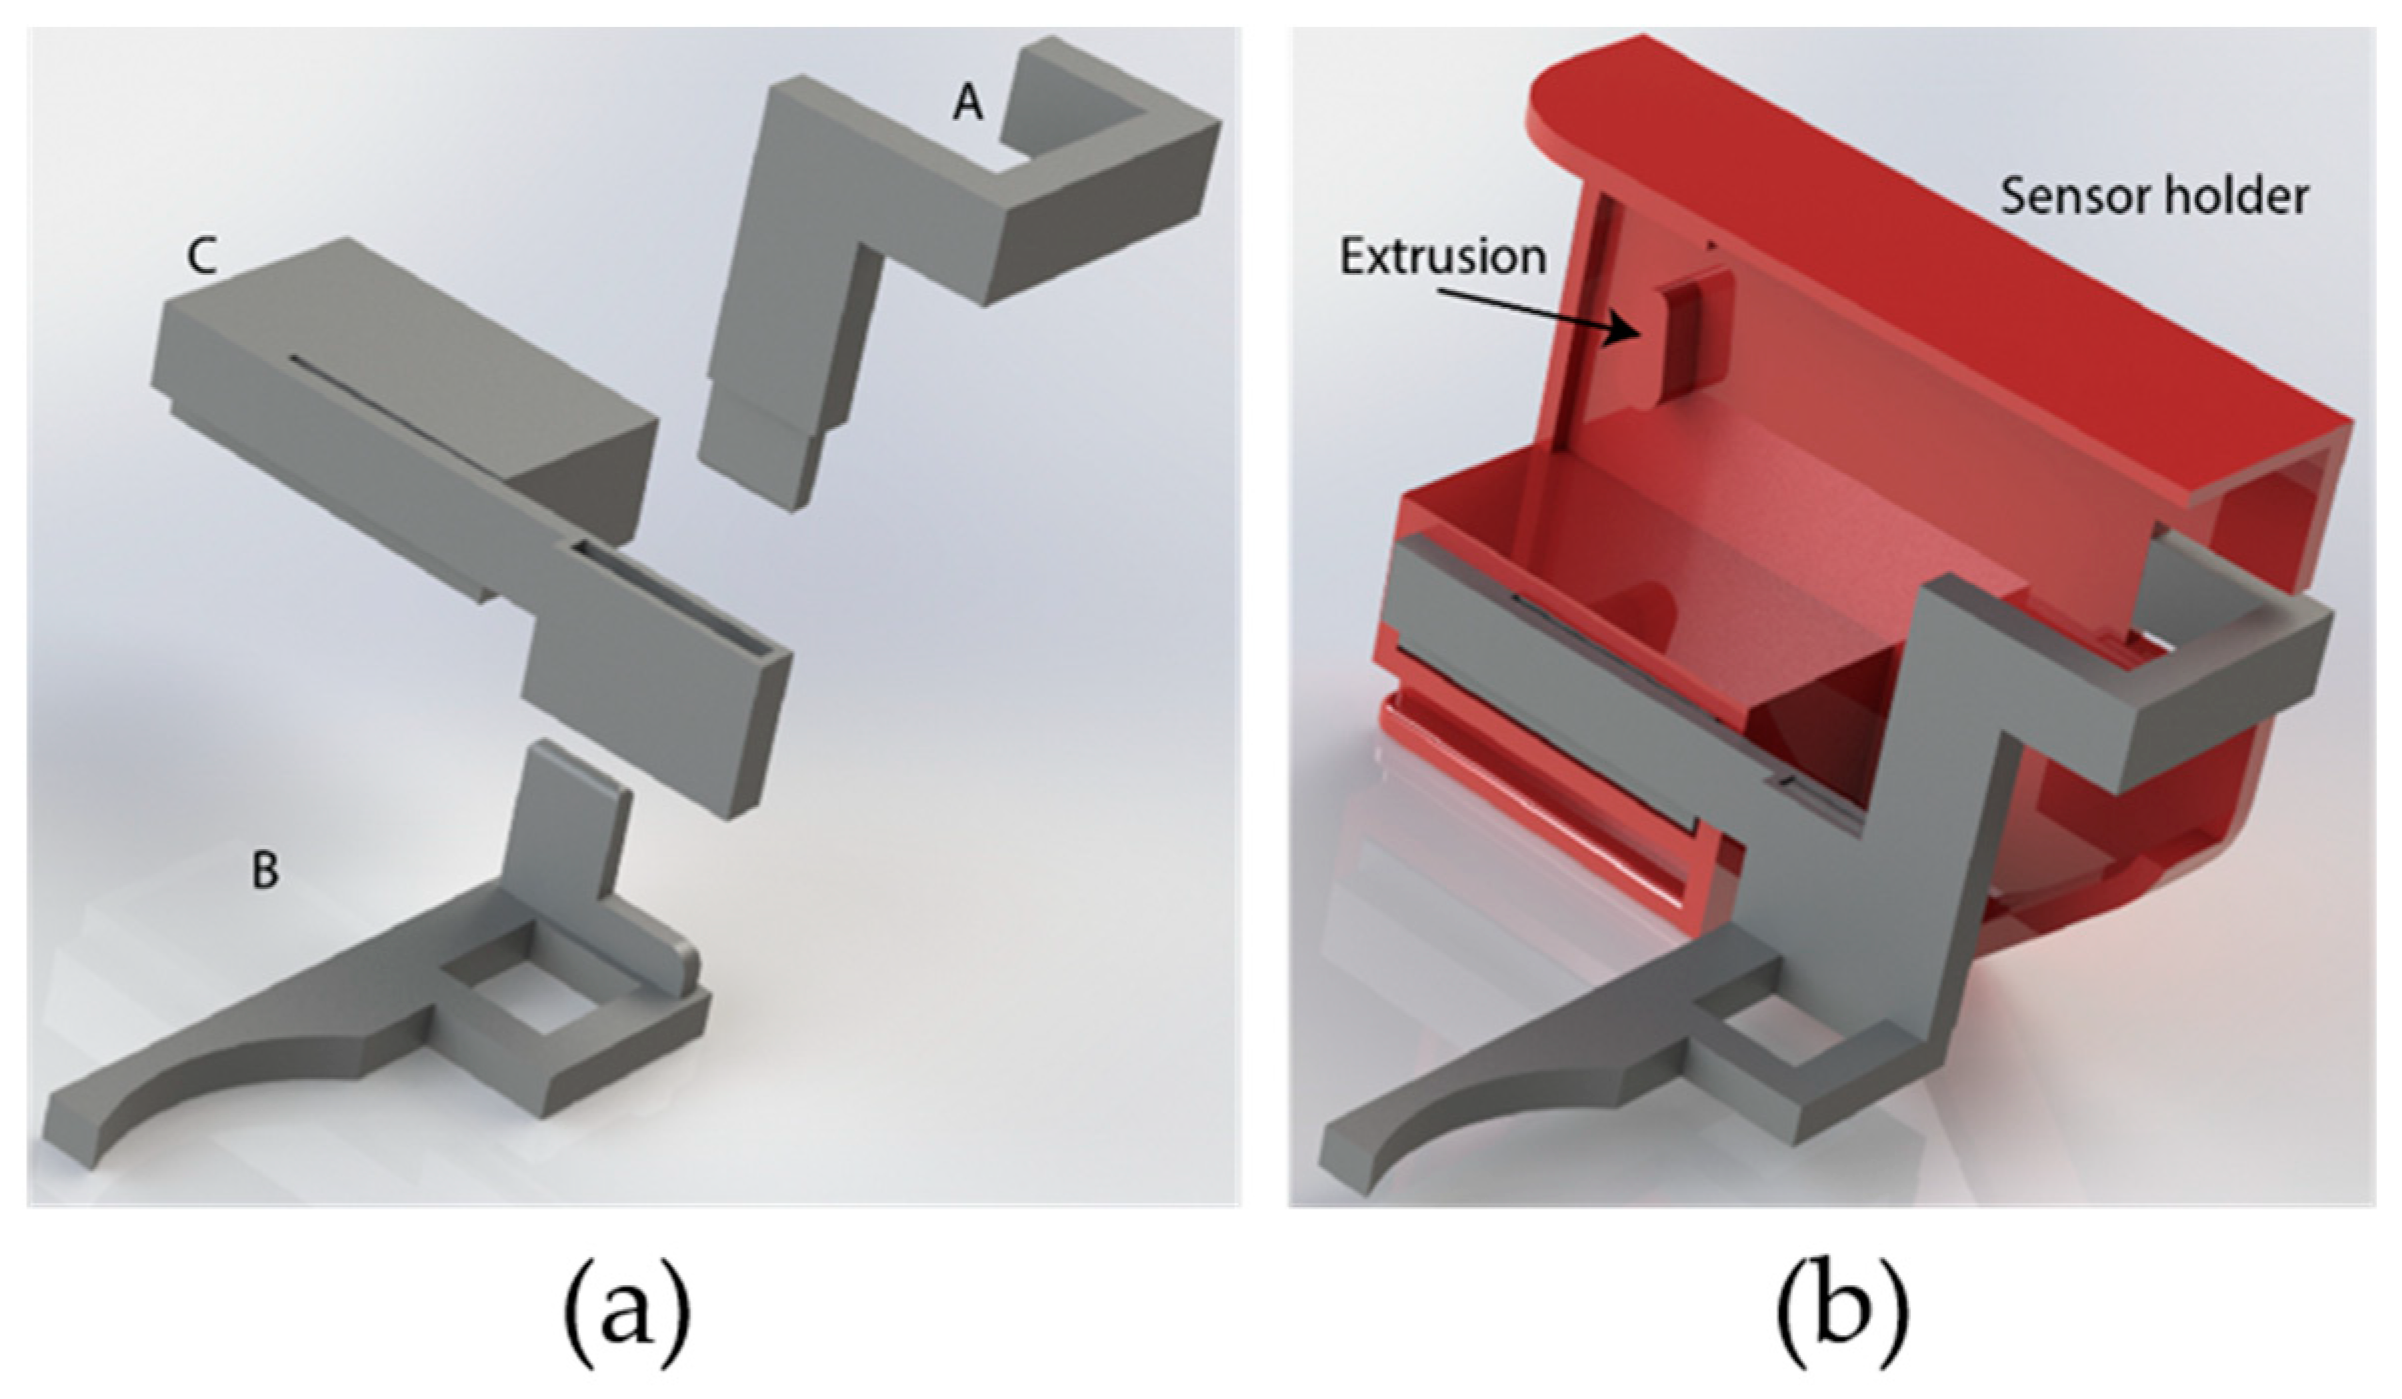
Compliant Mechanism. The compliant mechanism, shown in Figure 5 was designed to require no change in procedure for maintenance staff when replacing a sanitizer bottle. The device is based on a cantilevered beam and consists of three main components (Parts A, B, and C in Figure 5a). Part A wraps around the sensor module (left-most object in Figure 3), Part B contacts the sanitizer bottle when inserted, and Part C attaches to the sensor holder and contains the compliant beam. When a sanitizer bottle is inserted, Part B is pressed and deflects the beam in Part C, which is attached to Part A and pulls on the sensor module. The sensor module has an internal tamper switch that is depressed by an extrusion on its lid to detect when the lid is removed. The lid extrusion can be easily removed, providing external access to the tamper switch. The sensor module holder, shown in Figure 5b, has an extrusion on its face that contacts the tamper switch when the compliant mechanism is undeflected. Insertion of the sanitizer bottle causes the compliant mechanism to deflect, pulling the sensor box away from the sensor module holder and releasing the tamper switch from the extrusion, registering this event.
The compliant mechanism can be 3D-printed without the use of support material and is held together with an interference fit. The angle of the beam relative to the fixed portion creates an active load on the sensor box, keeping the tamper switch closed when a bottle is removed. Once a bottle is inserted, the beam will remain deflected (tamper switch open).
Sensor Module Holder. The sensor module holder and long-arm microswitch assembly detects the movement of the dispenser’s hand-actuated lever and triggers the “push” event. The sensor module holder is also 3D-printed. The design leverages the existing “T-Slot” feature on the original dispenser box for alignment and installation. The entire assembly is field-installed using a plug-and-play approach in less than 1 min per dispenser (Figure 6).

2.4. Wireless Network

The wireless network infrastructure includes (i) a wide-area network for communicating data collected by the sensor modules; (ii) a network server for receiving the sensor data; and (iii) an application server for hosting the received data, data analysis program, and reporting dashboards.

2.4.1. Wide-Area Network

The Long-Range Wide-Area Network (LoRaWAN) is used to connect the sensor modules located within the distributed dispensers. We used the MultiTech Conduit gateway (MTCDT-247A [32]) for creating the network, which has the following advantages:
  • Private WAN: the wireless network can be created using a single gateway without paying for access to a cellular network.
  • Long-range communication: the signal coverage range can be up to 10 miles (16 km) with line-of-sight and approx. 1–3 miles (1.5–5 km) around/inside buildings.
  • Cost-effectiveness: the LoRa network follows a “star topology”, with which a single gateway (USD 600) can cover up to hundreds of end-node devices for decreased cost of implementation.
In addition, although we did not implement this, it is possible to access existing open LoRaWAN networks that have seen deployment around the world.

2.4.2. Network Server

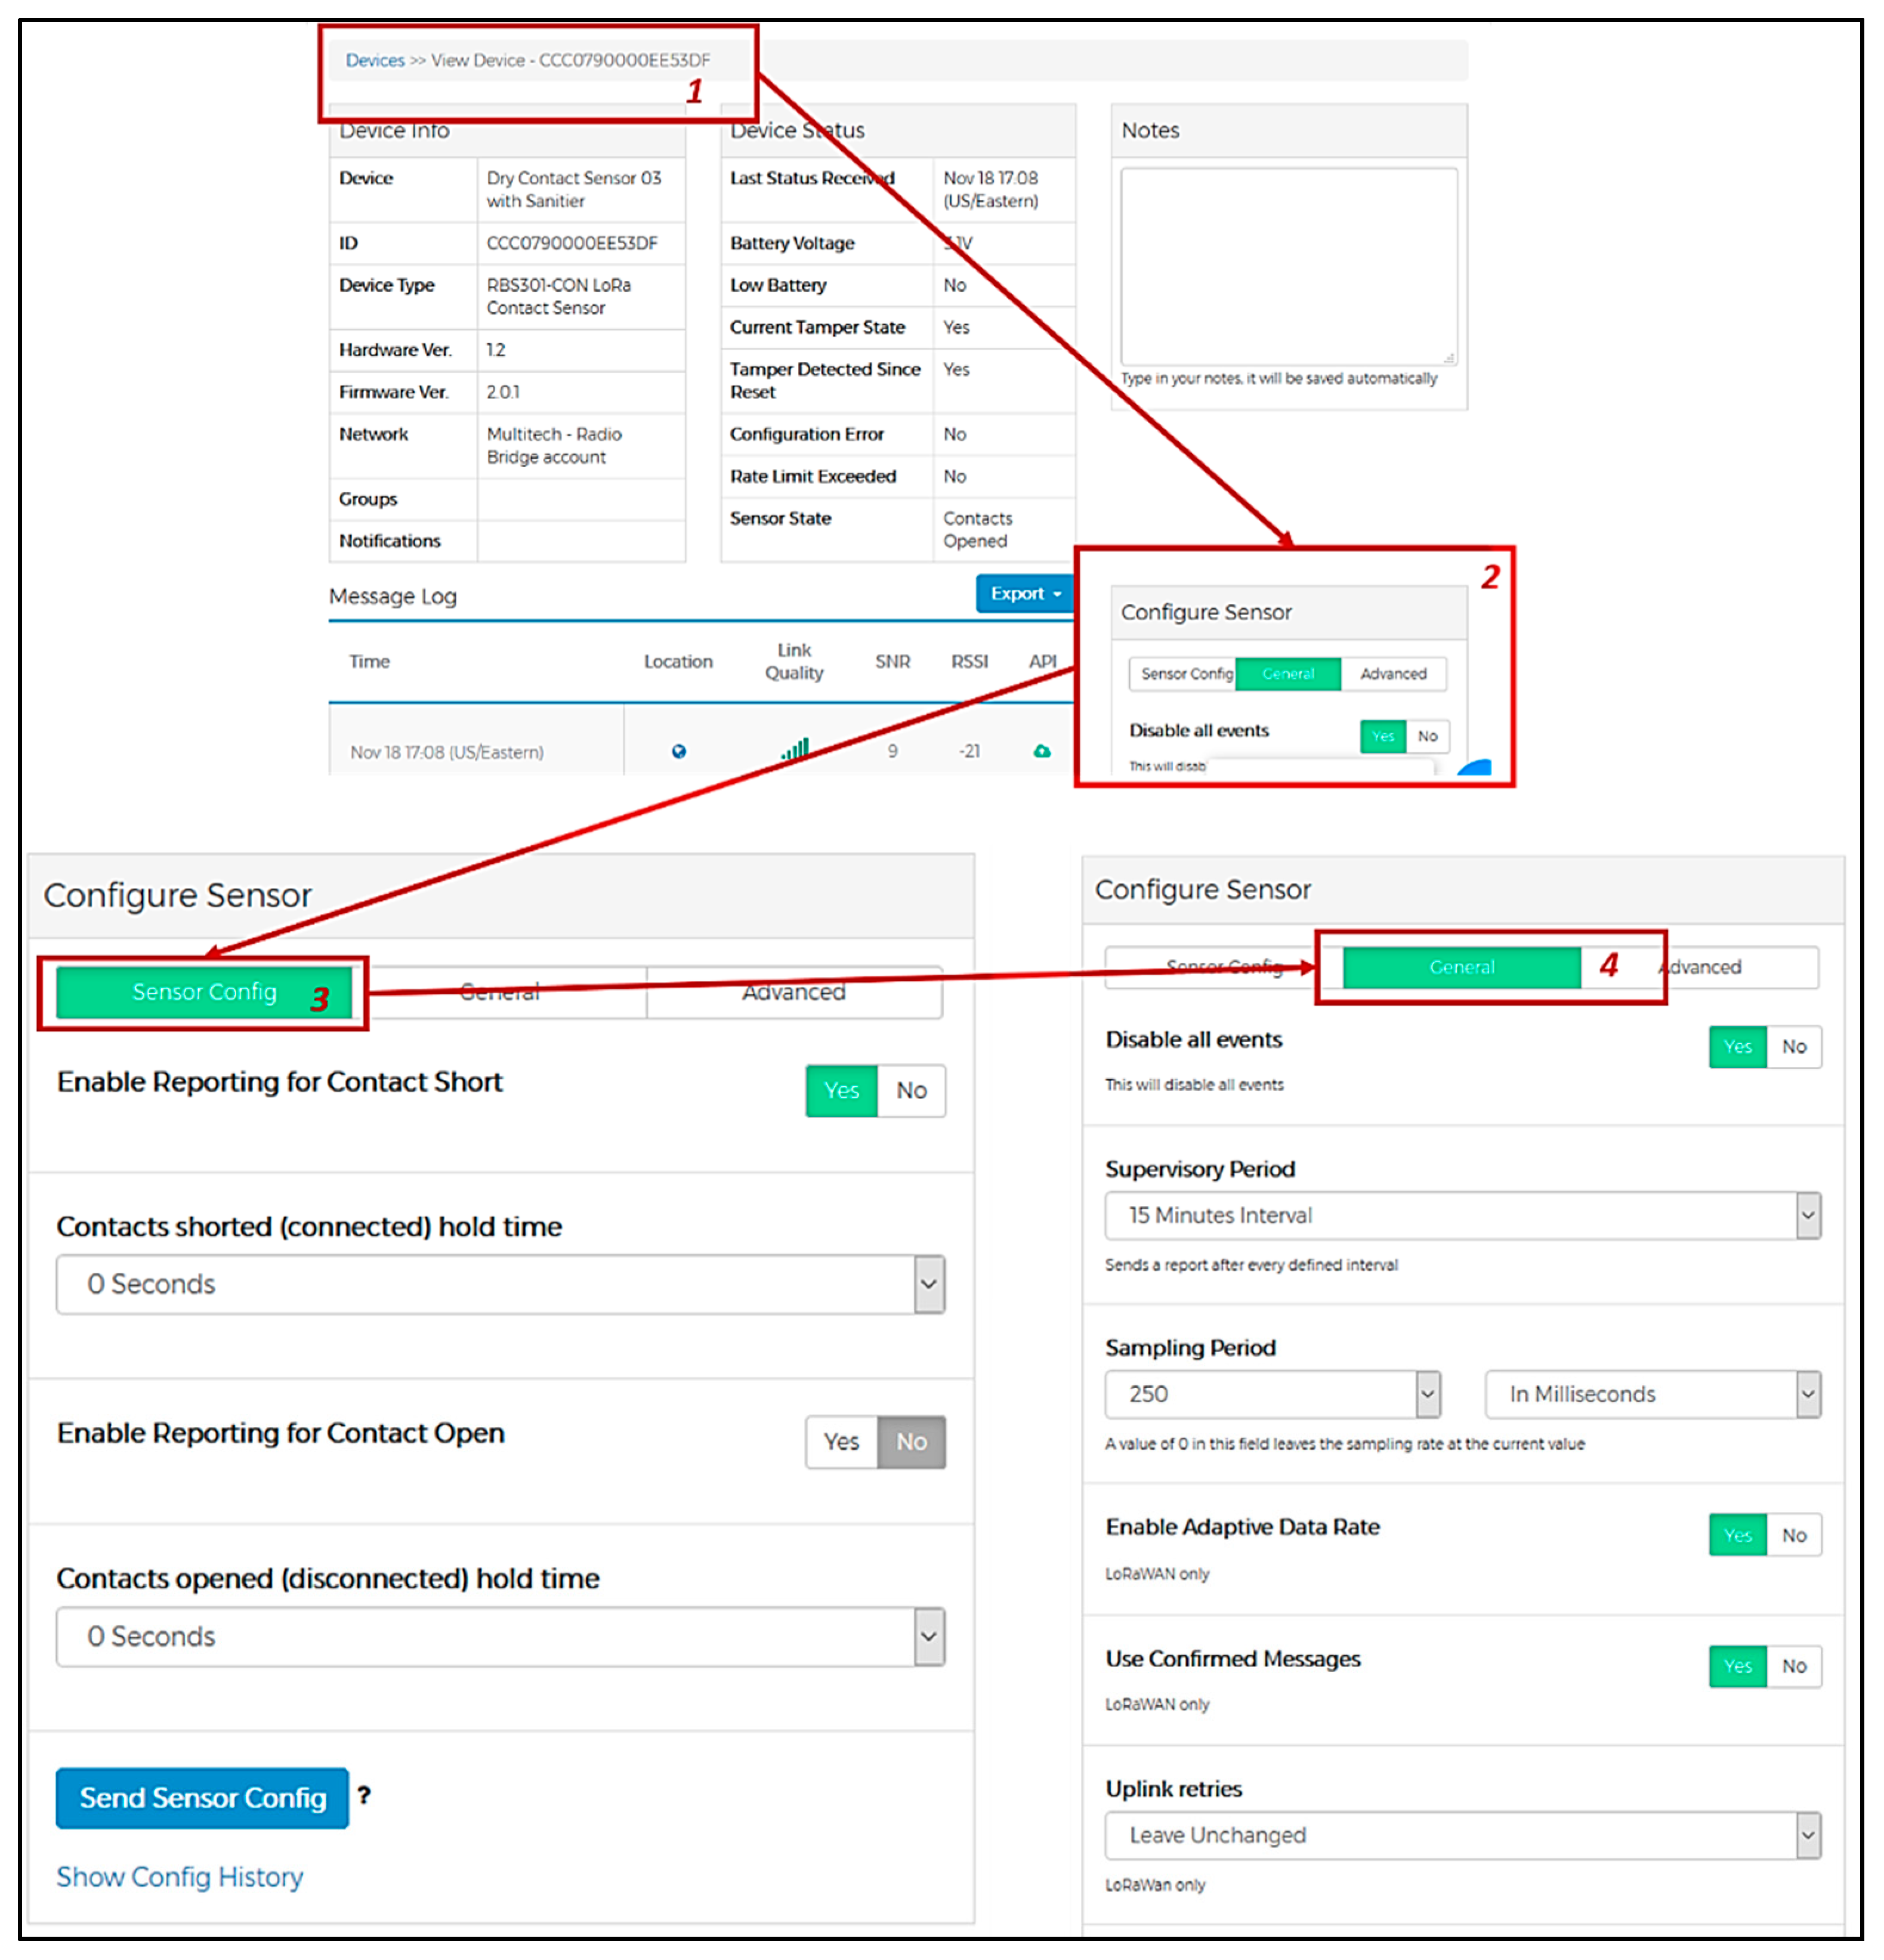
We used the Radio Bridge Console [31] as a network server, which is provided by the sensor manufacturer for receiving data and configuring sensors. Figure 7 shows an example of sensor configuration, during which the sensors were set to record only the “wire connection” event and accumulate all such events detected during a 10-min interval. (As either connection or disconnection indicates the dispenser lever has been pushed, recording only one of them is sufficient for indicating that the lever has been pushed.) A sample data packet received from the sensor is provided in Figure 8, which shows the sensor name (to identify the sensor, as signals from multiple sensors are sent to the console), time-stamp, event type, and signal quality encapsulated in the received data packet. Notably, the application programming interface (API) is provided by the console, which is an uplink for relaying data packets to the subsequent application server for analysis.

2.4.3. Application Server

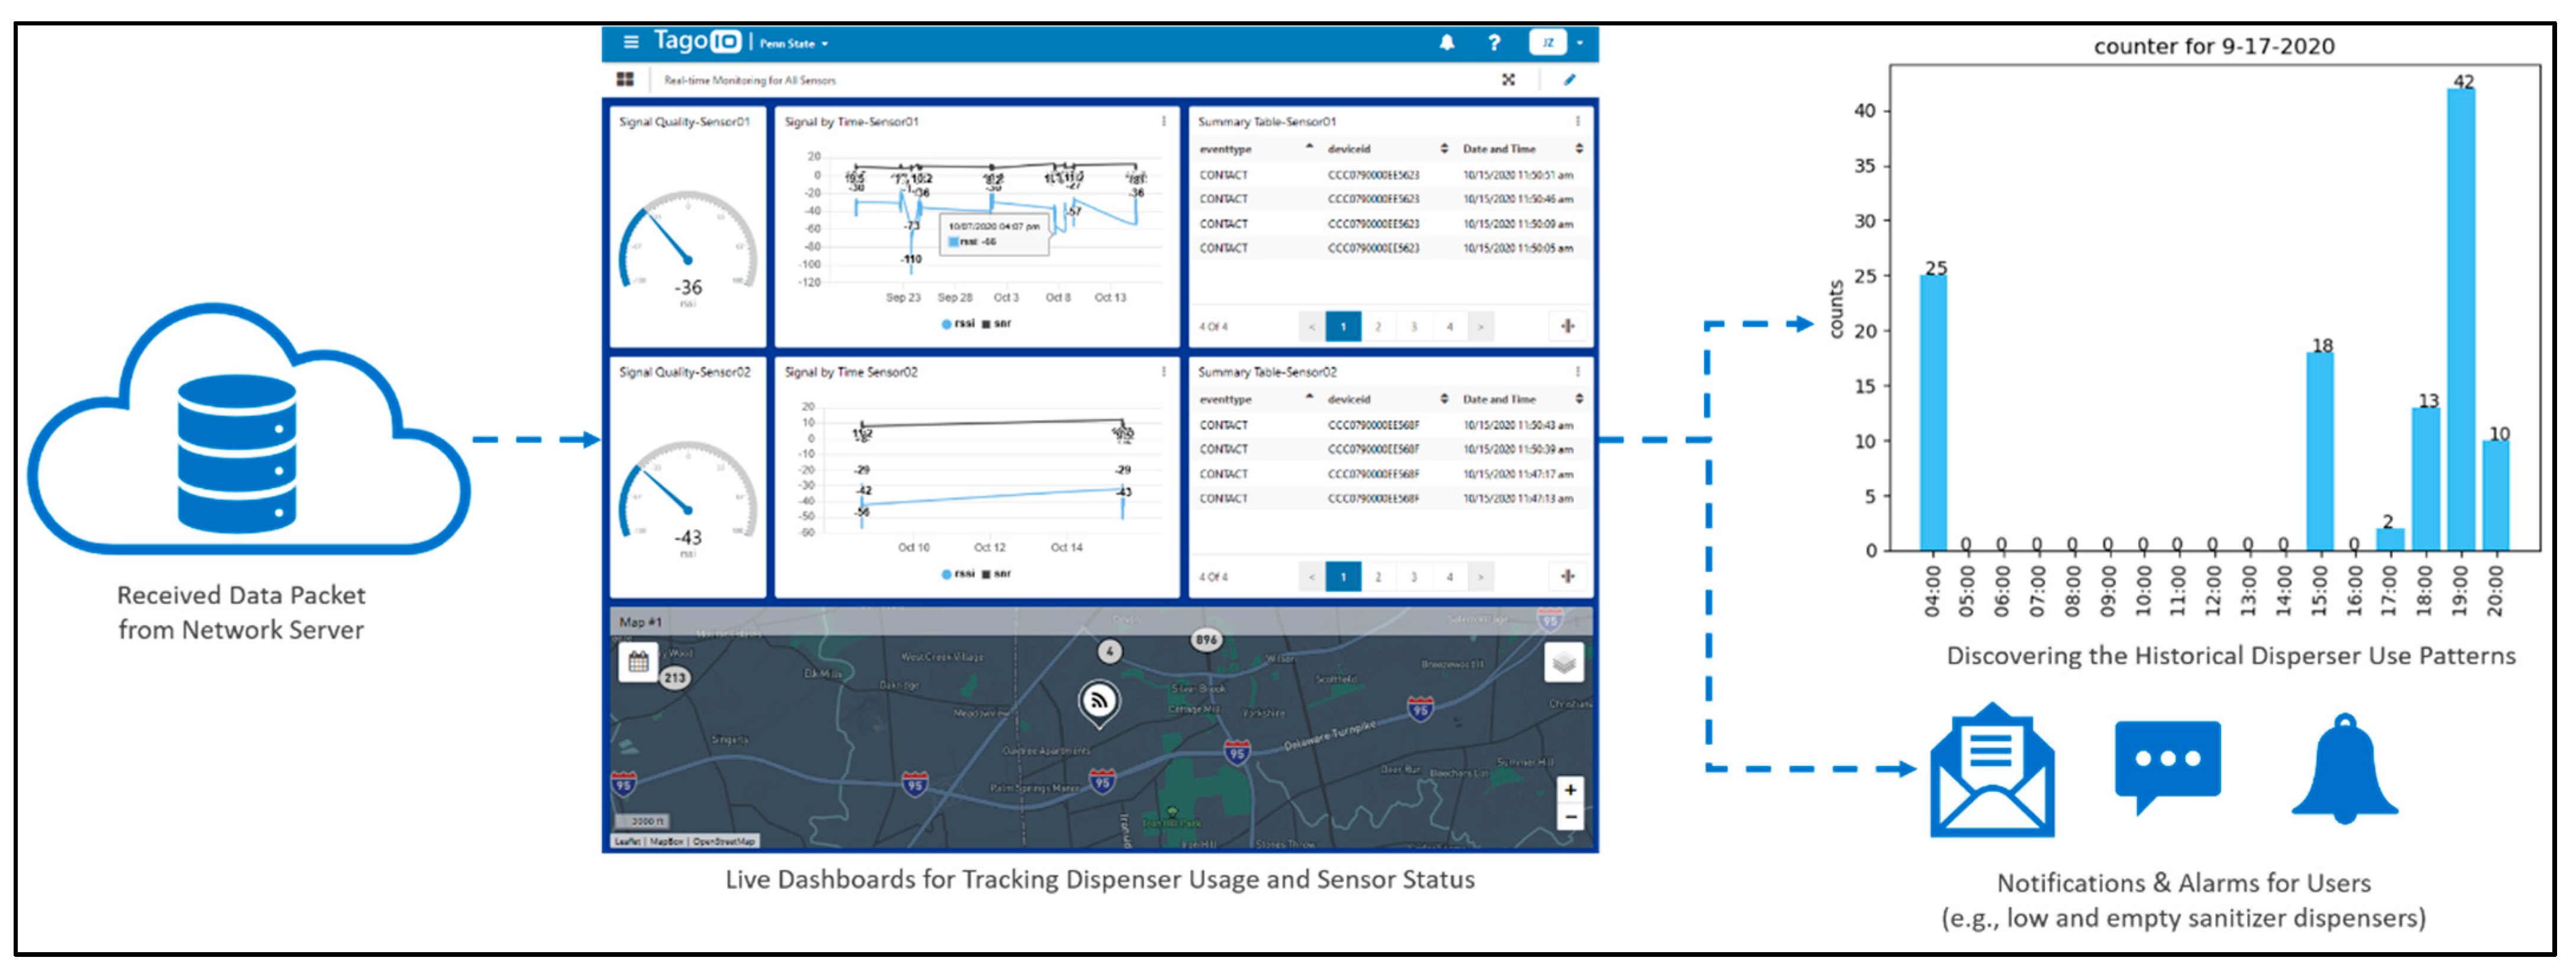
The TagoIO platform [33] was selected as the application server for storing, analyzing, and visualizing the sensor output. By processing the received data packet, the application server is designed to realize the following functionalities:
  • Sensor status checking: the received data packet is used to monitor the sensor operational status, such as signal quality (via the received signal strength indicator, RSSI) and battery life.
  • Real-time tracking of sanitizer usage: both the “push” and “replace” events are analyzed to monitor the number of push events after the most recent replacement, which tracks sanitizer usage.
  • Visualization: dispenser conditions and their locations are presented graphically.
  • Usage-pattern discovery: the recorded sanitizer usage data can assist in discovering historical patterns, such as the temporal and spatial usage trends on campus, which can help in assessing compliance with hand hygiene recommendations.
  • Early warning of empty sanitizers: rule-based alarms and notifications can be set to notify the facility managers and operators about sanitizer dispensers close to empty and those that are malfunctioning.
Notably, the sensor status checking and real-time tracking of sensor events (e.g., push and replace) were realized by running the authors’ program (in Python) on the TagoIO platform with an API (the TagoIO library) provided by the platform (Figure 9). Data visualization and pattern discovery were conducted via ad hoc analysis programs (mainly using the libraries Pandas and Matplotlib in Python). The notification function is a web application provided by TagoIO when sensing data are streaming into the platform. The codes and programs used in this study were available at the authors’ GitHub repository (https://github.com/JunqiZhao/IoT-Analysis/tree/master/Code, accessed 7 July 2021).

2.5. Test of Sanitizer Dispenser Network Operation

After the design and development of the proof-of-concept prototype, this study proceeded to validate the proposed system through a two-step procedure. First, for a single end-node sensor unit, we conducted a lab experiment to test the performance of different sensor configurations for reducing the missed detection of sensor events (see Section 2.5.1). Second, we further deployed 25 end-node sensors on sanitizer stations in a building as a field test, which helped to validate the operation of proposed sensor network in a real-world application scenario (see Section 2.5.2).

2.5.1. Test of Sensor Configuration

During our initial testing of the sensor module, we observed that, when the dry contact input was rapidly connected and disconnected, the event could miss being detected. Further investigation uncovered two possible reasons for this: (i) the fastest sampling rate of the sensor module is every 250 ms (4 Hz), so connect/disconnect cycles faster than this may be missed; or (ii) the sensor module does not register the event when sending information to the network server. To address these issues, we reconfigured the sensor mode to be “quasi-real-time”, in which the sensor keeps tracking the connect/disconnect events but stores this information on the sensor module, then sends out the cumulative counts at a fixed interval (e.g., every 10 minutes). Such an approach helps to mitigate the chance of conflict between dry contact detection and data communication.
A test was conducted to evaluate the effectiveness of reducing missed detections after the sensor module was configured as described above (see Figure 10 for comparison). Two dry contact sensors were connected then disconnected rapidly (about one connect and disconnect per second) 10 times, during which one of the sensors was reconfigured for data transmission at 1-min intervals and the other operated in real time. We repeated the test 10 times and compared the detected events from the two sensor modules. As the two sensors were connected/disconnected at the exact same time, the difference in the number of detected events could reflect the effectiveness of sensor configuration in reducing misdetection. The results of this test are discussed in Section 3.1.

2.5.2. Field Test of Sanitizer Network Operation

To test the operation of the proposed approach in a real-world scenario, we further deployed the developed prototype on a university campus as a case study. The Hammond Building on Penn State’s University Park campus was selected for deployment of the developed sensor units due to its size and the large number of installed sanitizer stations. The Hammond Building is a four-story (with sub-basement) building that was constructed in the 1950s using reinforced concrete with an aluminum frame curtain wall and internal metal walls. It has a total area is 159,912 sq. ft. [34] and represents an extremely challenging environment for radio-frequency propagation. As shown in Table 2 and Figure 11, a total of 24 sensors were deployed in sanitizer stations throughout the building. The gateway was deployed on the second floor, near the center of the building. The gateway was connected to the building’s IT network via a 1000 BT wired connection.
To test the gateway coverage and sensor signal quality, we kept all the sensors operating for five consecutive days from 1 to 5 January 2021. All the sensors were configured with a 10-min reporting interval that reported all the detected events within that interval. The test results are presented and discussed in Section 3.2.

3. Results and Discussion

3.1. Test of Sensor Module Configuration

The objective of the sensor configuration test was to identify the proper sensor configuration for reducing the missed event detections. The results of the sensor reconfiguration test are provided in Table 3 The error rate in this test was defined as the ratio of missed event detections under different configurations. Results in Table 3 show the interval-based approach had an average error rate of 0.06 among 10 independent experiments. However, the real-time approach had an average error rate of 0.7, indicating over 70% of contacts in the experiments were missed. These results suggest that configuring the sensor module to an interval-based event transmission approach can effectively reduce the number of missed events when compared with the real-time approach. The results also indicate that the data transmission was the primary issue leading to missed event detection as both real time and interval-based approaches had the same sampling rate. As we discuss above, the sensor module can miss an event when transmitting data across the network. Of these two mechanisms, the second was the primary cause of missed events. Therefore, the interval-based sensor configuration was selected for a subsequent field test.

3.2. Test of System Operation in the Field

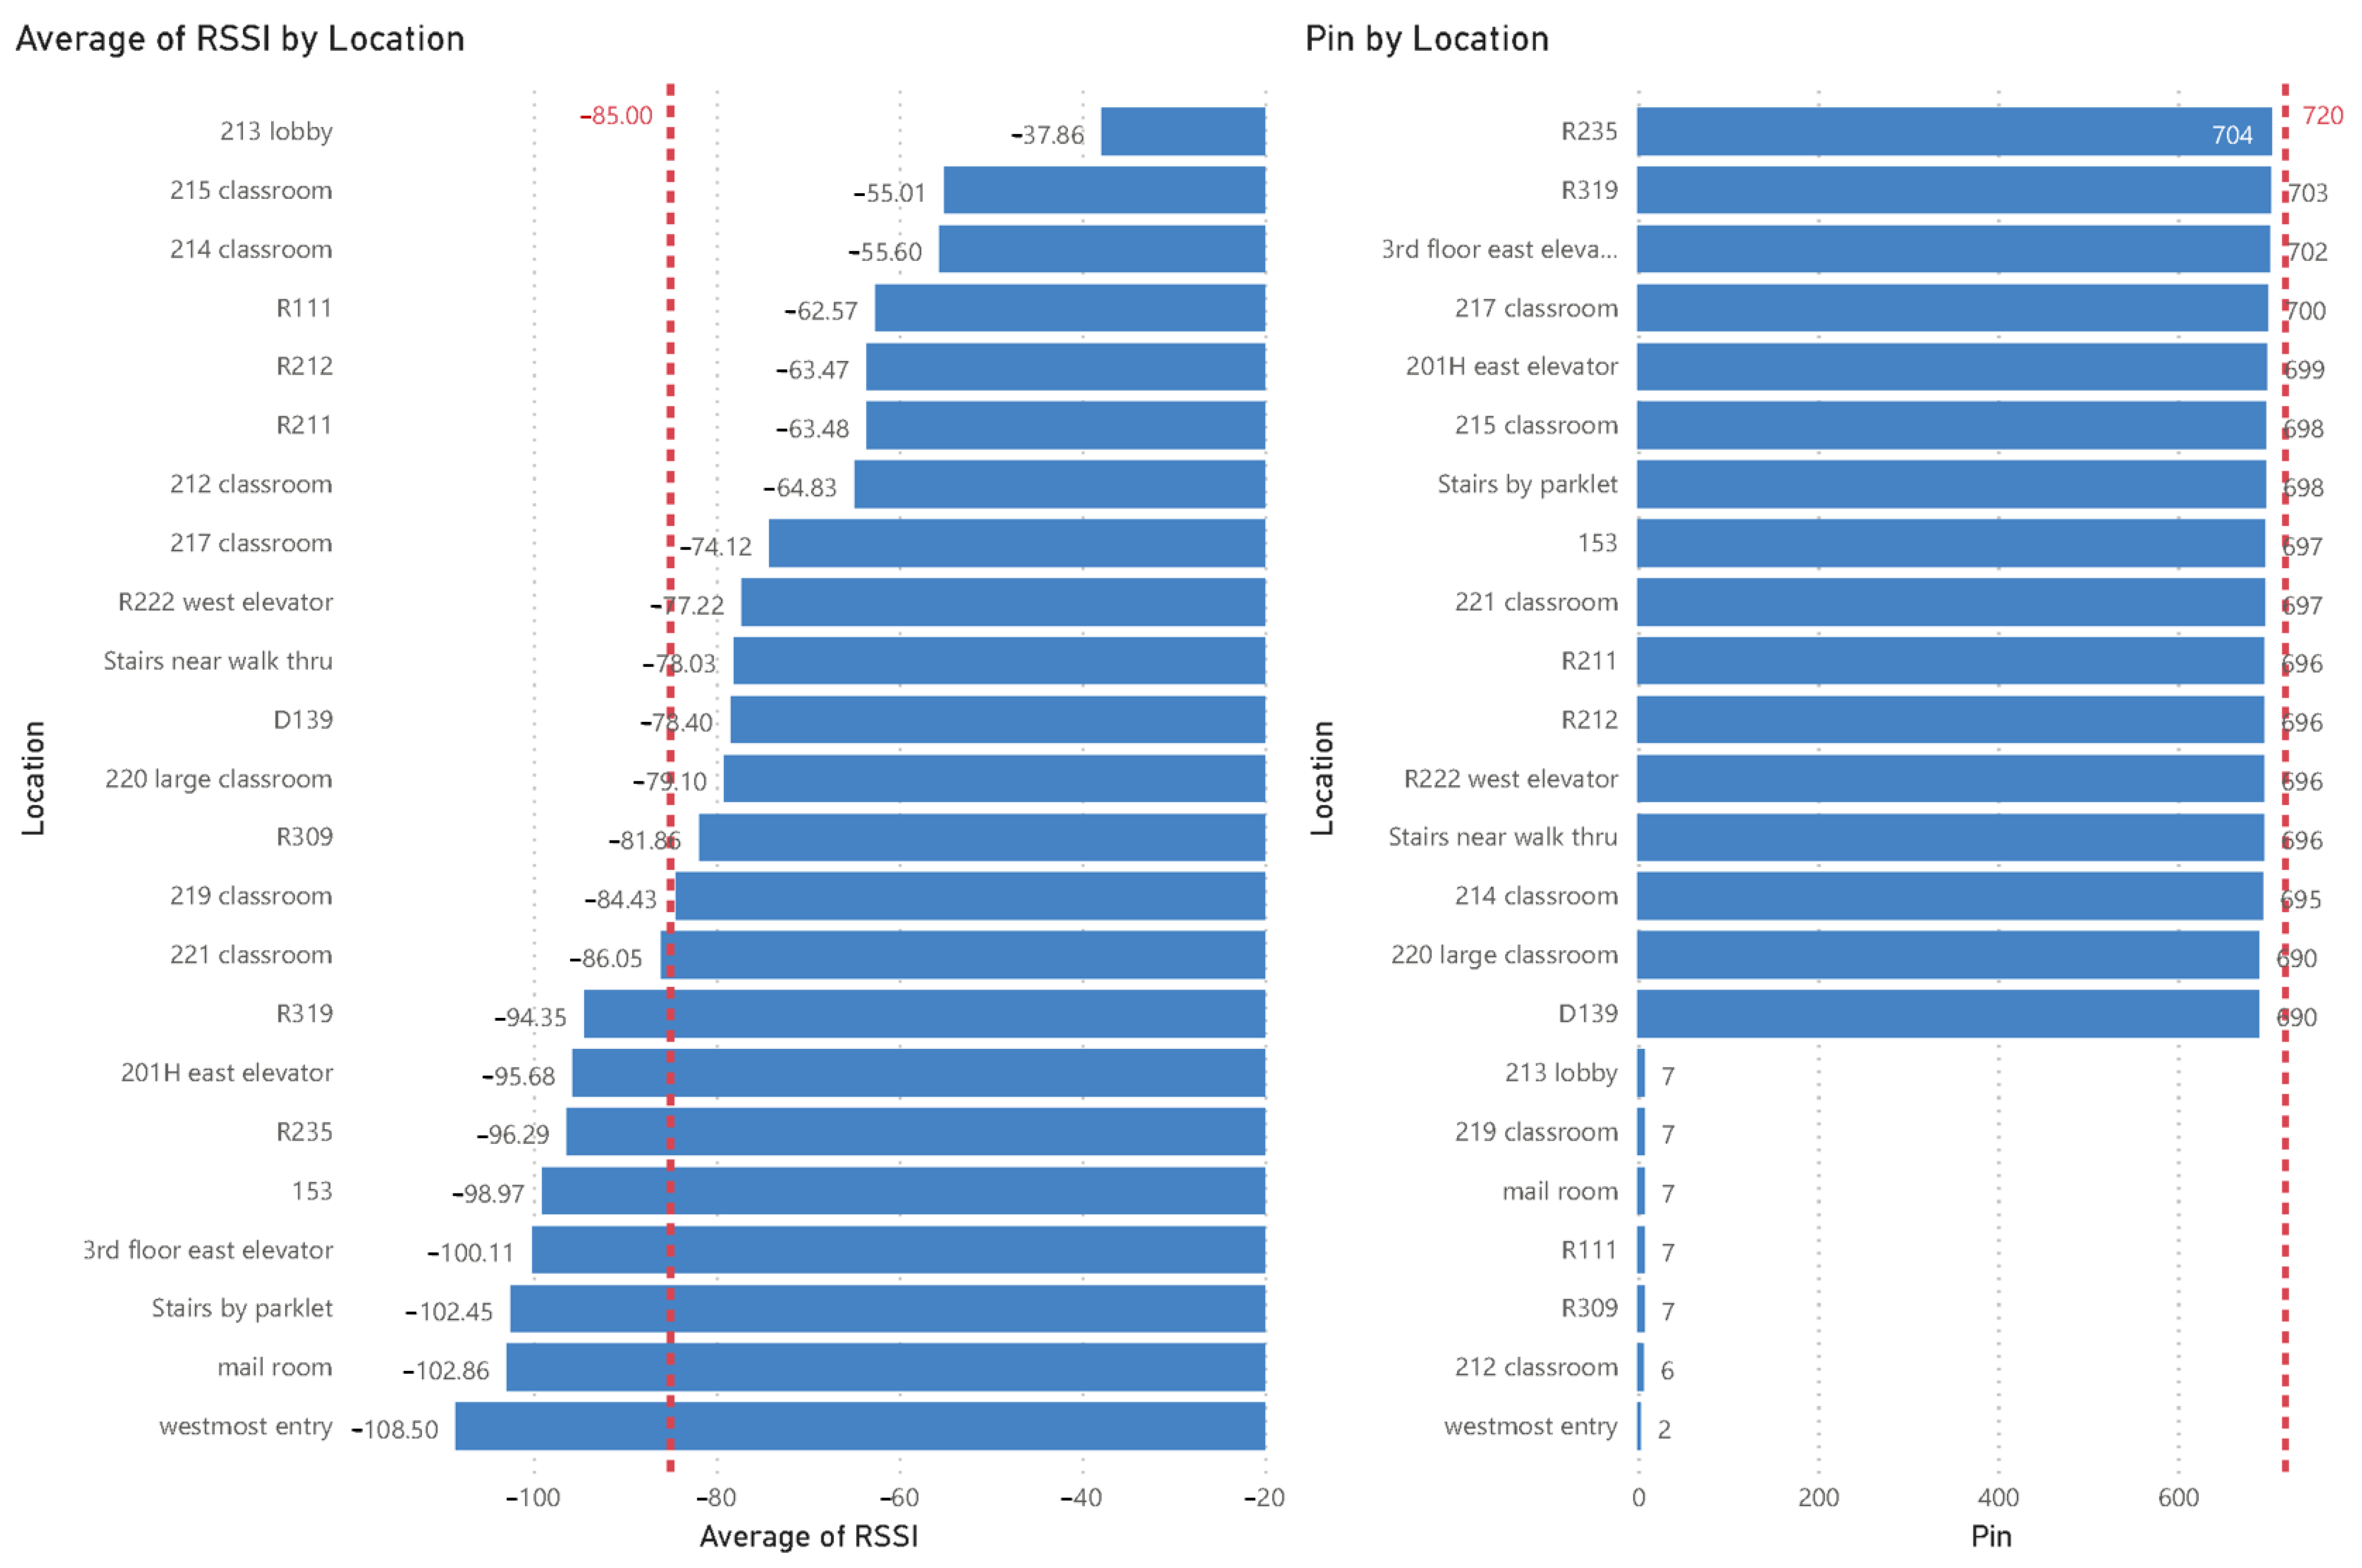
The field test aimed at validating the operation of proposed sensor networks in a real-world application scenario. In this initial study, we evaluated the signal coverage of the deployed sensor network and whether the messages from the sensors could be successfully detected when deployed at scale. The field test results are summarized in Table 4. After deployment of the sensor network in the Hammond Building, we first examined signal quality by sensor location, as shown in Figure 12 with sensor location illustrated in Figure 11. We compared the average signal quality, measured by RSSI, of the received signal from each sensor module over a five-day period. The results show the average RSSI of 23 sensors was −85 dBm, with all RSSI values above −120 dBm.
The results suggest that the received signals were of fairly good quality according to the standards suggested in [35,36]. Even the messages from sensors deployed on a floor different from the gateway location floor (such as R319 on the third floor and D139 on the first floor) could be successfully captured with low error rate of around 0.03. It is also important to note that data from one sensor installed near Room 205 were missing. This may not have been caused by low signal quality since signal quality was good for even the sensors installed on the first and third floors, farther away from the gateway. Room 205 was also close to Room 213, where the gateway was installed.
We then evaluated whether the deployed network registered all events sent from the sensors. If the sensors worked as configured, a total of 720 messages should have been received from each sensor (each sends out a message every 10 min over five days). The error rate in this test also denoted the ratio of event messages from the sensors that were missed. As shown in Table 4, 16 sensors worked properly, as we observed an average error rate of 0.03, and around 700 messages were received from each sensor. Other than the one sensor (Room 205) with the lost connection, seven sensors showed unstable connections with very few messages (no more than 7) received.
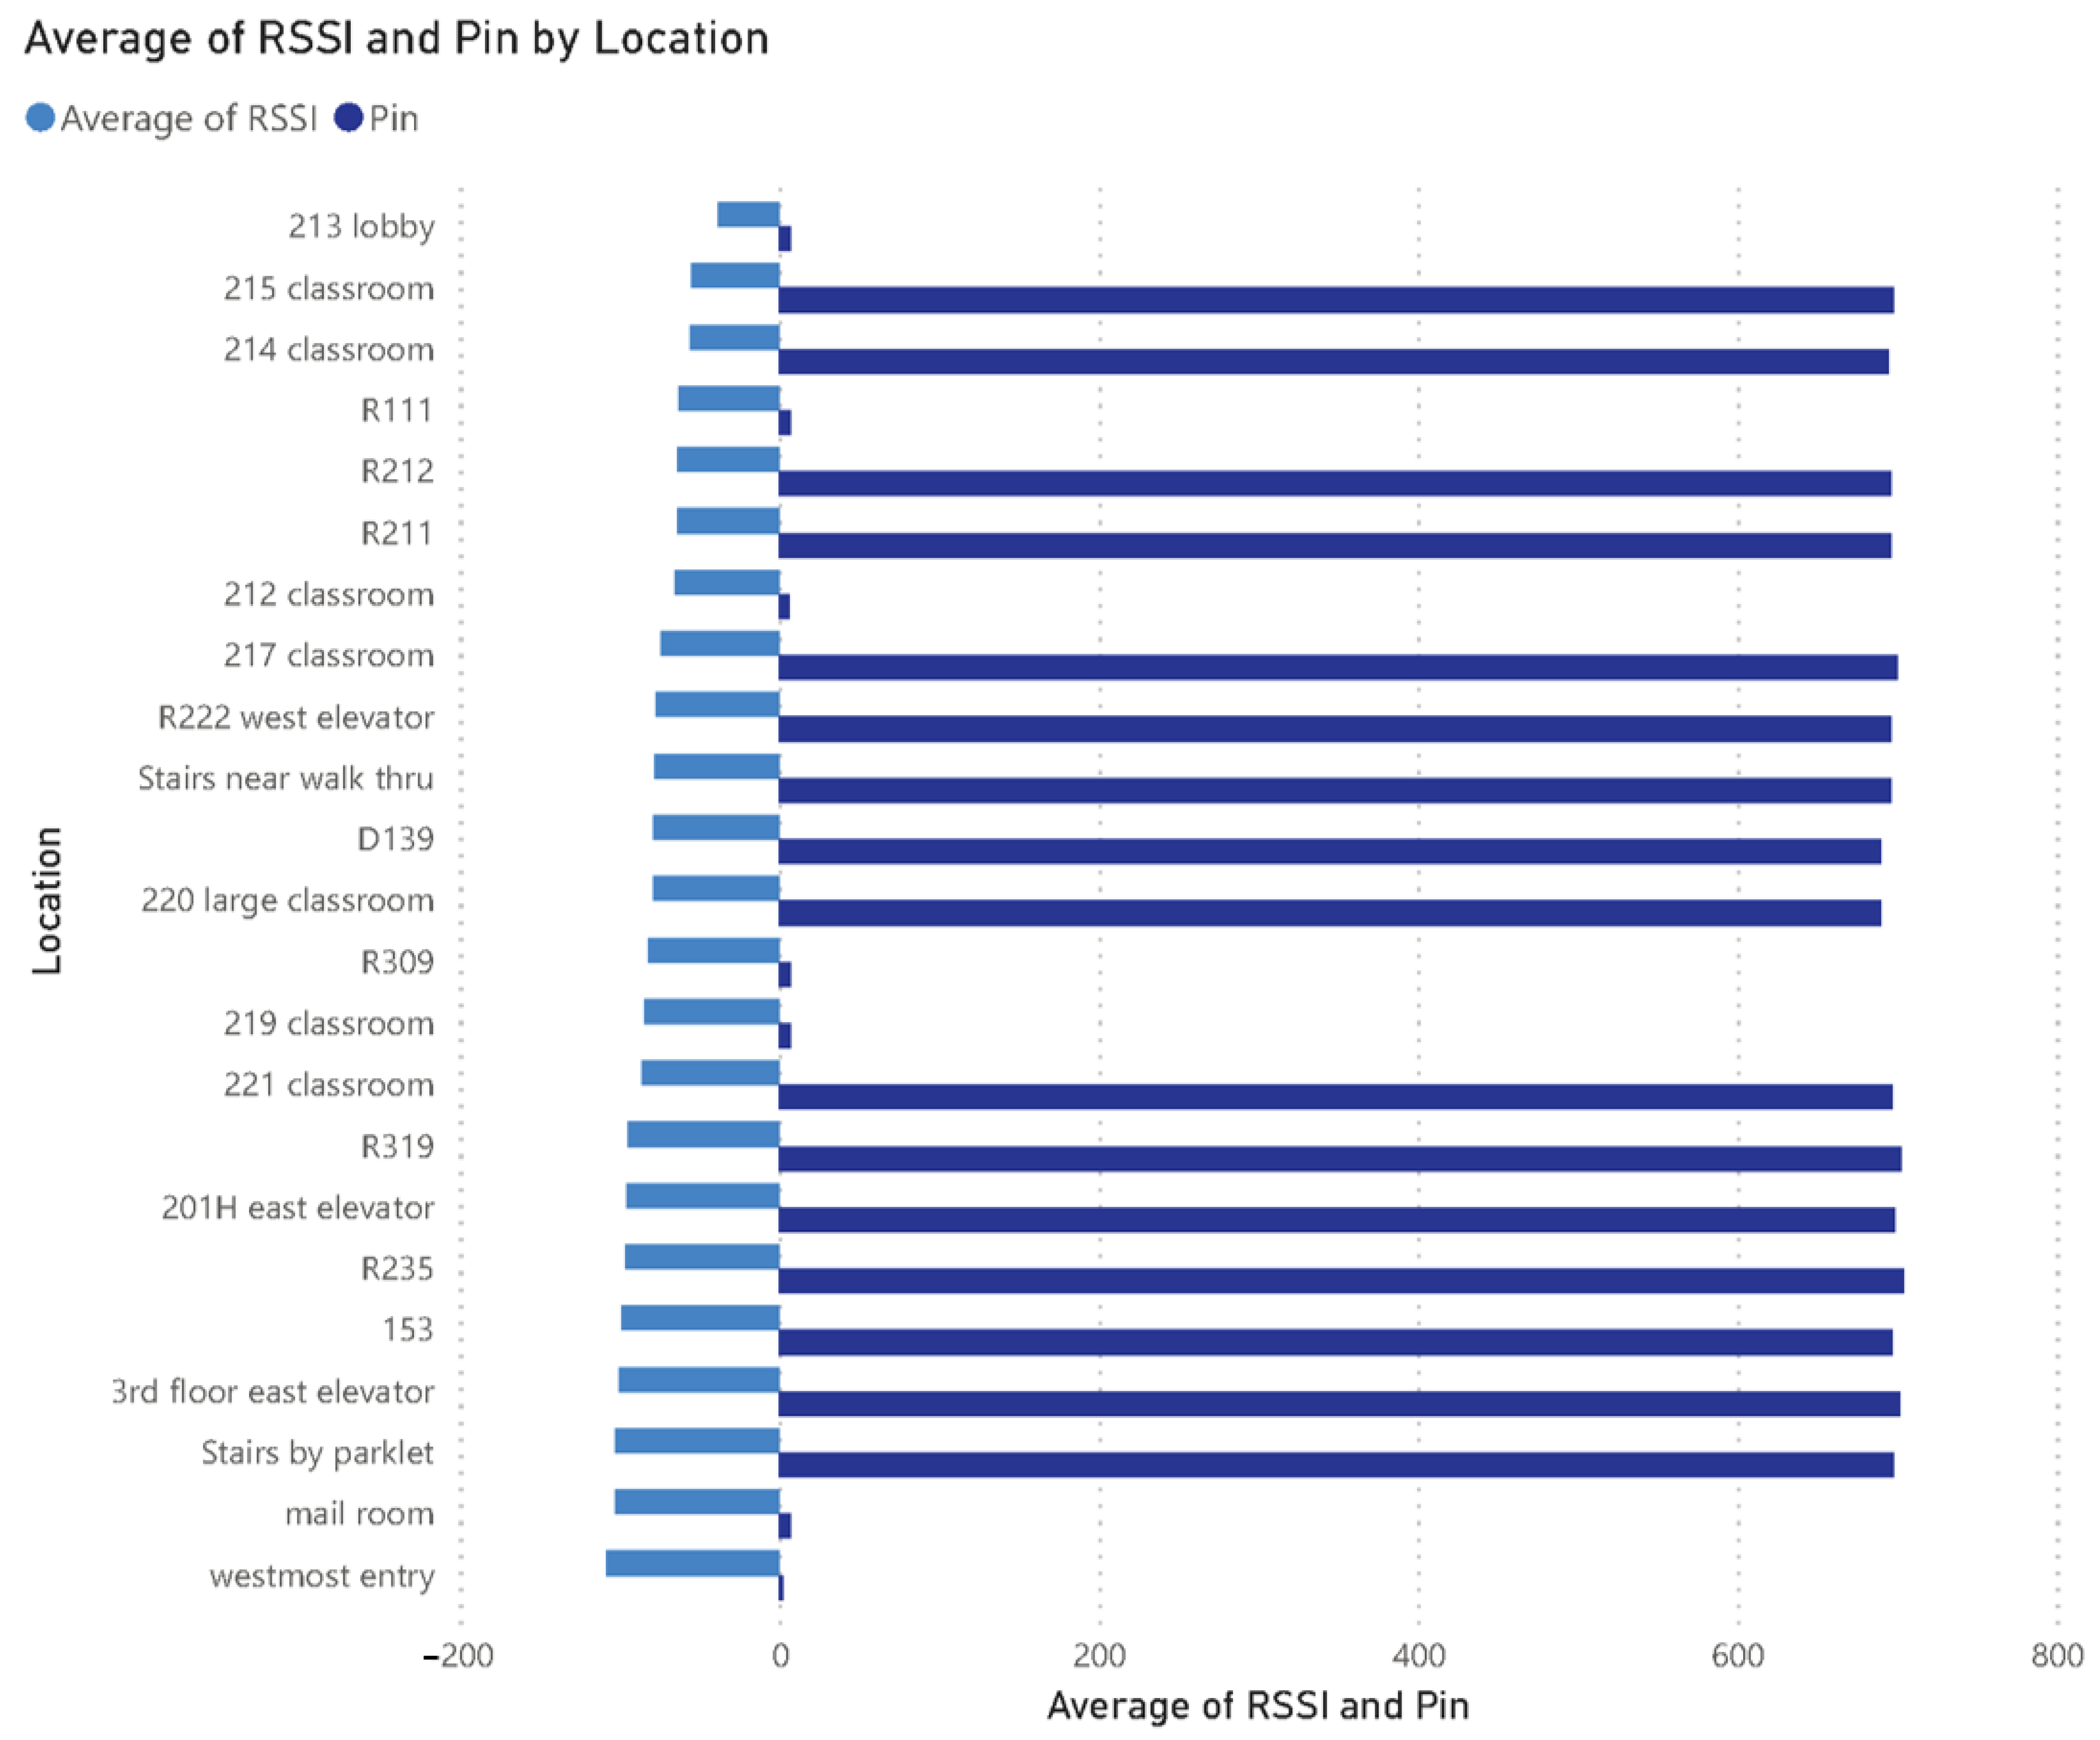
Figure 13 shows a further comparison of the number of received messages by sensor signal quality. Results showed that the low signal quality may not necessarily lead to the missing of messages from the sensors. For example, the sensor placed at the “stairs by parklet” worked properly even without a high-quality signal. The sensor with a strong signal quality could also miss packets, such as the sensor in the 213 lobby, closest to the gateway. Further work should be conducted to investigate the factors besides signal quality affecting the number of events received.
In summary, the test results suggest that the LoRaWAN network created by a single gateway has an acceptable signal coverage (measured by received signal quality) in a multi-story building on campus, which can support the scalable deployment of a sensor network in an urban environment. Most of the deployed sensors also demonstrated acceptable performance with relatively low missed packet rate, which indicates the deployed sensor units can work properly in the configured LoRaWAN network. It is also worth noting that signal coverage alone may not fully explain unstable sensor performance (denoted by a large number of missed events from sensors with good signal quality), which warrants further investigation in next research stage.

4. Conclusions, Limitations, and Further Work

4.1. Conclusions

In this study, we developed an IoT-based system for monitoring the usage of sanitizer dispensers in a public facility. The system integrated low-cost wireless sensors, 3D-printed housings, LoRaWAN, and cloud-based computing techniques into a proof-of-concept system. The modules were deployed in a building on the university campus for testing the system’s operation in the real world. The field test showed that using a LoRaWAN network with a single gateway can successfully connect with sensors distributed throughout the entire building with fairly good signal quality. The developed system is able to detect events caught by the sensors for further analysis. In addition, configuring the sensor modules to transmit data at fixed intervals can effectively reduce the missed detection of events compared with a real-time approach. It is, however, important to note the factors besides signal quality that can impact the system operation, which warrant further investigation. Overall, research results demonstrate the potential of leveraging the IoT-based Sanitizer Station Network for tracking public health within large facilities, which ultimately contributes to alleviating the burden of public health during and after the pandemic.

4.2. Limitations and Further Work

The work discussed in this paper represents of a proof-of-concept system. Several limitations are noted regarding this initial study and warrant further research. First, due to the limited duration of the field test, there were limited data for estimating how many sanitizer station usages (i.e., push events) were needed to empty the sanitizer bottle. Obtaining such information will help to estimate the remaining sanitizer in the bottle and the time intervals between replacement. In addition, a rigorous statistical test regarding the system performance was not conducted in this initial study to assess the system performance, such as a systematic test of whether the error rate of the real-time approach was significantly higher than the interval-based approach. An extended field test is warranted for rigorous statistical analysis. In addition, issues other than sensor signal quality may impact the sensor operation stability, which warrants further investigation. Lastly, there were no “replacement” events detected from the field test. We tested if a bottle replacement event could be detected by removing and replacing a bottle during the field test, demonstrating the effectiveness of the compliant mechanism; however, further field validation is required to verify the 3D-printed module can distinguish the replacement events during the regular use of sanitizer stations.
Further studies will be conducted to fully realize the functionality of the proposed system and extend the current system for a broader application scenario. Below we outline the further works built on the current study.
First, to enhance the facility usage monitoring, we will calibrate the sanitizer dispensers regarding the number of push events needed to empty a full sanitizer bottle. Such information is helpful to infer sanitizer usage based on the utilization of dispensers.
Next, the information captured from the sensors can be integrated with applicable cloud services for scalable deployment. One such extension is integrating sensor location information with the geographic information system (GIS), such as using the ArcGIS Velocity cloud. Combining facility usage with location information would facilitate intelligent route planning and scheduling for optimizing the facility (i.e., sanitizer stations) maintenance workflow. To improve the scalability of the current system, we can also ingest the sensor’s captured data to cloud servers such as Azure Event Hubs and IBM Watson. These IoT platforms would facilitate the usage of captured data across users with diverging interests and leverage more powerful intelligent tools for developing predictive models based on captured data.
Additionally, given that the current system focuses on detecting the “contact” events, the system can be readily adapted to monitor a broader range of similar public hygiene facilities, such as soap dispensers and trash cans. Moreover, the contact events captured in buildings are typically triggered by occupants. The detected contact events can be used as a proxy of occupants’ behavior, which allows us to investigate the interaction between occupants and the building environment. One such application we are exploring is assessing the impact of occupants’ behavior (e.g., window open/close) on indoor air quality [37] and building energy consumption. These applications ultimately contribute to the smart and healthy buildings environment.

Author Contributions

Conceptualization, J.Z., J.P.B., R.G.B., J.P.P., and S.G.B.; methodology, J.Z., B.Z., J.P.B., R.G.B., J.P.P., and S.G.B.; software, J.Z. and B.Z.; validation, J.Z., B.Z. and S.G.B.; formal analysis, J.Z. and B.Z.; investigation, J.Z., B.Z., J.P.B., R.G.B., J.P.P., and S.G.B.; resources, J.P.B., R.G.B., J.P.P., and S.G.B.; data curation, J.Z. and B.Z.; writing—original draft preparation, J.Z.; writing—review and editing, J.Z., B.Z., J.P.B., R.G.B., J.P.P., and S.G.B.; visualization, J.Z. and B.Z.; supervision, S.G.B.; project administration, S.G.B.; funding acquisition, S.G.B. All authors have read and agreed to the published version of the manuscript.

Funding

This research was funded by the School of Engineering Design, Technology, and Professional Programs and the Manufacturing and Sterilization for COVID-19 (MASC) initiative at Penn State.

Data Availability Statement

The data sets used in this study are available from the corresponding author upon request.

Acknowledgments

The authors would like to acknowledge School of Engineering Design, Technology, and Professional Programs; the College of Engineering’s Networking, Computing, and Training Services unit; and the Office of Physical Plant at Penn State for their support of this study.

Conflicts of Interest

The authors declare no conflict of interest.

References

  1. Cdc.gov. COVID-19 and Your Health. Available online: https://www.cdc.gov/coronavirus/2019-ncov/prevent-getting-sick/prevention.html (accessed on 27 March 2021).
  2. Love, J.; Keegan, L.T.; Angulo, F.J.; McLaughlin, J.; Shea, K.M.; Swerdlow, D.L.; Samore, M.H.; Toth, D.J. Continued need for non-pharmaceutical interventions after COVID-19 vaccination in long-term-care facilities. medRxiv 2021. [Google Scholar] [CrossRef]
  3. Galanti, M.; Pei, S.; Yamana, T.K.; Angulo, F.J.; Charos, A.; Swerdlow, D.L.; Shaman, J. The importance of continued non-pharmaceutical interventions during the upcoming SARS-COV-2 vaccination campaign. medRxiv 2020. [Google Scholar] [CrossRef]
  4. Gozzi, N.; Bajardi, P.; Perra, N. The importance of non-pharmaceutical interventions during the COVID-19 vaccine rollout. medRxiv 2021. [Google Scholar] [CrossRef]
  5. Andrade, R.O.; Yoo, S.G. A comprehensive study of the use of LoRa in the development of smart cities. Appl. Sci. 2019, 9, 4753. [Google Scholar] [CrossRef] [Green Version]
  6. Biyik, C.; Allam, Z.; Pieri, G.; Moroni, D.; O’Fraifer, M.; O’Connell, E.; Olariu, S.; Khalid, M. Smart Parking Systems: Reviewing the Literature, Architecture and Ways Forward. Smart Cities 2021, 4, 623–642. [Google Scholar] [CrossRef]
  7. Jaid Jim, A.A.; Kadir, R.; Mamun, M.; Al, A.; Nahid, A.-A.; Ali, M. A noble proposal for Internet of garbage bins (IoGB). Smart Cities 2019, 2, 214–229. [Google Scholar] [CrossRef] [Green Version]
  8. Fahmideh, M.; Yan, J.; Shen, J.; Mougouei, D.; Zhai, Y.; Ahmad, A. A Comprehensive Framework for Analyzing IoT Platforms: A Smart City Industrial Experience. Smart Cities 2021, 4, 588–622. [Google Scholar] [CrossRef]
  9. Syed, A.S.; Sierra-Sosa, D.; Kumar, A.; Elmaghraby, A. IoT in Smart Cities: A Survey of Technologies, Practices and Challenges. Smart Cities 2021, 4, 429–475. [Google Scholar] [CrossRef]
  10. Belli, L.; Cilfone, A.; Davoli, L.; Ferrari, G.; Adorni, P.; Di Nocera, F.; Dall’Olio, A.; Pellegrini, C.; Mordacci, M.; Bertolotti, E. IoT-Enabled Smart Sustainable Cities: Challenges and Approaches. Smart Cities 2020, 3, 1039–1071. [Google Scholar] [CrossRef]
  11. Ertürk, M.A.; Aydın, M.A.; Büyükakkaşlar, M.T.; Evirgen, H. A survey on LoRaWAN architecture, protocol and technologies. Future Internet 2019, 11, 216. [Google Scholar] [CrossRef] [Green Version]
  12. Haxhibeqiri, J.; De Poorter, E.; Moerman, I.; Hoebeke, J. A survey of LoRaWAN for IoT: From technology to application. Sensors 2018, 18, 3995. [Google Scholar] [CrossRef] [PubMed] [Green Version]
  13. Barro, P.A.; Zennaro, M.; Degila, J.; Pietrosemoli, E. A smart cities LoRaWAN network based on autonomous base stations (BS) for some countries with limited internet access. Future Internet 2019, 11, 93. [Google Scholar] [CrossRef] [Green Version]
  14. A’ssri, S.A.; Zaman, F.H.; Mubdi, S. The efficient parking bay allocation and management system using LoRaWAN. In Proceedings of the the 2017 IEEE 8th Control and System Graduate Research Colloquium (ICSGRC), Shah Alam, Malaysia, 4–5 August 2017; pp. 127–131. [Google Scholar]
  15. Nor, R.F.A.M.; Zaman, F.H.; Mubdi, S. Smart traffic light for congestion monitoring using LoRaWAN. In Proceedings of the 2017 IEEE 8th Control and System Graduate Research Colloquium (ICSGRC), Shah Alam, Malaysia, 4–5 August 2017; pp. 132–137. [Google Scholar]
  16. Pasolini, G.; Buratti, C.; Feltrin, L.; Zabini, F.; Verdone, R.; Andrisano, O.; De Castro, C. Smart city pilot project using LoRa. In Proceedings of the European Wireless 2018, 24th European Wireless Conference, Catania, Italy, 2–4 May 2018; pp. 1–6. [Google Scholar]
  17. Liu, S.; Xia, C.; Zhao, Z. A low-power real-time air quality monitoring system using LPWAN based on LoRa. In Proceedings of the 2016 13th IEEE International Conference on Solid-State and Integrated Circuit Technology (ICSICT), Hangzhou, China, 25–28 October 2016; pp. 379–381. [Google Scholar]
  18. Basford, P.J.; Bulot, F.M.; Apetroaie-Cristea, M.; Cox, S.J.; Ossont, S.J. LoRaWAN for smart city IoT deployments: A long term evaluation. Sensors 2020, 20, 648. [Google Scholar] [CrossRef] [PubMed] [Green Version]
  19. de Castro Tomé, M.; Nardelli, P.H.; Alves, H. Long-range low-power wireless networks and sampling strategies in electricity metering. IEEE Trans. Ind. Electron. 2018, 66, 1629–1637. [Google Scholar] [CrossRef] [Green Version]
  20. Mdhaffar, A.; Chaari, T.; Larbi, K.; Jmaiel, M.; Freisleben, B. IoT-based health monitoring via LoRaWAN. In Proceedings of the IEEE EUROCON 2017-17th International Conference on Smart Technologies, Ohrid, North Macedonia, 6–8 July 2017; pp. 519–524. [Google Scholar]
  21. Hayati, N.; Suryanegara, M. The IoT LoRa system design for tracking and monitoring patient with mental disorder. In Proceedings of the 2017 IEEE International Conference on Communication, Networks and Satellite (Comnetsat), Semarang, Indonesia, 5–7 October 2017; pp. 135–139. [Google Scholar]
  22. Petäjäjärvi, J.; Mikhaylov, K.; Hämäläinen, M.; Iinatti, J. Evaluation of LoRa LPWAN technology for remote health and wellbeing monitoring. In Proceedings of the 2016 10th International Symposium on Medical Information and Communication Technology (ISMICT), Worcester, MA, USA, 20–23 March 2016; pp. 1–5. [Google Scholar]
  23. Bal, M.; Abrishambaf, R. A system for monitoring hand hygiene compliance based-on internet-of-things. In Proceedings of the 2017 IEEE International Conference on Industrial Technology (ICIT), Toronto, ON, Canada, 22–25 March 2017; pp. 1348–1353. [Google Scholar]
  24. Karimpour, N.; Karaduman, B.; Ural, A.; Challenger, M.; Dagdeviren, O. Iot based hand hygiene compliance monitoring. In Proceedings of the 2019 International Symposium on Networks, Computers and Communications (ISNCC), Istanbul, Turkey, 18–20 June 2019; pp. 1–6. [Google Scholar]
  25. Meydanci, M.A.; Adali, C.; Ertas, M.; Dizbay, M.; Akan, A. RFID based hand hygiene compliance monitoring station. In Proceedings of the 2013 IEEE International Conference on Control System, Computing and Engineering, Penang, Malaysia, 29 November–1 December 2013; pp. 573–576. [Google Scholar]
  26. Herbert, J.; Horsham, C.; Ford, H.; Wall, A.; Hacker, E. Deployment of a Smart Handwashing Station in a School Setting During the COVID-19 Pandemic: Field Study. JMIR Public Health Surveill. 2020, 6, e22305. [Google Scholar] [CrossRef] [PubMed]
  27. Sumbawati, M.S.; Chandra, H.A.; Wrahatnolo, T.; Ningrum, L.E.C.; Khotimah, K.; Fathoni, A.N. Design Automatic Hand Sanitizer Microcontroller Based using Arduino Nano and Ultrasonic Sensors as an Effort to Prevent the Spread of Covid-19. In Proceedings of the International Joint Conference on Science and Engineering (IJCSE 2020), Surabaya, Indonesia, 3–4 October 2020; pp. 136–140. [Google Scholar]
  28. Tadikonda, C. Smart Sanitizer Disperser with Level Monitoring. Turk. J. Comput. Math. Educ. (TURCOMAT) 2021, 12, 994–999. [Google Scholar]
  29. Chowdhury, B.; De, T. An Internet of Things Assisted Smart Hand Sanitizer with Health Monitoring System Help to Reduce Rapid Spread of COVID-19; 2516-2314; EasyChair: Manchester, UK, 2020. [Google Scholar]
  30. Wireless Dry Contact Sensors|Indoor/Smart Building|LoRa. Available online: https://radiobridge.com/products/wireless-contact-sensor (accessed on 27 March 2021).
  31. Radio Bridge Console. Available online: https://console.radiobridge.com/ (accessed on 27 March 2021).
  32. MultiTech Conduit®. Available online: https://www.multitech.com/brands/multiconnect-conduit (accessed on 27 March 2021).
  33. Cloud IoT Platform|Internet of Things|TagoIO. Available online: https://tago.io/ (accessed on 27 March 2021).
  34. Penn State University Libraries. Available online: https://digital.libraries.psu.edu/digital/collection/psuimages/id/380 (accessed on 27 March 2021).
  35. LoRa—LoRa Documentation. Available online: https://lora.readthedocs.io/en/latest/#rssi (accessed on 27 March 2021).
  36. Gambi, E.; Montanini, L.; Pigini, D.; Ciattaglia, G.; Spinsante, S. A home automation architecture based on LoRa technology and Message Queue Telemetry Transfer protocol. Int. J. Distrib. Sens. Netw. 2018, 14, 1550147718806837. [Google Scholar] [CrossRef] [Green Version]
  37. Carminati, M.; Sinha, G.R.; Mohdiwale, S.; Ullo, S.L. Miniaturized Pervasive Sensors for Indoor Health Monitoring in Smart Cities. Smart Cities 2021, 4, 146–155. [Google Scholar] [CrossRef]
Figure 1. Motivation for the proposed approach.
Smartcities 04 00051 g001
Figure 2. Block diagram of Sanitizer Dispenser Network system design.
Smartcities 04 00051 g002
Figure 3. Radio Bridge LoRaWAN Dry Contact Sensor Module, events, and data packet structure.
Smartcities 04 00051 g003
Figure 4. Existing sanitizer station with dispenser bottle (Diversey Intellicare Dispenser II, 1.3 L, 9.1″ × 19.5″ × 11.2″): (a) shows the dispenser with bottle installed as part of the sanitizer station; (b) inside view of the dispenser activation system.
Smartcities 04 00051 g004
Figure 5. 3D-printed components to provide “plug-and-play” deployment and operation within sanitizer dispensers: (a) compliant mechanism and (b) sensor module holder.
Smartcities 04 00051 g005
Figure 6. Sensor holder design for “plug-and-play” deployment in existing dispensers.
Smartcities 04 00051 g006
Figure 7. Sensor configuration in Radio Bridge Console.
Smartcities 04 00051 g007
Figure 8. Sample of received sensor data packet.
Smartcities 04 00051 g008
Figure 9. Functions of the application server.
Smartcities 04 00051 g009
Figure 10. Comparison of two sensor configuration methods.
Smartcities 04 00051 g010
Figure 11. Building layout with sensor module deployment and gateway indicated.
Smartcities 04 00051 g011
Figure 12. Sensor signal quality and received events by location (from field tests).
Smartcities 04 00051 g012
Figure 13. Comparing received messages with signal quality from the real-world field test. The sensors were ranked by their signal quality (high to low).
Smartcities 04 00051 g013
Table 2. Sensor module deployment.
DeviceLocation
Gateway2nd Floor (213) × 1
Sensors1st Floor × 7
2nd Floor × 14
3rd Floor × 3
Table 3. Test results of sensor reconfiguration.
Real Time1-min Interval
ExperimentCountError RateCountError Rate
130.790.1
220.8100
320.890.1
430.7100
530.770.3
630.7100
750.5100
830.790.1
930.7100
1030.7100
Average30.79.40.06
Table 4. Results of field test (order by error rate).
LocationAverage of RSSIReceived MessagesError Rate
Westmost entry−108.520.997
212 classroom−64.8360.992
213 lobby−37.8670.990
219 classroom−84.4370.990
Mail room−102.8670.990
R111−62.5770.990
R309−81.8670.990
220 large classroom−79.16900.042
D139−78.46900.042
214 classroom−55.66950.035
R211−63.486960.033
R212−63.476960.033
R222 west elevator−77.226960.033
Stairs near walk thru−78.036960.033
153−98.976970.032
221 classroom−86.056970.032
215 classroom−55.016980.031
Stairs by parklet−102.456980.031
201H east elevator−95.686990.029
217 classroom−74.127000.028
3rd floor east elevator−100.117020.025
R319−94.357030.024
R235−96.297040.022
Publisher’s Note: MDPI stays neutral with regard to jurisdictional claims in published maps and institutional affiliations.