Article

Leveraging Crowdsourcing for Mapping Mobility Restrictions in Data-Limited Regions

by
Hala Aburas
*,
Isam Shahrour
and
Marwan Sadek
Civil and Geo-Environmental Engineering Laboratory (LGCgE), Lille University, Rue Paul Duez, 59000 Lille, France
*
Author to whom correspondence should be addressed.
Smart Cities 2024, 7(5), 2572-2593; https://doi.org/10.3390/smartcities7050100
Submission received: 2 July 2024 / Revised: 1 September 2024 / Accepted: 4 September 2024 / Published: 7 September 2024
(This article belongs to the Section Applied Science and Humanities for Smart Cities)

Abstract

:

Highlights

What are the main findings?
  • Developed a novel methodology for real-time mapping of mobility restrictions using spatial crowdsourcing and Telegram in data-limited regions.
  • Achieved validation rates (67–100%) and precision (73%) for traffic event data collected and analyzed through this methodology.
What is the implication of the main findings?
  • Enhanced traffic management and informed decision-making in regions with limited traditional data collection infrastructure.
  • Provided a scalable model that can be applied to other regions with similar data limitations, contributing to the field of smart city technologies.

Abstract

This paper introduces a novel methodology for the real-time mapping of mobility restrictions, utilizing spatial crowdsourcing and Telegram as a traffic event data source. This approach is efficient in regions suffering from limitations in traditional data-capturing devices. The methodology employs ArcGIS Online (AGOL) for data collection, storage, and analysis, and develops a 3W (what, where, when) model for analyzing mined Arabic text from Telegram. Data quality validation methods, including spatial clustering, cross-referencing, and ground-truth methods, support the reliability of this approach. Applied to the Palestinian territory, the proposed methodology ensures the accurate, timely, and comprehensive mapping of traffic events, including checkpoints, road gates, settler violence, and traffic congestion. The validation results indicate that using spatial crowdsourcing to report restrictions yields promising validation rates ranging from 67% to 100%. Additionally, the developed methodology utilizing Telegram achieves a precision value of 73%. These results demonstrate that this methodology constitutes a promising solution, enhancing traffic management and informed decision-making, and providing a scalable model for regions with limited traditional data collection infrastructure.

1. Introduction

This research aims to develop a methodology for real-time mapping of mobility restrictions, utilizing spatial crowdsourcing and Telegram as a novel source for traffic event data. This approach addresses the limitations associated with traditional traffic event detection methods and Twitter’s uneven popularity, particularly in regions like the Palestinian territories. The study leverages advancements in Web GIS and natural language processing (NLP) to provide the accurate, timely, and comprehensive mapping of mobility restrictions.
Real-time mapping has emerged in urban emergency events for human safety, such as health emergency services [1], explosion evacuation [2], flood mapping [3,4,5], and fire evacuation [6,7]. In the realm of traffic studies, it has been widely applied for mapping traffic congestion [8,9] and hazards such as traffic crashes [10] and natural hazards on the highways [11,12].
Mapping traffic events is crucial to traffic management plans [13,14]. It facilitates the development of visualization platforms and dashboards to disseminate traffic information to the public and transportation authorities [15,16,17]. This enables travelers to make informed decisions about their trips, optimizing travel time and distance while allowing transportation agencies to adjust policies to improve current traffic conditions proactively.
In the traditional approach, mapping traffic events is based on collecting traffic data using physical sensors and cameras [18,19,20,21]. In most cases, these sensors are installed along major freeways rather than another road network due to the high cost of installation and maintenance [22]. Therefore, information on traffic events far from the freeway will likely be missed because of the limited data coverage. In the unstable geopolitical environment, there may be limited digital sovereignty over capturing devices and excessive regulatory requirements regarding data coverage, storage, and usage [23]. These factors can impact the effectiveness of detecting and mapping traffic events.
To overcome these challenges, spatial crowdsourcing (SC) technologies have emerged [24,25,26], leveraging people’s proximity to traffic events to gather data [27]. In this approach, individuals are considered the primary data source, either opportunistically or participatory. In the opportunistic approach, users are unaware of the data collection process [9,27], which involves collecting data from mobile device sensors like GPS, accelerometers, and gyroscopes to map vehicle movements [28]. For example, during the 2011 East Japan Earthquake, real-time traffic data were collected using GPS sensors from moving vehicles to create high-fidelity road passage maps to identify blocked roads, facilitating disaster recovery activities [29].
In the participatory approach, users actively contribute to data collection by capturing photos or reporting via mobile applications [27]. For example, ref. [1] developed a real-time health emergency response framework using the participatory approach. They incorporated the volunteer’s vicinity to an incident to trigger an alert notification to the rescue services with crucial information such as location co-ordinates, type of incident, and number of victims.
A recent approach in crowdsourcing leverages social network services such as Twitter, Facebook, and Telegram to collect traffic data, thanks to data mining techniques and natural language processing advancements. Social media platforms allow users to post short messages, images, and videos with timestamps and geolocation information, providing a cost-effective way to capture traffic information from continuous data streams at any time and place [30]. Twitter is one of the most dominant platforms used in the literature for traffic disruption management, including tasks such as traffic event detection [31,32], traffic congestion prediction [8], traffic flow predictions [33], and managing emergencies [30]. For the sample, ref. [8] proposed a methodology to geocode traffic-related events collected from Twitter and create a model for spatial-temporal traffic congestion.
Most Twitter-based studies’ methodology relies on historical datasets retrieved through keyword-based querying to detect traffic events. This approach generates massive amounts of traffic event-related tweets suitable for applying prediction models and spatiotemporal clustering. However, detecting and mapping traffic events in real-time or near real-time remains challenging. Another area for improvement is Twitter’s uneven popularity in different countries, especially in the MENA region [34]. For example, in the Palestinian territories, only 0.7% of the population uses Twitter, amounting to 36,800 users [35].
This study introduces the Telegram social platform as a novel crowdsourcing tool and source for mapping traffic events, addressing the limitations of Twitter. Telegram boasts a large user base of around 550 million active monthly users, surpassing Twitter’s approximately 436 million users [34]. Also, it offers the feature of pure instant messaging, enabling real-time communication and updates, which makes it an ideal source for obtaining accurate and timely data.
This study proposes a methodology for mapping mobility restrictions, a novel type of traffic event in the literature, including checkpoints, road gates, settler violence, and traffic congestion, using the Palestinian territories as a case study. This approach relies on collecting spatio-temporal data through opportunistic and participatory spatial crowdsourcing. Opportunistic crowdsourcing is facilitated by mining geosocial data from the Telegram platform, where voluntary citizens and drivers share information about mobility restrictions as part of their regular social interactions. Participatory crowdsourcing involves actively engaging users through Survey123 to provide specific, structured reports on mobility restrictions. The methodology utilizes ArcGIS Online (AGOL), an advanced web GIS tool, to gather, store, and analyze crowdsourced data. It also employs natural language processing (NLP) to analyze Arabic text to detect and identify mobility restriction information.
This study’s main contributions and innovations include introducing Telegram as a novel data source for traffic event data and addressing the limitations of Twitter’s uneven popularity. The study also develops a methodology that enables the real-time mapping of mobility restrictions, a type of traffic event not extensively covered in the literature.
The remainder of this paper is structured as follows: Section 2 provides an overview of mobility restrictions in the Palestinian territories. Section 3 outlines the materials and methods used, including detecting and identifying restrictions, processing and analyzing identified restrictions, and mapping and visualization techniques. Section 4 details the validation methods employed to ensure data quality. Section 5 presents the results of applying the proposed methodology and summarizes the outcomes of the validation methods. Finally, Section 6 discusses the limitations of this study and draws conclusions based on the findings.

2. Mobility Restrictions in the Palestinian Territories, West Bank (WB)

Mobility restrictions related to the occupation started in the WB around thirty years ago with checkpoints [36,37] and walls [36]. According to a recent survey conducted by the Office for the Co-ordination of Humanitarian Affairs (OCHA), there are approximately 645 permanent or intermittent movement obstacles (Figure 1), including road gates, checkpoints, earth mounds, roadblocks, road barriers, and other types of barrier [38].
In recent years, a new form of mobility restriction has emerged that poses a safety threat to travelers in the West Bank. This is known as settler-related violent incidents, which involve acts of violence performed by Israeli settlers living in Israeli settlements [39]. These violent actions range from road blockages and stone-throwing at vehicles, to physical attacks on travelers and even the use of live ammunition. According to a report by OCHA, the year 2022 witnessed an unusual increase in settlers’ violence, with an average of 6.6 injuries occurring daily [40]. Approximately 21% of all settler-related incidents were related to violence targeting vehicles, drivers, passengers, and road blockages [39].
The impact of these mobility restrictions extends across social, economic, and environmental aspects, significantly affecting the traveling experience by exposing longer waiting times and detours and undermining sustainability drivers [41]. Economically, they have increased costs, reduced employment opportunities, working days, and wages [42]. Socially, these restrictions disrupt the social fabric of Palestinian communities, limiting cultural exchange [43] and implementing arbitrary rules, which negatively impact daily life [44,45]. Additionally, incidents of violence perpetrated by settlers against travelers have further destabilized the prospects for a peaceful and just society [46].
From an environmental standpoint, these mobility restrictions have significantly increased energy consumption and CO2 emissions. The prolonged travel times caused by checkpoints can be up to 27 times longer, substantially elevating energy consumption and CO2 emissions. Estimates indicate a 275% increase in CO2 emissions for gasoline vehicles and a 358% increase for diesel vehicles [47].
Most of the existing literature on mobility restrictions in the WB focuses on describing and evaluating their socioeconomic [43,45,46,48] and environmental impacts [47,48,49]. More studies need to be aimed at monitoring and mapping these restrictions. This gap primarily arises from limited digital sovereignty over the interurban road network in the West Bank, which prevents traditional traffic monitoring methods from collecting geolocated data, timestamps, and descriptions of restrictions. The lack of such data has long challenged travelers, government officials, and transportation authorities. Additionally, mobility restrictions in this region are influenced by unpredictable geopolitical factors, including sudden road closures, military checkpoints, and settler violence, which complicate real-time monitoring and response efforts.
Travelers typically obtain updates on mobility restrictions from social media due to the availability of smartphones and 2G and 3G networks [50]. According to [51], 74.6% of WB users use social media to be informed about news and recent updates. Although there are some initiatives to develop applications for sharing road traffic data, such as Doroob (https://www.doroob.net/) (accessed on 22 May 2023), these applications have limitations. Doroob, a location-based app, provides navigation services based on reported traffic information, like traffic crashes and police activity. However, it is unsuitable for sharing information on mobility restrictions since it does not explicitly support reporting checkpoints or road gates. Additionally, the data collected by such applications are proprietary and accessible only to approved partners, posing data access challenges for researchers and government departments [22].
This study represents the first contribution to addressing the Palestinian territories’ long-term mobility challenges. It develops a novel solution that visualizes the mobility restriction, including real-time temporal and type-specific information. By leveraging spatial crowdsourcing, social networks, and web GIS, the study offers a dynamic and interactive map of mobility restrictions, enabling residents and authorities to make informed decisions regarding travel routes and schedules. For residents, this means optimizing their daily commutes and avoiding restricted areas, saving time and reducing stress. Real-time data can facilitate better traffic management and resource allocation for authorities, ensuring quick and effective responses to mobility issues.

3. Materials and Methods

The literature on traffic event management inspired the research methodology here, which is composed of sequential steps, including (i) mobility restriction detection and identification [21,52,53]; (ii) processing and analysis of the identified restrictions [52,54,55]; and (iii) mapping and visualization [56,57]. While some of the literature extends the process of managing traffic events to suggest reactive responses, the author covers this dimension in a separate work [58].

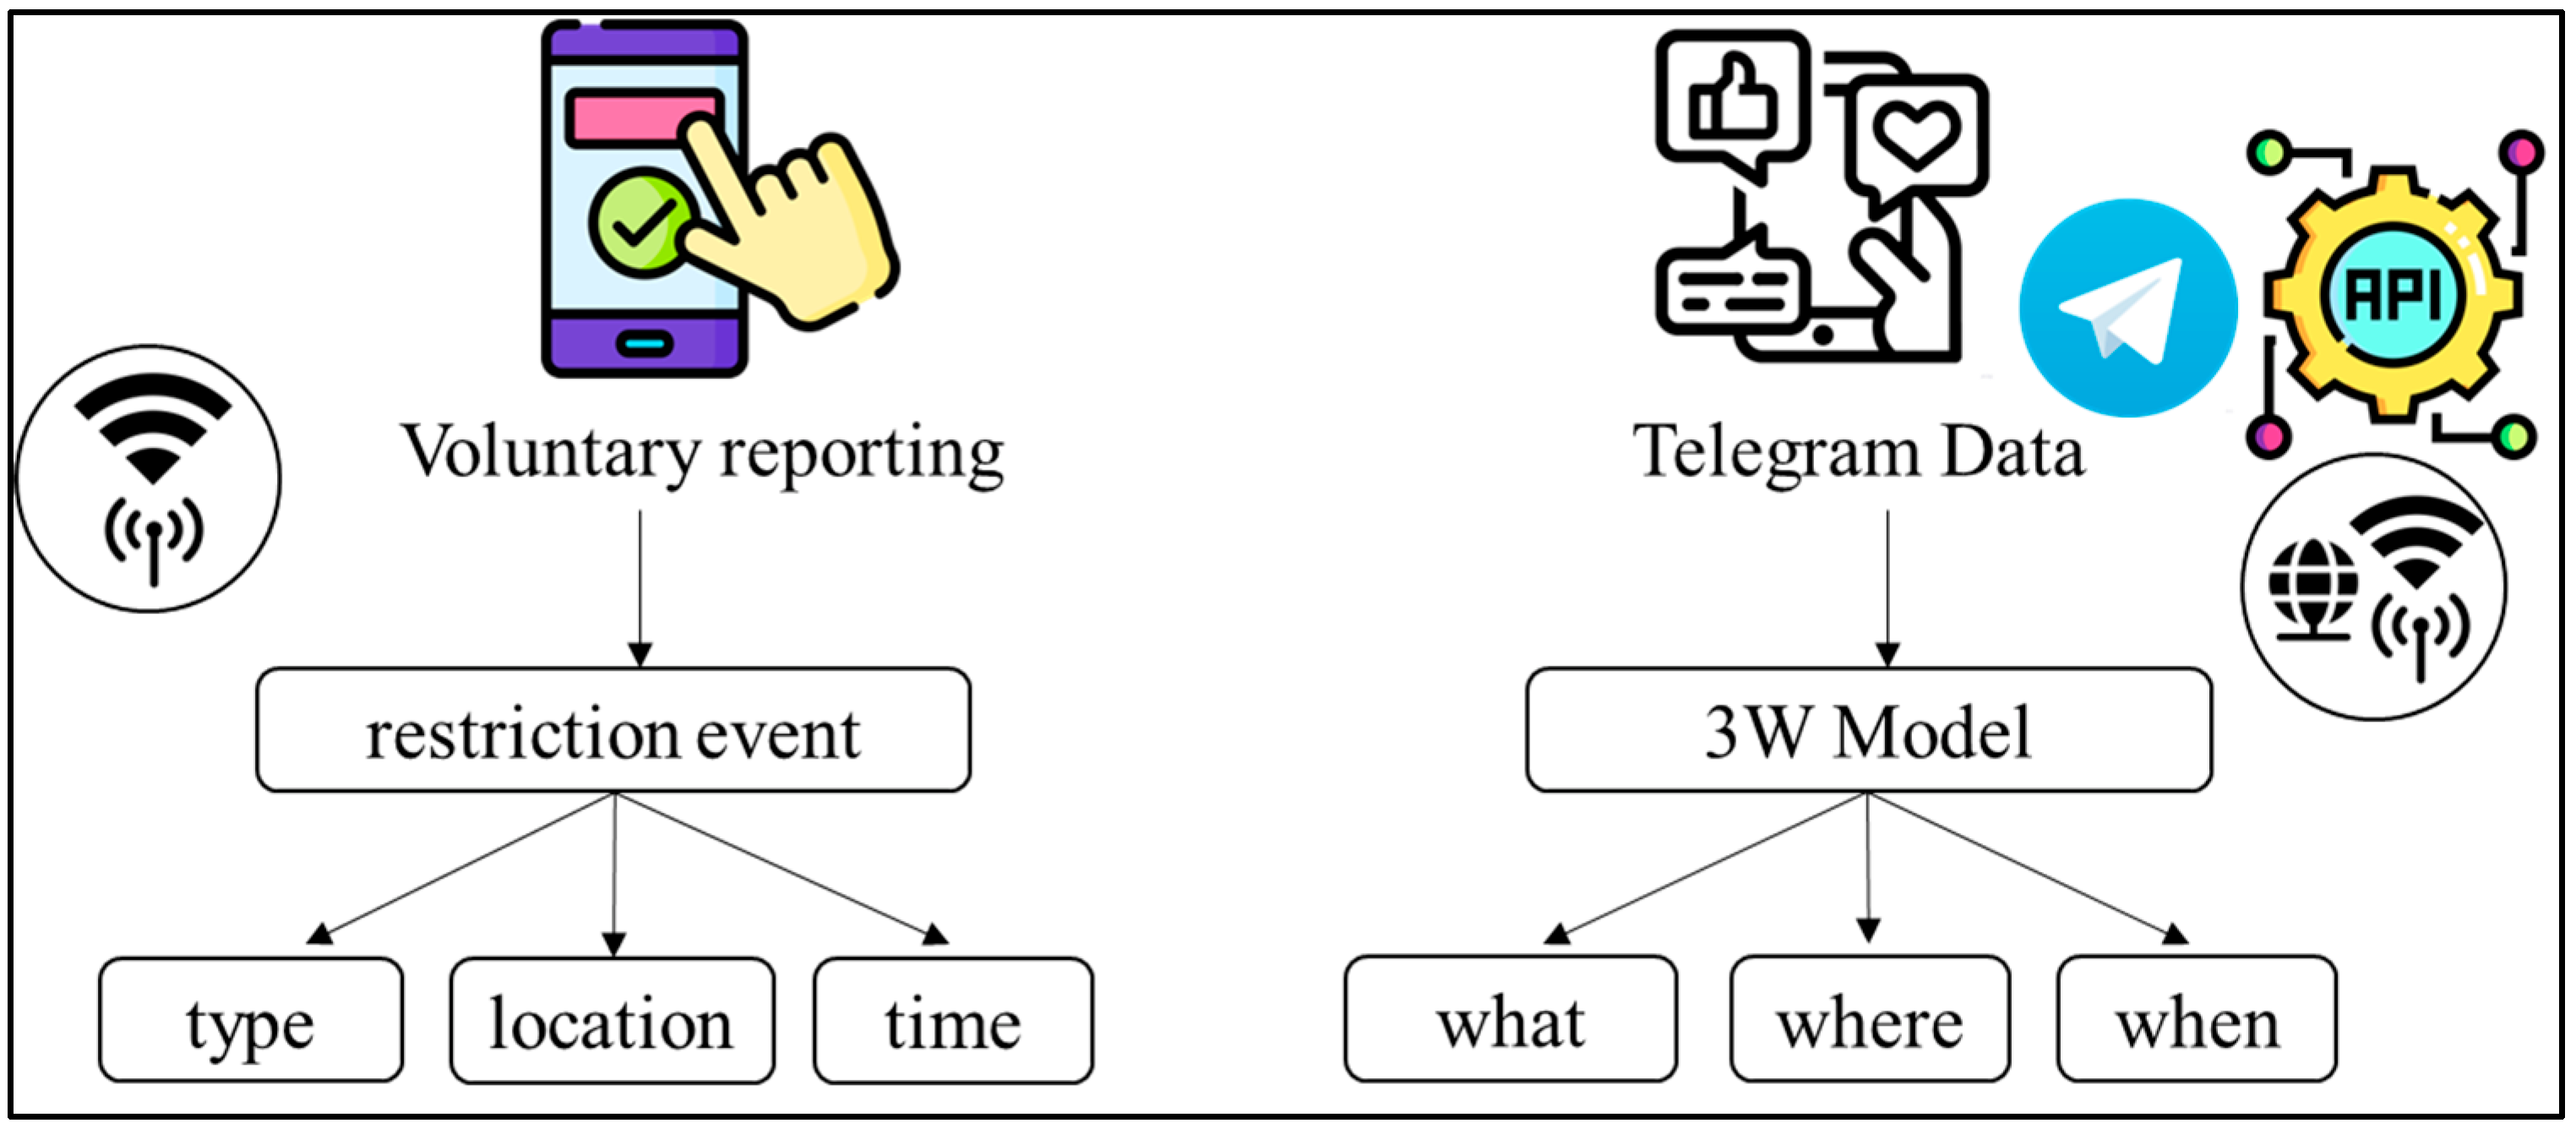
3.1. Data Collection: Mobility Restriction Detection and Identification

Mobility restrictions are seen as constantly changing and unpredictable traffic events [59], which makes traditional sensor-based capturing methods inefficient and costly. Consequently, this study embraces modern approaches that leverage the collective knowledge of individuals through crowdsourcing techniques [33,60]. It involves travelers acting as human sensors [61], voluntarily providing information about mobility restrictions. Additionally, the study utilizes the Telegram platform as a novel alternative source of mobility restriction-related data [62].
This study harnesses the capabilities of Web GIS for capturing data from travelers, along with natural language processing for retrieving data from Telegram in real- and near-real-time. Data, including restriction descriptions, locations, and times, will be captured from these sources, as illustrated in Figure 2.

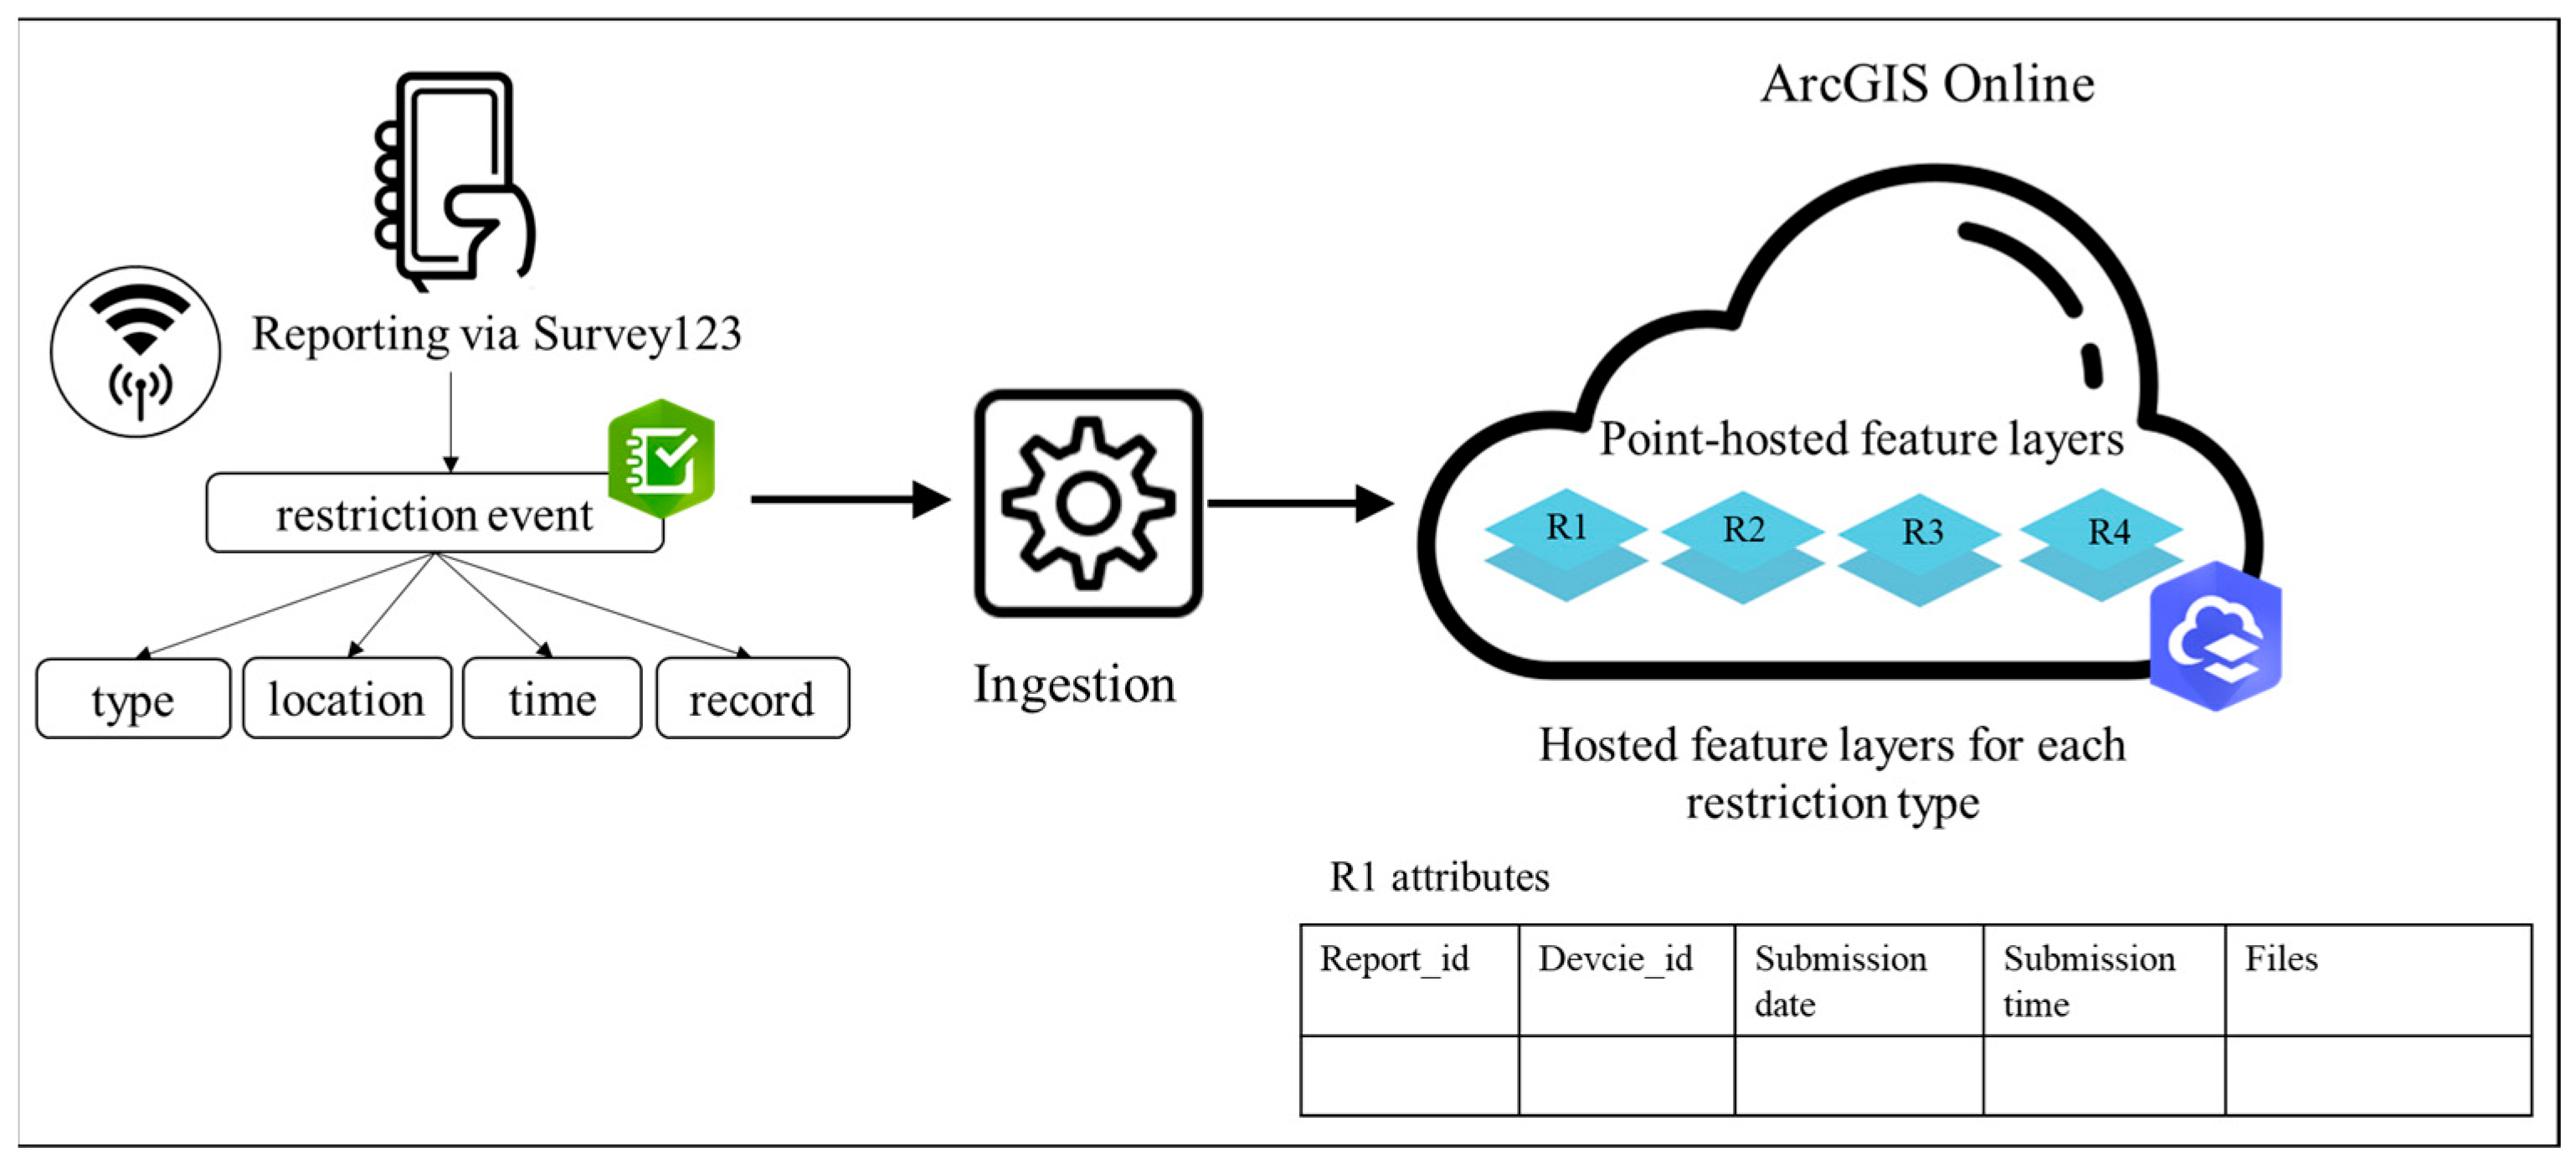
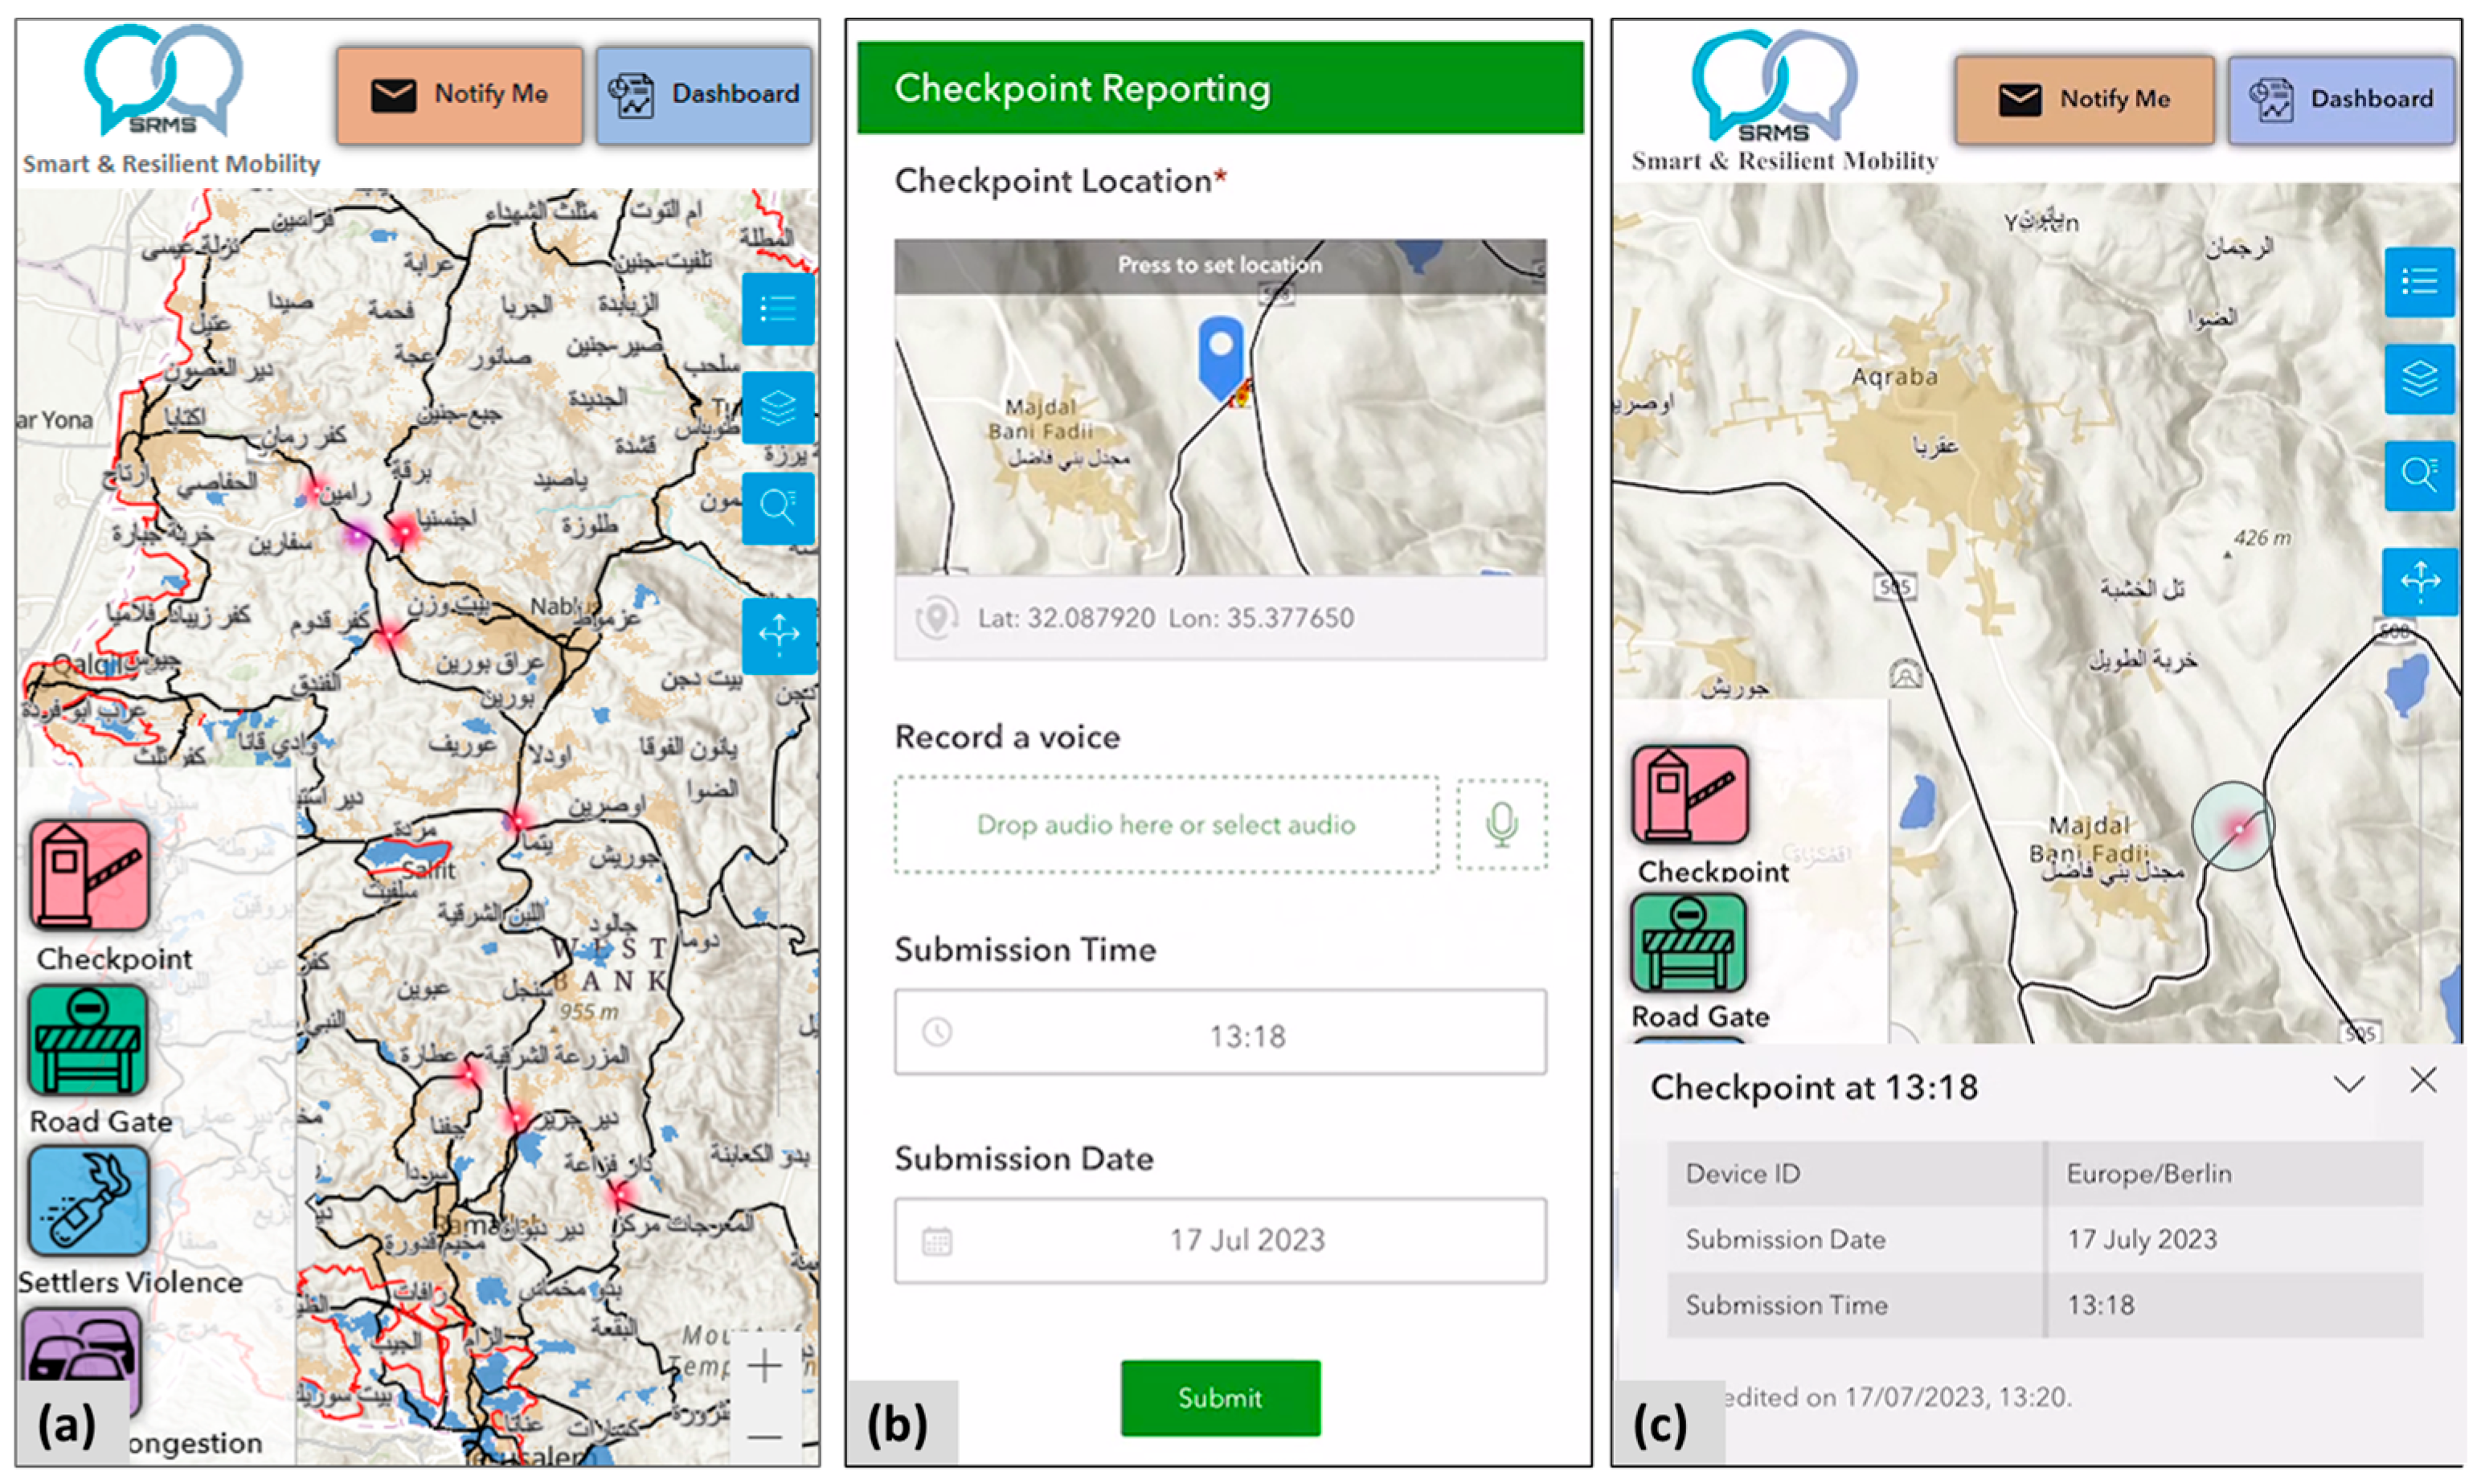
3.1.1. Data Transmitted from Travelers Using Survey123

This component concerns participatory data transmitted from travelers using ArcGIS Survey123, a simple and intuitive form-centric data-gathering tool with the power to publish results in real-time through the Web Feature Service (WFS) in the web GIS. Survey123 contributed to the participatory crowdsourcing approach in various domains, including health and wellness [63], urban development [64], and tourist planning [65].
Survey123 has superiority over other applications, such as Ushahidi, Maptionnaire, Open Data Kit, and GIS Cloud, etc. in providing a built-in database, supporting the removal and editing of single data entries, sorting and filtering, and many supported format options. Also, Survey123 offers data analysis and provides high visualization options. Survey123 is the only platform offering web and mobile applications that support Android and IOS devices [66].
Users submitting reports will actively disclose the particular type of mobility restrictions. Additionally, they grant the system permission to access their location data obtained from the GPS sensors on their mobile devices [9,27]. The event timestamp is automatically populated and is considered the reporting timestamp. Optionally, the users can record a voice to add more explanation, as illustrated in Figure 3.
All reported types of restriction will be stored within AGOL, a certified cloud-based Software-as-a-Service (SaaS) platform dedicated to creating, sharing, and managing geographic information via cloud-based servers and infrastructure [67,68]. Reported events will be stored based on their restriction type (R) as a point-hosted feature layer (Figure 3). This layer is ideal for housing event information data due to its capacity for the real-time addition, editing, and deletion of data.
Each hosted feature layer contains tabular attributes, including an autogenerated report ID, device ID, submission time and date, and attached audio files (if available) (Figure 3). A device ID is a unique identifier assigned to a smartphone used to collect data. This ID helps in distinguishing between different devices, and can be useful for tracking, managing, and analyzing data collection processes. The storage of location data adheres to the schema of the feature layer and general GIS data storage format. The location attributes are stored within the geometry of the features rather than as separate attributes in the table. Consequently, the data’s location will be visually represented on the map without a related location field. Figure 3 depicts the importation and integration of data from Survey123 into the ArcGIS Online platform. This ingestion allows the data to be processed, analyzed, and visualized effectively.

3.1.2. Data Retrieved from Telegram

Telegram is an instant messaging (IM) service where users can send text messages, photos, videos, stickers, and files of any type. Telegram’s message sender or receiver can be a user, group, or channel. In addition to user–user messaging, channels and groups can be used to broadcast messages in Telegram, such as a group where users interested in the same topic send and receive messages in the group. In contrast, channels are features that broadcast public messages to many users. A channel usually has one or just a few administrators who are the only ones who can publish messages in the channel [69].
In this study, retrieving data from Telegram involves using public groups where discussions and reports on mobility restrictions occur. The selection methodology of the target source is based on the following: (i) high participants and interaction; (ii) commonly known for providing reliable and up-to-date mobility restrictions and traffic data; and (iii) covering broad geographic areas to have an inclusive and comprehensive mapping of mobility restrictions.
Once these sources are identified, text data will be retrieved using the Telegram API, which interacts programmatically with the Telegram messaging platform [62,70]. The purpose is to access the most recent text data posted within the last 24 h, allowing for near-real-time information updates. For this research, a Telegram account (https://core.telegram.org/#getting-started) (accessed on 11 July 2023) was created (Figure 4), and an application was developed in Python using the Telethon library [71], which facilitates integration with the Telegram API.
The Telethon library allows the creation of a client to establish a connection between Python and Telegram environments. The purpose of this connection is to keep the client running as long as the connection is not interrupted. As we aim to capture text messages in real-time, we chose to keep the client running constantly. Next, the client uses the Telethon library to obtain more detailed information, including text messages, dates, and times; this information will be stored in the Pandas Data Frame format, as illustrated in Figure 4. This DataFrame format allows the organization and manipulation of the data efficiently using Pandas’ functionalities for analysis or further processing within a Python environment. Each row in the DataFrame represents a message, with columns indicating different attributes of the message, such as “text” and “date”. The “text” column contains the actual text of the messages, while the “date” column stores the timestamps of the messages (Figure 4).

3.2. Data Processing and Analysis

This phase focuses on processing the collected data, transmitted by travelers and retrieved from Telegram. The aim is to validate the data and eliminate noise, such as duplicate entries, transmission errors, and incomplete data. Additionally, this phase involves analyzing the processed data to extract useful spatio-temporal information about the mobility restrictions in real-time, preparing it for subsequent mapping and visualization.
The collected data from travelers will be processed and analyzed using ArcGIS Online’s capabilities. This involves applying filtering rules to the data stored in the hosted feature layers based on their attributes. For example, only reports containing near-real-time data (within the past 24 h) will be retained to ensure the most recent restriction updates are presented. Additionally, Survey123 forms were configured to capture and store metadata, such as time zone information, upon survey submission. While the time zone does not provide precise location details, it can indicate a general geographic region (e.g., a country or a large area within a country). As a result, reports from device IDs outside the designated study area will be excluded.
The methodology for processing and analyzing Telegram data is composed of sequential steps. These steps aim to mine the shared text to reveal valuable information related to mobility restrictions, including their types, locations, and times of occurrence. Figure 5 shows the general methodology followed to process and analyze Telegram data using natural language processing (NLP).

3.2.1. Telegram Data Processing

This phase focuses on processing retrieved messages in Arabic using Natural Language Processing (NLP). Over the last decade, significant attention has been devoted to NLP research concerning the Arabic language and its various dialects. Numerous studies have explored diverse aspects of processing this language, including morphological analysis, resource development, and machine translation [72]. Most of these studies have primarily focused on Modern Standard Arabic (MSA), which is utilized for formal writing and conversations, as well as Arabic dialects (AD), which are employed in everyday communication and vary among different communities (Alkhatib 2019) [32].
Various Arabic processing tools, such as Farasa [73], MADAMIRA [74], and YAMAMA, are commonly used for processing MSA. These tools offer modules for a wide array of processing and analysis tasks, encompassing tokenization, lemmatization, part-of-speech tagging, named entity recognition, phrase chunking, etc.
However, this study focuses on the Palestinian dialect utilized informally in Telegram chat groups, where the availability of natural language processing tools for this specific dialect is limited. The Shami corpus introduced by [75] encompasses data from the four dialects spoken in Palestine, Jordan, Lebanon, and Syria, containing 117,805 sentences and [76] presented Curras, a morphologically annotated corpus of the Palestinian Arabic dialect with over 56,000 tokens and rich morphological and lexical features. Unfortunately, these available tools do not offer public access to their modules or efficiently address tokenization tasks [72].
Consequently, this study utilizes the Natural Language Processing Toolkit (NLTK) modules for Arabic text processing. The NLTK is a prominent Python package explicitly designed for working with human language data [31]. This phase involves developing a text processing function that performs the following tasks: (i) removing numbers and special characters, as they do not provide meaningful information for tasks like regular expression and keyword extraction; (ii) tokenizing the text into individual words; and (iii) eliminating stopwords from the list using Arabic stopwords. Figure 6 shows these steps.

3.2.2. Telegram Data Analysis

This phase delves into further textual analysis to extract valuable information from the processed Telegram text. The Telegram data undergo analysis utilizing the “3W” communication model to accomplish this. It captures the spatio-temporal event data through three main questions (what, where, when) from Telegram data. The first use of a communication model was presented in Lasswell’s “5W” model in 1948, which depends on the main five questions “Who (says) What (to) Whom (in) Which channel (with) What effect [77]. The “5W” communication model in crowdsourcing has been customized to meet real-time data needs. For example, (Z. Xu et al., 2020) [30] used the communication model “5W” methodology: what, where, when, who, and why to describe the urban emergency event from social media.
The “5W” model of (Z. Xu et al., 2020) [30] obtains spatial and temporal information from social media and investigates the actors and reasons causing the emergency event. However, this model has some limitations, for example, the methodology was exclusively applied to the Weibo Chinese application. The Weibo application provides prepared real-time information for urban events and localized data, which is not true in most social media platforms. Also, the data of the (Who) element could undermine the privacy of the system’s users.
Compared to the 5W model of (Z. Xu et al., 2020) [30], the 3W model presented in this study preserves user privacy by adopting only three questions (What, Where, When), which are sufficient to provide accurate actual-time data about mobility restrictions and traffic conditions using Telegram data without revealing the identity of the users and the reasons behind that event.
The study employs the Regular Expressions (regex or regexp) module to facilitate this analysis. This module is well suited for searching, matching, and manipulating text strings according to specific rules and patterns [30,78,79]. Specifically, in this research, the regex module is employed to search for patterns in the Arabic text, enabling the identification of restriction names and their associated statuses. The methodology of analyzing text using the 3W model is illustrated in Figure 7.
This process involves creating a set of keywords derived from frequently used words that express mobility restriction-related statuses. Subsequently, a keyword list is compiled, encompassing the most commonly utilized words to describe status and their synonymous counterparts. These words encompass Modern Standard Arabic (MSA) and Dialectal Arabic (DA), as illustrated in Table 1. For example, the word “open” manifests in messages through various synonyms combining MSA and DA, such as “salik” and “salkeh” (both denoting “open” in Palestinian DA), and “maftouh”, which signifies “open” in MSA. The keywords list will undergo continuous updates and enrichment with new words as they are encountered and utilized in the data.
After creating the keywords, a regular expression is employed to detect patterns in the Arabic text. In this phase, the code runs a loop over all the listed rows in the processed text, searching for patterns within the text data. When a match is found, it captures the restriction name and its associated status. The code identifies all the names corresponding to the previously matched keywords for status. For example, if the sentence is “Huwara checkpoint is closed”, which is written in Arabic as “حاجز حوارة مغلق”, the code will capture the status that matches the keyword “closed” and identify “Huwara checkpoint” as the restriction name.
A dictionary stores the latest status for each unique restriction name. The first matching group captures the restriction name, allowing for the inclusion of one, two, or three words as the restriction name. On the other hand, the second matching group captures the restriction status. The extracted restriction names are checked for repetition and duplication, and the timestamps are compared to ensure that the most recent timestamps are added to the dictionary. Based on the data in the dictionary, three lists are created: “checkpoints”, “statuses”, and “times”.

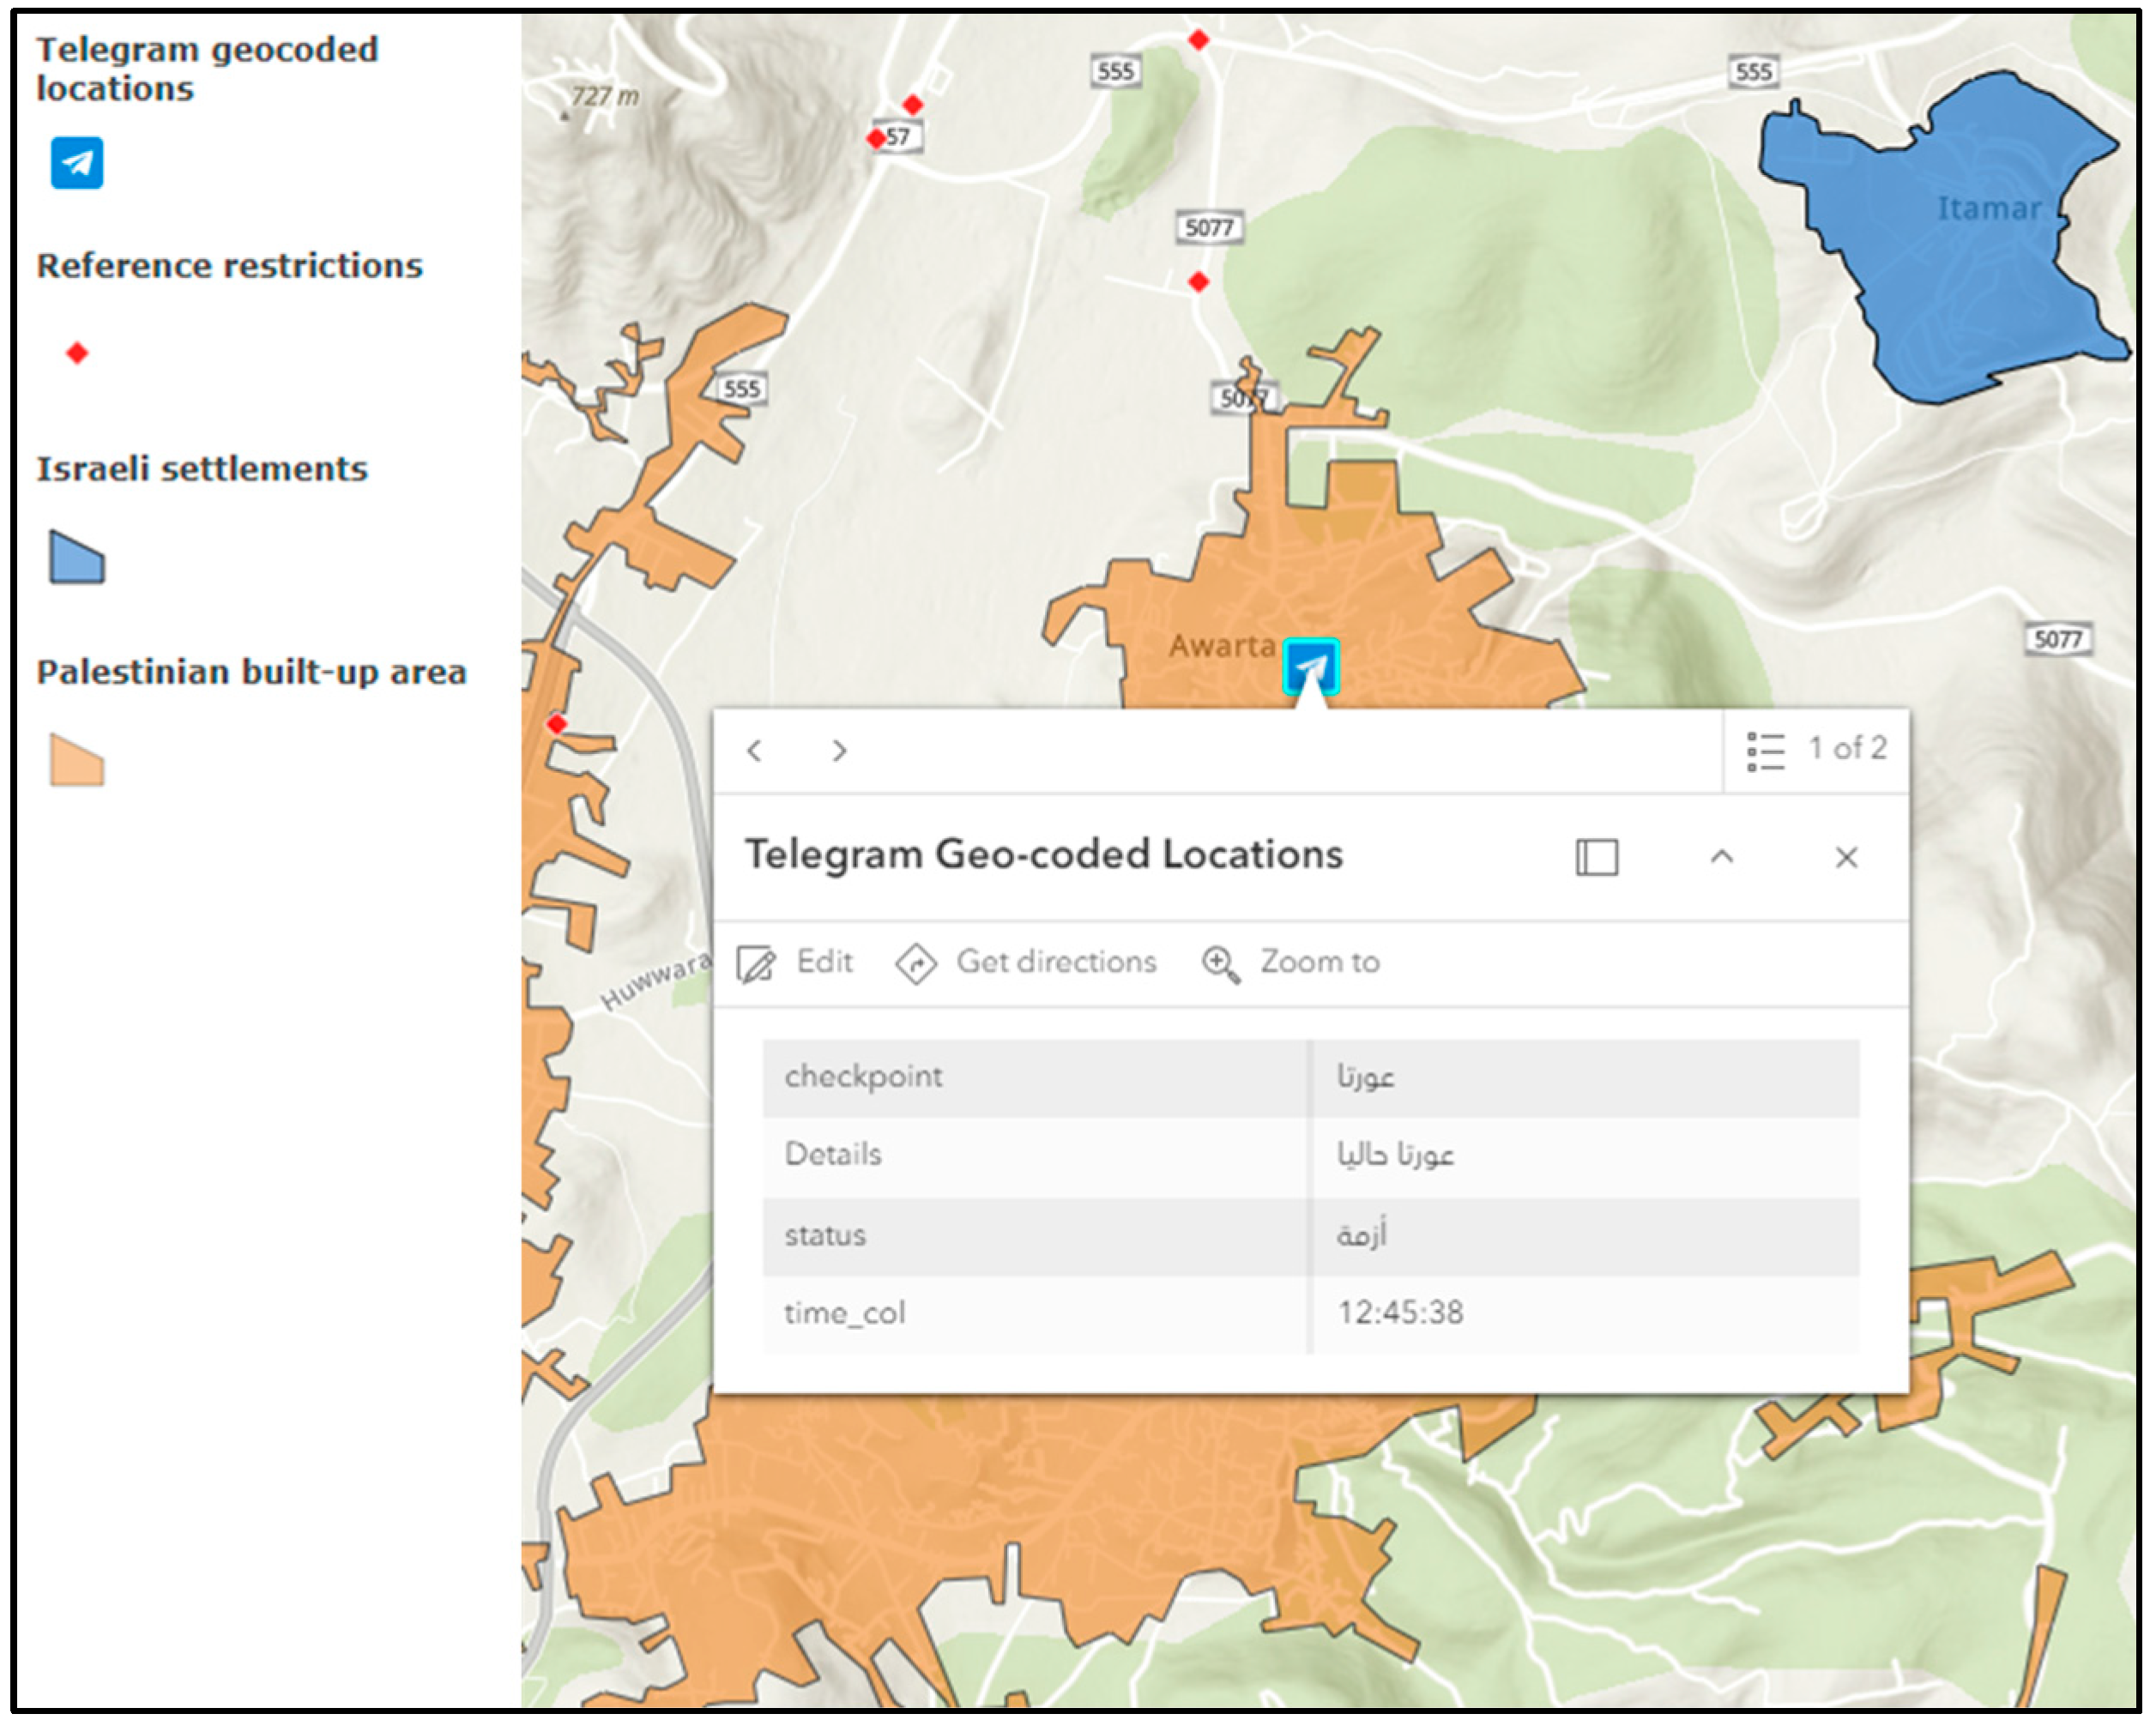
3.2.3. Geocoding Mobility Restrictions Mined from Telegram Data

This phase aims to convert human-readable locations into latitude and longitude co-ordinates for the previously observed mobility restrictions. This transformation visually maps these restrictions and facilitates efficient spatial analysis [80]. The geocoding process utilizes the Nominatim 4.4.1 geocoding service, an open-source software developed by the OpenStreetMap (OSM) project. Nominatim is available in the geopy Python package and supports several popular geocoding services. It leverages data from OSM to carry out geocoding tasks. A study by [81] compared Nominatim with other geocoding services and found that Nominatim’s geocoding service excels in identifying more locations. Additionally, Nominatim is widely recognized and commonly used for geocoding services [81].
However, it is essential to note that, due to limitations in data availability within geocoding services, specific geographic locations in the Palestinian territories, particularly checkpoints and road gates, may not be found in the Nominatim database. To address this challenge, the methodology leverages the ability to add and edit points in OSM, allowing users to include locations with attributes such as names and types. Therefore, a list of permanent and temporary checkpoints and road gates has been added to OSM so that Nominatim services can identify them.

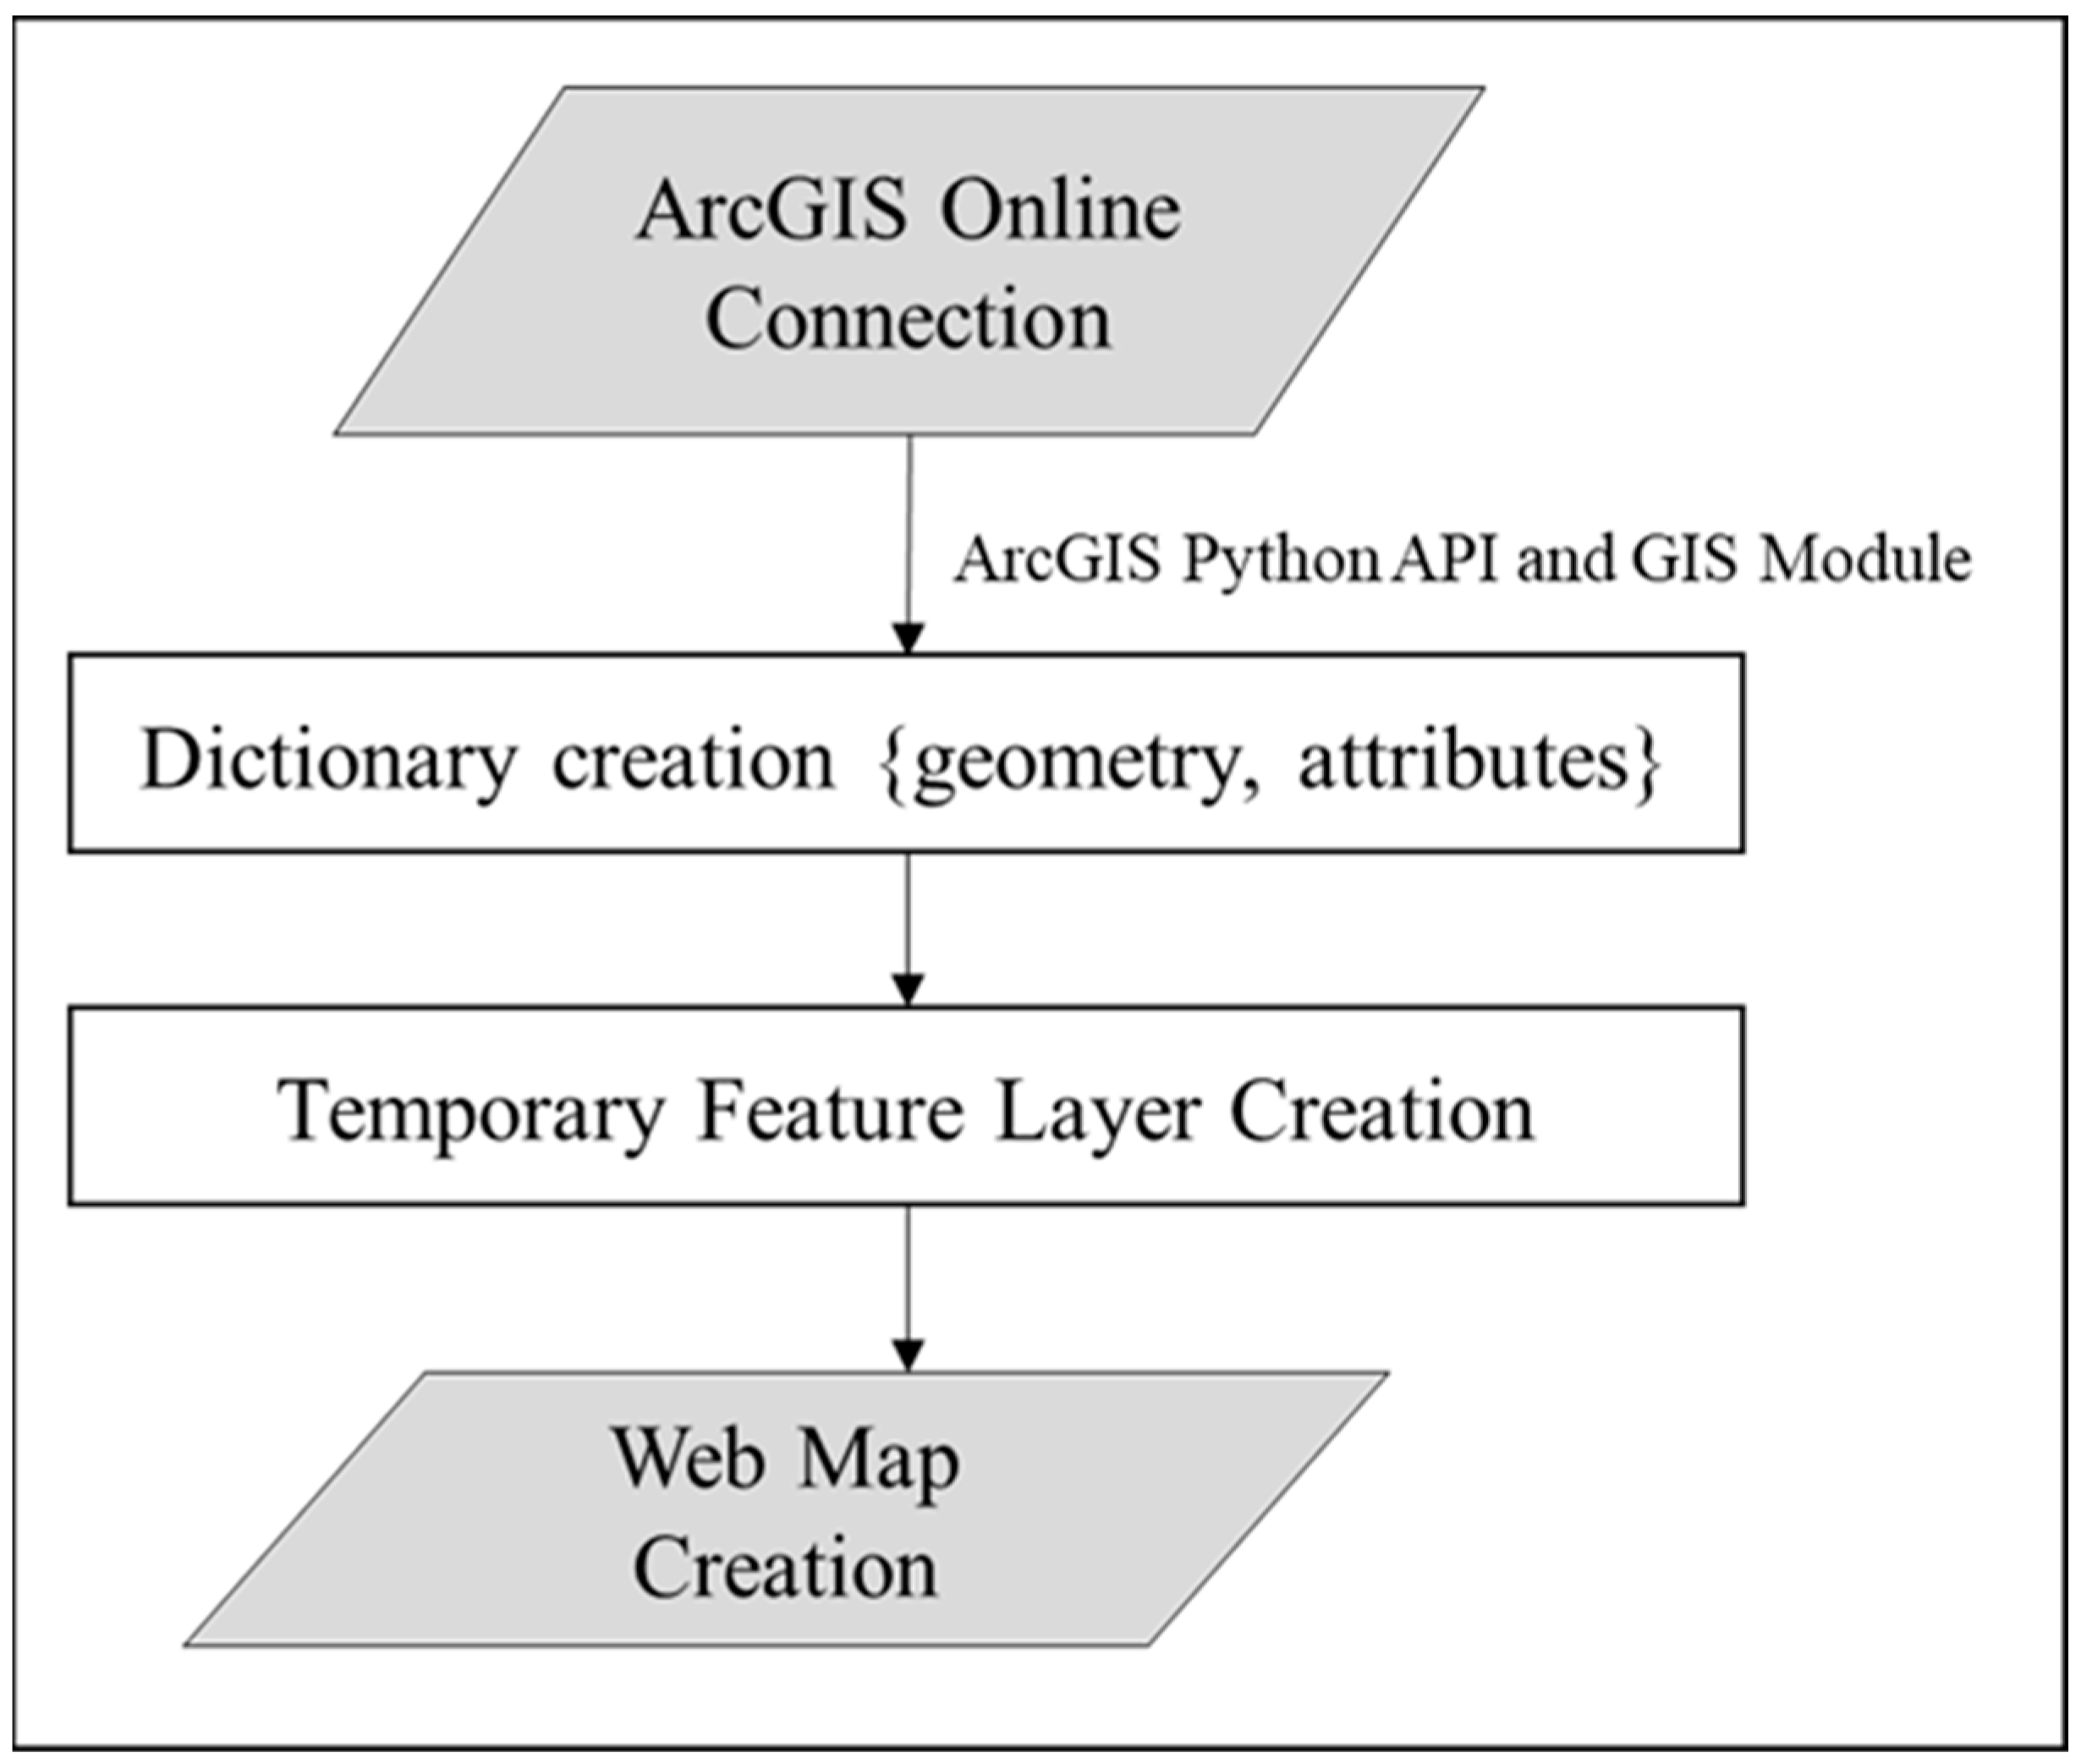
3.3. Mapping and Visualizing Mobility Restrictions to the End-Users

This phase concerns visualizing (i) the analyzed Survey123 data stored in the hosted feature layer; and (ii) geocoded mobility restrictions using their longitude and latitude data.
  • Mapping mobility restrictions transmitted from travelers
This section concerns disseminating and visualizing the processed data stored in the hosted feature layer (R) for public use. This phase will enable users to access information about mobility restrictions and adjust their travel plans accordingly. The hosted feature service configuration is required for sharing the reported data with the public. It includes configuring the accessibility of the users to the data by assigning the feature service to support public data collection, which enables users to add or modify their data.
The real-time mapping service will be published as a reporting widget on a web mobile application. To ensure the application is intuitive and user-friendly, a User-Centered Design (UCD) approach was employed [82,83]. The UCD focuses on understanding users’ needs, goals, and frustrations, guiding the design process to create an easy-to-use interface. Using techniques like the Scenario Persona method, we gathered insights into potential users’ behaviors and preferences, which informed the design of an efficient and navigable interface. We conducted a Likert scale survey to collect data on users’ profiles, commuting habits, and mobility needs, and used scenario-based questions to assess their preferences and willingness to interact with the app’s features [84].
The published data include information about the location, time, descriptive audio, and type of mobility restriction or traffic congestion. Users can access this information through a mobile application, which displays an interactive map with icons representing reported incidents. Users can access detailed information about the incident by clicking on these icons.
ii
Mapping mobility restrictions mined from Telegram data
This methodology includes the following steps, as illustrated in Figure 8: (i) using ArcGIS Python API to interact with AGOL; (ii) establishing a connection with AGOL using user credentials through the GIS module; (iii) data transformation—the observed mobility restrictions will be transformed into a dictionary containing “geometry” information (latitude and longitude co-ordinates with the Palestine1923 projection, a projection tailored explicitly to the Palestinian context). This choice ensures that geographic features are accurately positioned within the Palestinian territories. It will also include “attributes” data, including the checkpoint name, status, and timestamp; (iv) creating a temporary Feature Layer, which acts as a container for the geospatial data, allowing them to be displayed and manipulated within the SRMS platform; and (v) adding the temporary feature layer to the web map as an operational layer to make the geospatial data visible and interactive within the web map.

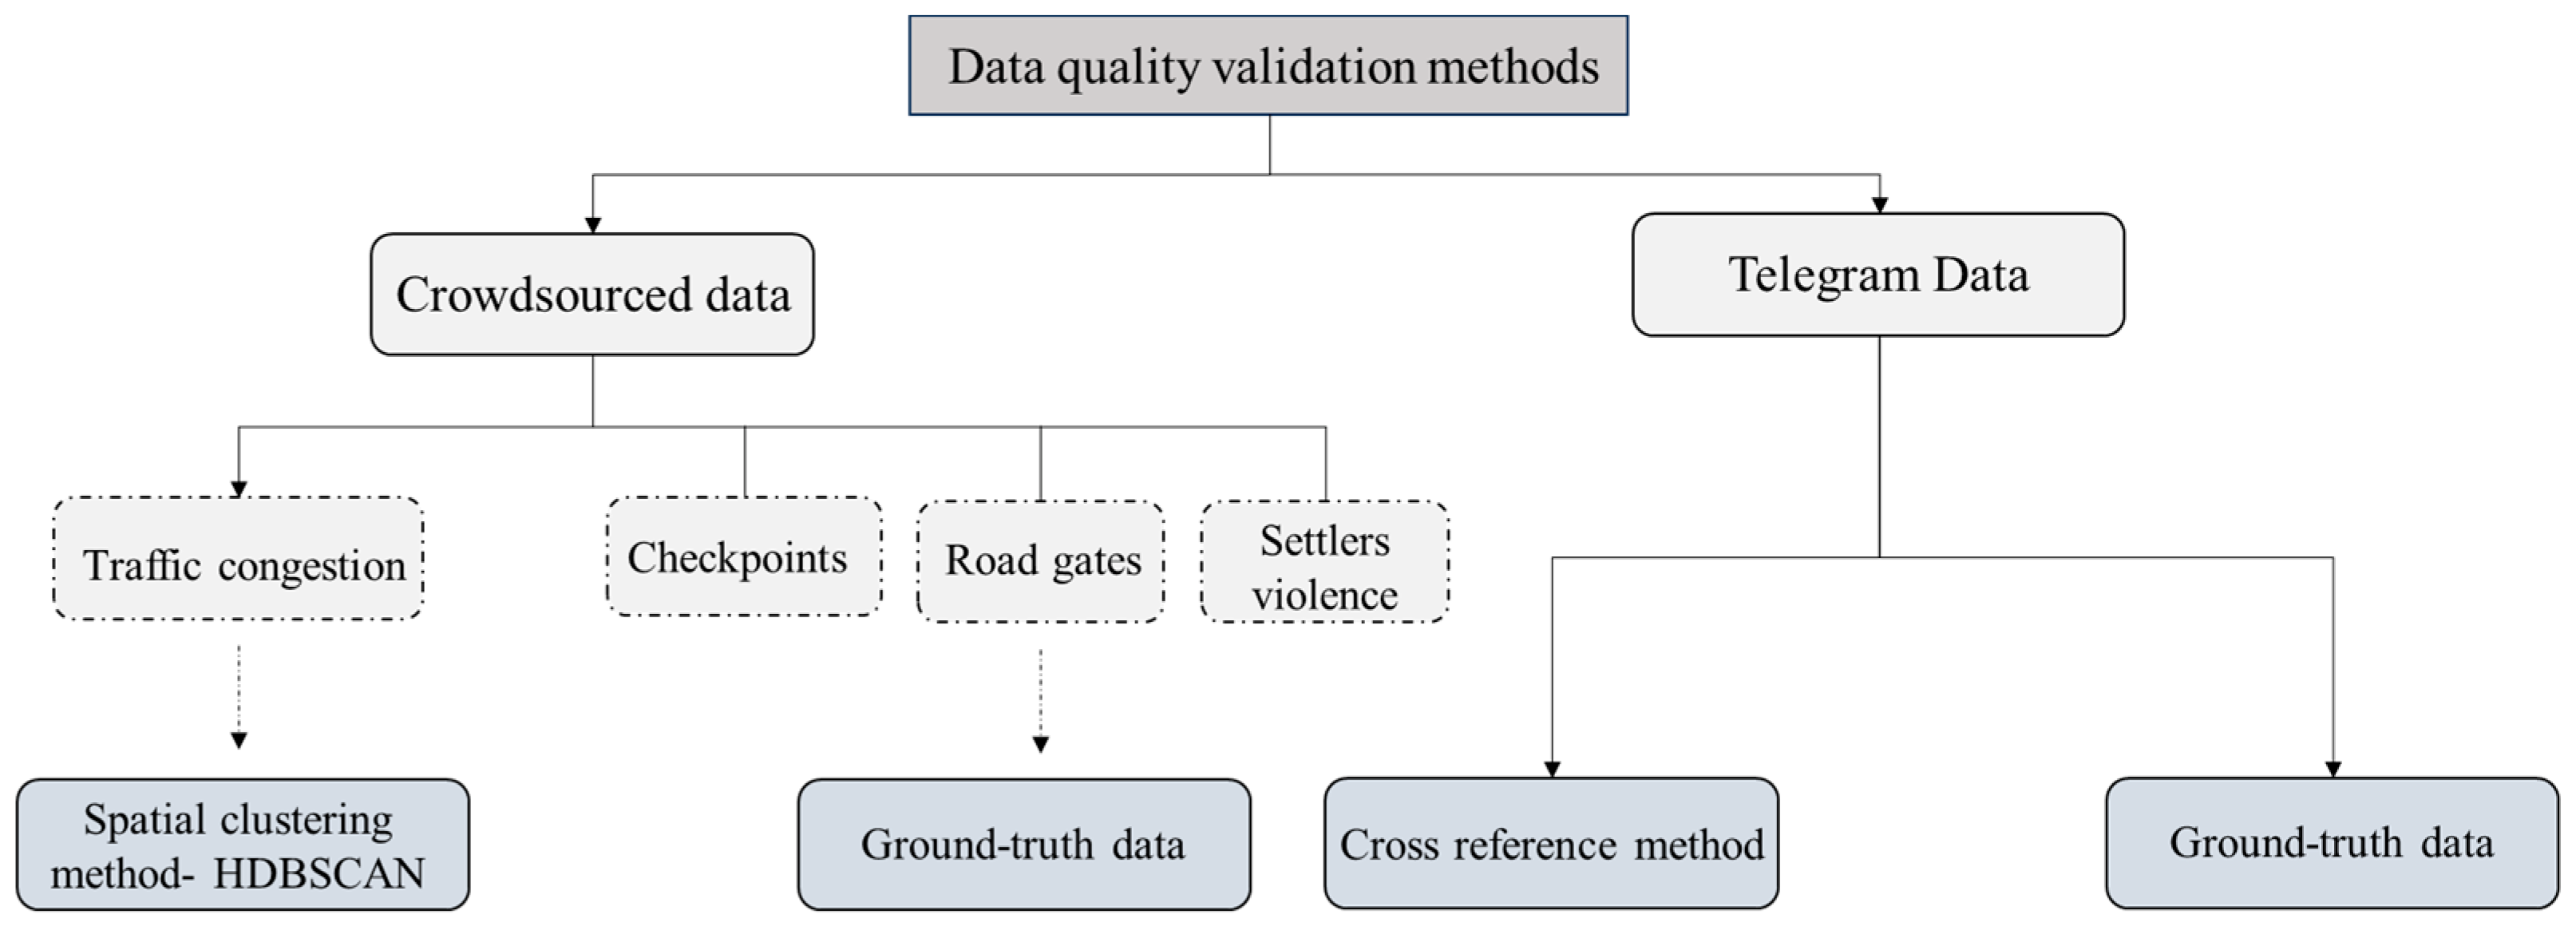
4. Data Quality Validation Methods

This section focuses on ensuring the quality and reliability of data received from individuals and mined from Telegram. The accurate mapping of mobility restrictions is crucial for making informed decisions [9]. The validation methods for crowdsourced data vary based on the reported mobility restriction type. For example, checkpoints, road gates, and acts of settler violence will be validated using third-party ground-truth data, as their spatial references are available. Traffic congestion reports, on the other hand, will be validated using spatial clustering methods.
Telegram data are submitted to two validation methods: (i) the cross-reference method, which compares the performance of the developed 3W model with information shared on the Telegram group, and (ii) ground-truth data, which evaluate the accuracy of the developed mapping service against the spatial distribution of the mobility restrictions. Figure 9 presents the methods for validating crowdsourced and Telegram data.

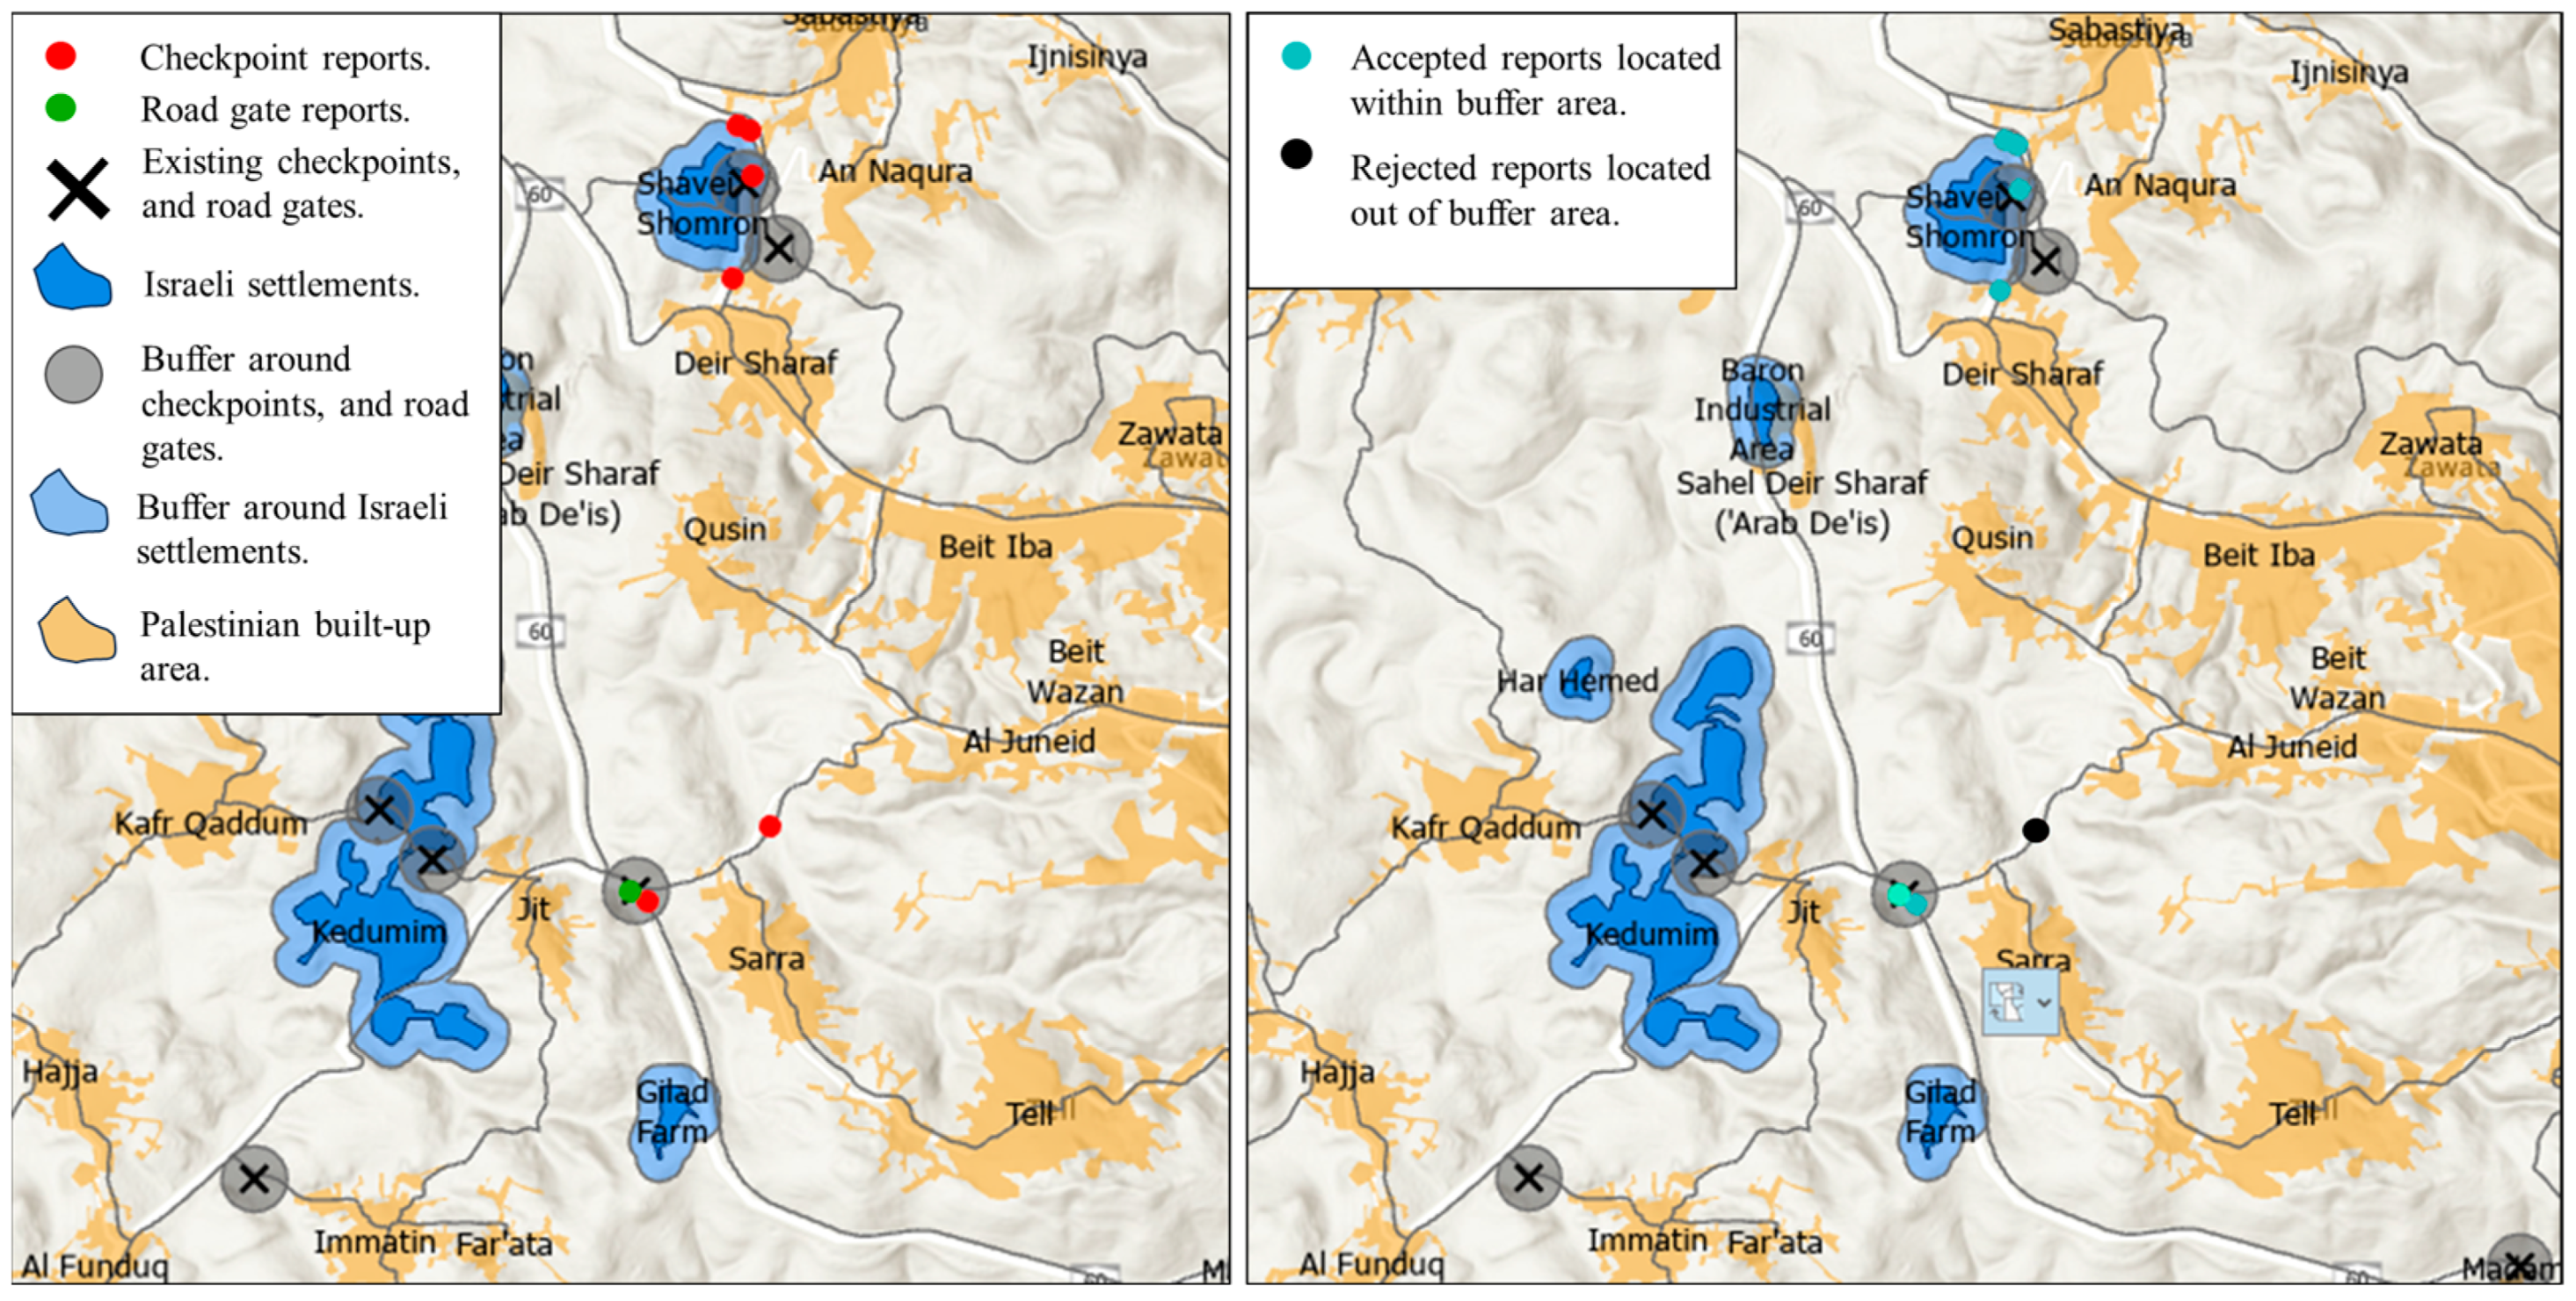
4.1. Validation of Crowdsourcing Data

The literature presents various approaches to ensure data quality in spatial crowdsourcing. A standard method involves user incentive mechanisms, which motivate participants to contribute accurate and reliable data [9,85]. Another approach is the redundancy-based strategy, which aggregates data from multiple users, considering the most redundant data to be high quality [86]. Additionally, some researchers validate crowdsourced data through an institutional honest third party [87] or by using data from the surrounding environment, known as the ground-truth method [88]. Another innovative approach involves spatio-temporal event clustering, which utilizes unsupervised machine-learning techniques to group large datasets based on spatial and temporal similarities [89].
Given the type of data and format used in this research, where each reported event is stored as a triplet consisting of longitude, latitude, and timestamp, and due to the limitation of the volume of the reported data, this research harnesses two methods for ensuring data quality, including (i) the spatial event clustering approach. This method clusters reported traffic congestion events based on their spatial proximity. Future work can enhance this approach by incorporating temporal parameters into the clustering analysis; and (ii) the ground-truth method, which uses a third-party database to check the reported checkpoints, road gates, and settlers’ violence data [90]. Both methods were implemented using the geoprocessing capabilities of ArcGIS Pro 3.1.
For the spatial clustering of traffic congestion reports, the HDBSCAN (Hierarchical Density-Based Spatial Clustering of Applications with Noise) algorithm was employed [91]. This method constructs a hierarchy of clusters by varying the density threshold, starting from a very high density (leading to small, tight clusters) to a very low density (leading to larger, more inclusive clusters) [92]. To identify the prominent clusters from this hierarchy, a stability value of a cluster (C) is established. It indicates how stable a cluster is over a range of density thresholds. The stability value is calculated by summing the cluster’s lifetime (i.e., the range of density levels over which the cluster persists) weighted by the number of points in the cluster. The stability for a cluster can be computed, as shown in Equation (1).
S t a b i l i t y   ( C ) = t T λ t 1 λ t · | c t |
where λ t and λ t 1 are consecutive density levels, and C is the size of the cluster at density level t .
For the ground-truth method, the spatial distribution of fixed and temporary checkpoints, road gates, and settlement polygons served as the spatial reference for validating checkpoints, road gates, and settler violence reports. The validation process began by creating a buffer zone around each referencing mobility restriction and Israeli settlements where the exposure to violence from settlers is high. The purpose of this buffer is to define an acceptable spatial distance within which each report should fall to be considered valid [93]. This distance depends on various factors, including stopping distance and visibility conditions influencing drivers’ or passengers’ perceptions. In this study, the buffer distance was set at 250 m from the mobility restrictions and settlements. It is worth mentioning that checkpoints and road gates are physical structures with an area of influence extending beyond their exact co-ordinates. A 250-m buffer represents the zone within which a checkpoint or road gate affects mobility and security. This distance accounts for the operational impact radius where people are likely to report such structures. As a result, reports located within this buffer zone or touching its boundaries were deemed validated reports.

4.2. Validation of Telegram Data

Telegram data were validated in two phases. The first phase involves validating the 3W model using a cross-reference method. A sample of Telegram messages from a common group dedicated to sharing mobility restriction information was used. The test dataset included messages with checkpoint names, statuses, and timestamps. The second phase concerned validating the geocoding service. This phase was conducted using ground-truth data. The spatial distribution of checkpoints, road gates, Palestinian built-up areas, and Israeli settlements was used to verify the accuracy of the geocoded events.

5. Results and Discussion

This section presents the results of applying the methodology of mapping the mobility restrictions using crowdsourced and Telegram data.

5.1. Mapping of Mobility Restriction Using Crowdsourced Data

Mapping mobility restrictions involved deploying a Survey123 form embedded in a customized web app widget created using AGOL, as shown in Figure 10. This form was distributed to a group of daily commuters experiencing various mobility restrictions over two weeks, resulting in 35 reports related to checkpoints, settlement violence, road gates, and traffic congestion. The distribution of these reports is visualized in Figure 11.
The validation of these reports involved the application of two data quality assurance methods: the spatial clustering method (HDBSCAN) and the ground-truth method. The HDBSCAN method was used for reports related to traffic congestion, while the ground-truth method was applied to reports associated with checkpoints, road gates, and settler violence. Both methods were implemented using the geoprocessing capabilities of ArcGIS Pro 3.1.
Figure 12 presents the results of the HDBSCAN application in the traffic congestion reports. It illustrates the stability value for the observed clusters. The results show that the reports were created in two main clusters and one noise. The first cluster, characterized by a moderate stability value of 0.64, comprised ten submitted reports, accounting for 67% of the total reports. The second cluster, with a stability value of 0.11, consisted of four reports, representing 27% of the submitted reports. The remaining 6% of the submitted reports were classified as noise with 0 stability value.
For the ground-truth method, a buffer zone with 250 m around temporary and fixed checkpoints, road gates, and Israeli settlements was created, as depicted in Figure 13. The analysis results for the submitted reports reveal that (i) for checkpoint reports, 11 out of 13 reports were located within the accepted buffer distance, representing an 85% validation rate; (ii) for road gate reports, all submitted reports were located within the accepted buffer distance, resulting in a 100% validation rate; and (iii) regarding settler violence reports, only one out of four reports was located within the buffer distance, accounting for a 25% validation rate. Figure 13 presents the results of the validation method for checkpoint and road gate reports.
These findings highlight the efficacy of using spatial crowdsourcing for reporting and mapping mobility restrictions, particularly checkpoints, road gates, and traffic congestion. However, they show a challenge in accurately positioning the settler violence reports, which may be attributed to the nature of these restrictions, as settlers typically have a mobile nature, which differs from the fixed and stationary nature of road gates or checkpoints. This mobility can make it more challenging to capture and validate reports related to settler violence accurately. Future efforts should focus on developing more advanced methods for tracking and validating mobile restrictions.

5.2. Mapping Mobility Restriction Using Telegram Data

Mapping mobility restrictions using Telegram data involves using the Telegram Public group “Ahwaltareq” [94] to share mobility restrictions and road information. With approximately 220,000 members, this group provides instant updates around the clock, seven days a week. Additionally, it covers updates on restrictions distributed throughout the West Bank region, making it a valuable data source.
This phase was applied by developing a comprehensive script using Python 3.11. It includes (i) message retrieving, (ii) text processing, (iii) a 3W analysis model, (iv) geocoding the extracted restrictions, and (v) the mapping of geocoded restrictions. The author can find the script on GitHub in the repository [76].

5.2.1. Validation of 3W Model

The performance of the developed script was validated using the cross-referencing method by preparing a test dataset, which included a sample of Telegram messages retrieved for the period 12:15–13:15 on 15 May 2023. This dataset comprised 13 messages detailing various restrictions names, statuses, and timestamps, as depicted in Figure 14. Upon conducting the 3W model analysis, the script successfully identified eight restrictions, statuses, and timestamps, reflecting the true positive detections. However, it incorrectly identified three restrictions that did not match the ground-truth dataset, resulting in a precision ratio of 72.7%. Additionally, the script failed to detect four values from the test dataset, leading to a recall of 66.6% and an F1 score of 69.5%.
Achieving a precision ratio of 72.7% indicates that the majority of the restrictions identified by the script were accurate when compared to the reference dataset. However, the script’s recall rate of 66.6% indicates it missed detecting some restrictions in the test dataset. This implies that while the script performed well in identifying relevant information, there was room for improvement in capturing all events mentioned, potentially due to variations in how information was presented in Telegram messages or nuances in language processing. The overall F1 score of 69.5%, which balances precision and recall, provides a comprehensive measure of the script’s performance. It indicates that the script achieved a reasonable balance between correctly identifying relevant restrictions and minimizing false positives.

5.2.2. Validation of Restrictions Geocoding

The primary objective of this phase was to verify whether the geographical co-ordinates (latitude and longitude) extracted from Telegram messages accurately corresponded to the ground-truth data. This validation was performed using the ground-truth method, leveraging the known spatial distribution of Palestinian communities, Israeli settlements, and both temporary and fixed mobility restrictions in the West Bank. AGOL was utilized to map these reference elements, as illustrated in Figure 15. This step ensures the reliability and accuracy of the geocoding process, confirming that the mapped locations reflect the actual positions of the reported locations and mobility restrictions.
To verify the geocoded locations against their spatial references, a Point-In-Polygon (PIP) method was employed. This method checks whether the geocoded points, extracted from Telegram messages, fell within the correct built-up areas represented as polygons. For example, a traffic congestion report extracted from a Telegram message about the Awarta community was geocoded and then validated using the PIP method, ensuring that the point was accurately located within the Awarta community, as shown in Figure 16.

6. Conclusions

This paper presented an innovative methodology for the real-time mapping of mobility restrictions using spatial crowdsourcing and Telegram, specifically targeting regions where traditional data collection methods fall short. By integrating ArcGIS Online and natural language processing (NLP), the proposed methodology offered a reliable and efficient solution for mapping traffic events, including checkpoints, road gates, settler violence, and congestion, as demonstrated through a case study in the Palestinian territories. The methodology employed ArcGIS Online for comprehensive data collection, storage, and analysis, and NLP for creating the innovative 3W model (what, where, when) to analyze Arabic text mined from Telegram. The robustness and reliability of this approach were validated through spatial clustering, cross-referencing, and ground-truth methods. The validation results indicate that using spatial crowdsourcing to report restrictions yields promising validation rates ranging from 67% to 100%. Additionally, the developed methodology utilizing Telegram achieves a precision value of 73%. These results confirm the potential of the proposed method to enhance traffic management and enable residents to optimize their daily commutes.
This research faced limitations related to the volume of collected data. Due to time constraints, gathering a substantial number of reports took a lot of work, which would have been beneficial for applying temporal-spatial clustering. Another challenge was the analysis model for the Arabic language, which is influenced by the dialects used in the study area. Any reuse of the 3W model in this study needs to be customized and tailored to the local dialects. Future work will integrate temporal aspects into the clustering analysis to validate the received reports. Additionally, efforts will focus on developing a methodology for validating mobile restrictions beyond using clustering methods. Additionally, with a sufficient volume of data, we plan to assess the impact of mapping mobility restrictions on people’s mobility and their related socioeconomic and environmental aspects. Through continued collaboration with local and governmental bodies, and by incorporating user feedback, we aim to refine this solution to provide more accurate and actionable insights into mobility restrictions, ultimately improving mobility and quality of life for affected populations.

Author Contributions

Conceptualization, H.A. and I.S.; methodology, H.A. and I.S.; software, H.A.; formal analysis, H.A.; investigation, H.A.; writing—original draft preparation, H.A.; writing—review and editing, H.A., I.S. and M.S.; visualization, H.A.; supervision, I.S.; resources, H.A., I.S. and M.S.; validation, H.A., I.S. and M.S.; data curation, H.A., I.S. and M.S.; funding acquisition, I.S.; project administration, H.A., I.S. and M.S. All authors have read and agreed to the published version of the manuscript.

Funding

This research received no external funding.

Data Availability Statement

The data used in this research are presented in this paper.

Conflicts of Interest

The authors declare no conflicts of interest.

References

  1. Hamrouni, A.; Ghazzai, H.; Frikha, M.; Massoud, Y. A Photo-Based Mobile Crowdsourcing Framework for Event Reporting. In Proceedings of the 2019 IEEE 62nd International Midwest Symposium on Circuits and Systems (MWSCAS), Dallas, TX, USA, 4–7 August 2019; pp. 198–202. [Google Scholar] [CrossRef]
  2. Zuo, F.; Kurkcu, A.; Ozbay, K.; Gao, J. Crowdsourcing Incident Information for Emergency Response Using Open Data Sources in Smart Cities. Transp. Res. Rec. 2018, 2672, 198–208. [Google Scholar] [CrossRef]
  3. Castro, U.; Avila, J.; Sustaita, C.V.; Hernandez, M.A.; Larios, V.M.; Villanueva-Rosales, N.; Mondragon, O.; Cheu, R.L.; Maciel, R. Towards Smart Mobility during Flooding Events in Urban Areas Using Crowdsourced Information. In Proceedings of the 2019 IEEE International Smart Cities Conference (ISC2), Casablanca, Morocco, 14–17 October 2019; pp. 154–159. [Google Scholar] [CrossRef]
  4. Feng, Y.; Brenner, C.; Sester, M. Flood Severity Mapping from Volunteered Geographic Information by Interpreting Water Level from Images Containing People: A Case Study of Hurricane Harvey. ISPRS J. Photogramm. Remote Sens. 2020, 169, 301–319. [Google Scholar] [CrossRef]
  5. Helmrich, A.M.; Ruddell, B.L.; Bessem, K.; Chester, M.V.; Chohan, N.; Doerry, E.; Eppinger, J.; Garcia, M.; Goodall, J.L.; Lowry, C.; et al. Opportunities for Crowdsourcing in Urban Flood Monitoring. Environ. Model. Softw. 2021, 143, 105124. [Google Scholar] [CrossRef]
  6. Tavra, M.; Racetin, I.; Peroš, J. The Role of Crowdsourcing and Social Media in Crisis Mapping: A Case Study of a Wildfire Reaching Croatian City of Split. Geoenviron. Disasters 2021, 8, 10. [Google Scholar] [CrossRef]
  7. Oliveira, A.C.M.; Botega, L.C.; Saran, J.F.; Silva, J.N.; Melo, J.O.S.F.; Tavares, M.F.D.; Neris, V.P.A. Crowdsourcing, Data and Information Fusion and Situation Awareness for Emergency Management of Forest Fires: The Project DF100Fogo (FDWithoutFire). Comput. Environ. Urban Syst. 2019, 77, 101172. [Google Scholar] [CrossRef]
  8. Salazar-carrillo, J.; Torres-ruiz, M.; Davis, C.A.; Quintero, R.; Moreno-ibarra, M.; Guzmán, G. Traffic Congestion Analysis Based on a Web-gis and Data Mining of Traffic Events from Twitter. Sensors 2021, 21, 2964. [Google Scholar] [CrossRef]
  9. Kong, X.; Liu, X.; Jedari, B.; Li, M.; Wan, L.; Xia, F. Mobile Crowdsourcing in Smart Cities: Technologies, Applications, and Future Challenges. IEEE Internet Things J. 2019, 6, 8095–8113. [Google Scholar] [CrossRef]
  10. Ghandour, A.J.; Hammoud, H.; Telesca, L. Transportation Hazard Spatial Analysis Using Crowd-Sourced Social Network Data. Phys. A Stat. Mech. Its Appl. 2019, 520, 309–316. [Google Scholar] [CrossRef]
  11. Balakrishnan, S.; Zhang, Z.; Machemehl, R.; Murphy, M.R. Mapping Resilience of Houston Freeway Network during Hurricane Harvey Using Extreme Travel Time Metrics. Int. J. Disaster Risk Reduct. 2020, 47, 101565. [Google Scholar] [CrossRef]
  12. Ferlisi, S.; Marchese, A.; Peduto, D. Quantitative Analysis of the Risk to Road Networks Exposed to Slow-Moving Landslides: A Case Study in the Campania Region (Southern Italy). Landslides 2021, 18, 303–319. [Google Scholar] [CrossRef]
  13. Arbib, C.; Arcelli, D.; Dugdale, J.; Moghaddam, M.T.; Arbib, C.; Arcelli, D.; Dugdale, J.; Moghaddam, M.T.; Real-time, H.M.; Arbib, C.; et al. Real-Time Emergency Response through Performant IoT Architectures. In Proceedings of the International Conference on Information Systems for Crisis Response and Management (ISCRAM), Valencia, Spain, 19–22 May 2019. [Google Scholar]
  14. Ali, A.; Ayub, N.; Shiraz, M.; Ullah, N.; Gani, A.; Qureshi, M.A. Traffic Efficiency Models for Urban Traffic Management Using Mobile Crowd Sensing: A Survey. Sustainability 2021, 13, 3068. [Google Scholar] [CrossRef]
  15. Zhang, X.; Souleyrette, R.R.; Green, E.; Wang, T.; Chen, M.; Ross, P. Collection, Analysis, and Reporting of Kentucky Traffic Incident Management Performance. Transp. Res. Rec. 2021, 2675, 167–181. [Google Scholar] [CrossRef]
  16. Jung, J.; Oh, T.; Kim, I.; Park, S. Open-Sourced Real-Time Visualization Platform for Traffic Simulation. Procedia Comput. Sci. 2023, 220, 243–250. [Google Scholar] [CrossRef]
  17. Zerafa, J.; Islam, M.R.; Kabir, M.A.; Xu, G. ExTraVis: Exploration of Traffic Incidents Using a Visual Interactive System. In Proceedings of the 2021 25th International Conference Information Visualisation (IV), Sydney, Australia, 5–9 July 2021; pp. 48–53. [Google Scholar] [CrossRef]
  18. Kong, Y.; Guan, M.; Li, X.; Zhao, J.; Yan, H. Bi-Linear Laws Govern the Impacts of Debris Flows, Debris Avalanches, and Rock Avalanches on Flexible Barrier. J. Geophys. Res. Earth Surf. 2022, 127, e2022JF006870. [Google Scholar] [CrossRef]
  19. Musa, A.; Hamada, M.; Hassan, M. A Theoretical Framework Towards Building a Lightweight Model for Pothole Detection Using Knowledge Distillation Approach. SHS Web Conf. 2022, 139, 03002. [Google Scholar] [CrossRef]
  20. Chan, R.; Lis, K.; Uhlemeyer, S.; Blum, H.; Honari, S.; Siegwart, R.; Fua, P.; Salzmann, M.; Rottmann, M. SegmentMeIfYouCan: A Benchmark for Anomaly Segmentation. In Proceedings of the 35th Conference on Neural Information Processing Systems (NeurIPS 2021) Track on Datasets and Benchmarks, Virtual, 6–14 December 2021. [Google Scholar]
  21. Rathee, M.; Bačić, B.; Doborjeh, M. Automated Road Defect and Anomaly Detection for Traffic Safety: A Systematic Review. Sensors 2023, 23, 5656. [Google Scholar] [CrossRef] [PubMed]
  22. Xu, S.; Li, S.; Huang, W.; Wen, R. Detecting Spatiotemporal Traffic Events Using Geosocial Media Data. Comput. Environ. Urban. Syst. 2022, 94, 101797. [Google Scholar] [CrossRef]
  23. Ahmed, E.; Yaqoob, I.; Hashem, I.A.T.; Khan, I.; Ahmed, A.I.A.; Imran, M.; Vasilakos, A.V. The Role of Big Data Analytics in Internet of Things. Comput. Netw. 2017, 129, 459–471. [Google Scholar] [CrossRef]
  24. Tong, Y.; Zhou, Z.; Zeng, Y.; Chen, L.; Shahabi, C. Spatial Crowdsourcing: A Survey. VLDB J. 2019, 129, 459–471. [Google Scholar] [CrossRef]
  25. To, H.; Shahabi, C. Location Privacy in Spatial Crowdsourcing. In Handbook of Mobile Data Privacy; Springer: Cham, Switzerland, 2018; pp. 167–194. [Google Scholar] [CrossRef]
  26. Kazemi, L.; Shahabi, C. GeoCrowd: Enabling Query Answering with Spatial Crowdsourcing. In Proceedings of the SIGSPATIAL 2012 International Conference on Advances in Geographic Information Systems, Redondo Beach, CA, USA, 6–9 November 2012; pp. 189–198. [Google Scholar]
  27. Phuttharak, J.; Loke, S.W. A Review of Mobile Crowdsourcing Architectures and Challenges: Toward Crowd-Empowered Internet-of-Things. IEEE Access 2019, 7, 304–324. [Google Scholar] [CrossRef]
  28. Sarker, R.A.; Biswas, P.; Dadon, S.H.; Imam, T. An Efficient Surface Map Creation and Tracking Using Smartphone Sensors and An Efficient Surface Map Creation and Tracking Using Smartphone. Sens. Crowdsourcing 2021, 21, 6969. [Google Scholar] [CrossRef]
  29. Song, X.; Zhang, H.; Akerkar, R.; Huang, H.; Guo, S.; Zhong, L.; Ji, Y.; Opdahl, A.L.; Purohit, H.; Skupin, A.; et al. Big Data and Emergency Management: Concepts, Methodologies, and Applications. IEEE Trans. Big Data 2022, 8, 397–419. [Google Scholar] [CrossRef]
  30. Xu, Z.; Liu, Y.; Yen, N.Y.; Mei, L.; Luo, X.; Wei, X.; Hu, C. Crowdsourcing Based Description of Urban Emergency Events Using Social Media Big Data. IEEE Trans. Cloud Comput. 2020, 8, 387–397. [Google Scholar] [CrossRef]
  31. Kang, Y.; Cai, Z.; Tan, C.W.; Huang, Q.; Liu, H. Natural Language Processing (NLP) in Management Research: A Literature Review. J. Manag. Anal. 2020, 7, 139–172. [Google Scholar] [CrossRef]
  32. Alkhatib, M.; El Barachi, M.; Shaalan, K. An Arabic Social Media Based Framework for Incidents and Events Monitoring in Smart Cities. J. Clean. Prod. 2019, 220, 771–785. [Google Scholar] [CrossRef]
  33. Essien, A.; Petrounias, I.; Sampaio, P.; Sampaio, S. A Deep-Learning Model for Urban Traffic Flow Prediction with Traffic Events Mined from Twitter. World Wide Web 2021, 24, 1345–1368. [Google Scholar] [CrossRef]
  34. Statista Leading Countries Based on Number of Twitter Users as of October 2020. Available online: https://www.statista.com/statistics/303681/twitter-users-worldwide/ (accessed on 27 March 2023).
  35. Statcounter Social Media Stats Palestinian Territory. Available online: https://gs.statcounter.com/social-media-stats/all/palestinian-territory/#monthly-202301-202407 (accessed on 8 January 2024).
  36. Habbas, W.; Berda, Y. Colonial Management as a Social Field: The Palestinian Remaking of Israel’s System of Spatial Control. Curr. Sociol. 2021, 71, 2–28. [Google Scholar] [CrossRef]
  37. Griffiths, M.; Repo, J. Women and Checkpoints in Palestine. Secur. Dialogue 2021, 52, 249–265. [Google Scholar] [CrossRef]
  38. OCHA Movement and Access in the West Bank|August 2023. Available online: https://www.ochaopt.org/2023-movement#:~:text=At (accessed on 4 June 2024).
  39. B’Tselem Settler Violence in the WB. Available online: https://www.btselem.org/settler_violence_updates_list?f%5B2%5D=nf_district%3A181&f%5B3%5D=nf_type%3A173&f%5B4%5D=date%3A%28min%3A1640995200%2Cmax%3A1672444800%29&page=1 (accessed on 22 January 2023).
  40. OCHA Data on Casualties. Available online: https://www.ochaopt.org/data/casualties (accessed on 13 February 2023).
  41. Lam, D.; Head, P. Sustainable Urban Mobility. In Energy, Transport, & the Environment: Addressing the Sustainable Mobility Paradigm; Springer: London, UK, 2012; pp. 359–371. [Google Scholar] [CrossRef]
  42. Calì, M.; Miaari, S.H. The Labor Market Impact of Mobility Restrictions: Evidence from the West Bank. Labour Econ. 2018, 51, 136–151. [Google Scholar] [CrossRef]
  43. Boussauw, K.; Vanin, F. Constrained Sustainable Urban Mobility: The Possible Contribution of Research by Design in Two Palestinian Cities. Urban. Des. Int. 2018, 23, 182–199. [Google Scholar] [CrossRef]
  44. Braverman, I. Civilized Borders: A Study of Israel’s New Crossing Administration. Antipode 2011, 43, 264–295. [Google Scholar] [CrossRef]
  45. Rijke, A.; Minca, C. Inside Checkpoint 300: Checkpoint Regimes as Spatial Political Technologies in the Occupied Palestinian Territories. Antipode 2019, 51, 968–988. [Google Scholar] [CrossRef]
  46. Amira, S. The Slow Violence of Israeli Settler-Colonialism and the Political Ecology of Ethnic Cleansing in the West Bank. Settl. Colon. Stud. 2021, 11, 512–532. [Google Scholar] [CrossRef]
  47. Aburas, H.; Shahrour, I. Impact of the Mobility Restrictions in the Palestinian Territory on the Population and the Environment. Sustainability 2021, 13, 3457. [Google Scholar] [CrossRef]
  48. ARIJ. Assessing The Impacts of Israeli Movement Restrictions on the Mobility on People and Goods in The West Bank; Bethlehem, 2019. Available online: https://www.arij.org/publications/special-reports/special-reports-2019/assessing-the-impacts-of-israeli-movement-restrictions-on-the-mobility-of-people-and-goods-in-the-west-bank-2019/ (accessed on 4 January 2022).
  49. Abu-Eisheh, S. The Impacts of the Segregation Wall on the Sustainability of Transportation Systems and Services in the Palestinian Territories. An-Najah Natl. Univ. J. Res. 2004, 18, 24. [Google Scholar] [CrossRef]
  50. Youth Media Center واقع الإعلام الرقمي في فلسطين; Gaza, 2023. Available online: https://drive.google.com/file/d/1cmiGdeIlY9Cp7s_H5DJ1QA7Wvwm0UPg0/view (accessed on 15 May 2023).
  51. IPOKE الواقع الرقمي الفلسطيني; Ramallah, 2022. Available online: https://www.slideshare.net/slideshow/digital-palestine-january-2022/255416114 (accessed on 28 April 2023).
  52. Wide, P. Improving Decisions Support for Operational Disruption Management in Freight Transport. Res. Transp. Bus. Manag. 2020, 37, 100540. [Google Scholar] [CrossRef]
  53. Singh, B.; Gupta, A. Recent Trends in Intelligent Transportation Systems: A Review. J. Transp. Lit. 2015, 9, 30–34. [Google Scholar] [CrossRef]
  54. Shetab-Boushehri, S.N.; Rajabi, P.; Mahmoudi, R. Modeling Location–Allocation of Emergency Medical Service Stations and Ambulance Routing Problems Considering the Variability of Events and Recurrent Traffic Congestion: A Real Case Study. Healthc. Anal. 2022, 2, 100048. [Google Scholar] [CrossRef]
  55. Chen, C.; Li, K.; Teo, S.G.; Zou, X.; Li, K.; Zeng, Z. Citywide Traffic Flow Prediction Based on Multiple Gated Spatio-Temporal Convolutional Neural Networks. ACM Trans. Knowl. Discov. Data 2020, 14, 1–23. [Google Scholar] [CrossRef]
  56. Paiva, S.; Ahad, M.A.; Tripathi, G.; Feroz, N.; Casalino, G. Enabling Technologies for Urban Smart Mobility: Recent Trends, Opportunities and Challenges. Sensors 2021, 21, 2143. [Google Scholar] [CrossRef] [PubMed]
  57. Partheeban, P.; Karthik, K.; Elamparithi, P.N.; Somasundaram, K.; Anuradha, B. Urban Road Traffic Noise on Human Exposure Assessment Using Geospatial Technology. Environ. Eng. Res. 2022, 27, 249. [Google Scholar] [CrossRef]
  58. Aburas, H. Smart and Resilient Mobility Services Platform for Managing Traffic Disruptive Events by Hala Aburas Cite This Article Smart and Resilient Mobility Services Platform for Managing Traffic Disruptive Events. Highlights Sustain. 2024, 3, 163–183. [Google Scholar] [CrossRef]
  59. Abrahams, A.S. Hard Traveling: Unemployment and Road Infrastructure in the Shadow of Political Conflict. Political Sci. Res. Methods 2021, 10, 545–566. [Google Scholar] [CrossRef]
  60. Lin, Y.; Li, R. Real-Time Traffic Accidents Post-Impact Prediction: Based on Crowdsourcing Data. Accid. Anal. Prev. 2020, 145, 105696. [Google Scholar] [CrossRef] [PubMed]
  61. Aljoufie, M.; Tiwari, A. Citizen Sensors for Smart City Planning and Traffic Management: Crowdsourcing Geospatial Data through Smartphones in Jeddah, Saudi Arabia. GeoJournal 2022, 87, 3149–3168. [Google Scholar] [CrossRef]
  62. Khaund, T.; Hussain, M.N.; Shaik, M.; Agarwal, N. Telegram: Data Collection, Opportunities and Challenges. In Information Management and Big Data; Springer: Berlin/Heidelberg, Germany, 2021. [Google Scholar]
  63. Fornace, K.M.; Surendra, H.; Abidin, T.R.; Reyes, R.; Macalinao, M.L.M.; Stresman, G.; Luchavez, J.; Ahmad, R.A.; Supargiyono, S.; Espino, F.; et al. Use of Mobile Technology—Based Participatory Mapping Approaches to Geolocate Health Facility Attendees for Disease Surveillance in Low Resource Settings. Int. J. Health Geogr. 2018, 17, 21. [Google Scholar] [CrossRef]
  64. Walther, S.C.; Gurung, K. Using GIS and Remote Sensing to Map Grassroots Sustainable Development for a Small NGO in Nepal. IJGER 2019, 6, 1–16. [Google Scholar]
  65. Jordan, E.J.; Moran, C.; Godwyll, J.M.; Jordan, E.J.; Moran, C.; Godwyll, J.M.; Survey, A.; Jordan, E.J. Current Issues in Tourism Does Tourism Really Cause Stress ? A Natural Experiment Utilizing ArcGIS Survey123. Curr. Issues Tour. 2019, 24, 1–15. [Google Scholar] [CrossRef]
  66. Lamoureux, Z.; Fast, V. The Tools of Citizen Science: An Evaluation of Map-Based Crowdsourcing Platforms Chickadee Technology. Spat. Knowl. Inf. Can. 2019, 7, 1–6. [Google Scholar]
  67. Kholoshyn, I.V.; Bondarenko, O.V.; Hanchuk, O.V.; Shmeltser, E.O. Cloud ArcGIS Online as an Innovative Tool for Developing Geoinformation Competence with Future Geography Teachers. CEUR Workshop Proc. 2019, 2433, 403–412. [Google Scholar] [CrossRef]
  68. Esri ArcGIS Trust Center. Available online: https://trust.arcgis.com/en/security/cloud-options.htm#:~:text=ArcGIS (accessed on 15 March 2023).
  69. Nobari, A.D.; Reshadatmand, N.; Neshati, M. Analysis of Telegram, an Instant Messaging Service. Int. Conf. Inf. Knowl. Manag. Proc. 2017, F131841, 2035–2038. [Google Scholar] [CrossRef]
  70. Dongo, I.; Cadinale, Y.; Aguilera, A.; Martínez, F.; Quintero, Y.; Barrios, S. Web Scraping versus Twitter API; Association for Computing Machinery: New York, NY, USA, 2020; pp. 263–273. [Google Scholar] [CrossRef]
  71. Aburas, H. Telegram-Text-Retrieving-Analysis-and-Geocoding. Available online: https://github.com/hala-aburas/Telegram-Messages-Retrieving-Analysis-and-Geocoding-Mapping.git (accessed on 17 May 2023).
  72. Guellil, I.; Saâdane, H.; Azouaou, F.; Gueni, B.; Nouvel, D. Arabic Natural Language Processing: An Overview. J. King Saud. Univ. Comput. Inf. Sci. 2021, 33, 497–507. [Google Scholar] [CrossRef]
  73. Abdelali, A.; Darwish, K.; Durrani, N.; Mubarak, H. Farasa: A Fast and Furious Segmenter for Arabic. In Proceedings of the 2016 Conference of the North American Chapter of the Association for Computational Linguistics: Demonstrations (NAACL-HLT 2016), San Diego, CA, USA, 12–27 June 2016; pp. 11–16. [Google Scholar] [CrossRef]
  74. Pasha, A.; Al-Badrashiny, M.; Diab, M.; El Kholy, A.; Eskander, R.; Habash, N.; Pooleery, M.; Rambow, O.; Roth, R.M. MADAMIRA: A Fast, Comprehensive Tool for Morphological Analysis and Disambiguation of Arabic. In Proceedings of the 9th International Conference on Language Resources and Evaluation, LREC 2014, Reykjavik, Iceland, 31 May 2014; pp. 1094–1101. [Google Scholar]
  75. Kwaik, K.A.; Saad, M.; Chatzikyriakidis, S.; Dobnik, S. Shami: A Corpus of Levantine Arabic Dialects. In Proceedings of the LREC 2018—11th International Conference on Language Resources and Evaluation, Mizayaki, Japan, 7–12 May 2019; pp. 3645–3652. [Google Scholar]
  76. Jarrar, M.; Habash, N.; Alrimawi, F.; Akra, D.; Zalmout, N. Curras: An Annotated Corpus for the Palestinian Arabic Dialect. Lang. Resour. Eval. 2017, 51, 745–775. [Google Scholar] [CrossRef]
  77. Wenxiu, P. Analysis of New Media Communication Based on Lasswell’s “5W” Model. J. Educ. Soc. Res. 2015, 5, 245–250. [Google Scholar] [CrossRef]
  78. Zou, L.; Lam, N.S.N.; Cai, H.; Qiang, Y. Mining Twitter Data for Improved Understanding of Disaster Resilience. Ann. Am. Assoc. Geogr. 2018, 108, 1422–1441. [Google Scholar] [CrossRef]
  79. Zheng, L.-X.; Ma, S.; Chen, Z.-X.; Luo, X.-Y. Ensuring the Correctness of Regular Expressions: A Review. Int. J. Autom. Comput. 2021, 18, 521–535. [Google Scholar] [CrossRef]
  80. Serere, H.N.; Resch, B.; Havas, C.R. Enhanced Geocoding Precision for Location Inference of Tweet Text Using SpaCy, Nominatim and Google Maps. A Comparative Analysis of the Influence of Data Selection. PLoS ONE 2023, 18, e0282942. [Google Scholar] [CrossRef]
  81. Serere, H.N.; Resch, B.; Havas, C.R.; Petutschnig, A. Extracting and Geocoding Locations in Social Media Posts: A Comparative Analysis. GI_Forum 2021, 9, 167–173. [Google Scholar] [CrossRef]
  82. Blackett, C. Human-Centered Design in an Automated World BT—Intelligent Human Systems Integration 2021; Russo, D., Ahram, T., Karwowski, W., Di Bucchianico, G., Taiar, R., Eds.; Springer International Publishing: Cham, Switzerland, 2021; pp. 17–23. [Google Scholar]
  83. Vallet, F.; Puchinger, J.; Millonig, A.; Lamé, G.; Nicolaï, I. Tangible Futures: Combining Scenario Thinking and Personas—A Pilot Study on Urban Mobility. Futures 2020, 117, 102513. [Google Scholar] [CrossRef]
  84. Sim, W.W.; Brouse, P.S. Developing Ontologies and Persona to Support and Enhance Requirements Engineering Activities—A Case Study. Procedia Comput. Sci. 2015, 44, 275–284. [Google Scholar] [CrossRef]
  85. Zhao, Y.; Gong, X.; Chen, X. Privacy-Preserving Incentive Mechanisms for Truthful Data Quality in Data Crowdsourcing. IEEE Trans. Mob. Comput. 2022, 21, 2518–2532. [Google Scholar] [CrossRef]
  86. Zheng, Y.; Li, G.; Li, Y.; Shan, C.; Cheng, R. Truth Inference in Crowdsourcing: Is the Problem Solved? Proc. VLDB Endow. 2016, 10, 541–552. [Google Scholar] [CrossRef]
  87. Sumner, J.L.; Farris, E.M.; Holman, M.R. Crowdsourcing Reliable Local Data. Political Anal. 2020, 28, 244–262. [Google Scholar] [CrossRef]
  88. Wang, R.Q.; Mao, H.; Wang, Y.; Rae, C.; Shaw, W. Hyper-Resolution Monitoring of Urban Flooding with Social Media and Crowdsourcing Data. Comput. Geosci. 2018, 111, 139–147. [Google Scholar] [CrossRef]
  89. Ansari, M.Y.; Ahmad, A.; Khan, S.S.; Bhushan, G. Mainuddin Spatiotemporal Clustering: A Review. Artif. Intell. Rev. 2020, 53, 2381–2423. [Google Scholar] [CrossRef]
  90. Hu, H.; Zheng, Y.; Bao, Z.; Li, G.; Feng, J.; Cheng, R. Crowdsourced POI Labelling: Location-Aware Result Inference and Task Assignment. In Proceedings of the 2016 IEEE 32nd International Conference on Data Engineering, ICDE, Helsinki, Finland, 16–20 May 2016; pp. 61–72. [Google Scholar] [CrossRef]
  91. Ye, J.Y.; Yu, C.; Husman, T.; Chen, B.; Trikala, A. Novel Strategy for Applying Hierarchical Density-Based Spatial Clustering of Applications with Noise towards Spectroscopic Analysis and Detection of Melanocytic Lesions. Melanoma Res. 2021, 31, 526–532. [Google Scholar] [CrossRef]
  92. Wang, L.; Chen, P.; Chen, L.; Mou, J. Ship Ais Trajectory Clustering: An Hdbscan-Based Approach. J. Mar. Sci. Eng. 2021, 9, 566. [Google Scholar] [CrossRef]
  93. Raleigh, C.; Linke, A.; Hegre, H.; Karlsen, J. Introducing ACLED: An Armed Conflict Location and Event Dataset. J. Peace Res. 2010, 47, 651–660. [Google Scholar] [CrossRef]
  94. Ahwaltareq. Available online: http://t.me/Ahwaltareq (accessed on 24 May 2023).
Figure 1. Geographical distribution of mobility restrictions in the WB.
Smartcities 07 00100 g001
Figure 2. Methods for collecting mobility restrictions data.
Smartcities 07 00100 g002
Figure 3. Workflow of importing and integrating data from Survey123 into the ArcGIS Online platform.
Smartcities 07 00100 g003
Figure 4. Methodology of connecting to Telegram, retrieving data, and storing in Pandas DataFrame.
Smartcities 07 00100 g004
Figure 5. Methodology of processing and analysis of Telegram data.
Smartcities 07 00100 g005
Figure 6. Phases of Telegram Arabic text processing using the NLTK.
Smartcities 07 00100 g006
Figure 7. Methodology of analyzing text using the 3W model.
Smartcities 07 00100 g007
Figure 8. Methodology of mapping mobility restrictions.
Smartcities 07 00100 g008
Figure 9. Data quality validation methods.
Smartcities 07 00100 g009
Figure 10. Application of mapping mobility restrictions using Survey123; (a) visual presentation of checkpoints and traffic congestion events on the map; (b) Survey123 checkpoint reporting page with mandatory filed marked with asterisk; (c) detailed information on the reported checkpoint.
Smartcities 07 00100 g010
Figure 11. Distribution of restriction reports.
Smartcities 07 00100 g011
Figure 12. Results of applying HDBSCAN on the traffic congestion reports, showing the distribution of stability values and the visualization of two clusters along with one noise cluster.
Smartcities 07 00100 g012
Figure 13. Ground-truth method application: buffer zone creation around temporary and fixed restrictions, along with validation results for checkpoint and road gate reports.
Smartcities 07 00100 g013
Figure 14. Results of the cross-referencing method using a test dataset from a Telegram group for sharing road traffic information, alongside the outcomes of the 3W model analysis.
Smartcities 07 00100 g014
Figure 15. Distribution of geocoded locations and ground data.
Smartcities 07 00100 g015
Figure 16. Traffic congestion report in Awarta.
Smartcities 07 00100 g016
Table 1. Keywords for identifying restriction status in Palestinian Dialect (DA) and Modern Standard Arabic (MSA).
Keywords of Restriction StatusPalestinian DAMSA
OpenسالكSalik مفتوحMaftouh
سالكة، سالكهSalikah
ClosedمسكرmsakirمغلقMughlaq
مسكره، مسكرةmsakirehمغلقة، مغلقهMughlaquh
إغلاق، اغلاقIghlaq
شبه مغلقhibh mughlaq
شبه مغلقة، شبه مغلقهhibh mughlaq
Congestedمأزم، مازمma’azim أزمة، ازمةAzima
سيئsayie’
سيئة، سيئهsayie’a
Violent incidents مواجهاتMuwajahat
مستوطنينMustawtinin
مسلحينMusalahin
Disclaimer/Publisher’s Note: The statements, opinions and data contained in all publications are solely those of the individual author(s) and contributor(s) and not of MDPI and/or the editor(s). MDPI and/or the editor(s) disclaim responsibility for any injury to people or property resulting from any ideas, methods, instructions or products referred to in the content.

