Article

Assessing the Impact of Calendar Events upon Urban Vehicle Behaviour and Emissions Using Telematics Data

School of Geography, Earth, and Environmental Sciences, University of Birmingham, Birmingham B15 2TT, UK
*
Author to whom correspondence should be addressed.
Smart Cities 2024, 7(6), 3071-3094; https://doi.org/10.3390/smartcities7060120
Submission received: 17 September 2024 / Revised: 17 October 2024 / Accepted: 21 October 2024 / Published: 24 October 2024
(This article belongs to the Section Smart Transportation)

Abstract

:

Highlights

This study provides an in-depth examination of the influence of calendar events (Easter holidays) on travel characteristics and vehicular emissions.
What are the main findings?
  • During Easter holidays, vehicles exhibited more dynamic driving patterns compared to the average annual periods, with increases in speed (~4%), acceleration (3–4%), and vehicle-specific power (7–9%). The more active driving behaviour resulted in higher emissions per vehicle, with CO2 and NO2 emission factors increasing by 3–8% and 4–10%, respectively.
  • The effect of Easter holidays on overall CO2 and NO2 emissions in 2022 was not uniform across time and location. By integrating road occupancy data, this study revealed contrasting outcomes: major roads experienced substantial decreases in emissions (15–25%) during weekday peak hours, while urban roads saw slight increases during weekend rush periods. This variability highlights the complex interplay between holiday traffic flow patterns and emission levels across different road types and times.
What is the implication of the main finding?
  • This study calls into question the assumption that a reduction in traffic automatically results in lower emissions per vehicle. This is evidenced by the observation that individual vehicle emission factors are higher during less congested holiday periods.
  • The substantial decline in overall emissions during Easter, despite an increase in per-vehicle emissions, highlights the pivotal role of traffic volume in urban air quality management. This finding suggests that strategies focusing on reducing the number of vehicles on the road, such as promoting public transportation or encouraging remote work during peak periods, may prove more effective in lowering total emissions than solely targeting individual vehicle efficiency in urban environments.

Abstract

Employing vehicle telematics data, this study investigates the transport environment across urban and major road networks during a two-week period encompassing the Easter holidays, considered as a case study. The analysis spans four distinct years: 2016, 2018, 2021, and 2022. Geospatial and Temporal Mapping captured the dependencies of vehicle speed, acceleration, vehicle-specific power (VSP), and emission factors (EFs) for air pollutants (CO2 and NOx) on the studied calendar period. The results showed that during the Easter holiday, the median vehicle speeds exceeded annual averages by roughly 5%, indicating a clear deviation from regular traffic patterns. This deviation was particularly stark during the 2021 lockdown, with a significant drop in vehicle presence, leading to less congestion and thus higher speeds and vehicle acceleration. The emissions analyses revealed that individual cars emit higher levels of CO2 and NOx during Easter. Specifically, the median values of CO2 EF and NOx EF were 9% and 11% higher than the annual norm. When combined with road occupancy data, the results demonstrate that the Easter holidays in 2022 had a variable impact on NOx and CO2 emissions, with significant reductions on major roads during weekday rush hours (15–25%) but slight increases on urban roads during weekend periods.

1. Introduction

Road transport is a crucial aspect of daily life, influencing how people move, work, and interact within cities. It facilitates the movement of goods, services, and people and supports economic and social activities. As such, it is a significant sector in modern societies, supporting development and economic growth [1]. The transport sector, and therefore the demand for transport, has significantly grown over the last two decades. For example, according to the Department for Transport (DfT) in the United Kingdom (UK), the number of cars registered in the UK increased by 22% between 2000 and 2020 [2]. In the United States (US), the demand for transportation constituted approximately 9% of the gross domestic product (GDP) in 2022, driven largely by the purchase of motor vehicles and associated parts by households [3]. In the European Union (EU), the transport sector contributed approximately 5% of the gross domestic product (GDP) in 2022, with road transport representing a significant component of logistics and economic activity [4]. However, UK DfT figures show that by 2020, almost 85% of UK road vehicles were powered by internal combustion engines (ICEs) using either petrol or diesel [2].
The substantial contribution of ICEs to the emission of urban air pollutants, including particulate matter (PM), carbon monoxide (CO), nitrogen oxides (NOx = NO + NO2, where NO and NO2 are nitric oxide and nitrogen dioxide, respectively), and volatile organic compounds (VOCs), has been extensively documented in the literature; see, for example, [5,6,7]. Despite the significant reductions in exhaust emissions, non-exhaust emissions remain a serious concern for electric, hybrid, or clean fuel vehicles [8]. The wide and dangerous health impacts of air pollution have been evidenced by a wide body of research, see for example Refs. [9,10]. Road transport also contributes to almost one-fifth of global carbon dioxide (CO2) emissions [11], making it a major contributor to climate change and global warming [12].
Accordingly, the road transport environment in terms of emissions and fuel consumption of road vehicles has attracted considerable interest from many stakeholders, including academics, urban planners, policymakers, private and administrative sectors, city authorities, etc. Key factors such as urban development, fleet size and composition, and urban climate, have been shown to play a crucial role. For example, ref. [13] investigated the effects of unsustainable urbanization on road emissions in a medium-sized city in Iran.
Human behaviour constitutes a critical factor influencing urban road transport and a substantial corpus of research has been devoted to examining the influence of human response to both planned and unplanned interventions and events on air quality and road emissions. The COVID-19 pandemic, as an example of an unplanned intervention, generated significant scholarly discourse regarding its impact on air pollution and road transport. For instance, ref. [14] studied the impact of the COVID-19 pandemic on the emissions of Oman’s transportation sector and found a nearly 30% reduction in the corresponding greenhouse gas emissions. Conversely, ref [15] explored the consequences of a planned intervention, specifically the econo-political conflicts (US sanctions) on air pollution in Tehran, Iran. Their findings indicated a substantial increase (10–117%) in various air pollutant levels. Notwithstanding the extensive and rich literature addressing the impact of planned and unplanned interventions on air pollution and emission sources, certain common occurrences, such as official holidays, remain inadequately explored in terms of their effects on urban road transport and air quality. This gap in the literature underscores the need for further investigation into these frequently occurring, yet understudied phenomena.
In the context of air pollution research, the ‘holiday effect’ has emerged as a significant concept. This phenomenon elucidates the variations in air pollution levels during holiday periods—encompassing weekends, calendar events, and national holidays—compared to non-holiday times. The holiday effect provides valuable insights into the direct influence of human behaviour on environmental dimensions, thereby offering a promising avenue for future research in urban air quality management and sustainable transportation planning.
Most research focuses on identifying differences in urban air quality patterns between weekdays and weekends. For instance, Hua and Zhang [16] conducted a study in Beijing that examined the variations in PM2.5 and NO2 concentrations during holidays. Their findings revealed a Saturday effect in the downtown area, indicating a 4% reduction in PM2.5 and a 3% reduction in NO2 compared to weekdays. The study attributed the reduction in NO2 in suburban areas to decreased traffic, as many residents travelled to their hometowns for the holidays. However, the study does not discuss the deeper connection between them. Yousefian and Faridi [17] investigated the temporal differences in air pollutant levels in the city of Tehran, the Capital of Iran. They found that the concentration variation of all air pollutants follows the holiday effect, especially O3. Some studies highlight the impact of big holiday events on urban air pollution levels. For instance, Chen and Tan [18] assessed the impact of holiday characteristics in Taipei and emphasised the need for implementing ozone control strategies. Their study highlighted the intricate influence of calendar events on air quality, considering factors such as meteorological conditions and anthropogenic emissions. A study conducted in Barcelona, Spain, investigated the impact of public transport strikes on air quality, which can be considered as unforeseen events [19]. The research found that private vehicle trips increased during such strikes, resulting in higher levels of air pollution. Specifically, there were significant increases in NOx and black carbon levels, ranging from 4.1% to 7.7%, during the strike days.
A notable gap in the current literature is the limited examination of urban transportation’s specific reactions to calendar events. While the overarching “holiday effect” provides a macro-level perspective of air quality variations, the intricacies of transportation’s influence within this context are not adequately probed. Given the considerable influence of the transportation sector on urban emissions, it is crucial to understand how mobility patterns affect air pollution emissions during these special occasions. Moreover, the preponderance of studies in this domain exhibits a notable deficiency in comprehensive qualitative analyses of the actual effects of the events under scrutiny on road emissions. These investigations predominantly focused on evaluating air quality data before and after the study period, presenting results and discussions in an ostensibly objective manner. However, they failed to delve into the intricate impacts of the events or interventions, specifically on road emissions. It is imperative to recognise that urban environments are characterised by high dynamism. Consequently, detailed spatial and temporal road data are indispensable for conducting thorough and reliable analyses. This granularity of data is crucial for capturing the complex interplay between urban mobility patterns, calendar events, and resultant air quality variations.
Vehicle GPS data can provide valuable insights into urban mobility and its response to events and interventions. However, access to this data is limited because major players, such as Google Maps, Waze, and City Mapper, which collect it for navigation purposes, do not provide free access. In addition, almost all existing services are online, making it difficult to study the impact of events and interventions offline. It is noted that Google provides limited access to some location data to demonstrate the impact of the COVID-19 pandemic on urban mobility in various cities worldwide [20].
In the realm of urban transport analysis, the emergence of vehicle telematics data heralds a revolutionary method for elucidating urban transport trends with remarkable specificity. Telematic, a fusion of telecommunications and informatics, plays a pivotal role in recording real-time vehicular data. The majority of vehicle telematics data are collected from drivers who voluntarily share their location data with the telematics companies to receive fairer insurance premiums. The different methods to collect vehicle telematics data and the existing challenges faced by the telematics market and telematics research were discussed in detail by ref. [21]. Vehicle telematics data offer enriched perspectives on driving habits, vehicular efficiency and even potential estimations of air pollutant emissions across varied spatial and temporal dimensions [22]. In 2024, Ghaffarpasand and Pope [23] developed a new approach for analysing urban mobility using vehicle telematics data. Their approach offers road transport characteristics at highly detailed spatial and temporal resolutions.
In response to the aforementioned research gap concerning urban transport’s reaction to calendar events, this study endeavours to utilise vehicle telematics data to construct a nuanced understanding of urban mobility variations, both during and outside conventional calendar events. The Easter holiday in the city of Birmingham, UK, is considered as a case study and its impact on road transport is discussed here. Easter is a Christian festival that includes public holidays on Good Friday and Easter Monday in the UK. While the official holiday has a defined duration, its impact on transport patterns, road emissions, and air pollution can extend over a broader period, typically affecting travel behaviour for up to two weeks due to the accompanying school and work holidays. This extended influence may be overlooked due to the holiday’s short official duration and its variable timing in either March or April each year.
Utilising the analytical framework established by ref. [24], this paper will transform these identified vehicular behavioural variations into quantifiable air pollution metrics. The overarching objective of this investigation is to provide a comprehensive, integrated perspective on how calendar-specific human activities, particularly in the realm of transportation, influence local road emissions.
This research seeks to bridge the gap in current literature by offering a detailed examination of urban transportation’s specific responses to calendar events, moving beyond the macro-level “holiday effect” to elucidate the nuanced dynamics of mobility patterns during these distinctive periods. By focusing on the Easter holiday, this study addresses the need for granular spatial and temporal road data in analysing urban environmental dynamics.

2. Materials and Methods

2.1. Telematics Data

The Floow (www.thefloow.com, accessed on 20 October 2024) provided the vehicle telematics data for this study. The dataset comprised instantaneous speed–time records collected from passenger cars weighing 3.885 tonnes or less, as defined by the EU Commission (1999), travelling on the roads of Birmingham, UK. The company stated that the telematics data were only collected from the onboard diagnostics (OBDs), or black boxes, installed in the cars and the data collected from the drivers’ mobile phones were excluded. The data were collected from 3–7% of the fleet, depending mainly on the time and place of the sampling. In essence, the density of the collected data is determined by the spatiotemporal characteristics of road transport. For instance, the number of GPS-connected vehicles on major roads during rush hour on weekdays is higher than that on minor roads during non-rush hour on weekends. Hence, caution is required when using data collected from minor roads, such as service or residential roads, because of the lower data density.
The initial data processing involved Quality Control and Quality Assurance (QC/QA) checks performed by the telematics company. Post-processing, the data were anonymised and aggregated in alignment with the European Union and UK General Data Protection Regulation (GDPR) guidelines. This aggregation was based on road sections and temporal intervals. The processed dataset was further divided into segments, each characterised by unique geospatial and temporal elements, henceforth referred to as GeoST-segments.
GeoST-segments are geospatial polyline entities assigned to time-specific markers, oriented according to the direction of traffic flow. One of the used GeoST-segments here is represented in Figure 1a. For each GeoST-segment, a Speed-Acceleration Frequency Distribution (SAFD) matrix was computed [22]. The foundation of this methodology lies in the acquisition of raw speed and acceleration data from passenger cars traversing each GeoST-segment. Subsequent to data pre-processing, the continuous speed and acceleration measurements are discretized into bins, a crucial step in the creation of the SAFD matrix. The bin structure is carefully defined based on both the intrinsic characteristics of the collected data and insights gleaned from previous studies in the field (e.g., [25,26]). The adopted binning scheme comprises speed bins ranging from 0 to 36 m/s with 2 m/s intervals, resulting in 18 distinct speed categories. Concurrently, acceleration is binned from −4 to 4 m/s2 with 0.1 m/s2 intervals, yielding 10 acceleration categories. The calculation of the SAFD matrix for each GeoST-segment involves an iterative process wherein each data point is assigned to its corresponding speed-acceleration bin. The frequency f(i,j) for each bin (i,j) is calculated as f(i,j) = n(i,j)/N * 100, where n(i,j) represents the number of data points in bin (i,j), and N denotes the total number of data points in the GeoST-segment. This normalization converts raw counts to percentages, facilitating comparisons across segments with varying data volumes. The Floow contributed to this study by providing the SAFD for the studied GeoST-segments.

2.2. Geospatial and Temporal Mapping of Urban Mobility (GSTMUM)

Travel characteristics including the average speed, acceleration, and vehicle-specific power (VSP) are estimated from the SAFD matrix within each GeoST-segment. This methodological approach termed geospatial and Temporal Mapping of Urban Mobility (GSTMUM), was extensively discussed by [23,24]. It was also used to convert the VSP values within each GeoST-segment into vehicular NOx and CO2 emission factors (EFs) [23,24]. VSP is a commonly used index for estimating vehicle emissions [27]. However, additional information, such as the relationship between VSP and emission rates of vehicle subsets and fleet composition over the studied area are prerequisites to examine the emission factors. The VSP parametrization of emission rate, as provided by ref. [28], is used in this study. The composition of the studied fleet will be determined in the following section.

2.3. Spatial and Temporal Scope of This Study

This study focuses on the city of Birmingham, the capital of the West Midlands County, located in the centre of the UK. Figure 1b shows the location of Birmingham on the UK map, the main road network and the distribution of different road types in the city. The roads in question have been categorised using the Open Street methodology [23].
It is important to note that five types of roads including motorways, trunk, primary, secondary, and tertiary roads are studied here. Other road types have been excluded due to the reduced data density of the collected data on minor roads, as discussed in the preceding section. The certainty of the results of the major roads was previously discussed in detail by ref. [23].
The roads under study are divided into two subsets: urban and major roads. The urban subset comprises secondary and tertiary roads, which are primarily two-way single-carriageways. The major subset comprises trunk, motorway, and primary roads, which are mainly dual carriageways or multi-lane roads, with higher corresponding speed limits and usage. The majority of the roads in Birmingham are residential or service roads (see Figure 1b); thus, only 21% of the city’s roads were included in this study.
Figure 1. (a) An example of a GeoST-segment as polyline entities assigned to time-specific markers; (b) the major road network and road type distribution in the city of Birmingham, UK; (c) the fleet composition in the city, while 2022_CAZ stands for fleet composition in areas located inside the clean air zone (CAZ). Details of the figure are reported in Table S1.
Smartcities 07 00120 g001aSmartcities 07 00120 g001b
Road transport in the city is considered here over a period of four years: 2016, 2018, 2021, and 2022. The population of the city, the number of road vehicles, and the annual vehicle miles travelled for the period considered (2016–2022) are approximately 1.2 million, 2 million, and 3.6 billion, respectively, according to the UK Department for Transport. As was mentioned above, the applied method here provides road transport characteristics within Geo-ST-segments, which are the pieces of the roads with given spatial (longitude and latitude) and temporal attributions. In terms of their spatial identities, they are polylines aligned with the traffic flow, connecting certain pairs of destinations with known longitude and latitude. In terms of their temporal identity, they cover 35 time slots within a week, spanning seven time periods per day (00:00–07:00, 07:00–09:00, 9:00–12:00, 12:00–14:00, 14:00–16:00, 16:00–19:00 and 19:00–24:00) over five days a week, including Monday, Tuesday, Friday, Saturday, and Sunday. Wednesday and Thursday were excluded based on the assumption that their characteristics would be highly similar to those of Tuesday. This approach enabled us to optimise the size and cost of our dataset while maintaining representative coverage of weekday patterns. This assumption is corroborated by an examination of hourly traffic flow data from 2022, which serves as a representative case study. As illustrated in Figure S1 (Supplementary Materials), the traffic patterns on Tuesdays, Wednesdays, and Thursdays exhibit notable similarities in their hourly variations. Although this sampling approach may be regarded as a potential limitation of the present study, it is our contention that it represents a pragmatic compromise between comprehensive coverage, data costs, and analytical efficiency, given the constraints of the overall dataset size.
The GeoST-segments dataset for the city of Birmingham comprises in excess of 70,000 GeoST-segments for each year under examination, encompassing a total distance of over 15,000 km of road. As previously stated, each GeoST-segment encompasses the characteristics of urban mobility and transport environments, including the average speed, acceleration, VSP, NOx, and CO2 EFs for the 35 time slots under examination. It should be noted, however, that only 21% of the GeoST-segments for the five types of roads were used in the analysis.
The temporal characteristics were aggregated and analysed as follows: weekday characteristics were averaged across five days (Monday to Friday), while weekend characteristics were averaged across two days (Saturday and Sunday). This bifurcation of temporal data into weekday and weekend categories allows for a more nuanced analysis of time-dependent phenomena, accounting for potential variations in behaviour or patterns between workdays and leisure days.

2.4. Fleet Composition and Traffic Data

The fleet composition was developed using the insights provided by the Birmingham City Council (BCC). To facilitate transport planning and enforcement of bus lane regulations, BCC has deployed a network of automatic number plate recognition (ANPR) cameras across the city since 2016. These cameras have been installed to record the registration numbers of vehicles passing through the city, as well as those that contravene bus lane regulations. They convert captured images into digital format. The information on the passing car is then extracted from the driving archives, specifically the Driver and Vehicle Licensing Agency (DVLA). The fleet composition is estimated by the information extracted from ANPR cameras. However, the estimations are typically conducted by a third party to address existing GDPR concerns in the UK and EU. The collected data are anonymised and then analysed to gain a detailed understanding of the city’s fleet composition. The authors do not possess information on specific details, such as the quantity of data collected, as BCC solely provided the combined outcomes of the fleet composition for the period under study.
Since June 2021, the Clean Air Zone (CAZ) has been implemented in the city of Birmingham. Petrol and diesel cars with Euro emission standards lower than Euro 4 and Euro 6, respectively, have to pay a fee if they enter into the CAZ area. Regarding the wide exemptions introduced for the first year of the CAZ in 2021, this study considers distinct fleet compositions for areas inside and outside the CAZ in 2022. Figure 1b displays the fleet composition of the city for the studied years, while 2022_CAZ provides the fleet composition within the CAZ in 2022, as identified by ANPR cameras. The detailed contribution of the different car subsets to the fleet composition is shown in Table S1 in the Supplementary Materials.
During the study period from 2016 to 2022, there was a shift in the distribution of petrol to diesel cars in Birmingham. In general, the percentage contribution of diesel cars, compared to petrol cars, has been decreasing over time. However, there was a surprising increase in the percentage of diesel cars in 2021–2022. There was also an increase in the number of Euro 6 cars in this period, which can be directly attributed to the implementation of the Birmingham CAZ in June 2021. It should be noted that this study focuses solely on the exhaust emissions of passenger cars. It is important to note that the vehicle fleet composition included a proportion of electric and hybrid vehicles, which varied between 2 and 10% across different time periods and locations (see Table S1 in Supplementary Material for exact percentages). These vehicles were excluded from our emissions calculations due to their zero or potentially zero exhaust emissions. While we acknowledge that hybrid vehicles may operate in non-electric mode and thus contribute to exhaust emissions, the limitations of our dataset prevented us from distinguishing between fully electric and hybrid vehicles or determining the operational mode of hybrid vehicles. This simplification may lead to a slight underestimation of total emissions, particularly in areas or time periods with higher proportions of hybrid vehicles. Future studies with more detailed fleet data could refine this approach by incorporating the emissions from hybrid vehicles operating in non-electric mode.
The data on traffic volumes was provided by Transport for West Midlands (TfWM) for the 2022 year. TfWM installed several traffic count stations across the entire West Midlands, with the objective of monitoring the number of passing vehicles on a 24 h basis.

2.5. The Method to Evaluate the Effect of Calendar Events

This study analyses the impact of calendar events on travel and transport. The case study focuses on the Easter break, a Christian festival and cultural holiday celebrated in many parts of the world. In the UK, the timeline of the Easter national holiday varies between March and April each year. In addition, the UK government typically designates the Monday after Easter Friday as a public holiday. As a result, many people plan their leave around this date to maximise their holiday time. This research considers a two-week period encompassing the Easter holiday and evaluates the characteristics of the travel and transportation environment during this time using annual figures. The timetable for the two-week period that covers Easter and the specific period considered is reported in Table 1. This two-week period covers the same period as the typical school holiday in the UK. The Easter holiday period was chosen, rather than other holiday periods such as Christmas or the long summer break, because it is less likely to be affected by extreme meteorological events such as heatwaves or cold waves, which could cause confounding factors.
This study analysed the impact of the Easter holidays by examining the probability distribution function (PDF) of the studied parameters over the Geo-ST-segments for both the two-week Easter period (as reported in Table 1) and the entire year in which that specific Easter occurred. The median values for PDF profiles of the two-week Easter period and annual data were then evaluated together. For example, Figure 2a shows a PDF of the average speed over the GeoST-segments distributed throughout Birmingham during the Monday morning rush hour (07:00–09:00) in 2016. The same is presented for the same time slots during the two-week Easter period. The difference between the median values is considered the impact of the intervention studied on the transport characteristics. This study analysed the results in 35 different time slots, with seven intervals per day and five days per week, as discussed in Section 2.3. The impact of the intervention on each transport characteristic was examined through 35 relative differences after completing the exercise. Figure 2b presents the box plots of the relative differences, which provide new insights into the role of the interventions studied by year.

3. Results and Discussions

3.1. Travel Characteristics

3.1.1. Vehicle (Traffic Flow) Speed

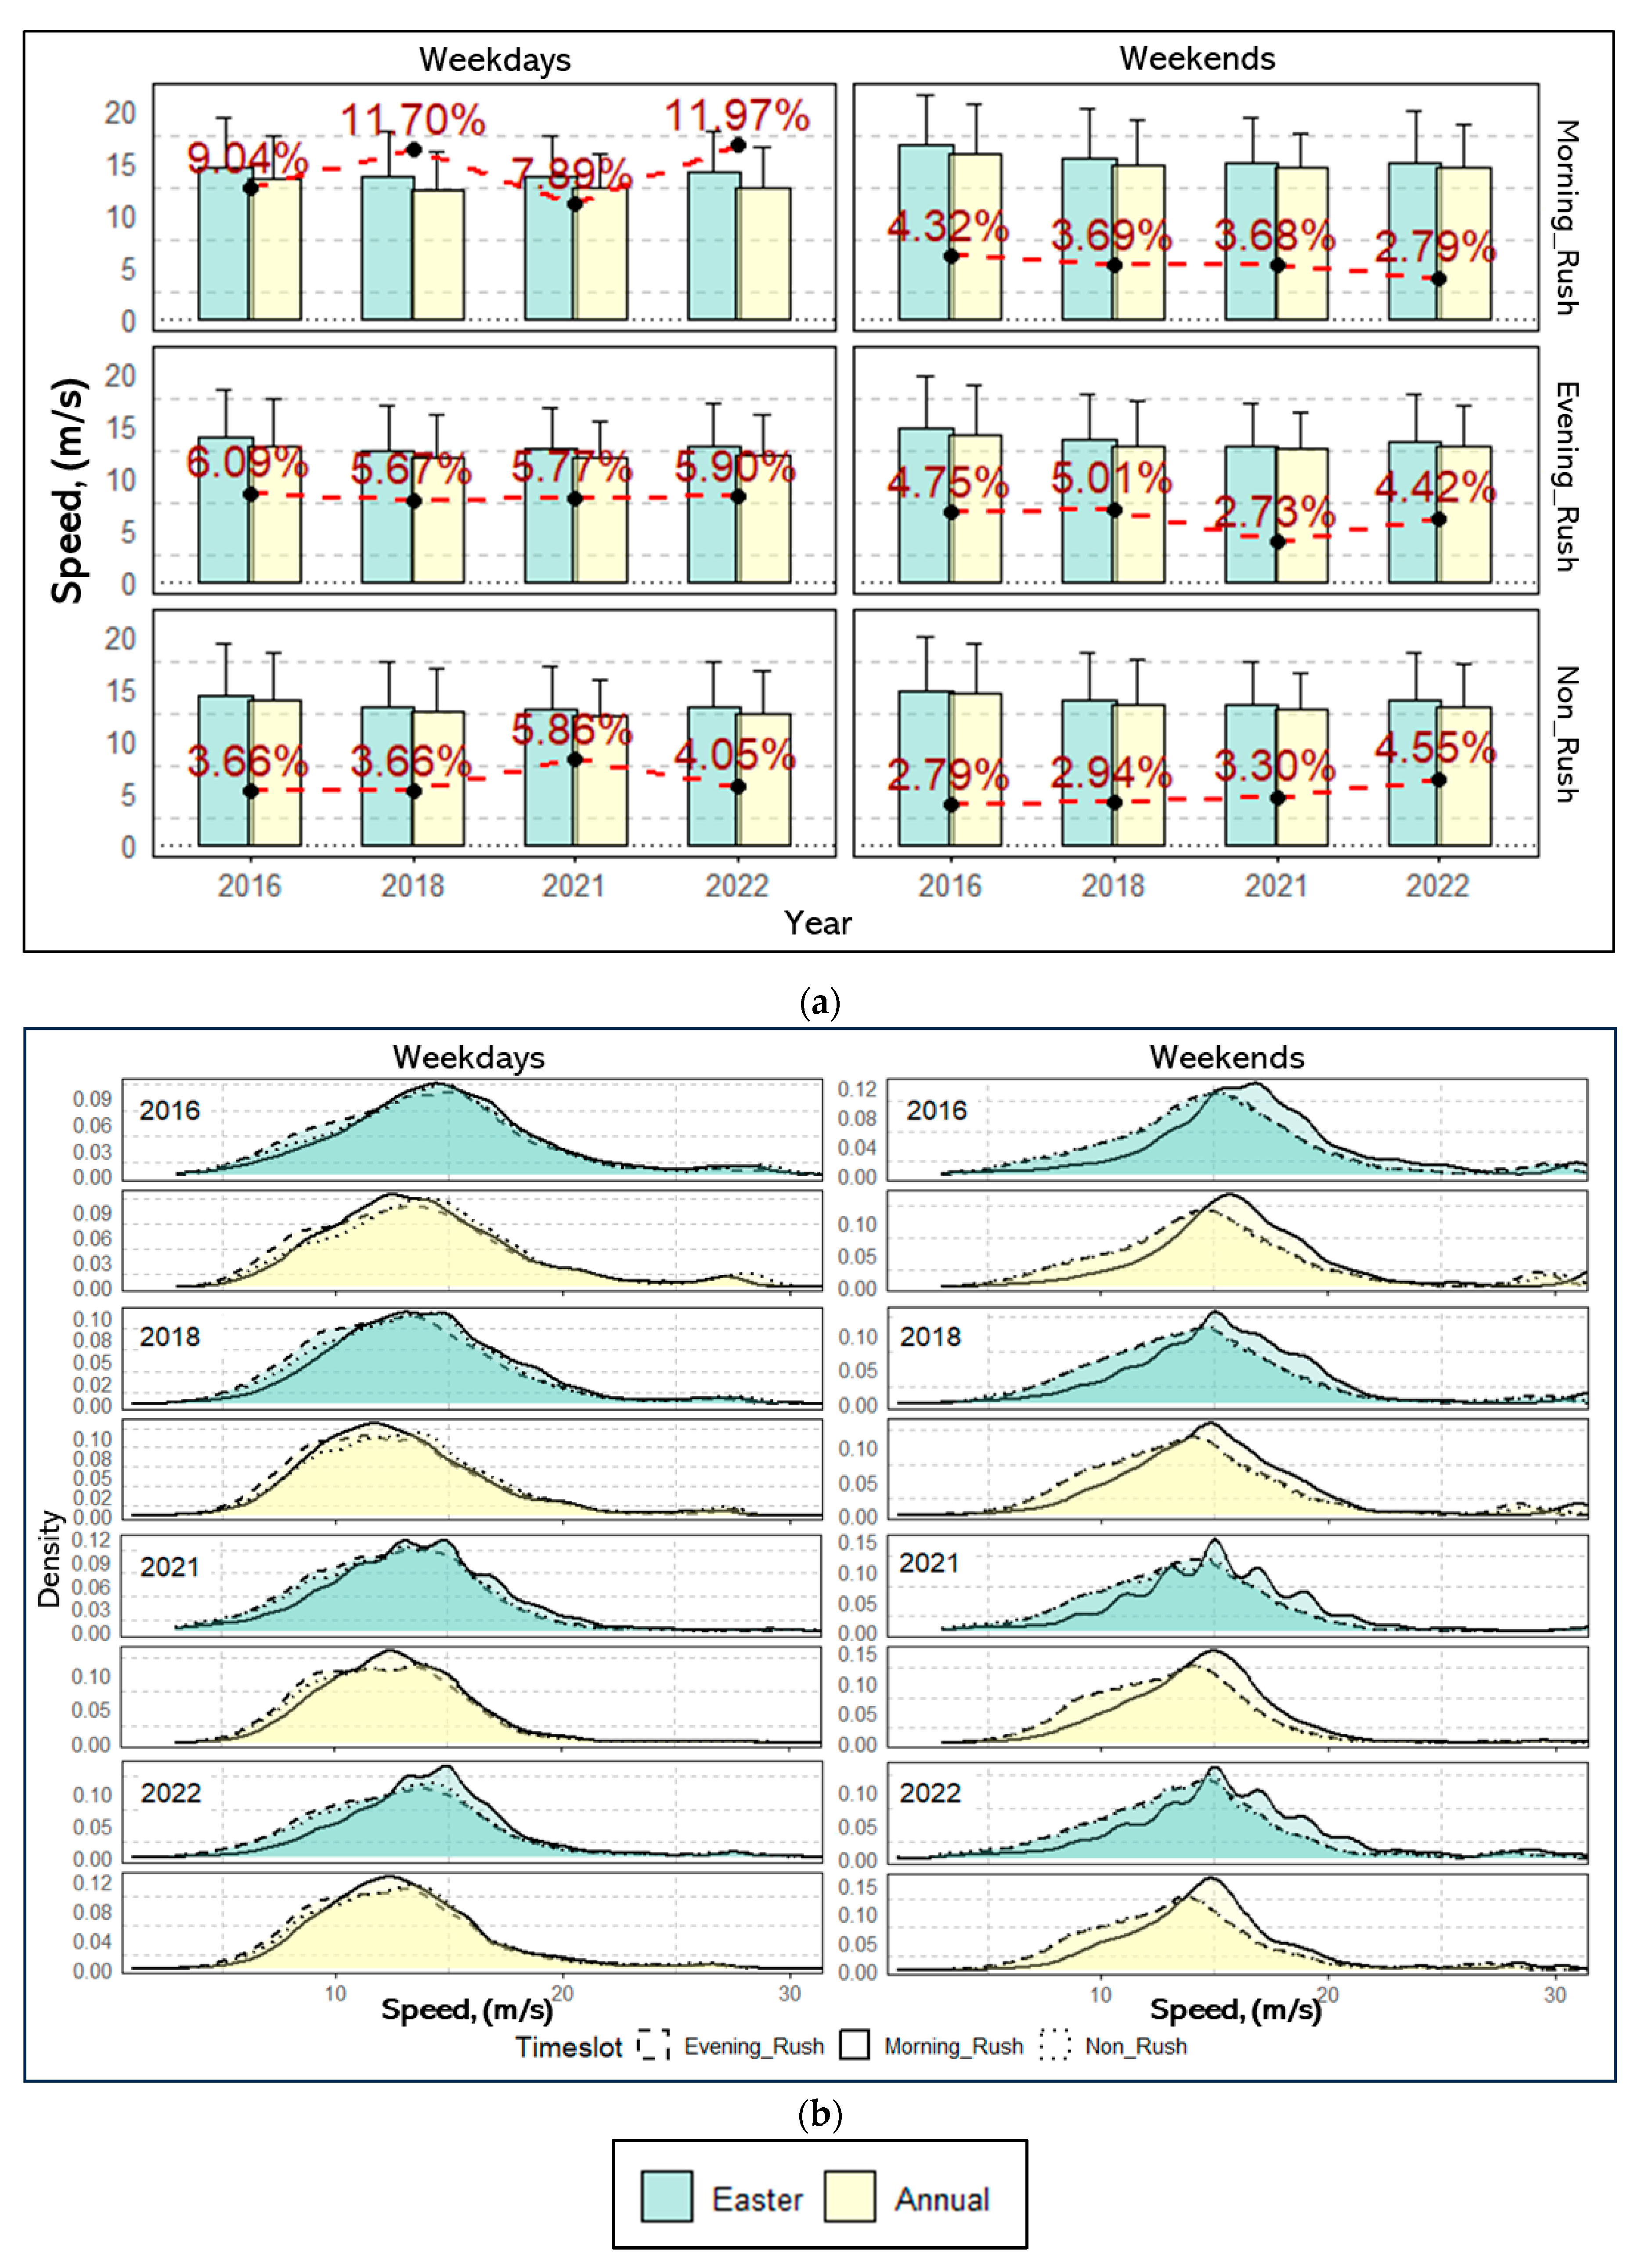
Figure 3a and Supplementary Figure S2a illustrate the relative differences (RDs) in vehicle speeds between Easter and annual averages across various timeslots for major and urban roads, respectively, segmented by time of day and the weekend/weekday distinction. The median vehicle speeds during Easter consistently exceed those of the annual average, indicating a characteristic alteration in traffic patterns during the holiday period. It can be observed that there is a tendency for people to drive at faster speeds during the Easter holidays. This may be attributed to the reduced congestion observed during the period under consideration.
The RDs tend to be greatest during the weekday morning rush hours, particularly on major roads, where the RDs range between approximately 8 and 12%. These differences in speed can be attributed to reduced traffic volume because of the holiday schedule, which diminishes the typical congestion experienced during regular commuting periods. Conversely, on urban roads, a peak RD of 10.8% is observed, suggesting that the holiday impact on traffic speeds is also significant in more densely populated areas, where traffic is typically more heterogeneous and constrained by stop-and-go conditions.
A low RD value (0.7%) was observed during morning rush hours over the weekends on urban roads in 2021. Except for the weekday morning rush hour, there was a small drop in the speed RD in 2021 compared with the other three observed years on major roads. The pattern is the same as that for urban roads. The notable divergence of 2021 data could be attributed to the exceptional circumstances of the COVID-19 pandemic. National lockdowns were enforced from January to July 2021 in England, with the periods of restricted movement fundamentally altering traffic patterns across Birmingham. The pandemic-induced lockdowns likely led to a significant reduction in the number of vehicles on the road, as residents adhered to government mandates to stay at home except for essential travel. This significantly decreased traffic volumes, allowing for a freer flow of vehicles, and consequently higher speeds during times that would, under normal circumstances, experience peak congestion.
Figure 3b and Supplementary Figure S2b present the PDFs of vehicle speed across all the major road and urban road segments, broken down by different times of day and types of days (weekdays versus weekends).
On major roads, the PDFs show a multimodal distribution of vehicle speeds. Particularly during the Easter period, the peaks in speed PDF profiles suggest the presence of multiple preferred travel velocities, contrasting with the generally unimodal distribution observed in the annual situation. This multimodality is indicative of varied vehicular flow patterns. This phenomenon possibly reflects disparate traffic behaviours during the holiday season. For annual data, the distribution appears more unimodal regardless of the period. In 2022, for instance, a clear bimodal distribution during Easter weekday mornings indicates two dominant speed regimes: one around 12 m/s and another at approximately 15 m/s. This duality in peak speeds is less evident in the annual data for the same year, where a single peak around 15 m/s is more dominant. These findings are consistent across the studied years, albeit with some variability in peak speeds and densities.
The speeds appear to be more consistent, potentially influenced by work-related commutes, which may result in a more predictable flow of traffic. This relative regularity is reflected in the PDF as a single, dominant peak (unimodal), which suggests that there is a common speed range at which a significant portion of vehicles travel during non-holiday periods. These observations suggest that holiday road usage patterns differ from those observed during regular periods, resulting in the emergence of distinct traffic speed distributions.

3.1.2. Vehicle Acceleration

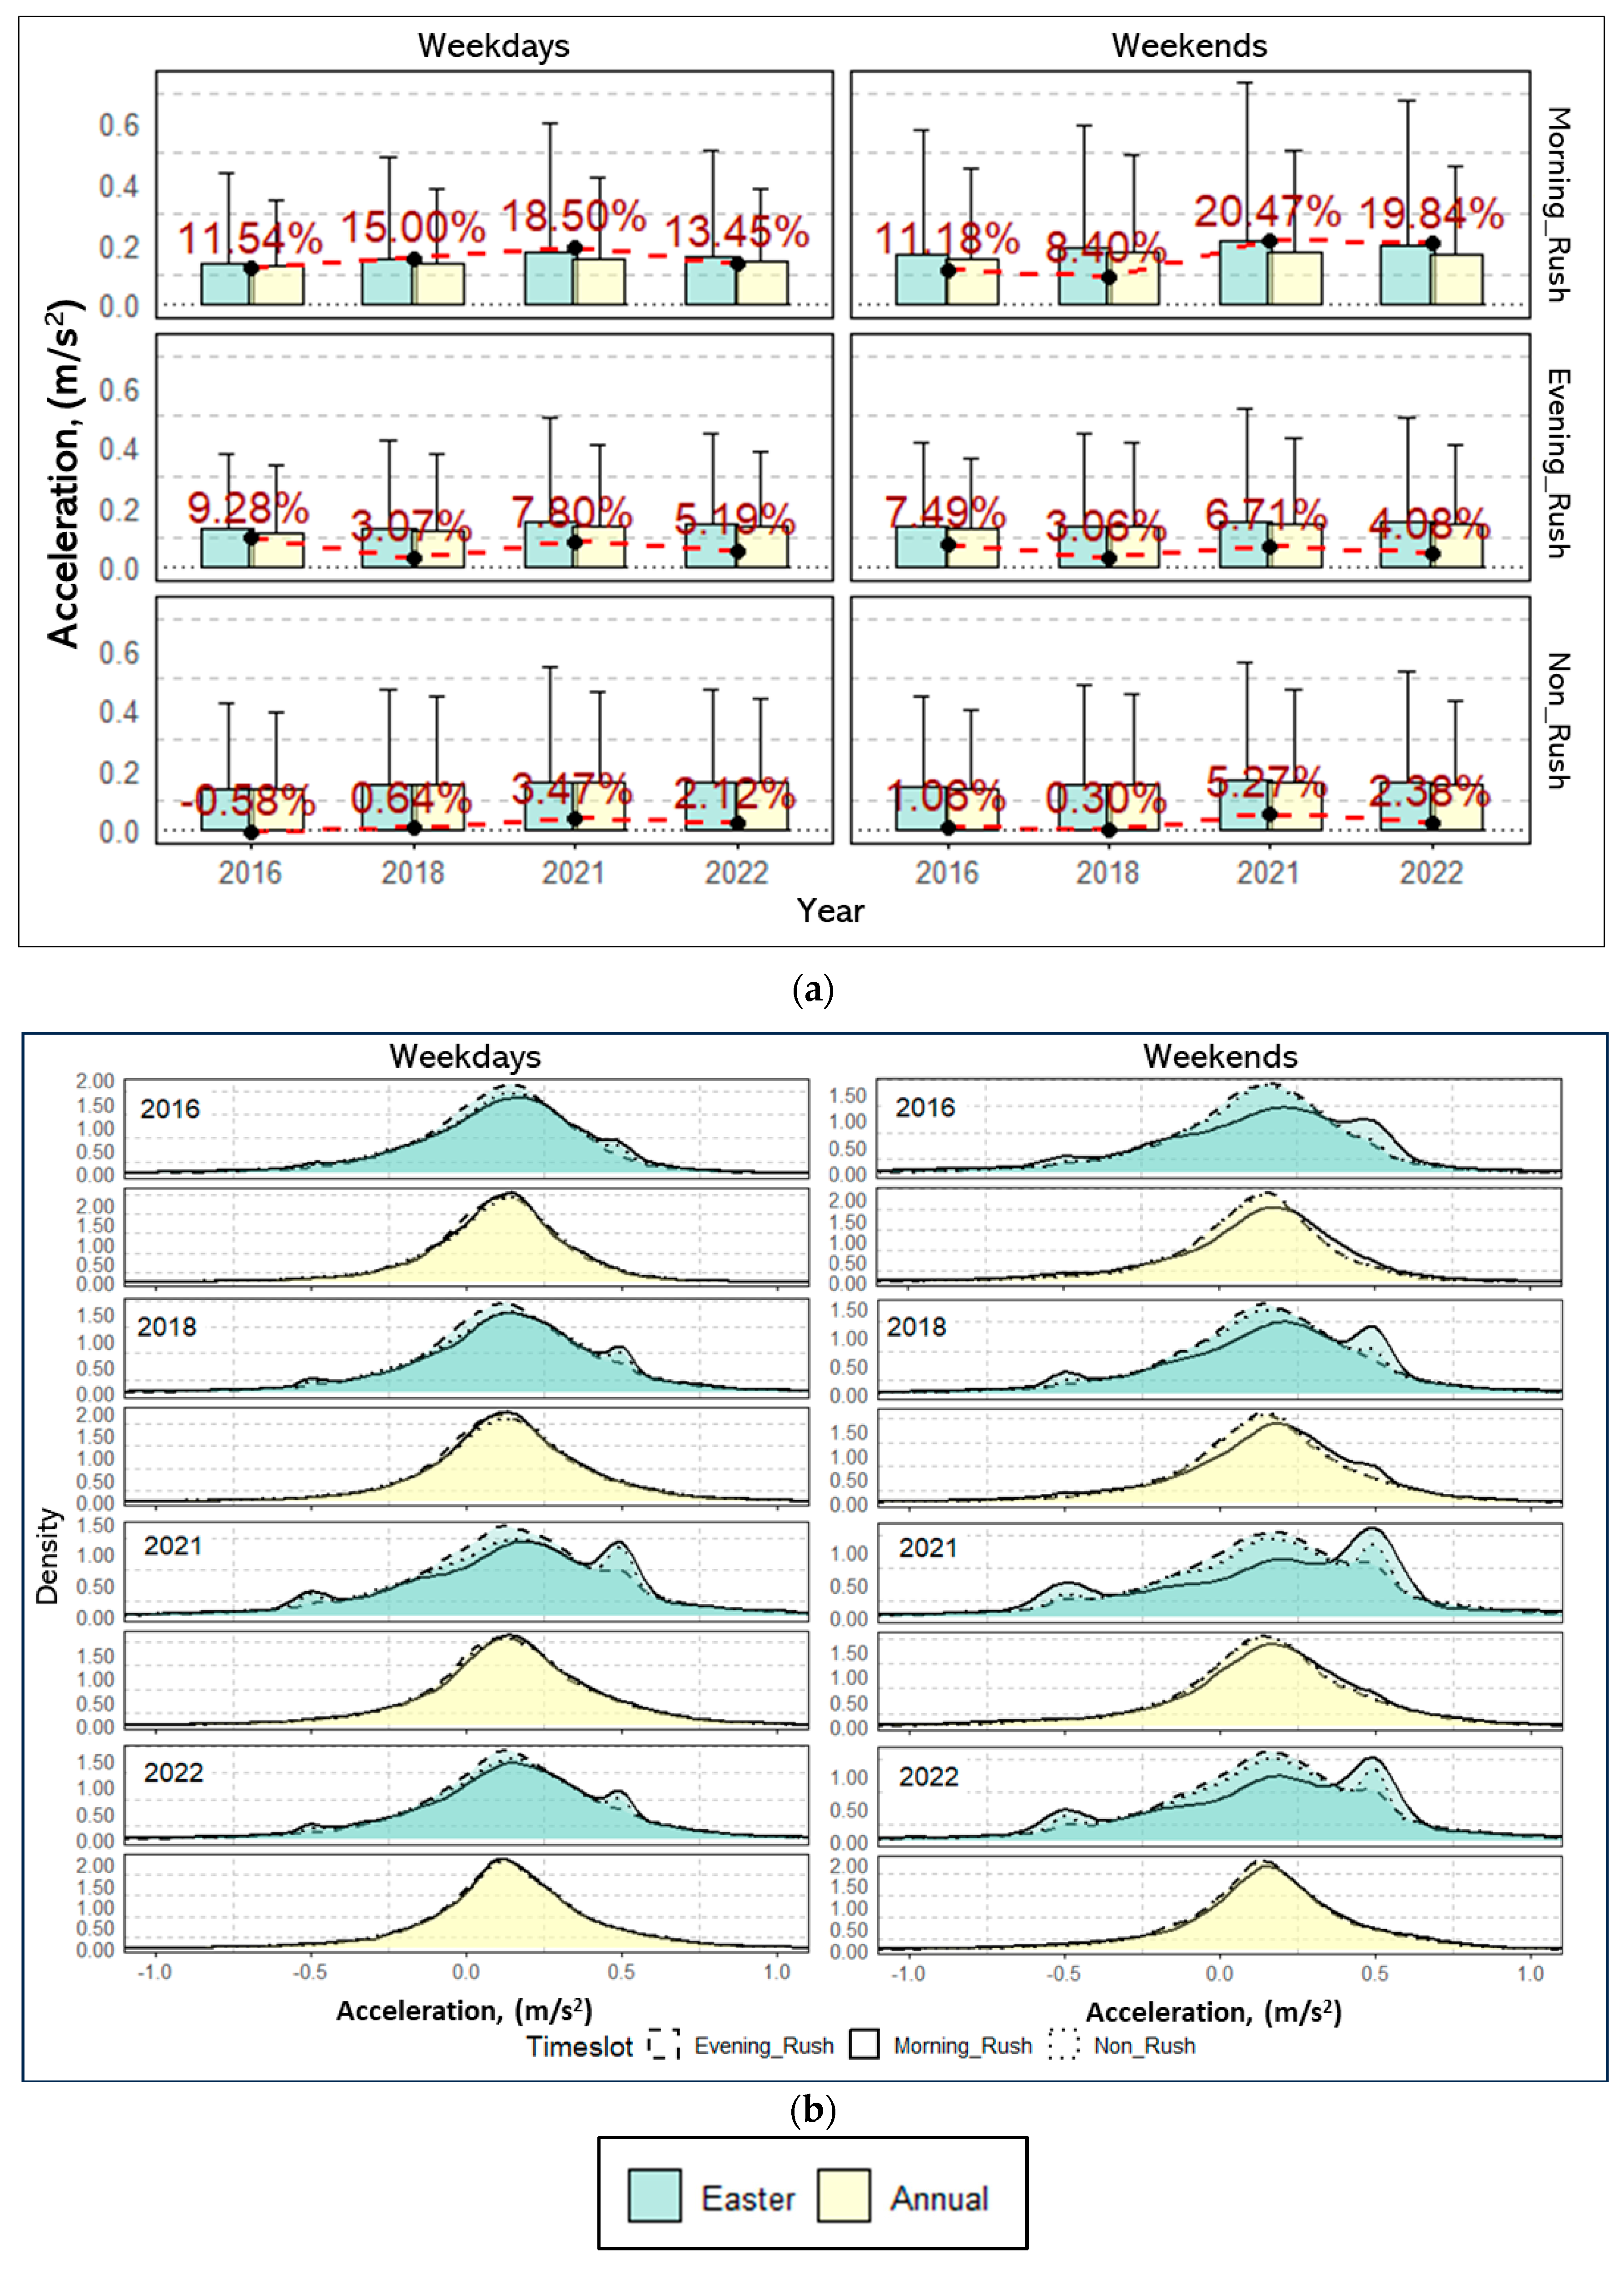
Figure 4a and Supplementary Figure S3a display the distributions of vehicle acceleration on major and urban roads in Birmingham over the Easter period compared to annual distributions. It is shown that the median value of acceleration during Easter is always greater than annual median. The plots in Figure 4a present notable variabilities in acceleration between years during morning rush hours on weekdays. This could be indicative of less congested roads, allowing for more frequent and pronounced acceleration events. For instance, in 2021, a relative difference of 20.47% suggests substantially altered driving patterns, likely due to the COVID-19 pandemic restrictions influencing typical traffic behaviour. During weekends, the relative difference peaks, especially in the morning rush, are higher during Easter, potentially reflecting a more leisurely driving style or less synchronised travel patterns when compared to the weekday commute.
In urban roads, as shown in Supplementary Figure S3a, the acceleration patterns are quite pronounced during the Easter period, reflecting the less systematic and more diverse driving behaviour that typifies urban areas with frequent stops and starts. The year 2021 stands out with substantial relative differences, particularly during non-rush hours, which may correlate with the unique circumstances of lockdown, when the usual urban traffic congestion would have been unusually light.
The higher accelerations during Easter suggest drivers experience more freedom to adjust speeds, likely due to reduced traffic density. With fewer vehicles on the road, drivers do not need to brake as often for other cars, leading to fewer stop-and-go conditions. This means that once they accelerate, they can maintain a higher speed for longer before needing to decelerate again. This leads to an overall increase in acceleration events, as drivers take advantage of the open road to speed up more quickly than they would in regular traffic. Moreover, with more open roads, drivers may be more inclined to accelerate more aggressively, knowing that they have more space and lower likelihood of needing to stop for traffic ahead. During lockdowns, the typical ‘rush hour’ congestion was absent, further contributing to this effect (the 36.34% and 40.03% peak of acceleration RD in 2021). During the 2021 lockdowns, these effects would have been particularly pronounced. The unprecedented reduction in traffic would mean that essential travel, which was still permitted, would occur on much emptier roads. Consequently, vehicles could accelerate more quickly and maintain higher speeds (Figure 3) without the need to frequently adjust speed for other road users.
The acceleration PDFs for both major and urban roads are depicted in Figure 4b and Supplementary Figure S3b. On weekdays, for major roads, there is a tendency for the PDF to exhibit a clear peak around zero acceleration, indicating that a large proportion of the time vehicles either maintain a steady speed or experience gentle acceleration and deceleration. During morning rush hours, the peaks are more pronounced, suggesting more dynamic acceleration and deceleration, as vehicles start and stop more frequently due to traffic conditions. The higher densities around zero during non-rush hours suggest steadier driving conditions, with less variability in speed.
The urban roads’ acceleration PDFs, on the other hand, show a slightly greater spread across the acceleration range, which is characteristic of urban driving, with more frequent stops, starts, and speed changes due to factors such as traffic lights, pedestrian crossings, and the presence of more junctions.
The morning rush hour exhibits a distinctly different acceleration PDF; it indicates the unique traffic conditions during this time. Typically, the morning rush hour is characterised by more consistent starting and stopping, as commuters head to work or school, which can create a more uniform pattern of acceleration across the board. This would be reflected in a more pronounced peak in the PDF around the most common acceleration values. On the other hand, the PDFs of the evening rush hour and non-rush hour behave similarly on both major and urban roads across all the timeslots. This might be because the evening rush is not as intense as the morning rush in terms of stop-and-go conditions, possibly due to a more staggered end to the workday or different traffic management conditions in the evening. Non-rush hours could then share similar driving dynamics, perhaps due to lower traffic volumes that still permit higher speeds but also require occasional stopping and starting (due to traffic signals, pedestrian activity, etc.), leading to a similar distribution of acceleration rates as the evening rush hour. The distinctive pattern during the morning rush hour could be a result of the concentrated demand for road space as people follow similar schedules to begin their day, which is not as pronounced later in the day or during periods without the typical rush hour constraints.

3.1.3. Vehicle-Specific Power (VSP)

VSP is an important parameter reflecting the engine power demand under different driving conditions. In Figure 5a and Figure S4a, the VSP distributions are presented for major and urban roads over selected years during Easter, compared to annual.
On major roads, the Easter period always has a higher VSP compared to the annual average. This suggests that on major roads, during the Easter holiday, vehicles tend to operate with a higher power demand compared to the annual average. Especially during morning rush hours, this phenomenon became more obvious (with percentages rising as high as 19.87% above the annual median in 2022 on weekdays). One possible explanation could be that the reduced traffic congestion during Easter allows for more dynamic driving, including higher speeds and more frequent acceleration, thus raising the average VSP.
Supplementary Figure S4a presents the VSP on urban roads. Contrasting with the VSP trends on major roads, the urban roads exhibit both increases and decreases in VSP during Easter as compared to the annual average (certain years and timeslots show a negative RD for VSP during Easter), suggesting that the power demand on the engine can be lower during the holiday period in these urban settings. For cases that have a positive RD of VSP, the RD values could be much lower compared with the situation on major roads, which means that the difference in VSP between the Easter period and the annual average on urban roads is not as obvious as on major roads. Additionally, in some cases, the negative value of the RD of VSP could be observed, and these decreases in VSP are particularly evident during the morning hours in 2016 (−1.38%), this could indicate more efficient driving conditions. The mixed VSP results on urban roads highlight the diverse impact of holiday periods on driving patterns in densely populated areas. While some increases in VSP suggest more dynamic driving, the observed decreases in specific contexts imply that the reduced traffic volume during Easter leads to more efficient driving, with less need for frequent and forceful acceleration. This nuanced pattern may reflect a balance between the less congested models, which allow for smoother traffic flow, and the short-distance urban trips typical of Easter that do not necessitate high power demands. It demonstrates that a reduction in traffic density can sometimes lead to improved engine efficiency, depending on the specific urban context and time of day.
Figure 5b and Supplementary Figure S4b present the PDFs for VSP across the four study years on both major and urban roads. The VSP distributions exhibit noticeable differences between the Easter period and regular traffic conditions. During Easter, the VSP tends to have wider distributions compared to the annual VSP. Additionally, the Easter VSP PDFs seem more likely to exhibit bimodal distributions on both weekdays and weekends, a phenomenon that has become more apparent over the years. Most notably, VSP during morning rush hours consistently shows a broader distribution, especially on weekends.
The tendency for wider and bimodal distributions in the VSP PDFs during Easter suggests that the holiday period introduces more variability in driving behaviours, possibly due to changes in routine and the reduced need for typical commuting. The presence of bimodal distributions may indicate that two distinct driving modes became prevalent during this period, which could be attributed to a mix of leisurely travel and the remaining commuting patterns. This variability, particularly pronounced during weekend mornings, underscores the influence of non-work-related travel during Easter.

3.2. Transport Environment Characteristics, Vehicle Emission Factors

As previously mentioned, ref. [24] developed a VSP-based method to convert VSP values on each GeoST-segment to the exhaustive CO2 and NOx emission factors. Before proceeding with any further discussions, it is important to note that when evaluating emission factors, cases where VSP is negative (indicating deceleration or braking) typically result in lower concentrations of emitted pollutants compared to ambient levels. Therefore, these cases are considered as having zero emissions and will be assigned a value of zero for EF. This advice has been previously given in the study by ref. [28].

3.2.1. CO2 Emission Factor

In Figure 6a and Supplementary Figure S5a, CO2 emission factors (EFs) for individual vehicles are examined, comparing Easter with annual averages. Consistently across both major and urban roads, and over the four years studied, the CO2 EF RD values were positive. This denotes that during Easter, individual on-road vehicles exhibit higher CO2 emission factors compared to the rest of the year. For major roads, the RD peaks during morning rush hours over the weekends, with values up to 18.55% higher than the annual average. Similarly, urban roads also display significant increases, particularly during morning rush hours on the weekends, with RDs as high as 16.54%, and all values of CO2 EFs are around 200 g/km.
Furthermore, the CO2 EF RD during non-rush hours on weekends often shows higher values compared with evening rush hours. For instance, the urban roads exhibit an increase in CO2 EF RD during non-rush hours, from 8.23% in 2016 to 11.51% on weekends in 2022 (Figure S5), and from 3.06% in 2016 to 6.62% in 2021, dropping to 4.37% in 2022 (Figure 6) during weekend non-rush hours on major roads. This contrasts with more moderate increases during the evening rush (1.16% to 3.16% on major roads and 7.66% to 10.59% on urban roads). These variations may be attributed to the less predictable nature of non-rush hour traffic, where the absence of congestion leads to driving patterns that are not as efficient as those typically enforced by the higher vehicle densities of rush hours. These observations could partly show that the lower traffic density does not unconditionally equate to lower CO2 emissions for individual vehicles on the road. Instead, the quality of driving behaviours, the type of roads, and the specific time of day significantly influence vehicular CO2 emissions. The less congested roads during non-rush hours may facilitate driving behaviours, such as higher speeds and increased acceleration.
The CO2 EF PDFs during Easter show a more pronounced bimodal distribution, especially on weekends and morning rush hours when compared to the annual distribution. This suggests that on weekends and during busy morning commutes, there is a significant variation in vehicle emissions, likely due to a mix of different driving behaviours that are not as pronounced during typical weekday traffic conditions. These dual peaks imply that there are two dominant modes of driving—possibly one characterised by steady, efficient cruising, resulting in lower emissions, and another by higher speeds or aggressive acceleration, leading to increased emissions.
The CO2 emission factor PDFs exhibit notable differences when comparing Easter periods to annual data. According to Figure 6b and Supplementary Figure S5b, during Easter, the CO2 EF PDFs show a tendency toward a bimodal distribution, especially during weekends and morning rush hours. This indicates that there are likely two prevalent driving states contributing to emissions during these times—one corresponding to lower emission factors and another to higher emission factors, which could correspond to varying speeds or driving behaviours typical of holiday periods. When examining the CO2 EF PDFs for urban roads on an annual basis (Supplementary Figure S5b), the bimodal distribution is less pronounced on weekends and nearly absent during morning rush hours on major roads (Figure 6b). The annual data tend to have a more intense peak, suggesting a more uniform driving behaviour, with less variation in emission factors compared to the Easter period.
Following the year 2021, the CO2 EF PDFs show an increased tendency toward bimodal distributions during morning rush hours and around the 250 g/km mark on both urban and major roads, across both weekdays and weekends. This change may reflect a lasting alteration in traffic patterns due to the pandemic, with 2021 serving as an inflexion point leading to more differentiated driving behaviours. The shift toward a more defined bimodal pattern post-2021 suggests that, as traffic volumes may have started to rise again, certain driving behaviours that became more common during the pandemic persisted. For instance, if a significant portion of the workforce continues to telecommute, the typical morning rush hour may now comprise a blend of traditional commuters and a new segment of drivers who may have more flexibility in their travel times, possibly leading to varied speeds and acceleration patterns.

3.2.2. NOx Emission Factor

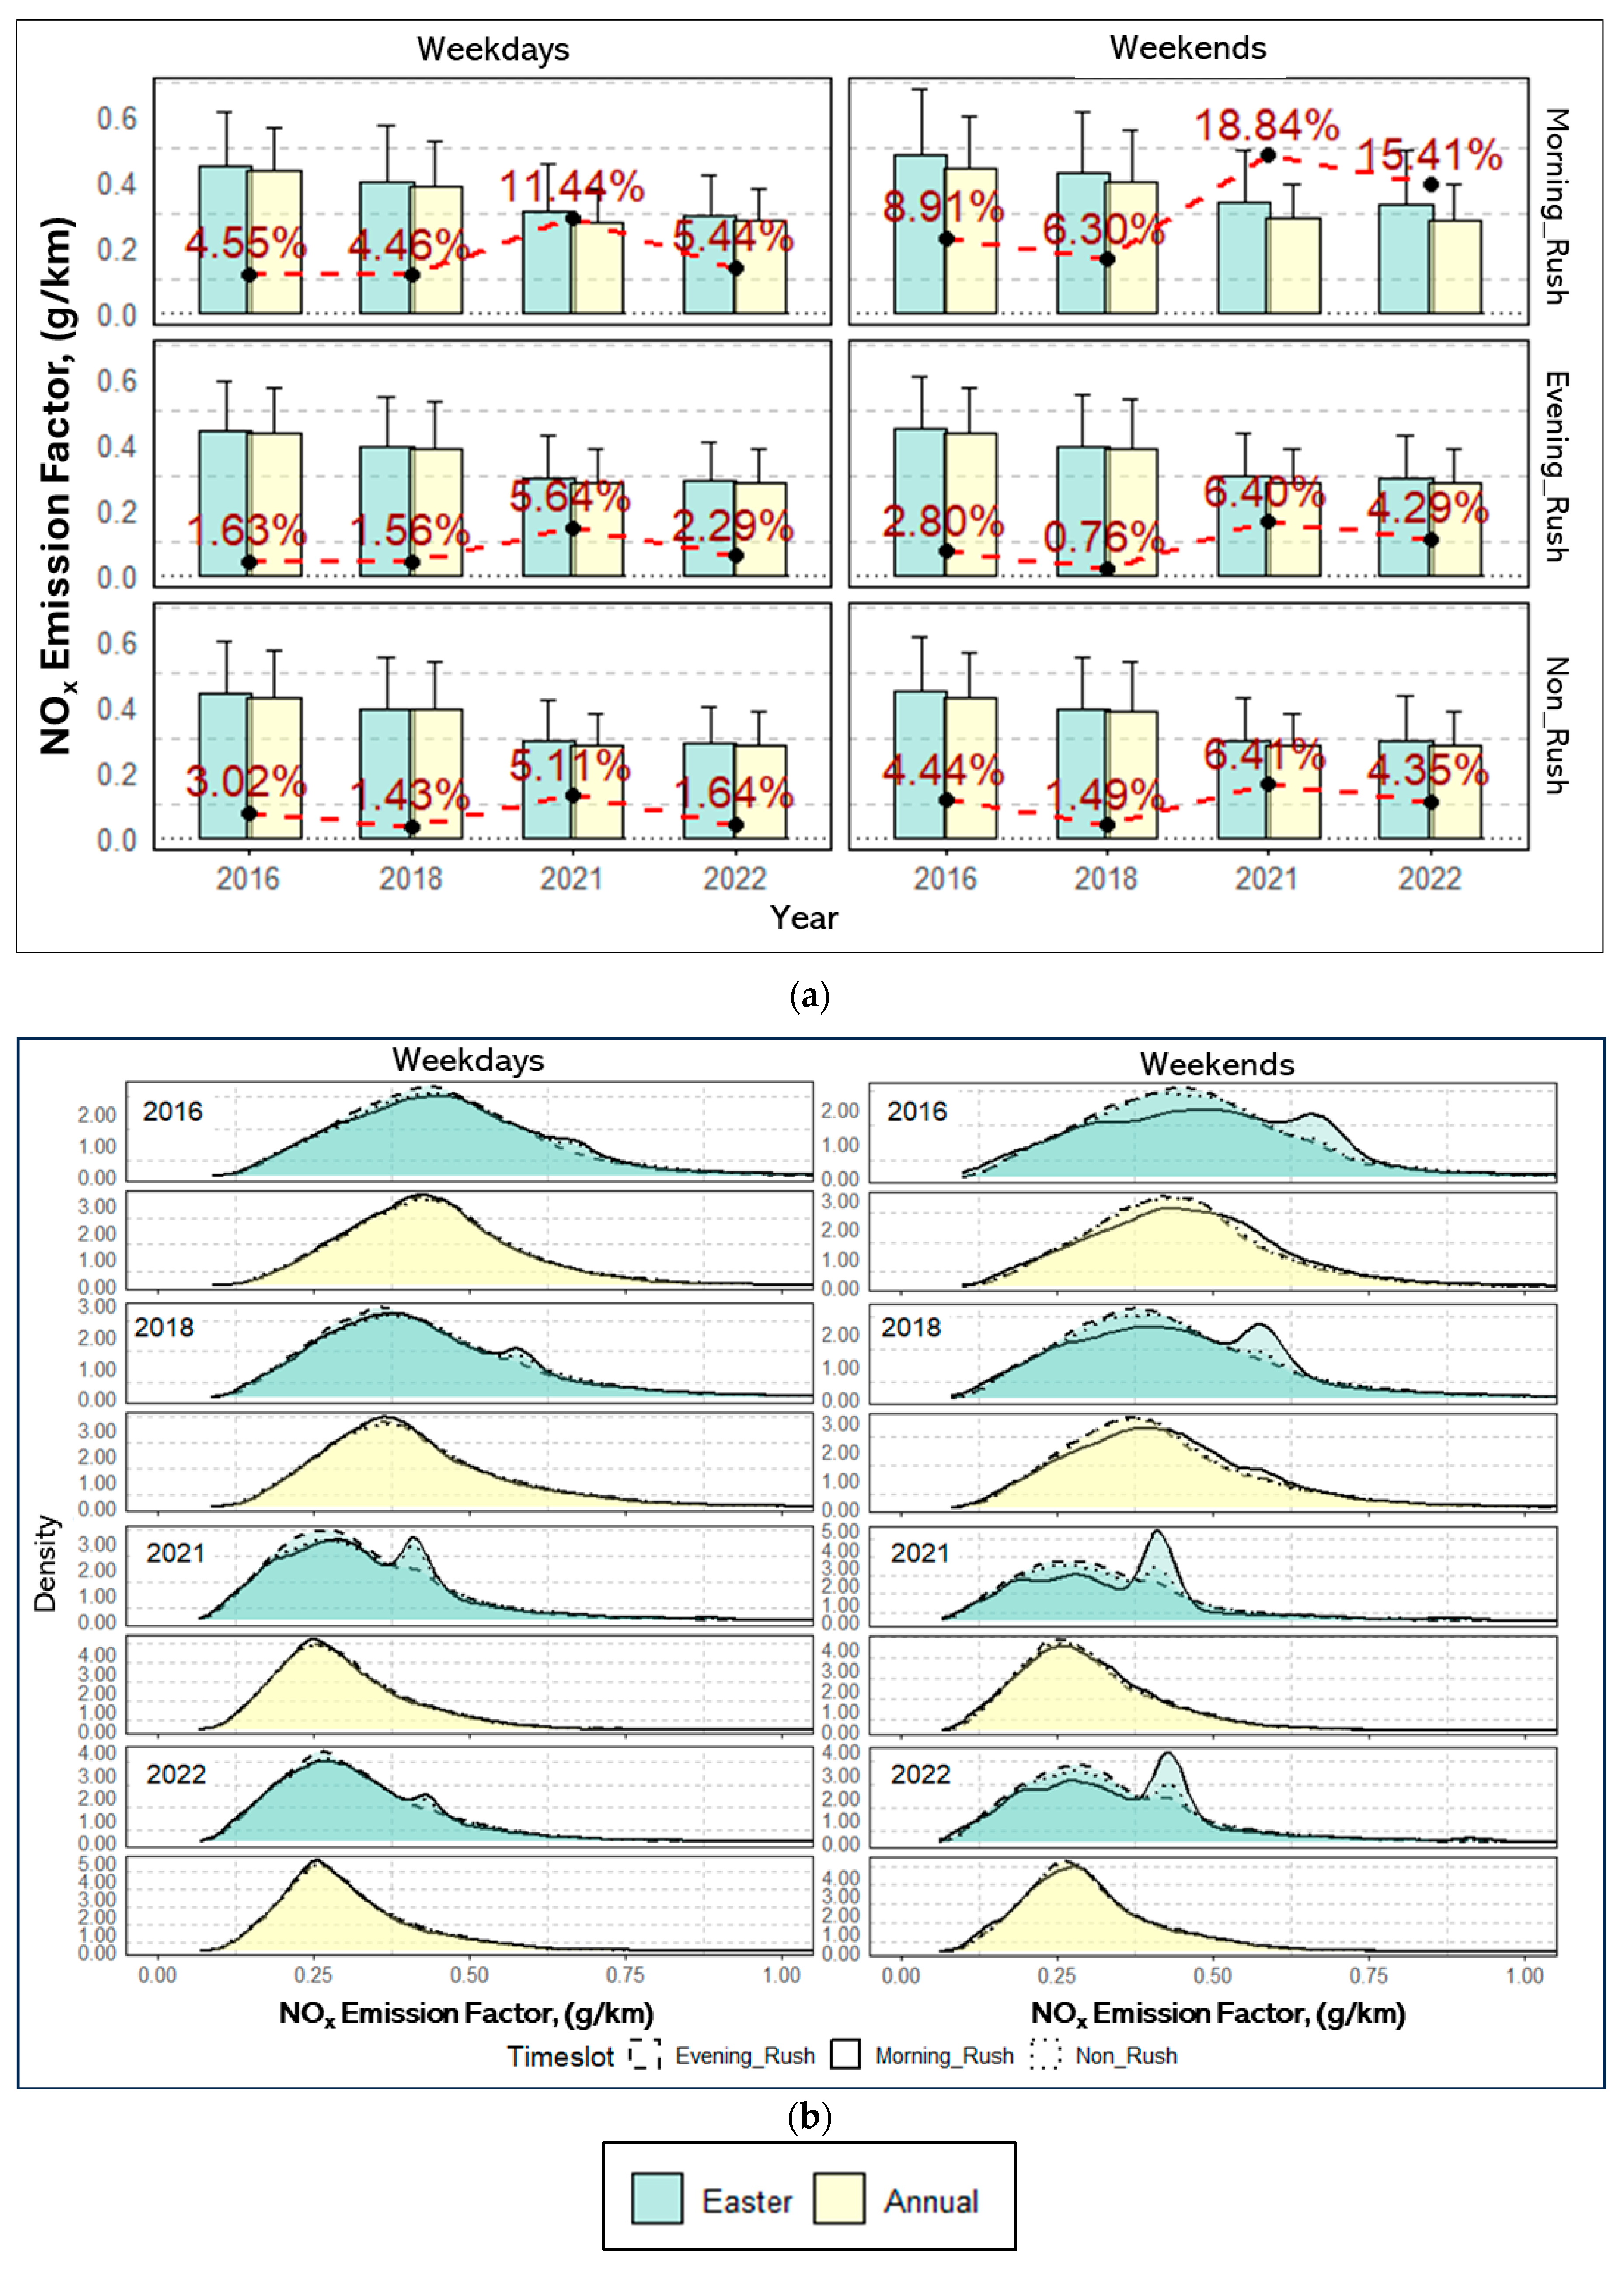
Both NOx and CO2 emissions originate from the combustion of fuel in vehicle engines. NOx emissions are typically higher when engines operate at higher temperatures, which can occur during rapid acceleration or when maintaining high speeds. CO2, on the other hand, is a result of the complete combustion of carbon-containing fuels. In this section, it is clear that the NOx EFs have a similar pattern when compared with the CO2 EFs. Figure 7a and Supplementary Figure S6a display the NOx emission factors for major and urban roads, respectively, comparing the Easter period with the annual cases. Similar to CO2, the NOx EF RD result indicates that NOx emission factors tend to be higher during Easter on both road types.
According to Figure 7a, on major roads, the RD in NOx emission factors shows a consistent increase during Easter compared to the annual average. The RD is particularly pronounced during the weekend morning rush hours, with values reaching up to 18.84%. In addition, on urban roads (Supplementary Figure S6a), the increase in NOx emission factors during Easter is even more substantial. The RDs are particularly high during weekend non-rush hours, peaking at around 22.75%. This pattern is the same as that observed in CO2 EF RD (Section 3.2.1). This could be explained by the fact that NOx emissions are particularly sensitive to changes in driving patterns that involve speed and acceleration. The less predictable nature of non-rush hour traffic on urban roads can lead to higher NOx EF RDs. These conditions during non-rush hours, which are often absent during rush hours due to higher vehicle density and slower speeds, can thus lead to less efficient combustion and increased NOx production.
As for the PDFs of NOx EF (Figure 7b and Supplementary Figure S6b), they follow a similar pattern to CO2, with bimodal distributions becoming apparent during Easter periods. This similarity suggests that factors leading to increases in CO2 emissions—i.e., higher speeds and/or more aggressive acceleration—also contribute to higher NOx emissions. The bimodal distribution might represent two prevalent driving behaviours: one involving steady, moderate-speed driving and the other involving high-speed, rapid acceleration driving, each with its own characteristic emissions profile. The RDs for urban roads and major roads are similar.
After 2021, on both urban and major roads, there is a noticeable shift in the distribution of NOx emissions, with the range of the distribution moving from around 0–0.75 g/km in 2016 and 2018 to approximately 0–0.50 g/km in 2021 and 2022. This shift could reflect a decrease in overall driving intensity, possibly due to the prolonged effects of the pandemic, such as continued remote working and a reduction in overall traffic. Further evidence is seen in the morning rush hour data from 2021 and 2022, where the peak of the NOx EF PDF shifts from above 0.60 g/km in previous years to around 0.40 g/km. This could indicate a fundamental change in rush hour dynamics due to the pandemic, with fewer cars on the road leading to smoother (or less) traffic flow, less frequent acceleration, and overall reduced NOx emissions during what was once a high-emission period.

3.3. Easter’s Impact on Travel Characteristics and Road Emissions

In Figure 8, box–violin–scatter plots illustrate the distribution and variance of the RD over four years (2016, 2018, 2021, and 2022) for all measured times of the day and days of the week, for the studied characteristics. The results indicate that the on-road passenger cars in the city of Birmingham have higher speed, acceleration, VSP, CO2, and NOx emission factors during the Easter holiday compared to the normal regular time (annual).
For vehicle speed (Figure 8a), vehicles tend to have around 1 m/s (or 3.6 km/h) higher speed (around 5%) compared to the annual speed (or regular traffic conditions). The RD distribution of acceleration (Figure 8b) across 4 years would suggest that vehicles experience around 2–3% more acceleration during Easter. The trends in speed and acceleration explain the VSP (Figure 8c). A 6–8% impact of Easter is shown in 2016 and 2018. After 2021, the influence of COVID-19 was significant, and the RD of VSP rose to around 17%, then it dropped to about 6% in 2022, which is similar to the pre-pandemic period. The relative differences in CO2 and NOx emission factors follow the VSP. For CO2 EF (Figure 8d), during Easter in 2016 and 2018, single on-road vehicles tended to have around 5% more EF than on normal days (around 10 g/km), but the value rose to around 10% (20 g/km) in 2021, and in 2022 the CO2 EF RD returned to the pre-pandemic level, which is around 5% (10 g/km). For the relative difference in NOx EF, similar to CO2, a difference of about 5–6% (0.025–0.032 g/km) can be observed in 2016 and 2018. During the COVID-19 period (2021), the RD was about 13% (0.064 g/km), and it decreased to 7% (0.034 g/km) in 2022.
The observed trends in speed, acceleration, and VSP suggest that the Easter holiday period is associated with a distinct driving behaviour that is likely contributing to increased emissions per individual vehicle. This behaviour includes faster driving and more dynamic vehicle operation, which explains the greater RDs in both CO2 and NOx EFs. This less constrained driving environment, while potentially reducing travel time, does not translate into lower emissions per vehicle. Another piece of evidence is the significant change in the RD of CO2 and NOx EF in 2021. During COVID-19, people may have expected reduced traffic to lead to lower emissions; however, the RDs remained elevated for CO2 and NOx. This suggests that while the quantity of traffic decreased, the emission for a single on-road vehicle may have increased significantly.
The net emission (NE) is calculated by multiplying the emission factor (EF) in grams per distance travelled in km, emission activity (EA) (traffic volume), and the length of the roads [29]. It should be noted, however, that this study is limited to an analysis of traffic activity in the area under study for the year 2022, as previously discussed in Section 2.4. Figure 9 illustrates the variation in traffic activity on major roads across different time periods in 2022. The same variations for the urban roads are shown in Figure S7. During the Easter period, a notable decline in the number of vehicles on major roads is evident on weekdays, particularly during the morning rush hour, with a relative reduction of −22.60%. This trend is also observed in the evening rush hours and non-rush hours, with relative differences of −9.30% and −12.10%, respectively. On weekends, the pattern is somewhat similar but less pronounced. The morning rush hour sees a relative difference of −11.90%, while the evening rush hour and non-rush hours show relative differences of −8.90% and −11.90%, respectively. This indicates that while traffic volume decreases during Easter weekends, the reduction is more evenly distributed across different times of the day compared to weekdays.
As the road lengths remained unaltered throughout the study period (Easter holidays), the variation in the net emissions is examined by considering the variations in both emission factors and traffic activity. For instance, if the emission factor is increased by 5.4% (NOx emission factors on major roads during morning rush hours on weekdays), and the emission activity is reduced by 27.6%, the new emission factor becomes 105.4% of the original, and the new emission activity becomes 72.4% of the original. When these adjustments are combined (NEnew = 1.054 EF0 × 0.724 EA0 = 0.763 NE0), the new net emission is 76.3% of the initial net emission. This results in a total reduction of 23.7% in the net emission. Table S2 presents the variation in net NOx and CO2 vehicular emissions attributed to the 2022 Easter holidays. A reduction of 25.0% and 27.6% in CO₂ and NOx vehicular emissions, was observed, respectively, during weekday morning rush hours on major roads. The impact of the Easter holidays in 2022 on the net emissions of NOx and CO2 was found to vary significantly in terms of both time and place. For instance, the Easter holidays resulted in a reduction in vehicular emissions of NOx and CO2 on major roads during morning and evening rush hours by 15–28% on working days. Conversely, a 2–5% and 0.7–2.6% increase was observed for the NOx and CO2 net emissions on urban roads in rush hours on weekends. The location of CO2 emissions is not very important for their effect on climate change due to the long lifetimes of CO2, whereas the emissions of the air pollutant NOx are very important from a place-based perspective.

4. Conclusions

In this study, we analysed road travel characteristics and vehicular emissions within Birmingham, UK, focusing on passenger vehicles operating across urban and major roads. Leveraging telematics data through geospatial and Temporal (GeoST) Mapping, we used vehicle characteristics—speed, acceleration, and VSP—and transformed these into CO2 and NOx emission factors. The GeoST-segments offered a geographically and temporally defined lens to examine the impact of the Easter holidays in the years 2016, 2018, 2021, and 2022.
Our comprehensive analysis utilised advanced telematics data to unravel the nuances of urban mobility within Birmingham’s diverse road networks during the Easter period. Distinct from annual norms, we observed a marked increase in vehicle speeds during the holiday, with morning rush hours on major roads revealing the most significant speed relative differences (RDs). The tendency for faster travel during Easter aligns with lighter traffic volumes and reduced congestion, leading to higher median speeds. This deviation was particularly pronounced in 2021, under the extraordinary conditions imposed by the COVID-19 lockdowns, which drastically altered usual traffic patterns, allowing for even freer vehicle flow. Moreover, the acceleration patterns during Easter demonstrated higher dynamism, mirroring the increased speeds and suggesting less inhibited driving behaviour. The vehicle-specific power (VSP) followed this trend, indicating higher power demands during the holiday period, especially noted during weekday mornings. These variations in vehicle speed, acceleration, and VSP collectively depict an Easter holiday period characterised by more vigorous and less constrained vehicular movement compared to regular traffic conditions.
For the emission factors (EFs), the result shows that Easter holidays increase CO2 and NOx emissions factors (EFs) for individual vehicles across Birmingham. Notably, these increases are more pronounced on urban roads, hinting at the complex dynamics of urban driving that exacerbate emissions during less congested periods. The pandemic’s imprint in 2021 emerged distinctly, with elevated EFs suggesting altered driving patterns, a trend that persisted into 2022. This persistence alludes to possibly lasting changes in mobility behaviours. Interestingly, the non-rush hours on weekends displayed particularly high CO2 and NOx EFs, challenging the intuition that lower traffic density automatically leads to reduced emissions per vehicle.
The overview analysis across Birmingham during Easter signifies a clear upsurge in vehicular speed by approximately 4%, an acceleration by about 3–4%, and a 7–9% increase in VSP relative to regular conditions. This surge underlines a transition towards more active driving during holidays. Notably, the pandemic heavily influenced the 2021 data, intensifying these effects, with VSP RDs soaring to approximately 16% above pre-pandemic levels, subsequently settling at a still elevated 8% in 2022. Correspondingly, emission factors for CO2 and NOx rose by about 3–8% and 4–10%, respectively, during the holiday period. This affirms that the Easter effect persists beyond immediate traffic changes, reflecting in emissions, with a single vehicle’s CO2 EF rising by up to 18 g/km in 2021, while the NOx EF increased by 0.040 g/km. This showcases a tangible holiday imprint on urban mobility and emissions.
To provide insights on the impact of the average change in individual vehicle speed-acceleration profiles upon net fleet emissions, whilst taking into account the reduction in fleet movement during the Easter holiday, this study employed a methodology whereby the changes in the median values of emission factors were multiplied by the changes in the median values of the traffic volume. This revealed a significant reduction in CO2 and NOx emissions on major roads during weekday morning and evening rush hours (15–25%). It is important to note that these reductions were predominantly attributable to a decrease in the number of vehicles on the road during the holiday period. While changes in individual vehicle emissions play a more minor role, the primary driver of this reduction was the overall reduction in traffic volume. This observation underscores the considerable impact that holiday periods can have on urban air quality through their influence on traffic patterns.

Supplementary Materials

The supporting information can be downloaded at: https://www.mdpi.com/article/10.3390/smartcities7060120/s1.

Author Contributions

Conceptualization, methodology, validation, formal analysis, visualization, and writing—original draft preparation J.X. Conceptualization, methodology, validation, formal analysis, supervision, investigation, and writing—review and editing, O.G. Conceptualization, methodology, validation, supervision, investigation, funding acquisition, and writing—review and editing, F.D.P. All authors have read and agreed to the published version of the manuscript.

Funding

This work was funded by the Natural Environment Research Council, UK (NERC) via the WM-Air project (NE/S003487/1).

Data Availability Statement

The raw data supporting the conclusions of this article will be made available by the authors on request.

Conflicts of Interest

The authors declare no conflicts of interest.

References

  1. Pradhan, R.P. Investigating the causal relationship between transportation infrastructure, financial penetration and economic growth in G-20 countries. Res. Transp. Econ. 2019, 78, 100766. [Google Scholar] [CrossRef]
  2. Department for Transport; Driver and Vehicle Licensing Agency. Vehicle Licensing Statistics: Annual 2020. 2021. Available online: https://www.gov.uk/government/statistics/vehicle-licensing-statistics-2020 (accessed on 20 October 2024).
  3. BTS. Transportation Economic Trends; Contribution of Transportation to the Economy: Final Demand Attributed to Transportation; Bureau of Transportation Statics: Washington, DC, USA, 2022.
  4. European Comission. EU Transport in Figures; European Comission: Brussels, Belgium, 2022.
  5. EEA. Sources and Emissions of Air Pollutants in Europe; European Environmental Agency: Copenhagen, Denmark, 2022.
  6. Thana Singam, V.; Mohd Zahari, H.; Mohamad Rafiuddin, N. A systematic review on carbon emission of light duty vehicles in urban environment. Soc. Sci. Humanit. Open 2024, 10, 100924. [Google Scholar] [CrossRef]
  7. Zhang, Y.; Yang, X.; Wang, Y.; Yang, Z.; Zhao, H.; Ding, Y. Light-duty vehicle organic gas emissions from tailpipe and evaporation: A review of influencing factors. Sci. Total Environ. 2024, 947, 174523. [Google Scholar] [CrossRef]
  8. Harrison, R.M.; Allan, J.; Carruthers, D.; Heal, M.R.; Lewis, A.C.; Marner, B.; Murrells, T.; Williams, A. Non-exhaust vehicle emissions of particulate matter and VOC from road traffic: A review. Atmos. Environ. 2021, 262, 118592. [Google Scholar] [CrossRef]
  9. Brusselaers, N.; Macharis, C.; Mommens, K. The health impact of freight transport-related air pollution on vulnerable population groups. Environ. Pollut. 2023, 329, 121555. [Google Scholar] [CrossRef] [PubMed]
  10. Luo, Z.; Wang, Y.; Lv, Z.; He, T.; Zhao, J.; Wang, Y.; Gao, F.; Zhang, Z.; Liu, H. Impacts of vehicle emission on air quality and human health in China. Sci. Total Environ. 2022, 813, 152655. [Google Scholar] [CrossRef]
  11. Ritchie, H. Cars, Planes, Trains: Where Do CO2 Emissions from Transport Come from? 2020. Available online: https://ourworldindata.org/ (accessed on 20 October 2024).
  12. Wang, X.-C.; Klemeš, J.J.; Dong, X.; Fan, W.; Xu, Z.; Wang, Y.; Varbanov, P.S. Air pollution terrain nexus: A review considering energy generation and consumption. Renew. Sustain. Energy Rev. 2019, 105, 71–85. [Google Scholar] [CrossRef]
  13. Ghaffarpasand, O.; Talaie, M.R.; Ahmadikia, H.; TalaieKhozani, A.; Shalamzari, M.D.; Majidi, S. How does unsustainable urbanization affect driving behavior and vehicular emissions? Evidence from Iran. Sustain. Cities Soc. 2021, 72, 103065. [Google Scholar] [CrossRef]
  14. Yassine, C.; Sebos, I. Quantifying COVID-19’s impact on GHG emission reduction in Oman’s transportation sector: A bottom-up analysis of pre-pandemic years (2015–2019) and the pandemic year (2020). Case Stud. Transp. Policy 2024, 16, 101204. [Google Scholar] [CrossRef]
  15. Ghaffarpasand, O.; Blake, R.; Shalamzari, Z.D. How international conflicts and global crises can intertwine and affect the sources and levels of air pollution in urban areas. Environ. Sci. Pollut. Res. 2024, 31, 51619–51632. [Google Scholar] [CrossRef]
  16. Hua, J.; Zhang, Y.; de Foy, B.; Mei, X.; Shang, J.; Feng, C. Competing PM2.5 and NO2 holiday effects in the Beijing area vary locally due to differences in residential coal burning and traffic patterns. Sci. Total Environ. 2021, 750, 141575. [Google Scholar] [CrossRef] [PubMed]
  17. Yousefian, F.; Faridi, S.; Azimi, F.; Aghaei, M.; Shamsipour, M.; Yaghmaeian, K.; Hassanvand, M.S. Temporal variations of ambient air pollutants and meteorological influences on their concentrations in Tehran during 2012–2017. Sci. Rep. 2020, 10, 292. [Google Scholar] [CrossRef] [PubMed]
  18. Chen, P.-Y.; Tan, P.-H.; Chou, C.C.-K.; Lin, Y.-S.; Chen, W.-N.; Shiu, C.-J. Impacts of holiday characteristics and number of vacation days on “holiday effect” in Taipei: Implications on ozone control strategies. Atmos. Environ. 2019, 202, 357–369. [Google Scholar] [CrossRef]
  19. Basagaña, X.; Triguero-Mas, M.; Agis, D.; Pérez, N.; Reche, C.; Alastuey, A.; Querol, X. Effect of public transport strikes on air pollution levels in Barcelona (Spain). Sci. Total Environ. 2018, 610, 1076–1082. [Google Scholar] [CrossRef]
  20. Ghaffarpasand, O.; Okure, D.; Green, P.; Sayyahi, S.; Adong, P.; Sserunjogi, R.; Bainomugisha, E.; Pope, F.D. The impact of urban mobility on air pollution in Kampala, an exemplar sub-Saharan African city. Atmos. Pollut. Res. 2024, 15, 102057. [Google Scholar] [CrossRef]
  21. Ghaffarpasand, O.; Burke, M.; Osei, L.K.; Ursell, H.; Chapman, S.; Pope, F.D. Vehicle Telematics for Safer, Cleaner and More Sustainable Urban Transport: A Review. Sustainability 2022, 14, 16386. [Google Scholar] [CrossRef]
  22. Xiang, J.; Ghaffarpasand, O.; Pope, F.D. Mapping urban mobility using vehicle telematics to understand driving behaviour. Sci. Rep. 2024, 14, 3271. [Google Scholar] [CrossRef] [PubMed]
  23. Ghaffarpasand, O.; Pope, F.D. Telematics data for geospatial and temporal mapping of urban mobility: New insights into travel characteristics and vehicle specific power. J. Transp. Geogr. 2024, 115, 103815. [Google Scholar] [CrossRef]
  24. Ghaffarpasand, O.; Pope, F.D. Telematics data for geospatial and temporal mapping of urban mobility: Fuel consumption, and air pollutant and climate-forcing emissions of passenger cars. Sci. Total Environ. 2023, 894, 164940. [Google Scholar] [CrossRef]
  25. Huertas, J.I.; Giraldo, M.; Quirama, L.F.; Díaz, J. Driving Cycles Based on Fuel Consumption. Energies 2018, 11, 3064. [Google Scholar] [CrossRef]
  26. Yuhui, P.; Yuan, Z.; Huibao, Y. Development of a representative driving cycle for urban buses based on the K-means cluster method. Clust. Comput. 2019, 22, 6871–6880. [Google Scholar] [CrossRef]
  27. Jimenez-Palacios, J.L. Understanding and Quantifying Motor Vehicle Emissions with Vehicle Specific Power and TILDAS Remote Sensing; Massachusetts Institute of Technology: Cambridge, MA, USA, 1998. [Google Scholar]
  28. Davison, J.; Bernard, Y.; Borken-Kleefeld, J.; Farren, N.J.; Hausberger, S.; Sjödin, Å.; Tate, J.E.; Vaughan, A.R.; Carslaw, D.C. Distance-based emission factors from vehicle emission remote sensing measurements. Sci. Total Environ. 2020, 739, 139688. [Google Scholar] [CrossRef] [PubMed]
  29. Ghaffarpasand, O.; Talaie, M.R.; Ahmadikia, H.; Khozani, A.T.; Shalamzari, M.D. A high-resolution spatial and temporal on-road vehicle emission inventory in an Iranian metropolitan area, Isfahan, based on detailed hourly traffic data. Atmos. Pollut. Res. 2020, 11, 1598–1609. [Google Scholar] [CrossRef]
Figure 2. (a) The example probability distribution function (PDF) of vehicle speed on major roads in 2016. The PDF profile over the year and during the Easter holidays is shown by solid and dotted lines, respectively. (b) The relative difference box plots of vehicle speed between the annual and Easter variations for 2016, 2018, 2021, and 2022 on major roads.
Smartcities 07 00120 g002
Figure 3. (a) Relative differences in passenger cars’ speed between Easter and annual averages for major roads. The data are segmented by morning rush hour, non-rush hour, evening rush hour, and the weekend/weekday distinction; (b) the probability distribution function (PDF) of passenger car speeds is presented for both the two-week Easter period and the entire year over the studied years. Morning rush, evening rush, and non-rush refer to 19:00–23:00, respectively.
Smartcities 07 00120 g003
Figure 4. (a) Relative differences in passenger car acceleration between Easter and annual averages for major roads. The data are segmented by morning rush hour, non-rush hour, evening rush hour, and the weekend/weekday distinction; (b) the probability distribution function (PDF) of passenger car accelerations is presented for both the two-week Easter period and the entire year over the studied years. Morning rush, evening rush, and non-rush refer to 19:00–23:00, respectively.
Smartcities 07 00120 g004
Figure 5. (a) Relative differences in passenger car vehicle-specific power (VSP) between Easter and annual averages for major roads. The data are segmented by morning rush hour, non-rush hour, evening rush hour, and the weekend/weekday distinction; (b) the probability distribution function (PDF) of passenger car VSP is presented for both the two-week Easter period and the entire year over the studied years. Morning rush, evening rush, and non-rush refer to 19:00–23:00, respectively.
Smartcities 07 00120 g005
Figure 6. (a) Relative differences in passenger car CO2 emission factors (EFs) between Easter and annual averages for major roads. The data are segmented by morning rush hour, non-rush hour, evening rush hour, and the weekend/weekday distinction; (b) the probability distribution function (PDF) of passenger car CO2 EFs is presented for both the two-week Easter period and the entire year over the studied years. Morning rush, evening rush, and non-rush refer to 19:00–23:00, respectively.
Smartcities 07 00120 g006
Figure 7. (a) Relative differences in passenger cars NOx emission factors (EFs) between Easter and annual averages for major roads. The data are segmented by morning rush hour, non-rush hour, evening rush hour, and the weekend/weekday distinction; (b) the probability distribution function (PDF) of passenger car NOx EFs is presented for both the two-week Easter period and the entire year across the studied years. Morning rush, evening rush, and non-rush refer to 19:00–23:00, respectively.
Smartcities 07 00120 g007
Figure 8. The box-violin-scatter plots for the relative difference of (a) vehicle speed, (b) acceleration, (c) VSP, (d) CO2 EF, and (e) NOx EF for the studied years of 2016, 2018, 2021, and 2022 on both major and urban roads. Each scatter point represents one of the 35 distinct measurements for the time of the day and day of the week.
Smartcities 07 00120 g008aSmartcities 07 00120 g008b
Figure 9. The average number of cars during Easter, compared to the annual averages, segmented into morning rush hours, evening rush hours, and non-rush hours for both weekdays and weekends on major roads. The yellow bars represent the annual averages, while the green bars represent the Easter period. The red points and lines indicate the relative differences in car numbers between the two periods.
Smartcities 07 00120 g009
Table 1. The timetable of a two-week period that covers Easter holidays over 2016, 2018, 2021, and 2022.
YearStart and End Dates
201621st March–10th April
201827th March–15th April
20211st April–19th April
202211th April–22nd April
Disclaimer/Publisher’s Note: The statements, opinions and data contained in all publications are solely those of the individual author(s) and contributor(s) and not of MDPI and/or the editor(s). MDPI and/or the editor(s) disclaim responsibility for any injury to people or property resulting from any ideas, methods, instructions or products referred to in the content.