Highlights
What are the main findings?
- Smart City system leveraging real-time video analysis with machine learning to improve pedestrian safety in urban areas.
What is the implication of the main finding?
- Contributes to Smart City goals by integrating advanced tech solutions to create safer environments and reduce pedestrian accidents.
Abstract
This paper presents a novel system designed to enhance pedestrian safety in urban environments by utilizing real-time video analysis and machine learning techniques. With a focus on the bustling streets of Macao, known for its high pedestrian traffic and complex road conditions, the proposed model alerts drivers to the presence of pedestrians, significantly reducing the risk of accidents. Leveraging the You Only Look Once algorithm, this research demonstrates how timely alerts can be generated based on risk assessments derived from video footage. The model is rigorously tested against diverse driving scenarios, providing robust accuracy in detecting potential hazards. A comparative analysis of various machine learning algorithms, including Gradient Boosting and Logistic Regression, underscores the effectiveness and reliability of the system. The key finding of this research indicates that dataset refinement and enhanced feature differentiation could lead to improved model performance. Ultimately, this work seeks to contribute to the development of smart city initiatives that prioritize safety through advanced technological solutions. This approach exemplifies a vision for more responsive and responsible urban transport systems.
1. Introduction
Macao, a vibrant tourist destination, sees thousands of visitors daily, with varied cultural backgrounds and distinct road usage patterns. This diversity can lead to differences in behavior between locals and tourists, increasing the risk of accidents across all road users. To mitigate this issue, our research focuses on developing an alert system that warns drivers about upcoming pedestrians in front of their vehicles. Recent statistics from the Macao Public Security Police Force indicate a 15.82% increase in pedestrian-related traffic accidents from May 2023 to May 2024 [1]. Additionally, there has been a noticeable rise in recorded instances where pedestrians cross roads improperly, endangering both themselves and drivers. The most frequent conflicts occur between local and visiting individuals, which can further tarnish the reputation of the city. The road conditions of Macao are complex, often complicated by ongoing construction and vehicles parked on sidewalks, which pose unique challenges for drivers and pedestrians alike [2]. Consequently, it is essential to implement assistance systems in vehicles that can respond more swiftly than human reflexes, thereby minimizing the risk of accidents. The proposed pedestrian protection system (PPS) incorporates a lane detection algorithm to enhance driver visibility and compliance with road norms. This feature is particularly advantageous for vehicles lacking lane-keeping assistance technologies, such as those found in Tesla models [3]. Additionally, the embodiment of a smart city is reflected in the integration of science and technology, exemplified by the innovative system developed by Shukla and his team, which interacts with retractable bollards to enhance pedestrian safety measures. This initiative significantly contributes to ensuring safer environments for individuals navigating urban spaces [4]. The reaction time of drivers is influenced by their surrounding environment, with longer response intervals associated with increased driving duration or moments of distraction. This variation highlights the critical need for effective measures to assist drivers, ensuring safety while navigating various road conditions [5].
The core algorithm of this research is established on the You Only Look Once (YOLO) version 8 framework developed by Ultralytics, specifically designed for tracking individuals in designated areas. This system facilitates the creation of a pretrained model, enabling effective image processing and movement prediction. In the context of Macao, where driving distances tend to be shorter, over-reliance on automatic braking systems may increase the risk of rear-end collisions. Therefore, the proposed solution emphasizes providing early alerts to drivers, which enhances their ability to identify potential dangers and make informed decisions, ultimately promoting safer driving behavior. By enhancing driver awareness through timely reminders, this system enables individuals to assess when braking or other actions are necessary, effectively minimizing the potential for accidents linked to automated braking systems. Additionally, it offers a cost-effective, fully vision-based solution applicable not only to four-wheeled vehicles but also to motorcycles, which are a significant mode of transportation in Macao. This dual focus ensures broader safety measures across various types of road users.
Pedestrian tracking remains a prominent field within computer vision, with YOLO often selected for its effectiveness in object recognition. Various studies focus on fixed-location tracking; for instance, a system utilizing YOLO alongside DeepSORT algorithms successfully evaluated the accuracy of multiple YOLO versions, revealing that YOLOv5 outperforms YOLOv3 with an accuracy of 70.1%. Additionally, background alterations can impact pedestrian identification, leading to potential tracking inaccuracies, prompting the development of a multi-object tracking method based on FairMOT and Circle Loss to mitigate such issues [6]. This approach has achieved remarkable scores in multiple object tracking accuracy and identity recognition. Changes in the background have been observed to influence pedestrian identification, potentially leading to incorrect tracking outcomes. To address this challenge, a new multi-object tracking algorithm has been developed, drawing on the principles of FairMOT, which is designed to tackle detection and re-identification challenges within a single framework, and Circle Loss, which optimizes pair similarity in deep feature learning. This innovative algorithm has successfully reduced pedestrian ID switches by 636 in the MOT17 dataset, achieving notable performance metrics of 69.5% for Multiple Object Tracking Accuracy (MOTA) and 70.0% for Identity F1 (IDF1) score [7]. An enhanced approach has been developed that combines lane and distance metrics derived from the height and width of vehicles positioned perpendicularly to the street. This strategy is designed to improve the realism of human path predictions and takes inspiration from the research conducted by Clarsson and Eklundh [8]. The primary contributions of this paper lie in advancing pedestrian safety through the development of a real-time video analysis and risk prediction system, which enhances driver awareness by predicting potential hazards. The integration of advanced object detection techniques, specifically employing the YOLO framework, facilitates accurate identification of pedestrians and other objects in various driving conditions, thereby enabling timely warnings to drivers when risks are detected. Additionally, the proposed model evaluates its performance using previously unseen video data to ensure its applicability in real-world scenarios. The approach is characterized by the incorporation of lane and distance metrics, which consider vehicle dimensions in relation to the road, further refining the accuracy of human path predictions. This research also contrasts multiple machine learning algorithms, including Gradient Boosting and Logistic Regression, to determine the most effective model for this safety application, showcasing robust accuracy and responsiveness. Collectively, these innovations aim not only to improve the efficiency of vehicle systems but also to contribute to overall traffic safety through proactive measures in driver assistance technologies.
The structure of this article is organized into four additional sections, beginning with Section 2, where foundational concepts are examined to establish the theoretical framework for the research. This section delves into topics such as the YOLO algorithm, various proposed machine learning algorithms, and the newly introduced method for determining risk zones within pedestrian crossing detection systems. Additionally, the combined bivariate performance measure (CBPM) serves as a crucial metric for identifying the most effective machine learning algorithm in the pedestrian road crossing alert system. The proposed optimal design for machine learning-based alert systems introduced in Section 3 is derived from experimental results and highlights improved performance metrics. Section 4 delves into the design of the optimized pedestrian road crossing alert system, benefiting from thorough experimental validation. Lastly, Section 5 encapsulates the essential contributions of this paper in a detailed manner.
2. Preliminaries
This section sets the stage for the exploration and understanding of fundamental concepts essential to the upcoming discussion on pedestrian tracking and safety systems. The section delves into pivotal technologies and methodologies, particularly focusing on the YOLO algorithm, renowned for its efficiency in real-time object detection. Additionally, various machine learning models will be examined to highlight their roles in enhancing the accuracy and reliability of pedestrian tracking systems. By providing a foundational overview of these technologies, this section aims to establish the necessary context and rationale for incorporating advanced algorithms that work in tandem with YOLO to refine pedestrian identification and tracking. This comprehensive understanding is crucial for addressing the pressing challenges of safety in urban environments, particularly in complex scenarios like those faced in Macao.
2.1. You Only Look Once (YOLO)
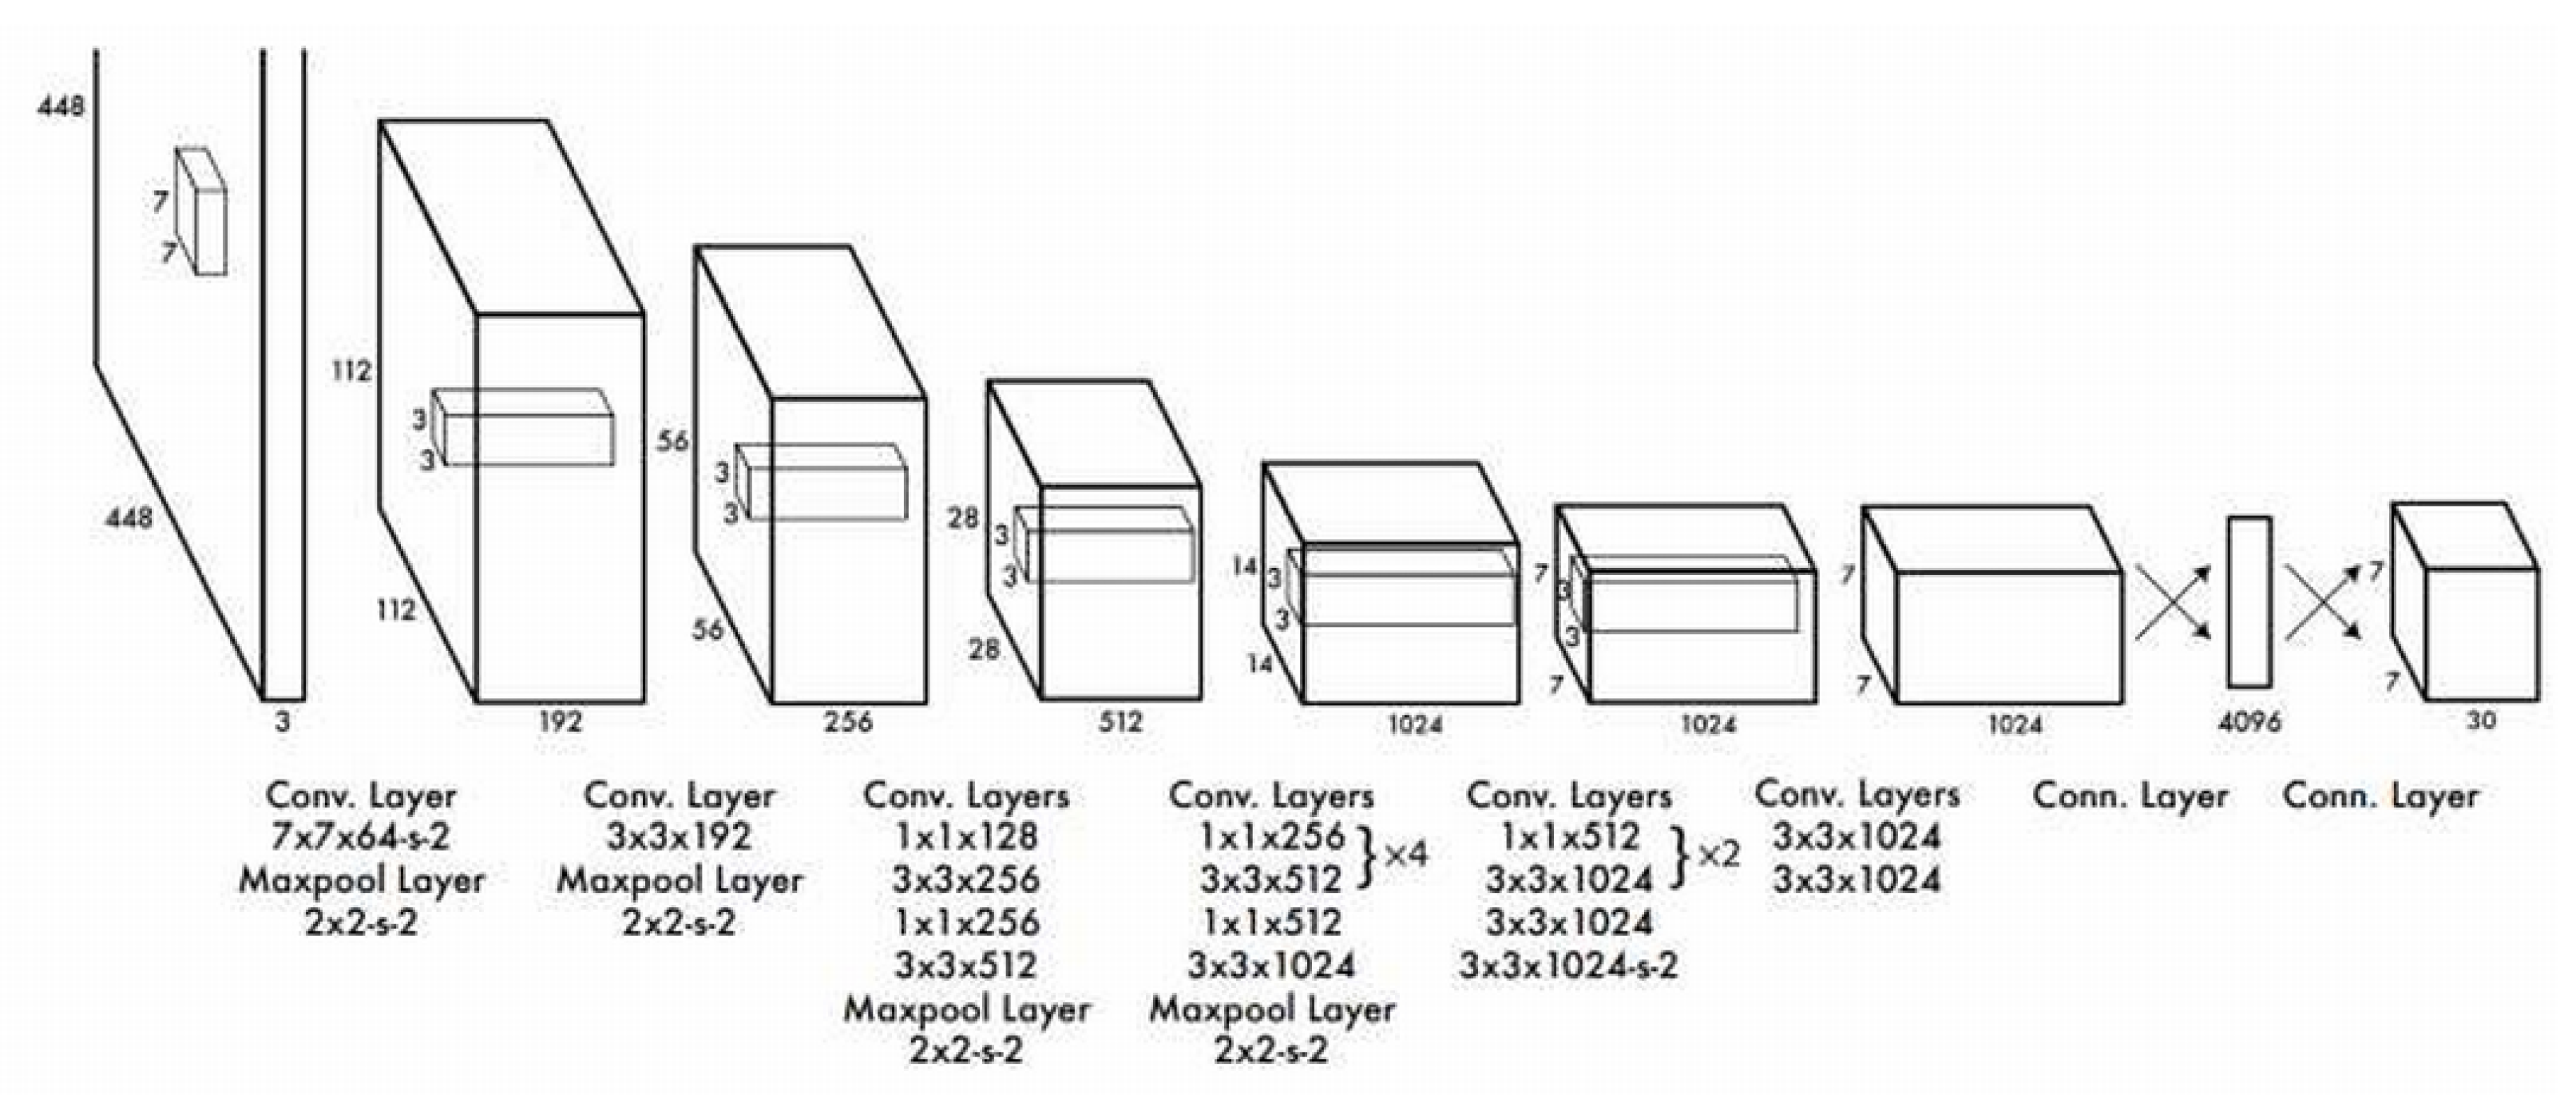
In the domain of object detection, YOLO stands out as a highly popular and reliable tool. It efficiently detects and classifies objects in real time, capable of recognizing and locating multiple objects within a single image while providing bounding boxes and class labels for each identified object. Utilizing a single convolutional neural network (CNN), YOLO directly predicts both bounding boxes and class probabilities from images, which contributes to its efficiency. Introduced in 2015, YOLO has become a common model in computer vision. Compared with alternative detection methods like Fast-RCNN, YOLO exhibits superior speed due to its architecture of 24 convolutional layers and 2 fully connected layers, allowing for rapid result generation [9,10]. A comprehensive overview of YOLO’s architecture reveals its significance in object detection. By incorporating algorithms like FairMOT and Circle Loss [11,12], YOLO enhances its ability to accurately detect low-resolution objects, achieving an impressive accuracy of 72.3% in multi-object detection [12,13,14,15]. The YOLO framework offers a versatile library for object tracking, utilizing either a pretrained model from the COCO dataset or a customized variant tailored for specific categories. Additionally, the resource efficiency demonstrated by Zhou and his team positions YOLO as a suitable choice for lightweight devices with limited computational capabilities, notably in Internet of Things (IoT) applications [16].
Focusing on refining the dataset involves extracting exclusively the person class from the COCO 2017 dataset, which comprises a total of 66,808 images. This targeted selection is essential for the subsequent steps in the modeling process. This filtration will utilize the open-source tool FiftyOne, alongside the YOLO v8 library, facilitating real-time detection capabilities. Once the objects are detected, the outputs will be formatted appropriately to serve as input for an alternative predictive modeling approach, as shown in Figure 1.
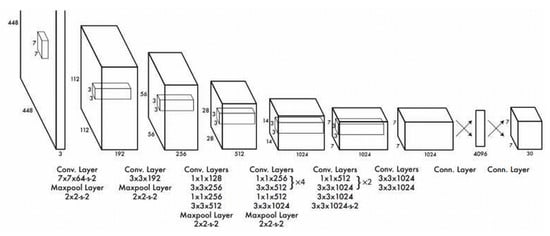
Figure 1.
YOLO architecture [17,18].
2.2. Various Machine Learning Models
Machine learning (ML) methodologies have gained considerable prominence in detecting surface defects. A vital component of system design is the selection of the most appropriate ML model, which is determined by the specific problem at hand, the characteristics of the data, and the volume of data available for analysis. Consequently, five distinct ML algorithms have been selected for application in surface defect detection, allowing for comparative evaluations to identify the most effective model. The following four ML algorithms will be elaborated upon:
- Gradient Boosting (GB) is an innovative machine learning technique aimed at building a robust predictive model by aggregating the outputs of several weak learners. This method involves sequentially training these weak learners according to the loss function of prior models, which enhances their capability to reduce errors and yield more accurate predictions. Each learner is focused on rectifying the errors, or residuals, produced by the ensemble up to that point. By minimizing the overall loss, the model progressively enhances its predictive accuracy. Furthermore, Gradient Boosting is notably adaptable, functioning effectively for both regression and classification tasks, which contributes to its popularity in machine learning applications [19].
- Logistic Regression (LogR) is a statistical technique employed to estimate the probability that a given output belongs to a specific class, which must be categorical or discrete. In this analysis, we applied ordinal Logistic Regression because our risk variable is divided into three interdependent categories. This approach is especially relevant in contexts where the dependent variable has a natural order, although the distances between these categories do not need to be uniform. While Logistic Regression is primarily used for predicting categorical results, linear regression focuses on predicting continuous variables [20].
- Random Forest Regressor (RFR) is an advanced extension of decision tree (DT) classification. This method utilizes a collection of decision trees during the training phase, generating predictions by averaging the outputs of individual trees to employ majority voting for classification tasks. RFR proves to be particularly effective with large datasets that may contain significant amounts of missing data. By integrating the predictions from multiple trees, RFR mitigates the risk of overfitting and significantly improves the ability to generalize across various contexts. Its adaptability and resilience contribute to its widespread application in diverse fields [21].
- Support Vector Machine (SVM) identifies the optimal hyperplane for separating data classes, which is essential for making accurate classifications while maximizing the margin between distinct classes. This margin acts as a protective buffer zone, boosting the model’s generalization ability so that it performs effectively on new, unseen data. In real-world scenarios where linear separation of data is often not feasible, SVM employs kernel functions to map the data into higher-dimensional spaces. This transformation allows SVM to discover suitable hyperplanes that precisely divide the classes, resulting in its extensive application and success across various classification tasks [22].
2.3. Combined Bivariate Performance Measure
The combined bivariate performance measure (CBPM) is a novel metric designed to assess systems with conflicting performance metrics, namely accuracy and machine learning training time [23]. It integrates these measures, revealing insights into the trade-offs between system accuracy and efficiency, enhancing overall evaluation in ML applications. The CBPM function is a critical component for integrating two distinct performance measures into a unified framework. This function adeptly captures the intricate interactions between these measures, enhancing the understanding of their combined effect on system performance. It is mathematically defined to illustrate how these metrics can be harmonized, thus promoting a thorough evaluation of system effectiveness. The mathematical formulation of the CBPM function is as follows [23]:
where
and
The function represents a crucial primary performance metric, deemed to hold greater significance compared with the other function . In this context, the formation of a discrete set for the CBPM can be established as follows:
where
From (2)–(3) and (5), the optimum for the best CBPM based on the discrete factor set X could be found as follows:
By utilizing this evaluation measure, researchers can effectively assess a range of models across various performance criteria, leading to more dependable conclusions about their effectiveness. Implementing such a holistic evaluation strategy is vital for improving the precision and efficiency of defect detection systems, which ultimately helps to mitigate potential risks associated with manufacturing processes. This approach not only maximizes the performance of detection algorithms but also aids in identifying defects at an earlier stage, thereby enhancing overall production quality.
2.4. Risk Zone Determination
Identifying the risk zone is crucial, as it directly impacts safety measures. Although current detection methods, such as Canny edge detection, could facilitate automated lane detection [24], the intricate road conditions in Macao and the challenges involved in developing reliable lane detection systems prompted our choice for a fixed lane approach. The newly proposed methodology in this research, informed by our video observations, emphasizes the model’s ability to predict risk effectively. The trapezoidal shape displayed in Figure 1 illustrates the varying levels of danger, with the area enclosed by the lines indicating the highest risk levels. The area between the two lines is identified as the highest risk zone, while the space outside the trapezoid is typically regarded as safe. However, regions that align with the elevation of a trapezoid are classified as moderately dangerous. The risk levels are categorized into three distinct degrees: 0 for safe, 1 for moderately dangerous, and 15 for the most dangerous situation, with these evaluations being recorded for future analysis. The result shall later be recorded in the column of the Excel sheet after processing each frame as the training dataset. The dataset exhibits significant imbalance, with 10,644 instances classified as safe, 548 as moderately dangerous, and 926 as most dangerous. This skewed distribution arises because the majority of pedestrians typically behave safely, making instances of risky behavior rare, which complicates the collection of a more balanced dataset.
3. Performance Evaluations
This section evaluates the performance of various machine learning models for defect detection, highlighting significant findings from their metrics. By employing a balanced dataset, the study shows improved model generalization and accuracy compared with previous research that used unbalanced data. The Logistic Regression model achieved the highest accuracy and F1-score, while concerns arose regarding its sensitivity to class imbalances, particularly in minority classes. The evaluations underscored the necessity of dataset quality and composition in refining machine learning applications, ultimately demonstrating the potential for optimizing detection systems to enhance practical outcomes.
3.1. Dataset
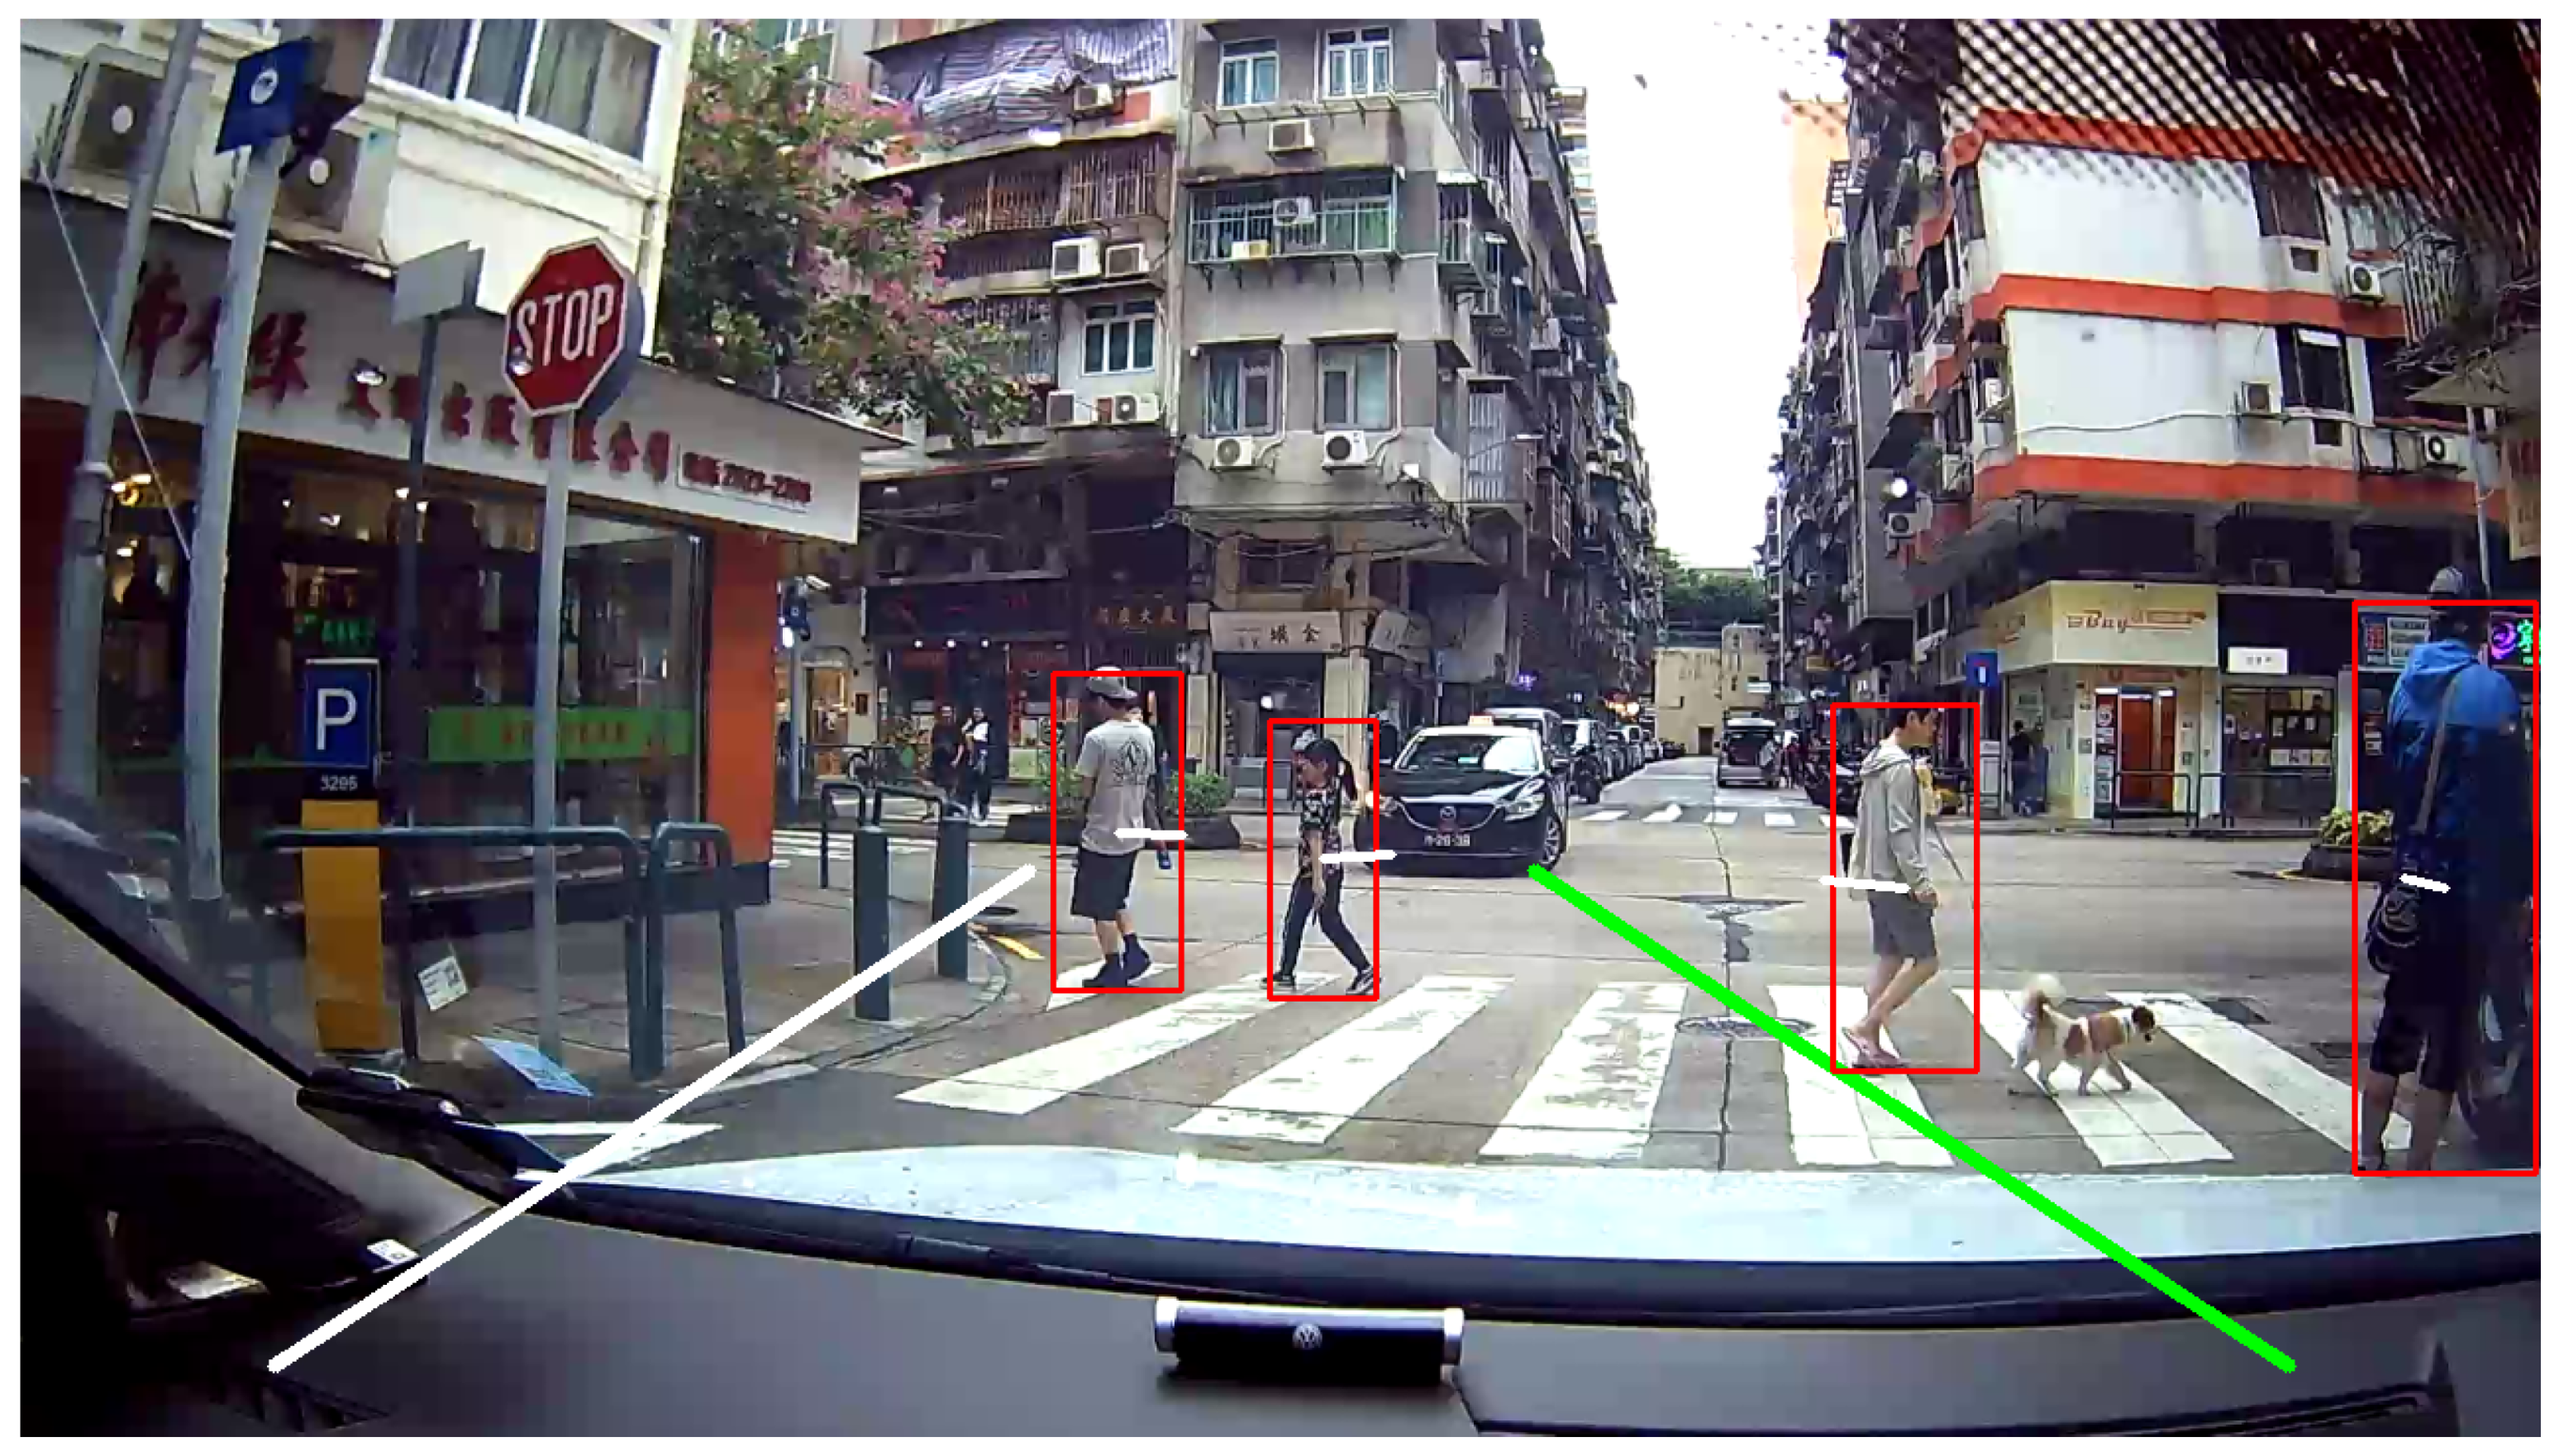
Surveillance cameras mounted in vehicles act as the primary source of data, underscoring the vital necessity of tracking dynamic objects in real time. Each video frame encapsulates numerous distinct objects, necessitating precise identification of the target—the human subject—within this setting by adapting the YOLO [25]. The data will be sourced from a single vehicle, wherein the camera will be strategically positioned at a specific height above the ground and a designated distance from the car’s front. The video will be recorded at a resolution of 1280-by-720 pixels with a frame rate of 30 FPS. This setup allows for the establishment of a fixed lane, enhancing consistency (see Figure 2). The gathered data will be meticulously stored in an Excel file for model training, promoting efficient data management and enabling ongoing improvements to the model. This structured approach ensures that the training process remains organized and effective, facilitating the adaptation of the model to emerging conditions. A total of 12,119 data points have been obtained from 43 distinct videos, which cumulatively cover an impressive duration of 2 h, 35 min, and 58 s. In real time, YOLO recognizes and labels target objects for each video frame while streaming live, incorporating the bytetrack.yaml tracker to minimize lag during tracking operations; every 0.5 s, the paths of all identified individuals are captured for further analysis.
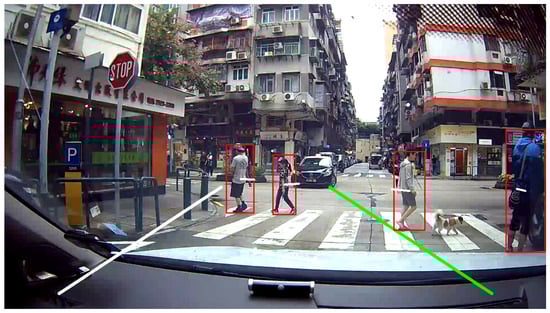
Figure 2.
YOLO sample for detecting pedestrian crossing.
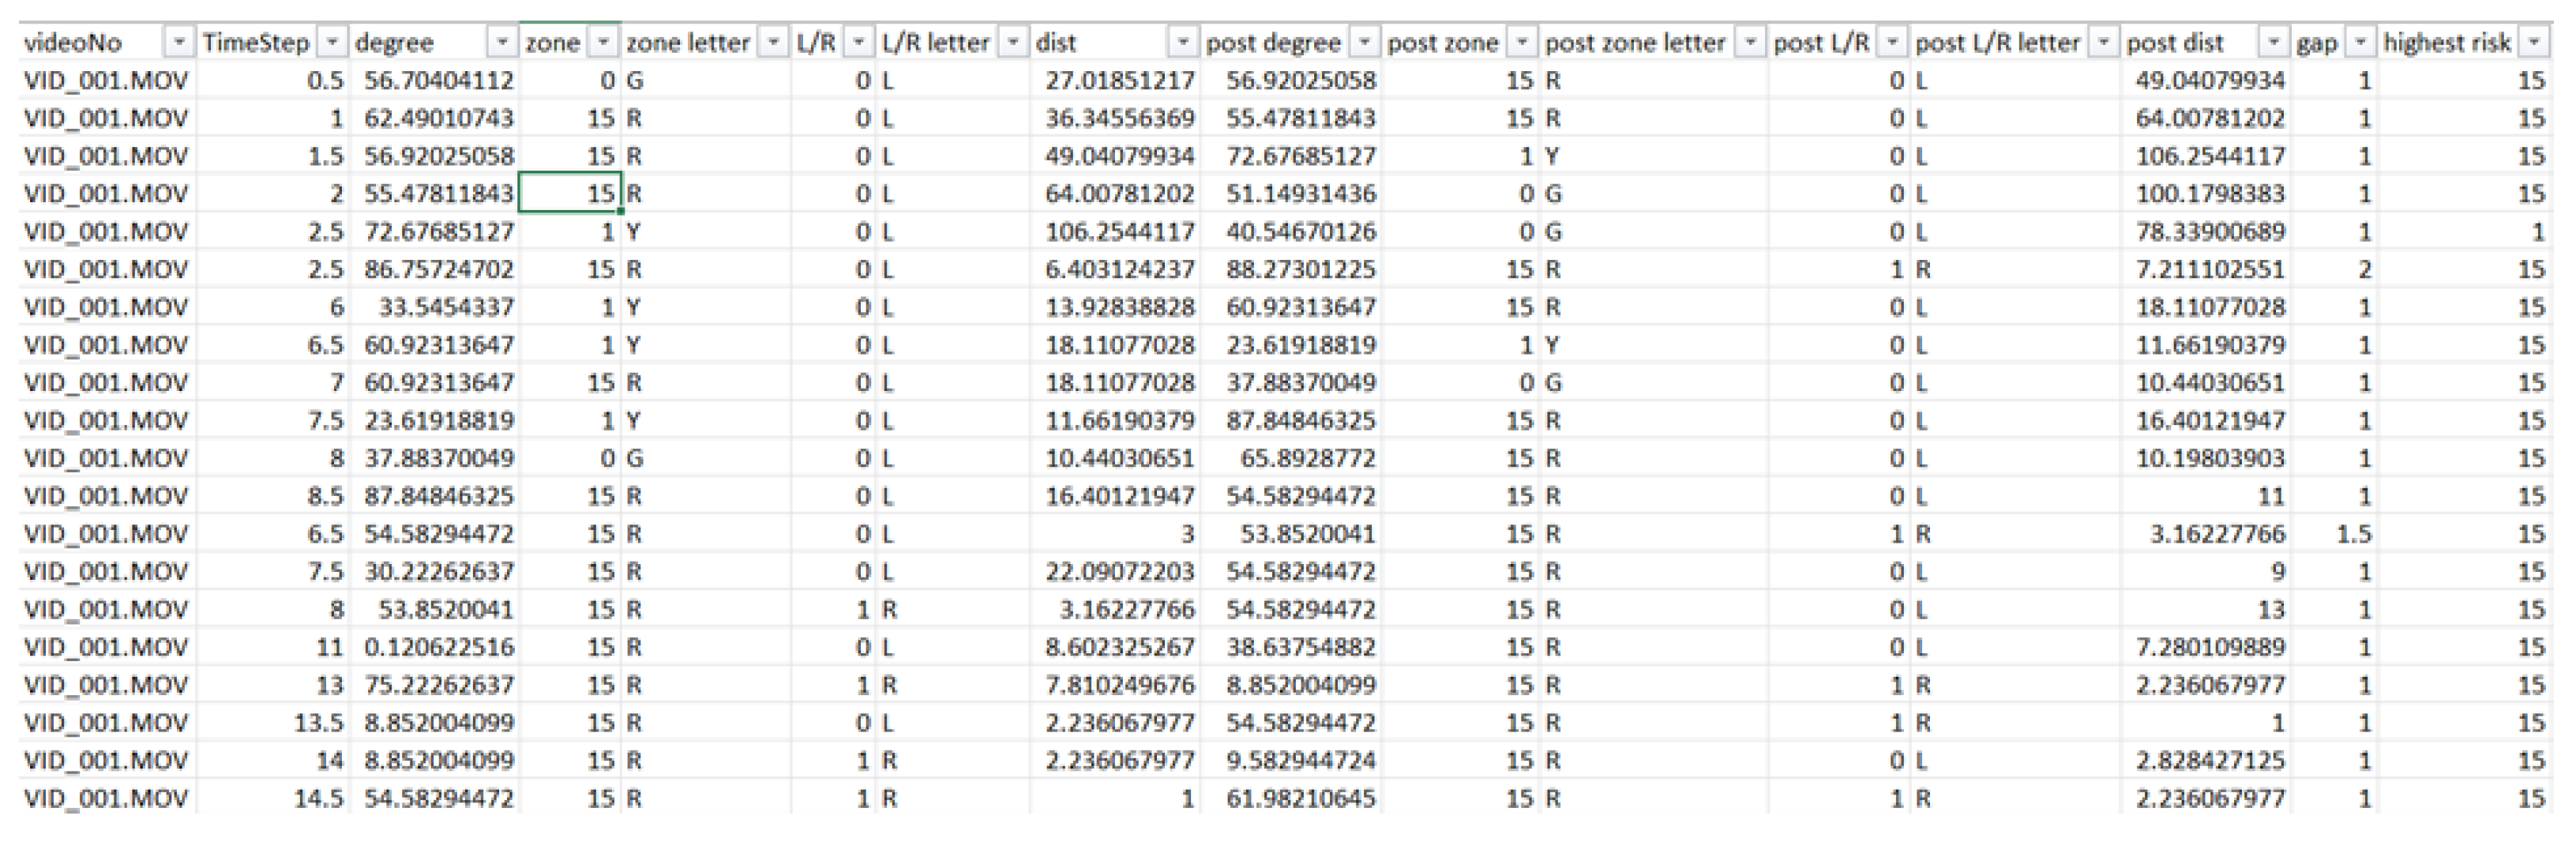
For each recorded trajectory, the zone, distance, and angle in relation to either the left or right lane are determined; within a span of 1 s, all these trajectories are compiled to pinpoint occurrences where three or more paths intersect, and then these intersections are evaluated for the highest risk level. Typically, a human can traverse 1.5 m (walking) up to 5 m (rapid movement) within one second. The system identifies high-risk situations based on defined risk zones and the analysis of pedestrian trajectories, including intersecting paths. These identified potential conflicts serve a purpose analogous to surrogate safety measures by indicating scenarios with elevated accident risk derived from observed interactions in video data. The dataset, which was extracted from videos for training, exhibits significant imbalance, comprising 10,644 samples designated as Safe, 548 samples categorized as Caution (labeled 1 for machine learning classification), and 926 samples identified as Dangerous (labeled 0). It is noted that Safe is labeled as 15 because the proportion of this classification sample relative to the average quantity of the remaining categories approximates 15. The imbalanced dataset for this research is a fundamental limitation in data extraction from real recorded data. In real-world scenarios, obtaining video footage depicting actual or near-accident events involving pedestrians proves challenging. Acquiring video footage of pedestrian-involved accidents or near misses may represent a primary approach to mitigating data imbalance for this research. Comparative analyses are performed every second. However, inherent instabilities may lead to tracking failures, which necessitate a more frequent occurrence of these comparisons. The identified highest risk values are then leveraged for subsequent predictive modeling purposes. The data collected is formatted in an Excel file (.csv) for model training (see Figure 3). This systematic method of data organization significantly improves the effectiveness of model training and validation, allowing the predictive model to persistently enhance and adjust according to varying traffic conditions.
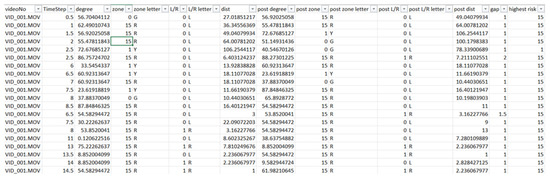
Figure 3.
Screenshot of data collection (.csv).
The columns marked as degree, zone, zone letter, L/R, and dist correspond to the trajectory degree, risk level, risk color, direction (left or right), and distance traveled, respectively. Columns with the prefix indicate these same parameters, albeit recorded a few seconds later. The gap column denotes the time interval in seconds between the current data and the post data. Finally, the column reveals the peak level of risk identified during that time frame.
3.2. Selecting the Best Machine Learning Model
The performance results of various candidate machine learning models for pedestrian road crossing alerts, as outlined in Table 1, have been derived from prerecorded videos. The selection of an appropriate model heavily influences the effectiveness of systems like surface defect detection. This choice hinges on various performance metrics, which can significantly differ when compared with past research due to the influence of data composition on training and evaluation outcomes. The emphasis on model performance critically reveals the impact of how data is characterized and structured; thus, understanding the intricacies of datasets becomes paramount for achieving precise and reliable systems.

Table 1.
Machine learning algorithms for pedestrian crossing alert.
Choosing the right ML model by evaluating various performance metrics is essential for optimizing system design [23]. There are numerous machine learning algorithms suitable for enhancing pedestrian crossing alert systems, each providing unique benefits. Therefore, a thorough assessment of performance indicators, such as accuracy and training time, is critical. From Equations (4)–(6) and Table 1, we can derive important conclusions regarding the effectiveness of these models as follows:
and represents the LogR model as shown in Table 1, which achieves the highest CBPM for the pedestrian alert system.
Although the GB model indicated by is recognized for its excellent training speed, the CBPM identifies LogR as the most efficient machine learning algorithm, acknowledging its competitive advantages even though it has a slower training duration in comparison to GB (see Figure 4). Utilizing the CBPM not only facilitates the discovery of the most effective algorithm but also helps reconcile conflicting performance metrics, which ultimately boosts the reliability and efficacy of the resulting detection system [23].

Figure 4.
Best machine learning model selection by adapting CBPM.
4. Advanced ML-Based Pedestrian Crossing Alert System
A comprehensive evaluation of the accuracy of a predictive model for real-time video analysis in automotive applications has been conducted using a dataset of previously unseen videos. This evaluation involved meticulous collection of results for each frame, which were then compared with actual outcomes observed one second later. The performance of four models was assessed, yielding the following accuracy rates: Gradient Boosting (GB) at 92.51%, Logistic Regression (LogR) at 94.80%, Random Forest Regressor (RFR) at 89.52%, and Support Vector Machine (SVM) at 90.53%, all of which align closely with the accuracy observed during the training phase (refer to Table 2). Notably, although the Gradient Boosting model did not achieve the highest accuracy, it outperformed the Logistic Regression model, which recorded the top accuracy. These findings illustrate the model’s robustness and reliability in predicting real-time events, affirming its potential to enhance driver safety through timely and accurate risk assessments.
Table 2.
Performance results of various machine learning algorithms.
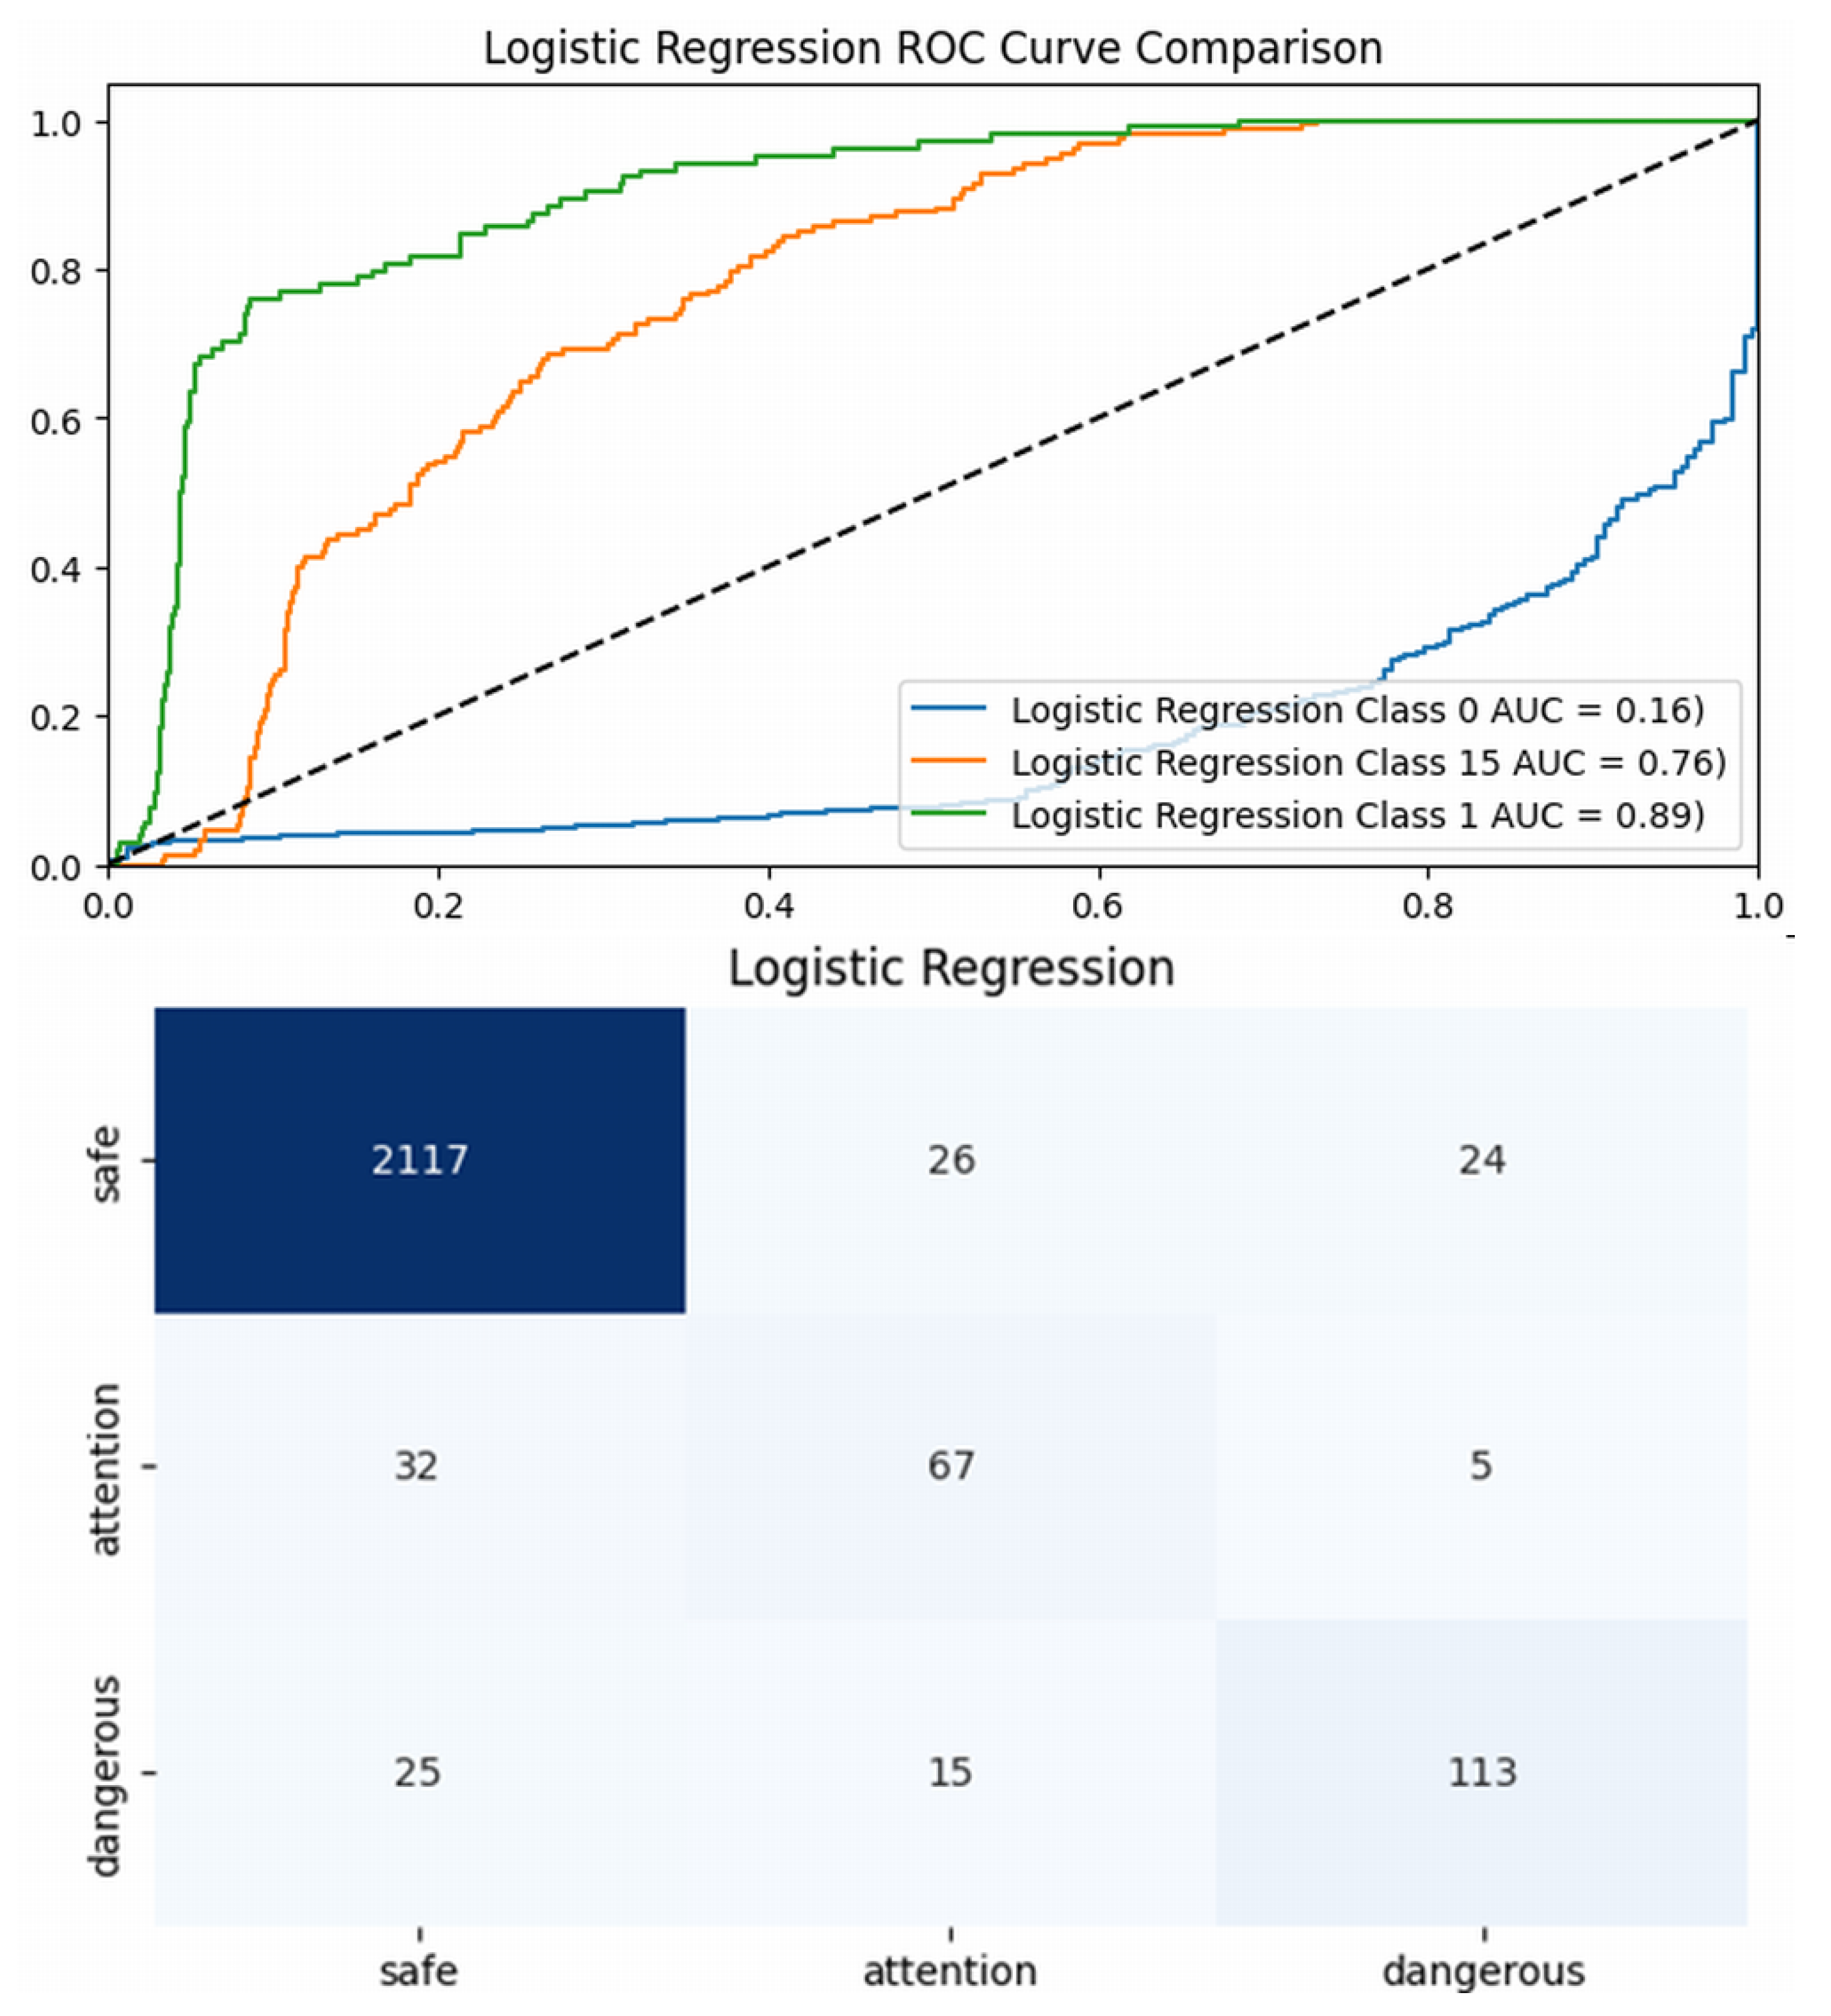
The LogR achieves superior overall accuracy at 94.76% and an impressive F1-score of 0.95, reflecting its strong performance across all classes. With precision at 94.74% and recall at 94.76%, it maintains a favorable balance between accurately identifying positive samples while minimizing false positives. Nevertheless, an examination of the AUC (Area Under the Curve) scores uncovers significant difficulties. It should be highlighted that the class imbalance significantly influences model analysis, yielding commendable accuracy alongside a low AUC score and a less favorable confusion matrix illustrated in Figure 5. Although it registers a fair AUC of 0.89 for Class 1, its scores for Class 0 (0.16) and Class 15 (0.76) are alarming, particularly for Class 15, where class differentiation remains a challenge (see top of Figure 5).
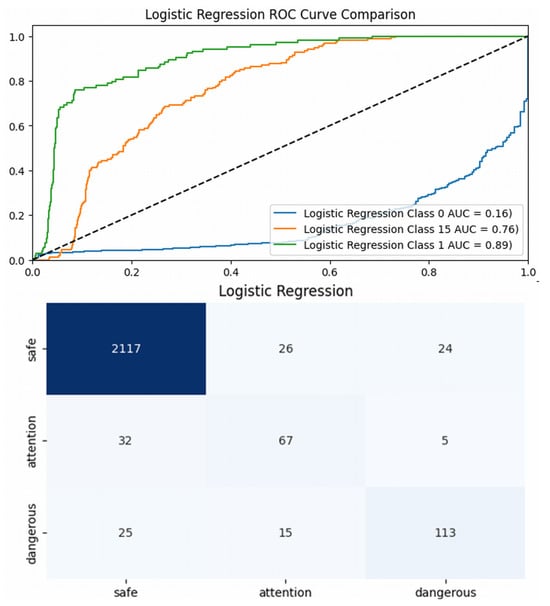
Figure 5.
(top) AUC results for Logistic Regression; (bottom) confusion matrix for pedestrian crossing.
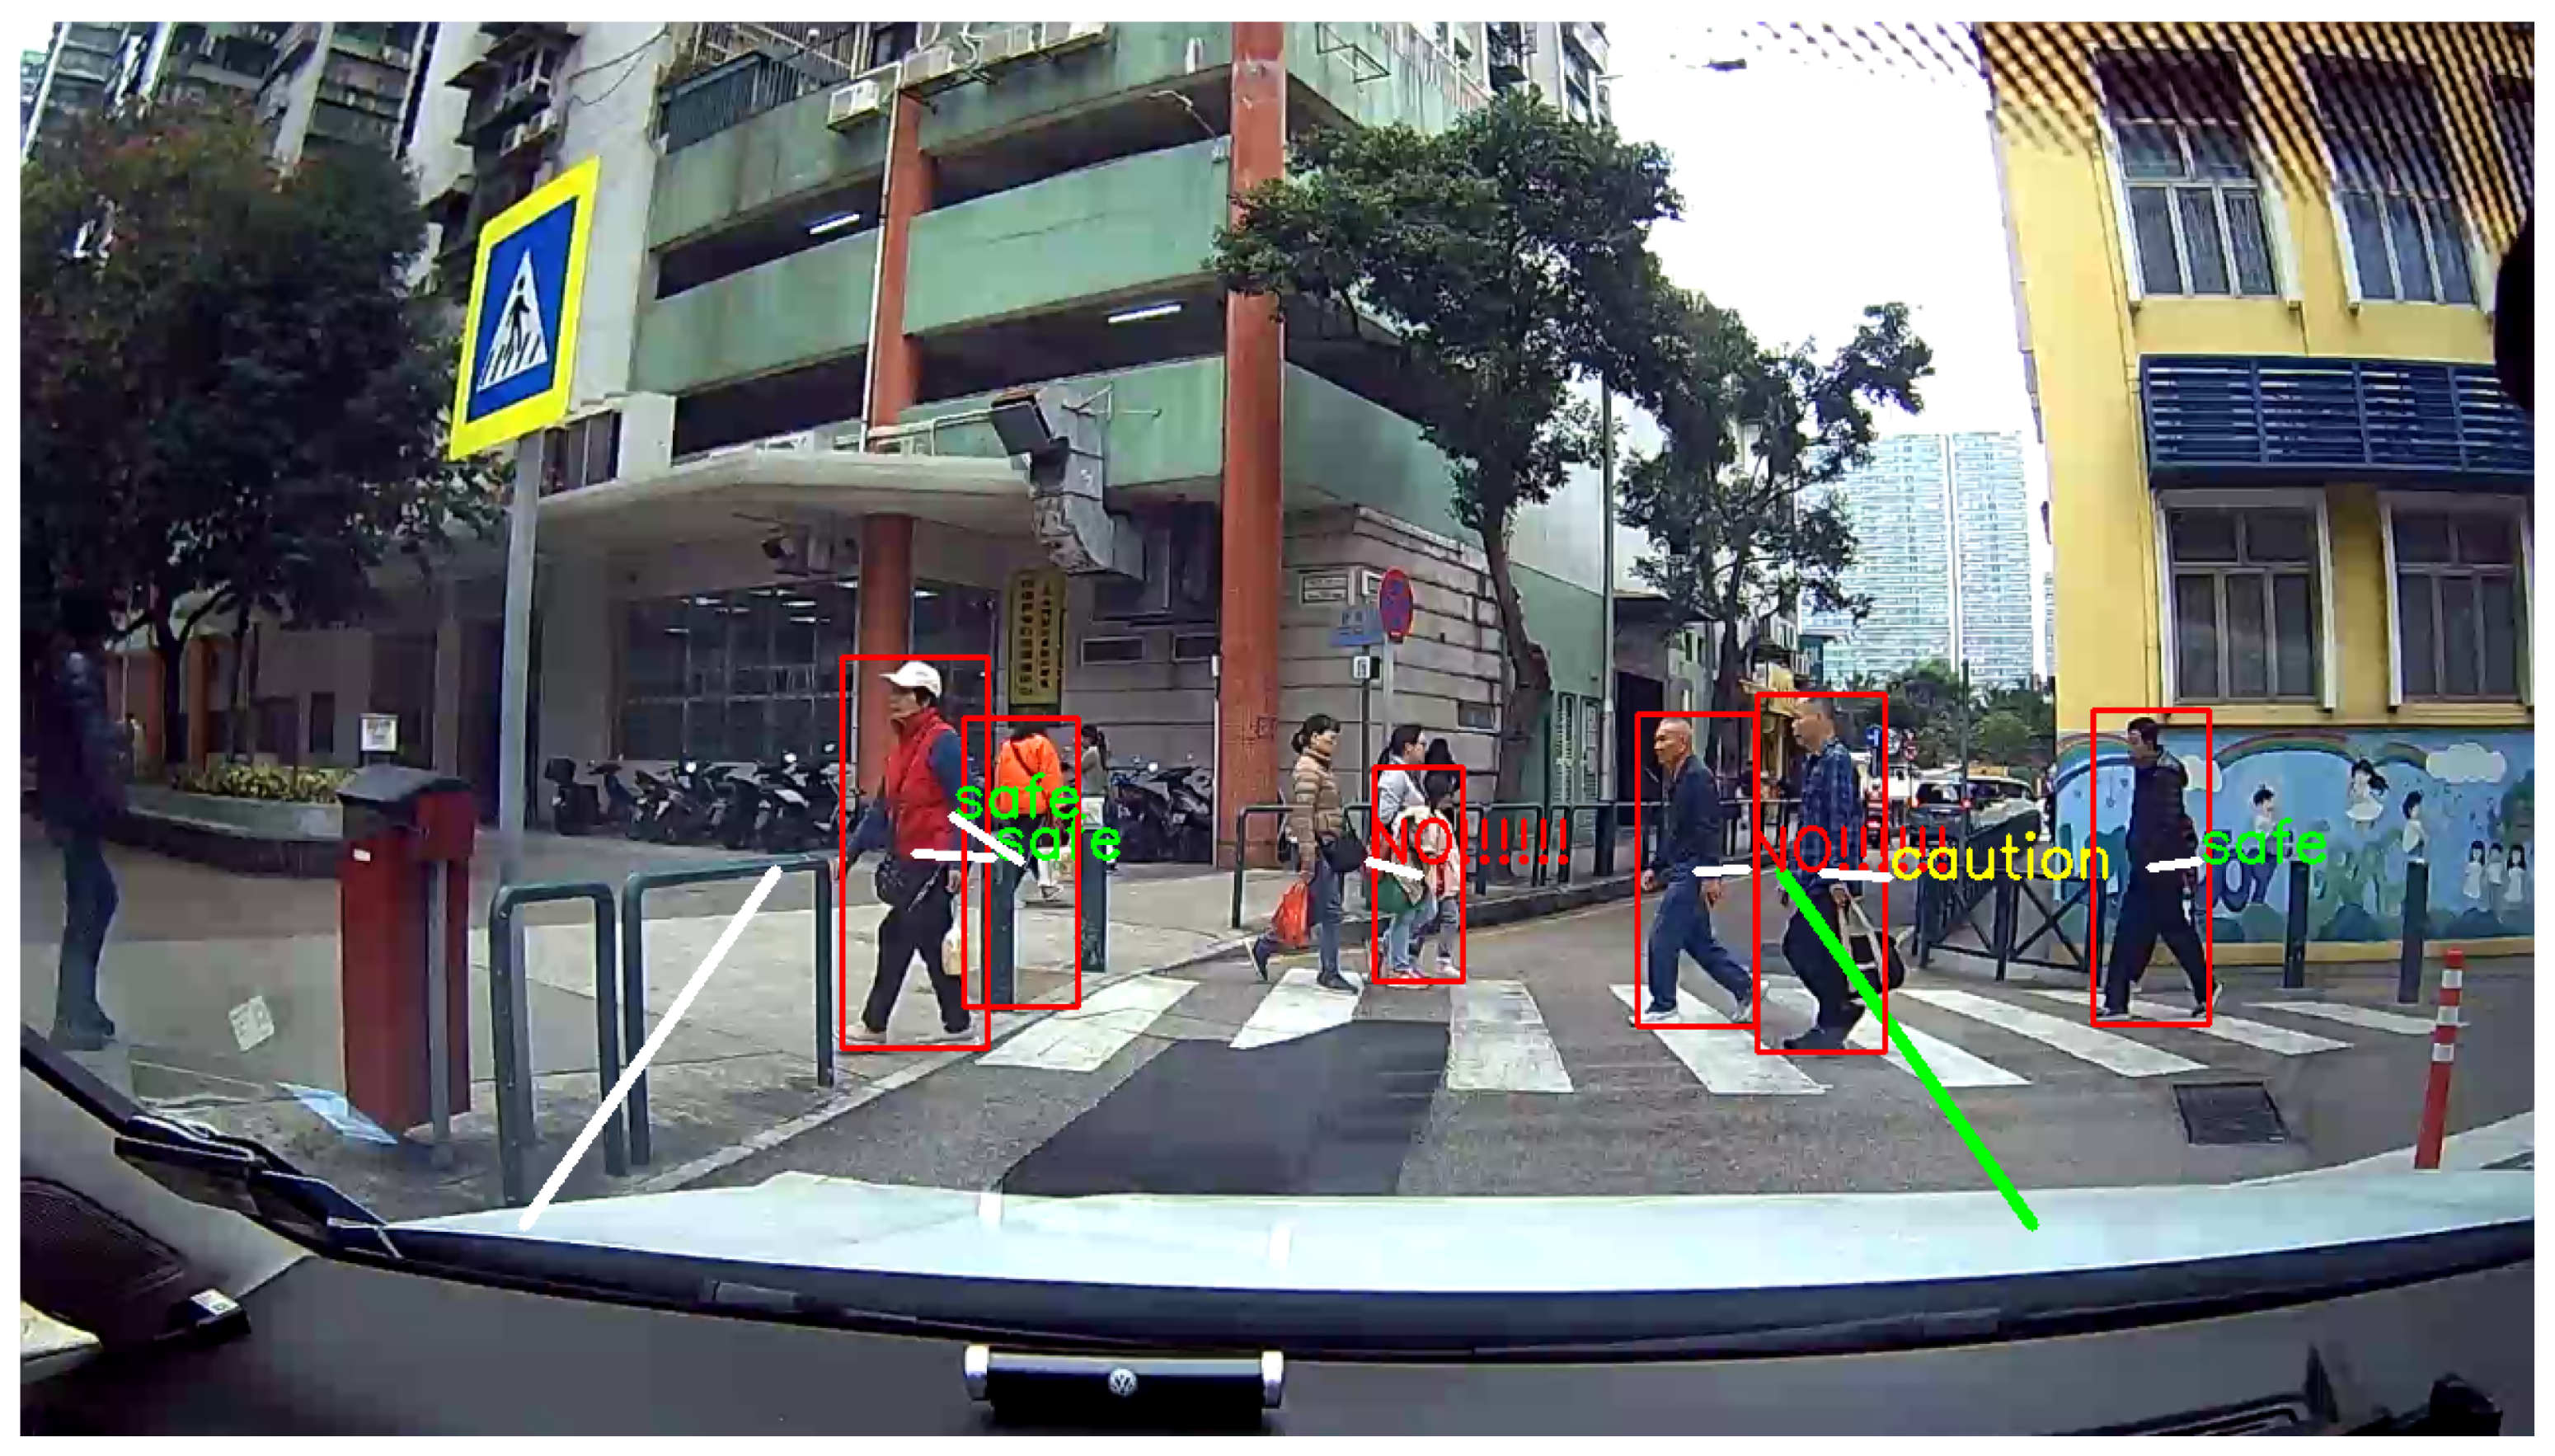
This situation reveals that the model is notably affected by class imbalance, which hampers its performance, especially in cases where minority classes hold critical importance. Moreover, with a training duration of 15.48 s, the efficiency of the model may pose constraints, particularly in environments with limited resources. While some classes fail to achieve satisfactory AUC results, others show notably higher values, further highlighting inconsistencies. This variation in performance could stem from the data quality, as it lacks adequate differentiation between features, making it difficult for the model to effectively distinguish between different classes. The confusion matrix associated with the LogR model offers significant insights into the performance of the alert system, highlighting the distinct separation between actual and predicted labels for different defect categories. As illustrated at the bottom of Figure 5, the model successfully identified 2297 out of 2424 defect samples, leading to an impressive accuracy rate of 94.76%, consistent with the findings in Table 2. Our performance evaluation suggests that the pedestrian crossing alert system can be further optimized, as demonstrated in Figure 3. This innovative approach enhances driver safety by analyzing video footage in real time and predicting potential risks. The system identifies frames with high risk levels, generating immediate alerts for the driver through visual or auditory signals. By focusing on horizontally moving pedestrians and employing object detection techniques, the model ensures precise processing while minimizing computational demands. This comprehensive system represents a significant advancement in driver safety technology. While this paper presents a confusion matrix and discusses the significant class imbalance within the dataset, explicit details regarding specific mitigation strategies, such as resampling techniques or algorithmic approaches, are not elaborated upon in the provided text. The discussion primarily focuses on how this imbalance influences model performance, particularly highlighting the discrepancy between overall accuracy and lower AUC scores for minority classes. The inclusion of the confusion matrix serves to illustrate the consequences of this imbalance on classification outcomes. Although the necessity of addressing dataset quality and composition is underscored, the methods employed to counteract the skewed distribution are not explicitly described, which could be a point for further clarification or discussion in a comprehensive manuscript. Enhancing driver safety can be achieved through a novel method that incorporates real-time video analysis and risk prediction techniques. The system was rigorously tested using video footage that simulated real-time driving conditions within a vehicle, as depicted in Figure 6.
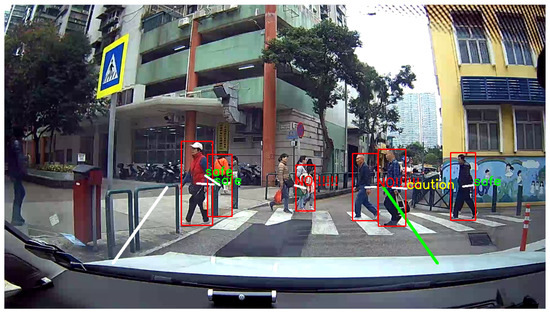
Figure 6.
Actual implementation of advanced alert.
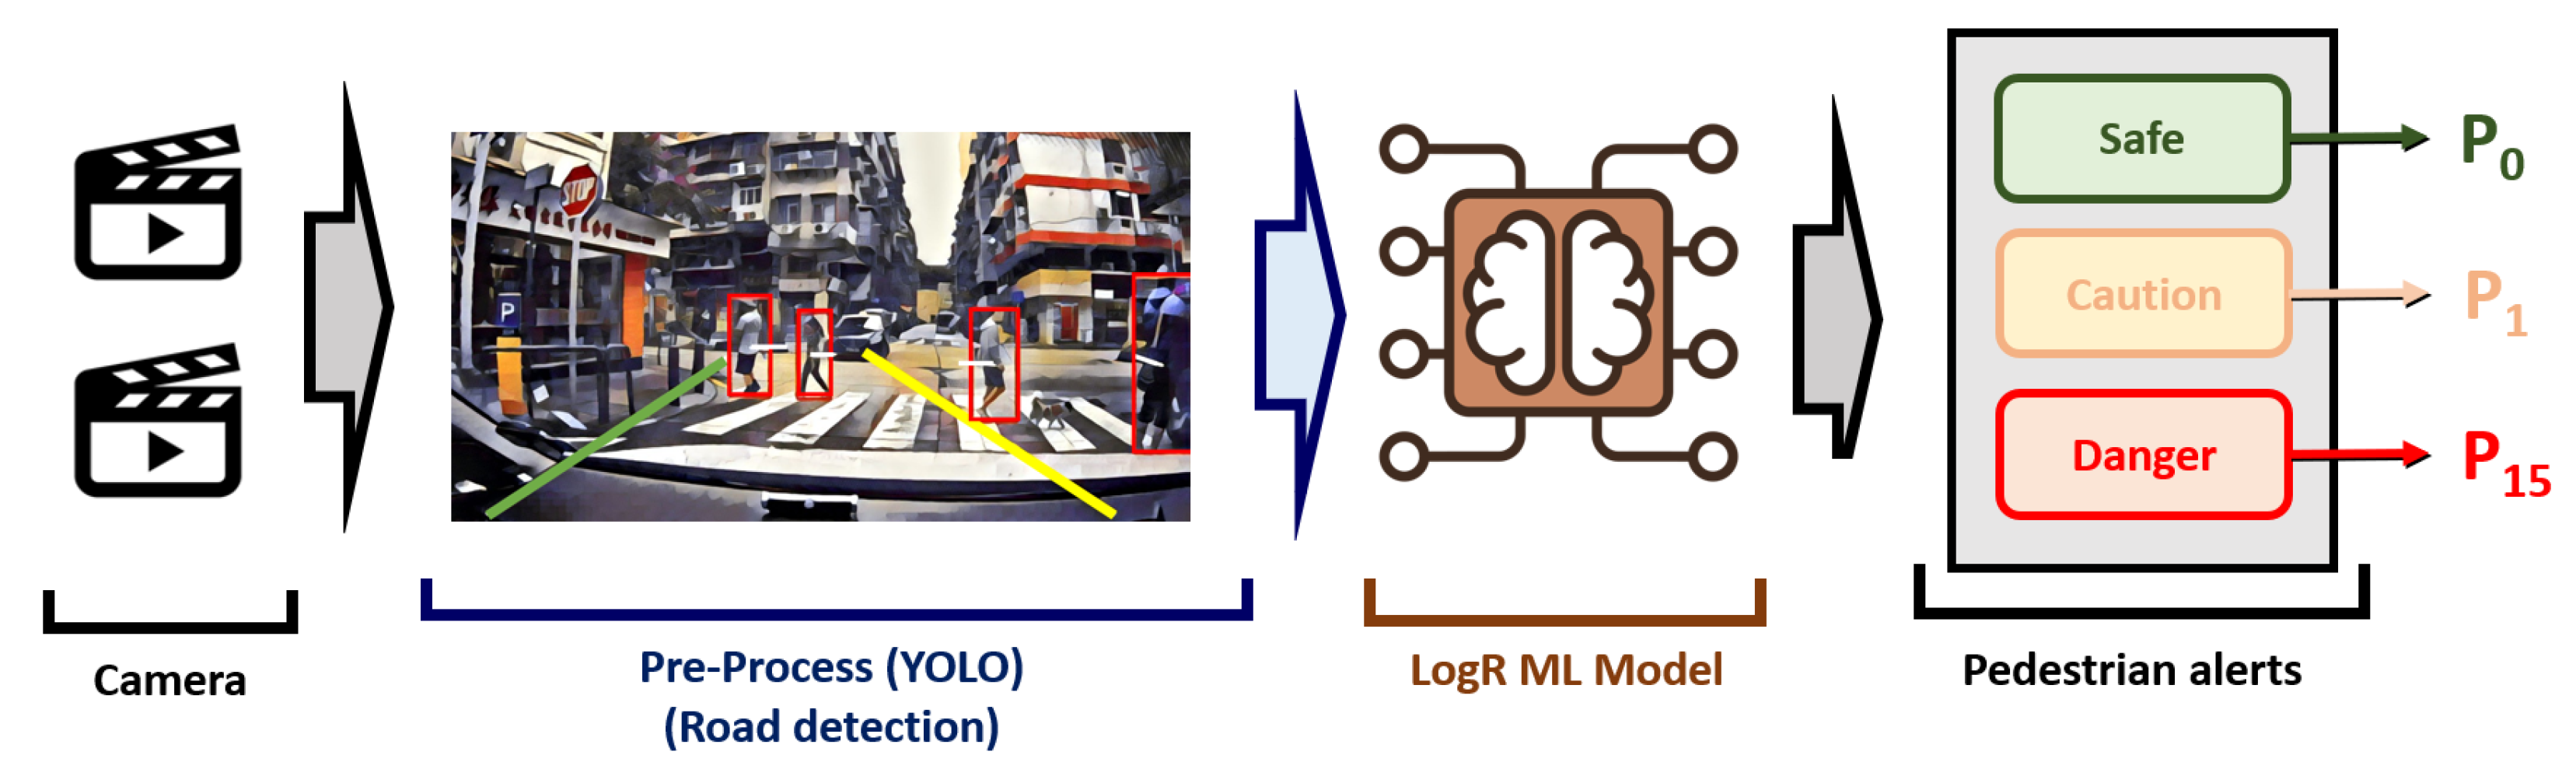
The design aims to improve reaction times and reduce accident risks, showcasing the potential for real-time applications in automotive environments. The primary function of this alert system focuses on identifying frames with the highest risk levels, leading to immediate driver alerts. When the system detects a high-risk frame, it prompts a visual or auditory warning, significantly improving driver response times and minimizing the likelihood of accidents by providing timely and clear hazard alerts (see Figure 7). The main goal of this system involves identifying the frames with the highest risk levels to promptly alert the driver. Upon detection of a high-risk frame, a visual alert in the form of a red flash or an auditory signal is activated to enhance driver awareness.
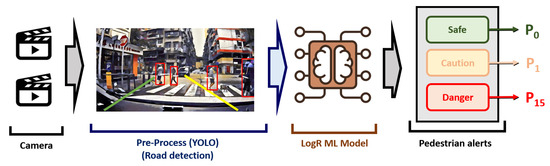
Figure 7.
Design of advanced ML-based pedestrian crossing alert system.
This newly proposed system demonstrates notable advantages over alternative approaches in several key aspects. Performance evaluations utilizing a balanced dataset indicate that the selected Logistic Regression model achieves superior overall accuracy (94.76%) and F1-score (0.95) compared with other tested machine learning algorithms. Furthermore, the application of the CBPM provides a robust framework for selecting the most efficient algorithm by balancing conflicting metrics like accuracy and training time, a capability often lacking in evaluations based solely on single performance indicators. It is particularly advantageous in urban environments like Macao with short driving distances, mitigating the risks of rear-end collisions. Additionally, its vision-based, cost-effective design applicable to both cars and motorcycles offers broader utility than solutions limited to specific vehicle types or fixed locations. The main strategy seeks to boost driver reaction times and lower the chances of accidents by delivering timely and clear warnings regarding potential hazards. Currently, the focus of research is on predicting the lateral movement of pedestrians. Integrating object detection capabilities allows the system to differentiate various objects, while fixed lanes can enhance movement predictions, yielding near real-time results effectively. Overall, this approach illustrates the practical applications of real-time risk assessments to bolster automotive safety.
5. Conclusions
This research has successfully demonstrated the effectiveness of employing machine learning techniques for real-time video analysis aimed at enhancing pedestrian safety in urban environments. By leveraging the advantages of computer vision, particularly through models such as YOLO, the proposed system is capable of promptly identifying high-risk scenarios, thus alerting drivers to potential dangers. Although the results indicate some sensitivity to class imbalance and variations in AUC scores among different classes, the overall accuracy of the models highlights their potential for practical applications. Notably, the findings suggest that refining the dataset and enhancing feature differentiation may further improve model performance. The flexibility of the system is an added advantage, allowing for implementation not only in vehicles but also in surveillance mechanisms, thereby expanding its utility for safety monitoring. As urban areas continue to grow and evolve, the integration of such smart technological solutions holds significant promise for reducing pedestrian-related accidents and fostering safer road environments. Future research will focus on addressing existing limitations, exploring advanced algorithms, and optimizing real-time performance, contributing to a holistic approach to urban pedestrian safety.
Author Contributions
Conceptualization, S.-K.K.; methodology, S.-K.K.; software, I.C.C.; data reshaping, I.C.C.; writing—original draft, S.-K.K. and I.C.C.; writing—review and editing, S.-K.K. All authors have read and agreed to the published version of the manuscript.
Funding
This work was supported in part by the Macao Polytechnic University (MPU), under Grant RP/FCA-05/2024.
Data Availability Statement
The datasets which have been used for the current study are available in the GitHub repository (https://github.com/amang-lab/PRCAS) accessed on 1 July 2025.
Acknowledgments
This paper was revised by using AI/ML-assisted tools. The authors are much in debt to anonymous referees for their careful reviews of our manuscript. Their insightful suggestions led to a notable improvement.
Conflicts of Interest
The authors declare no conflicts of interest.
References
- Force, P.S.P. Comparison of Traffic Statistical Data. 2025. Available online: https://www.fsm.gov.mo/ (accessed on 1 March 2025).
- Huang, Z. Discussion on Road Traffic Problems and “Public Transport Priority” Policy in the Macau Peninsula. World J. Eng. Technol. 2020, 8, 631–641. [Google Scholar] [CrossRef]
- Sultana, S.; Ahmed, B.; Paul, M.; Islam, M.R.; Ahmad, S. Vision-Based Robust Lane Detection and Tracking in Challenging Conditions. IEEE Access 2023, 11, 67938–67955. [Google Scholar] [CrossRef]
- Shukla, S.; Kumar, S.; Kumar, A.; Srivastawa, V. Pedestrian Safety Management System Using Automatically Retractable Bollards. In Proceedings of the 2023 3rd International Conference on Innovative Sustainable Computational Technologies (CISCT), Dehradun, India, 8–9 September 2023; pp. 1–6. [Google Scholar] [CrossRef]
- Li, W.; Zhang, H.; Ni, D.; Wang, Z.; Xiao, Y. The Effect of Driver Fatigue on Takeover Reaction Time under Human-Machine Co-Driving. In Proceedings of the 2023 7th International Conference on Transportation Information and Safety (ICTIS), Xian, China, 4–6 August 2023; pp. 1672–1677. [Google Scholar] [CrossRef]
- Zhao, Y. Design and Implementation of Pedestrian Target Tracking System Based on YOLO Architecture. In Proceedings of the 2023 International Conference on Artificial Intelligence and Automation Control (AIAC), Xiamen, China, 17–19 November 2023; pp. 368–373. [Google Scholar]
- Che, J.; He, Y.; Wu, J. Pedestrian multiple-object tracking based on FairMOT and circle loss. Sci. Rep. 2023, 13, 4525. [Google Scholar] [CrossRef] [PubMed]
- Carlsson, S. Object detection using model based prediction and motion parallax. In Proceedings of the Computer Vision—ECCV 90: First European Conference on Computer Vision, Antibes, France, 23–27 April 1990; Proceedings 1. pp. 297–306. [Google Scholar]
- Diwan, T.; Anirudh, G.; Tembhurne, J.V. Object detection using YOLO: Challenges, architectural successors, datasets and applications. Multimed. Tools Appl. 2023, 82, 9243–9275. [Google Scholar] [CrossRef] [PubMed]
- Jiang, P.; Ergu, D.; Liu, F.; Cai, Y.; Ma, B. A Review of Yolo Algorithm Developments. Procedia Comput. Sci. 2022, 199, 1066–1073. [Google Scholar] [CrossRef]
- Zhou, X.; Luo, J.; Lin, S.; Wang, Y.; Yan, Z.; Ren, Q.; Liu, X.; Li, X. Efficacy of Poria cocos and Alismatis rhizoma against diet-induced hyperlipidemia in rats based on transcriptome sequencing analysis. Sci. Rep. 2023, 13, 17493. [Google Scholar] [CrossRef] [PubMed]
- Senthil Selvi, A.; Sibi Aadesh, P.; Manoharan, B.; Hari Narayanan, S. Real-Time Multiple Object Tracking and Object Detection using YOLO v7 and FairMOT Algorithm. In Proceedings of the 2023 International Conference on Innovative Computing, Intelligent Communication and Smart Electrical Systems (ICSES), Chennai, India, 14–15 December 2023; pp. 1–5. [Google Scholar]
- Anish, A.; R, S.; Malini, A.H.; Archana, T. Enhancing Surveillance Systems with YOLO Algorithm for Real-Time Object Detection and Tracking. In Proceedings of the 2023 2nd International Conference on Automation, Computing and Renewable Systems (ICACRS), Pudukkottai, India, 11–13 December 2023; pp. 1254–1257. [Google Scholar]
- Sahithi, A.; Teja, B.S.; Shastry, C.V.; Venugopal, C.; Rajyalakshmi, C. Enhancing Object Detection and Tracking from Surveillance Video Camera Using YOLOv8. In Proceedings of the 2023 International Conference on Recent Advances in Information Technology for Sustainable Development (ICRAIS), Manipal, India, 6–7 November 2023; pp. 228–233. [Google Scholar]
- Terdal, S.; F, S.; Fatima, A.; Reddy, A.; Koppal, M. YOLO-Based Video Processing for CCTV Surveillance. In Proceedings of the 2023 5th International Conference on Inventive Research in Computing Applications (ICIRCA), Coimbatore, India, 3–5 August 2023; pp. 273–277. [Google Scholar]
- Zhou, X.; Xu, X.; Liang, W.; Zeng, Z.; Yan, Z. Deep-Learning-Enhanced Multitarget Detection for End–Edge–Cloud Surveillance in Smart IoT. IEEE Internet Things J. 2021, 8, 12588–12596. [Google Scholar] [CrossRef]
- Jocher, G.; Chaurasia, A.; Qiu, J. YOLOv8—Ultralytics YOLO Docs. 2023. Available online: https://github.com/ultralytics/ultralytics (accessed on 1 January 2023).
- Yang, H.; Lin, D.; Zhang, G.; Zhang, H.; Wang, J.; Zhang, S. Research on Detection of Rice Pests and Diseases Based on Improved yolov5 Algorithm. Appl. Sci. 2023, 13, 10188. [Google Scholar] [CrossRef]
- Natekin, A.; Knoll, A. Gradient boosting machines, a tutorial. Front. Neurorobotics 2013, 7, 63623. [Google Scholar] [CrossRef] [PubMed]
- Jurafsky, D.; Martin, J.H. Speech and Language Processing. 2021. Available online: https://web.stanford.edu/~jurafsky/slp3/ (accessed on 1 July 2025).
- Breiman, L. Random Forests. Mach. Learn. 2001, 45, 5–32. [Google Scholar] [CrossRef]
- Kalid, S.N.; Ng, K.H.; Tong, G.K.; Khor, K.C. A Multiple Classifiers System for Anomaly Detection in Credit Card Data With Unbalanced and Overlapped Classes. IEEE Access 2020, 8, 28210–28221. [Google Scholar] [CrossRef]
- Kim, S.K. Combined Bivariate Performance Measure. IEEE Trans. Instrum. Meas. 2024, 73, 1009404. [Google Scholar] [CrossRef]
- Bradski, G. and Kaehler, A. OpenCV: Canny Edge Detection. Learning OpenCV; O’Reilly: Sebastopol, CA, USA, 2008. [Google Scholar]
- Lin, T.Y.; Maire, M.; Belongie, S.J.; Bourdev, L.D.; Girshick, R.B.; Hays, J.; Perona, P.; Ramanan, D.; Dollár, P.; Zitnick, C.L. Microsoft COCO: Common Objects in Context. arXiv 2014, arXiv:1405.0312. [Google Scholar]

Disclaimer/Publisher’s Note: The statements, opinions and data contained in all publications are solely those of the individual author(s) and contributor(s) and not of MDPI and/or the editor(s). MDPI and/or the editor(s) disclaim responsibility for any injury to people or property resulting from any ideas, methods, instructions or products referred to in the content. |
© 2025 by the authors. Licensee MDPI, Basel, Switzerland. This article is an open access article distributed under the terms and conditions of the Creative Commons Attribution (CC BY) license (https://creativecommons.org/licenses/by/4.0/).