
Hydrolytic Oxidation of Cellobiose Using Catalysts Containing Noble Metals
 , and
, and
Abstract
:1. Introduction
2. Materials and Methods
2.1. Materials
2.2. Catalysts Synthesis
2.3. Catalysts Characterization
2.4. Catalyst Testing Procedure and Product Analysis
3. Results
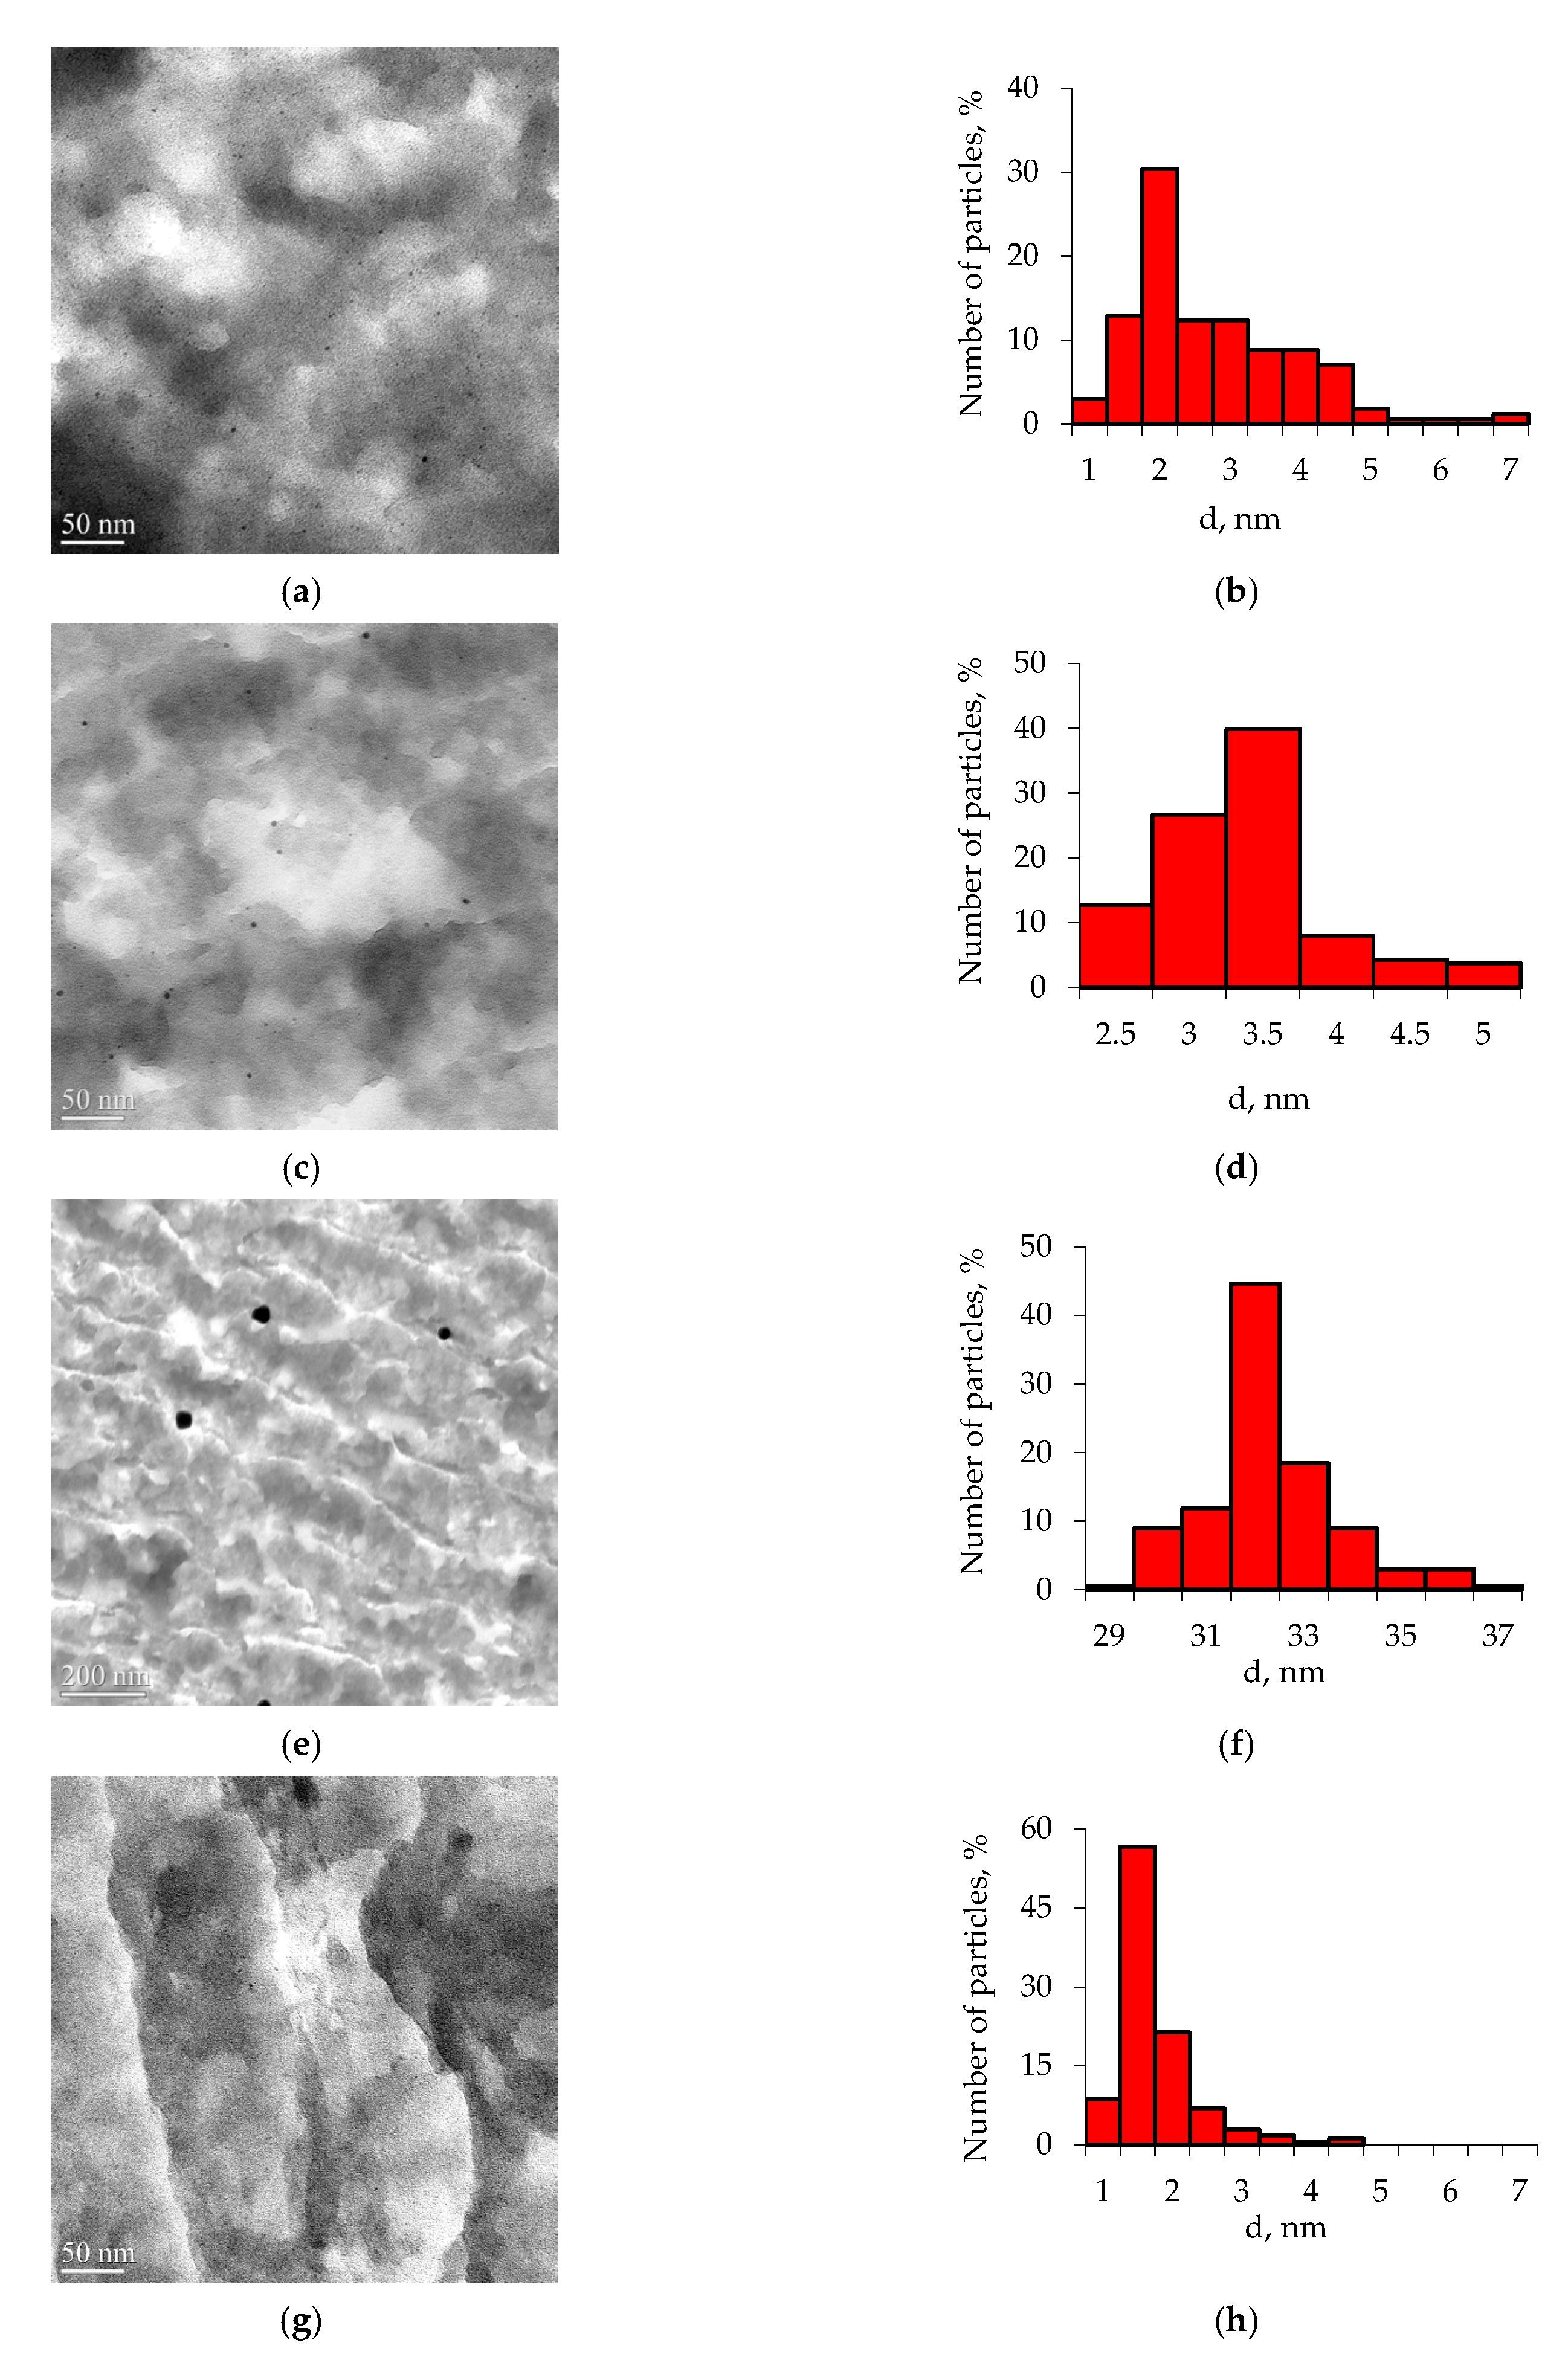
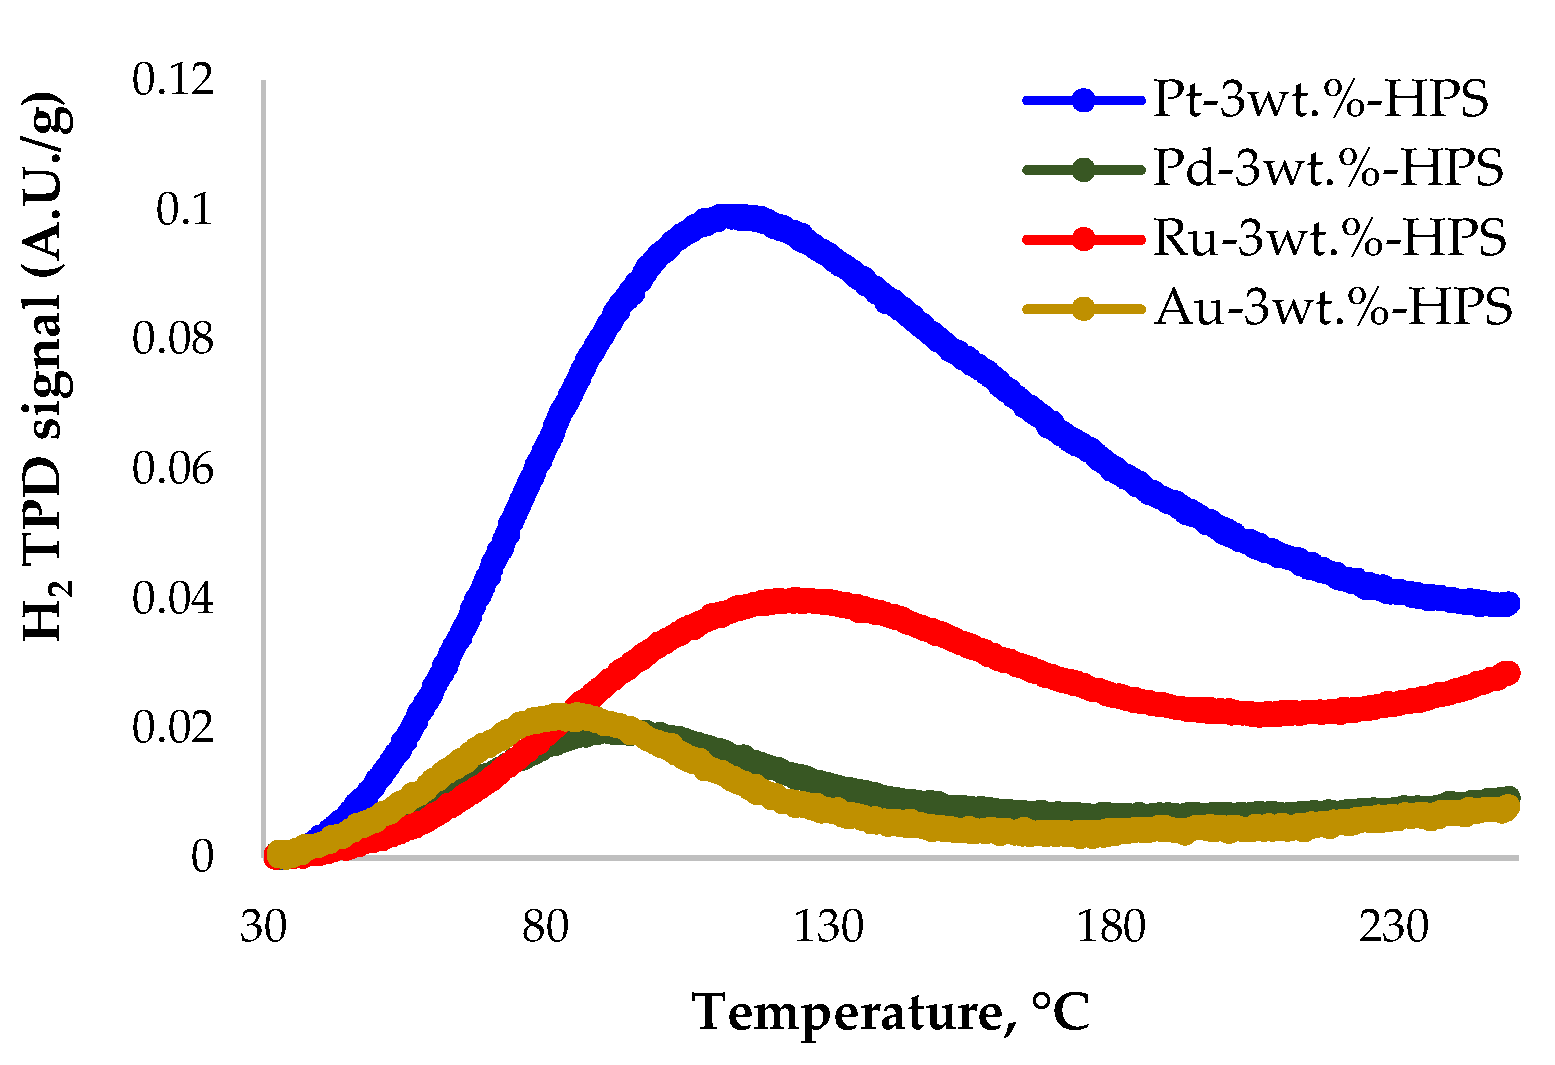
3.1. Catalyst Characterization
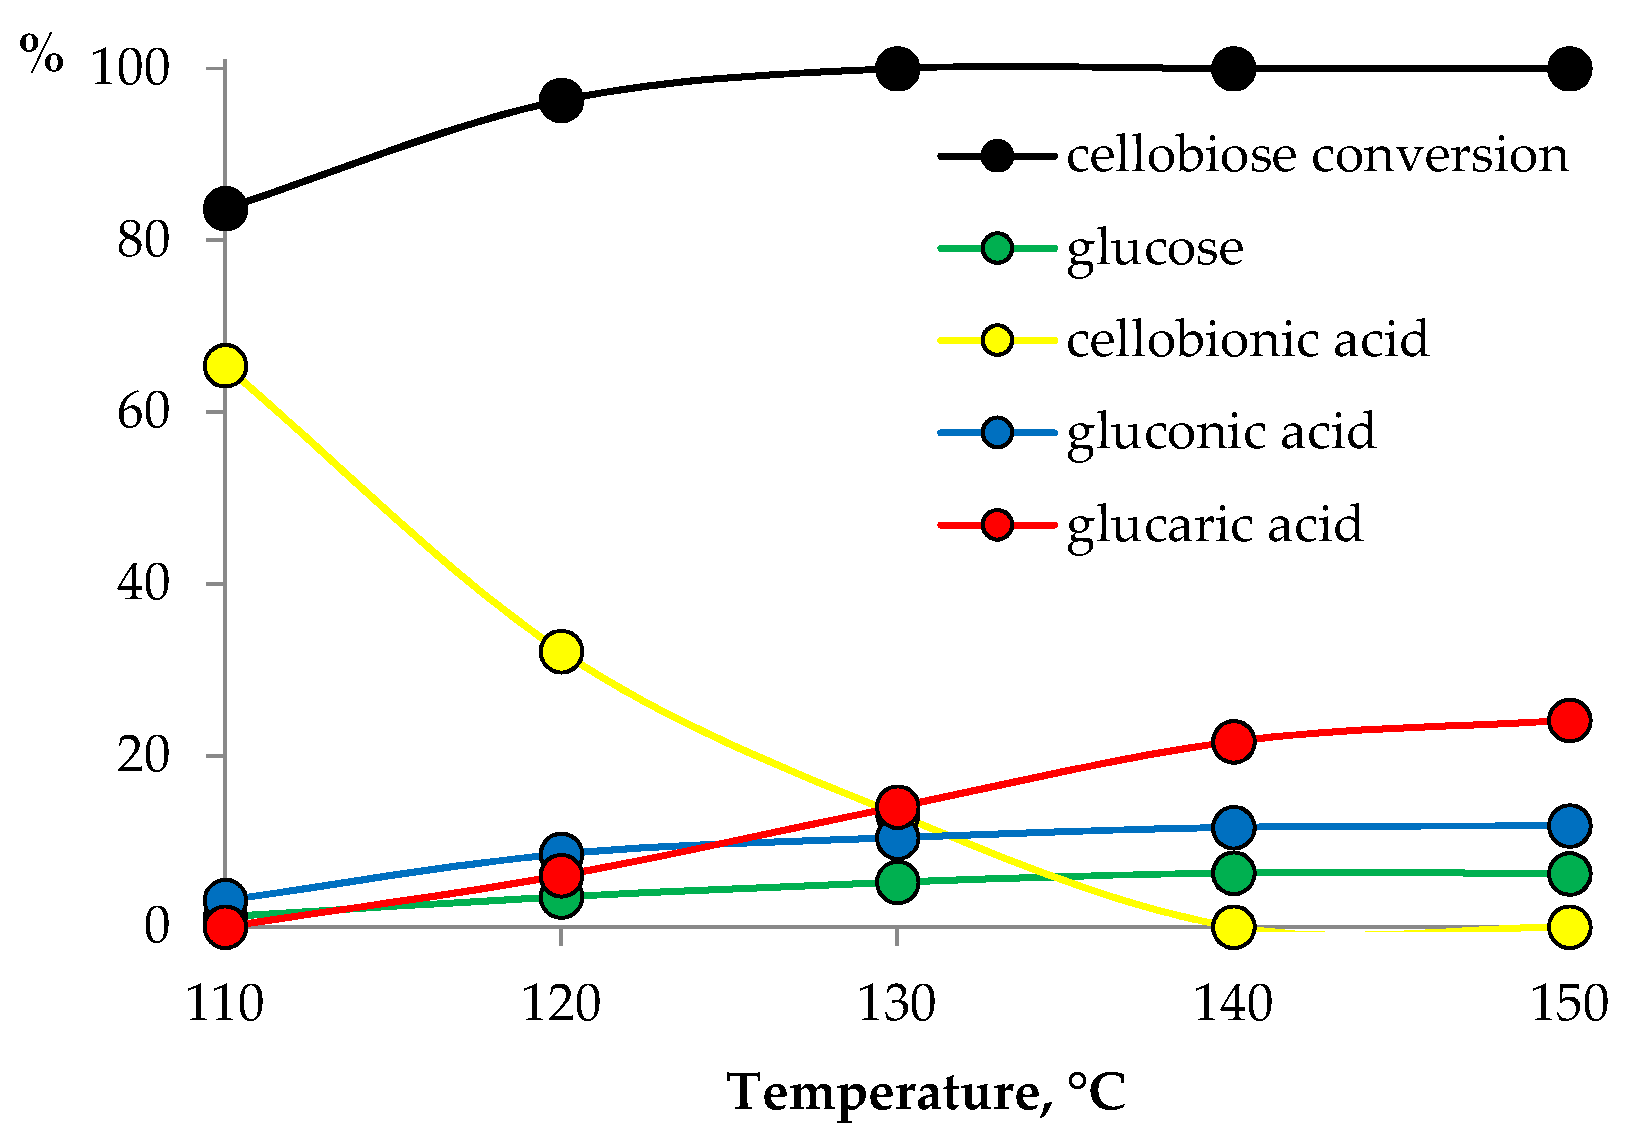
3.2. Catalyst Testing
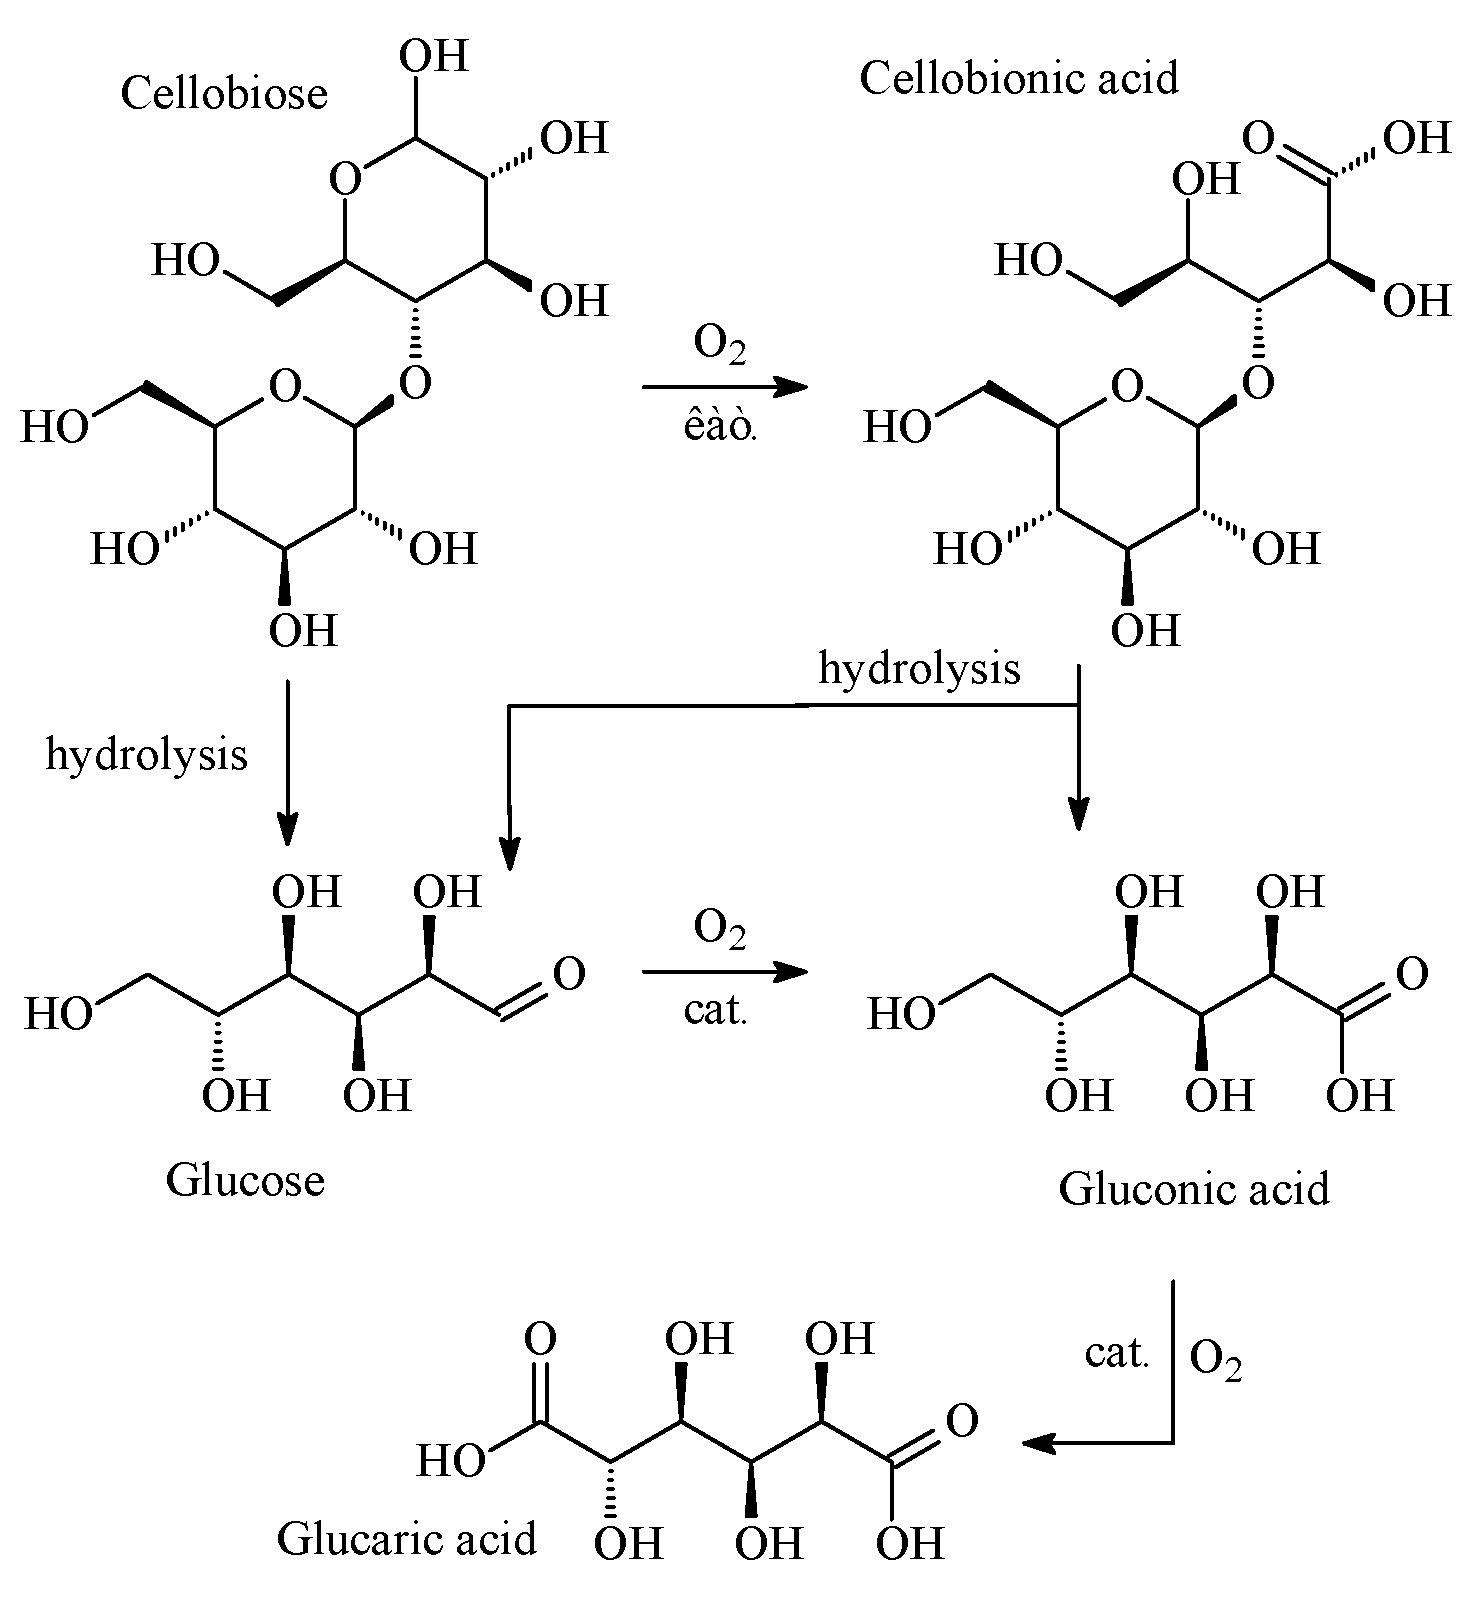
4. Discussion
5. Conclusions
Supplementary Materials
Author Contributions
Funding
Conflicts of Interest
References
- Ramachandran, S.; Fontanille, P.; Pandey, A.; Larroche, C. Gluconic Acid: Properties, Applications and Microbial Production. Food Technol. Biotechnol. 2006, 44, 185–195. [Google Scholar]
- Ahuja, K.; Singh, S. Gluconic Acid Market by Application, by Downstream Potential, Regional Outlook, Application Potential, Price Trend, Competitive Market Share & Forecast, 2018–2024; Global Market Insights Inc.: Selbyville, DE, USA, 2018; p. 240. [Google Scholar]
- Biella, S.; Prati, L.; Rossi, M. Selective oxidation of D-glucose on gold catalyst. J. Catal. 2002, 206, 242–247. [Google Scholar] [CrossRef]
- Pal, P.; Kumar, R.; Banerjee, S. Manufacture of Gluconic Acid: A Review towards Process Intensification for Green Production. Chem. Eng. Process. Process Intensif. 2016, 104, 160–171. [Google Scholar] [CrossRef]
- Sulman, A.; Matveeva, V.; Golikova, E.; Grebennikova, O.; Lakina, N.; Doluda, V.; Karpenkov, A.Y.; Sulman, E. Oxidoreductase Immobilization on Magnetic Nanoparticles. Chem. Eng. Trans. 2019, 74, 487–492. [Google Scholar]
- Neves, L.C.M.D.; Vitolo, M. Continuous production of gluconic acid and fructose using membrane bioreactor. World J. Pharm. Pharm. Sci. 2020, 9, 423–440. [Google Scholar]
- Lim, H.Y.; Dolzhenko, A.V. Gluconic Acid Aqueous Solution: A BioBased Catalytic Medium for Organic Synthesis. Sustain. Chem. Pharm. 2021, 21, 100443. [Google Scholar] [CrossRef]
- Ma, Y.; Li, B.; Zhang, X.; Wang, C.; Chen, W. Production of Gluconic Acid and Its Derivatives by Microbial Fermentation: Process Improvement Based on Integrated Routes. Front. Bioeng. Biotechnol. 2022, 10, 864787. [Google Scholar] [CrossRef]
- Fernandes, S.; Belo, I.; Lopes, M. Highly Aerated Cultures Boost Gluconic Acid Production by the Yeast-like Fungus Aureobasidium Pullulans. Biochem. Eng. J. 2021, 175, 108133. [Google Scholar] [CrossRef]
- Zhang, H.; Li, N.; Pan, X.; Wu, S.; Xie, J. Direct Transformation of Cellulose to Gluconic Acid in a Concentrated Iron(III) Chloride Solution under Mild Conditions. ACS Sustain. Chem. Eng. 2017, 5, 4066–4072. [Google Scholar] [CrossRef]
- Reports and Data. Available online: https://www.globenewswire.com/news-release/2020/08/24/2082896/0/en/Glucaric-Acid-Market-To-Reach-USD-1-46-Billion-By-2027-Reports-and-Data.html (accessed on 10 July 2022).
- Werpy, T.; Petersen, G.; Aden, A.; Bozell, J.; Holladay, J.; White, J.; Manheim, A.; Eliot, D.; Lasure, L. Top value added chemicals from biomass, volume 1—results of screening for potential candidates from sugars and synthesis gas. Off. Sci. Tech. Inf. 2004, 69, 36. [Google Scholar]
- Grand View Research, Glucaric Acid Market Size, Share & Trends Analysis by Product (Pure Glucaric Acid, D-Glucaric Acid-1,4-Lactone), by Application (Food Ingredients, Detergents, Corrosion Inhibitors), & Segment Forecasts, 2017–2025. Available online: https://www.grandviewresearch.com/industry-analysis/glucaric-acid-market (accessed on 10 July 2022).
- Wu, Y.; Enomoto-Rogers, Y.; Masaki, H.; Iwata, T. Synthesis of crystalline and amphiphilic polymers from d-glucaric acid. ACS Sustain. Chem. Eng. 2016, 4, 3812–3819. [Google Scholar] [CrossRef]
- Mehtiö, T.; Toivari, M.; Wiebe, M.G.; Harlin, A.; Penttilä, M.; Koivula, A. Production and applications of carbohydrate-derived sugar acids as generic biobased chemicals. Crit. Rev. Biotechnol. 2016, 36, 904–916. [Google Scholar] [CrossRef] [PubMed]
- Kiely, D.E.; Chen, L.; Lin, T.H. Hydroxylated Nylons Based on Unprotected Esterified D-Glucaric Acid by Simple Condensation-Reactions. Am. Chem. Soc. Symp. Ser. 1994, 575, 149–158. [Google Scholar] [CrossRef]
- Smith, T.N.; Hash, K.; Davey, C.-L.; Mills, H.; Williams, H.; Kiely, D.E. Modifications in the nitric acid oxidation of d-glucose. Carbohydr. Res. 2012, 350, 6–13. [Google Scholar] [CrossRef] [PubMed]
- Comotti, M.; Pina, C.D.; Rossi, M. Mono- and bimetallic catalysts for glucose oxidation. J. Mol. Catal. A Chem. 2006, 251, 89–92. [Google Scholar] [CrossRef]
- Jin, X.; Zhao, M.; Shen, J.; Yan, W.; He, L.; Thapa, P.S.; Ren, S.; Subramaniam, B.; Chaudhari, R.V. Exceptional performance of bimetallic Pt1Cu3/TiO2 nanocatalysts for oxidation of gluconic acid and glucose with O2 to glucaric acid. J. Catal. 2015, 330, 323–329. [Google Scholar] [CrossRef]
- Boussie, T.R.; Dias, E.L.; Fresco, Z.M.; Murphy, V.J. Production of Adipic Acid and Derivatives from Carbohydrate-Containing Materials. U.S. Patent 8501989B2, 11 June 2010. [Google Scholar]
- Moggia, G.; Schalck, J.; Daems, N.; Breugelmans, T. Two-steps synthesis of D-glucaric acid via D-gluconic acid by electrocatalytic oxidation of D-glucose on gold electrode: Influence of operational parameters. Electrochim. Acta 2021, 374, 137852. [Google Scholar] [CrossRef]
- Liu, W.; Xu, Z.; Zhao, D.; Pan, X.; Li, H.; Hu, X.; Fan, Z.; Wang, W.; Zhao, G.; Jin, S.; et al. Efficient electrochemical production of glucaric acid and H2 via glucose electrolysis. Nat. Commun. 2020, 11, 265. [Google Scholar] [CrossRef] [Green Version]
- Moggia, G.; Kenis, T.; Daems, N.; Breugelmans, T. Electrochemical oxidation of d-glucose in alkaline medium: Impact of oxidation potential and chemical side reactions on the selectivity to d-Gluconic and d-Glucaric Acid. ChemElectroChem 2020, 7, 86–95. [Google Scholar] [CrossRef] [Green Version]
- Sakuta, R.; Nakamura, N. Production of Hexaric Acids from Biomass. Int. J. Mol. Sci. 2019, 20, 3660. [Google Scholar] [CrossRef] [Green Version]
- Thaore, V.B.; Armstrong, R.D.; Hutchings, G.J.; Knight, D.W.; Chadwick, D.; Shah, N. Sustainable production of glucaric acid from corn stover via glucose oxidation: An assessment of homogeneous and heterogeneous catalytic oxidation production routes. Chem. Eng. Res. Des. 2020, 153, 337–349. [Google Scholar] [CrossRef]
- Morawa Eblagon, K.; Pereira, M.F.R.; Figueiredo, J.L. One-pot oxidation of cellobiose to gluconic acid. Unprecedented high selectivity on bifunctional gold catalysts over mesoporous carbon by integrated texture and surface chemistry optimization. Appl. Catal. B Environ. 2016, 184, 381–396. [Google Scholar] [CrossRef]
- Amaniampong, P.N.; Jia, X.; Wang, B.; Mushrif, S.H.; Borgna, A.; Yang, Y. Catalytic oxidation of cellobiose over TiO2 supported gold-based bimetallic nanoparticles. Catal. Sci. Technol. 2015, 5, 2393–2405. [Google Scholar] [CrossRef]
- Armstrong, R.D.; Hirayama, J.; Knight, D.W.; Hutchings, G.J. Quantitative Determination of Pt-Catalyzed D-Glucose Oxidation Products Using 2D NMR. ACS Catal. 2019, 9, 325–335. [Google Scholar] [CrossRef]
- Manaenkov, O.; Kosivtsov, Y.; Sapunov, V.; Kislitsa, O.; Sulman, M.; Bykov, A.; Sidorov, A.; Matveeva, V. Kinetic Modeling for the “One-Pot” Hydrogenolysis of Cellulose to Glycols over Ru@Fe3O4/Polymer Catalyst. Reactions 2022, 3, 1–11. [Google Scholar] [CrossRef]


| Catalyst | Me Loading, wt% | Me Content from Elemental Analysis, wt% |
|---|---|---|
| 3% Pt/HPS MN270 | 3.00 | 2.91 |
| 3% Pd/HPS MN270 | 3.00 | 2.95 |
| 3% Au/HPS MN270 | 3.00 | 2.87 |
| 3% Ru/HPS MN270 | 3.00 | 2.70 |
| Sample | BET | Langmuir | t-Plot | |
|---|---|---|---|---|
| SBET, m2/g | SL, m2/g | St, m2/g | V, cm3/g | |
| HPS MN270 | 1075 | 1191 | 265 1, 807 2, 1072 3 | 0.37 |
| 3% Pt/HPS MN270 | 863 | 944 | 184 1, 678 2, 862 3 | 0.31 |
| 3% Pd/HPS MN270 | 649 | 758 | 94 1, 553 2, 647 3 | 0.22 |
| 3% Au/HPS MN270 | 738 | 810 | 141 1, 593 2, 734 3 | 0.25 |
| 3% Ru/HPS MN270 | 839 | 921 | 151 1, 699 2, 856 3 | 0.28 |
| Sample | c(H2ads), mmol(H2)/g |
|---|---|
| 3% Pt/HPS MN 270 | 0.039 |
| 3% Pd/HPS MN 270 | 0.005 |
| 3% Ru/HPS MN 270 | 0.008 |
| 3% Au/HPS MN 270 | 0.005 |
| Catalyst | Cellobiose Conversion, % | Product Selectivity, % | ||||
|---|---|---|---|---|---|---|
| Glucose | Cellobionic Acid | Gluconic Acid | Glucaric Acid | Σ of By-Products | ||
| 3% Pt/HPS MN270 | 100 | 4.1 | 9.4 | 16.1 | 41.5 | 28.9 |
| 3% Au/HPS MN270 | 86.2 | 24.6 | 50.1 | 12.3 | 0 | 13.0 |
| 3% Pd/HPS MN270 | 53.3 | 24.2 | 40.0 | 2.8 | 0 | 33 |
| 3% Ru/HPS MN270 | 45.4 | 26.4 | 0 | 0 | 0 | 73.6 |
| blank (without catalyst) | 9.5 | 14.7 | 0 | 0 | 0 | 85.3 |
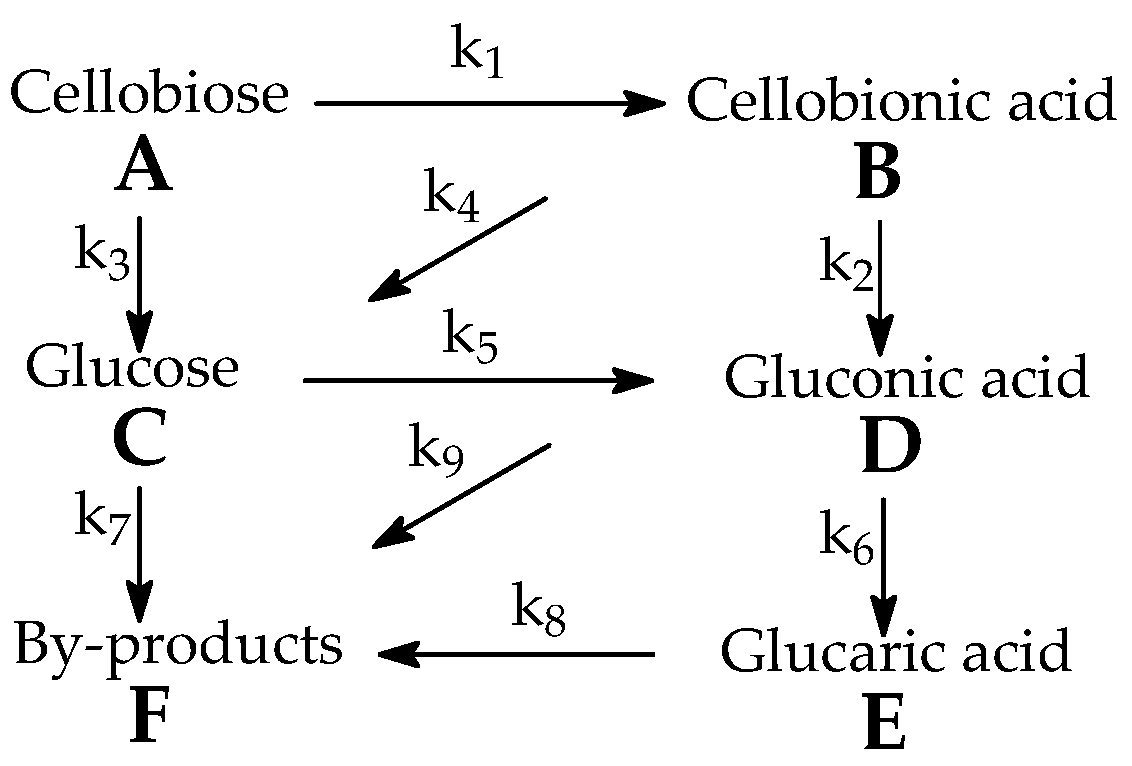
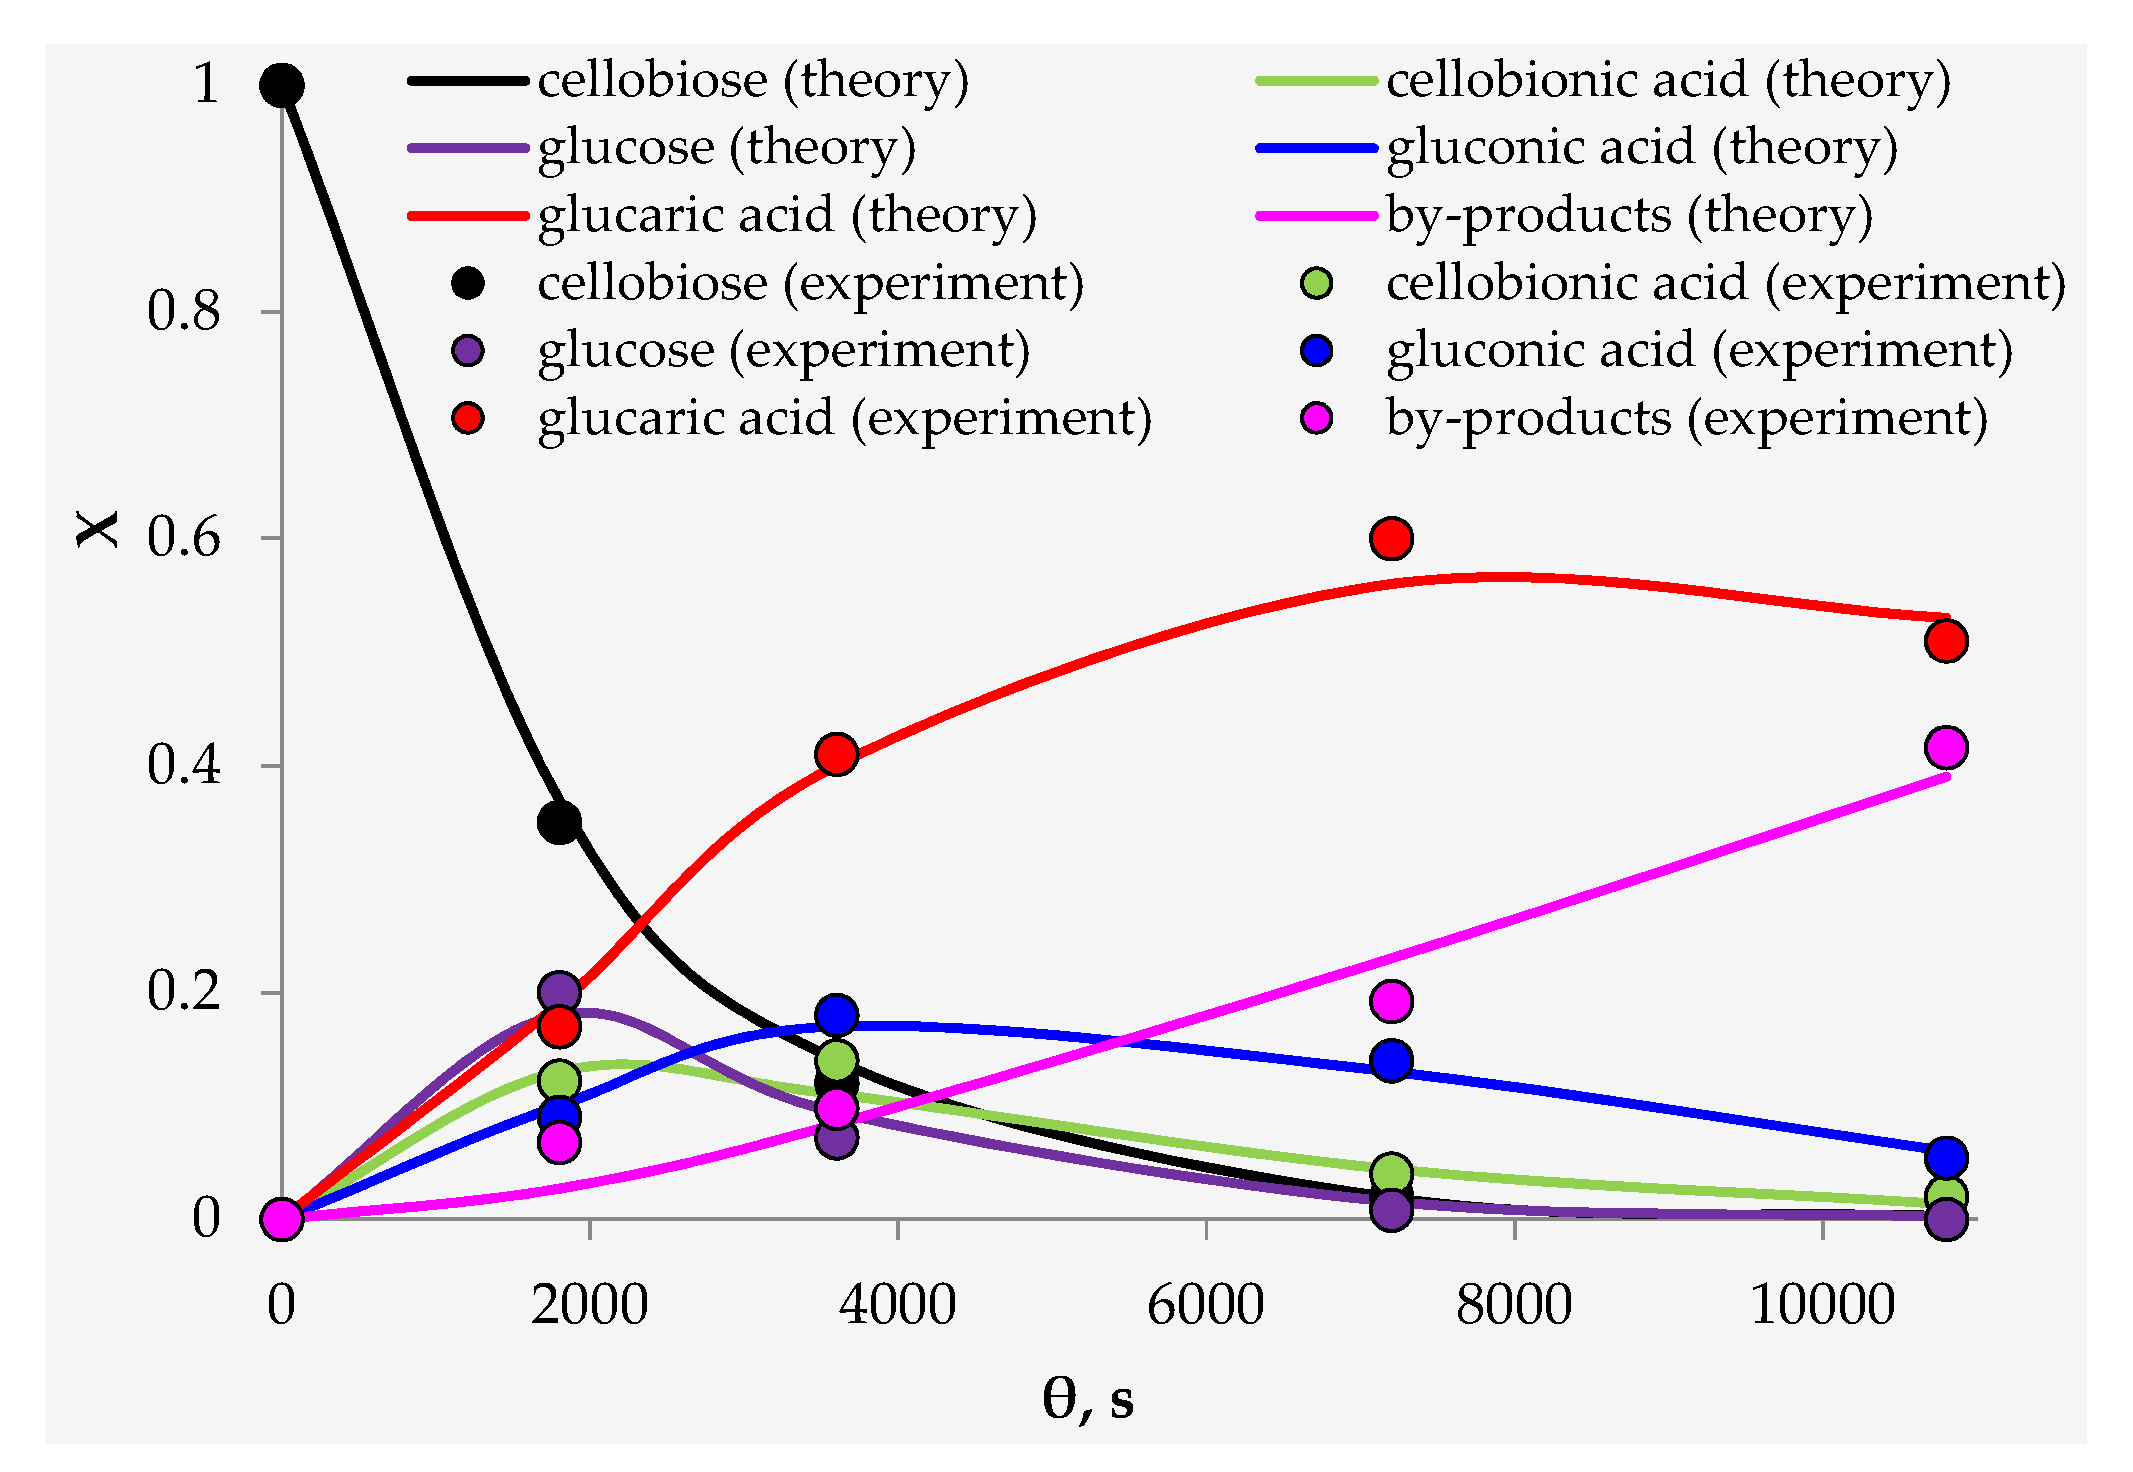
| Parameter, (mol/mol)n·s−1 | Value | Parameter, (mol/mol)n·s−1 | Value |
|---|---|---|---|
| k1 | 2.49 ± 0.07 × 10⁻⁴ | k6 | 4.99 ± 0.15 × 10⁻⁵ |
| k2 | 5.96 ± 0.18 × 10⁻⁴ | k7 | 2.18 ± 0.06 × 10⁻⁴ |
| k3 | 2.88 ± 0.09 × 10⁻⁴ | k8 | 3.82 ± 0.11 × 10⁻⁴ |
| k4 | 4.56 ± 0.14 × 10⁻⁴ | k9 | 7.34 ± 0.22 × 10⁻⁴ |
| k5 | 5.97 ± 0.18 × 10⁻⁴ |
Publisher’s Note: MDPI stays neutral with regard to jurisdictional claims in published maps and institutional affiliations. |
© 2022 by the authors. Licensee MDPI, Basel, Switzerland. This article is an open access article distributed under the terms and conditions of the Creative Commons Attribution (CC BY) license (https://creativecommons.org/licenses/by/4.0/).
Share and Cite
Manaenkov, O.; Kislitsa, O.; Ratkevich, E.; Kosivtsov, Y.; Sapunov, V.; Matveeva, V. Hydrolytic Oxidation of Cellobiose Using Catalysts Containing Noble Metals. Reactions 2022, 3, 589-601. https://doi.org/10.3390/reactions3040039
Manaenkov O, Kislitsa O, Ratkevich E, Kosivtsov Y, Sapunov V, Matveeva V. Hydrolytic Oxidation of Cellobiose Using Catalysts Containing Noble Metals. Reactions. 2022; 3(4):589-601. https://doi.org/10.3390/reactions3040039
Chicago/Turabian StyleManaenkov, Oleg, Olga Kislitsa, Ekaterina Ratkevich, Yuriy Kosivtsov, Valentin Sapunov, and Valentina Matveeva. 2022. "Hydrolytic Oxidation of Cellobiose Using Catalysts Containing Noble Metals" Reactions 3, no. 4: 589-601. https://doi.org/10.3390/reactions3040039