
Sewage Sludge Plasma Gasification: Characterization and Experimental Rig Design †

 , , ,
, , ,  ,
,
Abstract
1. Introduction
2. Materials and Methods
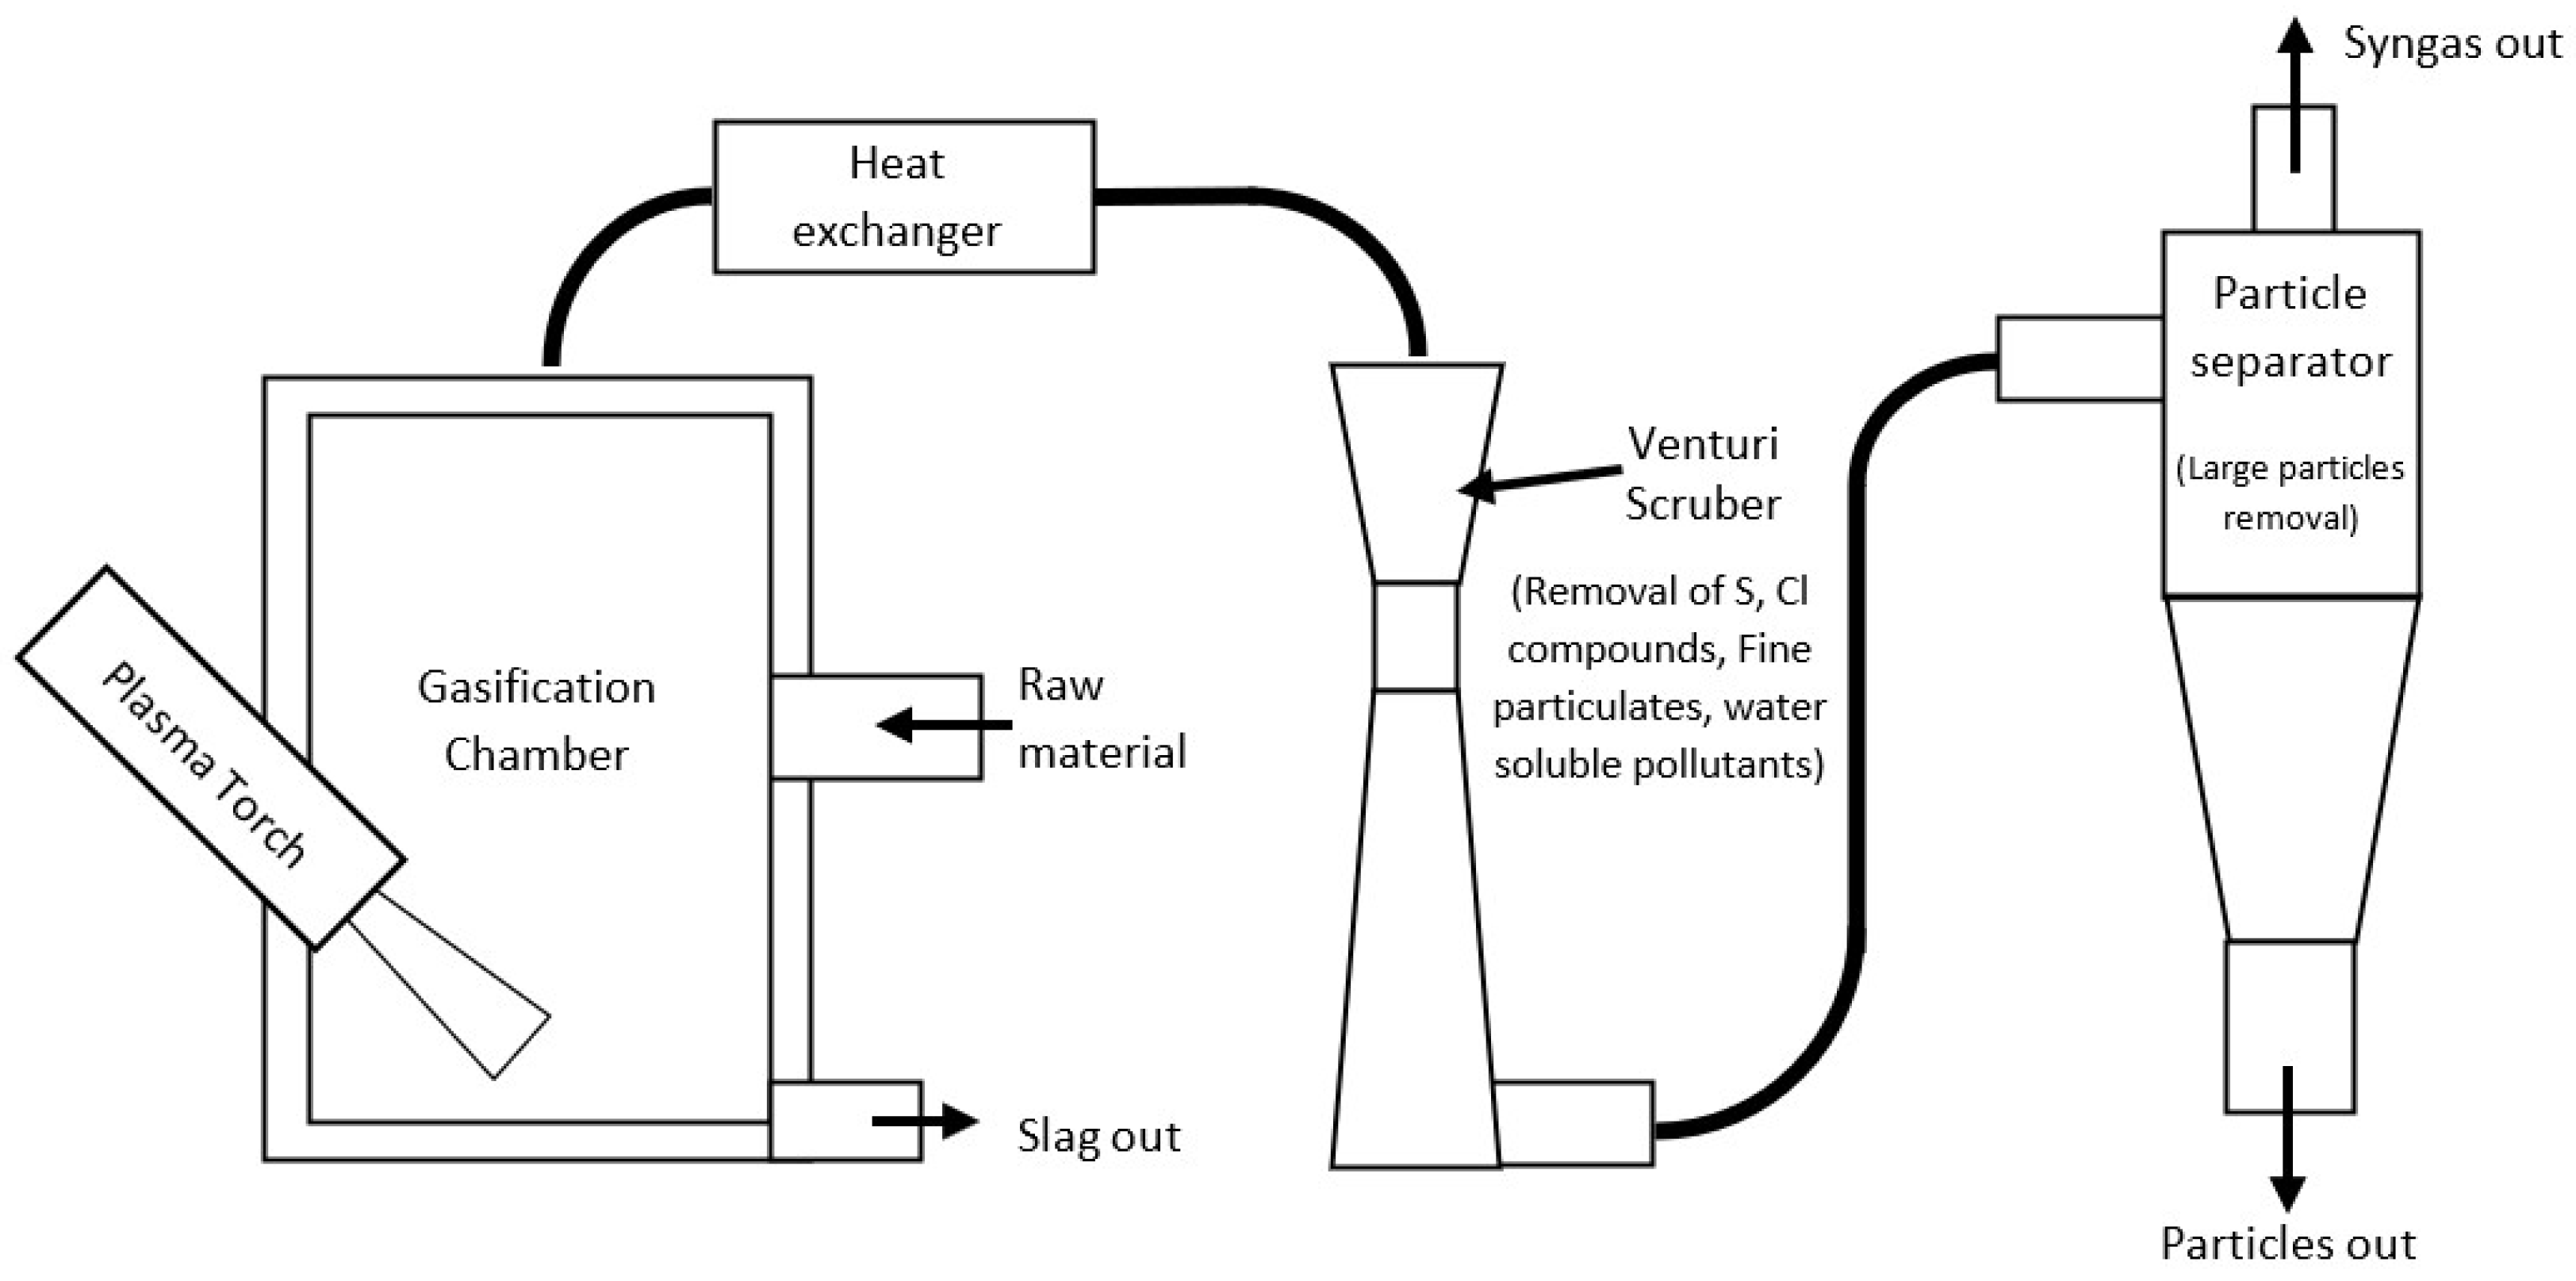
2.1. Experimental Setup
2.2. Sewage Sludge Characterization
2.2.1. Physicochemical Characterization
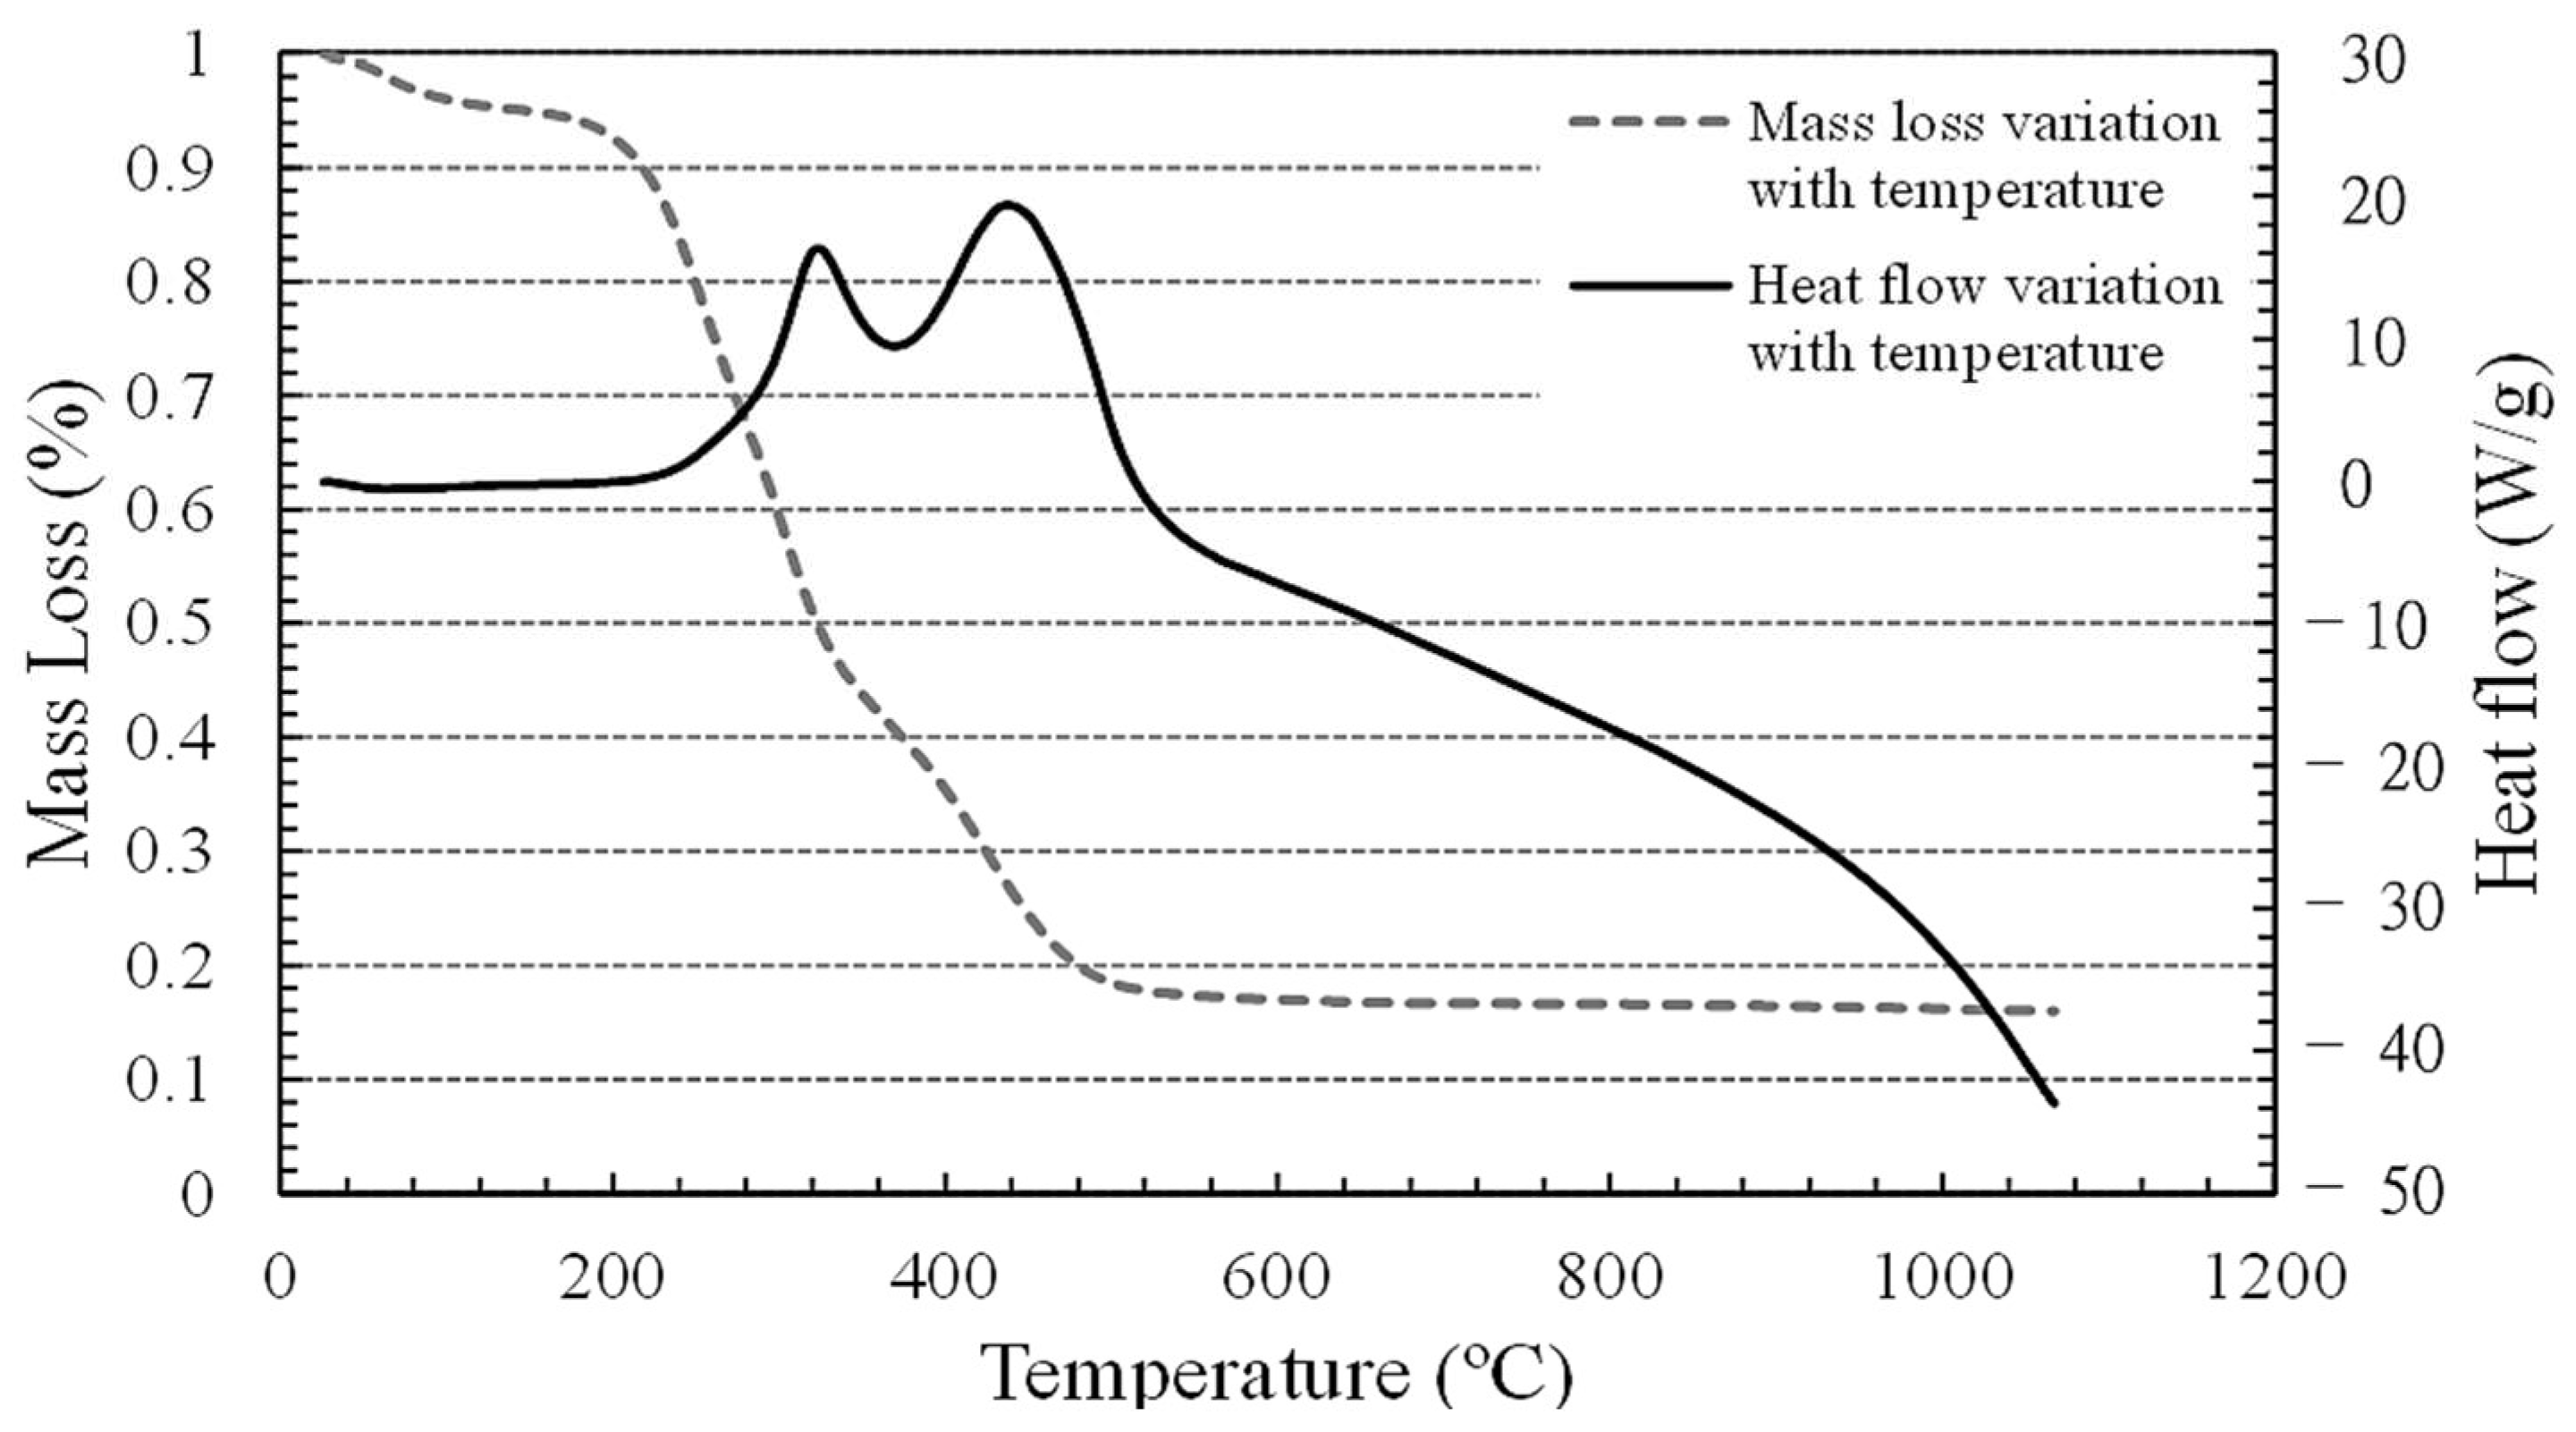
2.2.2. Thermogravimetric Analysis
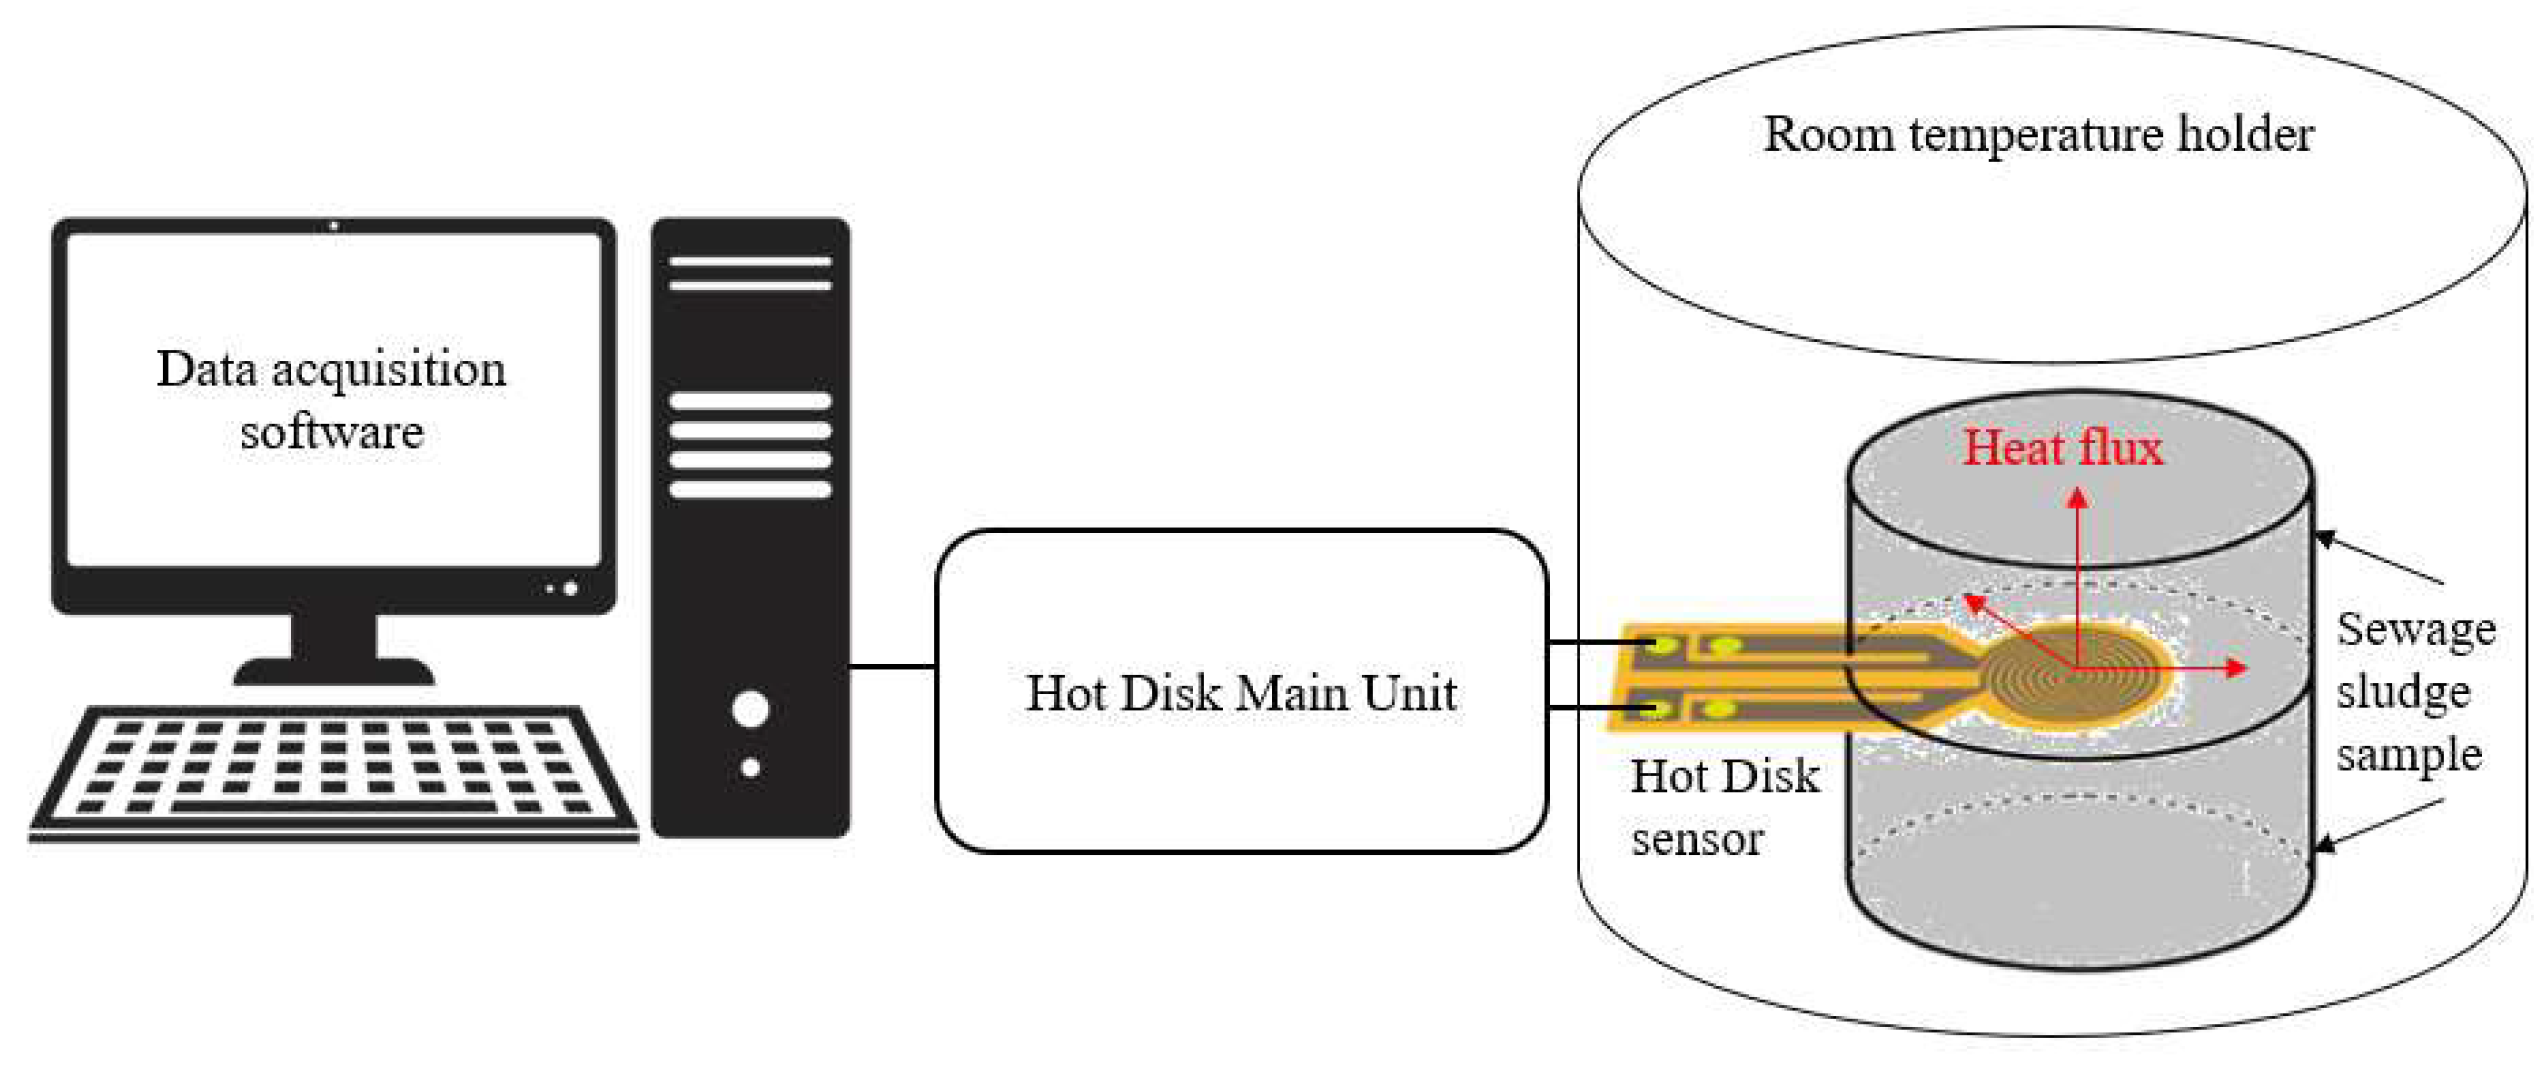
2.2.3. Thermal Properties
2.3. Sewage Sludge Ashes Characterization
2.3.1. Chemical Composition
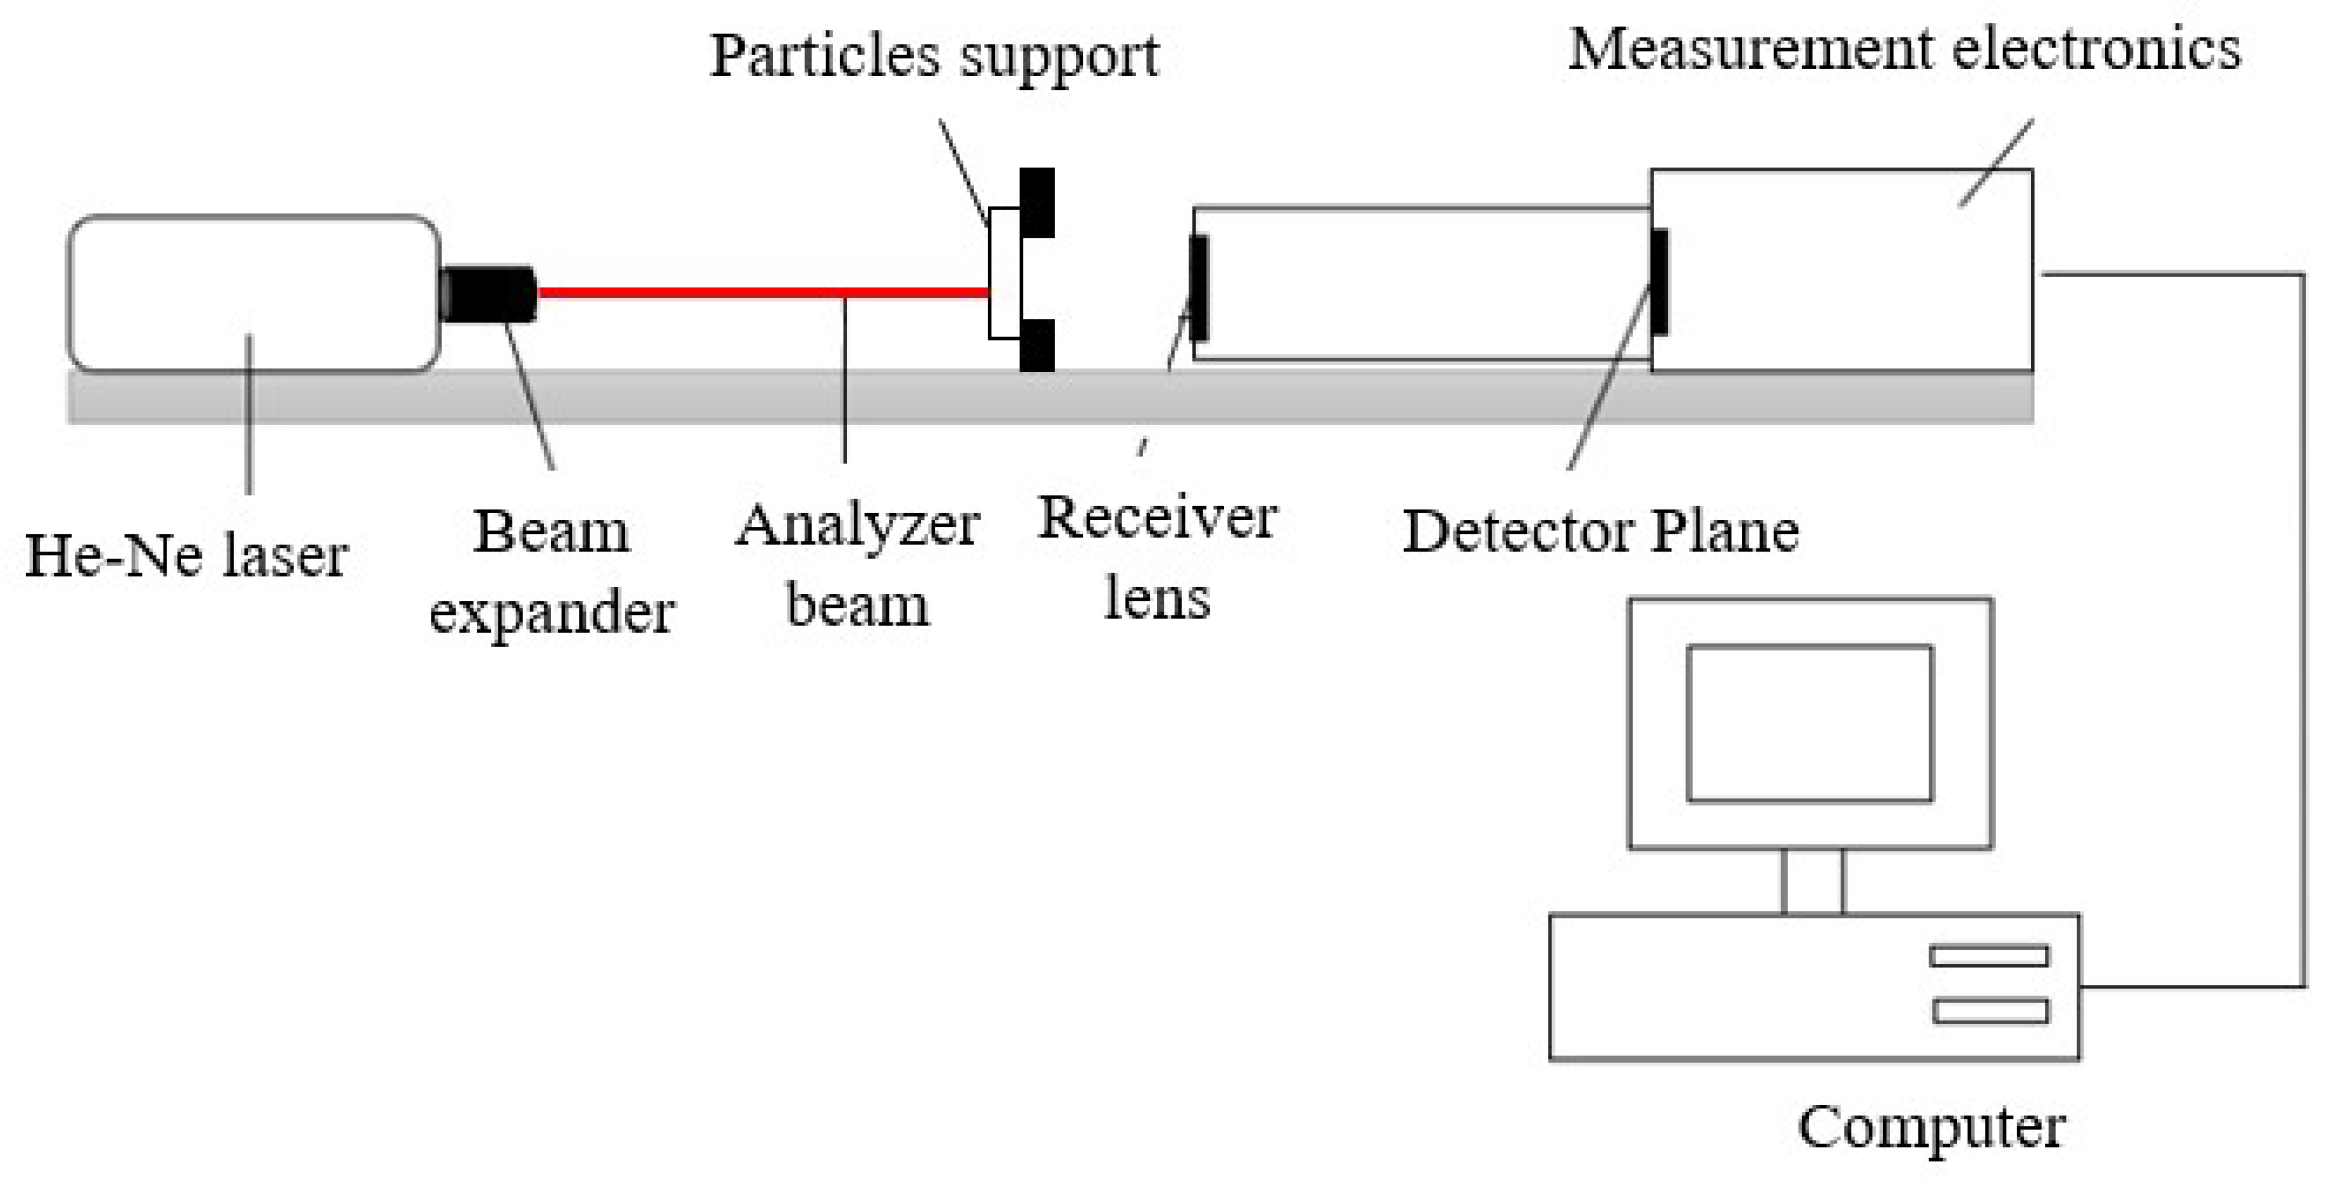
2.3.2. Particles Diameter
2.3.3. Fusibility Evaluation
2.4. System Design
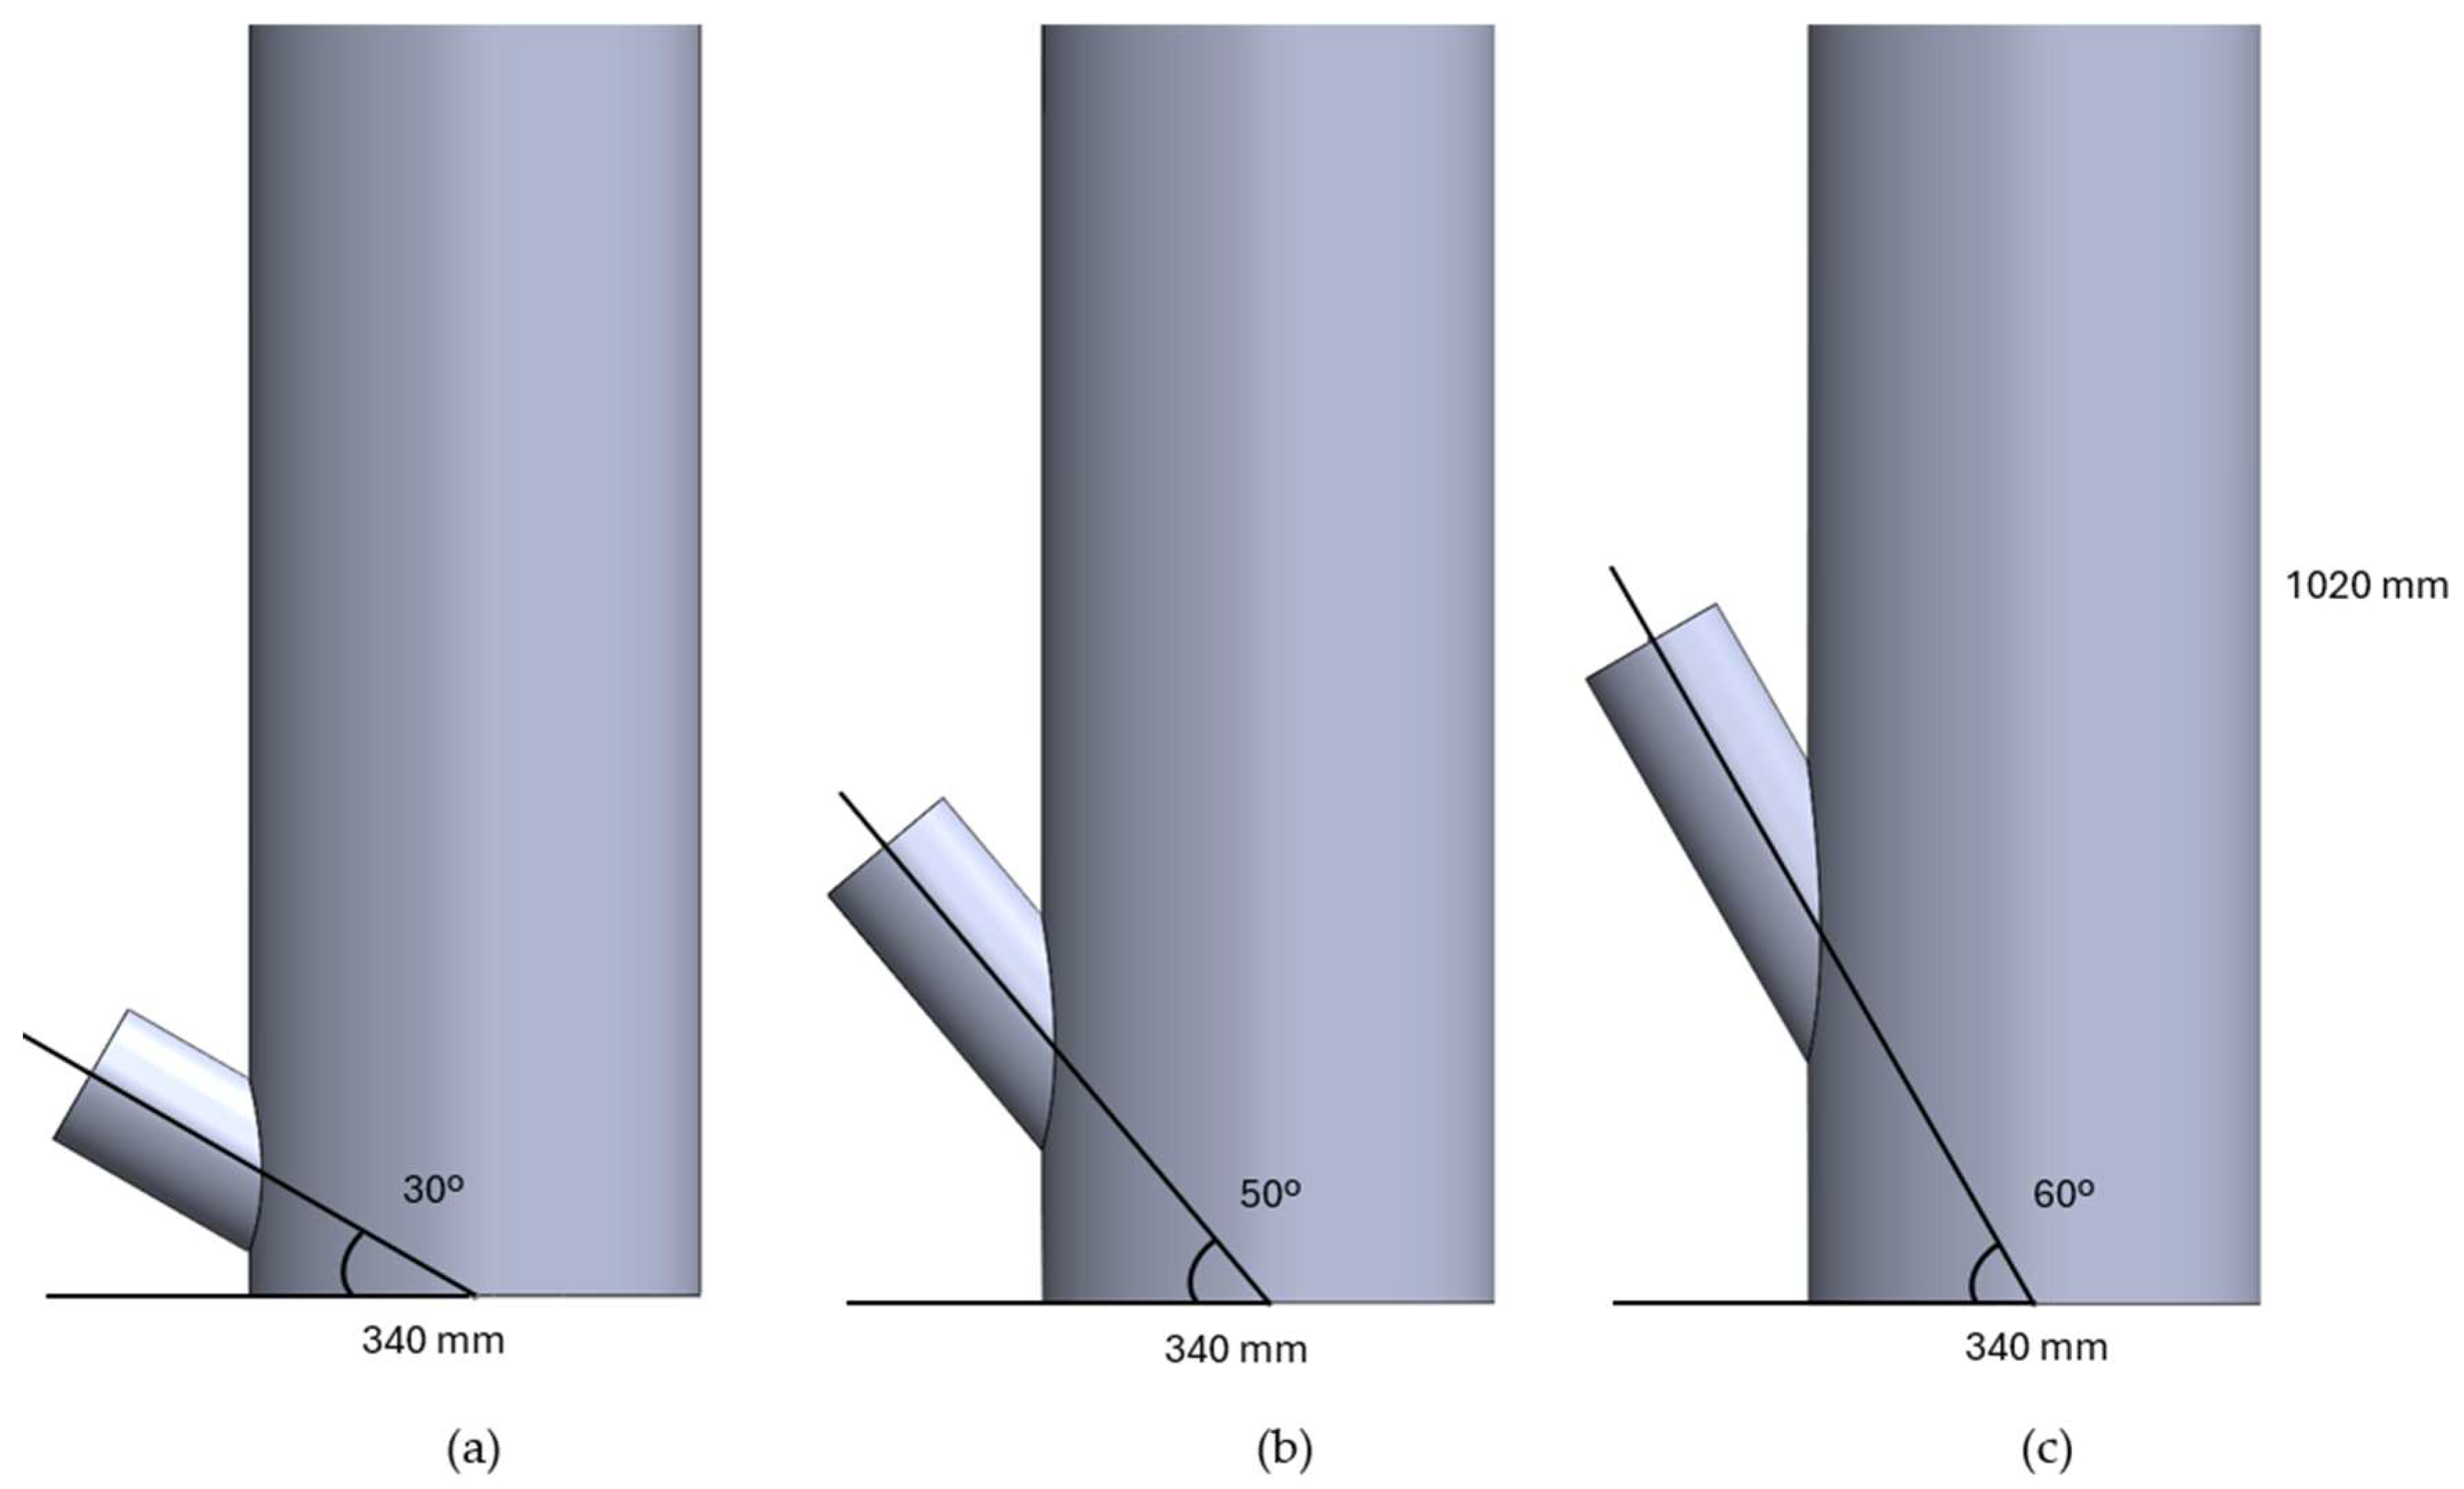
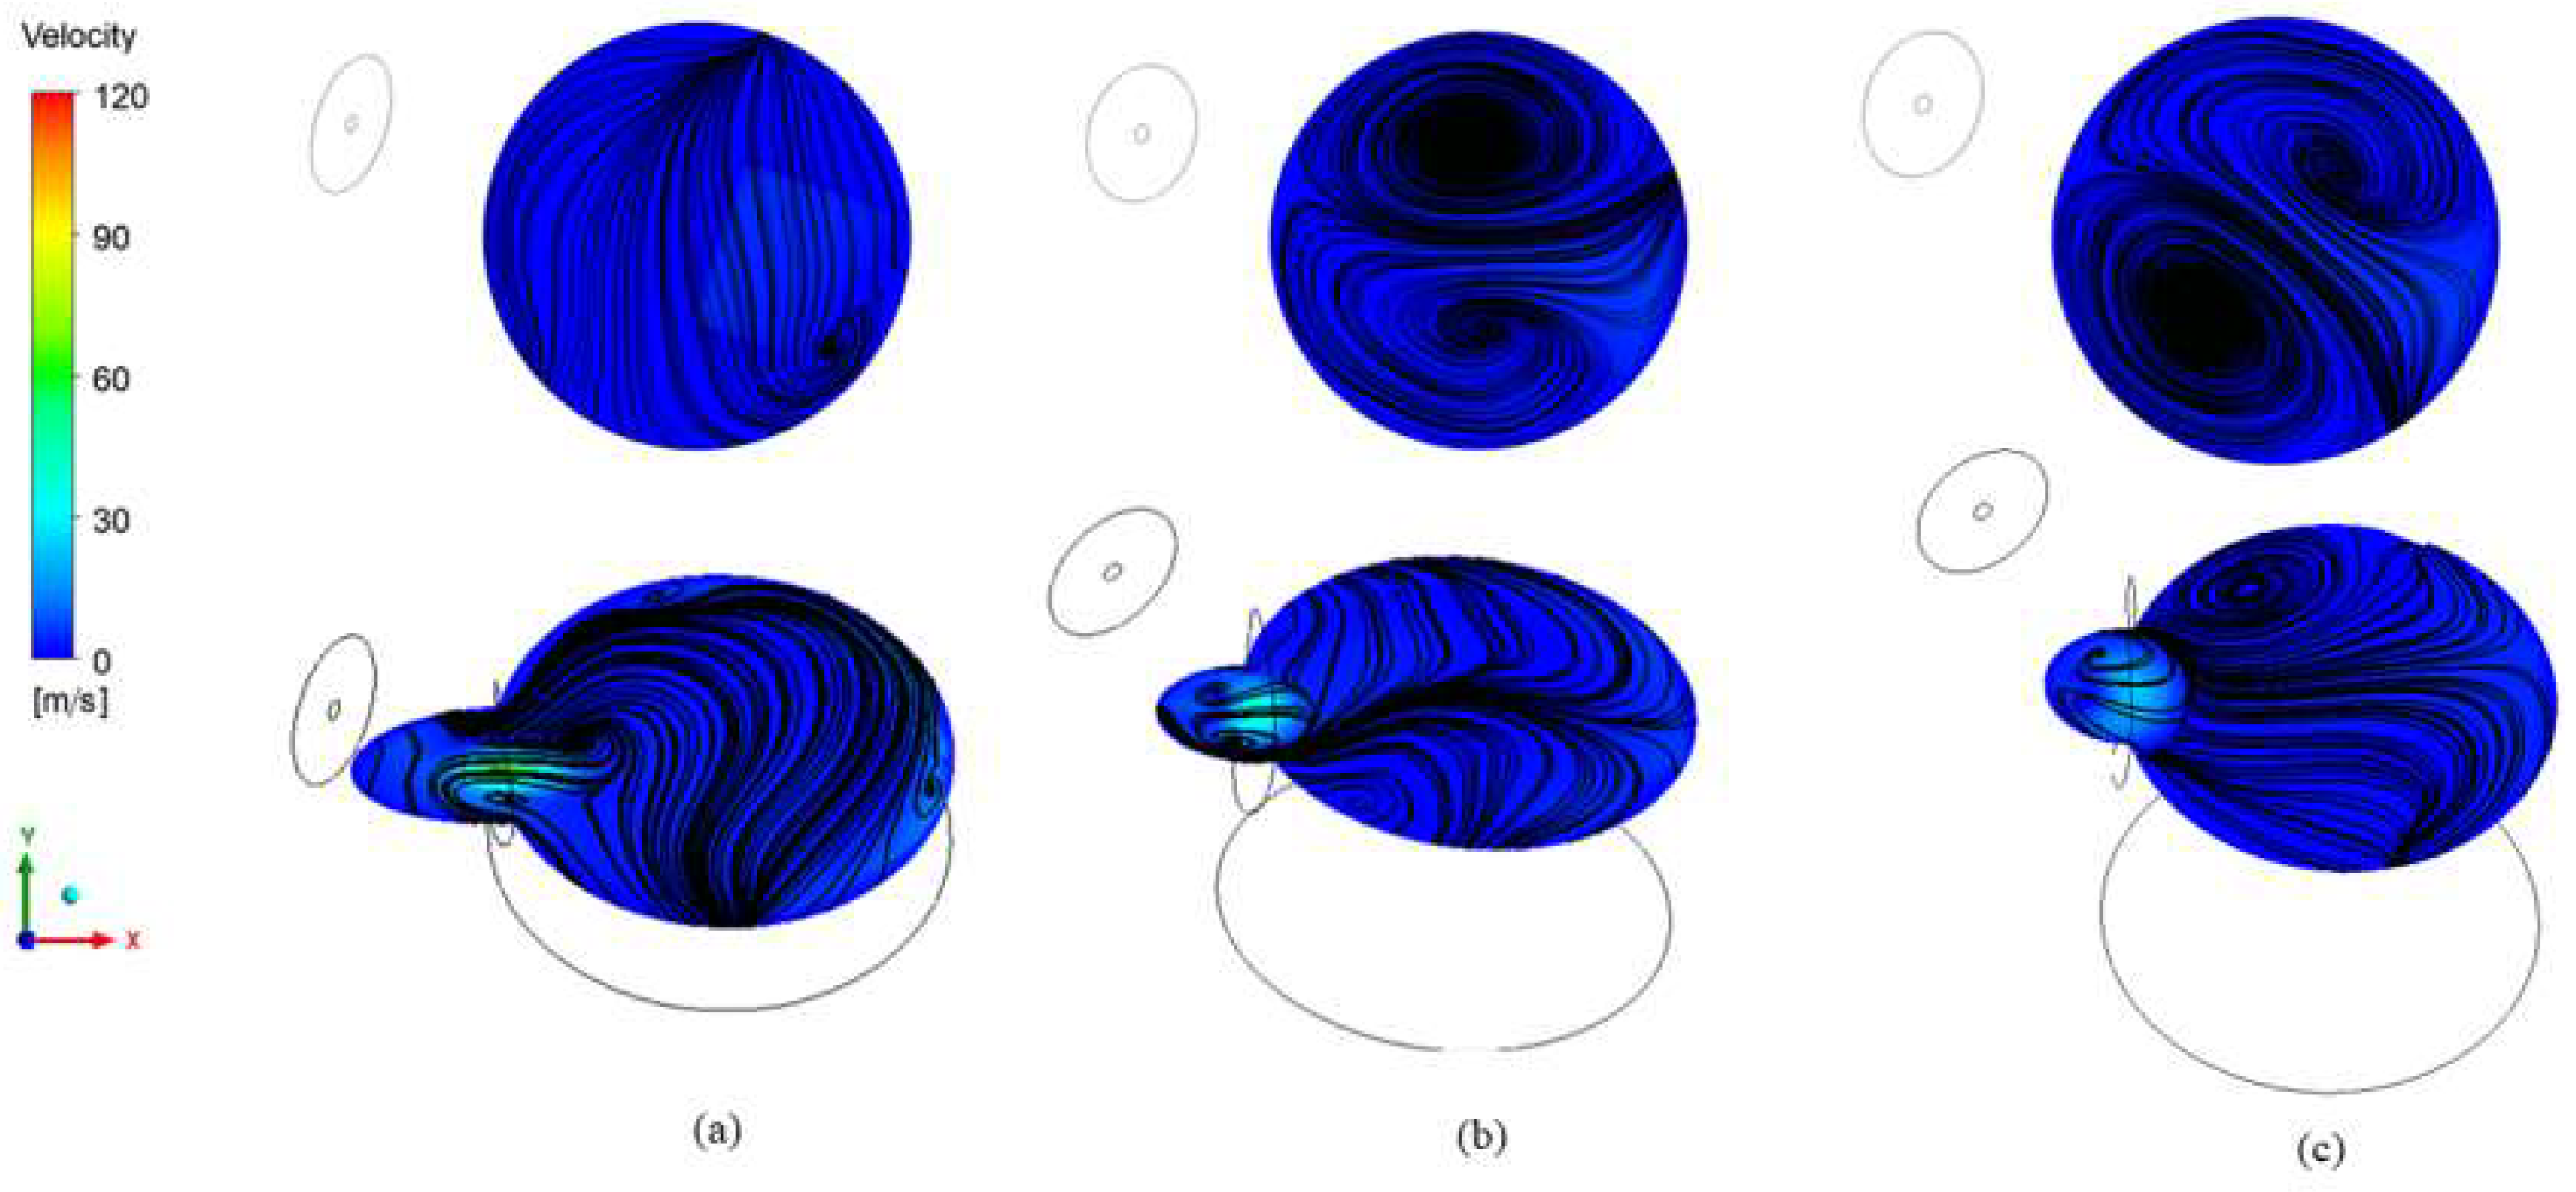
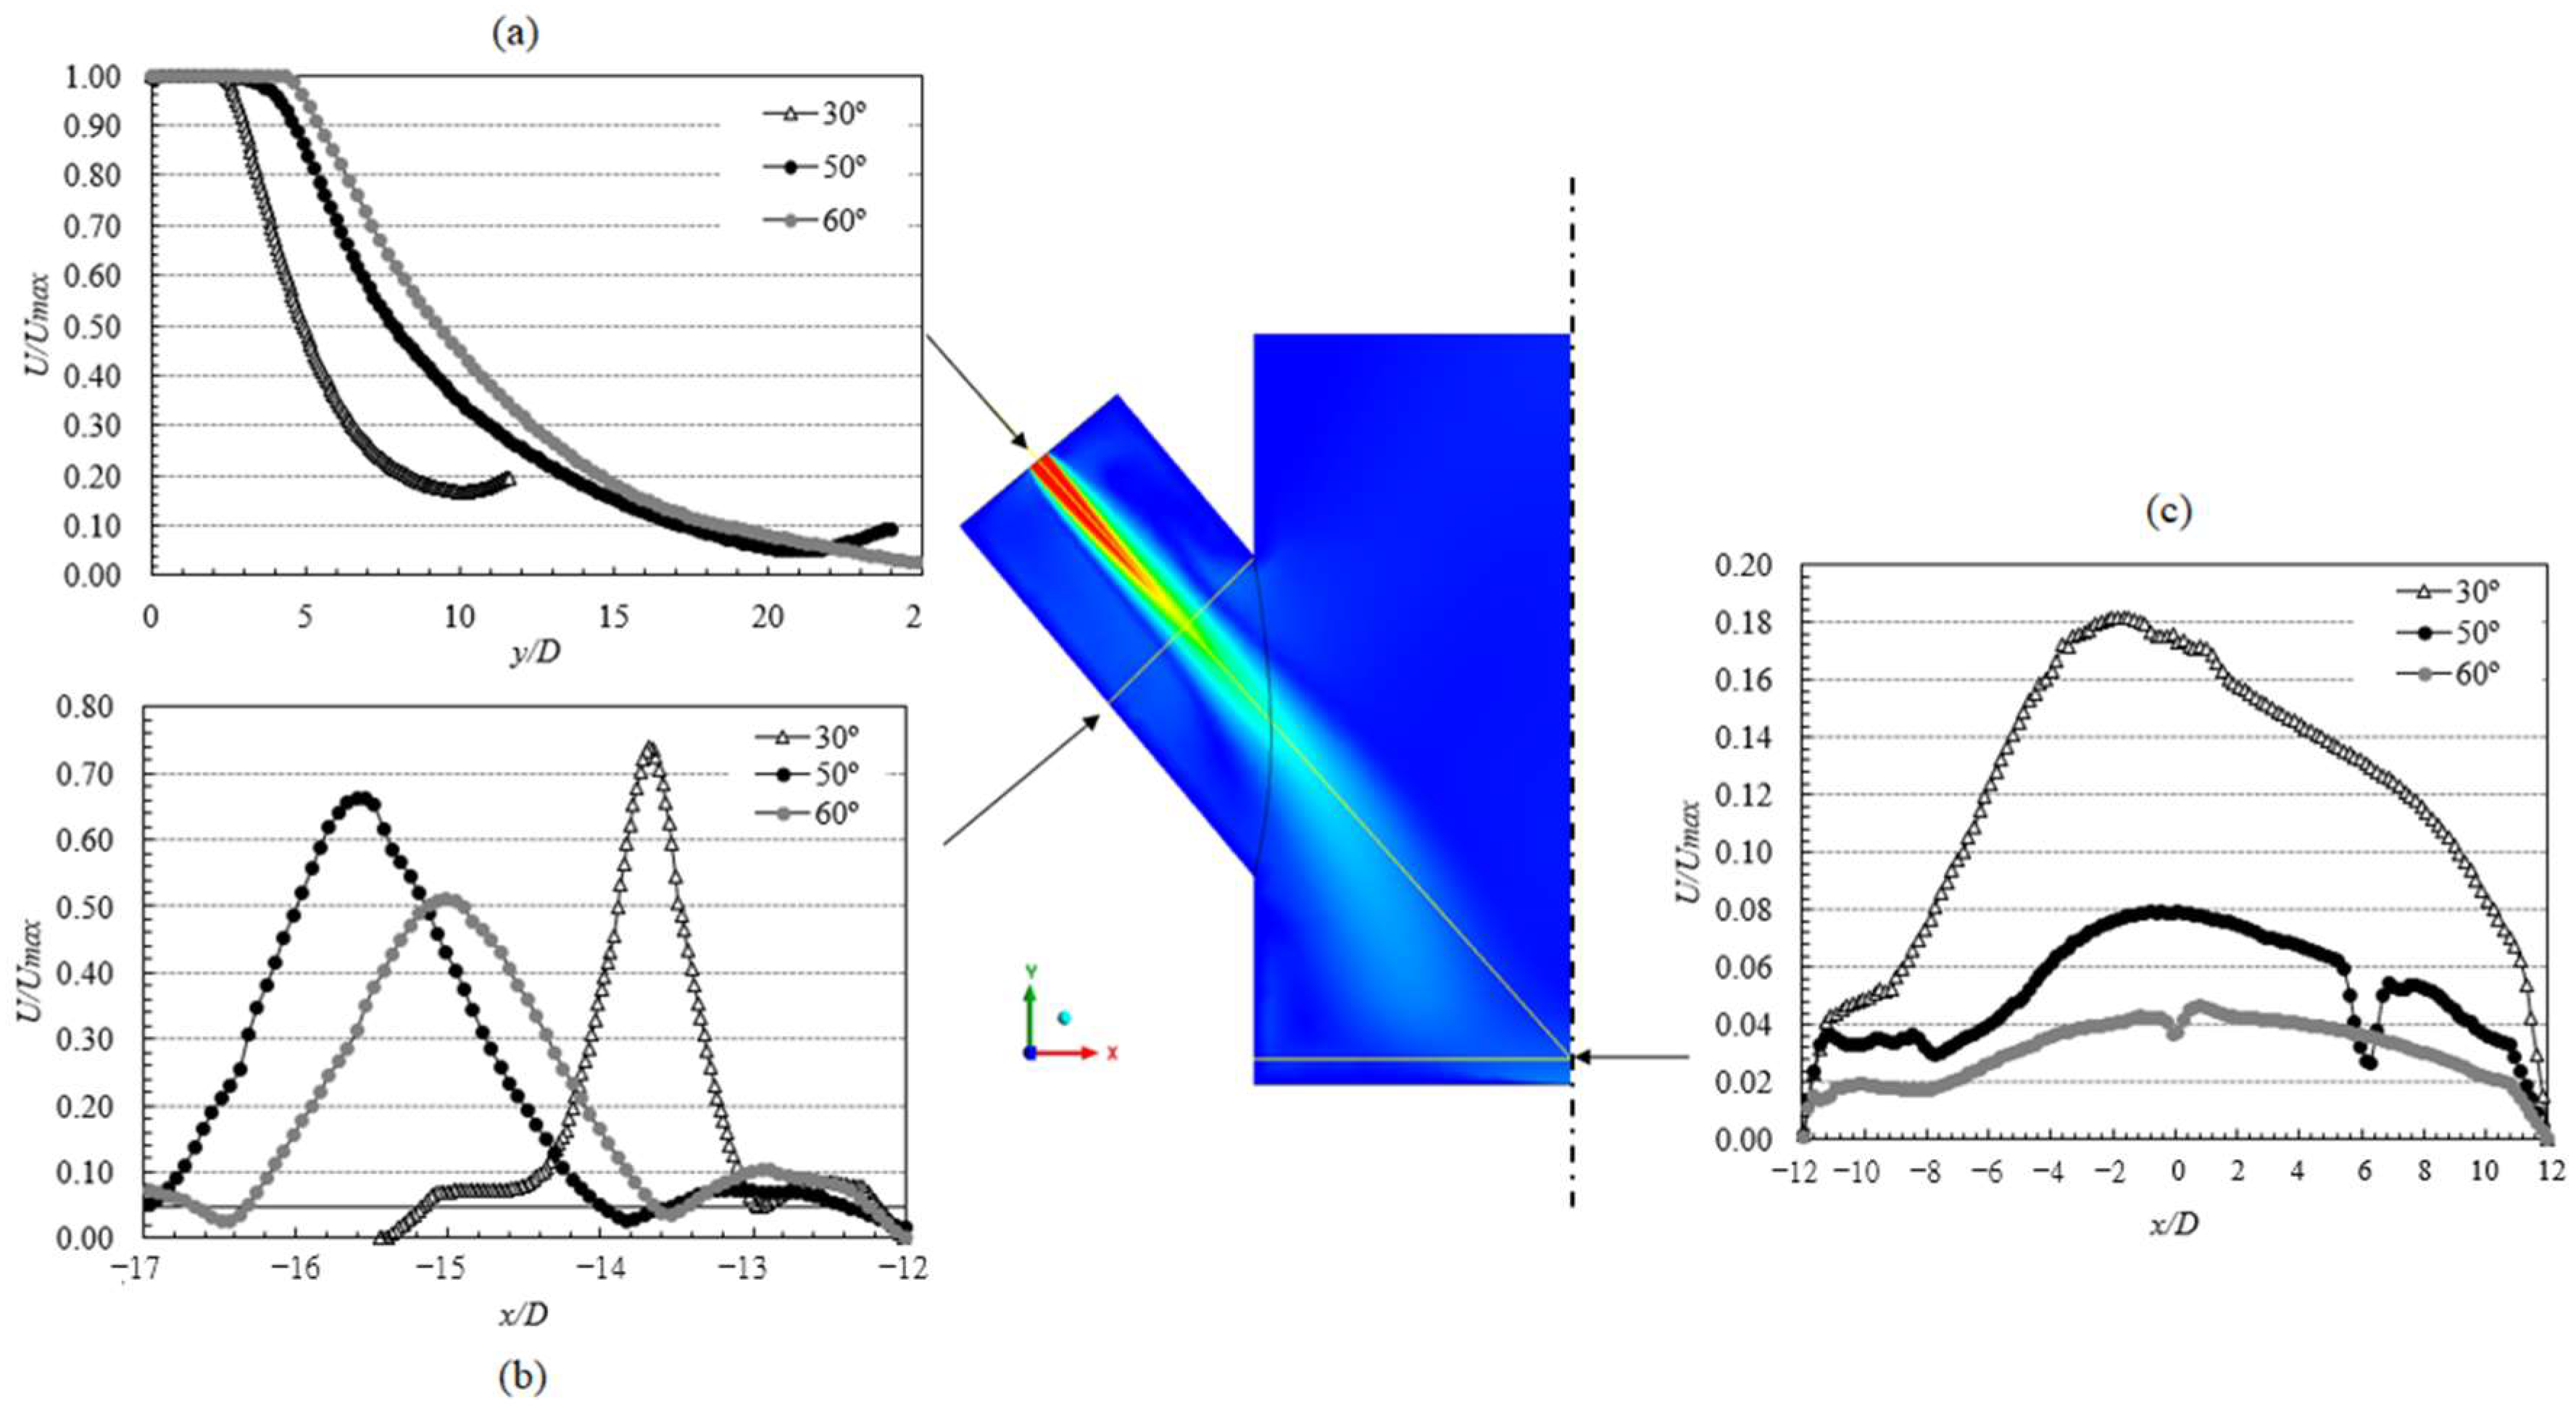
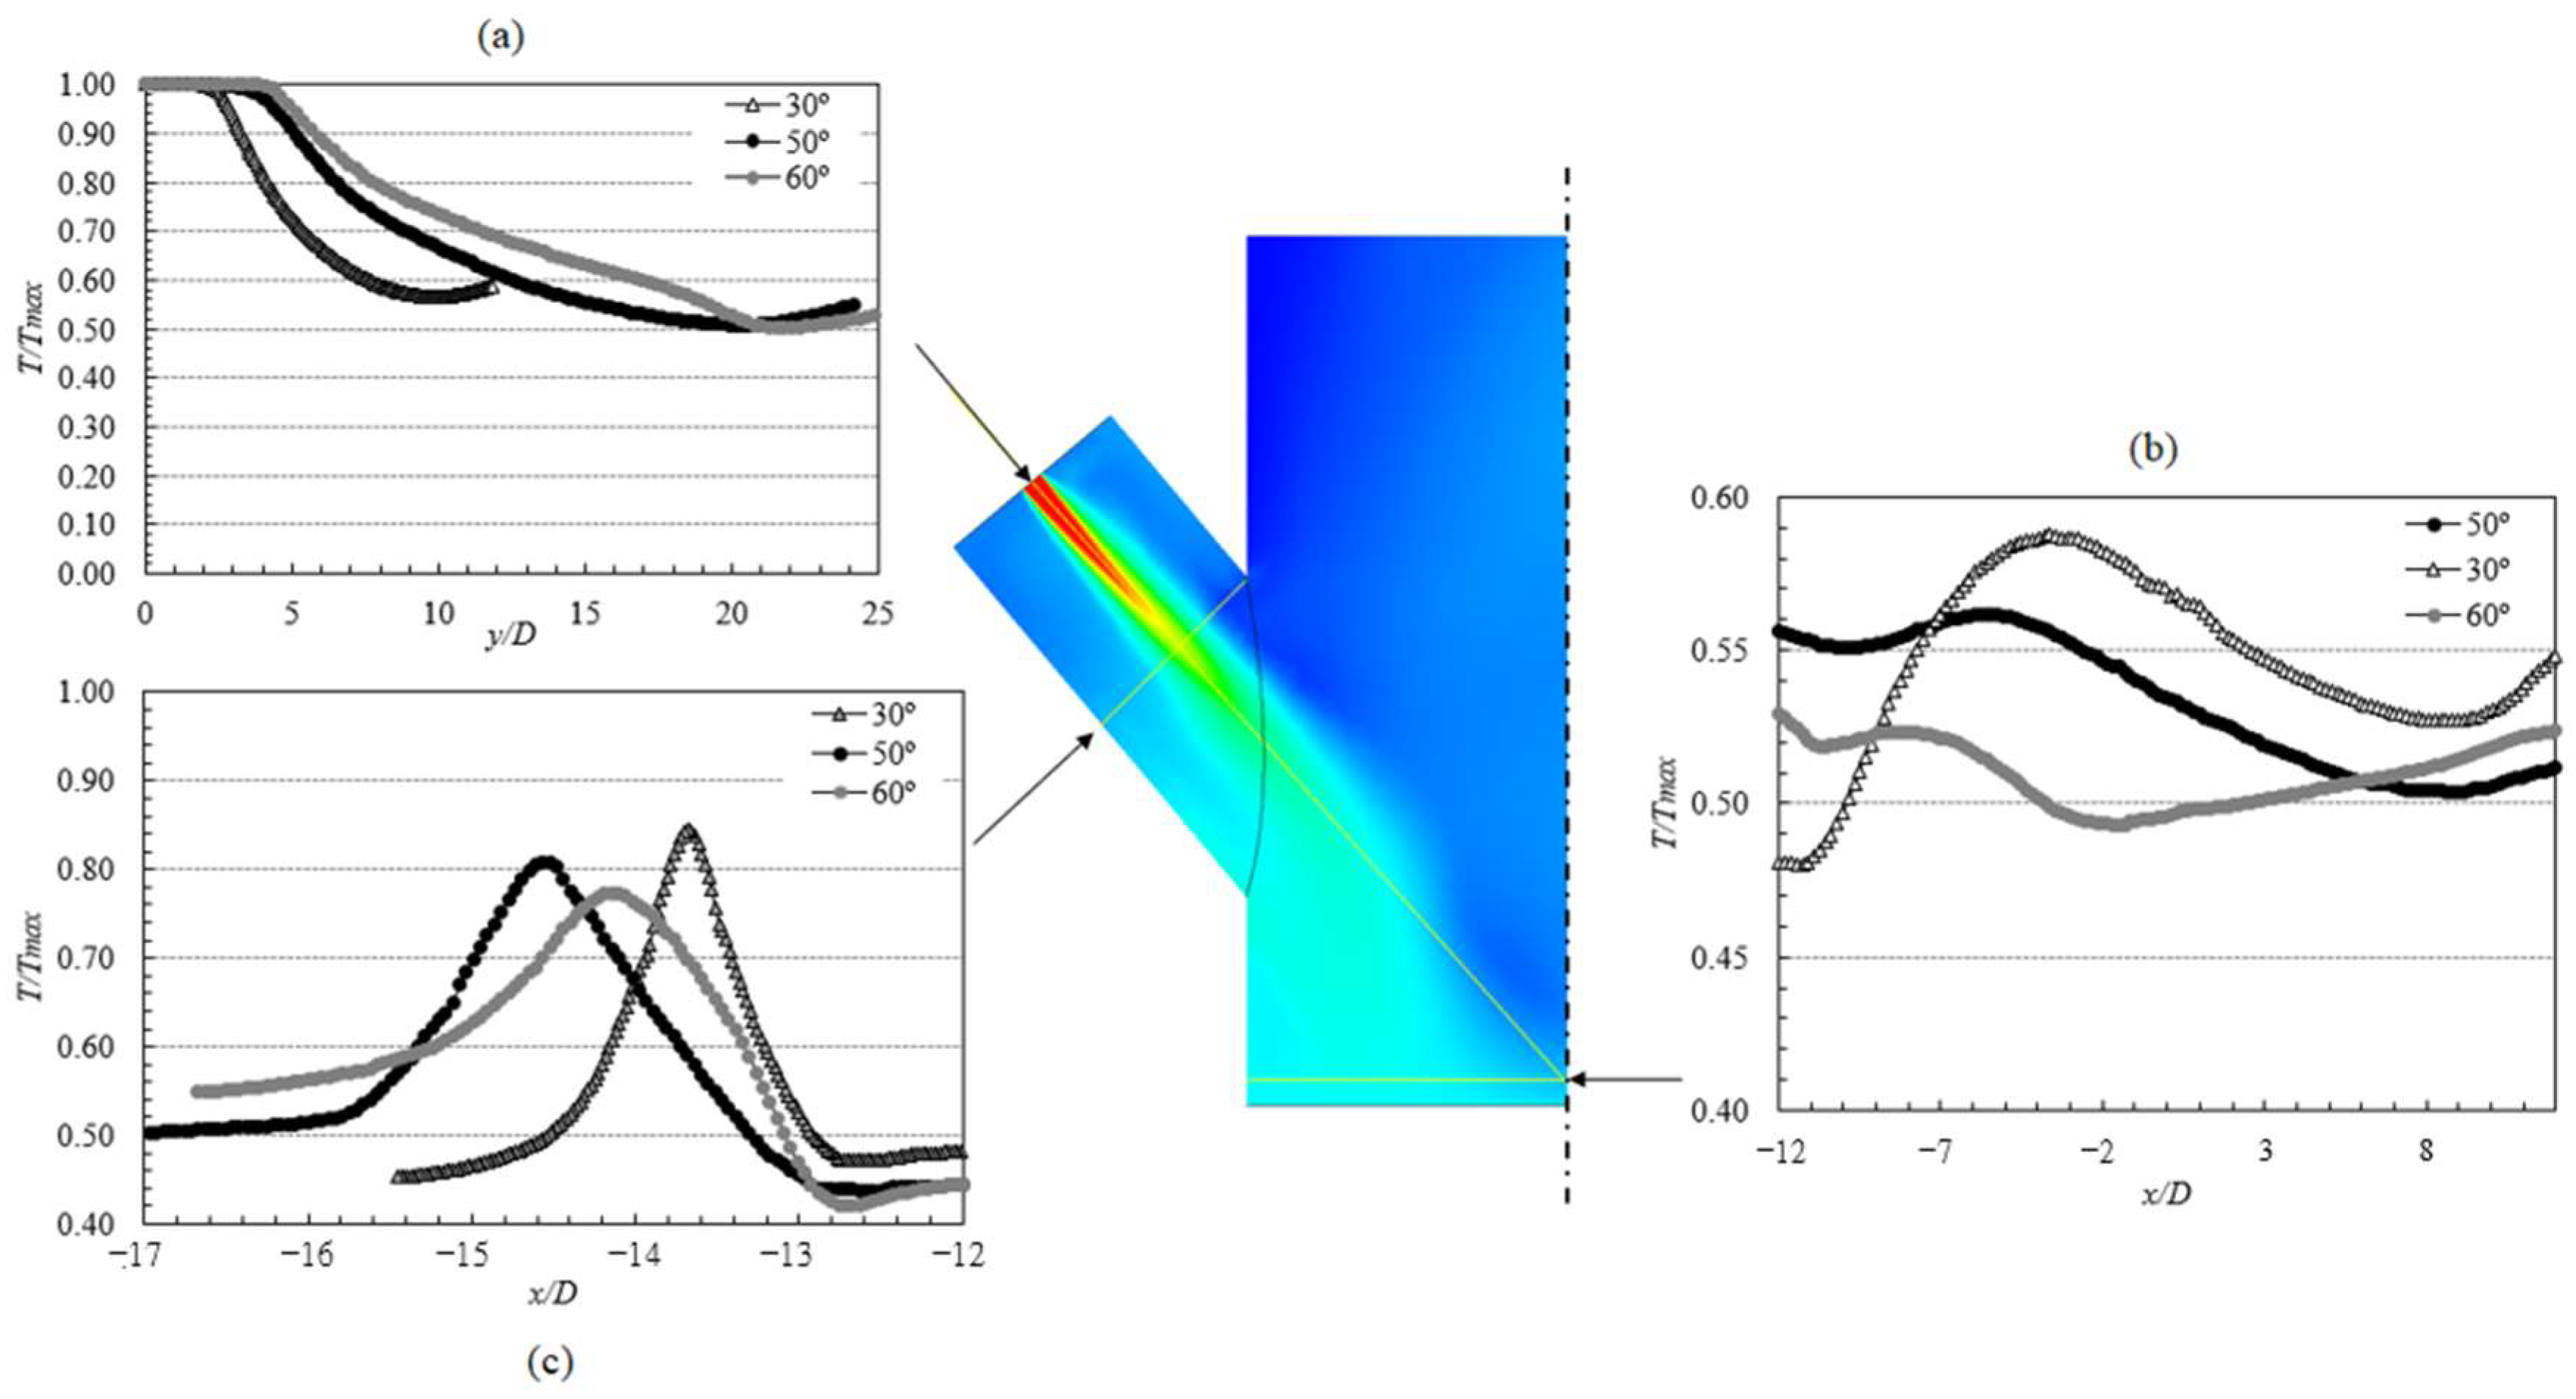
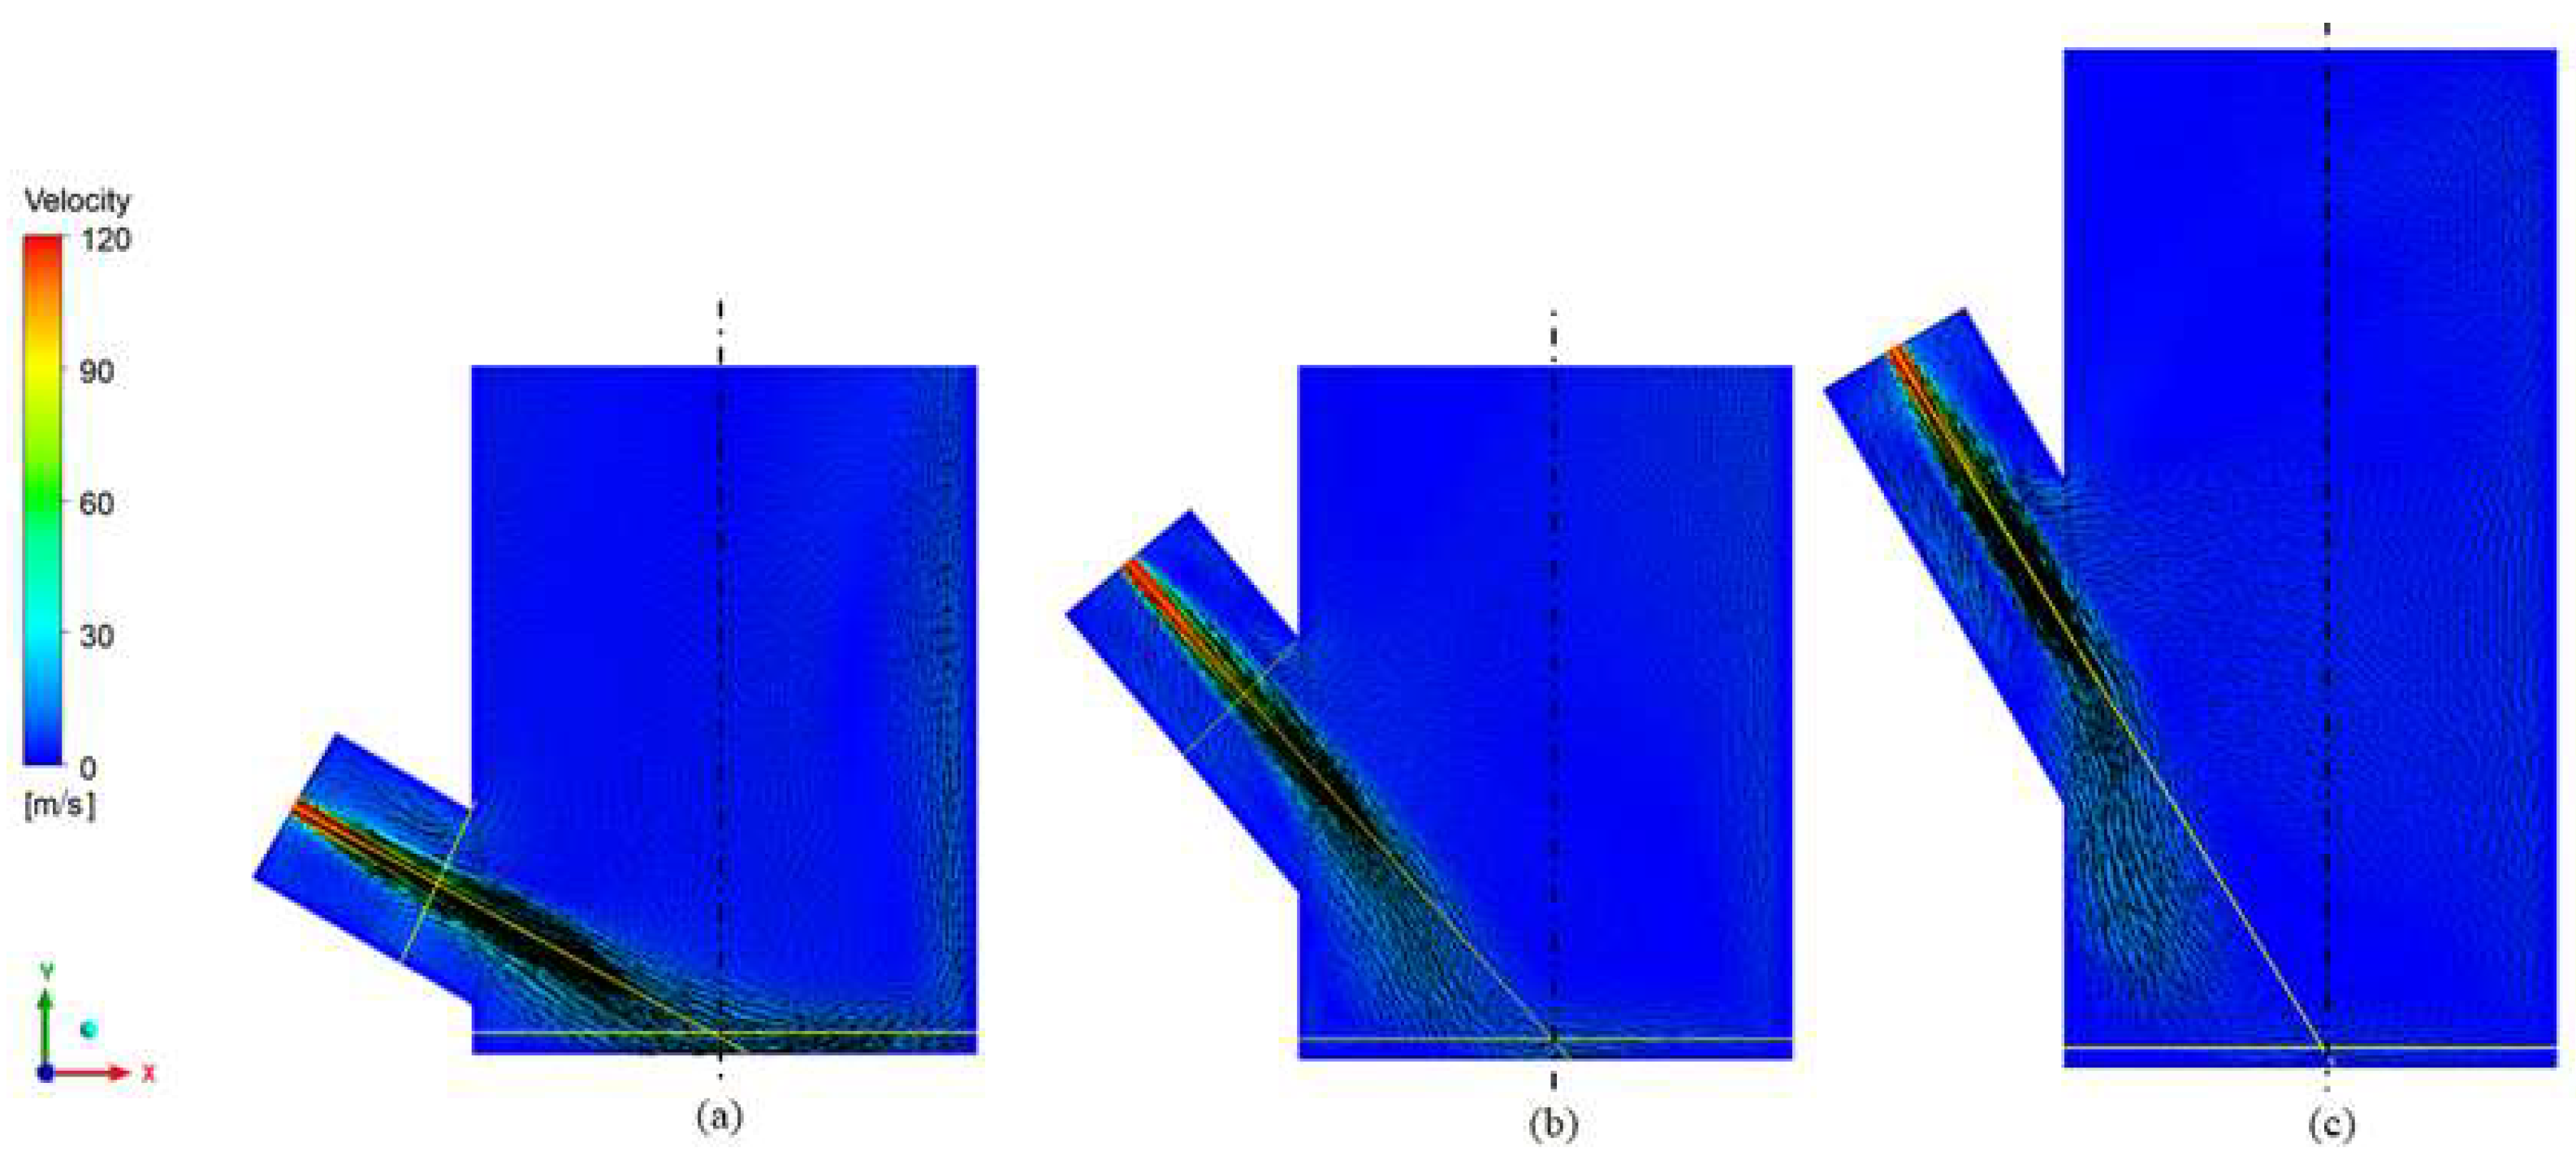
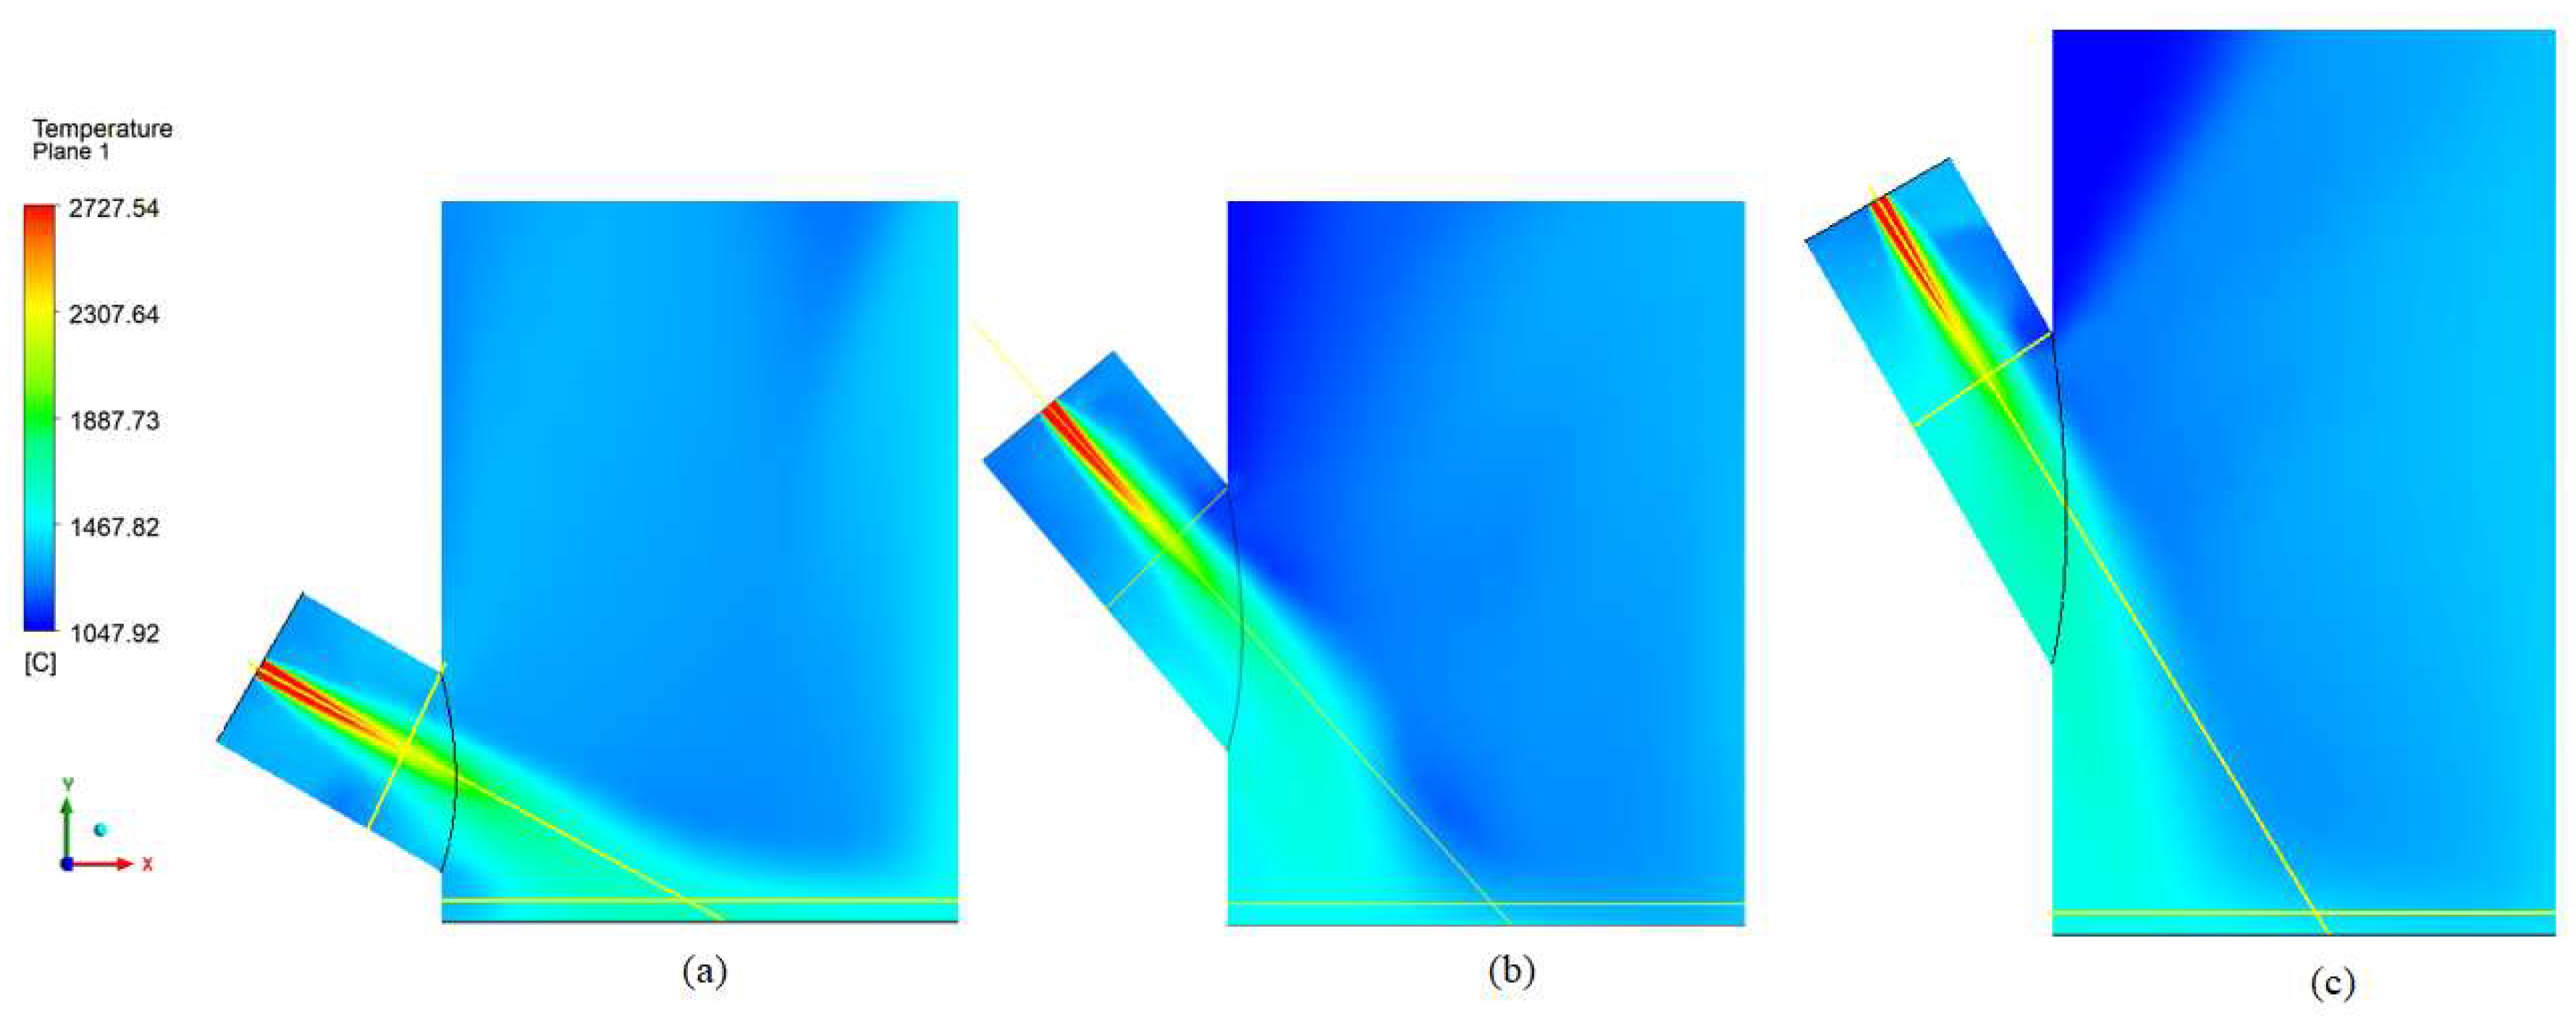
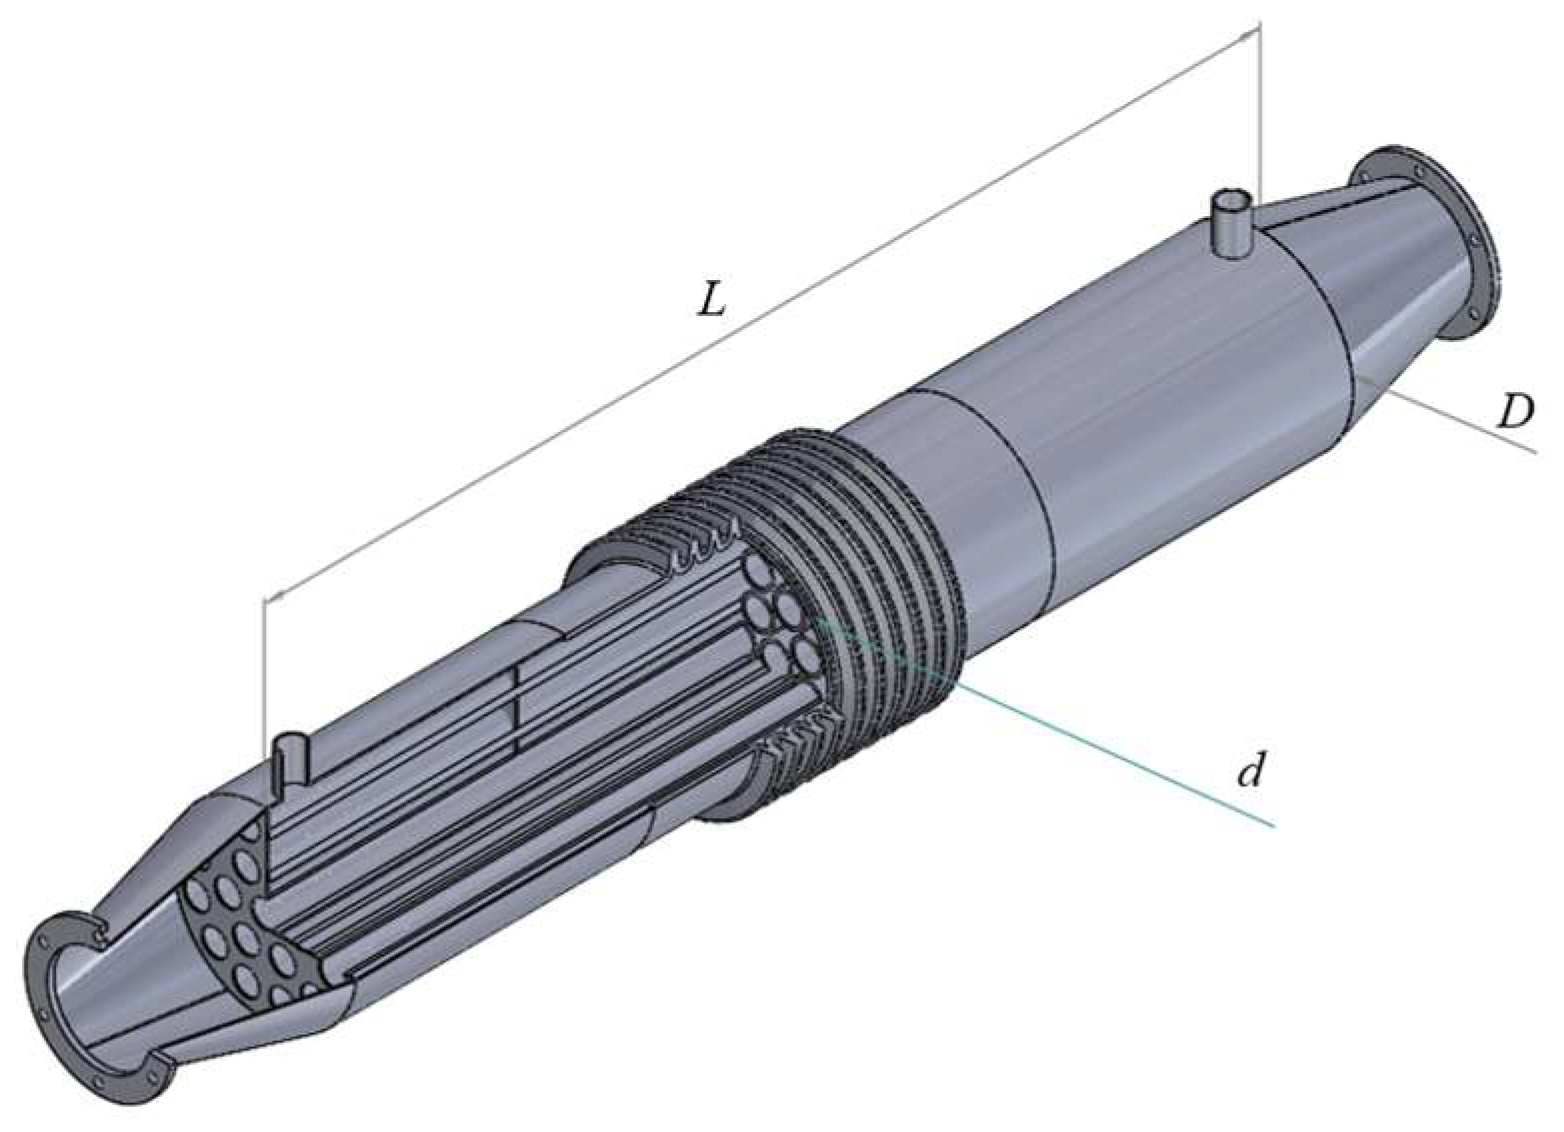
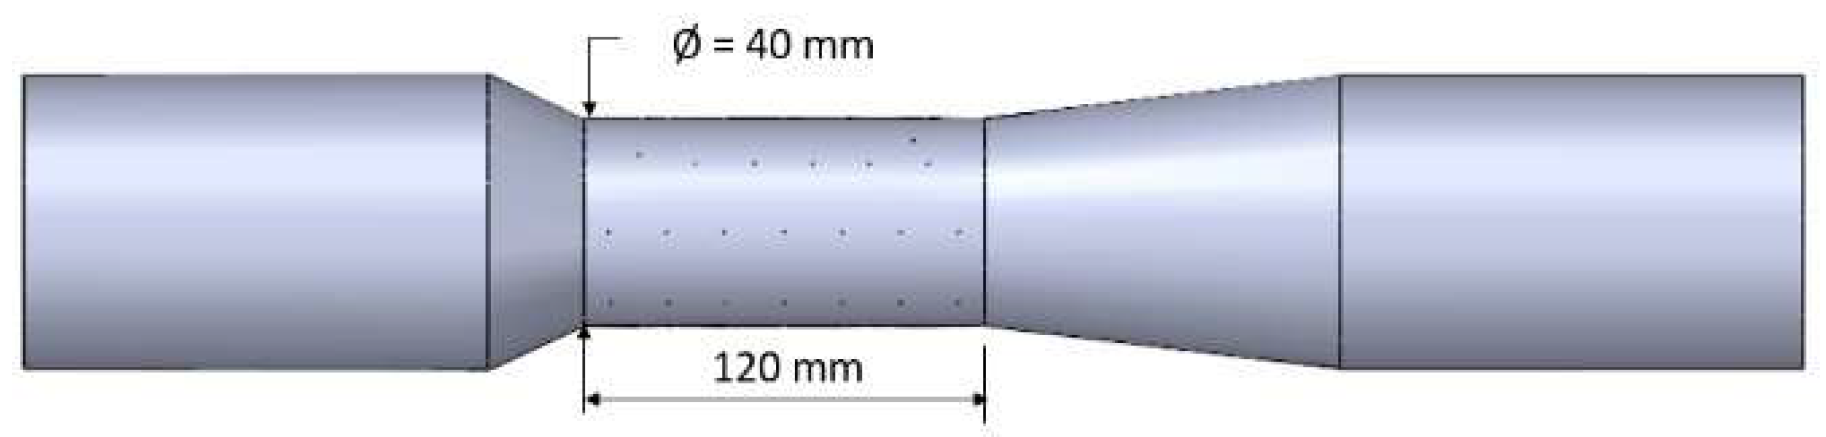
2.4.1. Reactor
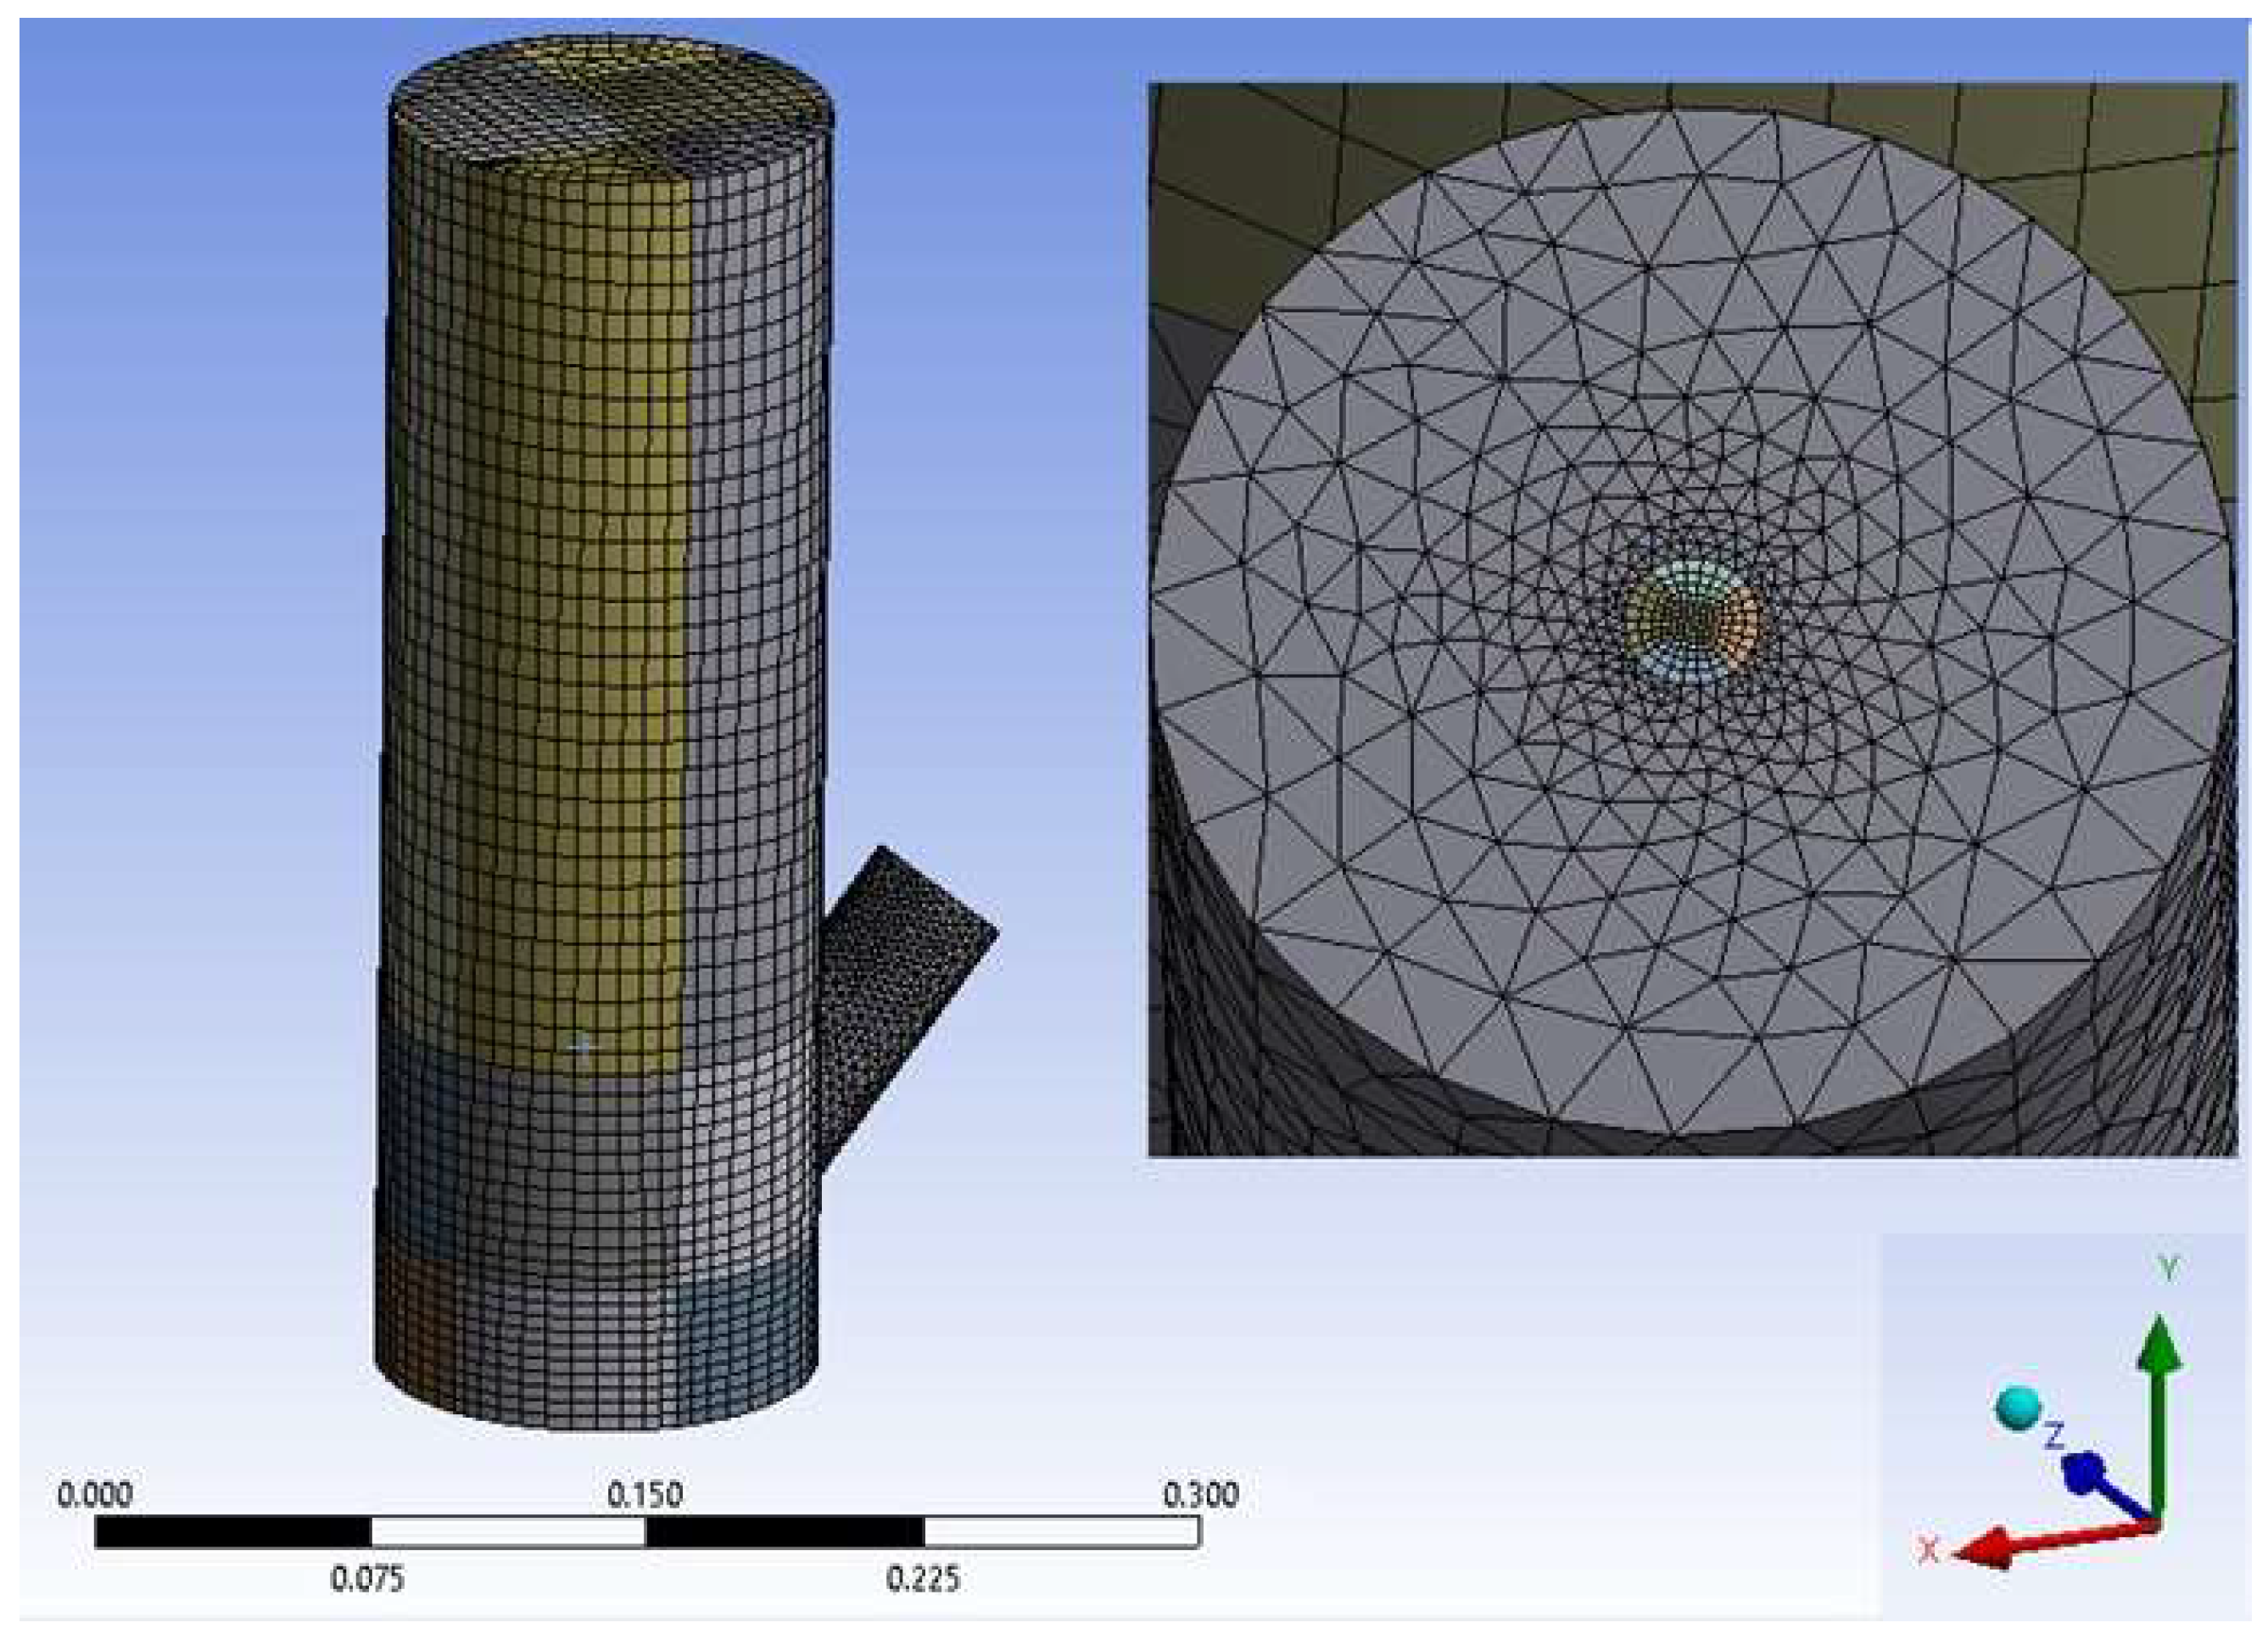
Simulation Domain and Meshing
Governing Equations
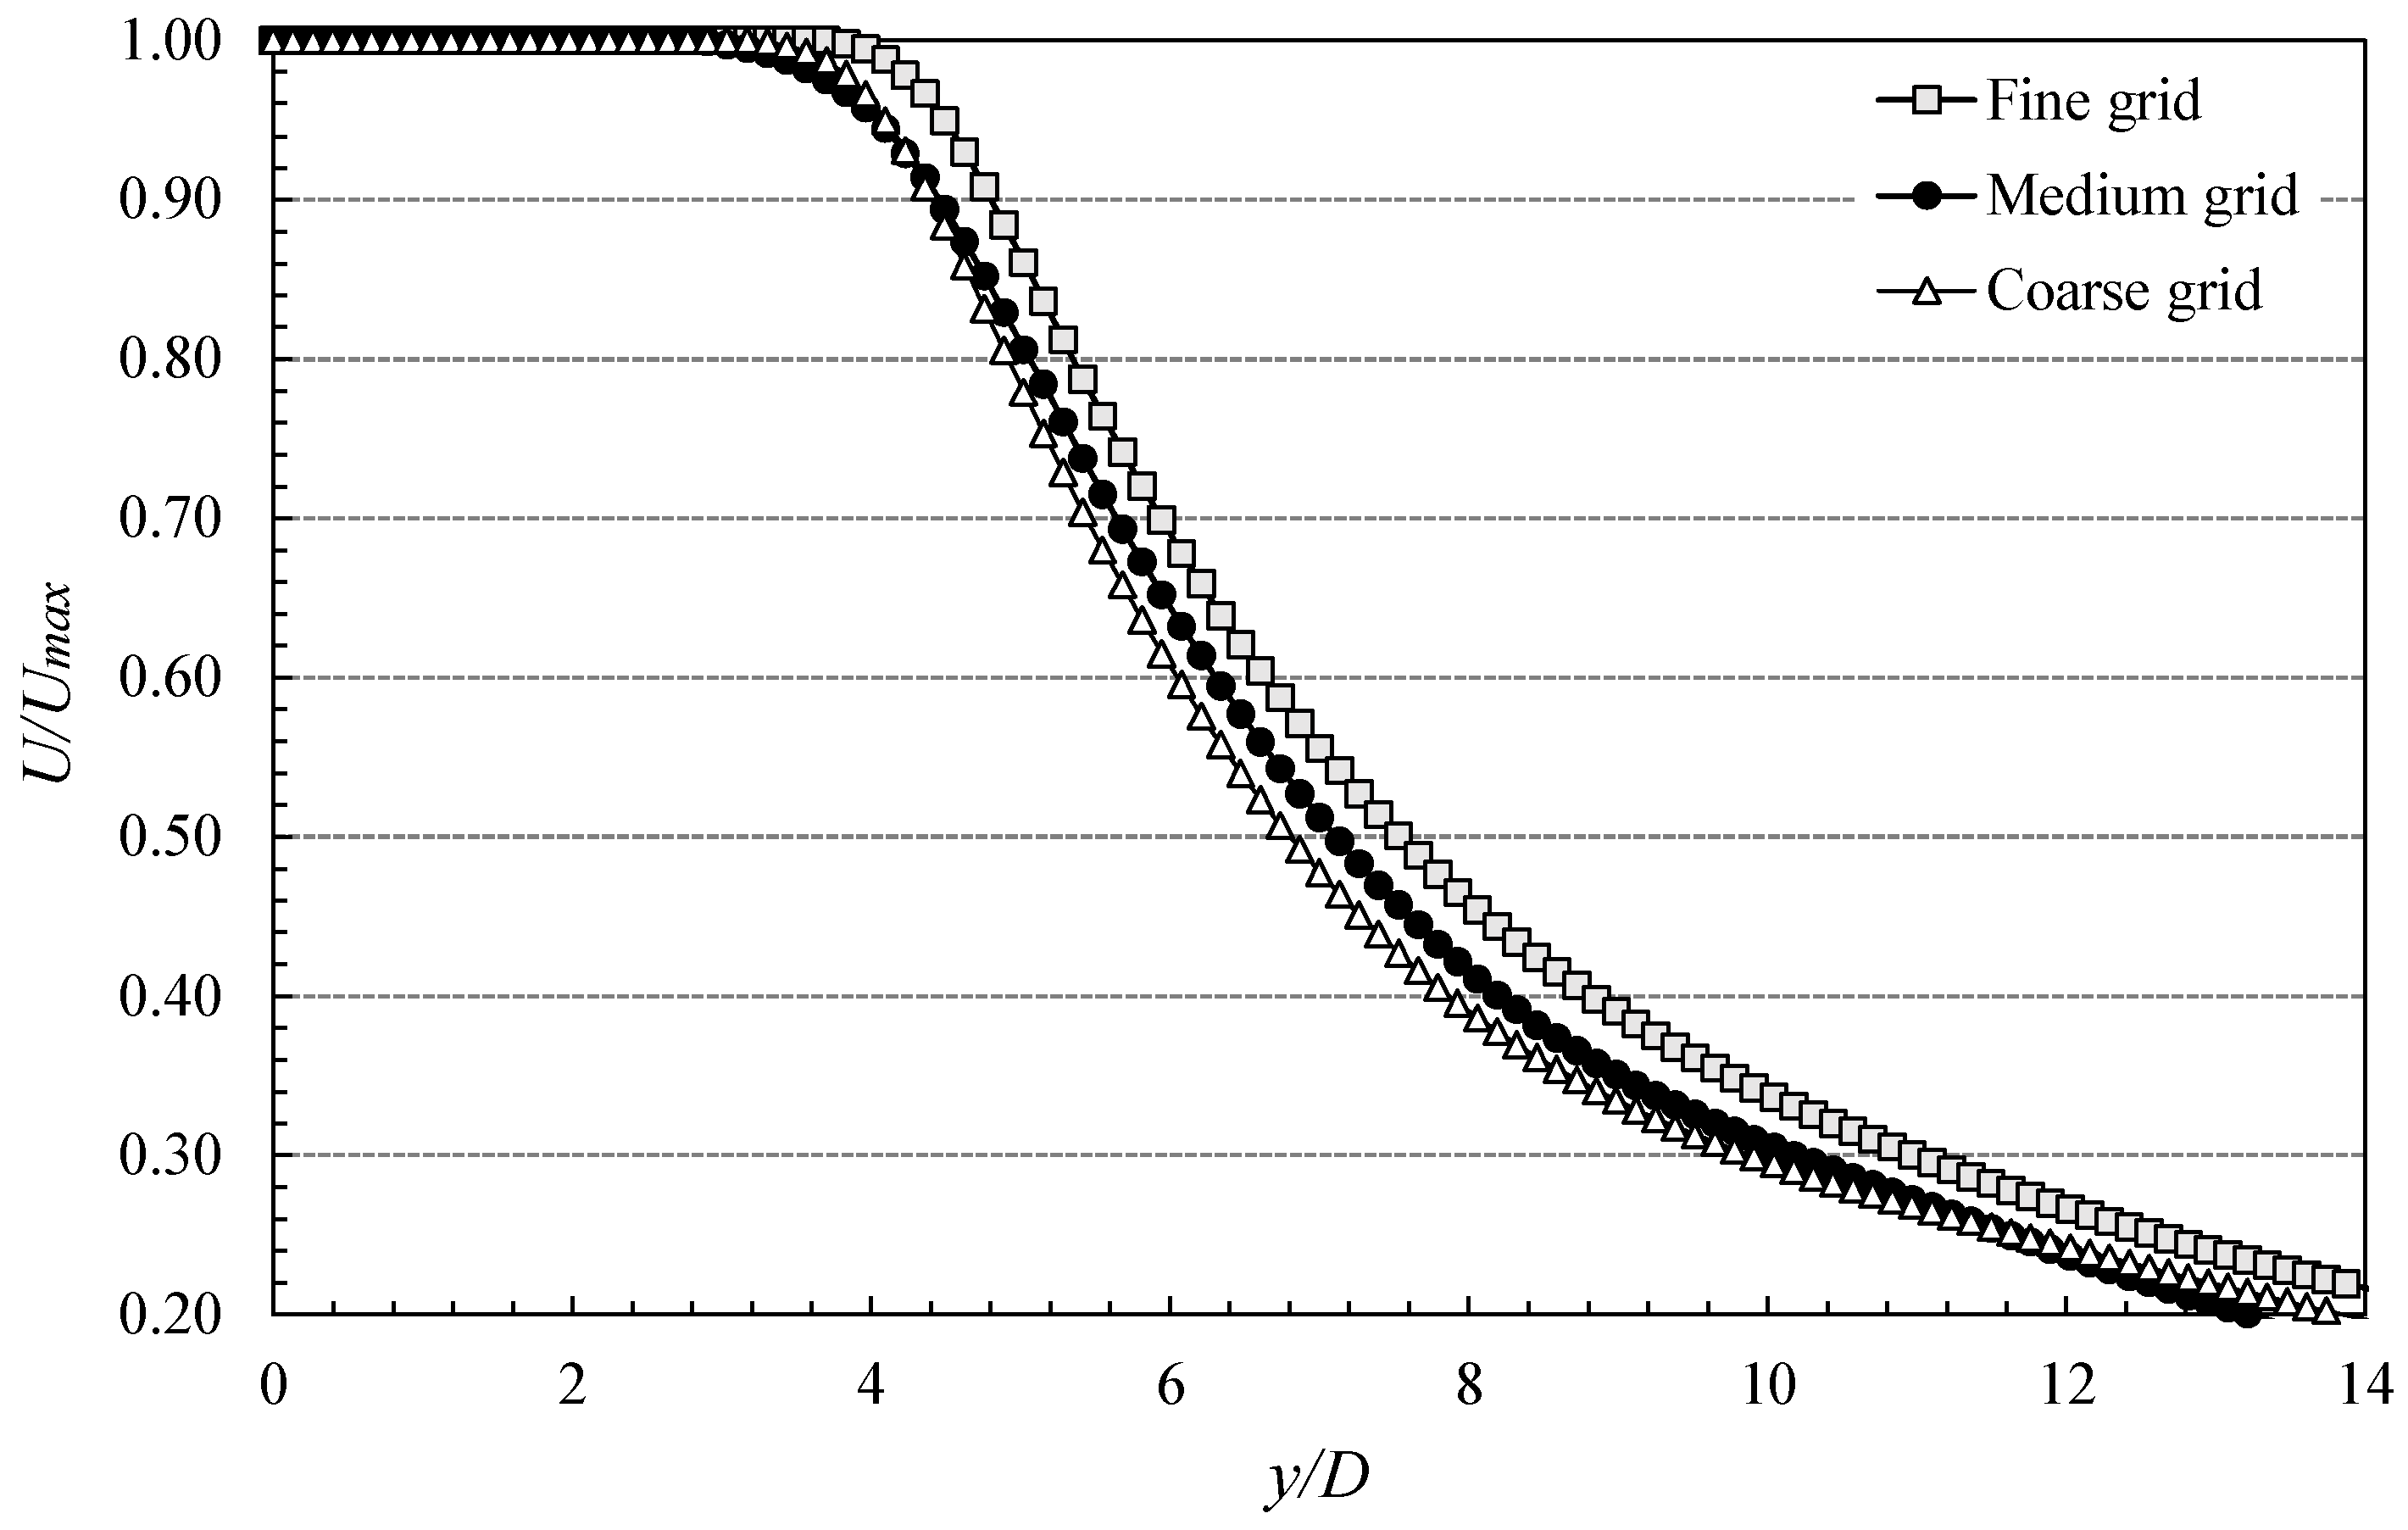
Grid Sensitivity Analysis
2.4.2. Heat Exchanger
2.4.3. Scrubber
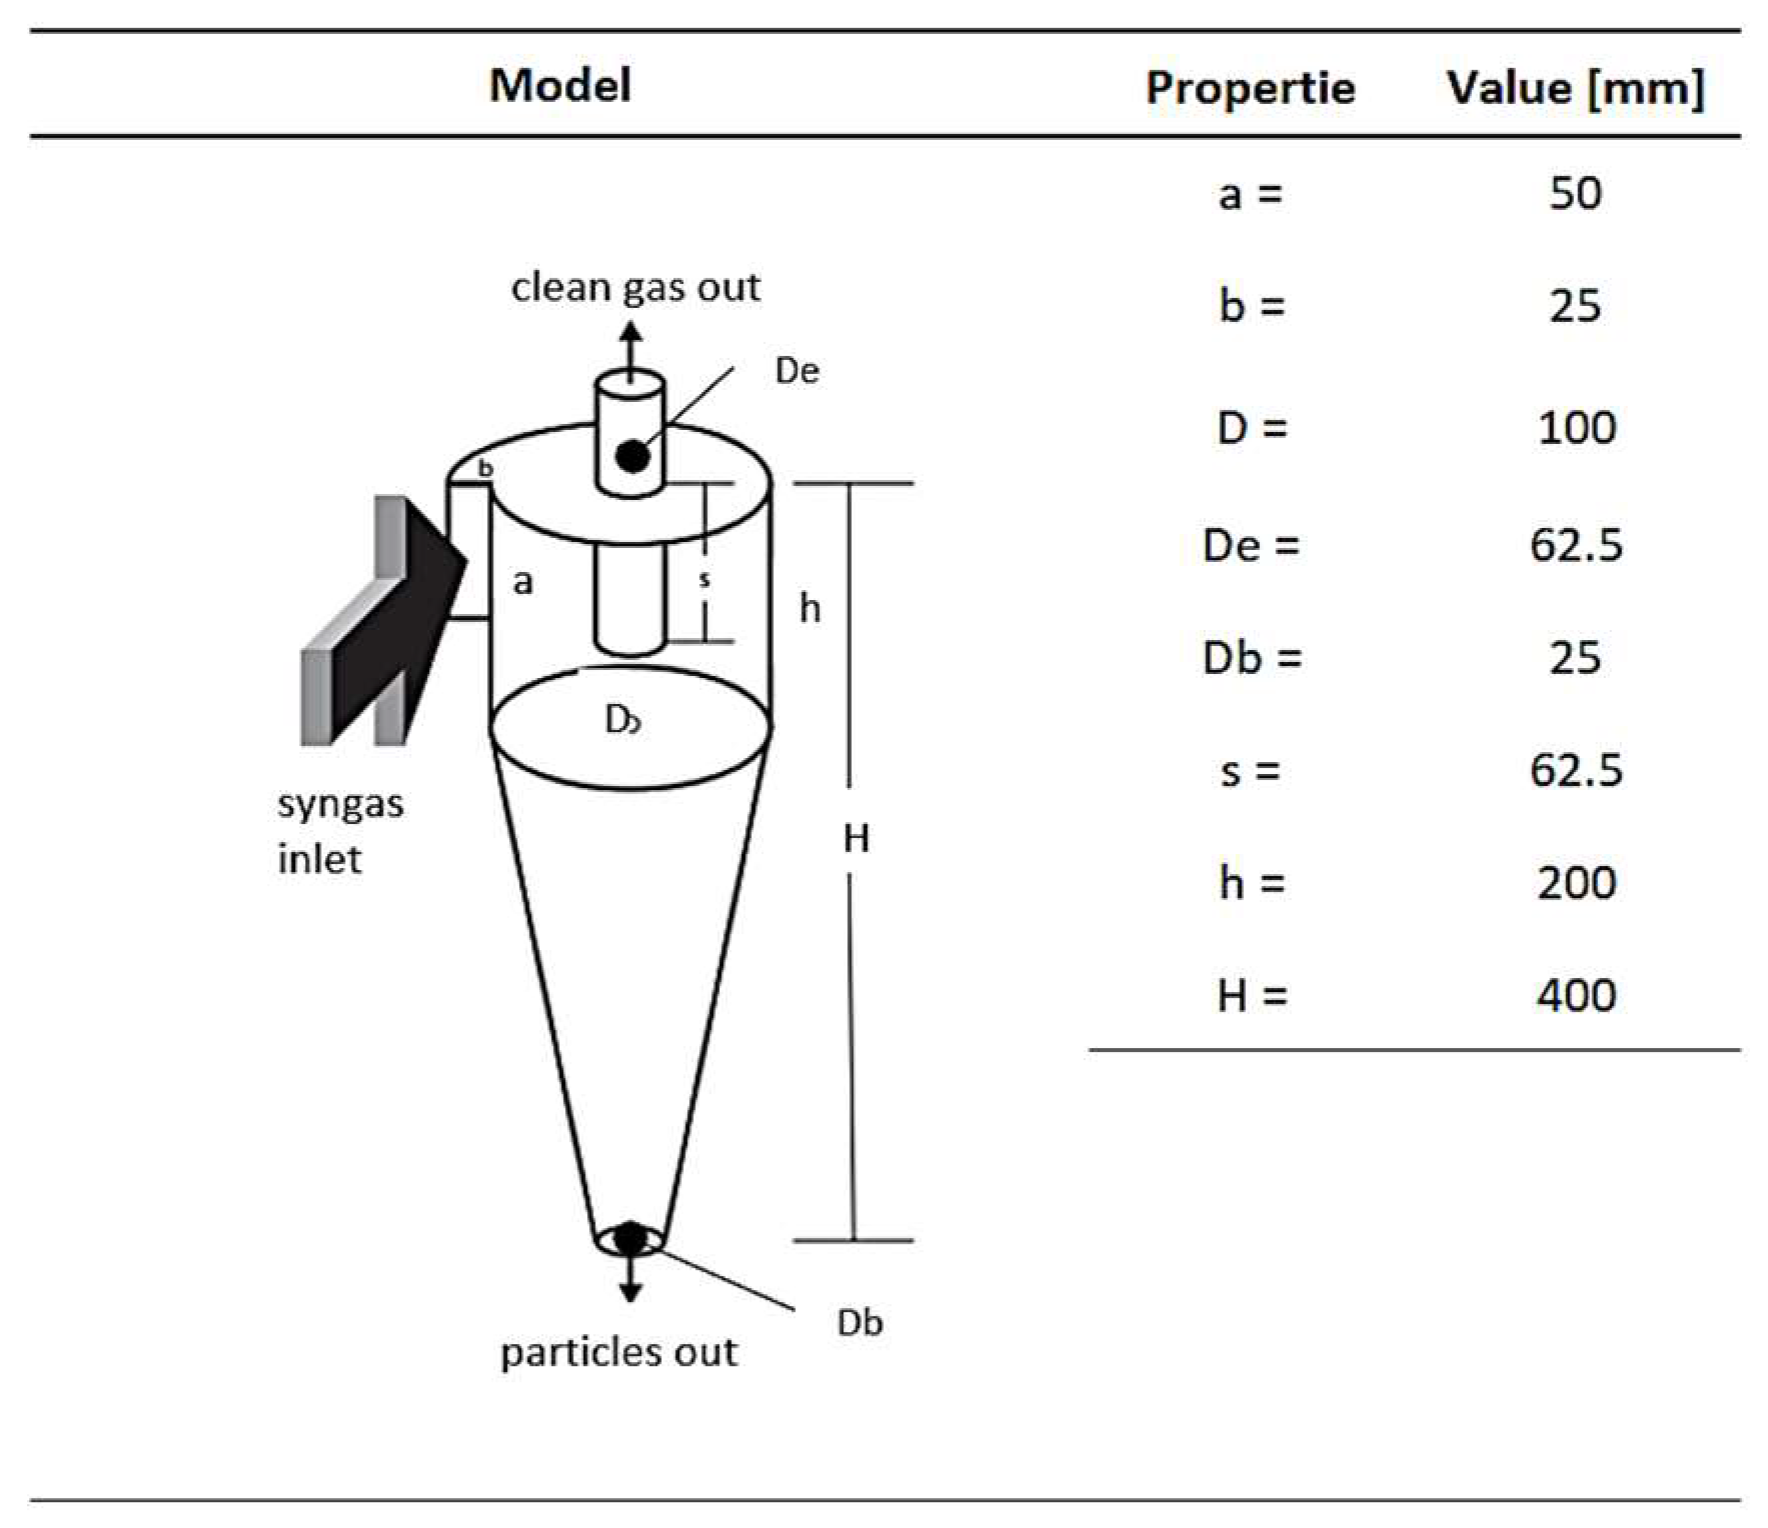
2.4.4. Particle Separator
3. Results and Discussion
3.1. Sewage Sludge Characterization
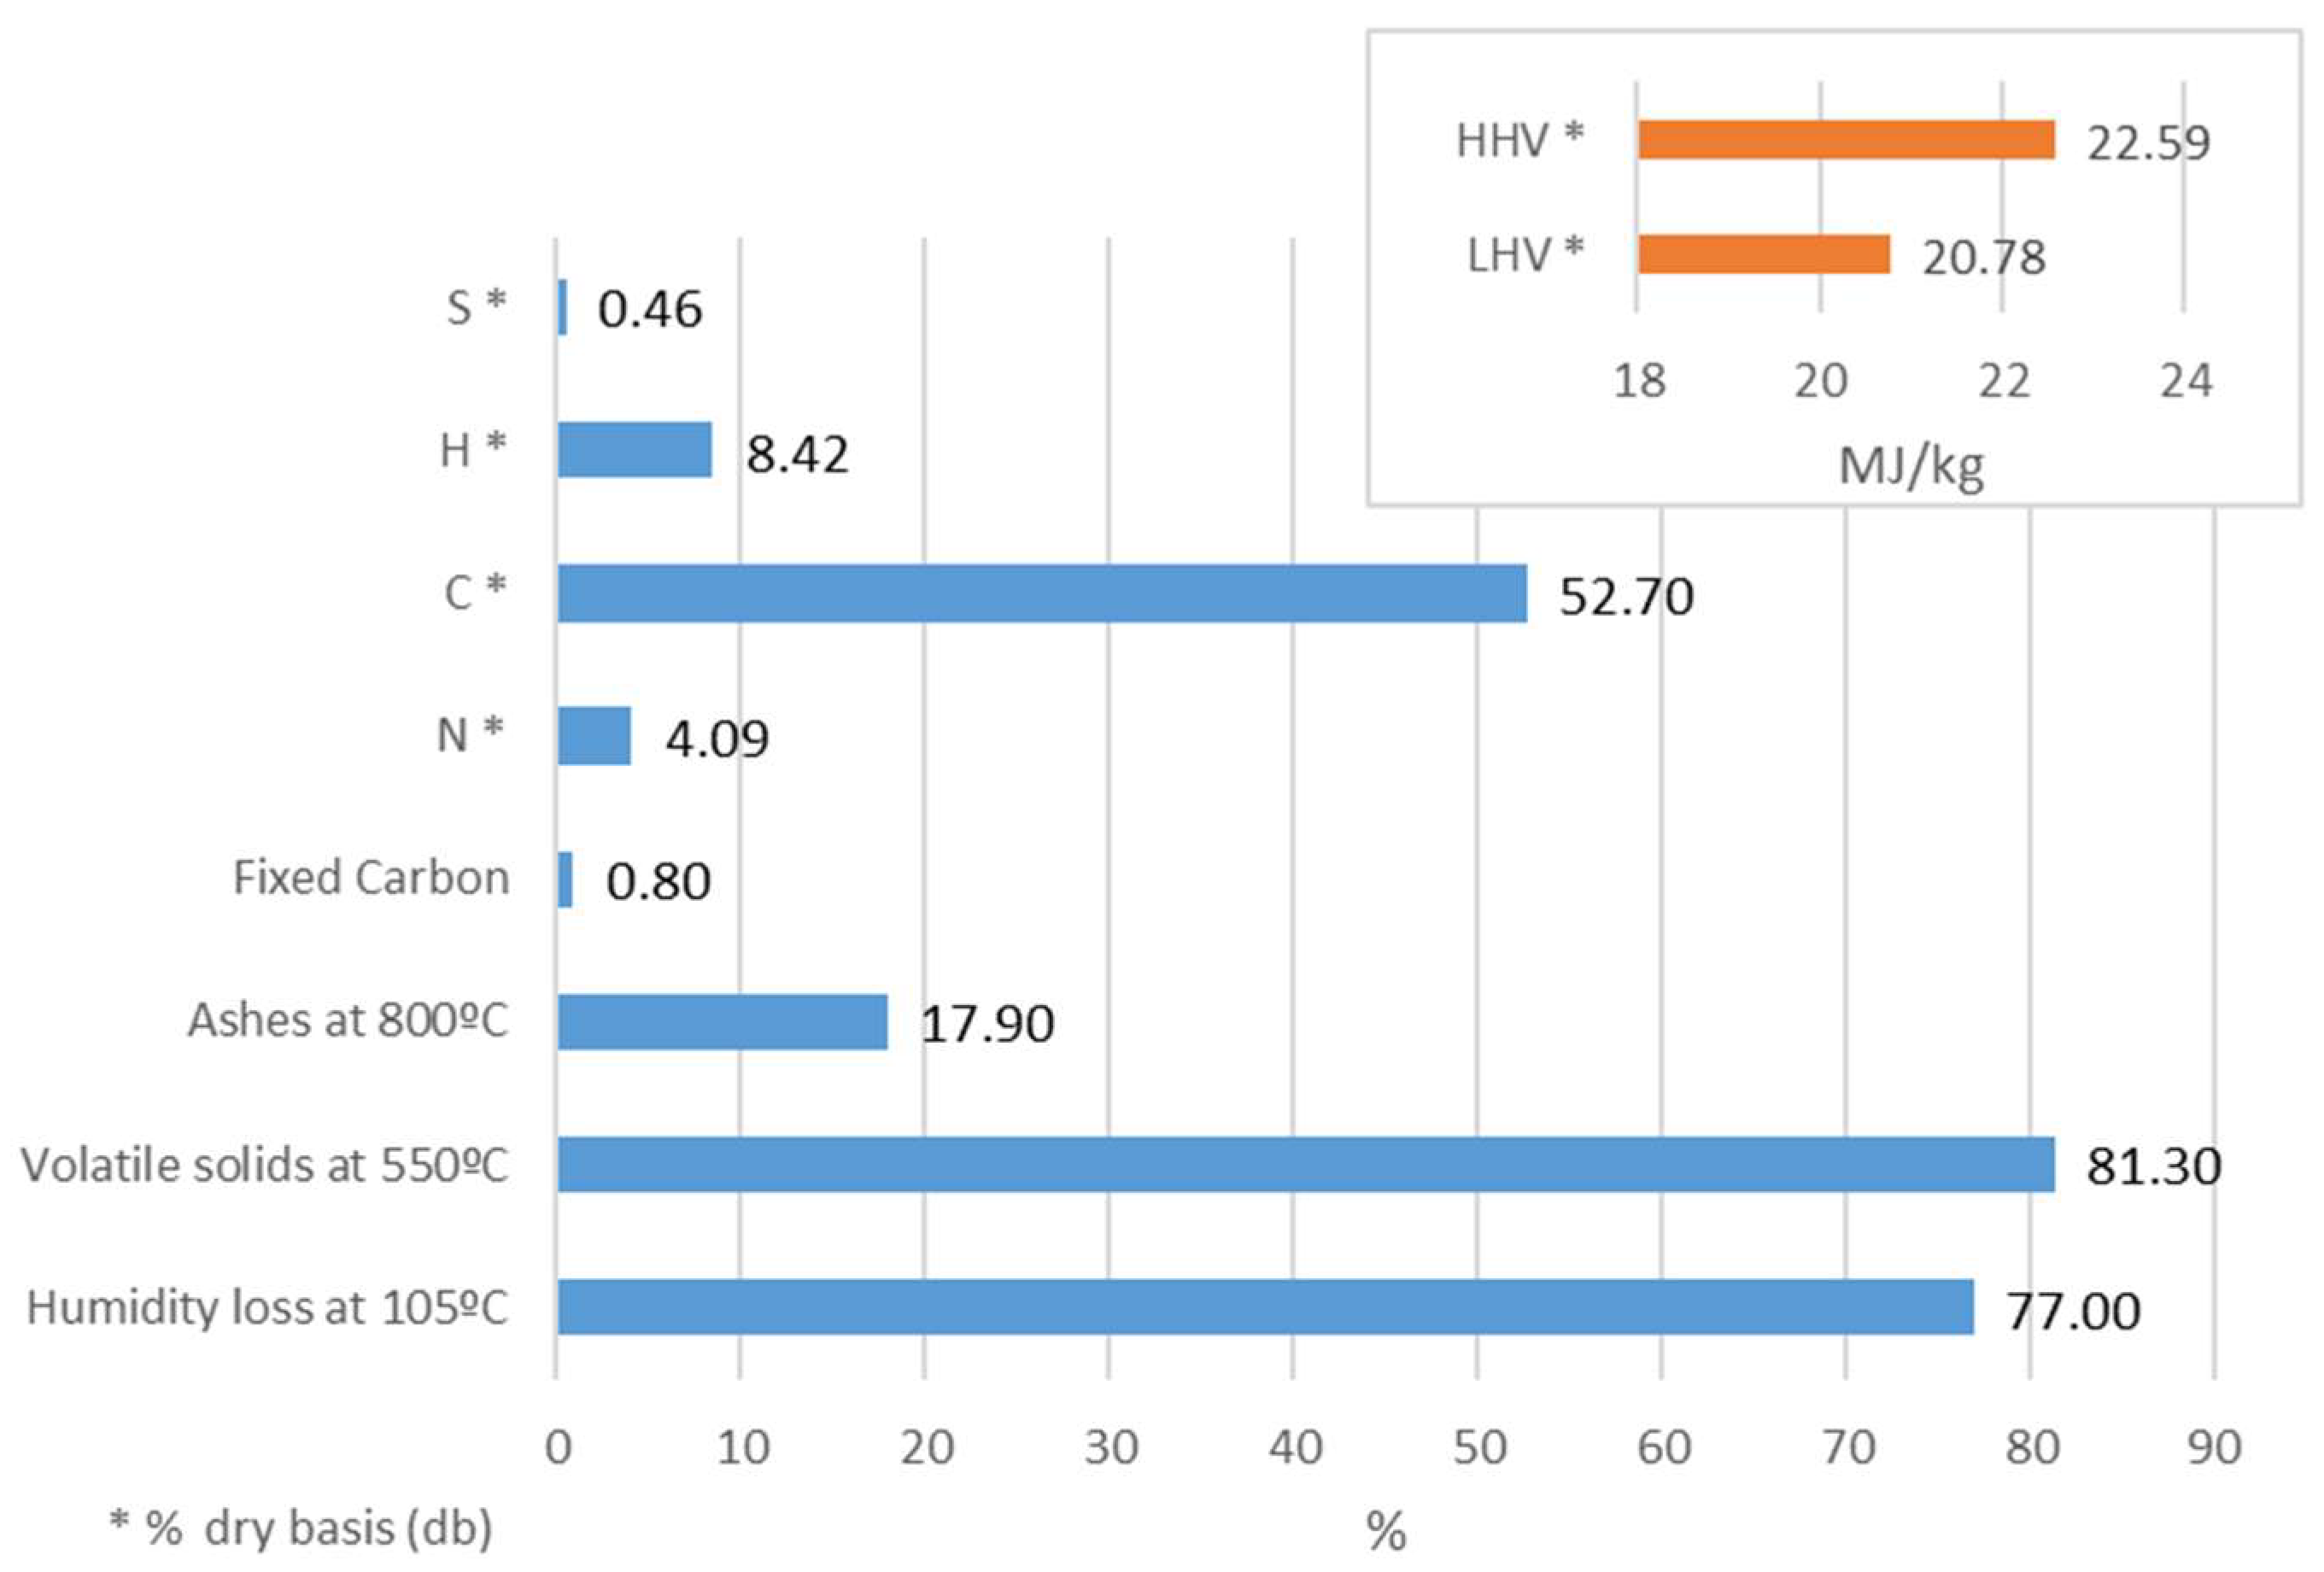
3.1.1. Physicochemical Characterization
3.1.2. Thermogravimetric Analysis
3.1.3. Thermal Properties
3.2. Sewage Sludge Ashes
3.2.1. Chemical Composition
3.2.2. Particle Diameter
3.2.3. Fusibility Characterization
3.3. System Design
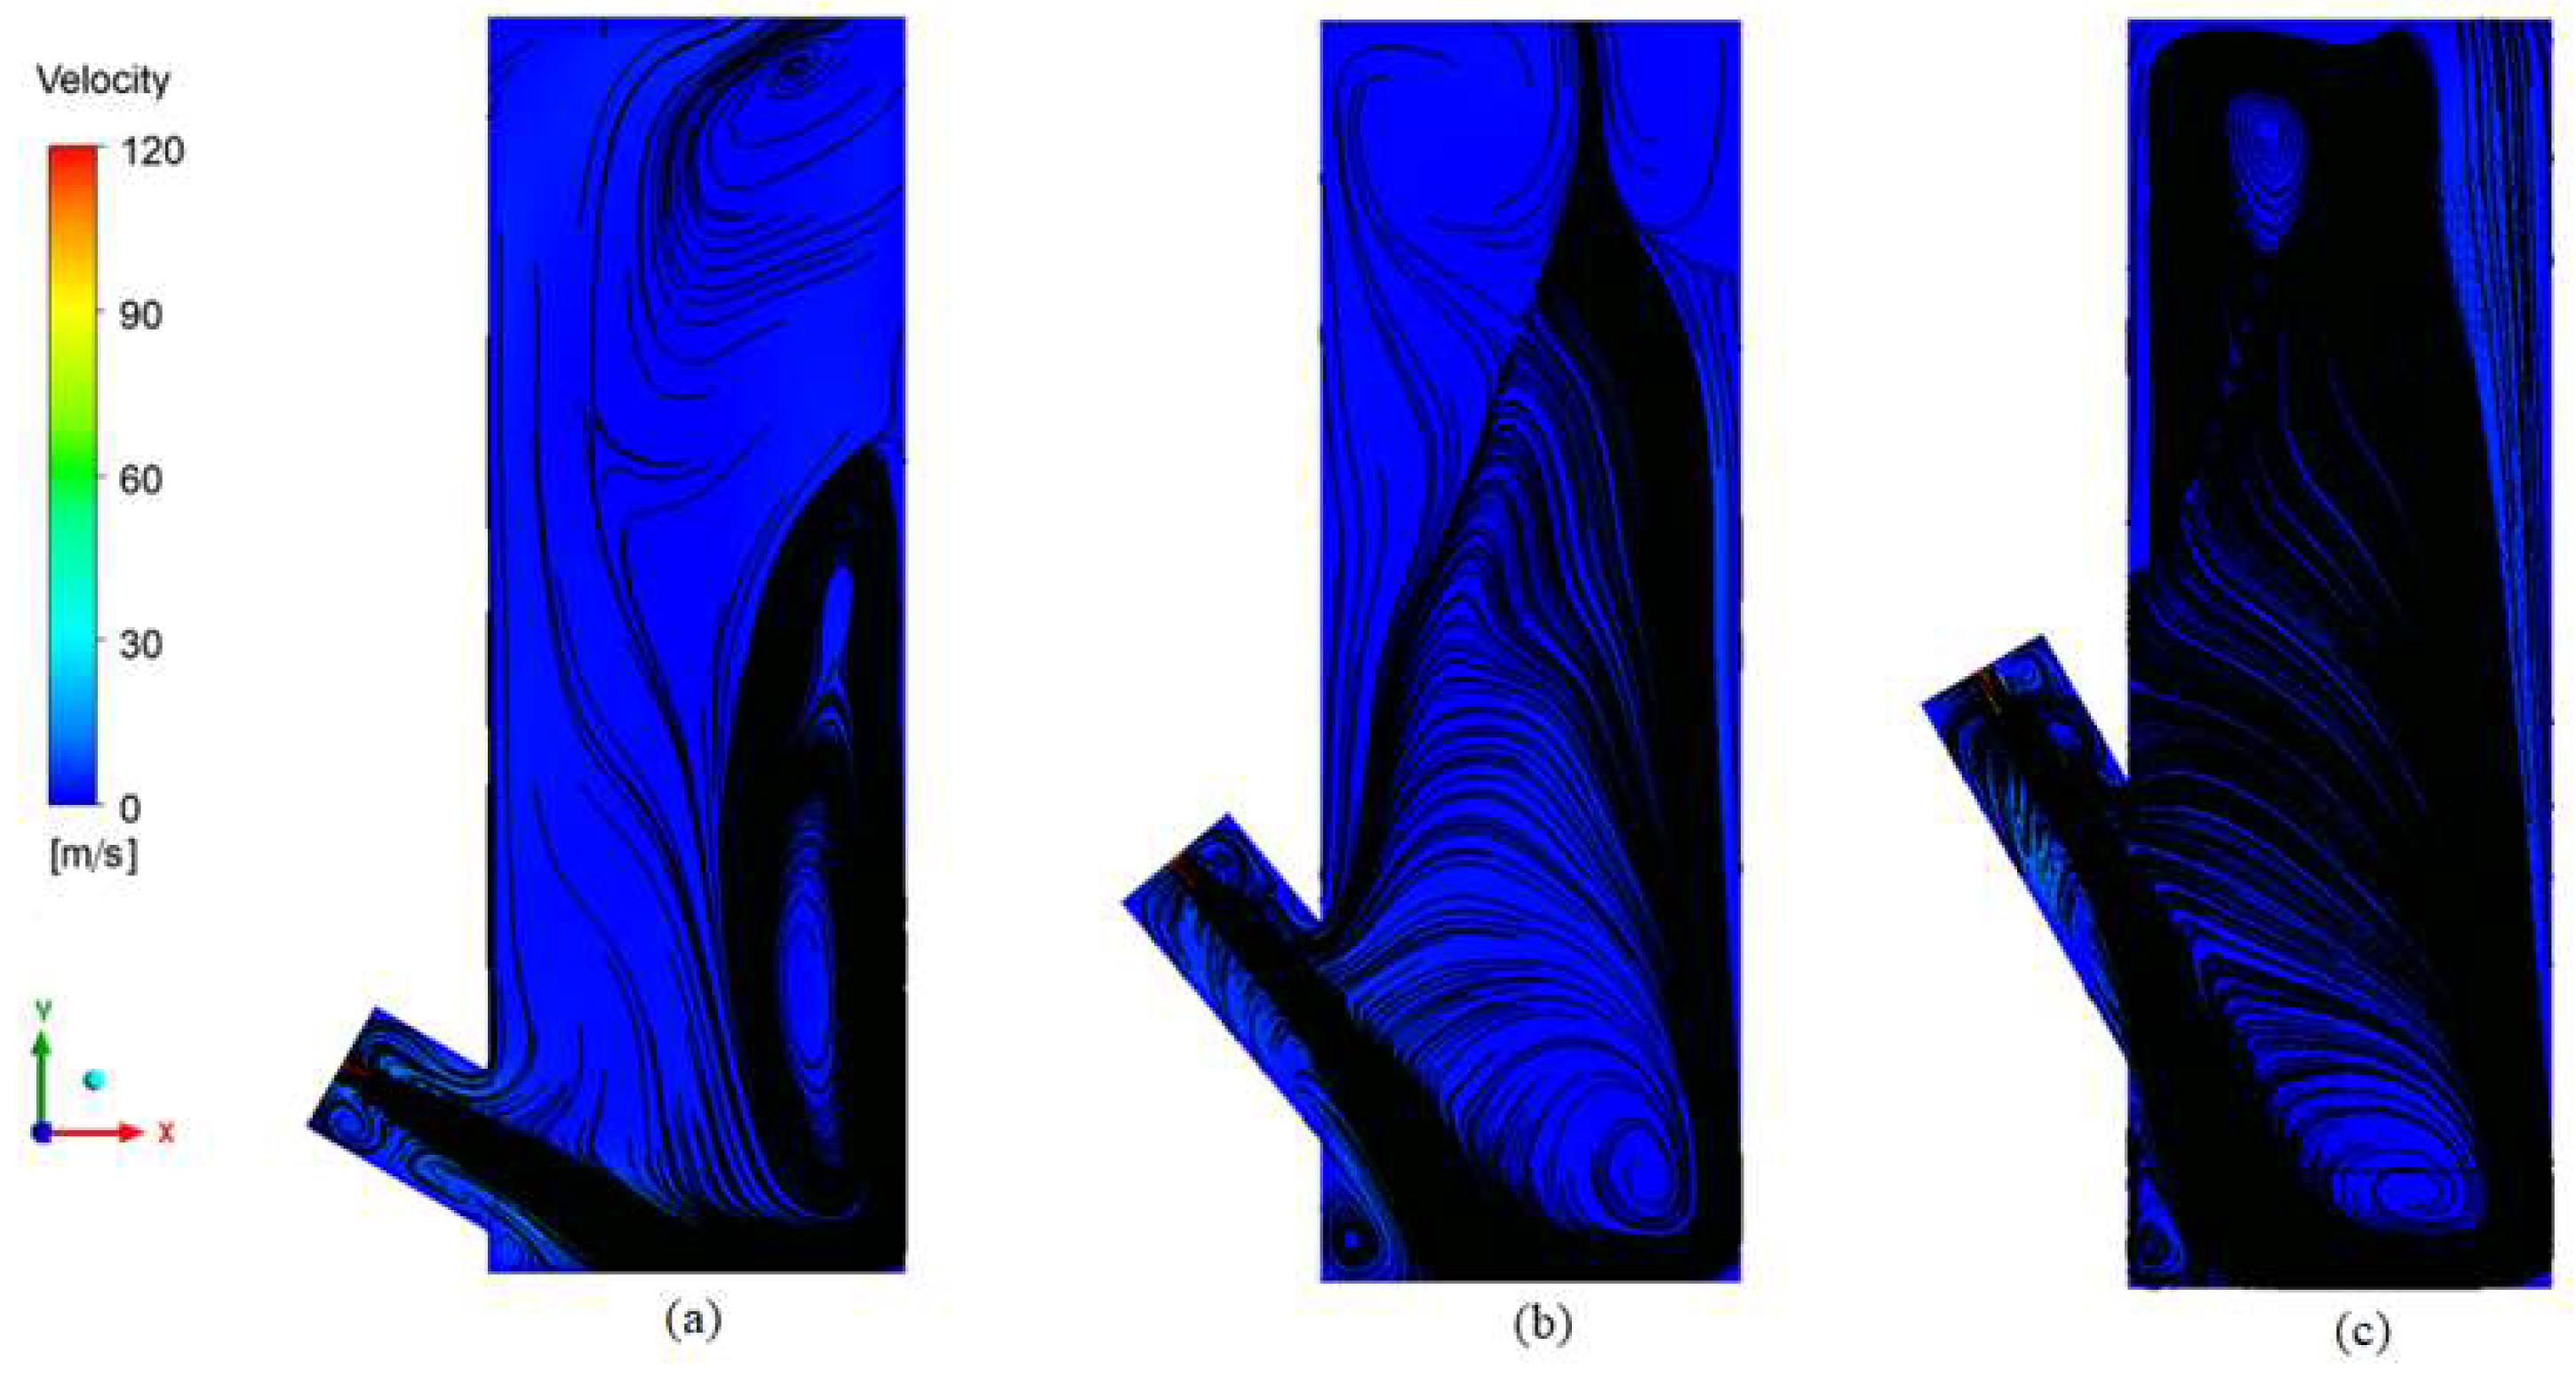
3.3.1. Reactor
3.3.2. Heat Exchanger
3.3.3. Scrubber
3.3.4. Particle Separator
4. Conclusions
Author Contributions
Funding
Data Availability Statement
Conflicts of Interest
Nomenclature
| Acronyms | SI Unit | |
| WWT | Wastewater treatment | |
| SS | Sewage sludge | |
| WWTPs | Wastewater treatment plants | |
| db | Dry basis | |
| CGE | Cold gas efficiency | (%) |
| CCE | Carbon conversion efficiency | (%) |
| HE | Heat exchanger | |
| LHV | Low heating value | (MJ/kg) |
| HHV | High heating value | (MJ/kg) |
| TGA | Thermogravimetric analysis | |
| DSC | Differential Scanning Calorimetry | |
| XRF | X-ray fluorescence spectroscopy | |
| LDT | Laser Diffraction Technique | |
| SMD | Sauter Mean Diameter | |
| Symbol | Quantity | SI Unit |
| Cp | Specific heat capacity | (J/kgK) |
| P | Power | (kW) |
| D, d | Diameter | (m) |
| Generation of k | (kg/m·s3) | |
| Generation of ω | (kg/m3·s2) | |
| H | Nozzle-to-plate distance | (m) |
| k | Turbulent kinetic energy; thermal conductivity | (m2/s2); (W/mK) |
| p | Pressure | (Pa) |
| r | Radius | (m) |
| Re | Reynolds number | - |
| Sk, Sω | Source term | (W/m3) |
| t | Time | (s) |
| T | Temperature | (°C) |
| u, U | Velocity | (m/s) |
| x, y, | Cartesian coordinates | - |
| Greek Symbol | ||
| Effective diffusivity of k, ω | (kg/m·s) | |
| α | Thermal diffusivity | (m2/s) |
| θ | Characteristic time | - |
| μ | Dynamic viscosity | (Pa/s) |
| ρ | Density | (kg/m3) |
| τ | Dimensionless time | - |
| ω | Specific dissipation rate | (1/s) |
| Subscript | ||
| max | Maximum | |
| min | Minimum | |
| w | Wall |
References
- Ronda, A.; Haro, P.; Gómez-Barea, A. Sustainability assessment of alternative waste-to-energy technologies for the management of sewage sludge. Waste Manag. 2023, 159, 52–62. [Google Scholar] [CrossRef] [PubMed]
- Database-Eurostat. Available online: https://ec.europa.eu/eurostat/data/database?node_code=env_ww_spd (accessed on 19 May 2023).
- Bagheri, M.; Bauer, T.; Burgman, L.E.; Wetterlund, E. Fifty years of sewage sludge management research: Mapping researchers’ motivations and concerns. J. Environ. Manag. 2023, 325, 116412. [Google Scholar] [CrossRef] [PubMed]
- Ali, A.M.; Hassan, M.A.A.; Abdulkarim, B.I. Thermal Plasma: A Technology for Efficient Treatment of Industrial and Wastewater Sludge. IOSR J. Environ. Sci. 2016, 10, 63–75. [Google Scholar]
- Wnukowski, M.; Kordylewski, W.; Łuszkiewicz, D.; Leśniewicz, A.; Ociepa, M.; Michalski, J. Sewage Sludge-Derived Producer Gas Valorization with the Use of Atmospheric Microwave Plasma. Waste Biomass-Valorization 2020, 11, 4289–4303. [Google Scholar] [CrossRef]
- Oliveira, M.; Ramos, A.; Ismail, T.M.; Monteiro, E.; Rouboa, A. A Review on Plasma Gasification of Solid Residues: Recent Advances and Developments. Energies 2022, 15, 1475. [Google Scholar] [CrossRef]
- Gomez, E.; Rani, D.A.; Cheeseman, C.; Deegan, D.; Wise, M.; Boccaccini, A. Thermal plasma technology for the treatment of wastes: A critical review. J. Hazard. Mater. 2009, 161, 614–626. [Google Scholar] [CrossRef]
- Speight, J.G. Handbook of Gasification Technology; Wiley: Hoboken, NJ, USA, 2020; ISBN 9781118773536. [Google Scholar]
- Zhovtyansky, V.; Valinčius, V. Efficiency of Plasma Gasification Technologies for Hazardous Waste Treatment. In Gasification Low-Grade Feed; IntechOpen: London, UK, 2018. [Google Scholar] [CrossRef]
- Erdogan, A.A.; Yilmazoglu, M.Z. Experimental and numerical investigation of medical waste disposal via plasma gasification. Appl. Energy 2024, 353, 122014. [Google Scholar] [CrossRef]
- Gao, N.; Kamran, K.; Quan, C.; Williams, P.T. Thermochemical conversion of sewage sludge: A critical review. Prog. Energy Combust. Sci. 2020, 79, 100843. [Google Scholar] [CrossRef]
- Pacheco, N.; Barbosa, F.V.; Ribeiro, A.; Carvalho, J.; Nascimento, L.; Soares, M.; Valerio, N.; Faria, L.; Silva, A.; Araujo, J.; et al. An Experimental Setup for Plasma Gasification of Sewage Sludge. In Proceedings of the 8th Thermal and Fluids Engineering Conference (TFEC), College Park, MD, USA, 26–29 March 2023; pp. 543–557. [Google Scholar] [CrossRef]
- Zheng, Q.; Kaur, S.; Dames, C.; Prasher, R.S. Analysis and improvement of the hot disk transient plane source method for low thermal conductivity materials. Int. J. Heat Mass Transf. 2020, 151, 119331. [Google Scholar] [CrossRef]
- Trofimov, A.A.; Atchley, J.; Shrestha, S.S.; Desjarlais, A.O.; Wang, H. Evaluation of measuring thermal conductivity of isotropic and anisotropic thermally insulating materials by transient plane source (Hot Disk) technique. J. Porous Mater. 2020, 27, 1791–1800. [Google Scholar] [CrossRef]
- He, Y. Rapid thermal conductivity measurement with a hot disk sensor: Part 1. Theoretical considerations. Thermochim. Acta 2005, 436, 122–129. [Google Scholar] [CrossRef]
- Eshel, G.; Levy, G.J.; Mingelgrin, U.; Singer, M.J. Critical evaluation of the use of laser diffraction for particle-size distribution analysis. Soil Sci. Soc. Am. J. 2004, 68, 736–743. [Google Scholar] [CrossRef]
- Kowalczuk, P.B.; Drzymala, J. Physical meaning of the Sauter mean diameter of spherical particulate matter. Part. Sci. Technol. 2016, 34, 645–647. [Google Scholar] [CrossRef]
- Wang, P.; Massoudi, M. Slag behavior in gasifiers. Part I: Influence of coal properties and gasification conditions. Energies 2013, 6, 784–806. [Google Scholar] [CrossRef]
- Deutsche Institut für Normung e.V. (DIN). DIN 51730:2022-02. Testing of Solid Fuels-Determination of Ash Fusibility; Deutsche Institut für Normung e.V. (DIN): Berlin, Germany, 2022. [Google Scholar]
- Basu, P. Biomass Gasification, Pyrolysis and Torrefaction: Practical Design and Theory; Academic Press: Cambridge, MA, USA, 2018. [Google Scholar]
- Menter, F.R. Two-equation eddy-viscosity turbulence models for engineering applications. AIAA J. 1994, 32, 1598–1605. [Google Scholar] [CrossRef]
- Brakmann, R.; Chen, L.; Weigand, B.; Crawford, M. Experimental and Numerical Heat Transfer Investigation of an Impinging Jet Array on a Target Plate Roughened by Cubic Micro Pin Fins1. J. Turbomach. 2016, 138, 111010. [Google Scholar] [CrossRef]
- Guo, Q.; Wen, Z.; Dou, R. Experimental and numerical study on the transient heat-transfer characteristics of circular air-jet impingement on a flat plate. Int. J. Heat Mass Transf. 2017, 104, 1177–1188. [Google Scholar] [CrossRef]
- Issac, J.; Singh, D.; Kango, S. Experimental and numerical investigation of heat transfer characteristics of jet impingement on a flat plate. Heat Mass Transf. 2020, 56, 531–546. [Google Scholar] [CrossRef]
- Singh, A.; Chakravarthy, B.; Prasad, B. Numerical simulations and optimization of impinging jet configuration. Int. J. Numer. Methods Heat Fluid Flow 2021, 31, 1–25. [Google Scholar] [CrossRef]
- Lu, S.; Deng, Q.; Ligrani, P.M.; Jiang, H.; Zhang, Q. Effects of coolant and wall temperature variations on impingement jet array thermal performance. Numer. Heat Transfer, Part A Appl. 2021, 79, 68–82. [Google Scholar] [CrossRef]
- Barbosa, F.V.; Teixeira, S.F.C.F.; Teixeira, J.C.F. Numerical analysis of the influence of the jet-to-jet spacing between two adjacent air jets impinging a flat plate. In Proceedings of the 4th Thermal and Fluids Engineering Conference, Las Vegas, NV, USA, 14–17 April 2019. [Google Scholar]
- ANSYS. Ansys Fluent Theory Guide; ANSYS, Inc.: Canonsburg, PA, USA, 2013; pp. 1–759. [Google Scholar] [CrossRef]
- Cengel, Y.A.; Ghajar, A.J. Heat and Mass Transfer: Fundamentals and Applications, 5th ed.; McGraw-Hill Education: New York, NY, USA, 2011. [Google Scholar]
- Rhie, C.M.; Chow, W.L. Numerical Study of the Turbulent Flow Past an Airfoil with Trailing Edge Separation. AIAA J. 1983, 21, 1525–1532. [Google Scholar] [CrossRef]
- Ferziger, J.H.; Peric, M. Computational Methods for Fluid Dynamics. Computational Methods for Fluid Dynamics, 3rd ed.; Springer: New York, NY, USA, 1996. [Google Scholar]
- de Alencar Júnior, N.R.; Gabaí, I. Incineração e dioxinas: Análise do aporte teórico disponível. Ano de Publicação Desconhecido. Autores Nehemias Rodrigues de Alencar Júnior e Isaac Gabaí. no. Mvc, 2011. Available online: https://www.abepro.org.br/biblioteca/ENEGEP2001_TR104_0410.pdf (accessed on 9 April 2024).
- Araújo, S.; Silva, R. Estudo da Formação de Dioxinas e Furanos em Sistemas Auxiliares de Plantas de Cimento que Usam o Co-Processamento de Resíduos Combustíveis. Ii Congr. Nac. Eng. Mecânica 2002, 10. Available online: http://www.abcm.org.br/app/webroot/anais/conem/2002/trabalhos/tema03/CPB0181.pdf (accessed on 21 March 2023).
- Cengel, Y.; Turner, R.; Cimbala, J. Fundamental of Thermal Fluid Sciences, 5th ed.; McGraw-Hill Education: New York, NY, USA, 2008. [Google Scholar]
- Menzel, D.B. EPA Air Pollution Standard, 6th ed.; United States Environmental Protection Agency: Washington, DC, USA, 2002. [Google Scholar]
- Bretschneider, B.; Kurfurst, J. Air Pollution Control Technology; Elsevier Science: Amsterdam, The Netherlands, 1987. [Google Scholar]
- Azzopardi, B.J.; Govan, A.H. The Modeling of Venturi Scrubbers. Filtr. Sep. 1984, 21, 1984. [Google Scholar]
- Hesketh, H.E.; Mohan, K. Specifying venturi scrubber throat length for effective particle capture at minimum pressure loss penalty. J. Air Pollut. Control. Assoc. 1983, 33, 854–857. [Google Scholar] [CrossRef]
- Miller, P.C.H.; Tuck, C.R.; Murphy, S.; Ferreira, M.C. Measurements of the droplet velocities in sprays produced by different designs of agricultural spray nozzle. In Proceedings of the 22nd European Conference on Liquid Atomization and Spray Systems, Como Lake, Italy, 8–10 September 2008. [Google Scholar]
- Maurício, P.; Silva, P.; Fonseca, A.; Duarte, P. Um Algoritmo para Dimensionamento de Ciclones. Rev. Fac. Ciência Tecnol. 2006. Available online: https://bdigital.ufp.pt/handle/10284/539 (accessed on 9 April 2024).
- Wang, L.K.; Pereira, N.C.; Hung, Y.-T. Handbook of Environmental Engineering-Air Pollution Engineering; Humana Press, Inc: Totowa, NJ, USA, 2004. [Google Scholar]
- EPA Technology Assessment Report Aqueous Sludge Gasification Technologies. Epa/600/R-12/540, no. June. 2012; pp. 1–58. Available online: https://nepis.epa.gov/Exe/ZyPDF.cgi/P100EM1Q.PDF?Dockey=P100EM1Q.PDF (accessed on 9 April 2024).
- Chun, Y.N.; Song, H.G. Microwave-enhanced gasification of sewage sludge waste. Environ. Eng. Res. 2018, 24, 591–599. [Google Scholar] [CrossRef]
- Werle, S.; Dudziak, M. 25-Gasification of sewage sludge. Ind. Munic. Sludge Emerg. Concerns Scope Resour. Recover. 2019, 575–593. [Google Scholar] [CrossRef]
- Bora, R.R.; Richardson, R.E.; You, F. Resource recovery and waste-to-energy from wastewater sludge via thermochemical conversion technologies in support of circular economy: A comprehensive review. BMC Chem. Eng. 2020, 2, 8. [Google Scholar] [CrossRef]
- Fedelich, N. Thermal Analysis in Practice-Tips and Hints. Mattler Toledo: Schwerzenbach, Switzerland, 2016. [Google Scholar]
- Wang, K.-S.; Tseng, C.-J.; Chiou, I.-J.; Shih, M.-H. The thermal conductivity mechanism of sewage sludge ash lightweight materials. Cem. Concr. Res. 2005, 35, 803–809. [Google Scholar] [CrossRef]
- Song, H.W.; Park, K.J.; Han, S.K.; Jung, H.S. Thermal conductivity characteristics of dewatered sewage sludge by thermal hydrolysis reaction. J. Air Waste Manag. Assoc. 2014, 64, 1384–1389. [Google Scholar] [CrossRef]
- Rawle, A.F. Basic of principles of particle-size analysis. Surf. Coat. Int. Part A Coat. J. 2003, 86, 58–65. [Google Scholar]
- Barbosa, F.V.; Teixeira, S.F.; Teixeira, J.C. Convection from multiple air jet impingement-A review. Appl. Therm. Eng. 2023, 218, 119307. [Google Scholar] [CrossRef]
- Hrycak, P.; Lee, D.T.; Gauntner, J.W.; Livingood, J.N.B. Experimental Flow Characteristics of a Single Turbulent Jet Impinging on a Flat Plate. Available online: https://ntrs.nasa.gov/citations/19700011262 (accessed on 2 September 2013).


| Grid | N° Cells |
|---|---|
| Coarse | 210,632 |
| Medium | 300,768 |
| Fine | 606,733 |
| Material/Properties | k (W/mK) | α (mm2/s) | Cp (J/kgK) | ρ (kg/m3) |
|---|---|---|---|---|
| Dry sewage sludge | 0.2498 | 0.1696 | 1172 | 1257 |
| Water at 25 °C | 0.607 | 1.457 × 10⁻³ | 4180 | 997 |
| Sewage sludge with 40% humidity | 0.392 | 0.102 | 2375 | 1153 |
| Chemical Compound | % Mass | Chemical Compound | % Mass |
|---|---|---|---|
| CaO | 15.8 | P2O5 | 13.4 |
| Fe2O3 | 5.5 | Cl | 0.07 |
| SiO2 | 38.1 | S | 1 |
| Al2O3 | 17 | SrO | 0.05 |
| MgO | 2.3 | Ni | 0.04 |
| MnO | 0.09 | RbO2 | 0.04 |
| TiO2 | 1.7 | Cu | 0.45 |
| Na2O | <0.1 | Zn | 1.16 |
| K2O | 3.4 | Cr | 0.05 |
| Parameter | Value (°C) |
|---|---|
| Shrinking starting temperature, tS | 970 |
| Deformation temperature | 1210 |
| Sphere temperature | 1230 |
| Hemisphere temperature | 1270 |
| Flow temperature | 1350 |
Disclaimer/Publisher’s Note: The statements, opinions and data contained in all publications are solely those of the individual author(s) and contributor(s) and not of MDPI and/or the editor(s). MDPI and/or the editor(s) disclaim responsibility for any injury to people or property resulting from any ideas, methods, instructions or products referred to in the content. |
© 2024 by the authors. Licensee MDPI, Basel, Switzerland. This article is an open access article distributed under the terms and conditions of the Creative Commons Attribution (CC BY) license (https://creativecommons.org/licenses/by/4.0/).
Share and Cite
Pacheco, N.; Ribeiro, A.; Oliveira, F.; Pereira, F.; Marques, L.; Teixeira, J.C.; Vilarinho, C.; Barbosa, F.V. Sewage Sludge Plasma Gasification: Characterization and Experimental Rig Design. Reactions 2024, 5, 285-304. https://doi.org/10.3390/reactions5020014
Pacheco N, Ribeiro A, Oliveira F, Pereira F, Marques L, Teixeira JC, Vilarinho C, Barbosa FV. Sewage Sludge Plasma Gasification: Characterization and Experimental Rig Design. Reactions. 2024; 5(2):285-304. https://doi.org/10.3390/reactions5020014
Chicago/Turabian StylePacheco, Nuno, André Ribeiro, Filinto Oliveira, Filipe Pereira, L. Marques, José C. Teixeira, Cândida Vilarinho, and Flavia V. Barbosa. 2024. "Sewage Sludge Plasma Gasification: Characterization and Experimental Rig Design" Reactions 5, no. 2: 285-304. https://doi.org/10.3390/reactions5020014
APA StylePacheco, N., Ribeiro, A., Oliveira, F., Pereira, F., Marques, L., Teixeira, J. C., Vilarinho, C., & Barbosa, F. V. (2024). Sewage Sludge Plasma Gasification: Characterization and Experimental Rig Design. Reactions, 5(2), 285-304. https://doi.org/10.3390/reactions5020014