Abstract
The development of heterostructures incorporating photocatalysts optimized for visible-light activity represents a major breakthrough in the field of environmental remediation research, offering innovative and sustainable solutions for environmental purification. This study explores the photocatalytic capabilities of a SnFe2O4/g-C3N4 heterojunction nanocomposite, successfully synthesized from graphitic carbon nitride (g-C3N4) and tin ferrate (SnFe2O4) and applied to the degradation of the cationic dye brilliant cresyl blue (BCB) in an aqueous solution. These two components are particularly attractive due to their low cost and ease of fabrication. Various characterization techniques, including XRD, FTIR, SEM, and TEM, were used to confirm the successful integration of SnFe2O4 and g-C3N4 phases in the synthesized catalysts. The photocatalytic and photo-Fenton-like activity of the heterojunction composites was evaluated by the degradation of brilliant cresyl blue under visible LED illumination. Compared to the pure components SnFe2O4 and g-C3N4, the SnFe2O4/g-C3N4 nanocomposite demonstrated a superior photocatalytic performance. Furthermore, the photo-Fenton-like performance of the composites is much higher than the photocatalytic performances. The significant improvement in photo-Fenton activity is attributed to the synergistic effect between SnFe2O4 and g-C3N4, as well as the efficient separation of photoexcited electron/hole pairs. The recyclability of the SnFe2O4/g-C3N4 composite toward BCB photo-Fenton like degradation was also shown. This study aimed to assess the modeling and optimization of photo-Fenton-like removal BCB using the SnFe2O4/g-C3N4 nanomaterial. The main parameters (photocatalyst dose, initial dye concentration, H2O2 volume, and reaction time) affecting this system were modeled by two approaches: a response surface methodology (RSM) based on a Box–Behnken design and artificial neural network (ANN). A comparison was made between the predictive accuracy of RSM for brilliant cresyl blue (BCB) removal and that of the artificial neural network (ANN) approach. Both methodologies provided satisfactory and comparable predictions, achieving R2 values of 0.97 for RSM and 0.99 for ANN.
1. Introduction
Water is a necessary resource for all organisms, humans, animals, plants, and microorganisms, because most of the important processes of the biosphere are related to it [1]. Today, issues over water pollution have increased considerably. This relates to industries like paper manufacturing, cosmetics, textiles, food, pharmaceuticals, and medical diagnostics that frequently produce waste that contains cationic and anionic dyes. These industries release a large amount of toxic substance mixtures, including surfactants, biocidal compounds, solid suspensions, dispersing and wetting agents, dyes, and metal traces, which jeopardize and compromise the existence of a number of living beings. In order to mitigate the effects of these toxic mixtures, several methods have been applied. Some oxidation methods, classified as oxidation processes, play a vital role in the purification of wastewater. Among the methods that present pollutant elimination potential are oxidation, biodegradation, and adsorption. However, these methods have deficiencies in terms of effectiveness and treatment time [2,3,4,5].
To alleviate the effects of these toxic mixtures, various methods have been implemented. Among these, advanced oxidation processes (AOPs) prove promising for treating refractory and/or toxic pollutants. AOPs generate highly reactive hydroxyl radicals •OH, which can degrade a wide range of organic compounds, including azo dyes. Photocatalytic and photo-Fenton-like processes, in particular, have garnered notable interest for their efficiency in decomposing dyes, owing to their low cost, moderate reaction conditions, and simplicity of operation [6].
The photocatalysis process relies on the generation of electron–hole pairs (e−/h+) under appropriate light irradiation [7], allowing the transfer of photoexcited charges to the surface of the photocatalyst, where they trigger redox reactions to form active species capable of degrading pollutants. The photo-Fenton-like process combines this approach with the Fenton reaction, in which •OH radicals are produced through the reaction of a Fenton reagent. However, these processes are traditionally effective only under UV irradiation, which constitutes only 5% of solar light, thereby limiting their practical application. It is therefore crucial to develop photocatalysts and photo-Fenton-like catalysts activated by visible light [8].
Currently, there is growing interest in the degradation of organic pollutants under visible light, particularly on graphitic carbon nitride (g-C3N4), due to its moderate band gap (2.4–2.8 eV) [9,10]. Furthermore, g-C3N4 may have several drawbacks, such as a high complexity level of photo-generated supports, low utilization of visible light, difficult recovery, and easy agglomeration [11,12].
To overcome these hindrances, several studies have explored the employment of g-C3N4 composites with different spinel ferrites for enhanced photocatalysis (MFe2O4, M = Mn, Zn, Ni, Cu, and Co) [13,14,15,16]. Moreover, ferrite spinel nanoparticles are magnetic materials with unique characteristics such as a narrow band energy gap, utilization of UV–visible light, elevated electromagnetic performance, cost-effectiveness, feasible preparation, high chemical stability, intriguing adsorption, and innocuous properties [17,18,19]. Additionally, ferrites can be easily separated from the polluted aqueous solution due to their magnetic properties, and thanks to this separation process, ferrite spinel nanoparticles can be reused, justifying their employment as photocatalysts at affordable prices [20,21,22]. The major challenge for the utilization of photocatalysts for wastewater treatment lies in recycling and separation. The association of spinel ferrites and g-C3N4 has shown not only an improvement in photocatalytic performance but also a magnetic recycling capacity of the photocatalyst [23,24]. However, spinel ferrites might cause the pollution of treated water due to their minor toxicity [25,26,27,28,29].In this context, it is worth noting that tin ferrite (SnFe2O4) can be considered an advantageous option due to its non-toxic nature and the abundance of Fe and Sn elements on earth [30]. SnFe2O4 has been mentioned as being extremely effective in photocatalytic elimination due to its high adsorption of UV–visible light, with a band-gap energy of 1.89 Ev [30].
In this work, we present a simple method for synthesizing SnFe2O4 by co-precipitation without the need for a calcination step, using NaOH as a precipitating agent. Meanwhile, g-C3N4 was synthesized by the calcination of a urea precursor. We successfully fabricated magnetic SnFe2O4/g-C3N4 nanocomposites with varying mass ratios, demonstrating their potential as visible-light-activated photocatalysts. The synthesized nanocomposites underwent thorough characterization using several techniques to assess their phase, purity, and morphology. This innovative approach introduces a simplified and cost-effective synthesis route that eliminates the high-temperature calcination typically associated with conventional methods, which can be both energy-intensive and costly. The resulting nanocomposites demonstrated enhanced photocatalytic and photo-Fenton activities under visible-light irradiation, effectively addressing the limitations of traditional UV-dependent catalytic processes. This advancement paves the way for more efficient and sustainable photocatalytic applications. First, we compared the performance of photocatalytic and photo-Fenton processes under identical experimental conditions. Then, we studied the impact of various experimental parameters, such as catalyst loading, initial BCB concentration, solution pH, H2O2 volume, and contact time, in order to identify the optimal conditions for the most efficient photo-Fenton process. These parameters, frequently explored in the literature, significantly influence the efficiency of the photo-Fenton process, making their optimization essential [31]. As a further step, radical scavenging experiments were carried out to identify the main active species involved in the photo-Fenton mechanism. In addition, this study is one of the first to compare the predictive capabilities of response surface methodology (RSM) and artificial neural networks (ANNs) in the modeling and optimization of brilliant cresyl blue (BCB) dye degradation, enabling the establishment of relationships between input factors and process responses for optimal performance. The practical significance of our results is also underlined by the magnetic properties of the SnFe2O4/g-C3N4 nanocomposites, which facilitate separation and reuse, reducing operational costs and minimizing environmental impact, while the non-toxic nature of SnFe2O4 addresses concerns about secondary pollution. By addressing the limitations of existing photocatalysts and photo-Fenton processes, this study advances the field of wastewater treatment and contributes to the development of sustainable and efficient solutions to mitigate water pollution, with the integration of experimental optimization and advanced modeling techniques (RSM and ANN) paving the way for future research and industrial applications [32].
2. Materials and Methods
2.1. Materials
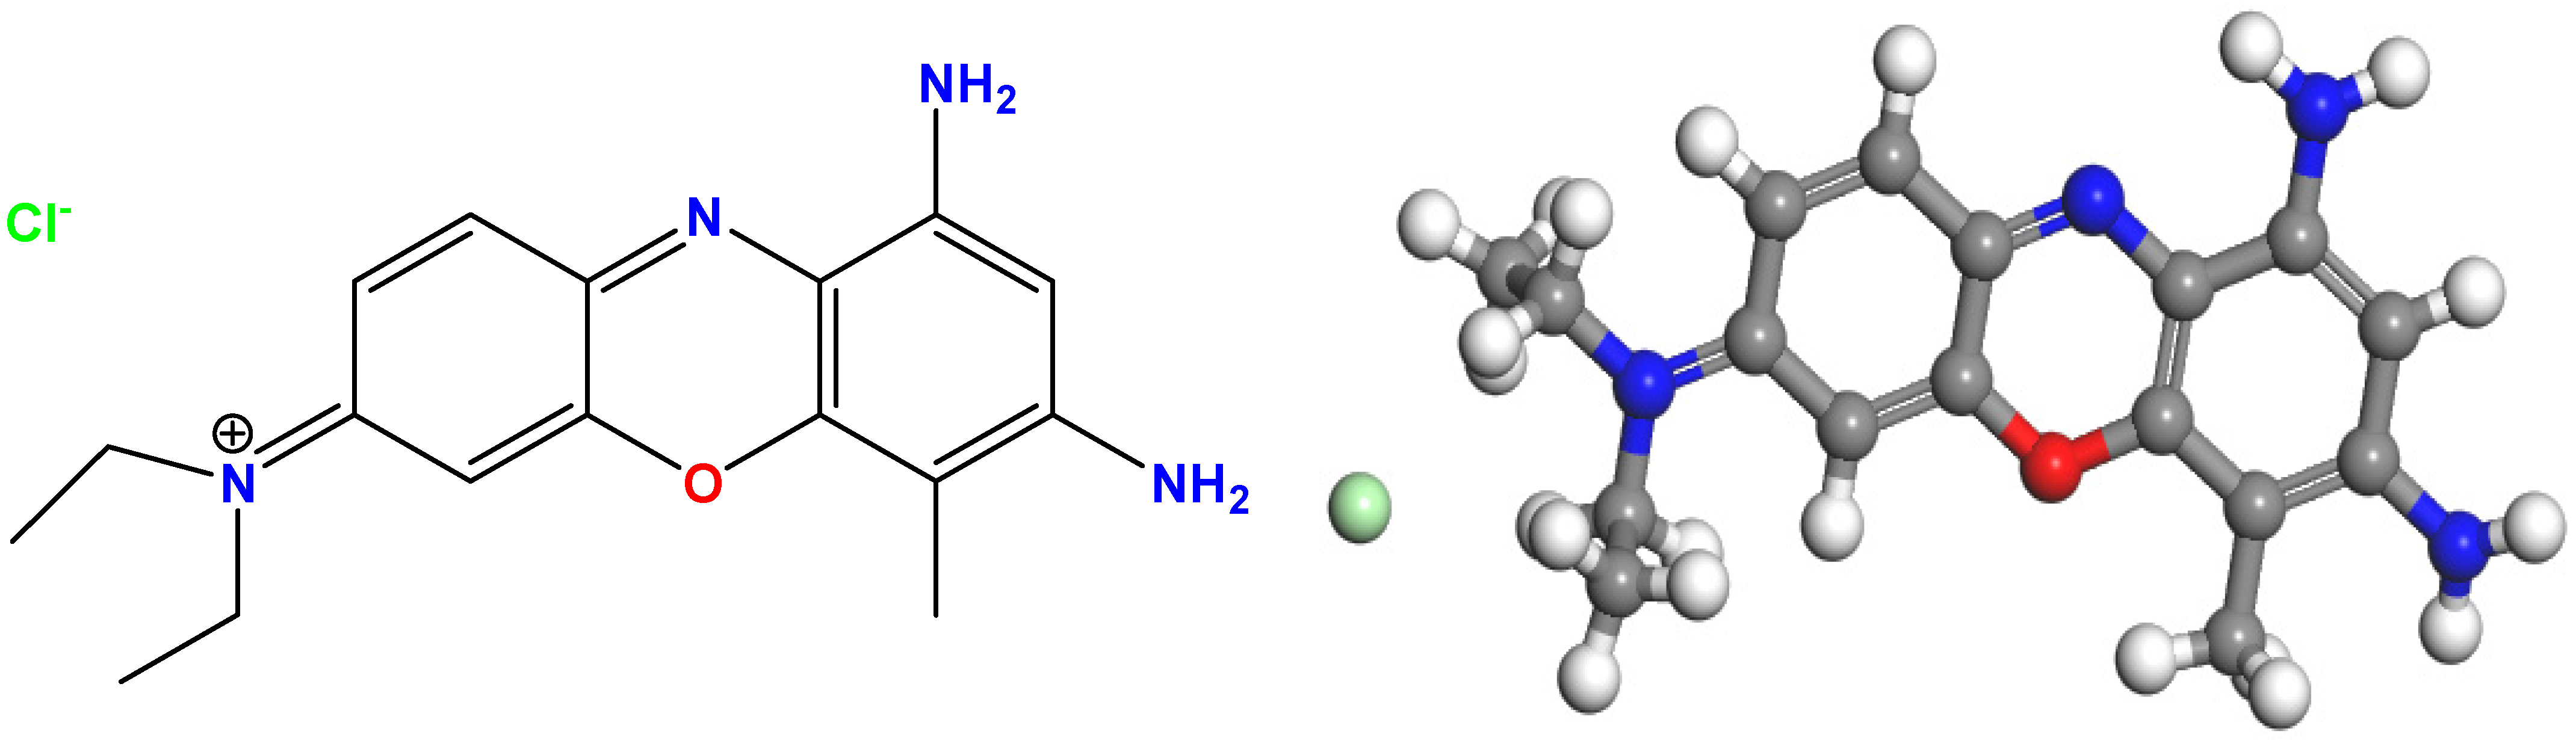
Urea (CH4N2O, Sigma-Aldrich, Munich, Germany), tin(II) chloride dihydrate (SnCl2·2H2O, 98%, Sigma-Aldrich, Munich, Germany), iron(III) chloride hexahydrate (FeCl3·6H2O, 97%, Sigma-Aldrich, Munich, Germany), sodium hydroxide (NaOH, purity ≥ 98%, Merck & Co., Rahway, NJ, USA), and hydrochloric acid (HCl, 37%, Merck & Co.) were used. The structure of brilliant cresyl blue (BCB) is shown in Figure 1 (its molecular formula is C₁₇H2₁ClN4O, its molar mass is 332.84 g·mol−¹, and its λmax = 626 nm) (REACTIFS RAL, Paris, France). Rhodamine B (RhB) and crystal violet (CV) were obtained from Sigma-Aldrich, Munich, Germany, as well as hydrogen peroxide (H2O2, 30%, Merck). All analytical-grade reagents were used as received, without any further purification.

Figure 1.
Chemical structure of brilliant cresyl blue (BCB).
2.2. Synthesis of g-C3N4 and SnFe2O4 Nanoparticles
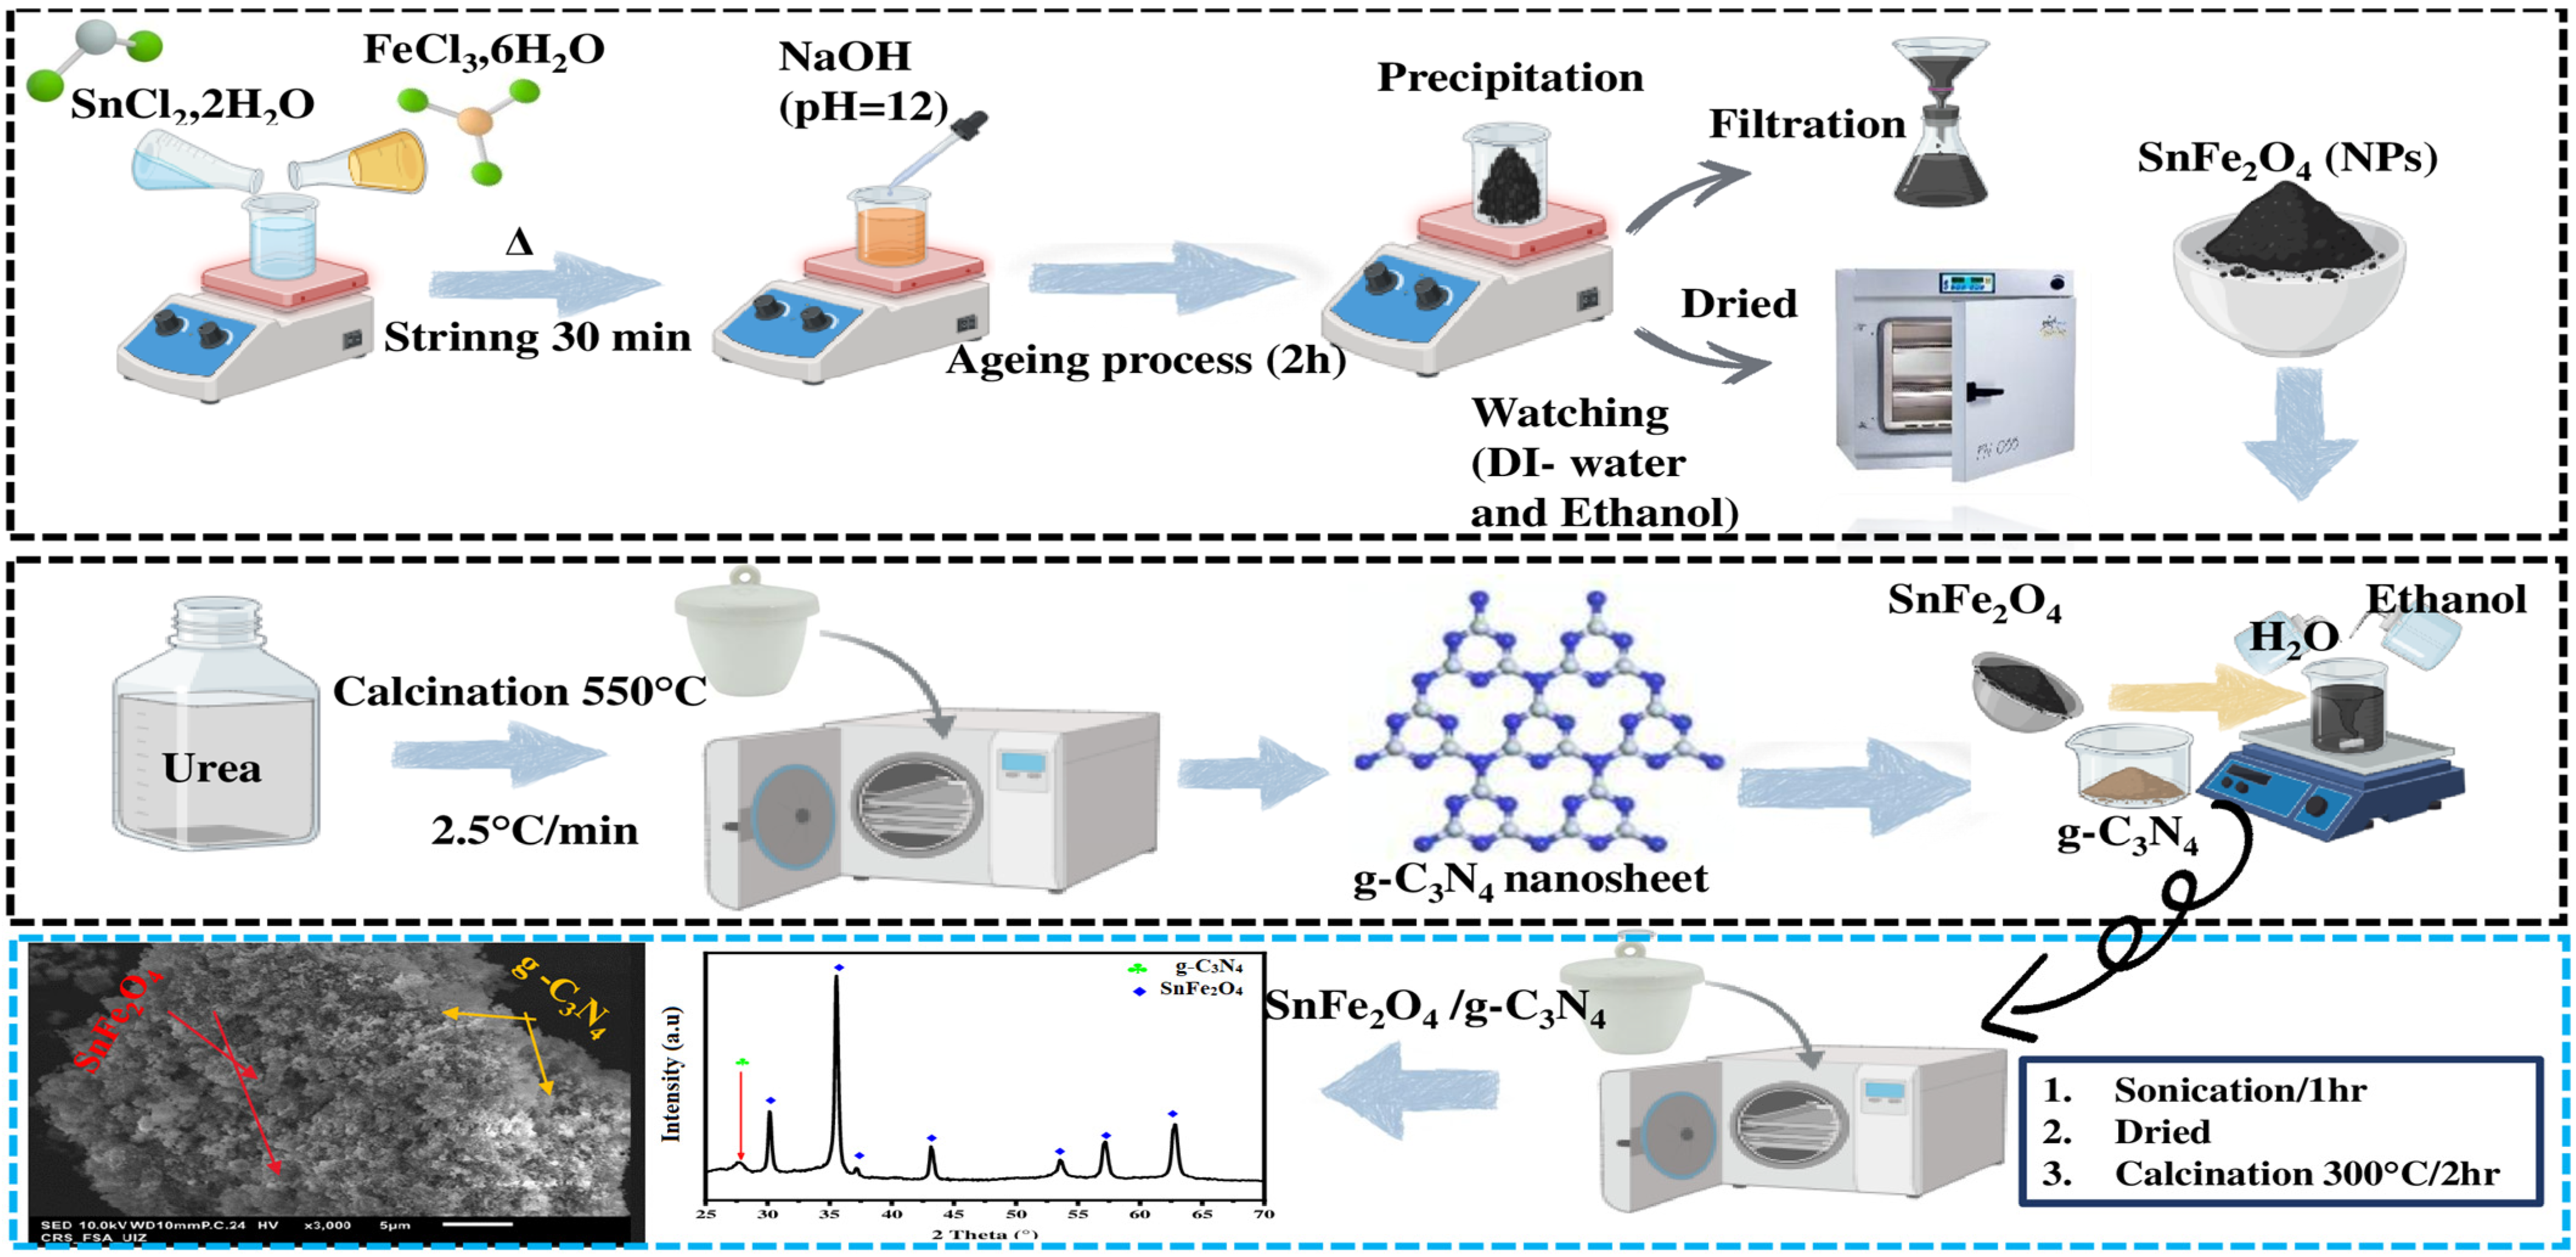
g-C3N4 was synthesized by the calcination of a urea precursor. Typically, 20 g of urea was placed in a ceramic crucible and then heated in a muffle furnace at 550 °C with a heating rate of 2.5 °C min−1 for 4 h.
SnFe2O4 nanoparticles were synthesized using a chemical co-precipitation method. Initially, 1.5 g of SnCl2·2H2O and 3.59 g of FeCl3·6H2O were dissolved in distilled water at a weight ratio of 1:2. The solution was stirred and heated to 60 °C. Once the desired temperature was reached, a 3 M NaOH solution was added dropwise until complete precipitation was achieved, while maintaining a highly basic pH (≈12). When the pH was maintained at 12, the solution was stirred for 2 h. After cooling to room temperature, the solution was decanted. The resulting SnFe2O4 product was washed with ethanol and distilled water until neutralized, then dried in an oven at 80 °C for 12 h. The co-precipitation reaction is described as follows:
SnCl2 + 2FeCl3 + 8NaOH → SnFe2O4 + 4H2O + 8NaCl
2.3. Synthesis of SnFe2O4/g-C3N4 Nanocomposites
SnFe2O4/g-C3N4 nanocomposites with two different proportions of g-C3N4 (5% and 20% by weight) were fabricated. Variable amounts of g-C3N4 and SnFe2O4 were dispersed in a mixture of ethanol and distilled water. After an ultrasonication period of 60 min, the mixture was heated in a water bath at 80 °C with constant stirring to evaporate the solvents. It was then placed in a muffle furnace for 2 h at 300 °C, forming the desired SnFe2O4/g-C3N4 nanocomposites. These nanocomposites were named SnFe2O4/g-C3N4 (5%) and SnFe2O4/g-C3N4 (20%), depending on the proportion of g-C3N4 used. The schematic diagram illustrating the preparation of SnFe2O4/g-C3N4 is presented in Scheme 1.
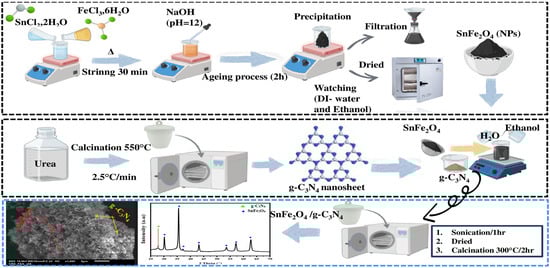
Scheme 1.
The synthesis process of the SnFe2O4/g-C3N4 heterojunction.
2.4. Characterisation
The SnFe2O4/g-C3N4 nanocomposites were characterized using various analytical techniques to assess their properties and structure. Characterization included X-ray diffraction (XRD) to determine the crystal structure and Fourier transform infrared (FTIR) spectroscopy to study chemical bonding, The morphology and microstructure were analyzed by scanning electron microscopy (Supra 40 VP Gemini Zeiss Column, with a maximum voltage of 20 KV), and the elemental composition of the composite was determined by recording its energy dispersive X-ray (EDX) spectra. Additionally, transmission electron microscopy (TEM) and high-resolution transmission electron microscopy (HRTEM) were used to examine the morphological structure and the presence of the heterojunction structure, respectively. These techniques provided detailed information on the physical and chemical properties of the SnFe2O4/g-C3N4 nanocomposites, which is crucial for understanding their potential applications in various fields.
2.5. The Photocatalytic and Photo-Fenton-like Catalytic Activity Test
The photocatalytic activity of the catalysts was evaluated in a glass batch reactor by monitoring the degradation of brilliant cresyl blue (BCB) under irradiation from a commercial 72 W LED lamp (λ ≥ 420 nm, Philips, Amsterdam, The Netherlands). Typically, 30 mg of the synthesized photocatalyst was introduced into a beaker containing 100 mL of an aqueous BCB solution (20 mg L−1). To establish an adsorption–desorption equilibrium, the reaction mixture was kept in the dark for 30 min while being magnetically stirred. During the degradation process, 3 mL of the solution was sampled every 30 min. After centrifugation, the residual solution was analyzed using a UV-Vis spectrophotometer at the maximum absorption wavelength of 626 nm for BCB. For the photo-Fenton-type process, 1 mL of 30 wt% H2O2 was added to the solution after stirring in the dark. After completing the degradation of brilliant cresyl blue (BCB), we tested two additional cationic dyes, rhodamine B (20 mg L−1) and crystal violet (20 mg L−1), to evaluate the effectiveness of the catalyst. Furthermore, to explore the active species involved in the photo-Fenton-like reaction, trapping experiments were conducted under experimental conditions similar to those of the previous experiments but with the addition of different trapping agents into the reaction system. In this study, ethylenediamine tetra acetic acid (EDTA-2Na), isopropyl alcohol (IPA), and L-ascorbic acid (ASC) were used as trapping agents for holes (h+), hydroxyl radicals (•OH), and superoxide anion radicals (O2•–), respectively [33]. The efficiency of degradation (DE%) and the rate constants K (min−1) are determined using Equations (2) and (3) [34], respectively:
Herein, and are the concentrations of the BCB dye at the initial and any time during the photo-Fenton process, respectively. K (min−1) is the constant of the first-order reaction.
2.6. Optimization Results Using the Box–Behnken Method
In 1960, Box and Behnken introduced a new experimental design suitable for second-order models, which facilitates the estimation of certain interactions. One of the main advantages of these experimental models is their ability to minimize the number of experiments needed during the testing phase by pre-identifying specific factors or combinations of factors that affect the response of the studied system [35]. The response surface methodology (RSM) is a set of mathematical and statistical techniques by which we can determine the efficiency or optimal conditions of degradation using Box–Behnken (BBD) models [36]. The parameters are defined at three distinct levels: low, medium, and high, represented by the codes −1, 0, and +1, respectively (Table 1). In this study, we evaluate the degradation efficiency of brilliant cresyl blue by examining the effects of four different factors: catalyst loading (X1), initial concentration of brilliant cresyl blue (X2), volume of H2O2 (X3), and time (X4). The degradation rate of BCB was used as the response variable in this study. A total of 30 experiments were conducted in a randomized order, and the results are available in the Supplementary Materials (Table S1). To evaluate the relevance and significance of the mathematical models proposed by RSM, certain analyses are required, including analysis of variance (ANOVA). The selected mathematical model is a second-degree polynomial, which describes the relationships between independent and dependent variables (Equation (4)) [37]. Experimental design, mathematical modeling, and optimization were performed using Desgn-Expert 13.0.5.0 software.

Table 1.
Actual and coded values of variables in the Box–Behnken design (BBD).
In this equation, Ŷ represents the response function, while β0 is the polynomial constant that reflects the overall mean effect. The coefficients corresponding to the linear, quadratic, and interaction effects are denoted by βi, βii, and βij, respectively. The coded independent variables are represented as Xi and Xj.
2.7. Artificial Neural Network Methodology
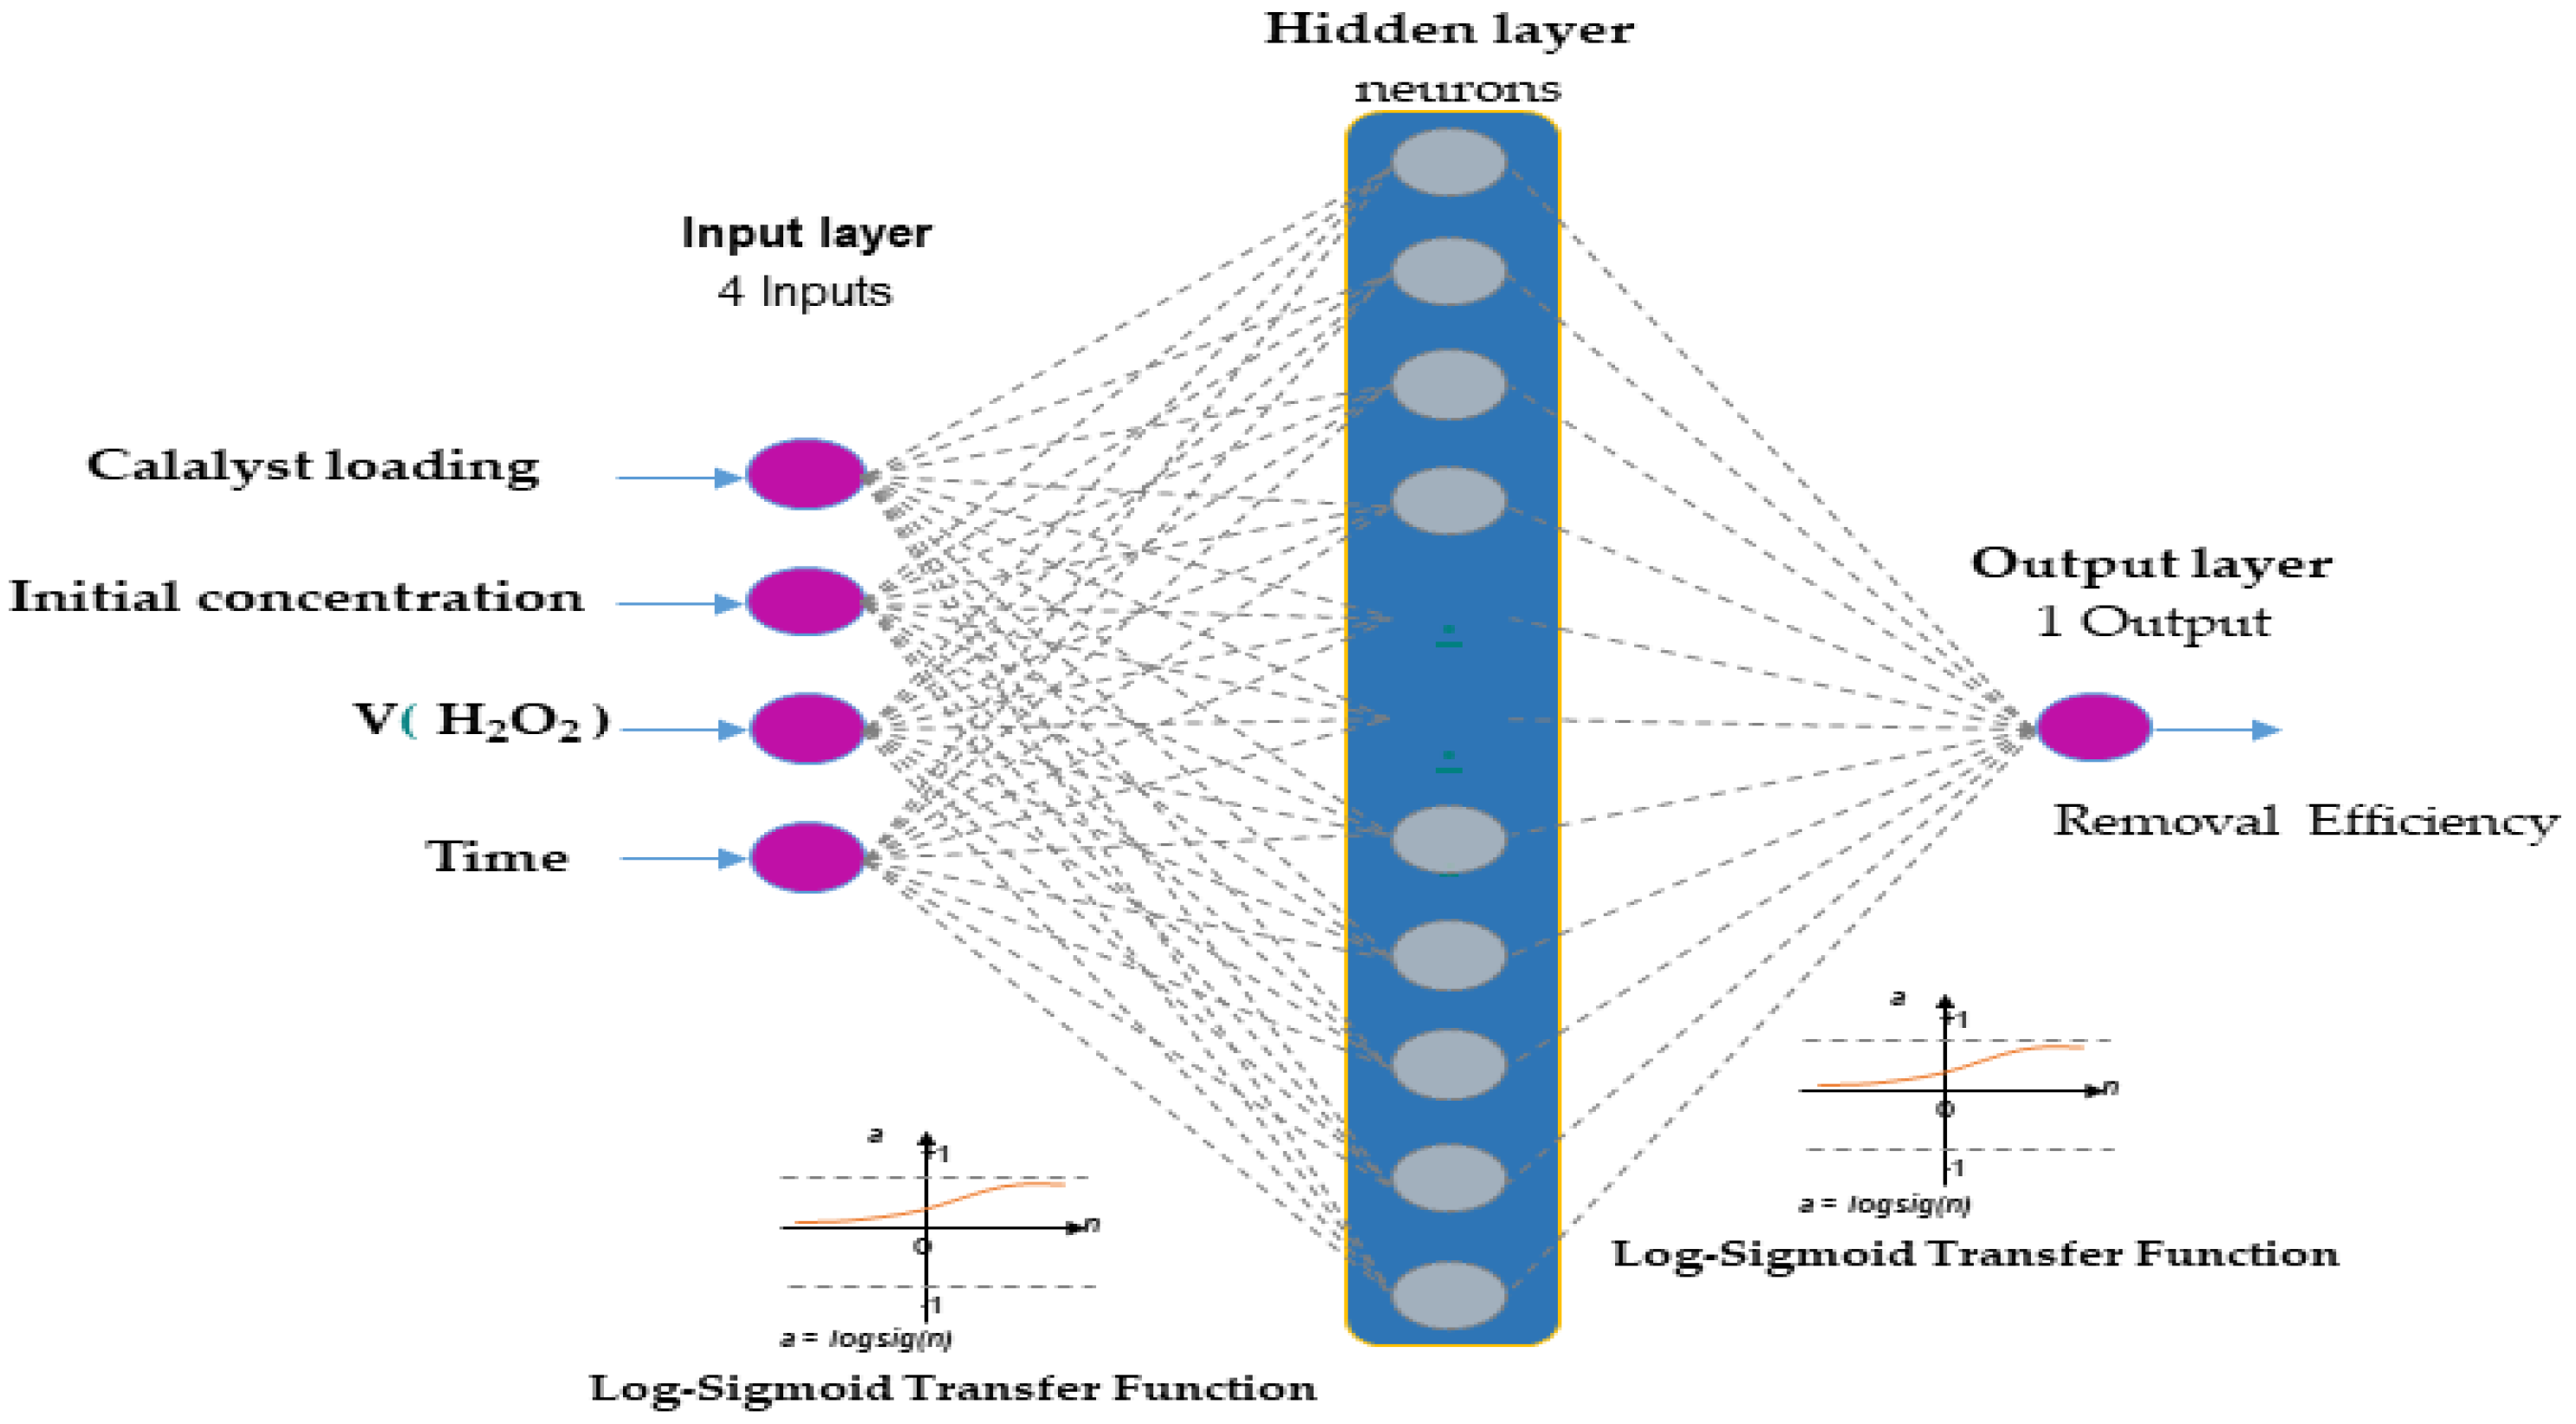
Artificial neural networks (ANNs) are models inspired by the neural architecture of intelligent organisms, which learn and acquire knowledge through experience. ANNs serve as a tool for polynomial regression modeling, facilitating data processing and analysis. An artificial neural network is made up of three main components: an input layer, one or more hidden layers, and an output layer. Each layer is made up of a large number of units called neurons connected by links, to which values called weights are assigned; this enables communication between the neurons [38].
The ANN used in this study was a four-layer neural network trained with the gradient descent backpropagation algorithm. The experimental data obtained was randomly divided into three sets: 20 for training, 5 for testing, and 5 for validation. The Levenberg–Marquardt algorithm updated the weights and biases of the training datasets, while the testing process assessed the extent to which the network had learned to generalize. In addition, during training, errors in the validation data were also observed to check for overlearning.
The optimal structure of the ANN model in this study is presented in Figure 2. A hyperbolic tangent function (tansig) with a sigmoid slope was used as the transfer function (purelin) for the neurons in the hidden layer, while linear functions were used for the neurons in the input and output layers, respectively. The input and output layers comprised 4 and 1 neurons, respectively. To determine the optimal number of neurons in the hidden layer, different topologies were evaluated, with the number of neurons ranging between 2 and 18. Each topology was repeated 10 times to avoid any random association due to the random initialization of weights and biases [39]. All calculations were performed using MATLAB R2024b.
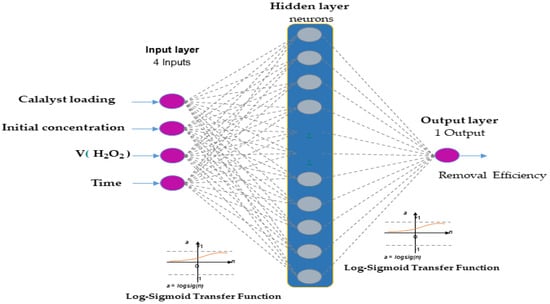
Figure 2.
Artificial neural network architecture composed of four input nodes, hidden nodes, and one output node.
2.8. Statistical Analysis
The quality of the fit between the experimental data and the outcomes of the photo-Fenton process was assessed using error metrics including the coefficient of determination (R2), root mean square error (RMSE), and mean absolute error (MAE). Additionally, these parameters were also employed to compare the RSM-BBD and ANN methods. R2 represents the proportion of variation in the dependent variable explained by the independent variables and is commonly used to indicate this proportion of variation. RMSE is the square root of the mean squared errors [38,40], and it is an absolute error metric primarily used for model fitting, validation, selection, comparisons, and forecast evaluations [41]. MAE denotes the average deviation between the observed and predicted values, reflecting the average total deviation within the dataset. Table S2 in the Supplementary Materials provides the various equations used to calculate these metrics.
3. Results and Discussion
3.1. Structural Analysis
3.1.1. XRD Analysis
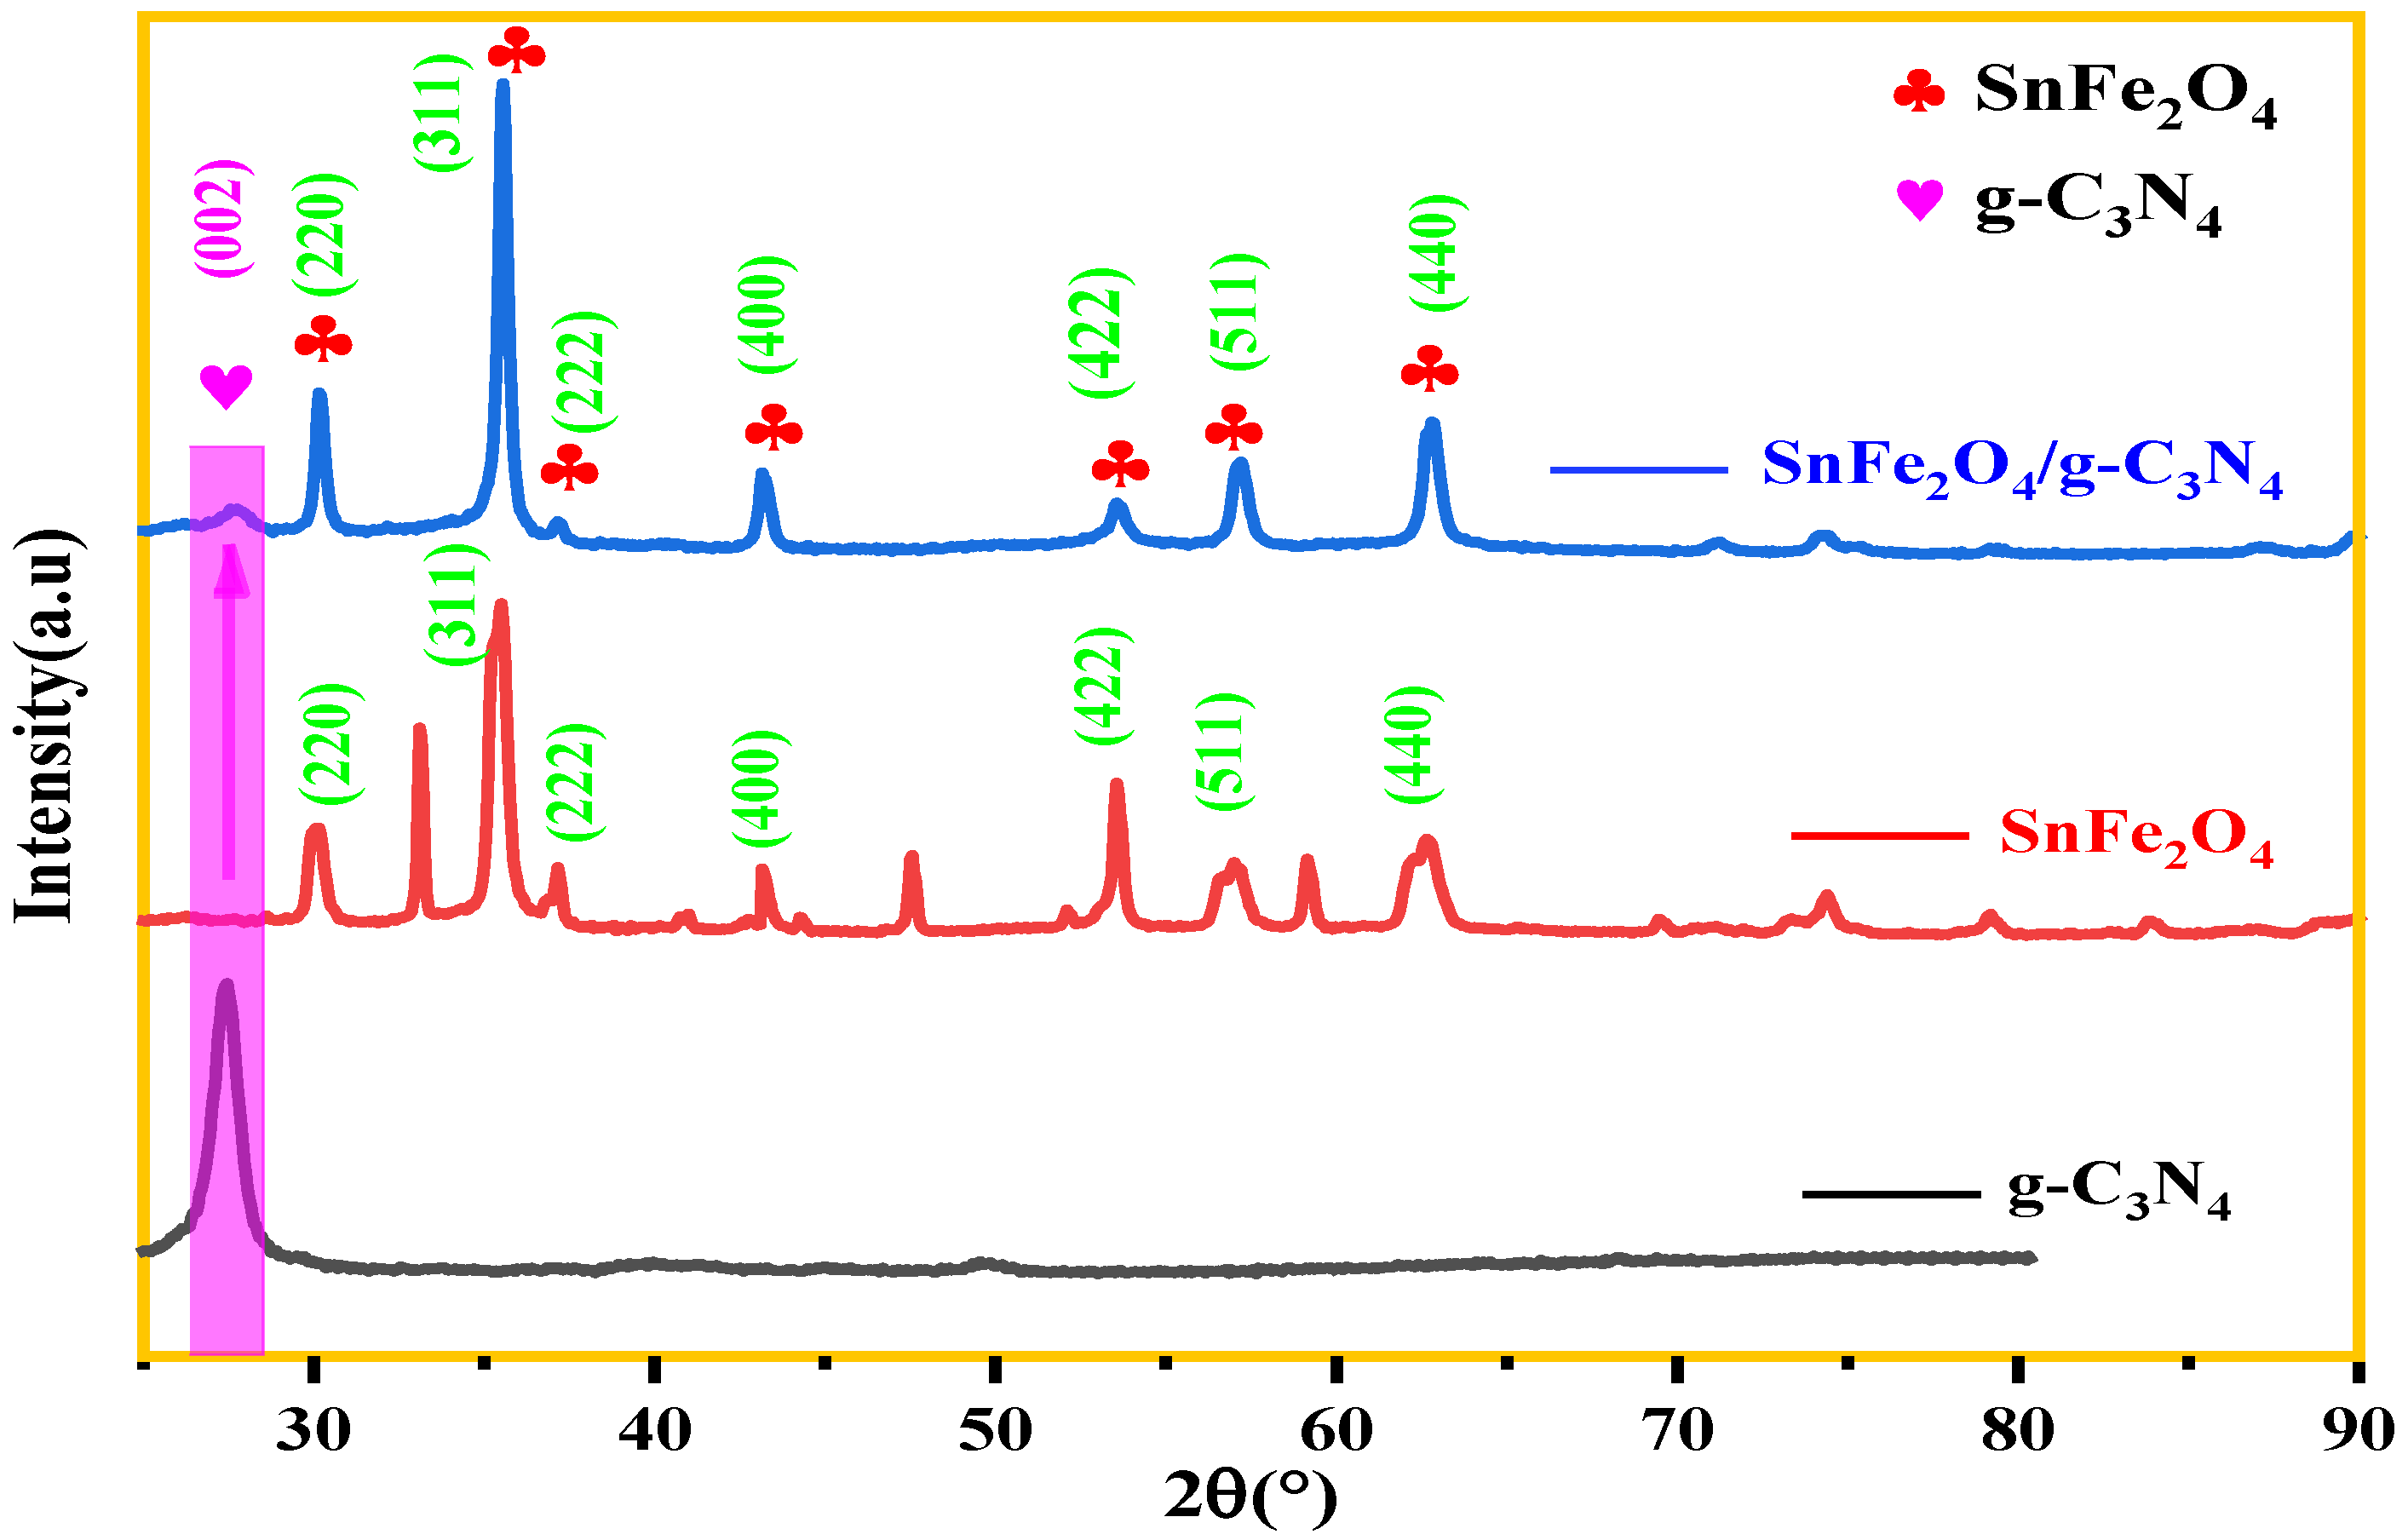
The X-ray diffraction (XRD) patterns of the photocatalysts g-C3N4, SnFe2O4, and SnFe2O4/g-C3N4 (20%) are shown in Figure 3. It can be seen that the diffraction peaks of synthesized SnFe2O4 via the co-precipitation method correspond well to the standard pattern of a cubic spinel structure SnFe2O4 (PDF #11-0614) [42]. In the CN pattern, the intense peak at 27.524°, which correspond to a d-spacing of 0.32 nm, can be indexed to the (002) diffraction plane, associated with the characteristic interplanar stacking of conjugated aromatic networks [43].
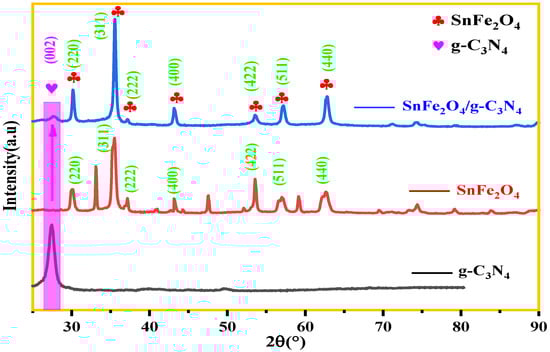
Figure 3.
XRD patterns of g-C3N4, SnFe2O4, and SnFe2O4/g-C3N4 (20%).
Diffraction peaks of pure SnFe2O4 at 2θ = 30.137°, 35.65°, 43.165°, 57.155°, and 62.564° can be indexed on the (220), (311), (400), (511), and (440) diffraction planes, respectively, corresponding well to the reflections of the SnFe2O4 spinel structure reported in the literature [44,45]. Another detected diffraction peak indicated the presence of an α-Fe2O3 phenomena similar to what was previously reported [46,47]. When SnFe2O4 is coupled with g-C3N4, no impurity phases such as iron oxide were detected or identified, indicating the achieved preparation of SnFe2O4/g-C3N4 (20%) hybrids. The XRD diffraction patterns of SnFe2O4/g-C3N4 (20%), thus, show hybrid formation. Similar results can also be found in others systems [42].
3.1.2. FTIR Analysis
The FTIR data of composite samples (gC3N4, SnFe2O4, and SnFe2O4/g-C3N4 (20%)) are illustrated in Figure 4. The spectra analysis of gC3N4 has disclosed three predominant adsorption zones: a broad band located between 3000 and 3400 cm−1 attributed to stretching vibrations of non-condensed amino groups (N-H), another band with sharp intensity was detected at 804 cm−1 corresponding to the characteristic respiration of tri-s-triazine heterocycles, along with bands in the range of 1200–1700 cm−1 arising from the vibrational stretching of the C-N bond inside the tri-s-triazine cycles. In the case of SnFe2O4, a distinctive absorption peak at 564 cm−1 was observed, associated to the vibrations of Fe-O bonds, consistent with the formation of the spinel structure of ferrite. Significantly, the main characteristics peaks of g-C3N4 and SnFe2O4 are present in the spectrum of the SnFe2O4/g-C3N4 (20%) composite, indicating the accomplished formation of the composite material.
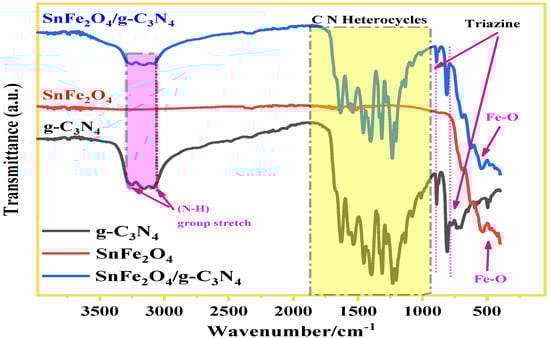
Figure 4.
FT-IR spectra of SnFe2O4, g-C3N4, and SnFe2O4/g-C3N4 (20%).
3.2. Morphological Analysis
3.2.1. SEM/EDX Analysis Results
The SEM and EDX characterization of g-C3N4, SnFe2O4, and SnFe2O4/g-C3N4 (20%) is presented in Figure 5 and Figure S1. g-C3N4 exhibits a folded and irregular sheet structure (Figure 5a), which enhances electron transmission capacity, improves light absorption performance, and extends the lifetime of photoexcited charge carriers. The spinel structure of SnFe2O4, along with intergranular pores and voids, is visible in Figure 5b. Additionally, the surface of g-C3N4 appears very rough, with a large number of SnFe2O4 nanoparticles attached (Figure 5c). Furthermore, the EDX diagram displays the elements of the SnFe2O4/g-C3N4 (20%) composite material, with carbon (C), nitrogen (N), oxygen (O), iron (Fe), and tin (Sn) atoms uniformly distributed on the SnFe2O4/g-C3N4 (20%) photocatalyst composite (Figure S1), confirming the successful synthesis of the SnFe2O4/g-C3N4 (20%) photocatalyst composite [48].
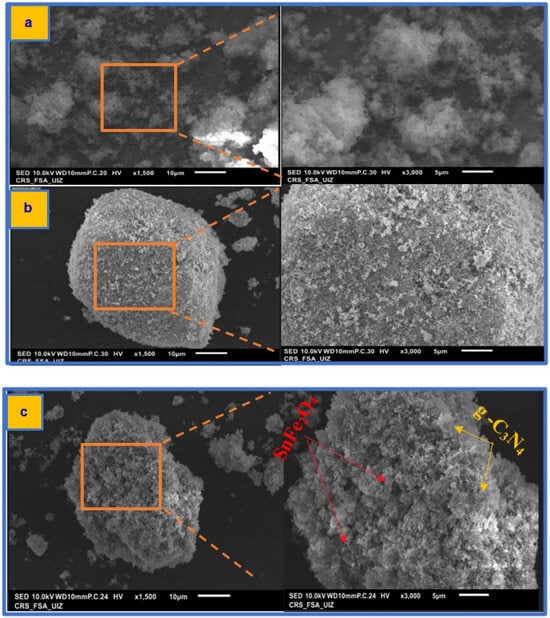
Figure 5.
SEM images of (a) g-C3N4, (b) SnFe2O4, and (c) SnFe2O4/g-C3N4 (20%).
3.2.2. TEM Analysis Results
The successful synthesis is confirmed by the TEM image of the SnFe2O4/g-C3N4 (20%) hybrid shown in Figure 6a–c. Two distinct phases are clearly visible: g-C3N4 (light region) and SnFe2O4 (dark region), in close contact and forming an intimate interface. This observation demonstrates that the SnFe2O4 (SFO) nanoparticles, with an average diameter of approximately 16 nm, have effectively covered the surface of g-C3N4. These results are fully consistent with the analyses by X-ray diffraction (XRD). Furthermore, the HRTEM (high-resolution transmission electron microscopy) image of the SnFe2O4/g-C3N4 (20%) hybrid (Figure 6d) reveals lattice fringes with interplanar spacings of 0.32 nm and 0.253 nm, corresponding to the (002) plane of g-C3N4 and the (311) plane of SnFe2O4, respectively [29,48].
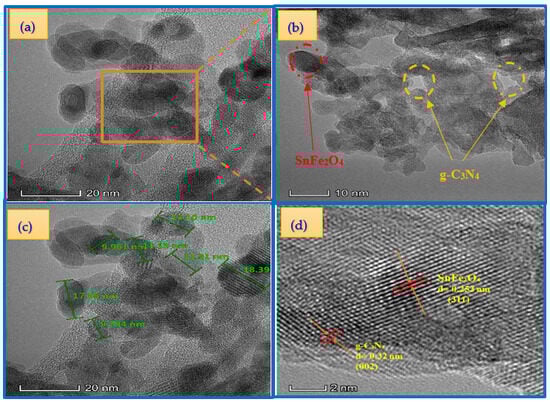
Figure 6.
TEM (a–c) and HRTEM (d) images of the SnFe2O4/g-C3N4 (20%).
3.3. Photo-Fenton-like Catalytic and Photocatalytic Performance
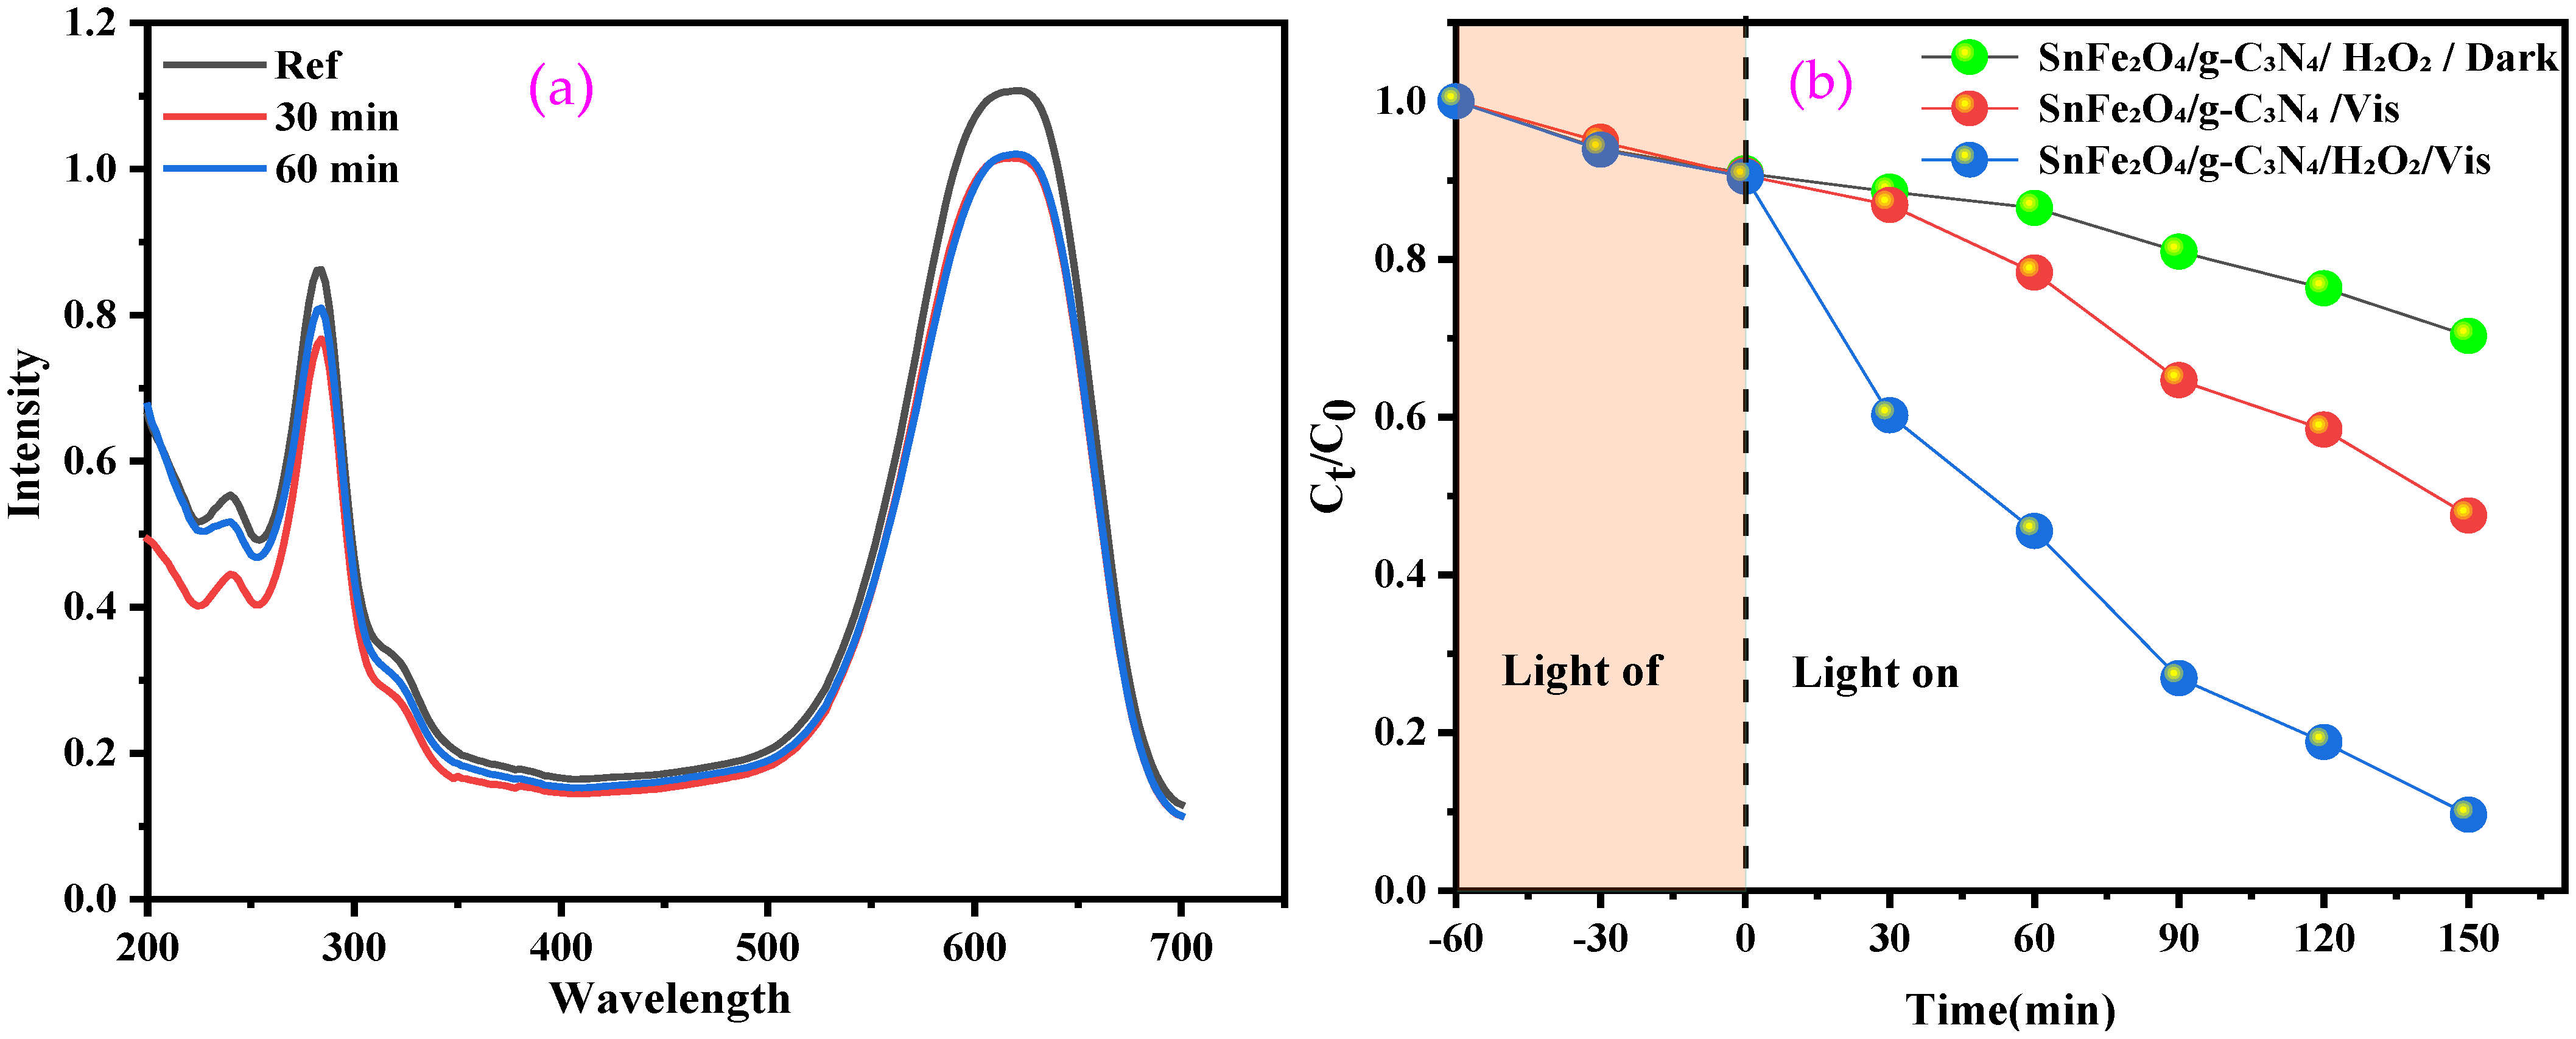
Dye adsorption plays a crucial role in the efficiency of photocatalytic degradation, particularly for semiconductors, where the adsorbed dye molecules act as electron donors, facilitating the transfer of excited electrons to the conduction band of the semiconductor under visible-light irradiation [49]. A study was conducted on the adsorption of the BCB dye on the surface of the SnFe2O4/g-C3N4 composite by maintaining the dye solution with the necessary amount of catalyst in the dark, without H2O2, for 60 min. At the end of the experiment, negligible adsorption (<10%) was observed (Figure 7a).
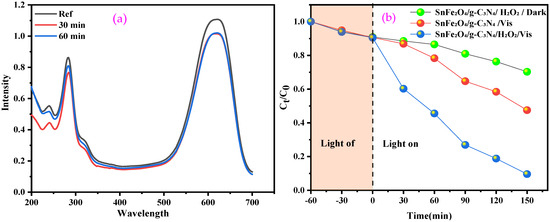
Figure 7.
(a) Adsorption of BCB by SnFe2O4/g-C3N4; (b) Fenton-like, photocatalytic, and photo-Fenton-like of BCB in the presence of SnFe2O4/gC3N4.
The efficiency of the photocatalytic and photo-Fenton-like degradation of BCB over time, using SnFe2O4/g-C3N4 nanocomposites, was evaluated under visible light. The order of BCB degradation follows this sequence: SnFe2O4/g-C3N4/H2O2/Vis > SnFe2O4/g-C3N4/Vis > SnFe2O4/g-C3N4/H2O2/Dark (Figure 7b). This demonstrates that the combination of the catalyst, visible light, and H2O2 offers the best degradation performance. Conversely, the absence of H2O2 during photocatalysis significantly reduces efficiency, as the process mainly relies on the separation of electron–hole pairs and the generation of radicals on the catalyst’s surface, which is often hindered by charge recombination.
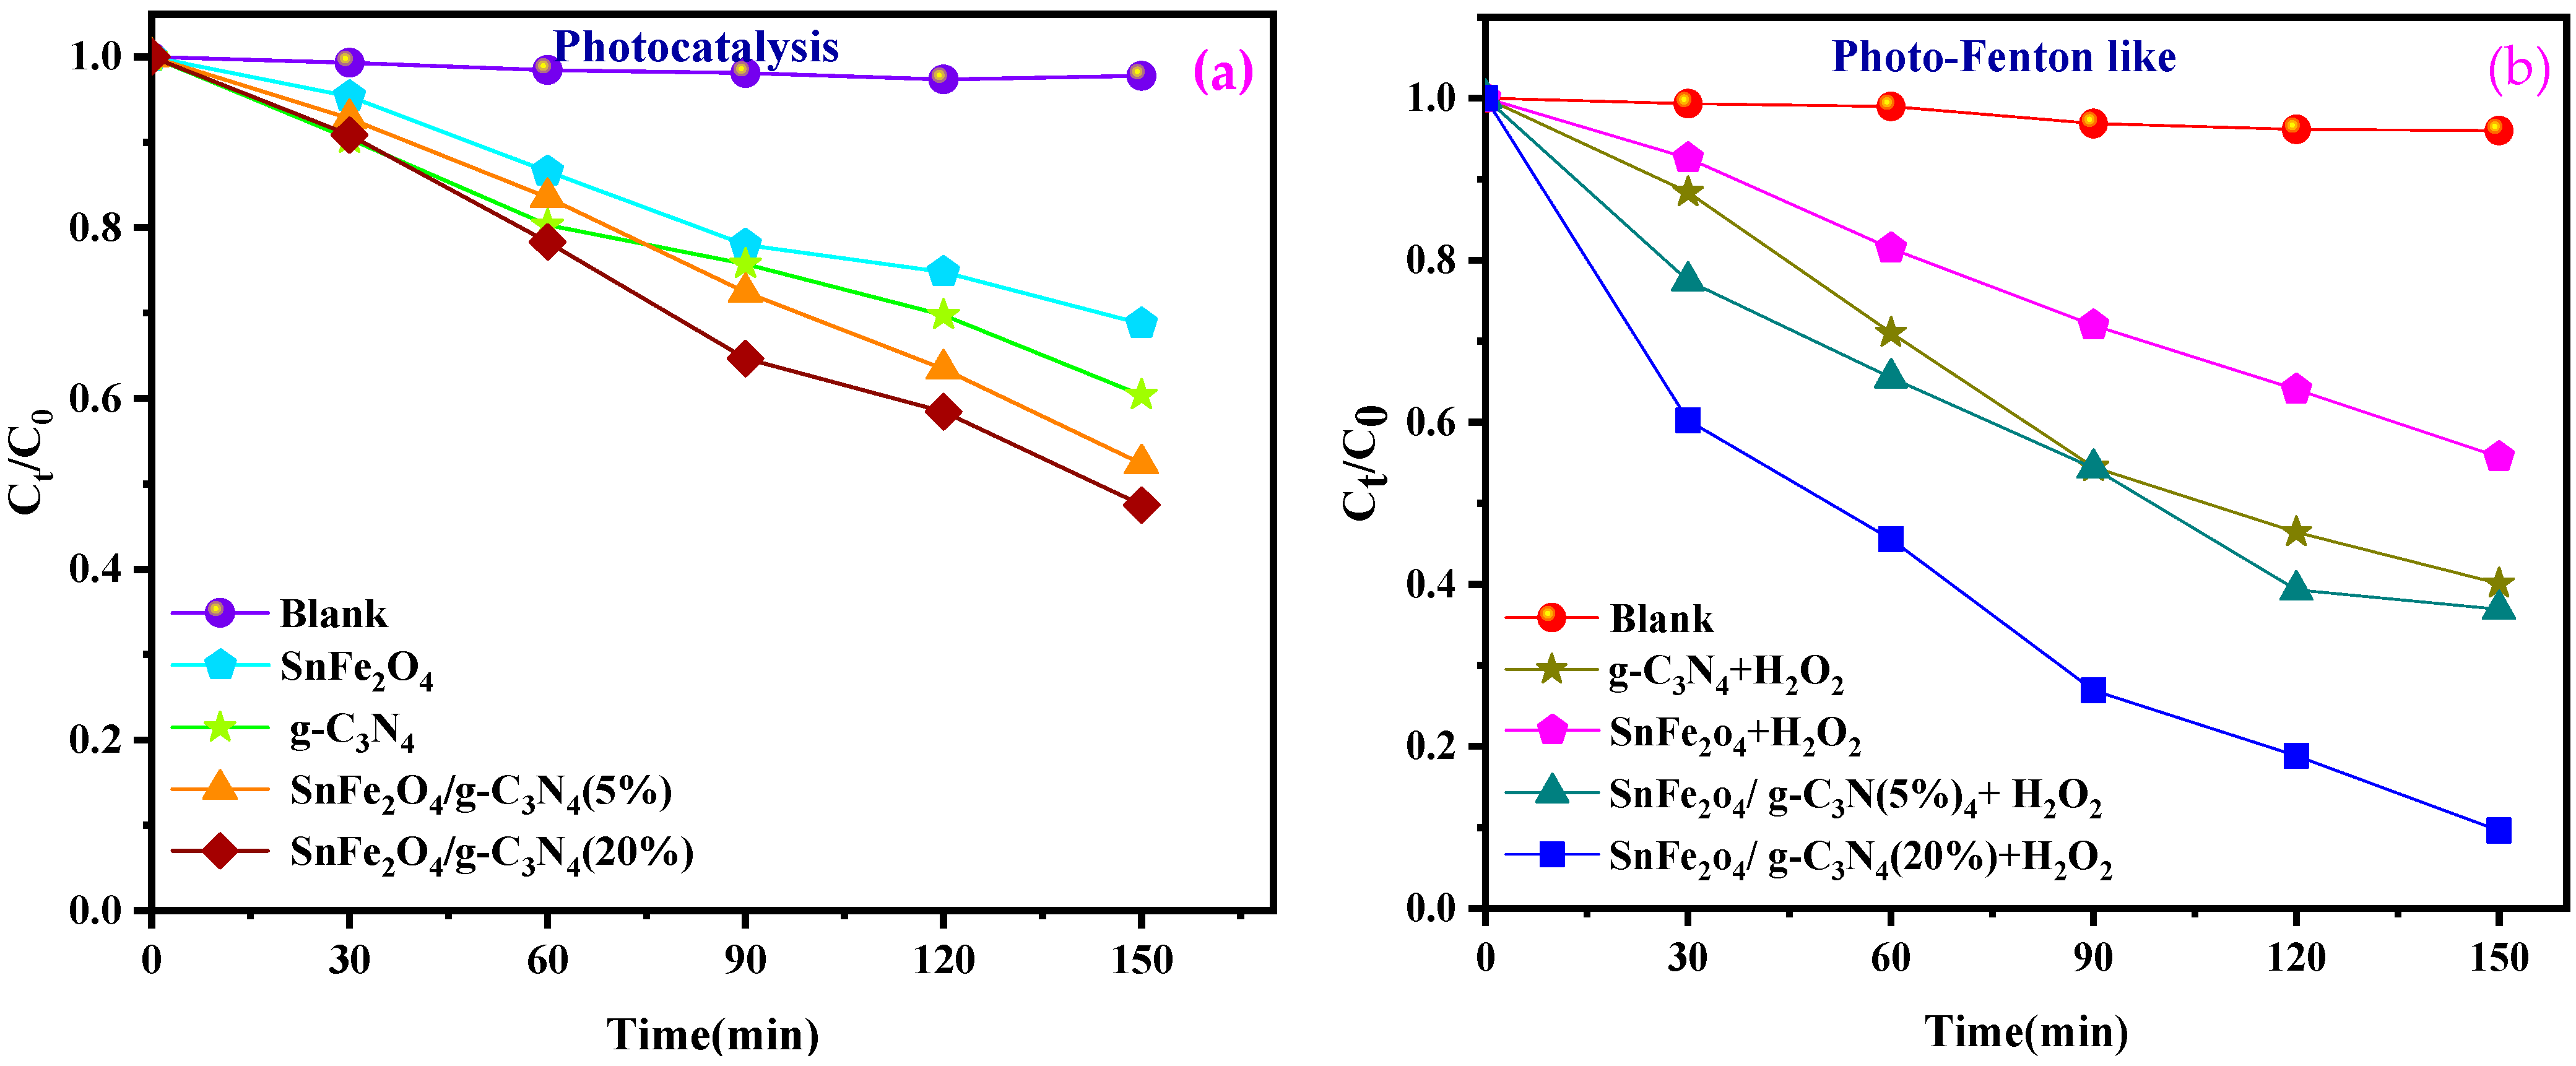
Figure 8a,b illustrates the progression of the photocatalytic and photo-Fenton-like degradation of BCB over time for the various samples. In all photocatalytic and photo-Fenton-like experiments, the SnFe2O4/g-C3N4 (20%) composites exhibited significantly enhanced photocatalytic activity for dye degradation compared to pure SnFe2O4 nanoparticles, g-C3N4 nanosheets, and SnFe2O4/g-C3N4 (5%). Furthermore, the percentage of dye degradation during 150 min of reaction is indicated in Figure 8c,d. Among the tested composites, the one with 20% g-C3N4 showed the highest photo-Fenton-like activity, achieving a degradation rate of 94.4% during 150 min of reaction (Figure 8d). Additionally, the control experiments confirmed that BCB remains stable during the photocatalytic and photo-Fenton-like processes in the absence of the photocatalyst. This indicates that dye removal is not solely due to surface adsorption but also involves the degradation of adsorbed dye molecules and their release from the catalytic sites.
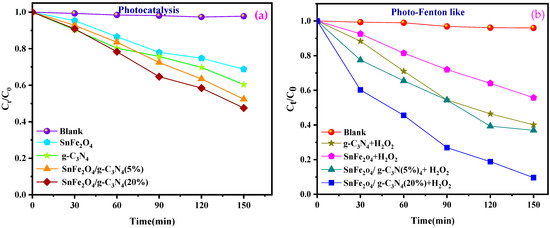
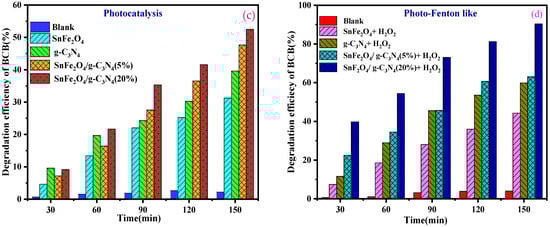
Figure 8.
(a,b) Photocatalytic degradation, photo-Fenton-like as a function of time of BCB by the samples, respectively. (c,d) Degradation efficiency of BCB dye for photocatalytic degradation and photo-Fenton-like.
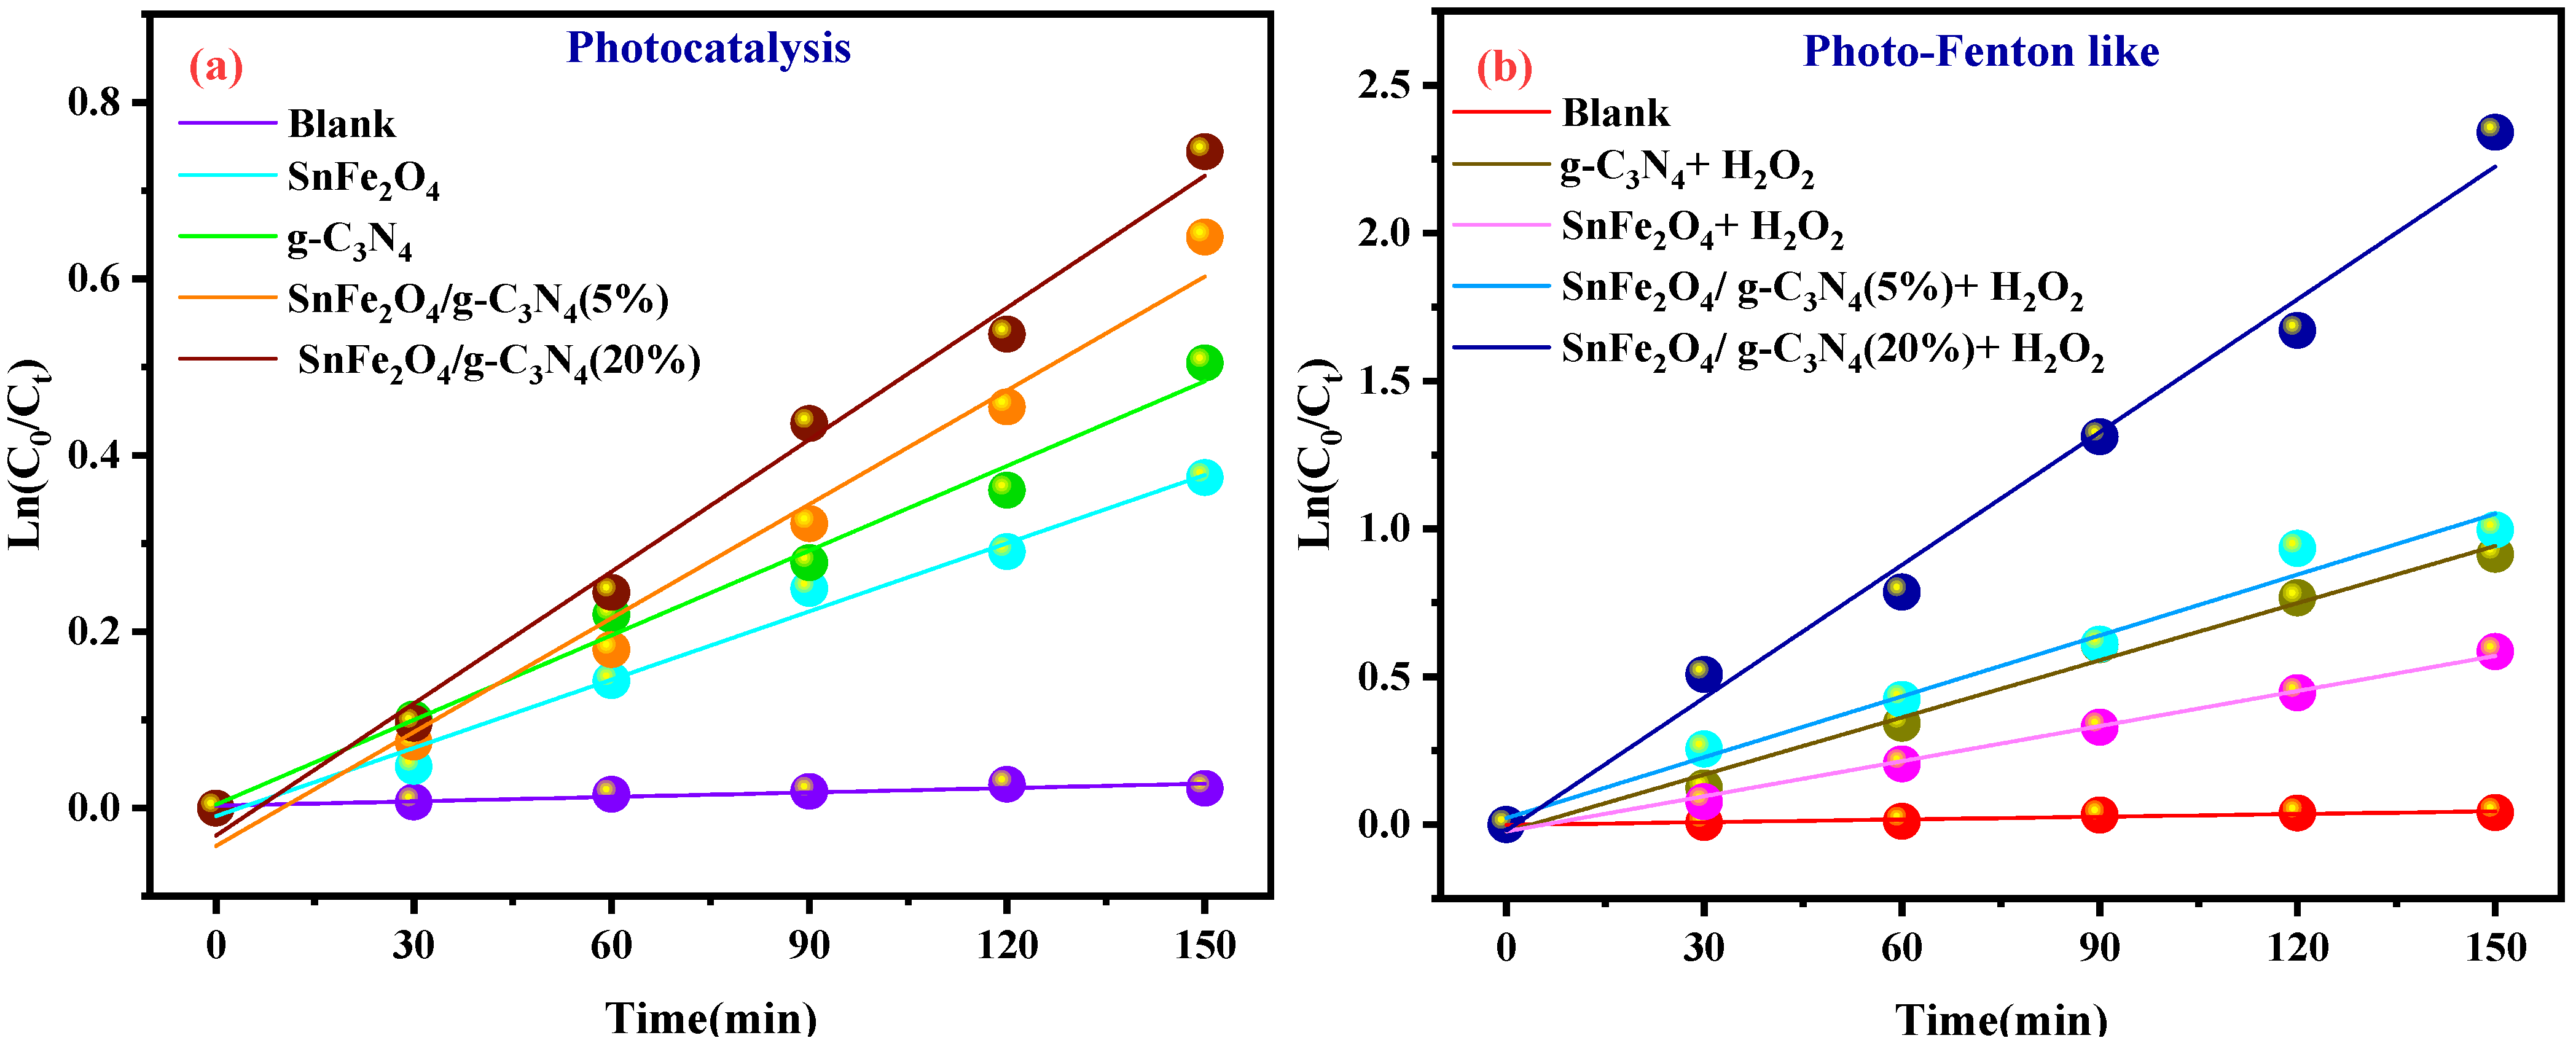
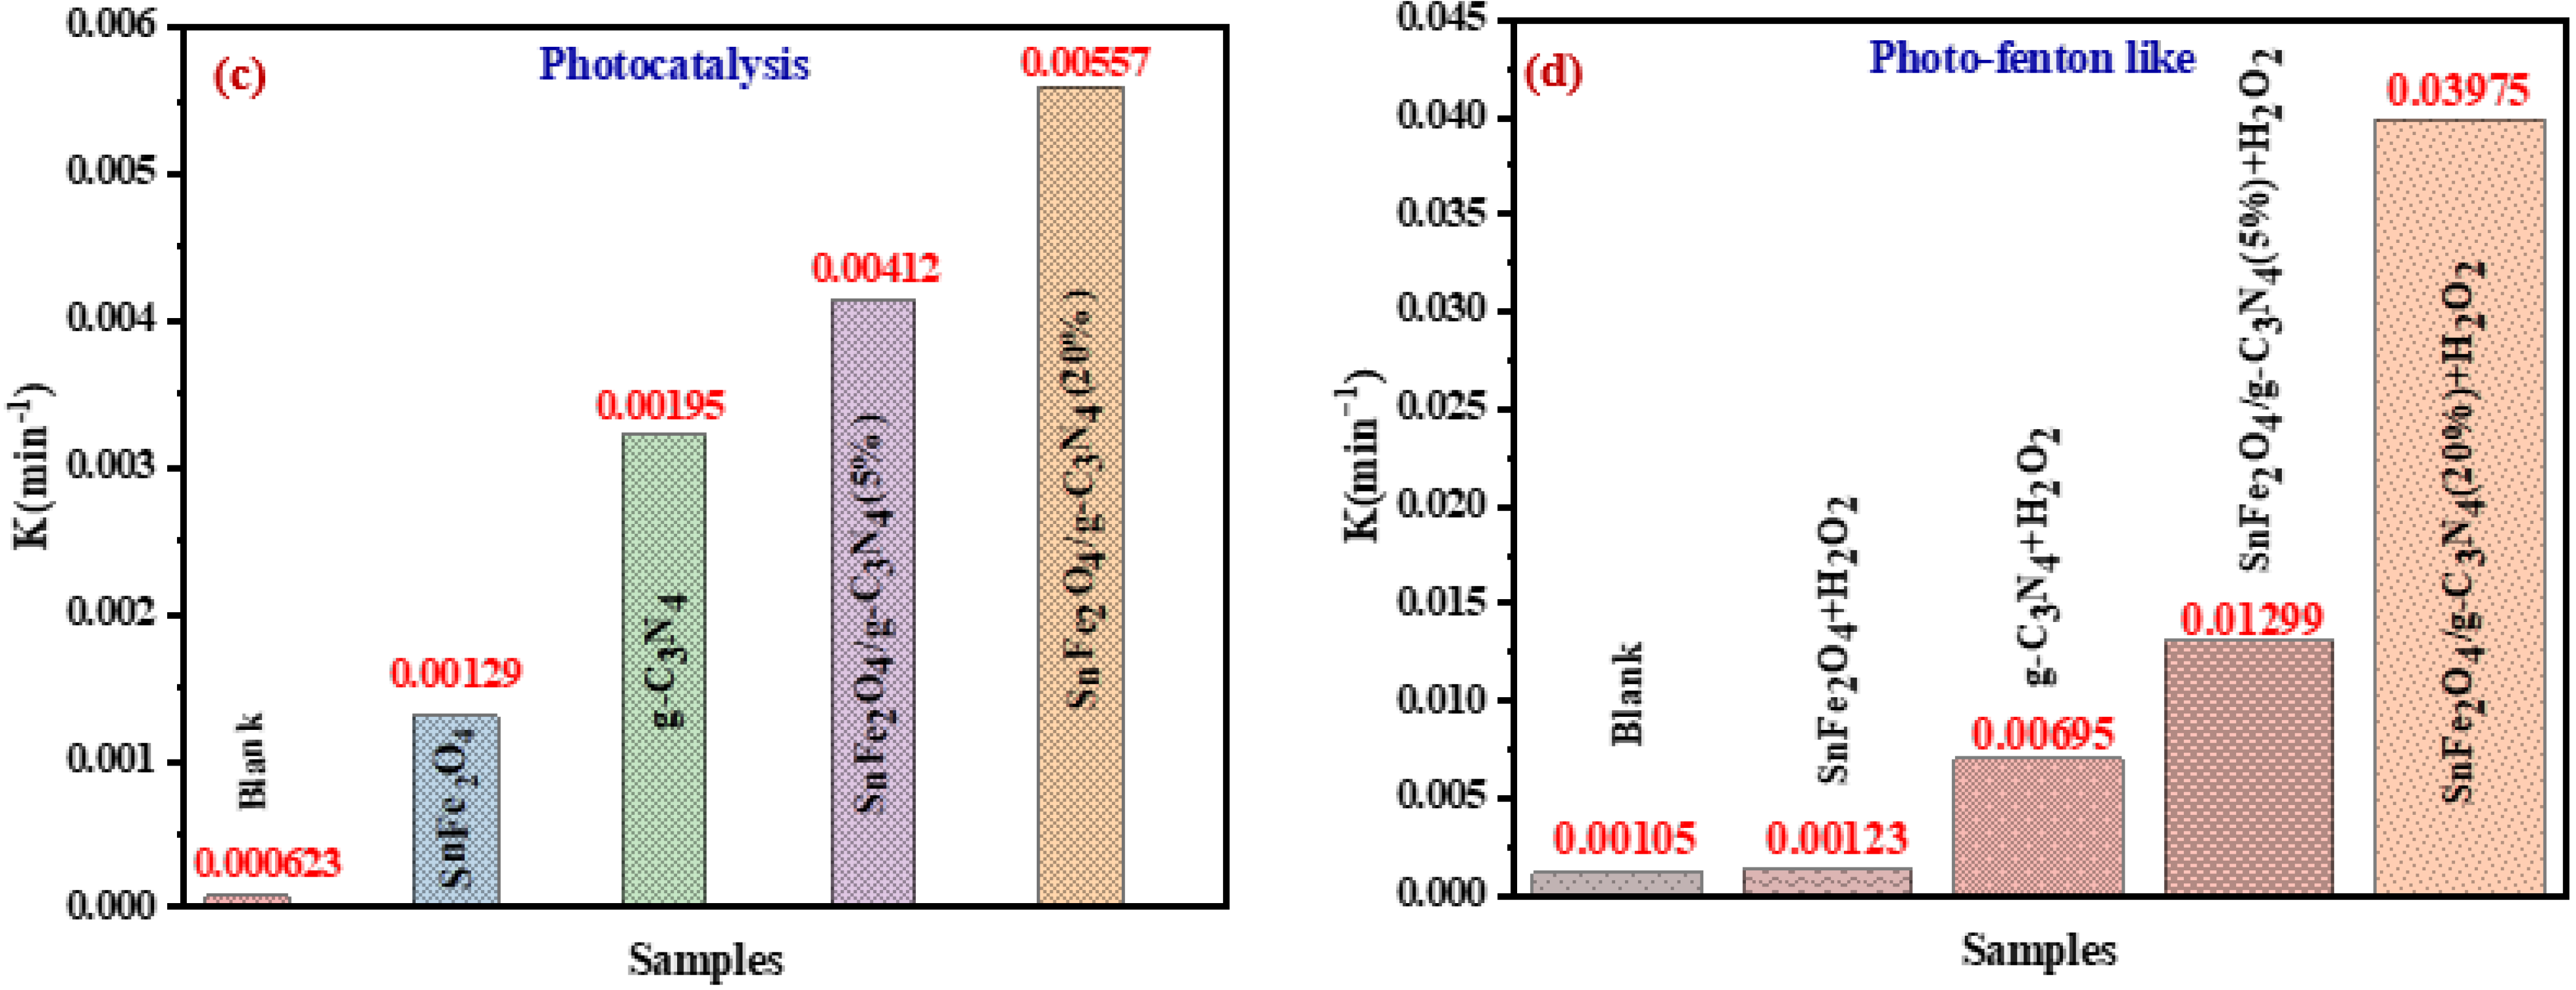
Figure 9a,b shows the plots of Ln (Ct/C0) versus irradiation time for the photocatalytic and photo-Fenton-like degradation of BCB, respectively, while the reaction rate constants are illustrated in Figure 9c,d. The rate constants for the photo-Fenton-like processes (0.0069, 0.00123, 0.01299, and 0.03975 min−1 for SnFe2O4, g-C3N4, SnFe2O4/g-C3N4 (5%), SnFe2O4/g-C3N4 (20%), respectively) are higher than those for the photocatalytic processes (0.00129, 0.00195, 0.00412, and 0.00557 min−1) for all catalysts (Figure 9c,d). It has been demonstrated that the Fenton-like photocatalytic reaction with SnFe2O4/g-C3N4 (20%) exhibits a reaction rate approximately 7.13 times higher than that of the standard photocatalytic reaction.
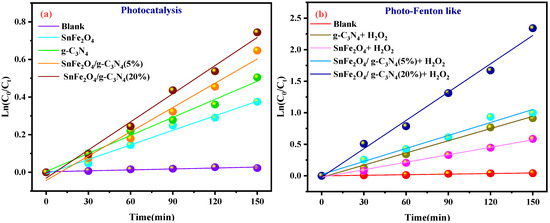

Figure 9.
(a,b) Ln(Ct/C0) graphs as a function of irradiation time; (c,d) kinetic curves of the samples for the photocatalytic degradation and photo-Fenton-like activity of BCB, respectively.
Additionally, further tests were conducted using other cationic dyes, such as rhodamine B and crystal violet, to evaluate the catalytic efficiency of the system. As illustrated in Figure S2b,c, the results revealed that the SnFe2O4/g-C3N4 (20%) composite also demonstrated remarkable efficiency in degrading these dyes, confirming the versatility of this catalyst for treating wastewater containing various cationic dyes.
Finally, it was observed that the photo-Fenton-like performance of the samples was significantly superior to their photocatalytic performance, suggesting that photo-Fenton-like catalysis is more effective for treating wastewater containing cationic dyes. Furthermore, the degradation capacity of the synthesized photocatalysts was compared to that of other heterojunction photocatalysts, as presented in Table 2. To further explore these performances, additional photo-Fenton-like degradation experiments were conducted using the SnFe2O4/g-C3N4 (20%) composite as the photocatalyst, studying the effects of the amount of photocatalyst, initial concentration, as well as the H2O2 content and pH of the solution on BCB degradation.
Table 2.
Comparison of different catalysts.
3.3.1. The Effect of Catalyst Loading
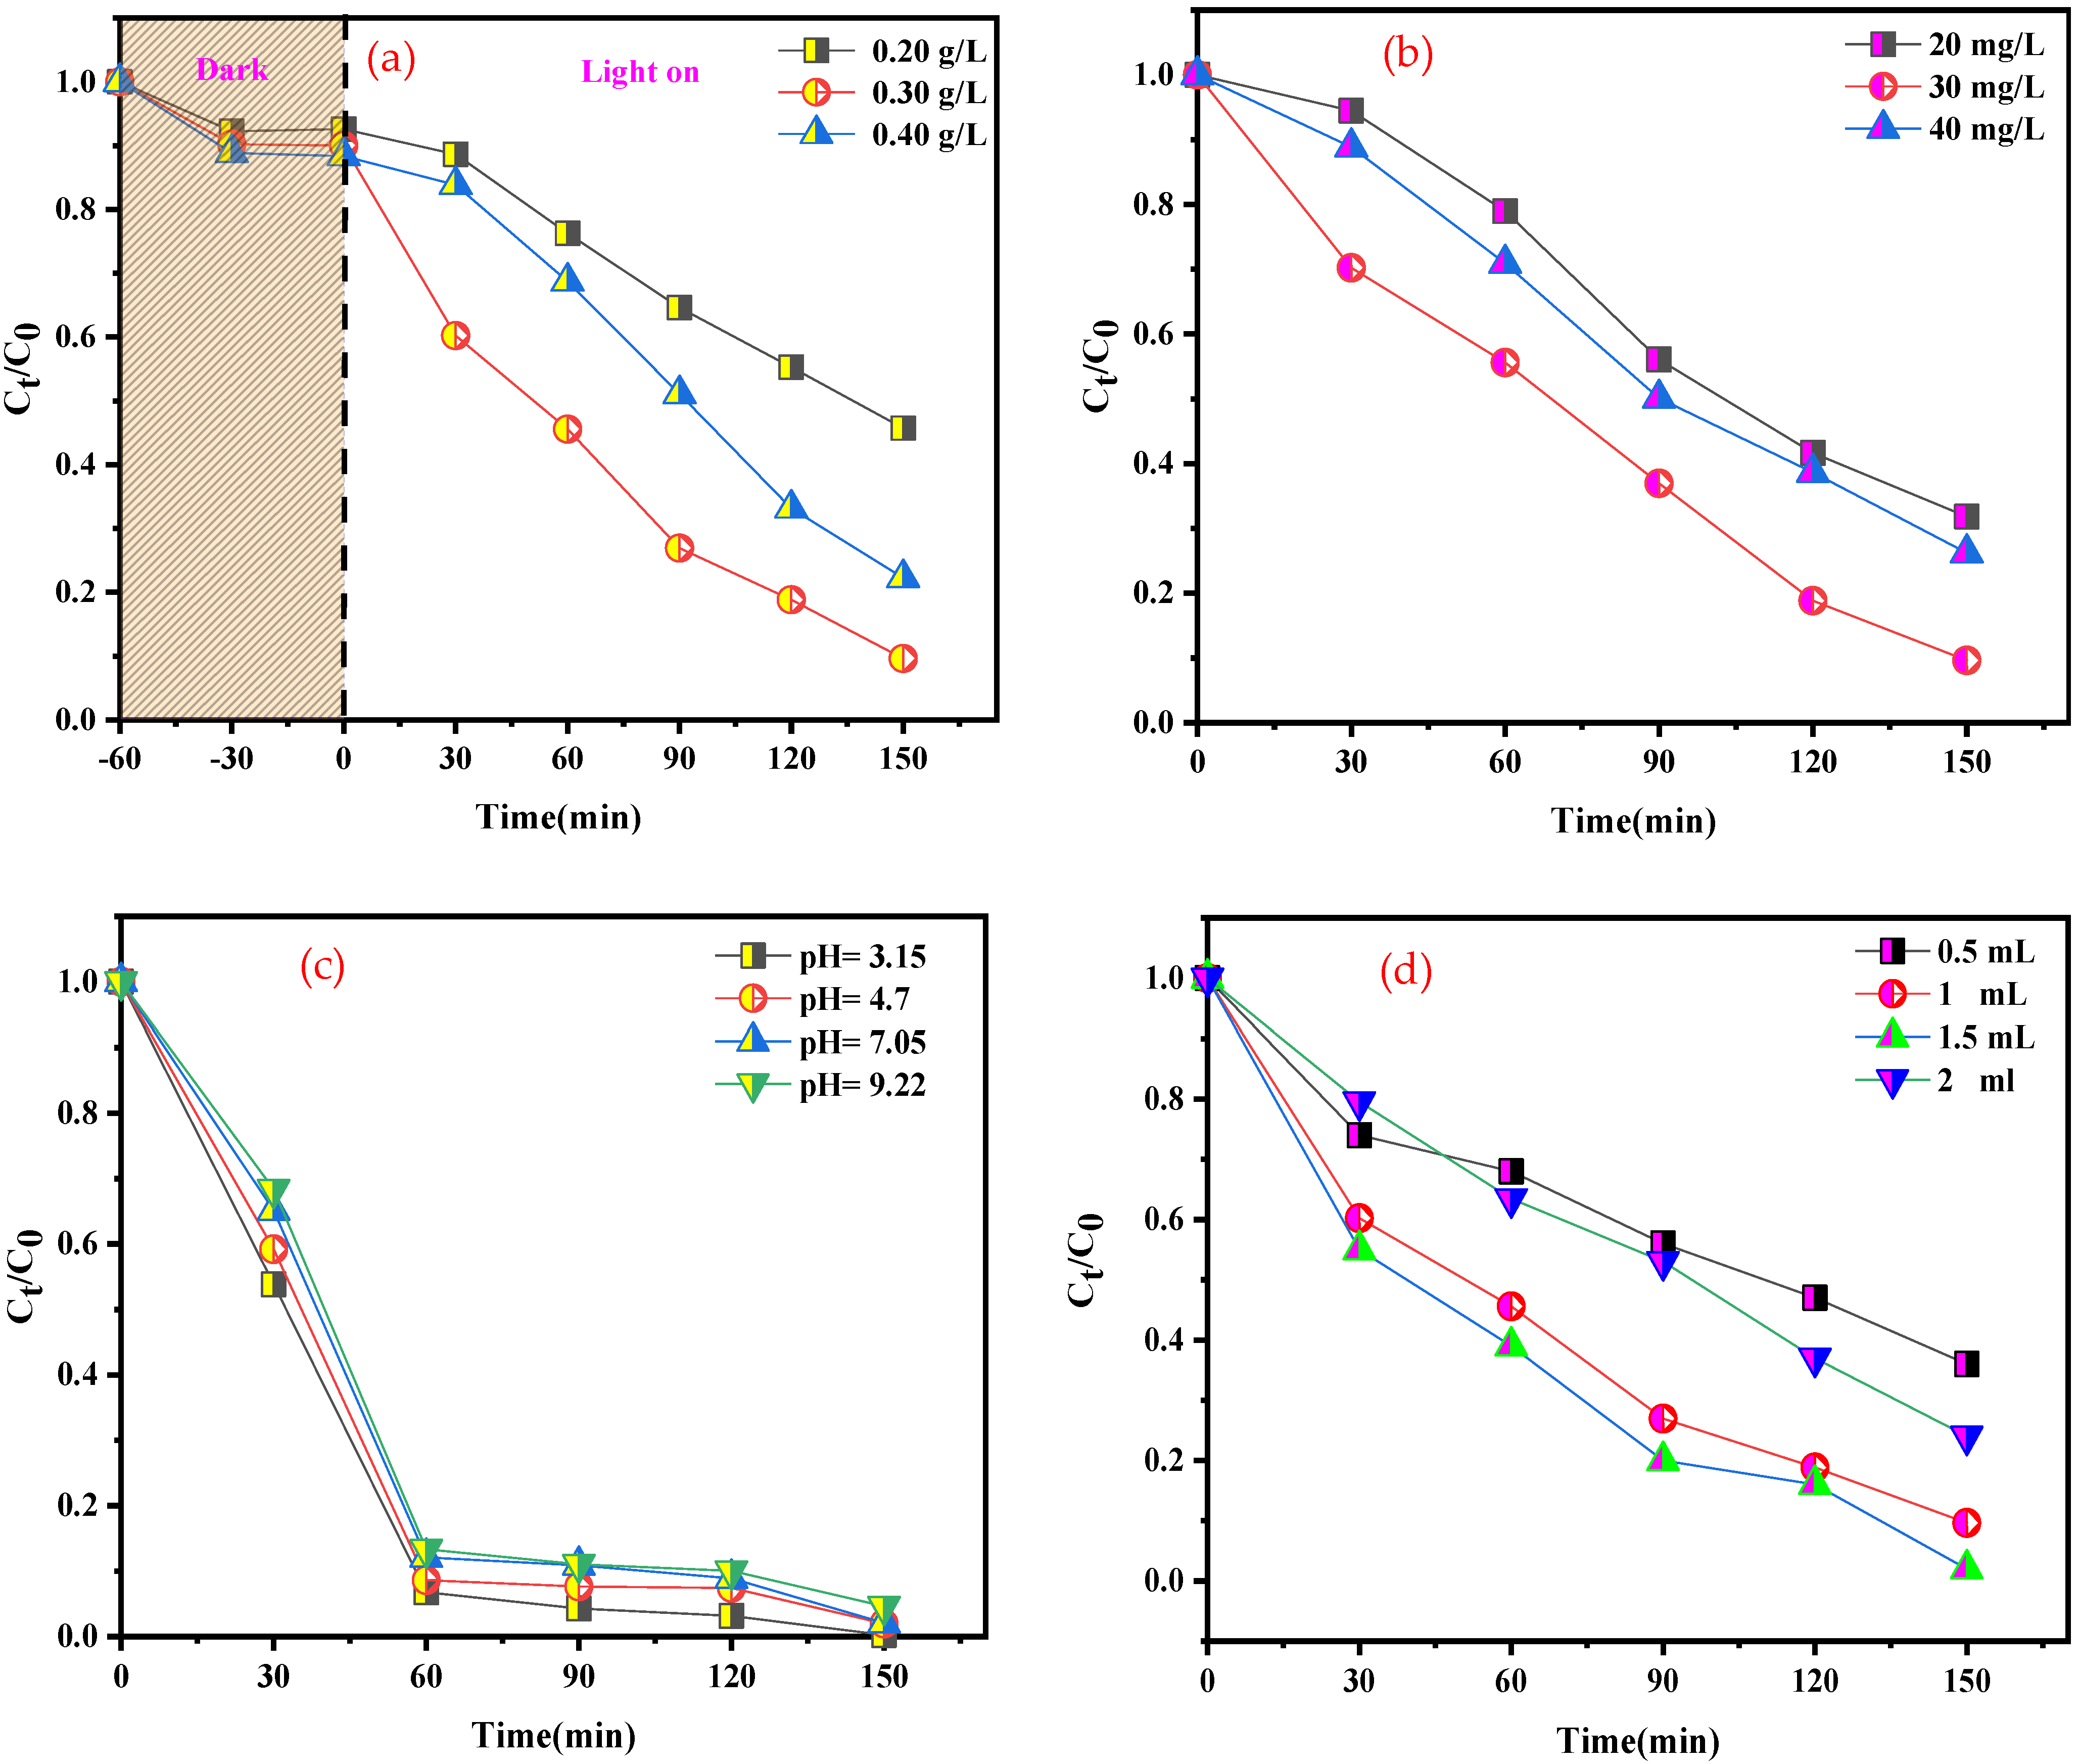
The impact of catalyst loading on the photo-Fenton-like catalytic activity was examined for BCB, as shown in Figure 10a. The degradation efficiency evolved linearly with an increase in catalyst loading from 20 to 30 mg. This phenomenon was attributed to the increased availability of active sites for catalytic reaction. However, above 30 mg of added catalyst, a slight decrease was observed. Presumably, this can be explained by the induced turbidity in the solution due to the elevated catalyst concentration, which results in the diffusion and slight penetration of light. As a result, the optimal catalyst loading for the experiments was fixed at 30 mg.

Figure 10.
Effects of different catalytic parameters on BCB degradation: (a) catalyst dosage, (b) BCB concentration, (c) pH value, and (d) volume of H2O2 (other catalytic parameters: catalyst dosage: 0.30 g L−1; H2O2 volume: 1 mL; pH: 5,46; T: 25 °C; BCB concentration: 20 mg L−1).
3.3.2. Impact of the Initial Dye Concentration
The effect of the initial dye concentration on BCB degradation is shown in Figure 10b. With a range of 20 to 40 mg L−1, the reaction rate progressively decreased as the initial BCB concentration increased. For example, when the initial BCB concentration was increased, nearly 70% of BCB degradation was achieved within 90 min (20 mg L−1). The same degradation percentage was achieved when the initial BCB concentration was 30 mg L−1 within 120 min, while the degradation time increased to 150 min when the initial BCB concentration was 40 mg L−1. It can be inferred that higher BCB concentrations have reverse effects, possibly because dye molecules cover the most available active sites. Consequently, the quantity of H2O2 freely available to interact with the active sites of SnFe2O4/g-C3N4, which is vital for the effective generation of •OH radicals, decreases. This phenomenon has been reported in other studies regarding dye oxidation.
3.3.3. Effect of Initial pH of the Solution
The influence of pH is one of the main parameters affecting the photocatalytic decomposition rate of certain organic compounds, which is crucial for wastewater treatment. To analyze the impact of pH on BCB dye degradation, experiments were conducted by varying the reaction medium pH from 3.15 to 9.22, while maintaining a fixed concentration of BCB dye (20 mg L−1) and catalyst (30 mg L−1). pH adjustments were made using appropriate NaOH (0.1 N) and HCl (0.1 N) solutions. The results presented in Figure 10c highlight the influence of pH variation on the photocatalytic degradation of BCB dye in the presence of H2O2. It is well known that the Fenton system requires acidic conditions [54], which is consistent with these results. The highest degradation efficiency was achieved at a pH value of 3.15. It was observed that the BCB degradation rate could reach approximately 75% in 30 min, even at a pH of 9. Beyond this value, a decrease in degradation efficiency was noted. In a basic medium, the increased formation of hydroxyl radicals •OH enhances decomposition efficiency. However, at a pH above 9, the photocatalytic efficiency decreases due to the negative surface charge induced by a high concentration of OH− ions, repelling the BCB from the catalyst surface.
3.3.4. The Effect of H2O2 Dosage
Figure 10d presents the effect of H2O2 concentration on the degradation efficiency of BCB. It was found that the degradation efficiency increased from 69.5% to 99.8% with an increase in H2O2 dosage from 0.5 mL to 1 mL. The accelerated degradation rate is due to the increased number of •OH radicals at a growing H2O2 dosage, demonstrating a gradual improvement in degradation efficiency with increasing H2O2 concentrations. However, no significant improvement was observed when the volume of H2O2 increased from 1.5 to 2 mL, due to the inhibitory effect of H2O2. A higher concentration of H2O2 promotes the trapping of •OH radicals (Equation (5a,b)), leading to the formation of a new radical (HO2•) with a markedly lower oxidation potential than that of •OH. Similarly, the recombination of •OH is also explained by Equation (6). This suggests that 1.5 mL constitutes the optimal concentration of H2O2 under the current experimental conditions.
•OH + H2O2 → HO2• + HO2•
•OH + HO2• → O2 + H2O
•OH + •OH → H2O
3.4. Potential Photo-Fenton-like Mechanism
The photocatalytic mechanism of the SnFe2O4/g-C3N4/H2O2/Vis system was investigated to gain a deeper understanding of the photo-Fenton-like process. This process involves several active species, including hydroxyl radicals (⦁OH), holes (h+), and superoxide anion radicals (⦁O2−). The roles of these active species, generated by the nanocomposite photocatalysts, were assessed using various radical scavengers [14].
To evaluate the effectiveness of the g-C3N4 photocatalyst, radical scavenging tests were performed to assess the degradation of BCB dye in the presence of various scavengers: disodium ethylenediaminetetraacetate (EDTA-2Na), L-ascorbic acid (ASC), and isopropyl alcohol (IPA), which capture h+, ⦁O2−, and ⦁OH radicals, respectively. The results, shown in Figure S3, indicate that BCB degradation was 91%, 73.5%, and 35.5% with the addition of EDTA, ASC, and IPA, respectively. These data suggest that IPA had the most significant effect of the primary active species in the SnFe2O4/g-C3N4/H2O2/Vis system, highlighting the crucial role of ⦁OH as the primary active species in the SnFe2O4/g-C3N4/H2O/Vis system.
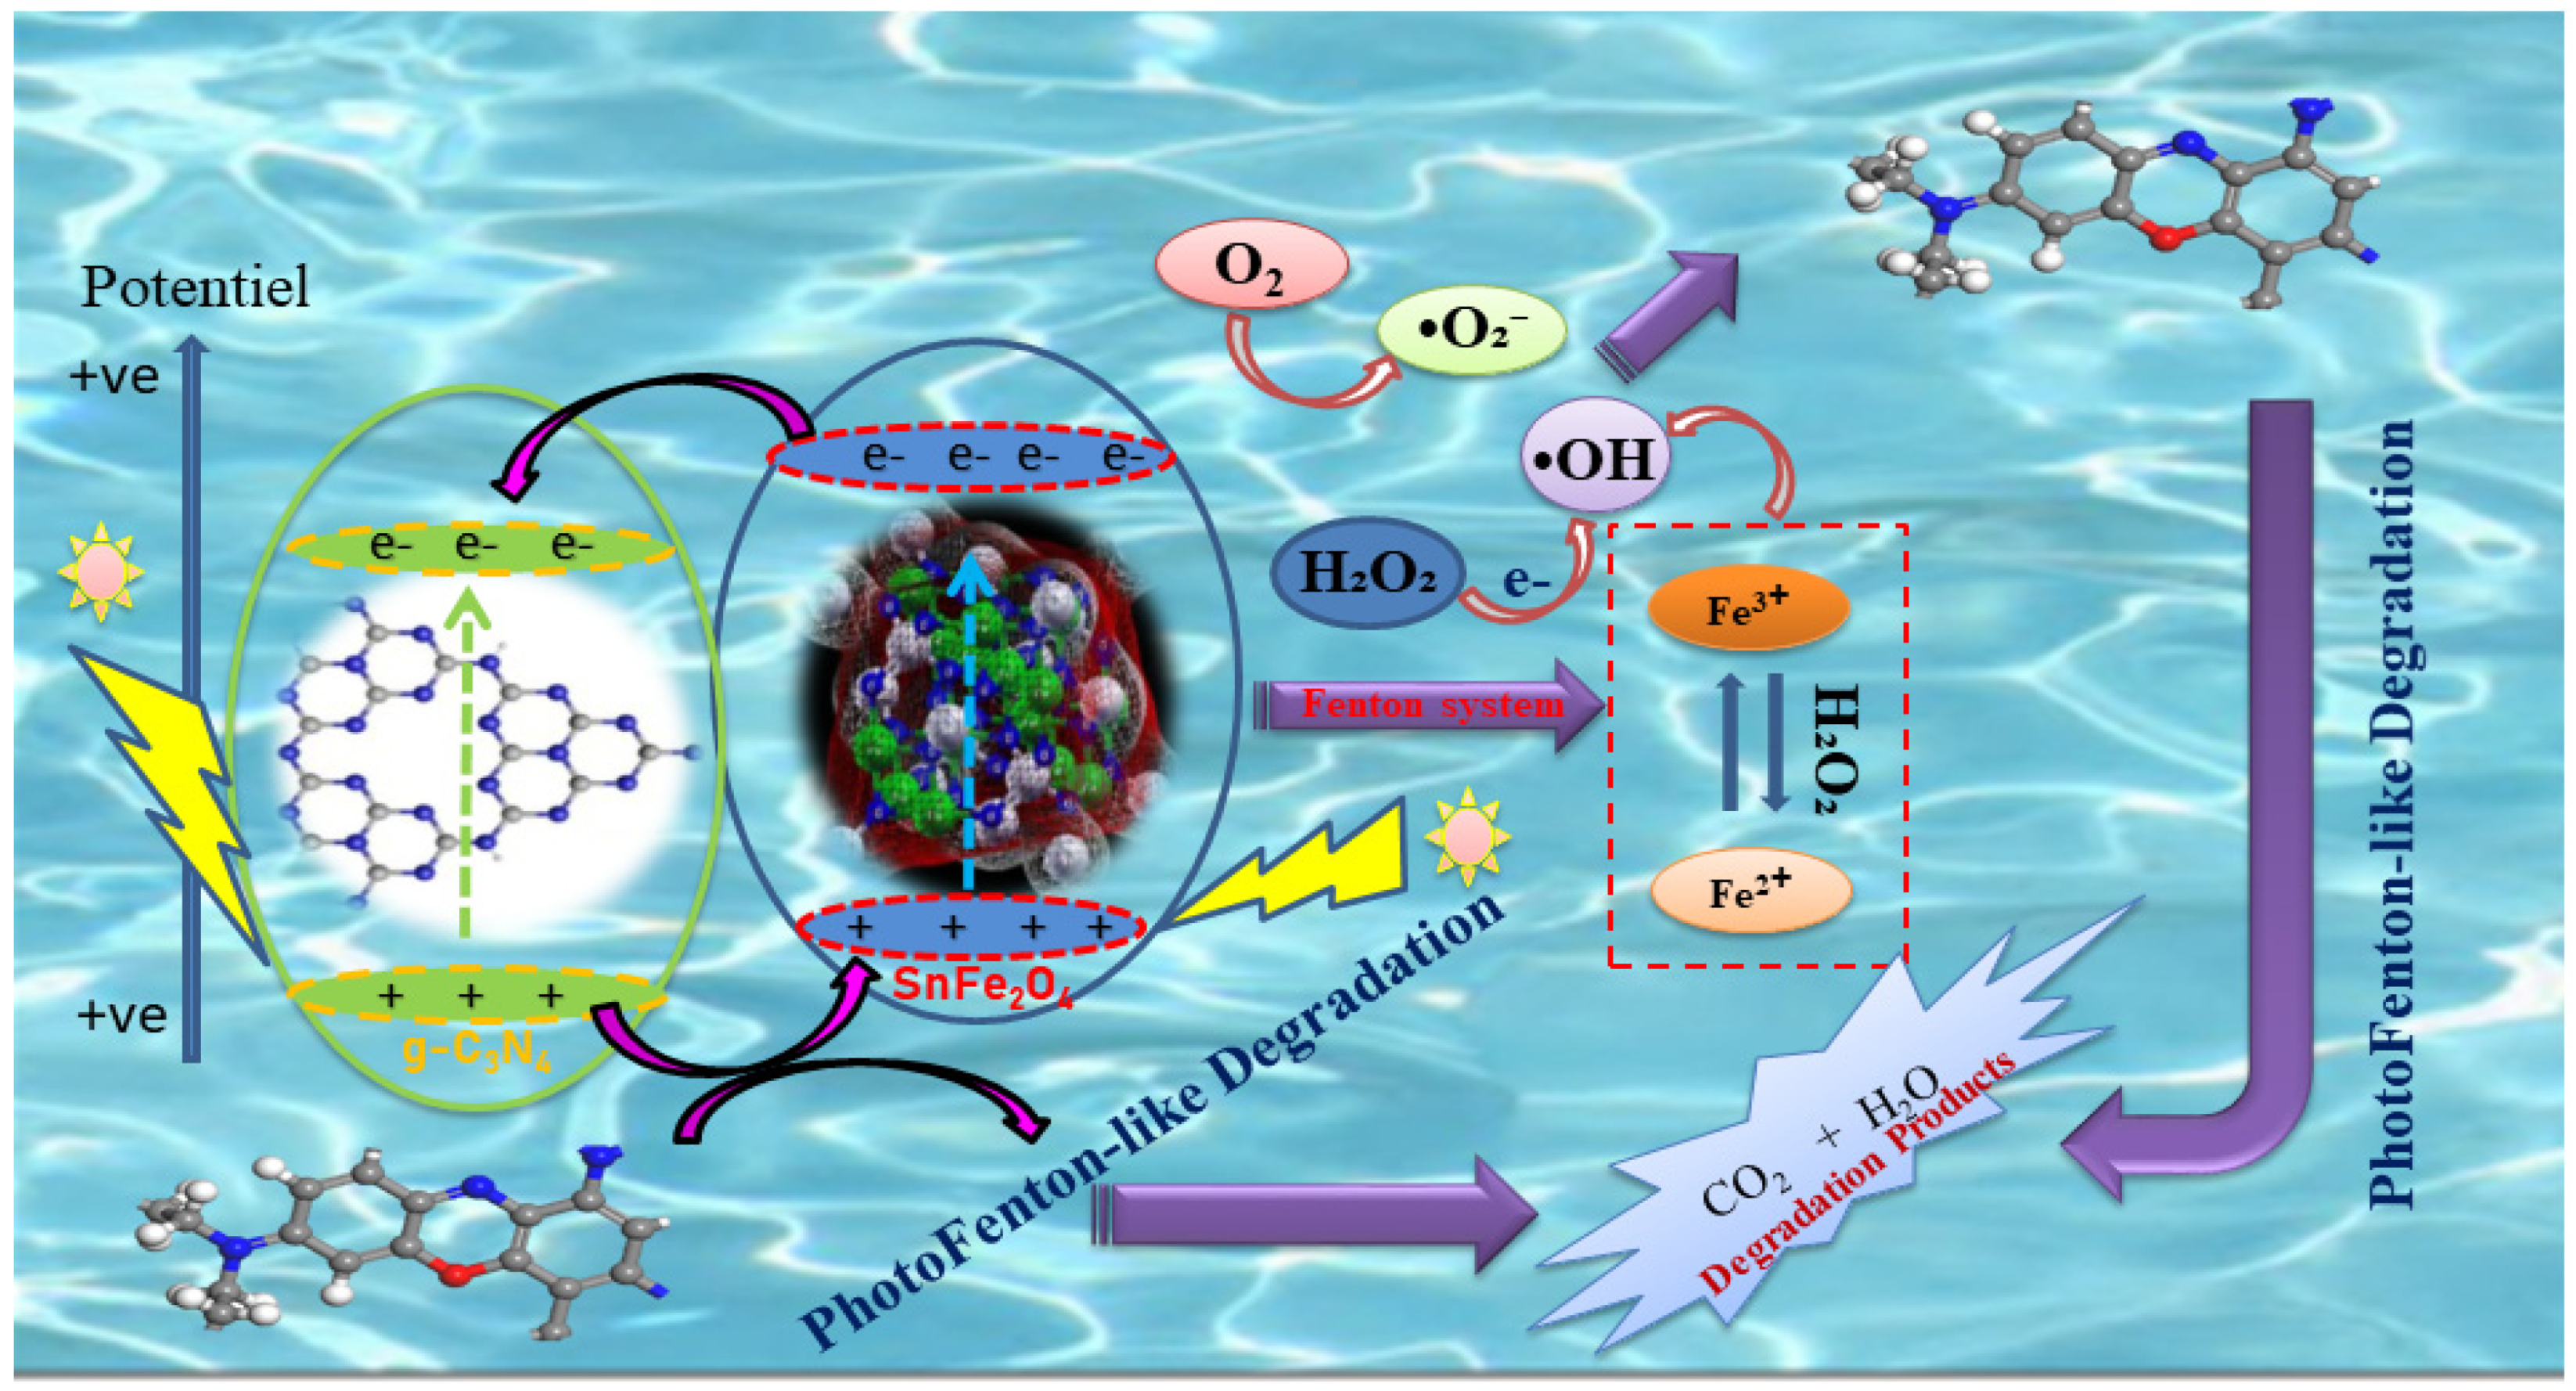
The term “photo-Fenton-like” refers to a process similar to the Fenton reaction but utilizes different catalysts and mechanisms to produce hydroxyl radicals •OH activated by ultraviolet or visible light. This method falls under advanced oxidation processes (AOPs), which enhance the efficiency of organic pollutant degradation. When exposed to light, photo-Fenton-like catalysts, such as metal ferrites or metal oxides, generate hydroxyl radicals through the interaction of the catalyst with hydrogen peroxide (H2O2). These highly reactive radicals facilitate the breakdown of organic contaminants into smaller molecules, as well as carbon dioxide (CO2) and water (H2O). By optimizing the generation of active radicals and expanding the options for pollutant treatment, this process serves as an effective alternative to conventional methods.
In a photo-Fenton-like process, the photocatalyst acts as a source of Fe3+, absorbing photon energy equal to or greater than its band-gap energy. This allows electrons (e−) to migrate from the valence band (VB) to the conduction band (CB), thereby balancing the number of holes in both bands. When exposed to visible light, the semiconductors generate electrons (e−) and holes (h+), which then migrate to the semiconductor surface. Here, they interact, respectively, with the electron donor and electron acceptor, as described in the literature [55]. Figure 11 illustrates the schematic of the photo-Fenton degradation of BCB by SnFe2O4/g-C3N4 under visible-light irradiation. In the SnFe2O4/g-C3N4/H2O2 system, hydrogen peroxide (H2O2) collaborates with Fe3+ to create a photo-Fenton reaction, where Fe3+ present on the surface of SnFe2O4 facilitates the formation of hydroxyl radicals while oxidizing H2O2 to produce •OH, which is then reduced to Fe2+. As a highly effective electron acceptor, H2O2 directs the energy band electrons to produce •OH and OH−, thereby minimizing the likelihood of electron–hole pair recombination. The •OH radicals convert BCB into byproducts such as CO2 and H2O. Additionally, these reactive species (h+, •O2−, and •OH) oxidize the BCB molecules adsorbed on the active sites of SnFe2O4/g-C3N4 through mechanisms involving π-π stacking and electrostatic attraction, contributing to their degradation [56,57]. The main photo-Fenton reaction process can be briefly described by Equations (7)–(16):
SnFe2O4/g-C3N4 + hv → SnFe2O4 (e−/h+) + g-C3N4 (e−/h+)
g-C3N4 (e−) + O2 →•O2−
Fe2+ + H2O2 → Fe3+ + •OH + OH−
Fe3+ + H2O2 → Fe2+ + •OOH + H+
•O2− + H+ → HO2•
2 HO2• → H2O2 + O2
H2O2 + e− → •OH + OH−
SnFe2O4 (h+) + dye → CO2 + H2O
•OH + dye → CO2 + H2O
•O2− + dye → CO2 + H2O
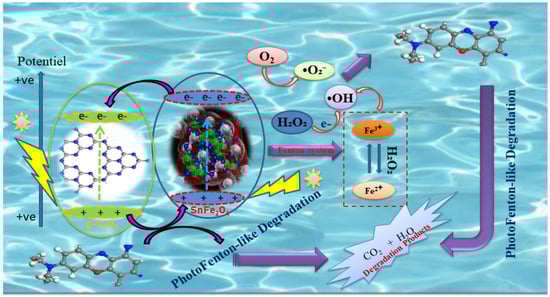
Figure 11.
Schematic illustration of photo-Fenton-like activity for BCB dye degradation using a SnFe2O4/g-C3N4 nanocomposite under eco-friendly LED irradiation.
3.5. The Resistance and Recycling Capacity of the Catalyst
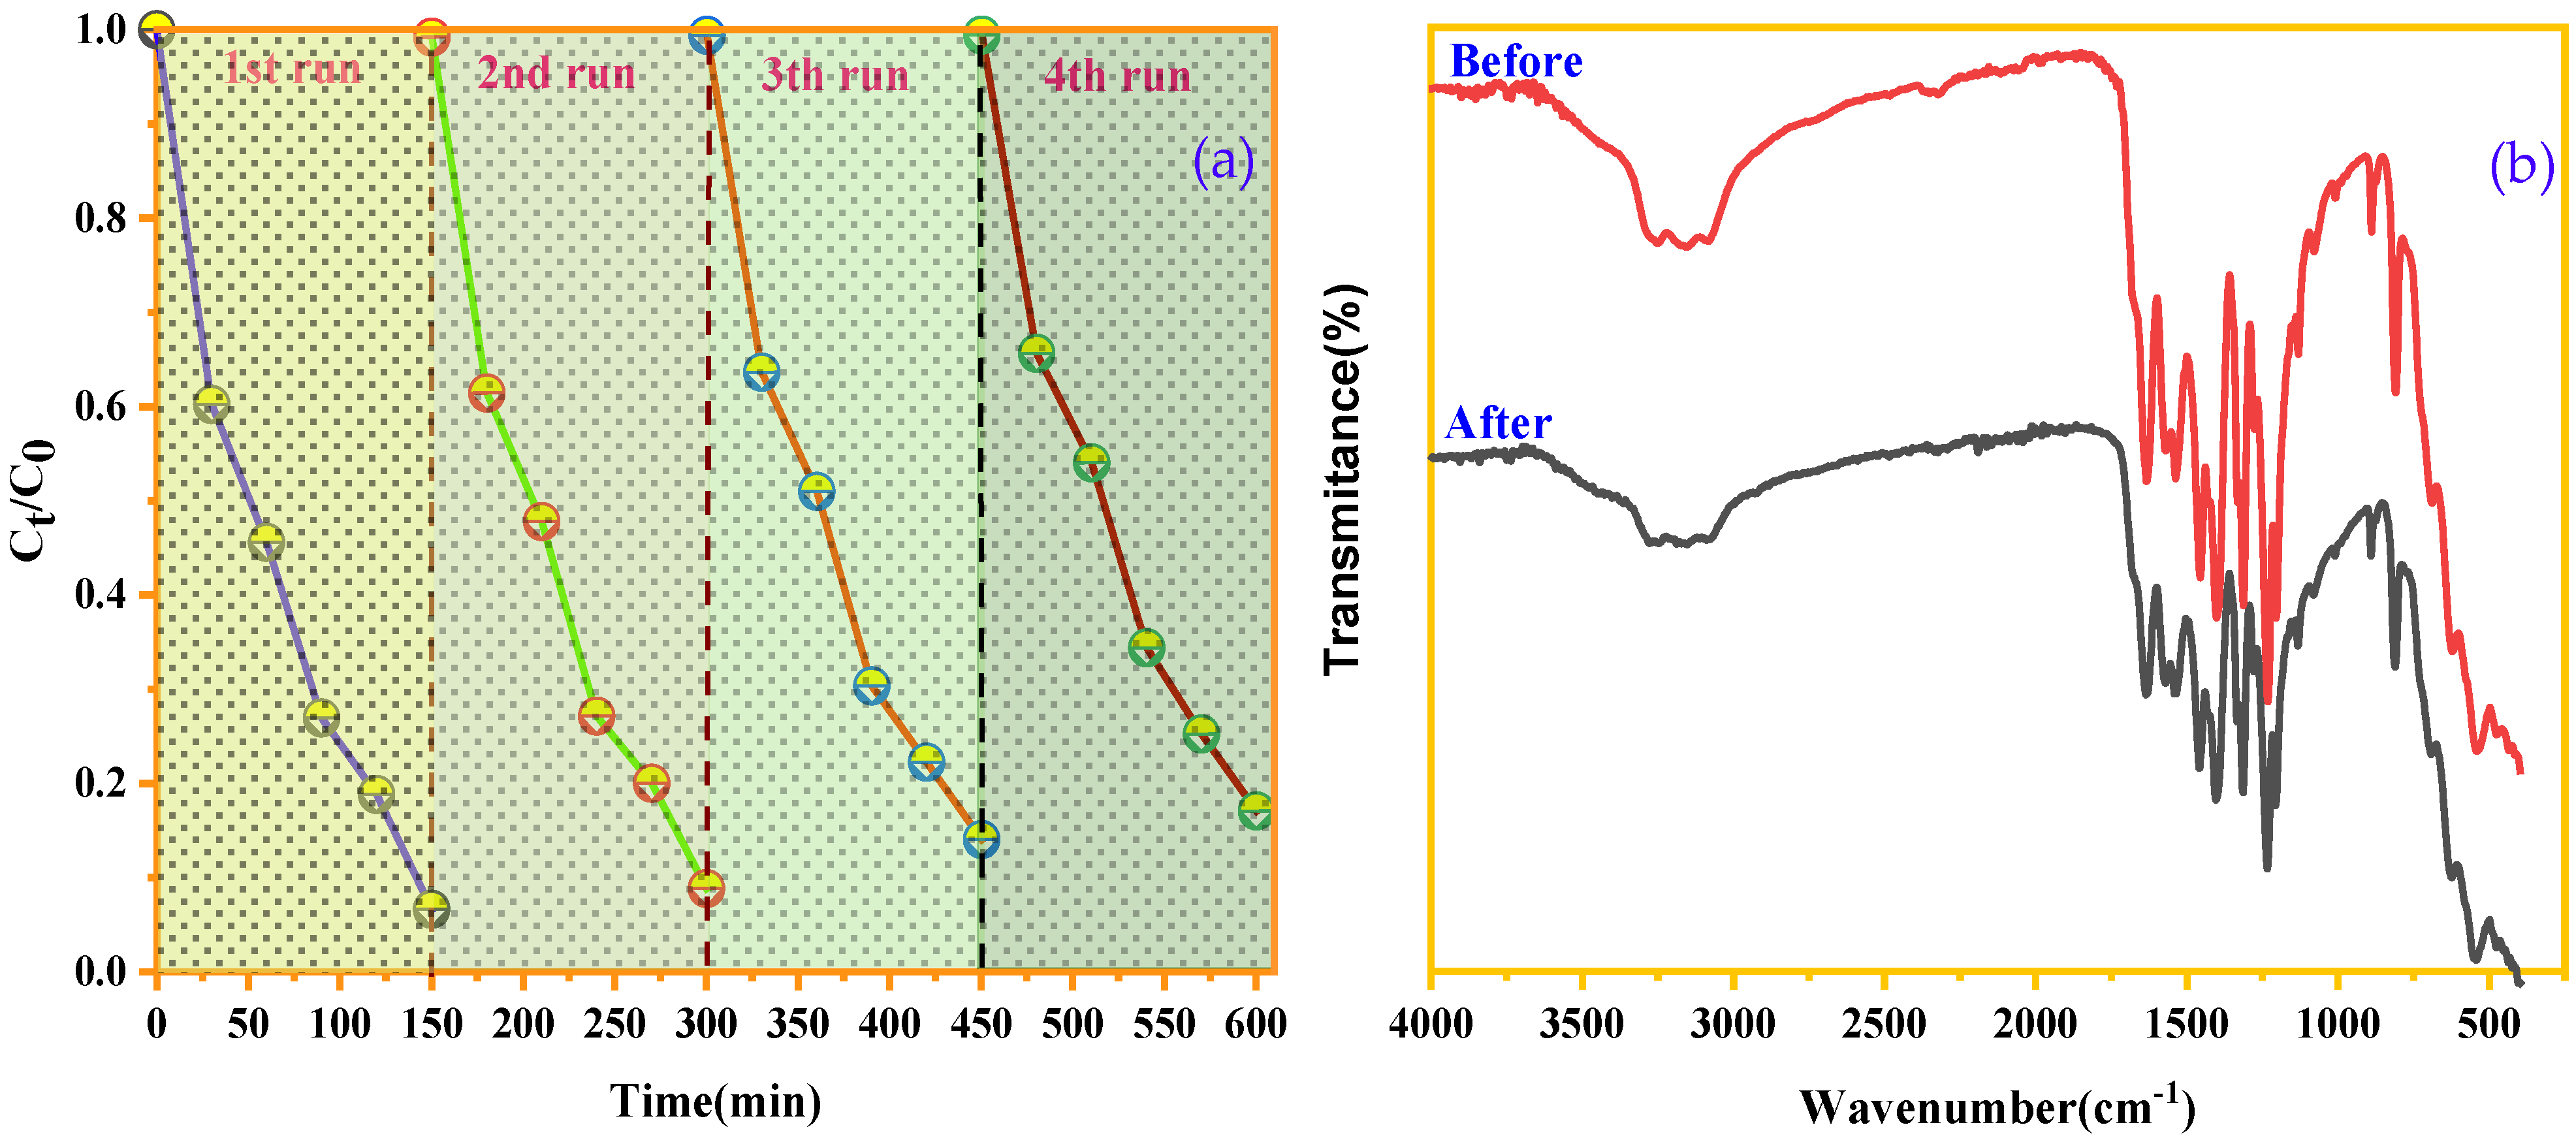
Among the criteria that can determine the robustness of a catalyst is its ability to retain efficiency and be reused over multiple cycles, which helps reduce operating costs and minimize negative environmental impacts. To evaluate the regenerative capacity of our catalysts, repeated cycle experiments were conducted to test their stability. After each regeneration cycle, the degradation efficiency was verified. According to Figure 12a, there is no significant change in the degradation efficiency of BCB by SnFe2O4/g-C3N4 after four recovery cycles. FTIR analysis (Figure 12b) confirms the stability of the SnFe2O4/g-C3N4 catalyst, as no changes are observed in the bands corresponding to SnFe2O4 and g-C3N4 after reuse. These results highlight the excellent stability and reusability of the SnFe2O4/g-C3N4 catalyst. Furthermore, the g-C3N4-based catalysts developed here stand out for their efficiency in BCB degradation, ease of preparation, eco-friendly characteristics, and recyclability, which make them highly promising for future industrial applications.
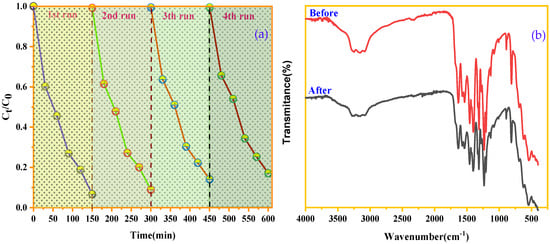
Figure 12.
(a) Recycling test of the SnFe2O4/g-C3N4 (20%) catalyst. (b) FTIR spectrum of the SnFe2O4/g-C3N4 (20%) before and after BCB degradation.
3.6. Experimental Optimization via the Response Surface Methodology (RSM)
3.6.1. Statistical Model Analysis
The response surface methodology (RSM) is a set of statistical and mathematical techniques by which the efficiency and optimal conditions of degradation can be easily determined via a Box–Behnken model (BBD) [58]. In this study, we assess the performance of BCB degradation by examining the effects of the following factors: catalyst loading (X1), BCB concentration (X2), H2O2 volume (X3), and reaction time (X4). The values of the aforementioned variables were selected and listed in Table S3, and thirty experiments were carried out in order to evaluate the effects of independent variables on the BCB degradation efficiency percentage (%). Table S1 shows the complete experimental design matrix as well as the observed responses (Y) and predicted responses (Y’) of the BCB degradation efficiency percentage (%). We have employed a polynomial quadratic model to study the interaction between variables. The regression model predicts the response of BCB degradation efficiency percentage (%) as described below:
Y = 62.17 + 6.17X1 − 7.06X2 + 13.92X3 + 21.05X4 + 1.91X1X2 + 3.99X1X3 − 0.3050X1X4 − 1.18X2X3
−3.63X2X4 − 1.75X3X4 − 11.57X12 − 0.0424X22 − 1.27X32 + 3.79X42
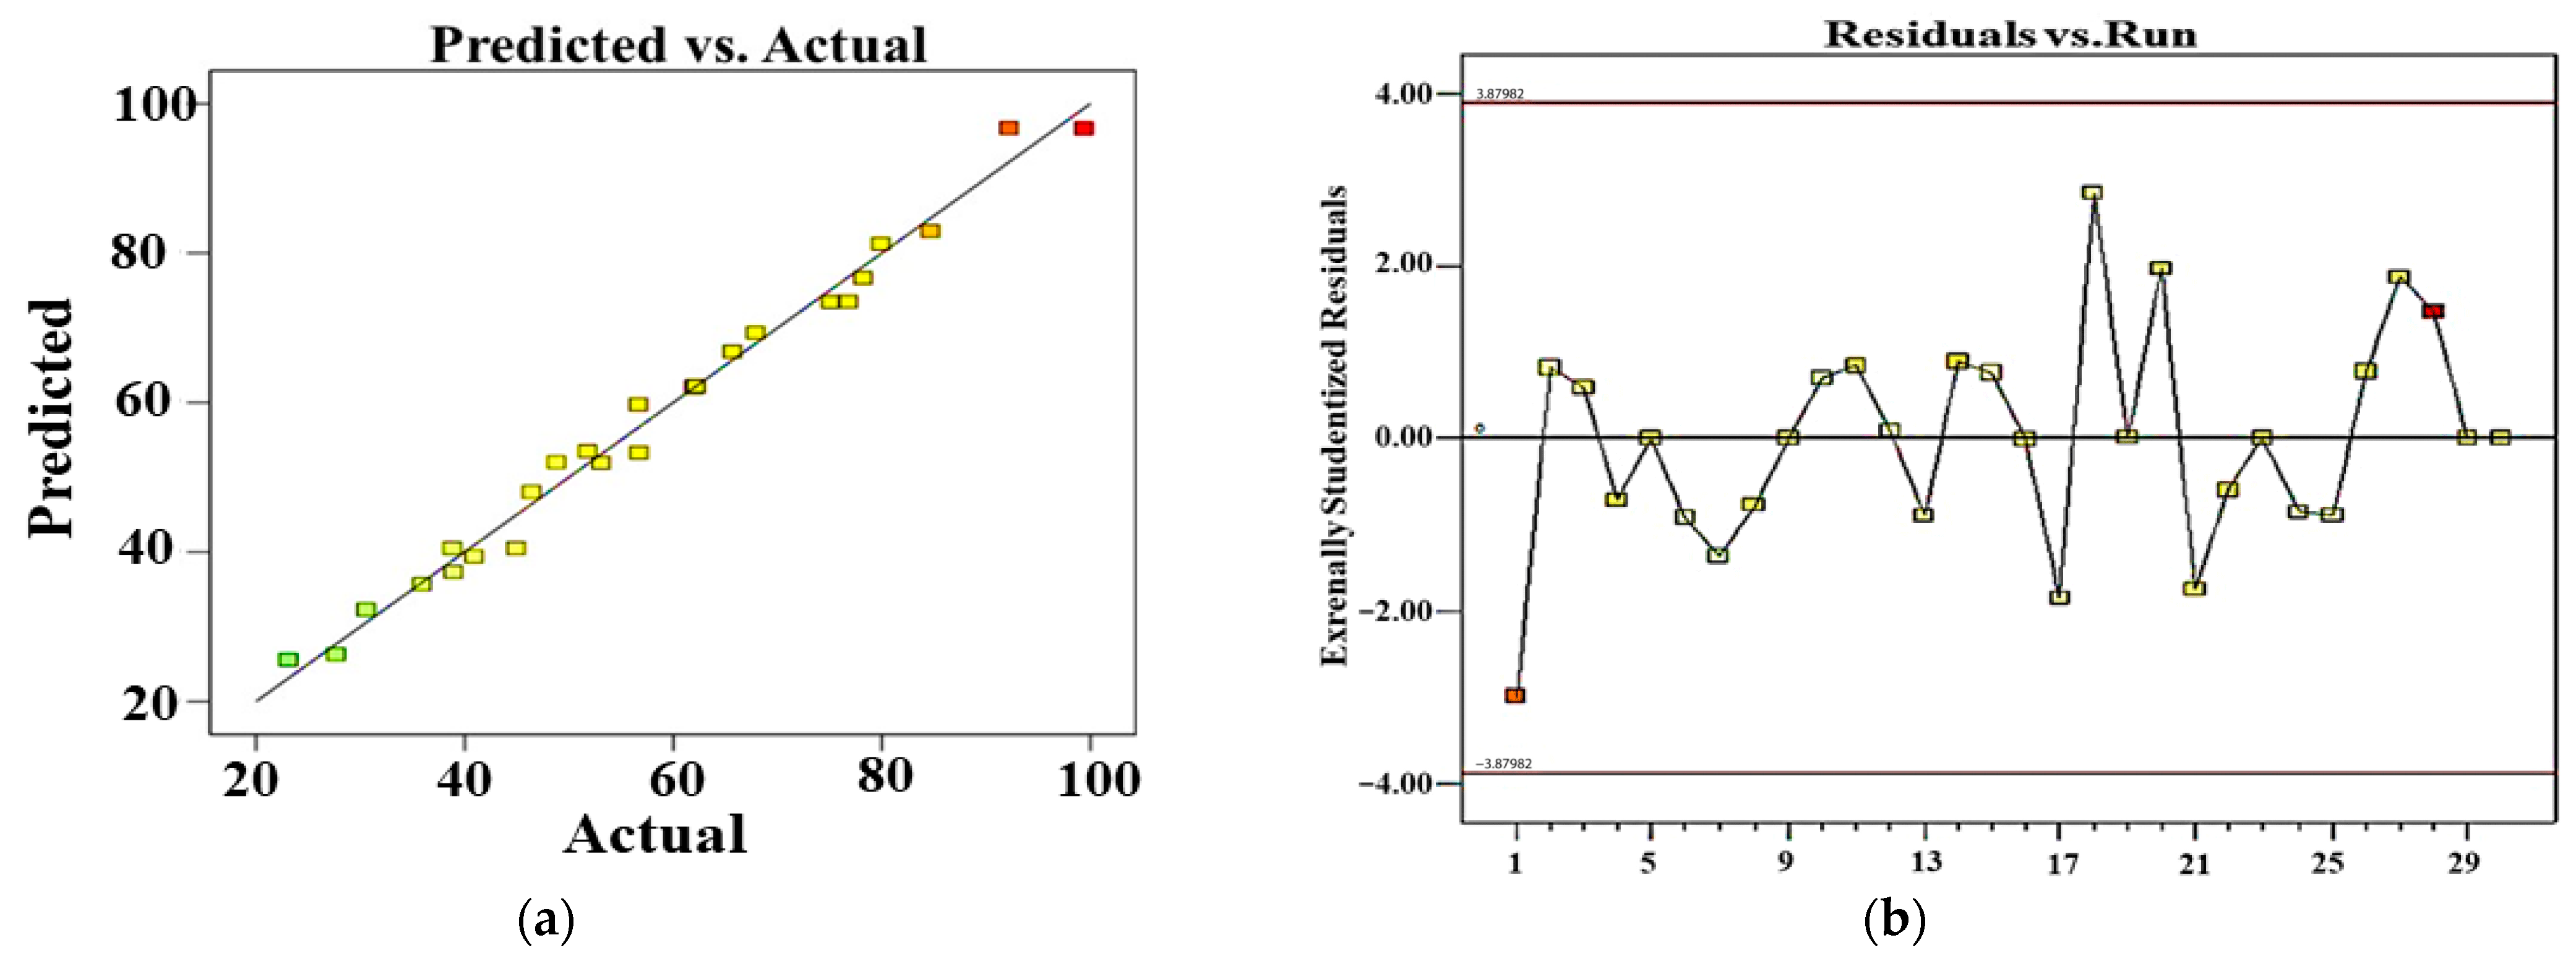
From this equation, we can notice that the catalyst load, H2O2 volume, reaction time, interaction between catalyst load and BCB introduced concentration, interaction between catalyst load and H2O2 volume, and the quadratic term of reaction time have shown a positive effect on BCB degradation efficiency. However, BCB introduced concentration, interaction between catalyst load and reaction time, along with the quadratic term of the catalyst load have shown a negative impact on BCB degradation efficiency. Analysis of variance (ANOVA) is an experimental design method that enables the analysis of each parameter in order to better define the objective function. In fact, the parameters do not share the same impact degree; some have significant effects while others do not [59]. An ANOVA was employed to assess and confirm the relevance of the quadratic polynomial model. The ANOVA results of BCB degradation efficiency are listed in Table 3: the statistical significance of the model was determined via the p and f values, where a p-value inferior to 5% indicates a statistical significance. The presented results in Table S3 show a strong correlation between the predicted and experimental degradation efficiencies (%), supported by the R2 (0.9875) and adjusted R2 (0.9758) illustrated in Table S4. Figure 13a presents a comparison between the actual response values and their corresponding predicted values calculated by the model. This graph of predicted versus actual values is useful for identifying any values or groups of values that are not easily predicted by the model. The straight line resulting from the plot of experimental and predicted values (Figure 13a) demonstrates a strong correlation between the experimental data and the predictions. Additionally, Figure 13b depicts a random dispersion of residuals across the experiments, indicating that there is no significant difference between the experimental and predicted values. This has proven that the quadratic polynomial model describes, with precision, the relation between process’ variables and responses, explaining 99.05% of the total variation of BCB degradation data. Parallelly, the ANOVA confirms the significance of the suggested model, with a p-value and f-value less than 0.01% and 66.47%, respectively, showing a satisfying adjustment in the experimental data. Moreover, the low value of the variation coefficient (4.31%) proves the high accuracy and reliability of the experiments. The probability (p-value) determines whether the importance of models should be accepted or not. An inferior p-value to 0.05 indicates the significance of the parameter of the term in the response surface p-value (<0.0001) and confirms that the model was way significant. According to the p-values, the significant factors were catalyst loading (X1), BCB introduced concentration (X2), H2O2 volume (X3), reaction time (X4), interaction between catalyst load, and H2O2 volume (X1X3), interaction between BCB introduced concentration and reaction time (X2X4), the quadratic term of catalyst loading (X1X1), and the quadratic term of reaction time (X4X4). An adequate precision measures the signal/noise ratio; a higher value than 4 of the latter is desirable [59].
Table 3.
Analysis of variance (ANOVA) for the Box–Behnken design (BBD).
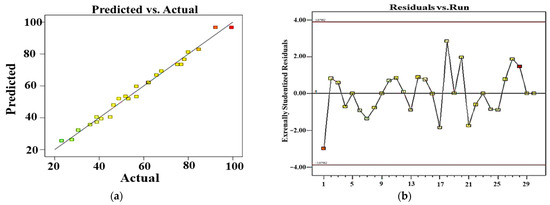
Figure 13.
Plots of predicted vs. experimental values (a) and residuals vs. run numbers (b) for the removal of BCB.
3.6.2. Response Surface and Contour Diagrams
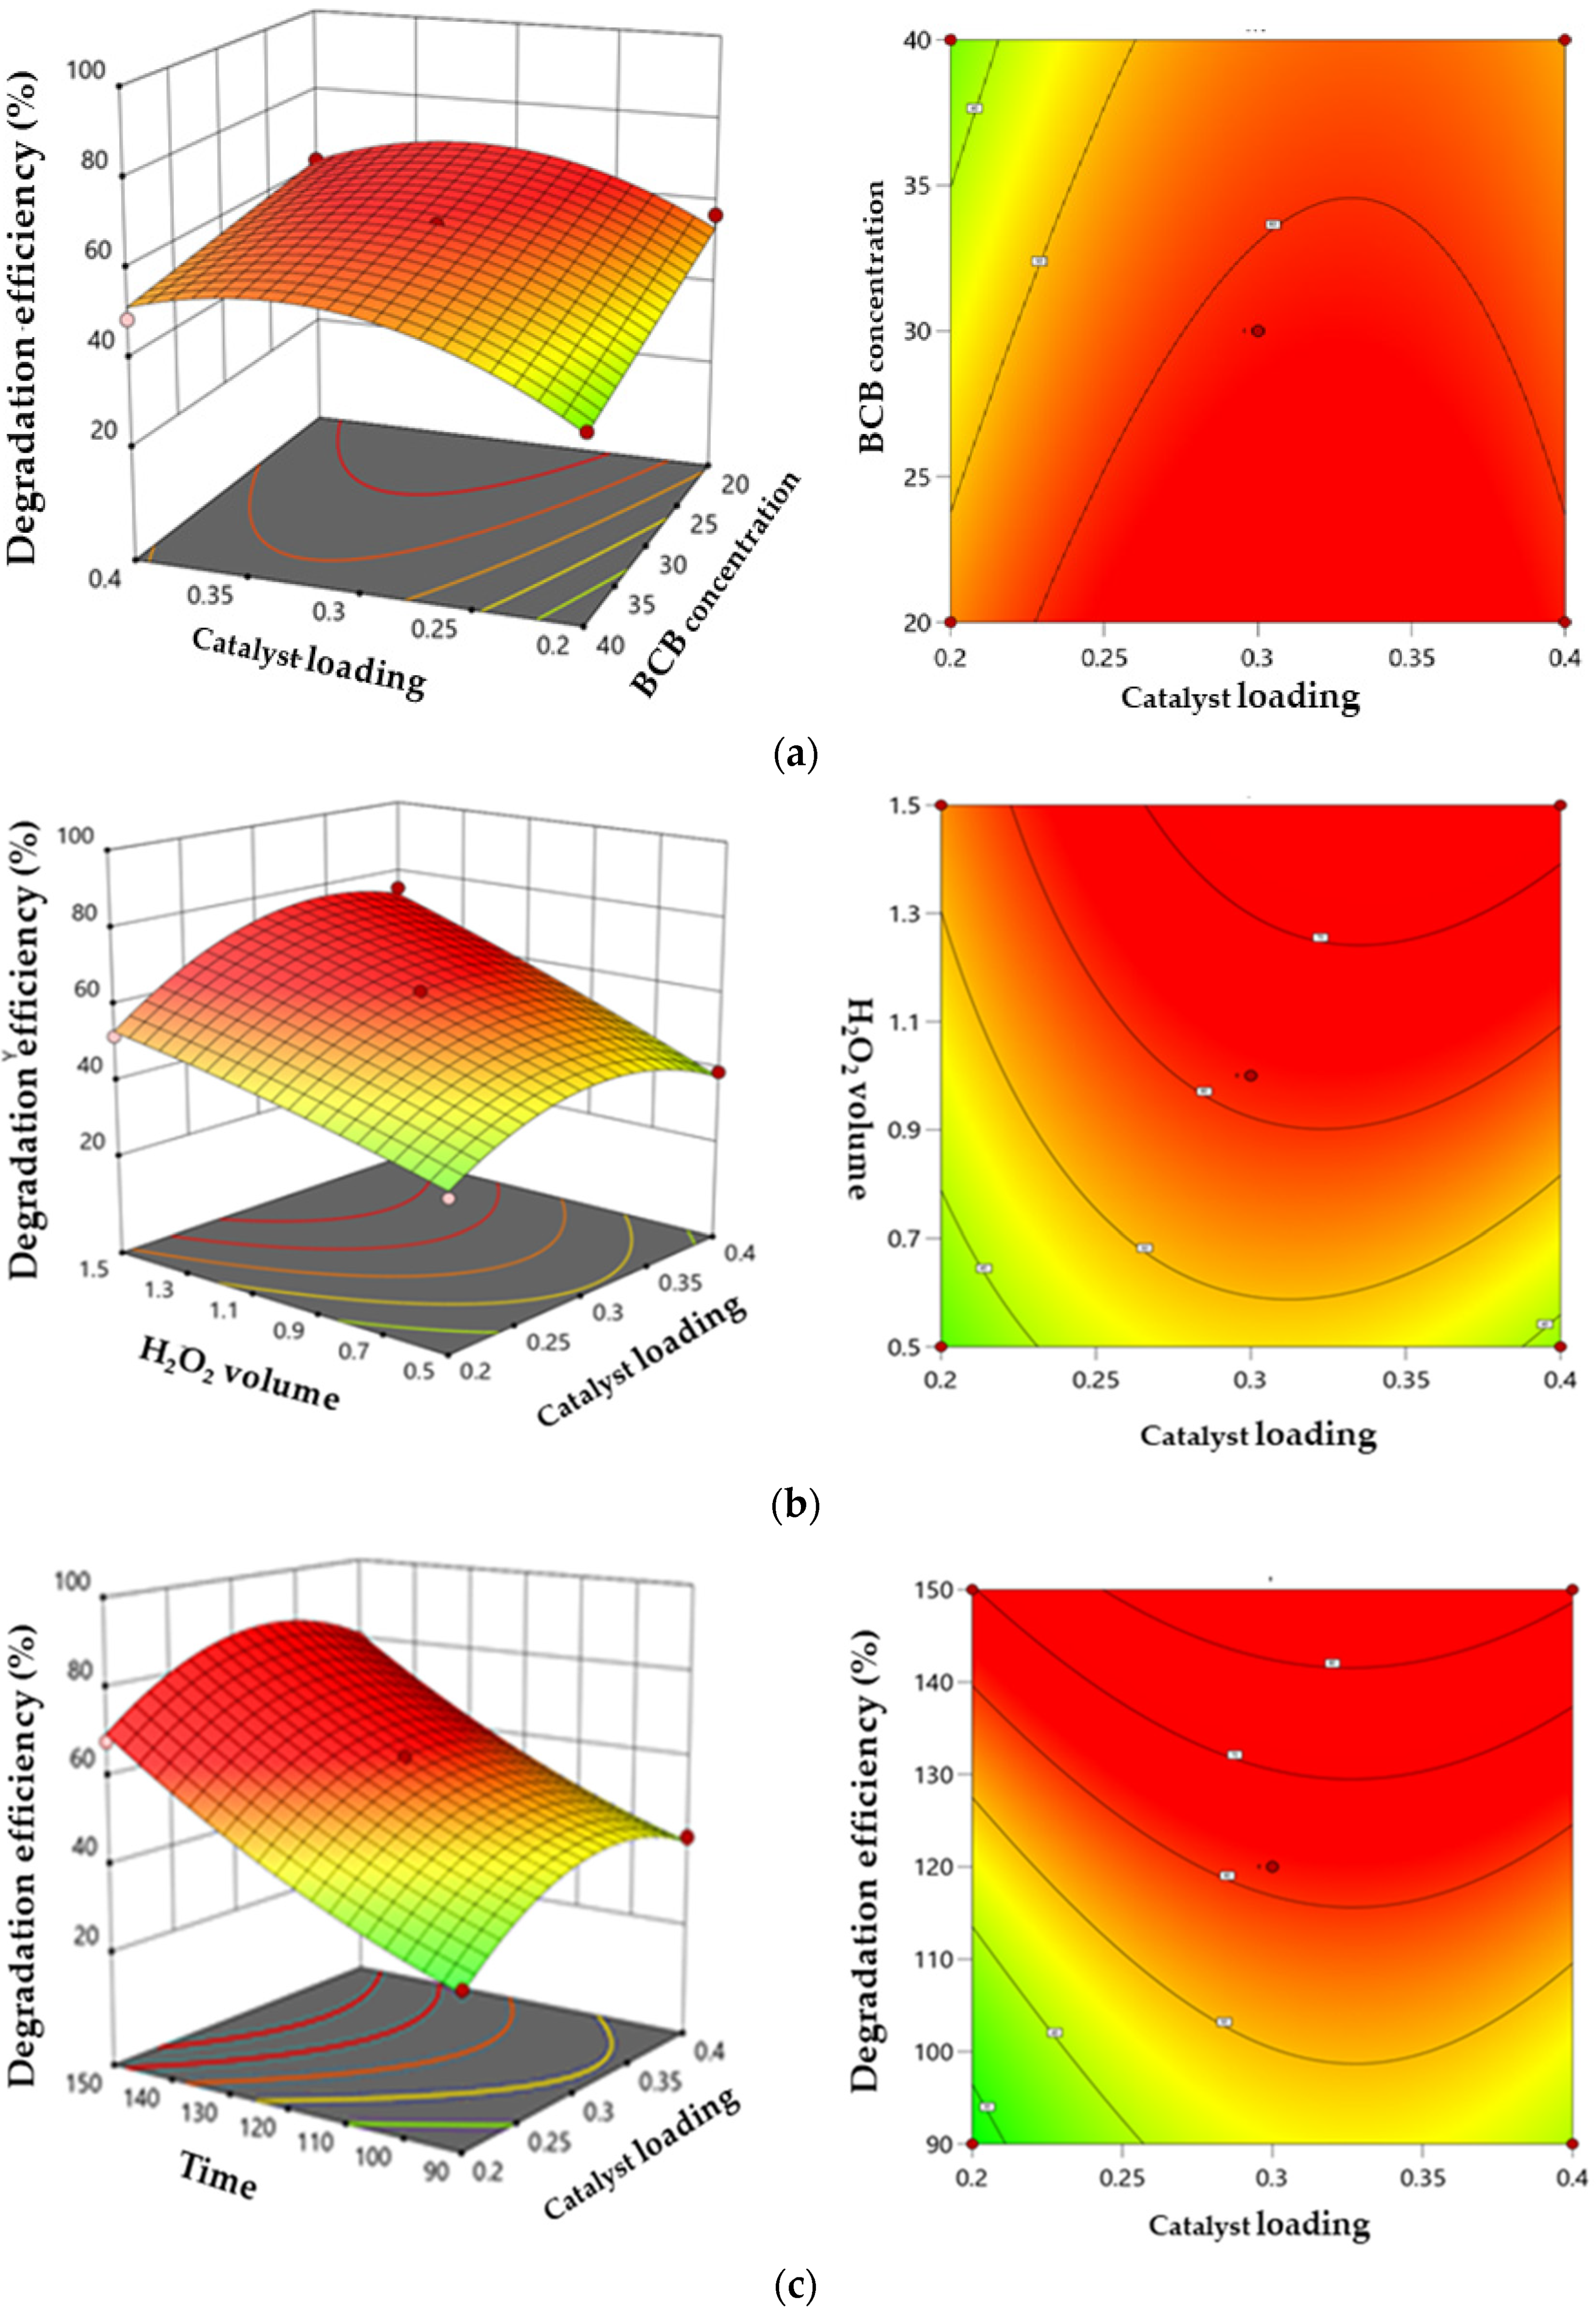
The response surface curves and contour plots illustrating the interaction between the catalytic dose, H2O2 volume, BCB concentration, and time of the BCB degradation rate are shown in Figure 14a–c. In the 3D response surface diagrams, steeper response surfaces indicate a stronger influence on the response value [60]. Darker colors in these diagrams correspond to higher BCB degradation efficiency. The 2D contour plots represent the interaction and magnitude of each factor, while the 3D response surface diagrams provide a complementary visualization of the contour lines.

Figure 14.
Three-dimensional surface and contour plots illustrating the interactive effects. (a) catalyst loading and BCB concentration. (b) catalyst loading and H2O2 volume. (c) catalyst loading and contact time.
Figure 14a illustrates the effect of the catalyst loading and BCB concentration on degradation efficiency. An initial increase in the catalyst dose enhances degradation due to the greater availability of active sites, as discussed in Section 3.3.1 regarding the effect of catalyst dosage. However, excessive catalyst amounts can reduce efficiency due to increased turbidity or optical masking. Similarly, a lower BCB concentration promotes degradation, while an excessive concentration limits molecule access to the active sites where radical reactions occur. The optimal zones for high efficiency are found at the intermediate levels of both parameters, reflecting a synergy, whereas extreme levels result in antagonistic effects. These findings help identify the ideal conditions to maximize efficiency and guide process optimization.
Figure 14b shows the combined effect of the catalyst loading and H2O2 volume on the BCB degradation rate. The rate improves with increasing H2O2 volume and catalyst dose, up to an optimal point. This improvement can be attributed to the increased generation of •OH radicals through H2O2 decomposition. However, an excess of catalyst may reduce efficiency due to optical masking or charge recombination. Regarding H2O2, a moderate volume is optimal as it generates a maximum number of radicals without producing undesirable by-products or wasting resources. The maximum degradation rate was achieved when the H2O2 volume was 1.37 mL. A synergistic interaction is observed in the optimal zones where these two parameters are balanced, whereas excessive or insufficient H2O2 volumes, combined with inappropriate catalyst concentrations, decrease efficiency.
Contact time is a critical factor with a direct and significant impact on the efficiency of the photo-Fenton-like process. A higher BCB concentration is degraded with prolonged contact time, which can be attributed to the increased availability of active sites over time. The results in 14c indicate that BCB degradation efficiency reaches an exceptionally high rate of 99% after 150 min of the decolorization process [61].
3.6.3. Optimal Conditions for the Photo-Fenton-like Process
The developed model allowed to predict the optimal conditions for enhanced degradation with numeric optimization application; the model seeks for the better trade-offs in the factorial space to achieve several objectives [59]. A desired value can be picked for each input and output factor. This document suggests a diverse input optimization option, including range, maxima, minima, target, along with the absence (of response). These options are defined in such a way as to obtain the optimal value for a set of specific conditions. The input variables and selected response in this study are depicted in Table S5. We have employed a desirability ramp diagram in order to analyze the obtained results. In fact, the desirability is an objective function that varies from zero outside the limits to the fixed target. The key point of numeric optimization consists of maximizing the desirability. The different responses and factors are combined into one single desirability function [62]. Desirability functions were used in order to determine the optimal levels for independent factors. An underlined element illustrates both factors accuracy on response and the magnitude wherein the objective has been achieved. Figure S4 depicts the results of the approach ramp desirability optimization for BCB degradation efficiency. The optimum values of catalyst load, BCB introduced concentration, and H2O2 volume were estimated to be approximately 0.29 g L−1, 25.046 mg L−1, 1.37 mL, and 149.657 min. In these conditions, the average obtained degradation was 99.347% within 150 min, with a probability of 1000. Under these predicted conditions, a verification experiment was carried out in order to verify the validity and suitability of the model. The confirmation experiment has led to a degradation (%) of 98.5%, which is too close to the predicted results. To conclude, the developed model was found to be accurate and reliable. This testifies the viability and precision of the model.
3.7. ANN Architecture Optimization
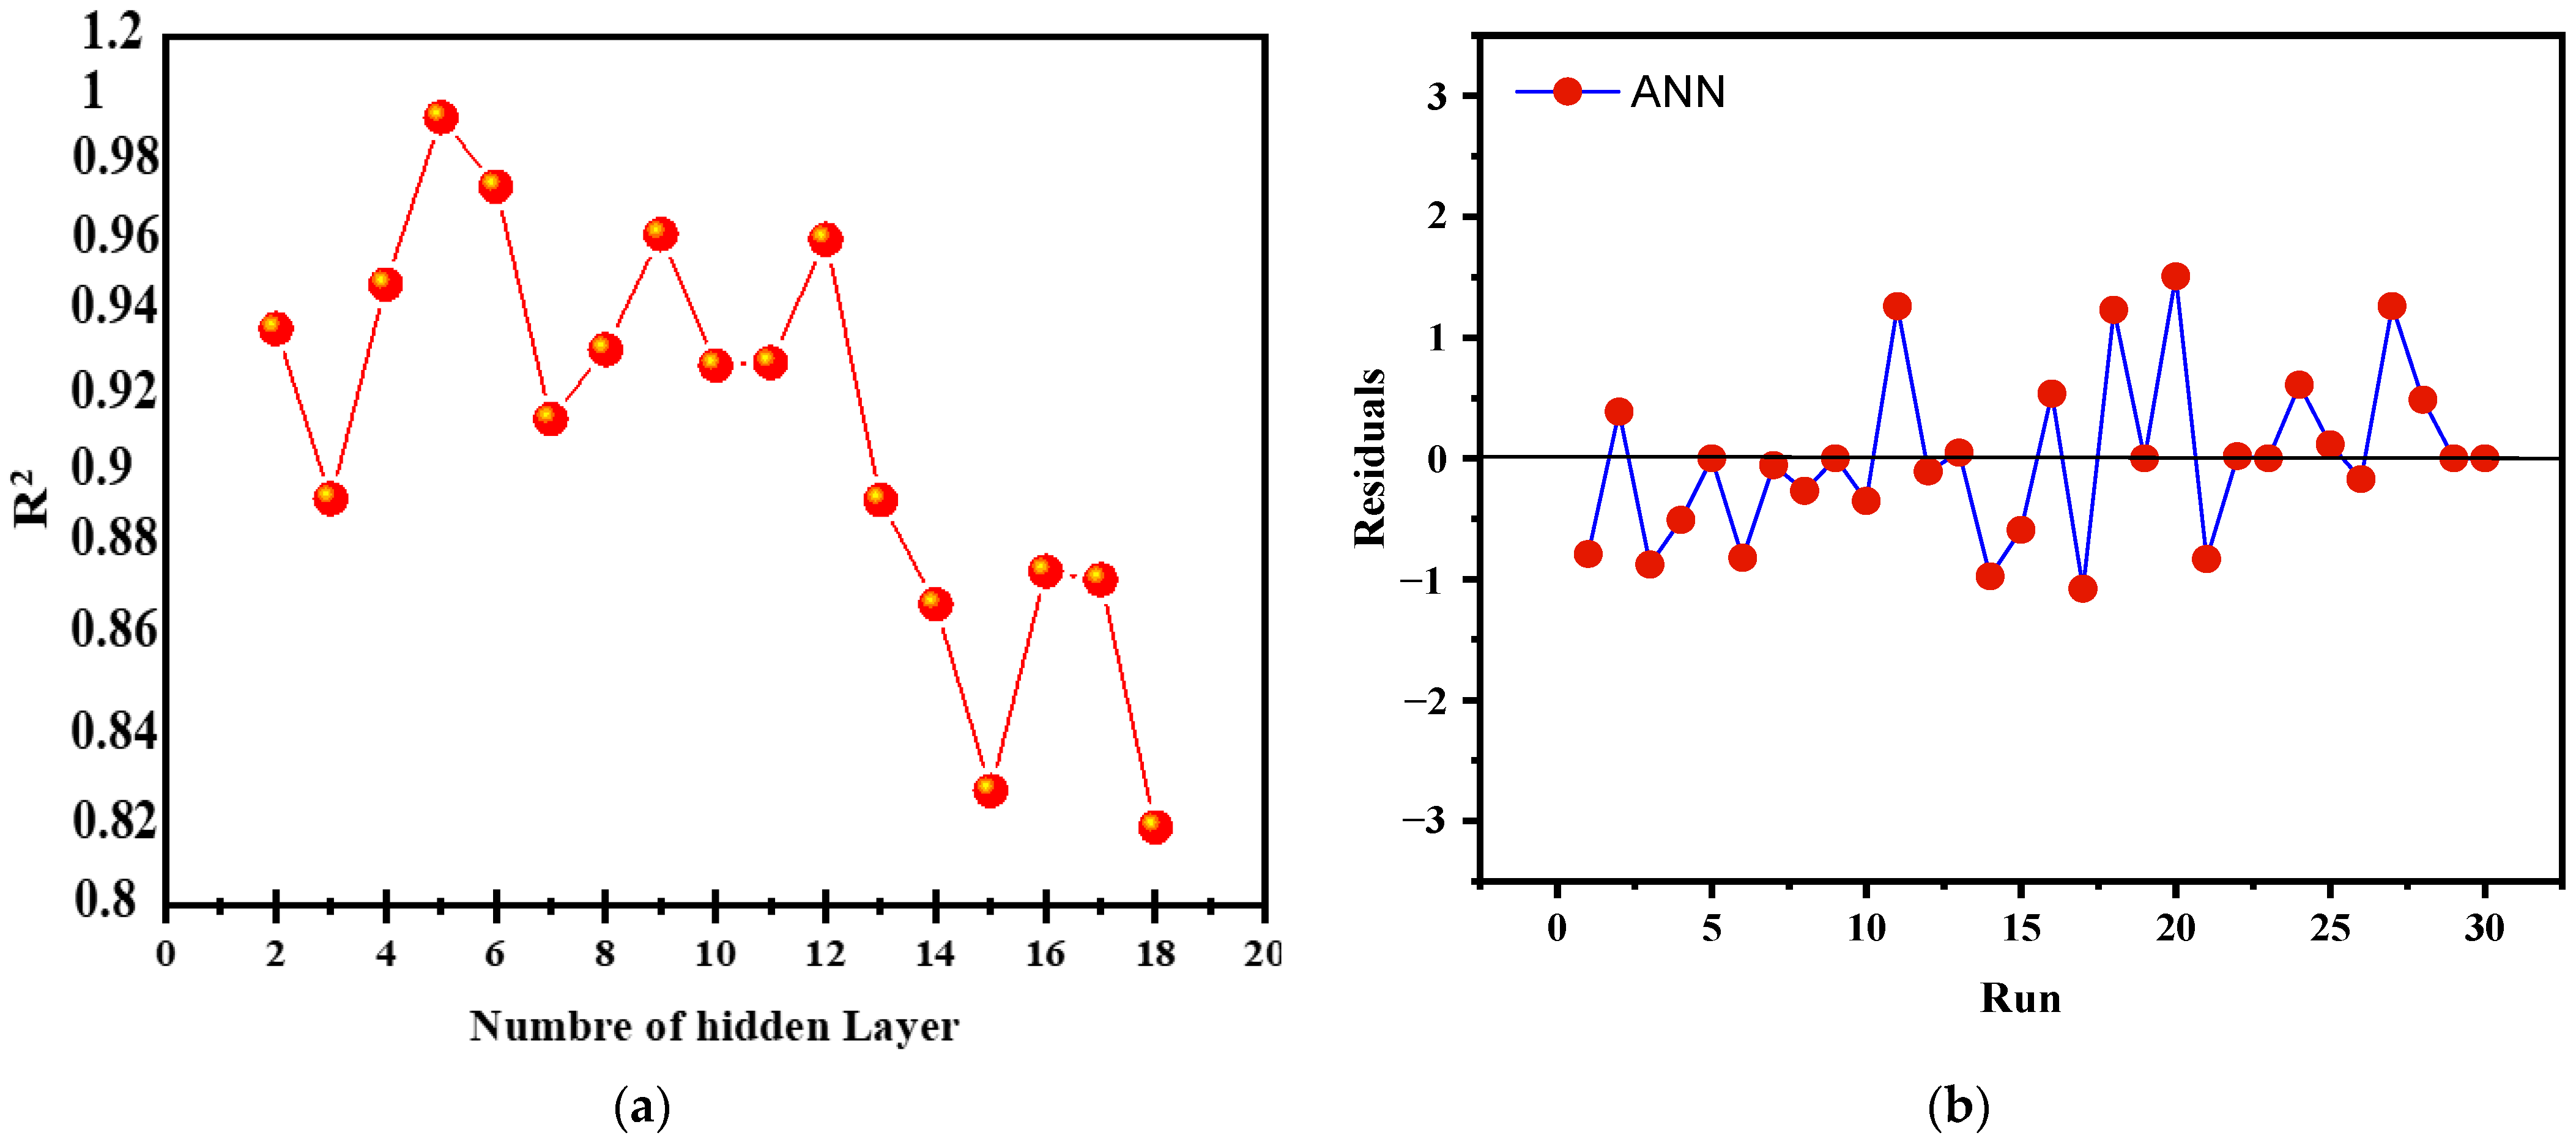
The LM (Levenberg–Marquardt) algorithm was utilized to optimize an artificial neural network (ANN), with 70% of the data designated for training and 15% each for validation and testing. The input parameters, defined according to the Box–Behnken design (BBD), included catalyst loading (X1), initial concentration of brilliant cresyl blue (X2), H2O2 volume (X3), and time (X4), with the output variable being the BCB degradation rate (Y). The network architecture was adjusted by testing different numbers of neurons in the hidden layer (ranging from 2 to 18), revealing a nonlinear relationship between the number of neurons and the coefficient of determination (R2). The optimal model, with 5 neurons in the hidden layer, achieved an R2 of 0.9996 (Figure 15a), beyond which a gradual decrease in R2 indicated overfitting. The final configuration 4-5-1, with four inputs, five hidden neurons, and one output, proved optimal for maximizing generalization capacity while minimizing RMSE. The results also showed a good distribution of residuals (Figure 15b) and a significant increase in the R correlation coefficient, as illustrated in the regression lines.
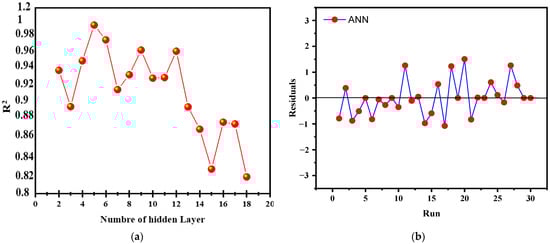
Figure 15.
(a) Number of hidden neurons Vs R2, and (b) running and residuals of the ANN model.
3.8. Global Sensitivity Analysis
This passage describes how the estimated weights and biases in an optimized neural network (ANN) were used to determine the relative importance (RI) of the input variables in predicting the output, following Garson’s formula (Garson, 1991) (Equation (S1)) [63]. According to Figure 16, the highest RI value was obtained by the catalyst dose (34.75%), followed by time (27.89%), the initial concentration of brilliant cresyl blue (23.93%), and finally, the volume of H2O2 (13.40%). The percentage of BCB degradation was thus highly dependent on the four studied factors, which were appropriately selected to describe the photo-Fenton degradation process.
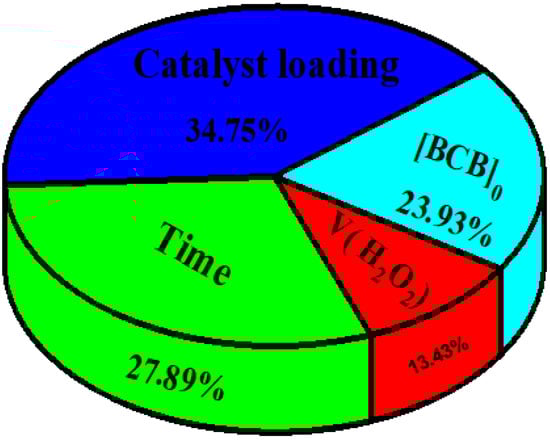
Figure 16.
The relative importance of the input variables to the degradation of BCB analyzed by the ANN model.
3.9. Comparison of RSM and ANN
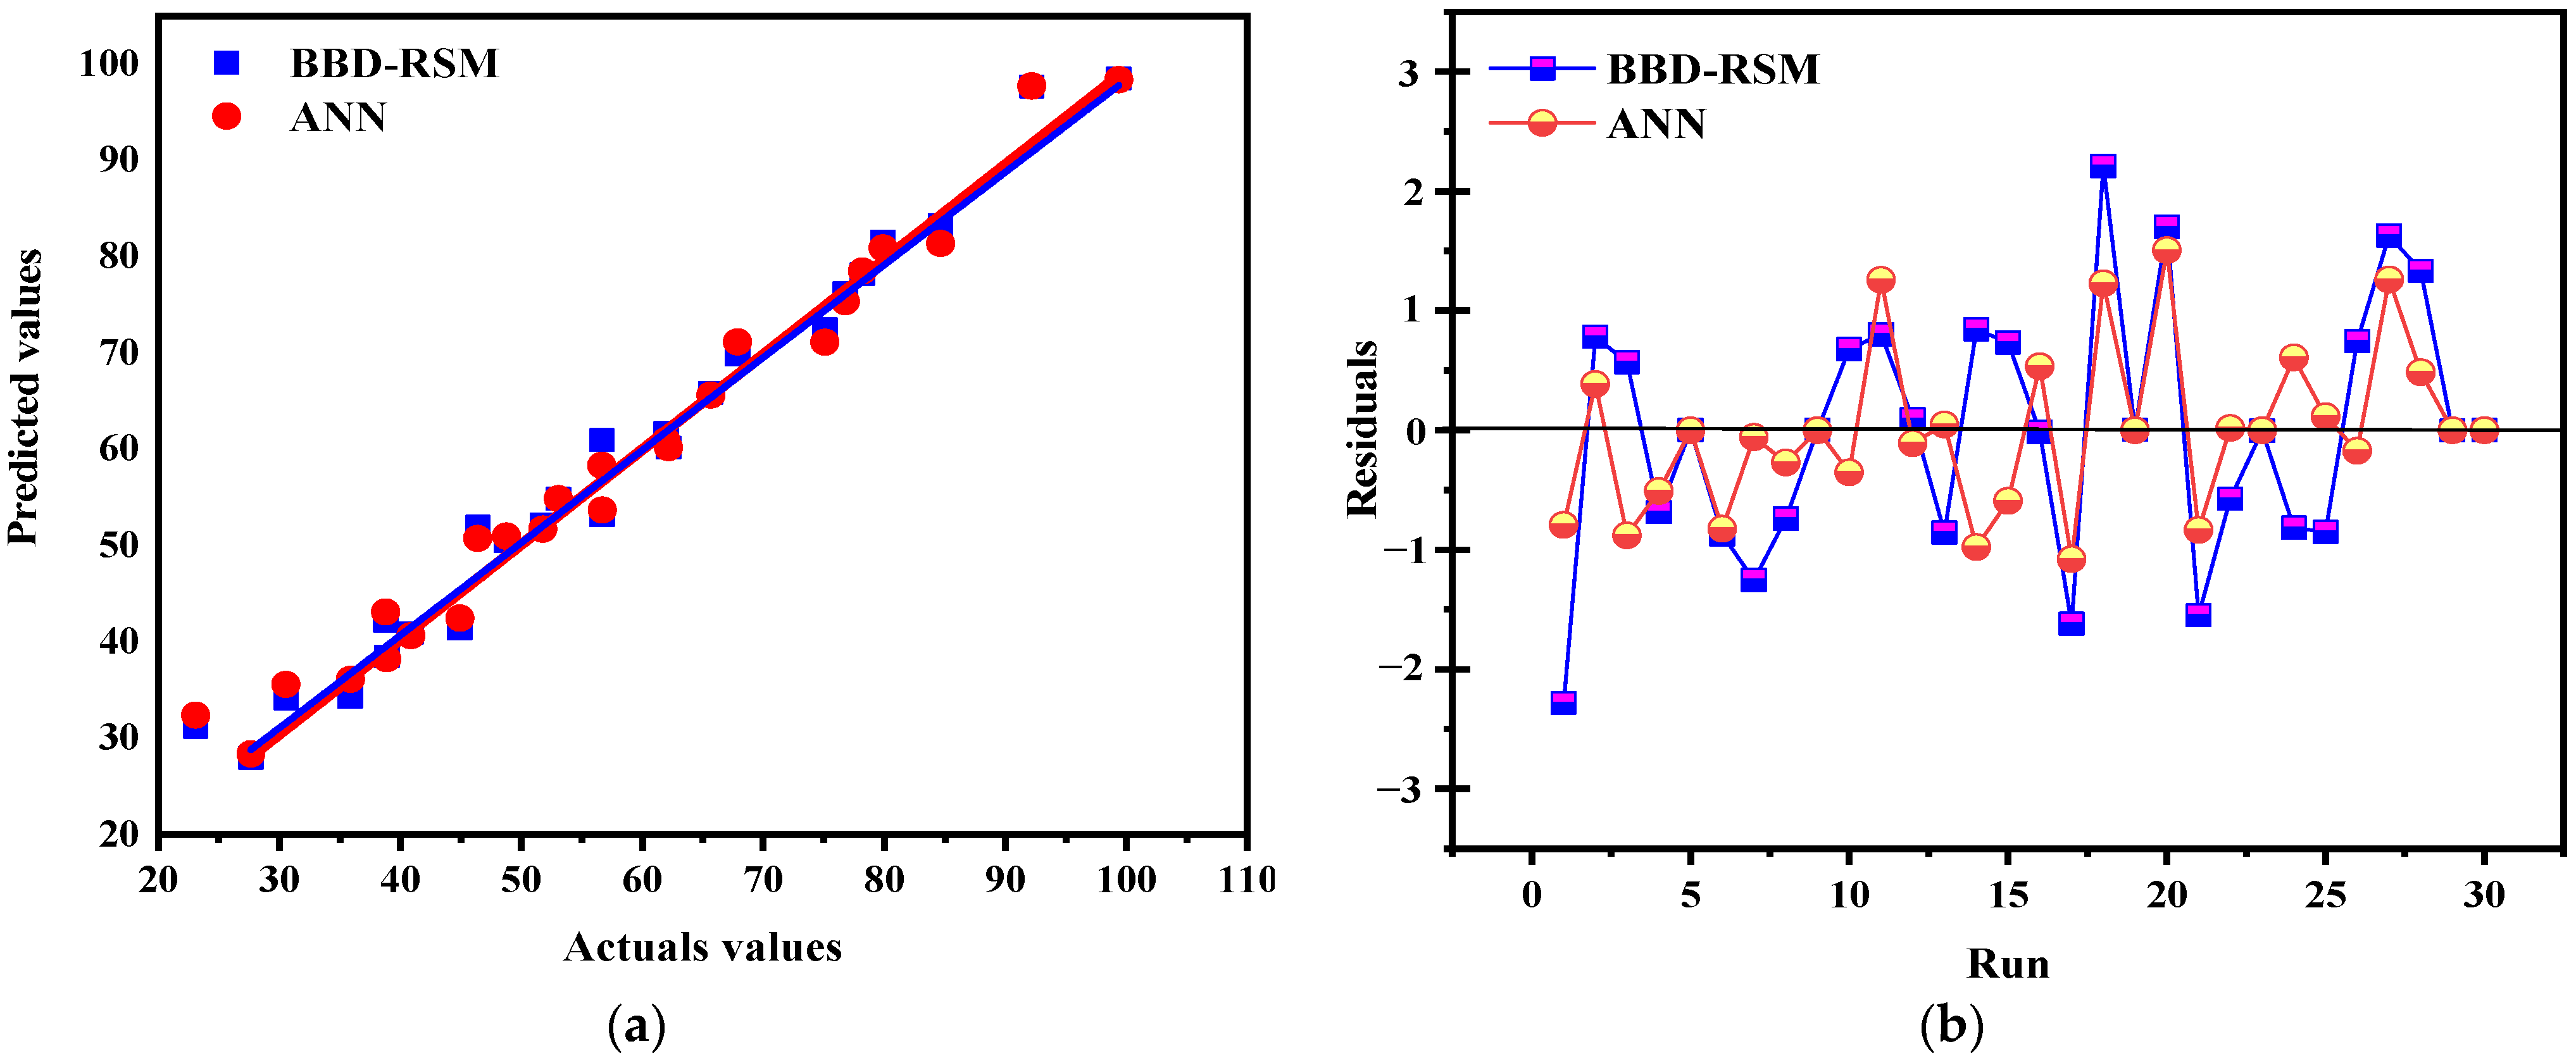
Comparing the ANN and RSM models is essential for determining their effectiveness in complex environments for predicting future events and identifying which model has the greatest impact based on the data and analysis criteria. This comparison helps to understand their ability to account for existing data as well as their potential to extrapolate predictions with new data. The results show that the artificial neural network (ANN) model outperforms the response surface methodology (RSM) in terms of predictive accuracy and overall fit. With determination coefficients (R2) of 0.9996 for tests, 0.99978 for training, and 0.98 for validation (Figure 17), the ANN offers an almost perfect fit, while the RSM shows R2 values of 0.9875 and 0.9279 for prediction, indicating a good but slightly lower accuracy. To evaluate these models, a statistical analysis based on RMSE (root mean square error) and MAE (mean absolute error) was performed (Table 4), justifying the relevance of each model while facilitating their comparison. The predicted values from both models were compared to the actual values, and as shown in Figure 18a, they are well aligned with the actual results, demonstrating their accuracy. However, the residuals from the ANN model are closer to the median line, revealing a significantly higher accuracy compared to RSM, as illustrated in Figure 18b. These results are consistent with statistical analyses showing lower RMSE and MAE values for the ANN, confirming its superiority in terms of its predictive and estimation capabilities compared to RSM, a finding also supported by previous research, which highlighted the superior predictive and estimation capabilities of the ANN architecture over the RSM approach [40,64,65].
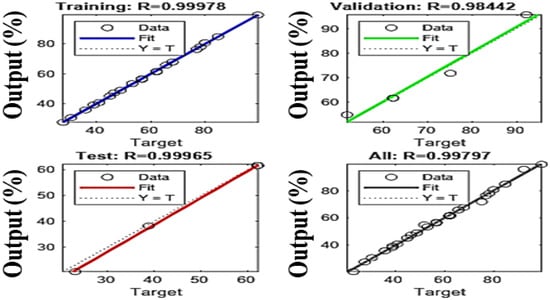
Figure 17.
Regression plots of the ANN model.
Table 4.
Statistical evaluation of the BBD-RSM and ANN models.
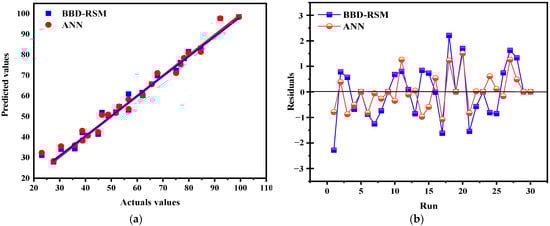
Figure 18.
Actuals values vs. predicted values (a); run vs. residuals (b).
4. Conclusions
This present study demonstrates the effectiveness of a visible-light-activated SnFe2O4/g-C3N4 heterojunction nanocomposite photocatalyst for the degradation of cationic dyes in photocatalytic photo-Fenton-like and photo-Fenton-like processes. Utilizing graphitic carbon nitride (g-C3N4) and tin ferrate (SnFe2O4) synthesized via co-precipitation, the composite was meticulously characterized by X-ray diffraction (XRD), Fourier-transform infrared spectroscopy (FTIR), scanning electron microscopy (SEM), and transmission electron microscopy (TEM), revealing an intimate contact between the two phases. Under visible LED light irradiation, the SnFe2O4/g-C3N4 composite exhibited significantly enhanced performance in degrading brilliant cresyl blue (BCB) compared to its individual components, reaching optimal activity. This improvement is due to the efficient separation of electron–hole pairs, facilitated by electron transfer and the synergistic interaction between SnFe2O4 and g-C3N4. Using response surface methodology (RSM) with a Box–Behnken design, the optimization of cationic dye removal was carried out by analyzing four variables. The optimal conditions for achieving a BCB removal rate of approximately 99.347% included a catalyst loading of 0.29 mg, a BCB concentration of 25.046 mg L−1, an H2O2 volume of 1.37 mL, and a reaction time of 149.657 min. These results are consistent with those obtained from batch optimization. Modeling the experimental data with both BBD-RSM and ANN models demonstrated the effectiveness of each approach in predicting BCB removal. However, the comparative analysis favored ANN, which achieved a higher R2 value of 0.9996 compared to RSM’s R2 value of 0.97. These findings underscore not only the efficiency of the SnFe2O4/g-C3N4 nanocomposite photocatalyst in breaking down recalcitrant organic pollutants but also its stability and high recyclability. The SnFe2O4/g-C3N4 nanocomposite photocatalyst proves to be an effective and sustainable solution for treating wastewater contaminated with cationic dyes, with potential applications in ecological environments and in magnetic fields.
Supplementary Materials
The following supporting information can be downloaded at: https://www.mdpi.com/article/10.3390/reactions6020023/s1, Figure S1: EDX spectrum and mapping micrographs, of SnFe2O4/g-C3N4 (20 %).; Figure S2: shows the UV-Vis absorption spectra of different dyes at various time intervals during their degradation via the Photo-Fenton-like process using the SnFe2O4/g-C3N4 (20%) composite; Figure S3: Impact of scavengers on the photocatalytic degradation of BCB using the SnFe2O4/g-C3N4 nanocomposite; Figure S4: Desirability Curve for Numerical Optimization of Experimental Variables; Table S1: Experimental design conditions by RSM and ANN (Y(%): actual values (%), RSM; Table S2: Statistical parameters; Table S3: Levels of variables considered for the Box-Behnken design; Table S4: Model Validation Statistics; Table S5: Range of Variables and Selected Responses in the Solutions.
Author Contributions
Conceptualization, Y.E. and S.E.H.; Methodology, Y.E., M.B.A., Y.B. and S.E.H.; Software, M.E.; Validation, F.-Z.A.; Formal analysis, F.-Z.A. and S.A.; Investigation, Y.E., M.B.A., M.E. and Y.B.; Resources, M.B.A.; Data curation, S.A.; Writing—original draft, Y.E.; Writing—review & editing, S.A., M.E. and S.E.H.; Visualization, S.E.H.; Supervision, S.E.H. All authors have read and agreed to the published version of the manuscript.
Funding
This research received no external funding.
Data Availability Statement
The original contributions presented in this study are included in the article/Supplementary Material. Further inquiries can be directed to the corresponding author(s).
Conflicts of Interest
The authors declare no conflict of interest.
References
- Bouwer, H. Integrated water management for the 21st century: Problems and solutions. J. Irrig. Drain. Eng. 2002, 128, 193–202. [Google Scholar]
- Dogan, M.; Alkan, M. Adsorption kinetics of methyl violet onto perlite. Chemosphere 2003, 50, 517–528. [Google Scholar]
- Jamil, T. Role of advance oxidation processes (AOPs) in textile wastewater treatment: A critical review. Desalination Water Treat. 2024, 318, 100387. [Google Scholar]
- Gogate, P.R.; Pandit, A.B. A review of imperative technologies for wastewater treatment I: Oxidation technologies at ambient conditions. Adv. Environ. Res. 2004, 8, 501–551. [Google Scholar]
- Kong, H.J.; Won, D.H.; Kim, J.; Woo, S.I. Sulfur-Doped gC3N4/BiVO4 Composite Photocatalyst for Water Oxidation under Visible Light. Chem. Mater. 2016, 28, 1318–1324. [Google Scholar] [CrossRef]
- Kocijan, M.; Podlogar, M. Perspective Chapter: Modification Engineering of Titanium Dioxide-Based Nanostructured Photocatalysts for Efficient Removal of Pollutants from Water. In Titanium Dioxide—Uses, Applications, and Advances; IntechOpen: London, UK, 2024. [Google Scholar]
- Gul, S.; Yousuf, M.A.; Anwar, A.; Warsi, M.F.; Agboola, P.O.; Shakir, I.; Shahid, M. Alsubstituted zinc spinel ferrite nanoparticles: Preparation and evaluation of structural, electrical, magnetic and photocatalytic properties. Ceram. Int. 2020, 46, 14195–14205. [Google Scholar]
- Hoffmann, M.R.; Martin, S.T.; Choi, W.; Bahnemann, D.W. Environmental Applications of Semiconductor Photocatalysis. Chem. Rev. 1995, 95, 69–96. [Google Scholar] [CrossRef]
- Chakraborty, T.; Sharma, S.; Debnath, T.; Mahapatra, A.S.; Selvam, A.; Chakrabarti, S.; Sutradhar, S. Fabrication of heterostructure composites of Ni-Zn-Cu-ferrite-C3N4-poly(vinylidene fluoride) films for the enhancement of electromagnetic interference shielding effectiveness. Chem. Eng. J. 2021, 420, 127683. [Google Scholar]
- Niu, P.; Zhang, L.; Liu, G.; Cheng, H.M. Graphene-Like Carbon Nitride Nanosheets for Improved Photocatalytic Activities. Adv. Funct. Mater. 2012, 22, 4763–4770. [Google Scholar] [CrossRef]
- Iftikhar, S.; Warsi, M.F.; Haider, S.; Musaddiq, S.; Shakir, I.; Shahid, M. The impact of carbon nanotubes on the optical, electrical, and magnetic parameters of Ni2+ and Co2+ based spinel ferrites. Ceram. Int. 2019, 45, 21150–21161. [Google Scholar]
- Li, Y.; Chen, D.; Fan, S.; Yang, T. Enhanced visible light assisted Fenton-like degradation of dye via metal-doped zinc ferrite nanosphere prepared from metalrich industrial wastewater. J. Taiwan Inst. Chem. Eng. 2019, 96, 185–192. [Google Scholar] [CrossRef]
- Sun, X.; Huang, L.; Wang, G.; Feng, H.; Zhou, S.; Zhao, R.; Wang, D.; Li, Z. Efficient degradation of tetracycline under the conditions of high-salt and coexisting substances by magnetic CuFe2O4/g-C3N4 photo-Fenton process. Chemosphere 2022, 308, 136204. [Google Scholar] [CrossRef] [PubMed]
- Liu, Y.; Song, Y.; You, Y.; Fu, X.; Wen, J.; Zheng, X. NiFe2O4/g-C3N4 heterojunction composite with enhanced visible-light photocatalytic activity. J. Saudi Chem. Soc. 2018, 22, 439–448. [Google Scholar] [CrossRef]
- Sun, H.; Zhou, T.; Kang, J.; Zhao, Y.; Zhang, Y.; Wang, T.; Yin, X. High-efficient degradation of oxytetracycline by visible photo-Fenton process using MnFe2O4/g-C3N4: Performance and mechanisms. Sep. Purif. Technol. 2022, 299, 121771. [Google Scholar] [CrossRef]
- Yao, Y.; Wu, G.; Lu, F.; Wang, S.; Hu, Y.; Huang, W.; Wei, F. Enhanced photo-Fenton-like process over Z-scheme CoFe2O4/g-C3N4 Heterostructures under natural indoor light. Environ. Sci. Pollut. Res. 2016, 23, 21833–21845. [Google Scholar] [CrossRef] [PubMed]
- Yao, Y.; Cai, Y.; Lu, F.; Qin, J.; Wei, F.; Xu, C. Magnetic ZnFe2O4−C3N4 hybrid for photocatalytic degradation of aqueous organic pollutants by visible light. Ind. Eng. Chem. Res. 2014, 53, 17294–17302. [Google Scholar] [CrossRef]
- Lu, A.H.; Salabas, E.L.; Schüth, F. Magnetic nanoparticles: Synthesis, protection, functionalization, and application. Angew. Chem. Int. Ed. 2007, 46, 1222–1244. [Google Scholar] [CrossRef]
- Baladi, E.; Davar, F.; Hojjati-Najafabadi, A. Synthesis and characterization of g–C3N4–CoFe2O4–ZnO magnetic nanocomposites for enhancing photocatalytic activity with visible light for degradation of penicillin G antibiotic. Environ. Res. 2022, 215 Pt 2, 114270. [Google Scholar] [CrossRef]
- Huang, S.; Xu, Y.; Xie, M.; Xu, H.; He, M.; Xia, J.; Li, H. Synthesis of magnetic CoFe2O4/g-C3N4 composite and its enhancement of photocatalytic ability under visible-light. Colloids Surf. A 2015, 478, 71–80. [Google Scholar] [CrossRef]
- Sun, J.; Lin, X.; Xie, J.; Zhang, Y.; Wang, Q.; Ying, Z. Facile synthesis of novel ternary g-C3N4/ferrite/biochar hybrid photocatalyst for efficient degradation of methylene blue under visible-light irradiation. Colloids Surf. A Physicochem. Eng. Asp. 2020, 606, 125556. [Google Scholar] [CrossRef]
- Khan, M.A.M.; Khan, W.; Ahamed, M.; Ahmed, J.; Al-Gawati, M.A.; Alhazaa, A.N. Silver-decorated cobalt ferrite nanoparticles anchored onto the graphene sheets as electrode materials for electrochemical and photocatalytic applications. ACS Omega 2020, 5, 31076–31084. [Google Scholar]
- Vignesh, K.; Suganthi, A.; Min, B.K.; Kang, M. Photocatalytic activity of magnetically recoverable MnFe2O4/g-C3N4/TiO2 nanocomposite under simulated solar light irradiation. J. Mol. Catal. A Chem. 2014, 395, 373–383. [Google Scholar]
- Chen, L.; Ma, W.; Dai, J.; Zhao, J.; Li, C.; Yan, Y. Facile synthesis of highly efficient graphitic-C3N4/ZnFe2O4 heterostructures enhanced visible-light photocatalysis for spiramycin degradation. J. Photochem. Photobiol. A 2016, 328, 24–32. [Google Scholar]
- Palanivel, B.; Hu, C.; Shkir, M.; AlFaify, S.; Ibrahim, F.A.; Hamdy, M.S.; Mani, A. Hétérojonction NiFe2O4 couplée au g-C3N4 dopé au fluor: Consommation de H2O2 pour la production de radicaux hydroxyles en vue de la dégradation du paracétamol. Commun. Sci. Colloïdes Interfaces 2021, 42, 100410. [Google Scholar] [CrossRef]
- Yao, Y.; Lu, F.; Zhu, Y.; Wei, F.; Liu, X.; Lian, C.; Wang, S. Magnetic core–shell CuFe2O4@C3N4 hybrids for visible light photocatalysis of Orange II. J. Hazard. Mater. 2015, 297, 224–233. [Google Scholar] [CrossRef] [PubMed]
- Rai, P.; Gautam, R.K.; Banerjee, S.; Rawat, V.; Chattopadhyaya, M.C. Synthesis and characterization of a novel SnFe2O4@activated carbon magnetic nanocomposite and its effectiveness in the removal of crystal violet from aqueous solution. J. Environ. Chem. Eng. 2015, 3, 2281–2291. [Google Scholar]
- Jia, Y.; Rhee, S.J.; Liu, C. Recyclability of g-C3N4/SnFe2O4 for CTC degradation, (B) magnetic hysteresis loops, (C) effects of series of scavengers on the degradation efficiency of CTC, (D) schematic of the photocatalytic degradation of CTC on g-C3N4/SnFe2O4. Mater. Lett. 2017, 188, 338–342. [Google Scholar]
- Lee, K.T.; Lu, S.Y. A cost-effective, stable, magnetically recyclable photocatalyst of ultra-high organic pollutant degradation efficiency: SnFe2O4 nanocrystals from a carrier solvent. J. Mater. Chem. A 2015, 3, 12259–12267. [Google Scholar]
- Jia, Y.; Kim, D.H.; Lee, B.W.; Rhee, S.J.; Kang, S.; Lee, T.; Liu, C. One-pot solvothermal synthesis of magnetic SnFe2O4 nanoparticles and their performance in the photocatalytic degradation of chlortetracycline with visible light radiation. RSC Adv. 2016, 6, 76542–76550. [Google Scholar]
- Arslan-Alaton, I.; Tureli, G.; Olmez-Hanci, T. Traitement des eaux usées de production de colorants azoïques par des procédés d’oxydation avancée de type Photo-Fenton: Optimisation par méthodologie de surface de réponse. J. Photochem. Photobiol. A Chem. 2009, 202, 142–153. [Google Scholar]
- Salari, M.; Nikoo, M.R.; Al-Mamoun, A.; Rakhshandehroo, G.R.; Mooselu, M.G. Optimisation du processus de type Fenton, homogène à pH neutre pour la dégradation de la ciprofloxacine: Comparaison de RSM-CCD et ANN-GA. J. Environ. Gérer. 2022, 317, 115469. [Google Scholar]
- Khiar, H.; Janani, F.Z.; Sadiq, M.; Qourzal, S.; Puga, A.; Barka, N. Hétérojonction Ag3PO4: Nn décorée MoO3 pour des performances photocatalytiques élevées et une stabilité améliorée. Bull. Rech. Mat. 2025, 184, 113253. [Google Scholar]
- Alahiane, S.; Qourzal, S.; El Ouardi, M.; Abaamrane, A.; Assabbane, A. Facteurs influençant la dégradation photocatalytique du jaune réactif 145 par les fibres non tissées revêtues de TiO2. Am. J. Anal. Chem. 2014, 5, 46558. [Google Scholar]
- Speck, F.; Raja, S.; Ramesh, V.; Thivaharan, V. Modeling and Optimization of Homogeneous Photo-Fenton Degradation of Rhodamine B by Response Surface Methodology and Artificial Neural Network. Int. J. Environ. Res. 2016, 10, 543–554. [Google Scholar]
- Berkani, M.; Kadmi, Y.; Bouchareb, M.K.; Bouhelassa, M.; Bouzaza, A. Combination of a Box-Behnken design technique with response surface methodology for optimization of the photocatalytic mineralization of C.I. Basic Red 46 dye from aqueous solution. Arab J. Chem. 2020, 13, 8338–8346. [Google Scholar]
- El-Habacha, M.; Lagdali, S.; Dabagh, A.; Mahmoudy, G.; Assouani, A.; Benjelloun, M.; Miyah, Y.; Iaich, S.; Chiban, M.; Zerbet, M. High efficiency of sodium hydroxide-treated phengite clay for adsorption of Congo red dye: Optimization, cost estimation, and mechanism study. Environ. Res. 2024, 259, 119542. [Google Scholar]
- Ray, S.; Haque, M.; Ahmed, T.; Nahin, T.T. Comparison of artificial neural network (ANN) and response surface methodology (RSM) in predicting the compressive and splitting tensile strength of concrete prepared with glass waste and tin (Sn) can fiber. J. King Saud Univ. Eng. Sci. 2023, 35, 185–199. [Google Scholar]
- de Luna, M.D.G.; Sablas, M.M.; Hung, C.-M.; Chen, C.-W.; Garcia-Segura, S.; Dong, C.-D. Modeling and optimization of imidacloprid degradation by catalytic percarbonate oxidation using artificial neural network and Box-Behnken experimental design. Chemosphere 2020, 251, 126254. [Google Scholar]
- Boukarma, L.; Aboussabek, A.; El Aroussi, F.; Zerbet, M.; Sinan, F.; Chiban, M. Insight into mechanism, Box-Behnken design, and artificial neural network of cationic dye biosorption by marine macroalgae Fucus spiralis. Algal Res. 2023, 76, 103324. [Google Scholar]
- Lee, J.H.; Kim, H.J. Application of response surface methodology to optimize the photocatalytic degradation of dyes using composite photocatalysts. Chem. Eng. J. 2020, 385, 123317. [Google Scholar]
- Jia, Y.; Rhee, S.J.; Liu, C. Synthèse d’un composite g-C3N4/SnFe2O4 magnétique récupérable avec des propriétés photocatalytiques améliorées en lumière visible. Mater. Lett. 2017, 188, 338–342. [Google Scholar] [CrossRef]
- Jo, W.-K.; Moru, S.; Tonda, S. Photocatalyseurs hybrides SnFe2O4/g-C3N4 magnétiquement réactifs avec des performances remarquables induites par la lumière visible pour la dégradation de substances dangereuses et la production durable d’hydrogène. Appl. Surf. Sci. 2020, 506, 144939. [Google Scholar] [CrossRef]
- Jo, W.-K.; Moru, S.; Tonda, S. Magnetically responsive SnFe2O4/g-C3N4 hybrid photocatalysts with remarkable visible-light-induced performance for degradation of environmentally hazardous substances and sustainable hydrogen production. Appl. Surf. Sci. 2020, 506, 144939. [Google Scholar] [CrossRef]
- Han, H.; Luo, Y.; Jia, Y.; Hasan, N.; Liu, C. A review on SnFe2O4 and their composites: Synthesis, properties, and emerging applications. Prog. Nat. Sci. Mater. Int. 2022, 32, 517–527. [Google Scholar] [CrossRef]
- Jiang, H.; Chen, H.; Fu, Y.; Guo, C. SnFe2O4 mediated near-infrared-driven photocatalysis, photothermal sterilization and piezocatalysis. Appl. Surf. Sci. 2023, 611, 155555. [Google Scholar] [CrossRef]
- Soufi, A.; Khnifira, M.; Hajjaoui, H.; Bessbousse, H.; Barka, N. Effect of MgFe2O4 catalyst preparation method on its surface characteristics and Fenton-like oxidation of tartrazine: Statistical comparison and DFT-assisted prediction of mechanism. Mater. Today Commun. 2023, 35, 105737. [Google Scholar] [CrossRef]
- Jia, Y.; Ma, H.; Zhang, W.; Zhu, G.; Yang, W.; Son, N.; Kang, M.; Liu, C. Z-scheme SnFe2O4-graphitic carbon nitride: Reusable, magnetic catalysts for enhanced photocatalytic CO2 reduction. Chem. Eng. J. 2020, 383, 123172. [Google Scholar] [CrossRef]
- Zhao, M.; Wang, X. Role of dye adsorption in enhancing photocatalytic performance: A review. Appl. Catal. B Environ. 2021, 284, 119760. [Google Scholar]
- Palanivel, B.; Perumal, S.M.; Maiyalagan, T.; Jayarman, V.; Ayyappan, C.; Alagiri, M. Rational design of ZnFe2O4/g-C3N4 nanocomposite for enhanced photo-Fenton reaction and supercapacitor performance. Appl. Surf. Sci. 2019, 498, 143807. [Google Scholar] [CrossRef]
- Nguyen, L.T.; Duong, A.T.; Bui, N.D.; Ngo, V.T.; Nguyen, H.Q.; Nguyen, H.T.; Tran, G.T.; Tran, T.V. Synthèse de photocatalyseurs magnétiques à hétérojonction NiFe2O4/g-C3N4 pour améliorer les performances de dégradation des colorants sous irradiation à la lumière visible. Soc. R. Chim. 2024, 7, 536–548. [Google Scholar]
- Ismael, M. Photo-Fenton reaction enhanced visible-light activity of p-CuFe2O4/n-g-C3N4 heterojunction composites synthesized by a simple ultrasonic-assisted route for organic pollutants degradation. Mater. Res. Bull. 2022, 151, 111803. [Google Scholar]
- Ji, H.; Jing, X.; Xu, Y.; Yan, J.; Li, H.; Li, Y.; Huang, L.; Zhang, Q.; Xu, H.; Li, H. Magnetic g-C3N4/NiFe2O4 hybrids with enhanced photocatalytic activity. RSC Adv. 2015, 5, 57960–57967. [Google Scholar] [CrossRef]
- O’Dowd, K.; Pillai, S.C. Photo-Fenton disinfection at near neutral pH: Process, parameter optimization and recent advances. J. Environ. Chem. Eng. 2020, 8, 104063. [Google Scholar]
- Zhang, J.; Lin, Y.; Liu, L. Electron transfer in heterojunction catalysts. Phys. Chem. Chem. Phys. 2023, 25, 7106–7119. [Google Scholar] [CrossRef]
- Li, N.; Zhang, J.; Tian, Y.; Zhao, J.; Zhang, J.; Zuo, W. Precisely controlled fabrication of magnetic 3D γ-Fe2O3@ZnO core-shell photocatalyst with enhanced activity: Ciprofloxacin degradation and mechanism insight. Chem. Eng. 2017, 308, 377–385. [Google Scholar]
- Xu, F.; He, Y.; Zhang, J.; Liang, G.; Liu, C.; Yu, J. Prolonging charge carrier lifetime via intraband defect levels in S-scheme heterojunctions for artificial photosynthesis. Angew. Chem. Int. Ed. 2025, 64, e202414672. [Google Scholar] [CrossRef]
- Hosseini, O.; Zare-Shahabadi, V.; Ghaedi, M.; Ahmadi Azqhandi, M.H. Experimental design, RSM and ANN modeling of tetracycline photocatalytic degradation using LDH@CN. J. Environ. Chem. Eng. 2022, 10, 108345. [Google Scholar]
- Mourabet, M.; El Rhilassi, A.; El Boujaady, H.; Bennani-Ziatni, M.; Taitai, A. Use of response surface methodology for optimization of fluoride adsorption in an aqueous solution by Brushite Arab. J. Chem. 2017, 10, S3292–S3302. [Google Scholar]
- Soufi, A.; Hajjaoui, H.; Elmoubarki, R.; Abdennouri, M.; Qourzal, S.; Barka, N. Heterogeneous Fenton-like degradation of tartrazine using CuFe2O4 nanoparticles synthesized by sol-gel combustion. Appl. Surf. Sci. Adv. 2022, 9, 100251. [Google Scholar] [CrossRef]
- Tolba, A.; Alalm, M.G.; Elsamadony, M.; Mostafa, A.; Afify, H.; Dionysiou, D.D. Modélisation et optimisation de processus hétérogènes de type Fenton et photo-Fenton utilisant des nanotubes de carbone Fe3O4-MWCNT réutilisables. Sécurité Procédés Prot. L’environnement 2019, 128, 273–283. [Google Scholar]
- Mugendiran, V.; Gnanavelbabu, A.; Ramadoss, R. Parameter optimization for surface roughness and wall thickness on AA5052 Aluminium alloy by incremental forming using response surface methodology. Proc. Eng. 2014, 97, 1991–2000. [Google Scholar] [CrossRef]
- Khasraghi, A.; Zare, K.; Mehrizad, A.; Modirshahla, N.; Behnajady, M.A. Zeolite 4A supported CdS/g-C3N4 type-II heterojunction: A novel visible-light-active ternary nanocomposite for potential photocatalytic degradation of cefoperazone. J. Mol. Liq. 2021, 342, 117479. [Google Scholar]
- Boucherit, N.; Hanini, S.; Ibrir, A.; Laidi, M.; Roubehie-Fissaa, M. Removal of Chlortetracycline Chlorhydrate by Photo-Fenton Process. Kem. Ind. 2023, 72, 627–637. [Google Scholar] [CrossRef]
- Kassahun, S.K.; Kiflie, Z.; Kim, H.; Baye, A.F. Process optimization and kinetics analysis for photocatalytic degradation of emerging contaminant using N-doped TiO2-SiO2 nanoparticle: Artificial Neural Network and Surface Response Methodology approach. Environ. Technol. Innov. 2021, 23, 101761. [Google Scholar] [CrossRef]


Disclaimer/Publisher’s Note: The statements, opinions and data contained in all publications are solely those of the individual author(s) and contributor(s) and not of MDPI and/or the editor(s). MDPI and/or the editor(s) disclaim responsibility for any injury to people or property resulting from any ideas, methods, instructions or products referred to in the content. |
© 2025 by the authors. Licensee MDPI, Basel, Switzerland. This article is an open access article distributed under the terms and conditions of the Creative Commons Attribution (CC BY) license (https://creativecommons.org/licenses/by/4.0/).