Article

Geospatial Analysis and Mapping of Regional Landslide Susceptibility: A Case Study of Eastern Tennessee, USA

Department of Geosciences, Mississippi State University, Mississippi State, MS 39762, USA
*
Author to whom correspondence should be addressed.
GeoHazards 2024, 5(2), 364-373; https://doi.org/10.3390/geohazards5020019
Submission received: 8 March 2024 / Revised: 12 April 2024 / Accepted: 14 April 2024 / Published: 17 April 2024

Abstract

:
A landslide is the movement of rocks, debris, and/or soils down a slope, which often includes falls, topples, slides, flows, and spreads. Landslides, a serious natural hazard to human and human activity, often occur in the coastal and mountainous areas in the United States. Although there are some studies that have explored the landslide probability, which is typically directly modeled by inputting potential environmental variables into statistical regression models, this study designed an alternative geospatial analysis and modeling approach. We first conducted statistical diagnostic tests to examine the significance of potential driving factors including landform, land use/land cover, landscape, and climate. In eastern Tennessee, USA, we first applied the t-test and chi-squared test to select the significant factors driving landslides, including slope, clay percentage in the soil, tree canopy density, and distance to roads, having a p-value of less than 0.05. We then incorporated the four identified significant factors as covariates into logistic regression to model the relationship between these factors and landslides. The fitted logistic model, with a high area under the ROC (AUC) score of 0.94, was then applied to predict landslides and make a regional landslide susceptibility map for eastern Tennessee. The landslide’s potential impacts on eastern Tennessee were also discussed, and implications for local governments and communities for current physical infrastructure protection and new infrastructure development were summarized.

1. Introduction

A landslide is the movement of rocks, debris, and/or soils down a slope, including falls, topples, slides, flows, and spreads [1,2]. They most often occur naturally but can also be trigged by human activities, such as unstable human-made slopes [3], uneven degrees of weathering [4], weak rock units, overadequate precipitation [5,6,7,8,9], and earthquakes [10,11,12].
In the United States, landslides, as a major geologic hazard occur, in all fifty states and more often in coastal and mountainous areas such as along the west coast and in the eastern mountainous and hilly regions. Landslides, a serious natural hazard to human and human activity, are a significant driving factor of landforms that modify slopes, transport sediments down slopes, change the land surface, and influence ecosystem functions. Each year, landslides cause about USD 3.5 billion in damage and kill about 25 to 50 people in the USA (https://pubs.usgs.gov/fs/2004/3072/fs-2004-3072.html, accessed on 28 March 2024).
However, not many landslide susceptibility studies in the United States have been published in refereed journals; some empirical case studies are for landslide sites in Idaho [13], Washington [14,15,16], and western Colorado [17], which are mountainous areas where slope was found to be a statistically significant influencing factor. The landslide study in Ohio [18] indicated that slope angle, proximity to streams, soil erodibility, and soil type were statistically significant influencing factors. The study in Kansas [5] found that slope was the most important factor in landslide susceptibility assessment modeling, and geologic units consisting mostly of shale, siltstone, and sandstone were also found to be variables contributing to landslide susceptibility; soil type was also examined, but soil type was highly correlated to geologic unit.
Currently, both qualitative methods and quantitative modeling are used to analyze and map landslide susceptibility. Being knowledge-driven, qualitative methods often rely on experts’ knowledge and opinions about a place, which typically require field surveys of geology, geomorphology, and land use and land cover [1,18], so that experts can assess the potential contribution of these factors to landslides. On the other hand, landslides are analyzed and mapped by using quantitative approaches, which are typically data-driven methods [19,20,21,22,23,24]; sometimes, experts’ assessments are also incorporated into quantitative modeling. An example of a combined quantitative and qualitative approach is spatial multicriteria evaluation, in which an analytical hierarchical process is used in a geographic information system (GIS) environment to assign weights and build a hierarchy of variables to quantify the potential for landslides [4,25].
In this study, we designed an alternative GIS modeling approach for regional landslide susceptibility analysis and mapping (Figure 1) and then applied it to eastern Tennessee, which is located in the southern Appalachian Mountains area in the U.S. We emphasize not only the geological, landform, landscape, and climate factors but also the multivariate analysis of driving force of landslides’ environmental factors, which were first statistically tested. Then, we applied logistic regression in a GIS environment to model and map landslide susceptibility.

2. The Study Area

We chose the eastern Tennessee area, covering various subranges of the Appalachian Mountain Range, based on the past landslides before 2015 in this region recorded by the Tennessee Department of Transportation. The eastern Tennessee region, also called Region 1, includes twenty-four counties including Fentress, Cumberland, Scott, Morgan, Roane, Loudon, Monroe, Campbell, Anderson, Know, Blount, Claiborne, Grainger, Jefferson, Sevier, Hancock, Hawkins, Greene, Cocke, Sullivan, Washington, Unicoi, Carter, and Johnson.
The total area of east Tennessee is 25,314 km2, and, within the study area, the major cities are Knoxville, Chattanooga, and the Tri-Cities, which are the third, fourth, and sixth largest population centers in Tennessee. This study area hosts one of the highest concentrations of European Americans in the USA. The populations in most counties are 90% or more White, except for the counties of Hamilton and Knox; African Americans are largely aggregated in Chattanooga and Knoxville.
Fully located within the Appalachian Mountains, the landforms in east Tennessee are mainly valleys and ridges, which are the characteristic terrain of the Great Appalachian Valley and constitute the majority of the study area [26]. This study area includes three major geological divisions: the Blue Ridge Mountains are in the east; in the center is the Ridge-and-Valley Appalachians; and to the west of the Ridge-and-Valley Appalachians is the Cumberland Plateau. The average elevation in the Blue Ridge Mountains within this study area is the highest, with a mean of 1500 m. However, the elevation in the Ridge-and-Valley Appalachians is the lowest, having relatively wide river valleys. Among them are parallel ridges commonly running from southwest to northeast, and the lowest site is only about 180 m above sea level. The Cumberland Plateau has an average elevation of 610 m above sea level, and most areas in general are about 300 m higher than the Appalachian Valley.
Most of the areas in the eastern Tennessee region experience warm summers and mild winters, except for the high-elevation areas in the Cumberland and Blue Ridge Mountains, where a humid continental and cool mountain temperature climate is dominant. The average temperature is 58.4 °F. Most of the precipitation occurs in the winter and early spring. The average annual precipitation (2000–2015) for eastern Tennessee was about 1300 mm [27].

3. Data and Methods

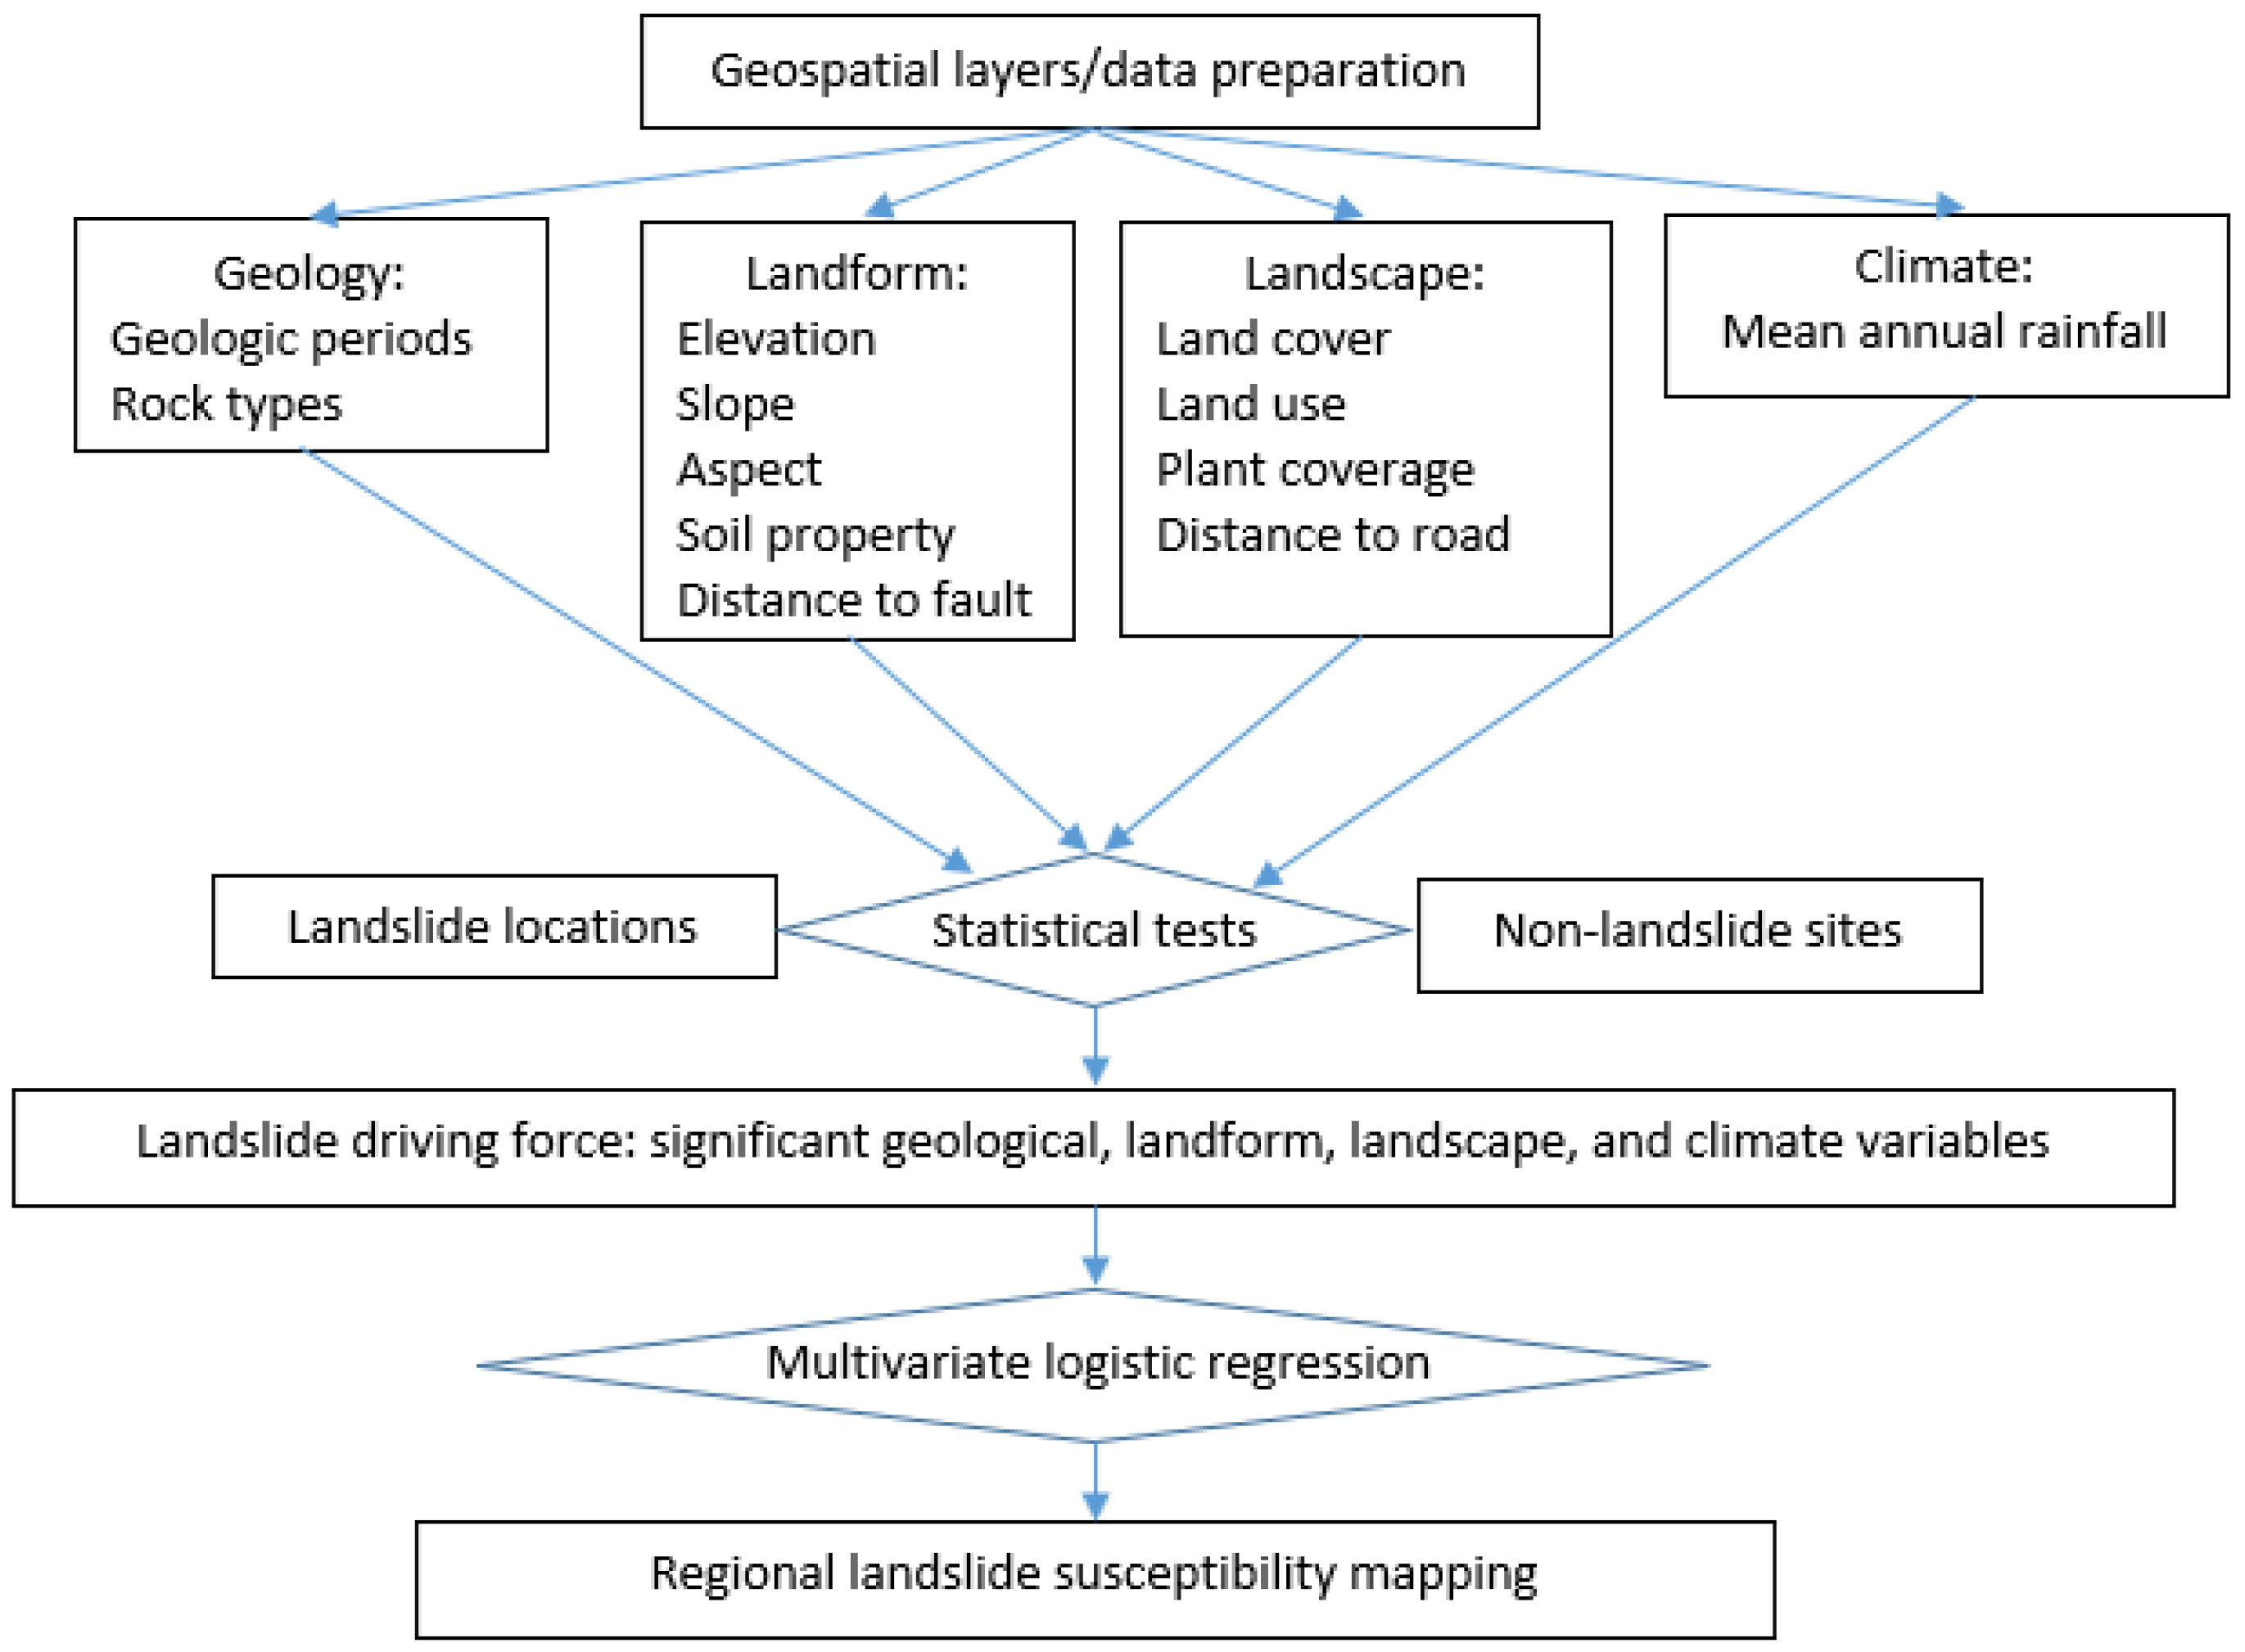
3.1. Geospatial Data Processing

Geology, landform, landscape, and climate data were prepared and processed into different geospatial layers (Table 1). Two types of geologic data, geologic period and rock type, were processed. Landform and soil geospatial layers included elevation, slope, aspect, clay and silt percentages, and distance to roads, which can be thought of as a social factor. Landscape data included land use, land cover, and percentage of tree canopy. Distance to roads was processed based on roads using the 2010 TIGER/Line dataset. The distance to road variable was the distance between a landslide point to the nearest road. To be ready for GIS and statistical regression modeling, all the geospatial layers in Table 1 were processed and converted into a 30 m grid format. For example, the nonraster layer of distance to a road, which was a point shapefile of distance, was then converted into a raster layer with cell size of 30 m. The PRISIM climate data were resampled onto a 30 m grid. All raster layers were then projected onto Tennessee State Plane using ArcGIS 10.3.1.

3.2. The Selection of Significant Variables

According to the landslide research process that we proposed above (Figure 1), the significant driving factors were first statistically tested after the geospatial layers were processed. The t-test and chi-squared test were applied to the factors in Table 1 for numeral and categorical data, respectively.
For the observed 28 landslide sites in eastern TN, we randomly sampled the 28 sites for each geospatial layer and repeated the statistical tests 10 times to check the significance of a potential driving factor. In this way, we generated random points in this study to meet the requirements of a paired two-sample t-test or a chi-square test for categorical variables. A two-sample t-test was executed later to compare the sample means of each variable. There were only the sample means of the 28 past landslides, and a two-sample t-test could be applied for the assessment of similar means of two independent samples. To account for the second sample, random points were created within the study area. Using the Create Random Points tool in ArcGIS, we generated these randomly sampled points. This random sampling process was performed 10 times to produce a final 280 random points (10 sections of 28). These randomly sampled points were kept as 10 sections throughout this process to have the same number of sites for each statistical test performed.

3.3. Logistic Regression
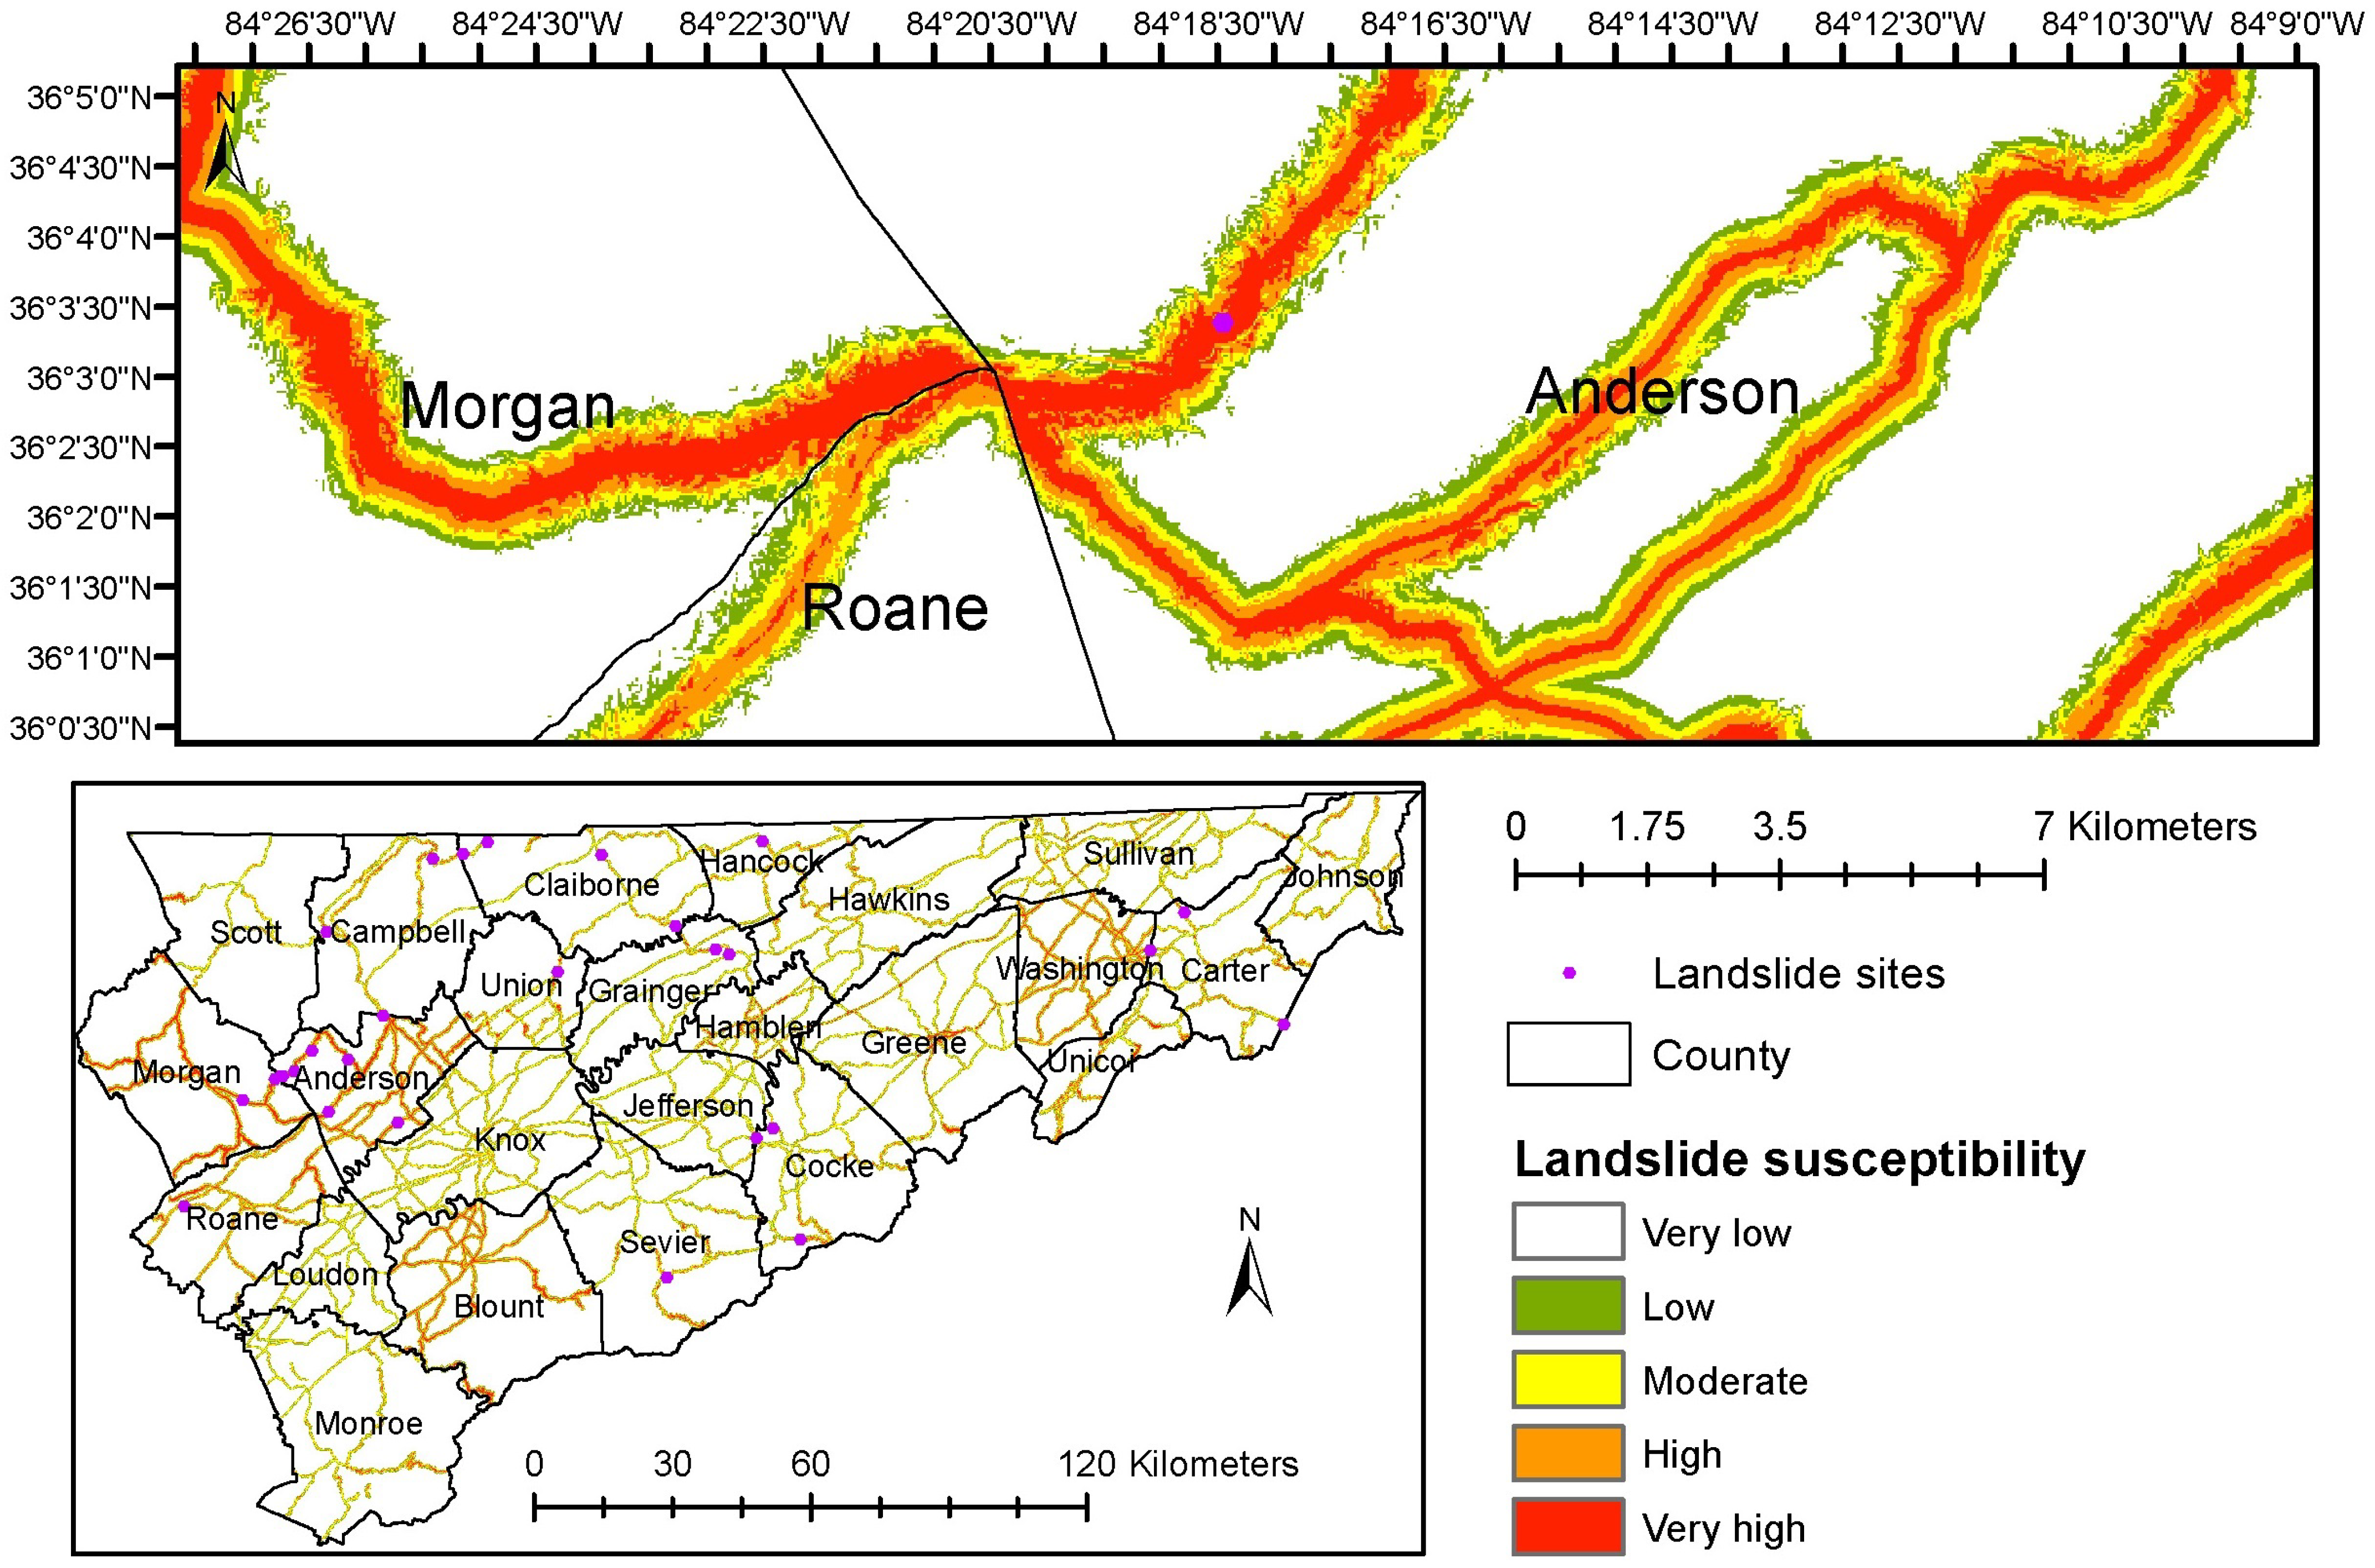
Logistic regression allows a probability output from 0 to 1, and it is often applied to modeling the relationship between significant driving factors that are potentially related to a response variable of interest [28]. In this study, it was used to predict the potential landslide probability across the study area. The response variable, landslide, was hence defined as a binary variable:
y i = 1   p r e s e n c e   o f   l a n d s l i d e s 0   a b s e n c e   o f   l a n d s l i d e s
where the random variable y i has a Bernoulli distribution, with values 1 and 0 taking the probabilities of π i and 1 − π i . Then, the logistic regression could be written as
y i ~   β ( n i ,   π i )
l o g i t   π i   ~   x β
where the total of 140 independent observed sites y1, y2, y3, …, yi, …y140 included the 28 observed landslide sites and 112 randomly sampled sites without landslides, and the ith landslide site was treated as the realization of the random variable yi. xi is a vector of the four significant factors as covariates, and β is the vector of the regression coefficients. Therefore, we formed this logistic regression model to analyze the relationship between the potential susceptibility to landslides and their significant driving factors [28].

4. Results

Using the statistical tests to select significant variables, we found four factors (distance to roads, percentage of tree canopy, clay percentage, and slope) that were significant driving factors of landslides. The results are listed in Table 2 below.
Other factors, including elevation, aspect, geologic period, land cover, silt, bedrock, and rainfall, were not significant in their relationship to landslides. The t-test results are summarized in Table 3. These nonsignificant factors may be significant for landslide susceptibility in other regions.
Leave-one-out cross-validation and K-fold cross-validation with K values from 5 to 15 were used to check for errors in the modeling process. Both produced similar results, with an error of about 0.11. The receiver operating characteristic (ROC) curve was applied, and the area under the ROC (AUC) was used to examine the performance of the logistic regression. An AUC value larger than 0.8 indicates the good performance of logistic regression modeling. The closer the AUC to one, the better the predictive capability of the logistic model. This logistic regression for landslide susceptibility analysis obtained an AUC of 0.94.
Among the four significant driving factors, slope positively impacted landslides. The other three factors, clay percentage, percentage of tree canopy, and distance to a road, had negative impacts on landslides. In other words, higher slopes have a higher probability of landslide, while a higher percentage of clay in this study area results in a lower probability of landslide; the same applies for a higher percentage of tree canopy and farther distances to roads (Table 4). We could interpret this result as follows: given a slope coefficient of 0.0125 and a log-odds of 1.0126, as slope increases one unit, landslide probability increases 1.26%. Likewise, as the clay percentage in the soil increases one unit, the log-odds decreases to 0.95, and the landslide probability decreases 5.37%. A one-unit increase in tree canopy and distance to road could result in decreases in landslide probability of 0.29% and 0.07%, respectively.
To better understand the potential impacts of landslides on eastern TN, USA, we classified the landslide probability into five levels considering both quantiles and natural breaks in the data. The susceptibility levels were very low (0–0.06), low (0.061–0.18), moderate (0.181–0.3), high (0.31–0.43), and very high (0.431–0.99), which are mapped in Figure 2. The high and very high susceptibility areas were mainly located in the counties of Anderson, Roane, Monroe, Knox, Hamblen, Greene, Washington, and Sullivan. Knox, Sullivan, and Washington are the most populous counties in the region, which have populations of 432,226, 122,979, and 156,823, respectively, according to the U.S. Census Bureau, 2010. Anderson, Roane, Monroe, Hamblen, and Greene counties are among the least populous counties, at 75,129, 54,106, 44,445, 62,544 and 68,831, respectively, according to the U.S. Census Bureau, 2010.

5. Discussion

This study fills the knowledge gap regarding landslides in the Appalachian Mountains, and a regional landslide susceptibility map was created for the eastern Tennessee region. Barbaccia [29] studied landslides and the damage they caused to roads including bridges on State Route 7 in Maury County, Tennessee. Loeb and King [30] focused on the effects of landslides on urban forests and the differences among species, in which slope was not a significant variable. Baird and Harden [31] focused on the meteorological conditions when a landslide occurred along I-40 from Hartford, Tennessee to Cocke County, North Carolina; Liddle and Bakaletz [32] studied a 25-acre landslide in Scott County, Tennessee, that occurred on 27 January 2005. However, they did not assess the factors driving the landslide or regional landslide susceptibility.
The driving variables of landslides may change from place to place. Slope and soil are significant factors driving landslides in the Appalachian Mountains, a finding that coincides with those of other landslide studies in mountain regions [15,33,34]. Distance to roads is a significant variable for landslide susceptibility, which was also found by [35,36,37]. We assumed that rainfall could be a significant force driving landslide susceptibility; however, the logistic regression modeling showed that it was not significant, although the t-test showed that it was significant with some but not other random samples.
Slope was the only variable significantly contributing to landslides in eastern Tennessee. Clay percentage, tree canopy density, and distance to roads were the significant variables reducing landslide probability in eastern Tennessee. Maintaining and increasing forest coverage in eastern Tennessee could reduce landslide susceptibility in the large-slope areas, and significant physical infrastructure should be developed in areas with small slopes, on soil with high clay percentages, a high density of trees, and away from roads. However, we need to understand that high percentages of clay generally result in high landslide susceptibility. Eastern Tennessee is located within the Appalachian Mountains, which receive an annual precipitation of about 1300 mm, and the clay in the topsoil is easily carried away by runoff to low-attitude areas with shallower slopes. Therefore, the clay percentage in the topsoil may not indicate high landslide susceptibility, especially in low-attitude areas with shallow slopes. It may also indicate that the current roads may be located close to or along relatively high-slope areas. In the future, new roads may be established on or close to areas with relatively gentle slopes.
Using multivariate logistic regression to determine landslide susceptibility, as in most other studies [38,39,40], we proposed a new GIS modeling approach in this study, and potential factors driving landslides were first statistically tested, and only significant variables were selected and then input into logistic regression modeling for landslide susceptibility. This approach directly achieves the optimal modeling of landslide susceptibility, removing the complicated stepwise regression and significant variable selection procedures required when many potential variables are directly input into logistic regression. Using remote sensing applications for landslide identification and risk assessment could be another type of approach to mapping landslide susceptibility [41,42,43], which was beyond the scope of this study because this study did not use any remote sensing data.
One obvious limitation of this study is the available landslide data. The landslide data were collected by the Tennessee Department of Transportation, which provided very limited information regarding landslide sites, and the area, size, depth, and consequences of the landslides were not recorded. There is much less research focusing on landslides, which may be because there was not enough funding for monitoring landslide hazards and collecting surveyed data. Therefore, this study could not conduct a comprehensive analysis focusing on landslide typology, velocity, frequency, and so on. Refs. [44,45,46,47,48] used combined GIS and machine learning approaches, in which relatively large landslide samples were used, while there were only 28 landslide sites recorded in eastern Tennessee. Additionally, rainfall is one of the typical triggers of landslides, but the statistical test did not find significant differences in rainfall between the observed 28 landslide sites and the random samples at nonlandslide sites in this study area. In other words, given the about 1300 mm precipitation and the only 28 observed landslide sites in this study area, the terrain factors and social activity factors significantly contributed to the overserved landslides. However, landslides may still be triggered by rainfall, especially rainfall intensity and rainfall period, which were not measured and considered in this study but could also be significant factors contributing to landslide susceptibility in eastern Tennessee. Additionally, coal mining, iron and metal mining, road construction, and other human activities in eastern Tennessee may also trigger landslides within this region.
The 28 historical recorded landslide sites comprise a relatively small size for statistical test and modeling, although the t-test can be applied to small sample sizes. Fortunately, the validation using leave-one-out cross-validation and k-fold cross-validation provided high-accuracy results. The results may only be applicable to eastern Tennessee. The significant variables affecting landslides identified in this study may not be significant in other regions. We did not try to apply machine learning methods. In general, machine learning methods need a large sample size, requiring several hundreds, thousands, or even much larger samples sizes [49,50,51]. Machine learning generally does not start with a predefined model but with enough data to process, train, learn a model, and then apply it for simulation or prediction. Conversely, based on some assumptions, statistical models are suitable for modeling with small sample sizes.
This study applied classic statistics including a two-sample t-test for continuous variables, a chi-square test for categorical variables, and then logistic regression for model training and prediction. There is a trend where machine learning and deep learning methods are being increasingly used to predict landslides and other types of natural hazards. However, science does not deny traditional or classic methods, as the objectives of the sciences are to find facts and the relationships or interactions among different phenomena. Machine learning or deep learning methods, in general, need large numbers of input observations and diverse attributes for the learning process, and large numbers of attributes are needed to train models to find stable relationships, which could then be used by the trained models for additional prediction or application. However, we need to understand if classic or traditional methods can solve the problems well: we may not need to try complicated deep learning approaches that are typically computation-demanding currently with results that are difficult to interpret.

6. Conclusions

This study developed a new geospatial analytics approach for regional landslide susceptibility modeling and mapping. Starting with potential geospatial data/layer processing, we first conducted statistical tests (i.e., t-test for numeral data and chi-squared test for categorical data) to identify significant relationships between each geospatial factor and landslide data. By inputting only significant factors into the logistic regression modeling of landslide susceptibility, it directly modeled landslides and the selected geospatial factors to significantly reduces efforts for selecting significant variables, and model comparisons were conducted to determine an optimal logistic regression model. Geospatial analysis in this study was used to find that landform variables (i.e., slope and clay content in the soil), tree canopy, and distance to road were significant for landslide susceptibility. In other words, given landslide triggers (e.g., rainfall, mining, and other human activities) in eastern Tennessee, the landslide-susceptible areas were mainly identified by their slope, clay content in soil, tree canopy, and distance to roads. Local governments and communities should pay attention to current physical infrastructure (e.g., buildings, power grid systems, etc.) located in steep-slope areas and close to roads, and new physical infrastructure should not be placed in areas with steep slopes and close to roads. The application of this GIS-based analytics approach to eastern TN, USA, showed that geospatial analytics is efficient for regional landslide susceptibility modeling and mapping with relatively small sample sizes.

Author Contributions

Conceptualization, Q.M. and J.R.; methodology, Q.M.; software, Q.M. and S.A.S.; validation, Q.M. and S.A.S.; formal analysis, Q.M. and S.A.S.; resources, S.A.S. and Q.M.; data curation, S.A.S. and Q.M.; writing—original draft preparation, Q.M. and S.A.S.; writing—review and editing, Q.M., S.A.S. and J.R. All authors have read and agreed to the published version of the manuscript.

Funding

This research received no external funding.

Data Availability Statement

The data on landslide sites were provided by the Tennessee Department of Transportation. The data sources for landform, land cover, land use, and climate data are summarized in Table 1.

Conflicts of Interest

The authors declare no conflicts of interest.

References

  1. Cruden, D.M. A simple definition of a landslide. Bull. Int. Assoc. Eng. Geol. 1991, 43, 27–29. [Google Scholar] [CrossRef]
  2. Varnes, D.J. Slope movement types and process. In Landslides: Analysis and Control; Schuster, R.L., Krizek, R.J., Eds.; Transportation Research Board: Washington, DC, USA, 1978; pp. 11–33. [Google Scholar]
  3. Muhammad, M.; Idris, I.; Salazar, A.S.; Nizam, K.; Taha, M.R. GIS Based Landslide Hazard Mapping Prediction in Ulu Klang, Malaysia. ITB J. 2010, 42, 163–178. [Google Scholar] [CrossRef]
  4. Ayalew, L.; Yamagishi, H. The application of GIS-based logistic regression for landslide susceptibility mapping in the Kakuda-Yahiko Mountains, Central Japan. Geomorphology 2005, 65, 15–31. [Google Scholar] [CrossRef]
  5. Ohlmacher, G.C.; Davis, J.C. Using multiple logistic regression and GIS technology to predict landslide hazard in northeast Kansas, USA. Eng. Geol. 2003, 69, 331–343. [Google Scholar] [CrossRef]
  6. Baeza, C.; Corominas, J. Assessment of shallow landslide susceptibility by means of multivariate statistical techniques. Earth Surf. Process. Landf. 2001, 26, 1251–1263. [Google Scholar] [CrossRef]
  7. Bai, S.B.; Wang, J.; Lü, G.N.; Zhou, P.G.; Hou, S.S.; Xu, S.N. GIS-based logistic regression for landslide susceptibility mapping of the Zhongxian segment in the Three Gorges area, China. Geomorphology 2010, 115, 23–31. [Google Scholar] [CrossRef]
  8. Dai, F.C.; Lee, C.F.; Ngai, Y.Y. Landslide risk assessment and management: An overview. Eng. Geol. 2002, 64, 65–87. [Google Scholar] [CrossRef]
  9. Dewitte, O.; Chung, C.J.; Cornet, Y.; Daoudi, M.; Demoulin, A. Combining spatial data in landslide reactivation susceptibility mapping: A likelihood ratio-based approach in W Belgium. Geomorphology 2010, 122, 153–166. [Google Scholar] [CrossRef]
  10. Kamp, U.; Growley, B.J.; Khattak, G.A.; Owen, L.A. GIS-based landslide susceptibility mapping for the 2005 Kashmir earthquake region. Geomorphology 2008, 101, 631–642. [Google Scholar] [CrossRef]
  11. Van Westen, C.J.; Castellanos, E.; Kuriakose, S.L. Spatial data for landslide susceptibility, hazard, and vulnerability assessment: An overview. Eng. Geol. 2008, 102, 112–131. [Google Scholar] [CrossRef]
  12. Wang, Z.; Cobb, J.C. A critique of probabilistic versus deterministic seismic hazard analysis with special reference to the New Madrid seismic zone. Geol. Soc. Am. Spec. Pap. 2012, 493, 259–275. [Google Scholar]
  13. Gritzner, M.L.; Marcus, W.; Aspinall, R.; Custer, S.G. Assessing landslide potential using GIS, soil wetness modeling and topographic attributes, Payette River, Idaho. Geomorphology 2001, 37, 149–165. [Google Scholar] [CrossRef]
  14. Wartman, J.; Montgomery, D.R.; Anderson, S.A.; Keaton, J.R.; Benoit, J.; dela Chapelle, J.; Gilbert, R. The 22 March 2014 Oso landslide, Washington, USA. Geomorphology 2016, 253, 275–288. [Google Scholar] [CrossRef]
  15. LaHusen, S.R.; Duvall, A.R.; Booth, A.M.; Montgomery, D.R. Surface roughness dating of long-runout landslides near Oso, Washington (USA), reveals persistent postglacial hillslope instability. Geology 2016, 44, 111–114. [Google Scholar] [CrossRef]
  16. Moon, S.; Shelef, E.; Hilley, G.E. Recent topographic evolution and erosion of the deglaciated Washington Cascades inferred from a stochastic landscape evolution model. J. Geophys. Res. F Earth Sci. 2015, 120, 856–876. [Google Scholar] [CrossRef]
  17. Regmi, N.R.; Giardino, J.R.; Vitek, J.D. Assessing susceptibility to landslides: Using models to understand observed changes in slopes. Geomorphology 2010, 122, 25–38. [Google Scholar] [CrossRef]
  18. Nandi, A.; Shakoor, A. A GIS-based landslide susceptibility evaluation using bivariate and multivariate statistical analyses. Eng. Geol. 2009, 110, 11–20. [Google Scholar] [CrossRef]
  19. Sabokbar, H.A.F.; Roodposhti, M.S.; Tazik, E. Landslide susceptibility mapping using geographically weighted principal component analysis. Geomorphology 2014, 226, 15–24. [Google Scholar] [CrossRef]
  20. Goetz, J.N.; Guthrie, R.H.; Brenning, A. Integrating physical and empirical landslide susceptibility models using generalized additive models. Geomorphology 2011, 129, 376–386. [Google Scholar] [CrossRef]
  21. Glade, T. Linking debris-flow hazard assessments with geomorphology. Geomorphology 2005, 66, 189–213. [Google Scholar] [CrossRef]
  22. Van Westen, C.J.; Rengers, N.; Soeters, R. Use of geomorphological information indirect landslide susceptibility assessment. Nat. Hazard 2003, 30, 399–419. [Google Scholar] [CrossRef]
  23. Chung, C.F.; Kojima, H.; Fabbri, A.G. Stability analysis of prediction models for landslide hazard mapping. In Applied Geomorphology: Theory and Practice; Allison, R.J., Ed.; John Wiley and Sons: London, UK, 2002; pp. 1–19. [Google Scholar]
  24. Zhou, C.H.; Lee, C.F.; Li, J.; Xu, Z.W. On the spatial relationship between landslides and causative factors on Lantau Island, Hong Kong. Geomorphology 2002, 43, 197–207. [Google Scholar] [CrossRef]
  25. Dai, F.C.; Lee, C.F.; Zhang, X.H. GIS-based geo-environmental evaluation for urban land-use planning: A case study. Eng. Geol. 2001, 61, 257–271. [Google Scholar] [CrossRef]
  26. Rodgers, J. Geologic Map of East Tennessee with Explanatory Text; USGS: Knoxville, TN, USA, 1993; Volume 58, Part II; pp. 1–177.
  27. NOAA, National Oceanic and Atmospheric Administration, National Centers for Environmental Information. Retrieved 10/2016, Climate at a Glance. Available online: https://www.ncei.noaa.gov/access/monitoring/climate-at-a-glance/statewide/time-series/40/tavg/12/0/2000-2015?base_prd=true&begbaseyear=2000&endbaseyear=2010 (accessed on 1 April 2024).
  28. Meng, Q. Modeling and prediction of natural gas fracking pad landscapes in the Marcellus Shale region, USA. Landsc. Urban Plan. 2014, 121, 109–116. [Google Scholar] [CrossRef]
  29. Barbaccia, T.G. Road into bridge: A massive landslide causes Tennessee DOT to rethink its rebuilding. Better Roads 2012, 82, 37–39. [Google Scholar]
  30. Loeb, R.E.; King, S. Landslides and the urban forest. Arboric. Urban For. 2011, 37, 213–218. [Google Scholar] [CrossRef]
  31. Baird, D.D., Jr.; Harden, C.P. Meteorological conditions and wedge failures in the Hartford area of Interstate 40, east Tennessee. Southeast. Geogr. 1994, 34, 54–66. [Google Scholar] [CrossRef]
  32. Liddle, R.; Bakaletz, S. Hydrologic and aquatic impacts from a landslide in the Tennessee coal fields. In Proceedings of the 25th Annual Meetings of the American Society of Mining and Reclamation and 10th Meeting of IALR, Richmond, VA, USA, 14–19 June 2008. [Google Scholar]
  33. Huat, L.T.; Ali, F. Slope hazard assessment in urbanized area. Electron. J. Geotech. Eng. 2012, 17, 341–352. [Google Scholar]
  34. Zhang, W.; Wang, W.; Xia, Q. Landslide risk zoning based on contribution rate weight stack method. Energy Procedia 2012, 16, 178–183. [Google Scholar] [CrossRef]
  35. Carrara, A.; Crosta, G.; Frattini, P. Geomorphological and historical data in assessing landslide hazard. Earth Surf. Process. Landf. 2003, 28, 1125–1142. [Google Scholar] [CrossRef]
  36. Shaban, A.; Khawlie, M.; Bou Kheir, R.; Abdallah, C. Assessment of road instability along a typical mountainous road using GIS and aerial photos, Lebanon-eastern Mediterranean. Bull. Eng. Geol. Environ. 2001, 60, 93–101. [Google Scholar]
  37. Guzzetti, F.; Carrara, A.; Cardinali, M.; Reichenbach, P. Landslide hazard evaluation: A review of current techniques and their application in a multi-scale study, Central Italy. Geomorphology 1999, 31, 181–216. [Google Scholar] [CrossRef]
  38. Garcia-Rodriguez, M.J.; Malpica, J.A.; Benito, B.; Diaz, M. Susceptibility assessment of earthquake-triggered landslides in El Salvador using logistic regression. Geomorphology 2008, 95, 172–191. [Google Scholar] [CrossRef]
  39. Chang, K.T.; Chiang, S.H.; Hsu, M.L. Modeling typhoon- and earthquake- induced landslides in a mountainous watershed using logistic regression. Geomorphology 2007, 89, 335–347. [Google Scholar] [CrossRef]
  40. Dominguez-Cuesta, M.J.; Jimenez-Sanchez, M.; Berrezueta, E. Landslides in the Central Coalfield (Cantabrian Mountains, NW Spain): Geomorphological features, conditioning factors and methodological implications in susceptibility assessment. Geomorphology 2007, 89, 358–369. [Google Scholar] [CrossRef]
  41. He, Y.; Wang, W.; Zhang, L.; Chen, Y.; Chen, Y.; Chen, B.; He, X.; Zhao, Z. An identification method of potential landslide zones using InSAR data and landslide susceptibility. Geomat. Nat. Hazards Risk 2023, 14, 2185120. [Google Scholar] [CrossRef]
  42. Gao, B.; He, Y.; Chen, X.; Zheng, X.; Zhang, L.; Zhang, Q.; Lu, J. Landslide Risk Evaluation in Shenzhen Based on Stacking Ensemble Learning and InSAR. IEEE J. Sel. Top. Appl. Earth Obs. Remote Sens. 2023, 16, 1–18. [Google Scholar] [CrossRef]
  43. Albanwan, H.; Qin, R.; Liu, J. Remote Sensing-Based 3D Assessment of Landslides: A Review of the Data, Methods, and Applications. Remote Sens. 2024, 16, 455. [Google Scholar] [CrossRef]
  44. Pellicani, R.; Argentiero, I.; Spilotro, G. GIS-based predictive models for regional-scale landslide susceptibility assessment and risk mapping along road corridors. Geomat. Nat. Haz. Risk 2017, 8, 1012–1033. [Google Scholar] [CrossRef]
  45. Mersha, T.; Meten, M. GIS-based landslide susceptibility mapping and assessment using bivariate statistical methods in Simada area, northwestern Ethiopia. Geoenviron. Disasters 2020, 7, 20. [Google Scholar] [CrossRef]
  46. Wang, Y.; Feng, L.; Li, S.; Ren, F.; Du, Q. A hybrid model considering spatial heterogeneity for landslide susceptibility mapping in Zhejiang Province, China. Catena 2020, 188, 104425. [Google Scholar] [CrossRef]
  47. Viet, H.P.; Quang, T.N.; Viet, H.P.; Thi Phuong, T.G.; An, B.N. GIS-based modeling of landslide susceptibility zonation by integrating the frequency ratio and objective–subjective weighting approach: A case study in a tropical monsoon climate region. Front. Environ. Sci. 2023, 11, 1175567. [Google Scholar] [CrossRef]
  48. Azarafza, M.; Azarafza, M.; Akgun, H.; Atkin, P.K.; Derakhshani, R. Deep learning-based landslide susceptibility mapping. Sci. Rep. 2021, 11, 24112. [Google Scholar] [CrossRef] [PubMed]
  49. John, G.; Langley, P.; John, H. Static Versus Dynamic Sampling for Data Mining; KDD: Washington, DC, USA, 1996; pp. 367–370. [Google Scholar]
  50. Provost, F.; Jensen, D.; Oates, T. Efficient Progressive Sampling. In Proceedings of the Fifth ACM SIGKDD International Conference on Knowledge Discovery and Data Mining, San Diego, CA, USA, 15–18 August 1999; pp. 23–32. [Google Scholar]
  51. Morgan, J.; Daugherty, R.; Hilchie, A.; Carey, B. Sample size and modeling accuracy of decision tree based data mining tools. Acad. Inf. Manag. Sci. J. 2003, 6, 71–99. [Google Scholar]
Figure 1. The GIS research procedure used for regional landslide susceptibility modeling and mapping.
Geohazards 05 00019 g001
Figure 2. Landslide susceptibility levels in eastern TN, USA, mapped using NAD1983 State Plane Tennessee FIPS 4100.
Geohazards 05 00019 g002
Table 1. Geospatial data sources and preprocessing.
FactorsSource
LandformNational Elevation dataset, U.S. Geological Survey, 30 m grid data.
          Slope
          Aspect
          Elevation
SoilgSSURGO datasets, U.S. Department of Agriculture, 30 m grid data.
          Clay percentage
          Silt percentage
GeologyOnline mineral resources spatial data, U.S. Geological Survey (shapefile).
          Geologic period
          Bedrock type
LandscapeNational Land Cover Database (NLCD), 2011, 30 m grid data.
          Land use land cover types
          Percentage of tree canopy
Distance to roadsTIGER, U.S. Census Bureau, 2010 (shapefile).
Climate: Mean annual rainfallPRISM climate data, 800 m grid data.
Note: Landform data were downloaded from www.ned.usgs.gov (accessed on 21 March 2024), soil data were obtained from www.websoilsurvey.nrcs.usda.gov/ (accessed on 21 March 2024), geology data were from http://mrdata.usgs.gov (accessed on 21 March 2024), landscape data were obtained from www.mrlc.gov/nlcd2011.php (accessed on 21 March 2024), TIGER data were from www.census.gov/geo/maps-data/data/tiger-line.html (accessed on 21 March 2024), and climate data were obtained from http://prism.oregonstate.edu/ (accessed on 21 March 2024).
Table 2. The p-values of statistical tests between landslide and nonlandslide sites.
Sample TimesSlopeClay PercentagePercentage of Tree CanopyDistance to Road
10.01260.00670.0343<0.0001
20.08840.04030.0003<0.0001
30.07760.04130.0005<0.0001
40.00810.01010.0114<0.0001
50.23460.00630.0020<0.0001
60.14080.23010.0024<0.0001
70.05010.01190.0042<0.0001
80.18360.01010.0004<0.0001
90.00250.04550.0065<0.0001
100.19030.05740.0020<0.0001
Table 3. The p-values of nonsignificant factors.
Sample TimesElevationAspectGeologic PeriodLandcoverSiltBedrockRainfall
10.29230.21520.50000.15260.08910.98640.1631
20.48500.14480.16310.15420.14390.99640.1508
30.14480.15810.16310.15170.29330.99750.1010
40.35590.35350.16310.15010.09450.78000.1597
50.10510.31720.16310.15080.00100.00010.1786
60.17860.12720.16310.15120.06320.89300.0435
70.08590.21710.16310.15140.22090.99260.1214
80.45680.36450.16310.15210.13680.08800.0153
90.33520.49040.16310.14910.24280.00010.0051
100.33730.17860.17860.15110.43000.99980.0859
Table 4. Understanding the factors driving landslides.
CoefficientEstimatep ValueDriving Impact
Slope0.01250.0005Positive
Clay percentage−0.05520.0153Negative
Tree canopy−0.00290.0004Negative
Distance to road−0.00072.61 × 10−7Negative
Disclaimer/Publisher’s Note: The statements, opinions and data contained in all publications are solely those of the individual author(s) and contributor(s) and not of MDPI and/or the editor(s). MDPI and/or the editor(s) disclaim responsibility for any injury to people or property resulting from any ideas, methods, instructions or products referred to in the content.

