1. Introduction
Despite significant investments in cybersecurity infrastructures, the occurrence of successful cyberattacks remains significant. The evolving landscape of cyber threats consistently leans in favor of attackers, as they exploit the intricate nature of traditional network protocols and adapt rapidly to emerging security mechanisms [
1]. This prevailing imbalance is exacerbated by defenders often grappling with complex and overly specialized cybersecurity tools, which, while sophisticated, can introduce overheads that result in slower response times and fragmented investigative processes. Moreover, the sheer intricacy of such tools can overwhelm defenders, inadvertently providing a window of opportunity for cyber adversaries [
2]. In response to these escalating threats, our research is driven by research questions on how can we enhance real-time anomaly detection through improved, low-cost data extraction and visualization techniques? In addition, what role can effective visualization play in identifying and responding to prevalent threats? These questions underscore the urgent need for cybersecurity tools that are not only advanced in their capabilities but are also accessible and efficient in practice.
Network intrusion detection systems (NIDSs) play a crucial role in detecting and mitigating network compromises. Data analytics-based NIDSs utilize algorithms and large datasets to identify malicious activities, offering a promising approach to cybersecurity. However, the dynamic nature of cyber threats presents challenges. Many existing NIDSs struggle with timely updates and adaptation to novel malware patterns, leading to potential vulnerabilities [
3]. Moreover, the responses of some systems can inadvertently reveal defensive mechanisms to attackers, providing them with information that could be exploited in future attacks [
4]. Additionally, the vast amount of data generated by modern networked systems can strain the processing capabilities of NIDSs, affecting their real-time detection performance [
5].
In response to these challenges, there is a growing inclination in the cybersecurity domain towards the integration of visualization techniques with traditional NIDSs [
6,
7,
8]. Despite this interest, many current visualization approaches fall short in effectively representing the technical ramifications of cyberattacks [
6,
7,
8]. There remains a significant need for a cyber visualization tool that seamlessly integrates with NIDS alerts and provides real-time comprehensive insights into the threat landscape.
In the context of these cybersecurity challenges, a synergy between streamlined abstraction and the visualization of security events may offer a robust solution for network anomaly detection [
9]. The adversarial tactics, techniques, and procedures detailed in [
10] span seven distinct phases. Within this schema, adversaries first undertake reconnaissance, subsequently weaponize malware, devise a delivery mechanism, exploit identified vulnerabilities, and eventually escalate and sustain the attack while maintaining persistent network connectivity. Notably, the execution of the latter five stages hinges on a successful breach, emphasizing the significance of network connectivity and the absence of effective NIDS intervention. Given that adversarial actions invariably leave detectable footprints within network traffic [
11], an incisive focus on specific traffic patterns and behaviors can prevent sub-optimal network traffic analysis. “Footprints” are signs that indicate potential security threats within network traffic, including unusual patterns like spikes in traffic or unexpected request types, which can suggest malicious activities. For instance, if a server typically receives 100 connection requests per time interval but suddenly receives
requests/probes as an outlier considering all other network constants, that can be a clear footprint of a potential distributed denial of service (DDoS) attack.
In light of the aforementioned context, our research introduces a novel model characterized by the following model objectives (MO):
MO-1: We present a low-cost and straightforward technique for extracting network data using open-source scanning tools designed to dynamically capture network connections, facilitating the efficient identification of potentially malicious hosts.
MO-2: We automate the network data extraction mechanism to ensure its replicability for subsequent research endeavors.
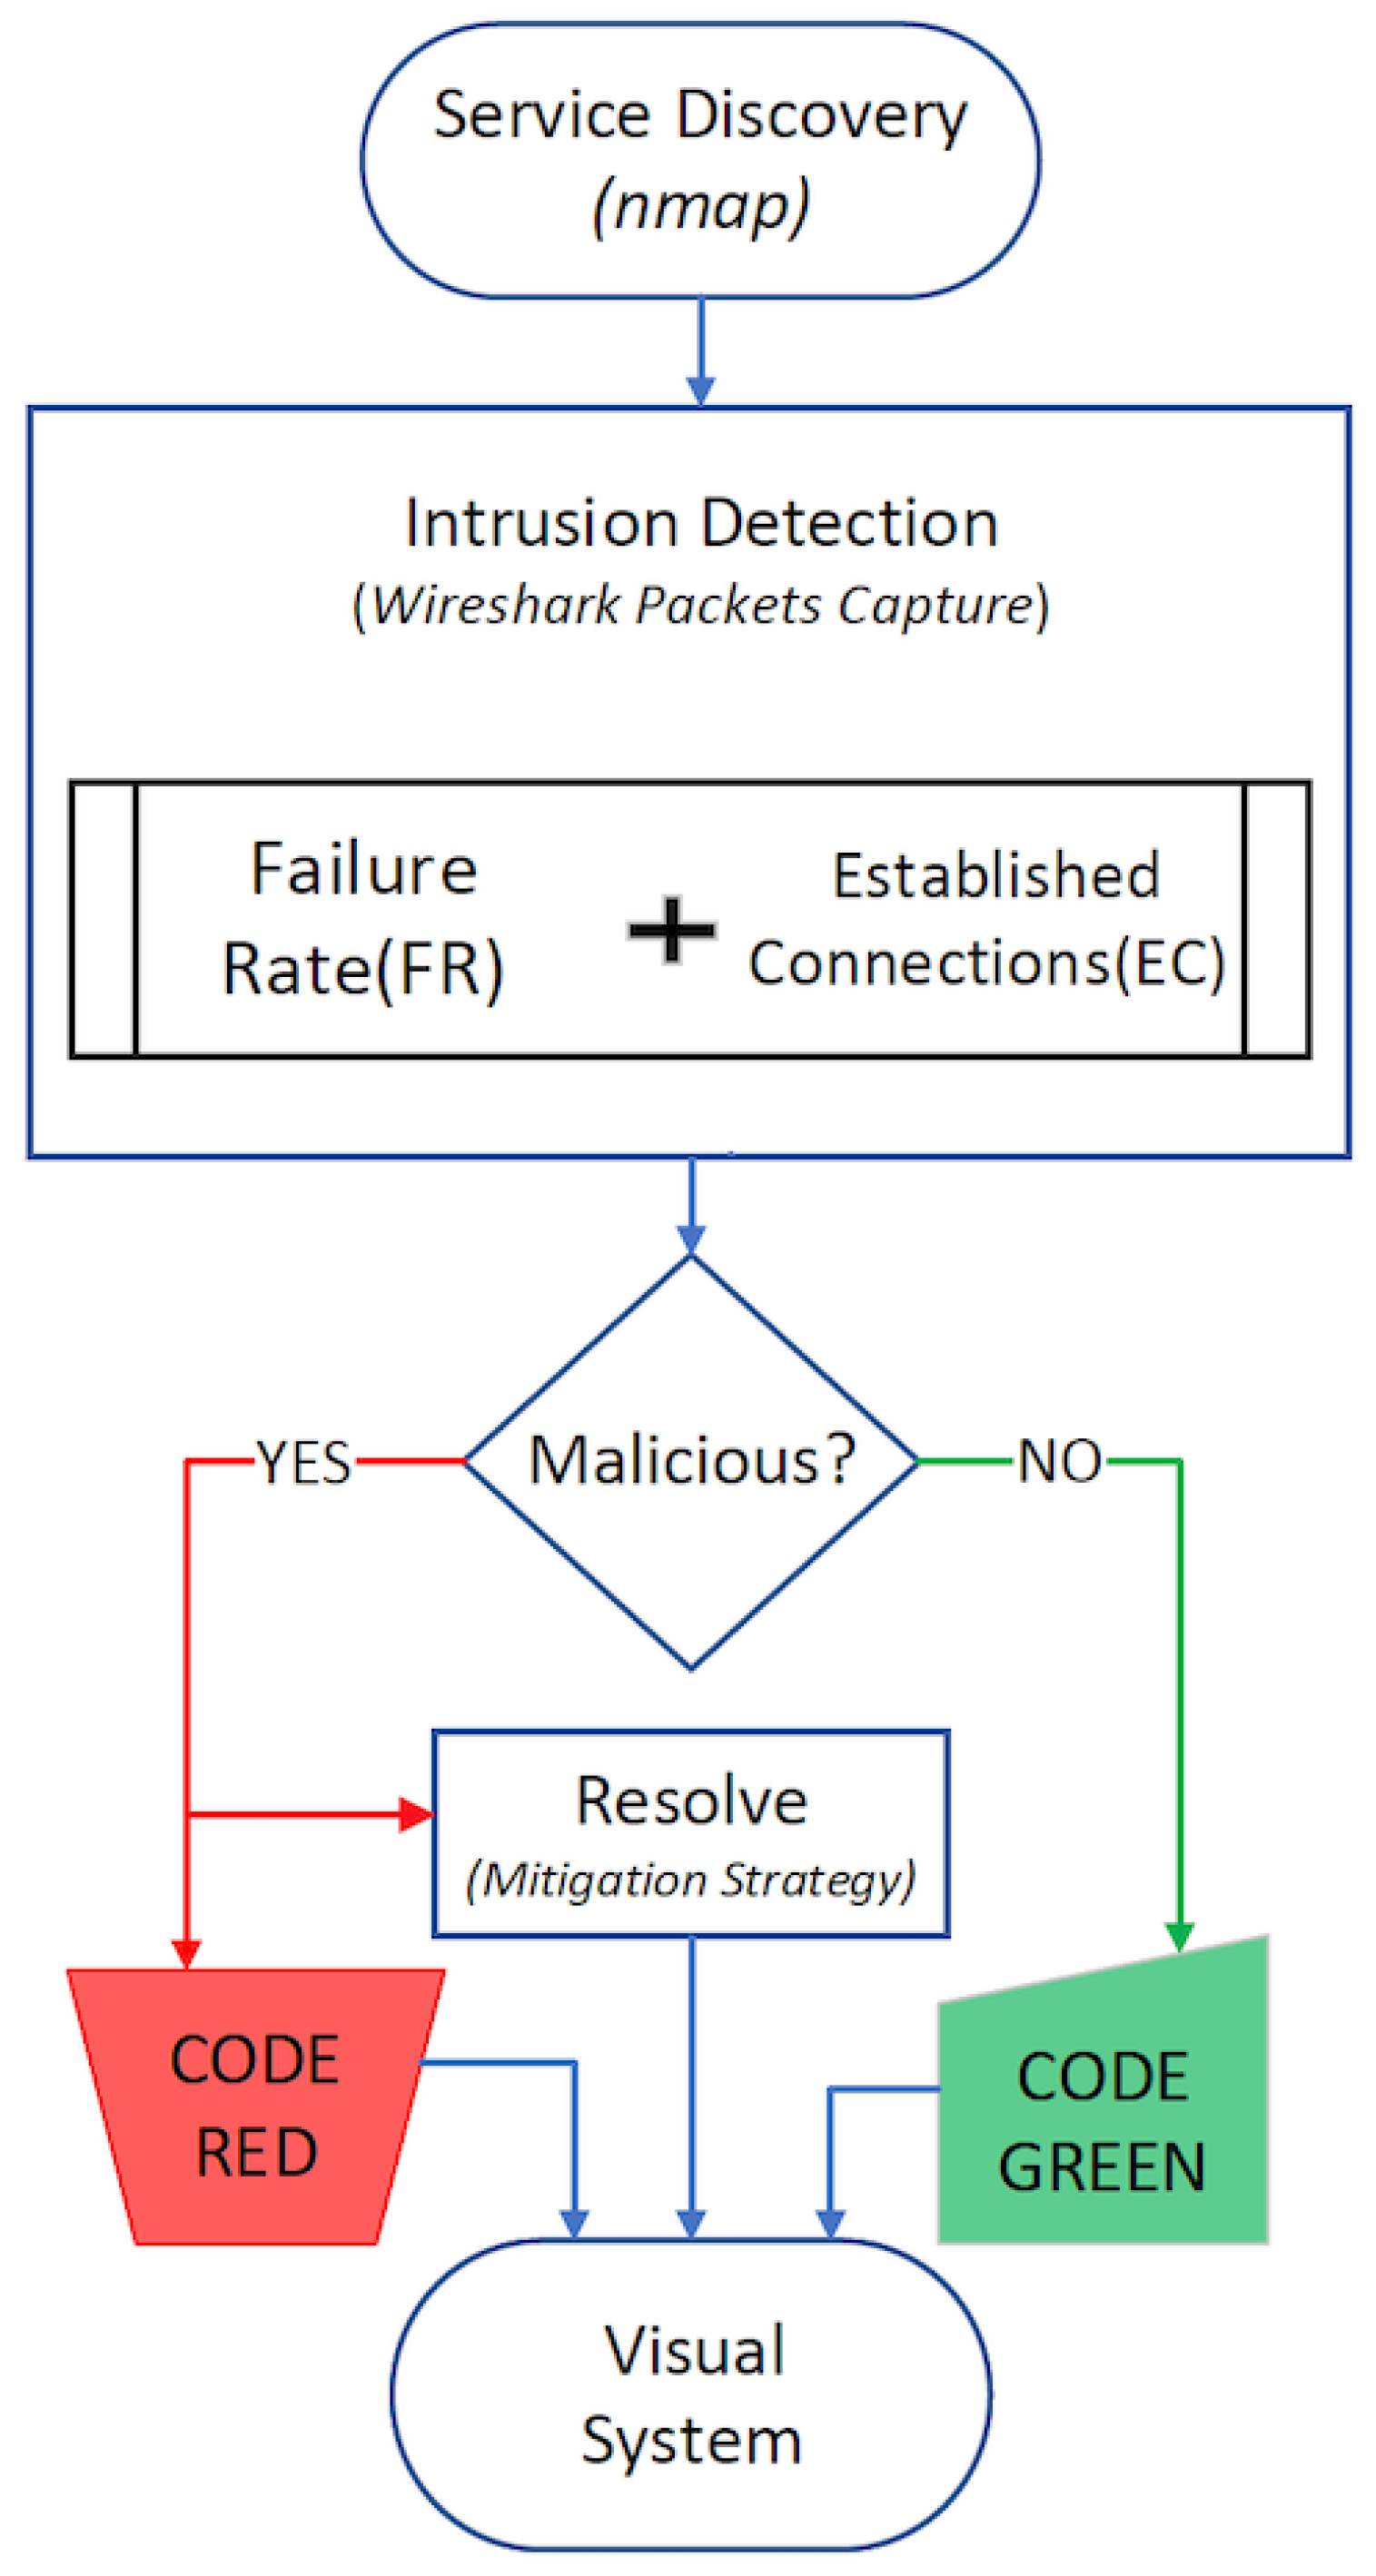
MO-3: We overlay our anomaly detection framework with a cyber visualization layer, capturing benign or malicious connections. This visualization granularity is derived from computed attack and defense metrics, as illustrated in
Figure 1.
MO-4: Finally, we incorporate proactive mitigation strategies within our visual module, where link hues transition from red to blue, signifying the successful counteraction of cyber threats, and conversely from blue to red upon detecting malicious activities.
Our proposed model case study can be described as an analysis of temporal and behavioral patterns’ network traffic, distinguishing between normal operations and potential threats. An anomaly is detected when a surge in failed connection attempts is observed, deviating from a baseline of established connections typically seen from benign hosts. Unlike traditional systems that might flag this as a mere spike in traffic, our proposed model assesses the failure rate in conjunction with established connections to flag attack attempts.This is also summarized in
Figure 1 to depict the novelty of the model’s ability to accurately identify threats by analyzing nuanced patterns of network interactions, thereby giving an improved and effective NIDS.
The essence of our paper revolves around addressing specific and prevalent threats related to DoS and malware probing. It is pertinent to emphasize that while the cybersecurity domain is vast and multifaceted, zooming in on specific threat vectors offers the advantage of depth, precision, and optimized solutions. While there exists a multitude of cyber threats like malware command and control, command/SQL injection, and drive-by download attacks, our targeted approach is towards DoS and malware probing threats. This focus is substantiated by evidence of their disruptive capabilities on cyber–physical systems, as highlighted in [
12]. DoS attacks, for example, are shown to significantly impair communications between physical and computing systems, thereby demonstrating their potential to disrupt operations. Focusing our analytical techniques on these specific threat vectors allows us to deliver a highly refined and effective detection mechanism [
12].
TCP connectivity-based analysis, in particular, has shown to be adept at uncovering the subtle nuances and patterns related to these threats [
13]. Integrating machine learning (ML) techniques or rule-based detection mechanisms can provide an enriched detection landscape [
1]. However, introducing them without a well-defined scope might lead to a dilution of precision, increased false positives and potential inefficiencies [
3,
11]. Our current approach sets a strong foundation upon which subsequent research can build, expanding to other threats and incorporating diverse detection mechanisms. TCP connectivity-based analysis, in particular, has shown to be adept at uncovering the subtle nuances and patterns related to these threats.
The remainder of this paper is organized as follows:
Section 2 delineates the existing research gap;
Section 3 provides the foundational background;
Section 4 details our model’s implementation. Our performance evaluation and its empirical results are presented in
Section 5, while
Section 6 describes the design of our visual prototype. We conclude the paper in
Section 7.
2. Related Work
Network complexities and cost implications are pivotal in network security models. Due to technical challenges, including cost and network complexities, many existing models are grouped on techniques, algorithms, system types, and available datasets [
14]. Our spectrum of scope in this section considers approaches based on network data types and, more so, transmission control protocol (TCP) connections that form the crux of several NIDS approaches. To distinguish between these, we categorize them based on their treatment of TCP data in terms of feature extraction and classification. Approaches such as [
15,
16,
17,
18,
19] emphasize extracting features from TCP connections and labeling data. These processed data are then utilized to classify network traffic as malicious or benign.
Anomaly Detection with AdaBoost: The AdaBoost-based solution [
15] deploys an online AdaBoost algorithm, leveraging both extracted network data and global detectors.
Boosted Decision Trees: Both Ruan et al. [
16] and the Hierarchical SOM method [
17] use a similar foundational model but enrich it by integrating boosted decision trees, leading to multiple decision classifiers.
Support Vector Machines (SVM): refs. [
18,
19] exploit the SVM algorithm post extensive training from TCP feature extracted data. Particularly, ref. [
19] melds kernel principal component analysis and the genetic algorithm, while the multi-level hybrid SVM and extreme learning machine (ELM) introduces a modified
k-means algorithm.
Each method offers its unique strengths, but a common lacuna is the absence of an affordable, nonproprietary, on-the-fly data probing and collection mechanism that operates sans extensive training. Our proposal fills this gap using open-source service discovery tools for network extraction and intrusion detection. Additionally, our model does not require extensive training and is differentiated with a visualization module offering enhanced portrayal of NIDS outputs.
Addressing SYN-ACK-based attacks is a topic of much debate. The brute-force method, as described in [
20], aims to inflate the data structure for TCP connections awaiting acknowledgment, making it cumbersome for average attacker requests to sustain bandwidth constraints. While effective, this method is not without its pitfalls. The survey [
21] flags issues like sluggish response times during connection look-ups, owing to the sheer volume of TCP data structures housed in vast spans of protected kernel memory. Moreover, unwarranted memory allocation might inadvertently modify TCP signaling behaviors. Our proposal counters these challenges by offering an economical and simplified approach. By monitoring TCP connections via open-source tools, we boost intrusion detection efficiency, merging the dual strengths of combined failure rates and pre-established TCP connections.
Visualization remains an under-explored territory in intrusion detection. Our method stands out by integrating a visual module that augments information processing, an emphasis not universally applied. For instance, Bhardwaj and Singh [
22] leverage supervised data mining for network data extraction but offer limited details on live packet capture parameters, performance metrics, or validation data. In contrast, our approach ensures transparency by utilizing
service discovery tools for automated network data mining.
Other notable endeavors include Ohnof et al.’s [
23] methodology, which focuses on visualizing IP addresses related to cyberattacks by analyzing attack timing, source, and type with network sensors yet primarily targets Internet-worm attacks with a narrow visual scope. Ulmer et al. [
24] develop a web-based prototype analyzing Geo-IP data changes to identify unusual behavior, focusing on historical threat source visualization rather than networked assets’ current state. Our approach surpasses these models by not just visualizing security events for informed cyber decisions but also a visual representation of the extent to which cyber assets are affected, showing the total effects of cyberattacks (TCE).
4. Methodology and Implementation
4.1. Automated Service Discovery
Information about the actual state of devices in a networked system can be obtained through network scanning. In this section, we explain MO-2, i.e., how our model actively probes and gathers network information on the fly without requiring extensive training data. We automate service discovery by compiling the following commands in a bash script. First, we dynamically discover the network IP class; secondly, we scan for all active IPs in the network, followed by a fingerprint scan for the OS version. This bash script enables us to extract a network topology on the fly based on active IPs as input to our model. Hence, our experiment can be easily replicated elsewhere as per MO-2, as follows:
Then, obtain a list of all active IPs
Loop through each IP and obtain the OS version’
Additionally, through
Wireshark [
35], a commonly available
open-source network protocol analyzer, we execute remote packet capture to extract network traffic, applying
SYN, ACK, and FIN to filter all established TCP connections per device. The Wireshark output becomes an input network model to our visualization system set to update in real time, depending on network activities. We selected Wireshark capture on the basis of the knowledge that the identification of connectivity from such a network-level view, same as stated in [
36], would provide a realistic network model for Algorithm 1, instead of ineptly considering all relevant network aspects (e.g., user behavior and size).
| Algorithm 1 Visualization of TCE () |
Require: All hosts S, time-intervals t
Ensure: Total Cyberattack Effect (TCE%)
- 1:
Start Timer - 2:
for ,t
do - 3:
for ,S do ▹ hosts ordered by IP address - 4:
if then ▹ Check in intervals - 5:
break; - 6:
end if - 7:
if Solve then - 8:
Solve - 9:
Solve ( 21) Color Red; - 10:
LineWidthSize Double - 11:
else - 12:
Solve ( 21) Color Blue; - 13:
LineWidthSize Single; - 14:
end if - 15:
- 16:
- 17:
end for - 18:
end for - 19:
Stop Timer - 20:
return
(TCE)
|
4.2. Malicious Hosts
To simulate the described attacks in our network model, we need to arbitrarily select random hosts as malicious hosts, attempting both worm and TCP-SYN flood attacks. Randomness is challenging to characterize mathematically because of process unpredictability, but it is a critical feature of nature and crucial for many scientific applications [
37]. Inaccuracies or failures in the theoretical modeling of such processes, e.g., from adversarial attacks, restrict random number generators’ reliability through weaknesses that are difficult to detect and control. We use a randomness generation model verified by Bell inequality violation from [
38] in Equation (
1) to obtain designated attack hosts for our network model.
where
represents the probability of
if sets
are selected and
is analogously defined. Therefore,
Z becomes the summation outcome that quantifies the contrast in probabilities over certain network behavior conditions, and we use
i and
j as summation indices when iterating over the network model.
x and
y denote variables within the probability functions
P, where these could represent specific network states, behaviors, or outcomes being analyzed.
4.3. Attack Dataset
The underlying choice of the dataset in NIDS research is not purely about modernity, but rather the comprehensiveness, applicability, and the depth of provided features. While our selected dataset KDDCUP’99 [
39] might be considered historically grounded, its continued significance in recent research endeavors is evident [
40,
41,
42]. As delineated in
Section 1 and
Section 2, our study focuses on particular malicious activities and behaviors within network settings. Many of these behaviors echo the characteristics found in the KDD-99 dataset, indicating that foundational threat vectors remain deeply embedded in contemporary attack patterns. Furthermore, the mechanisms employed by computer worms are still pivotal in elucidating the propagation dynamics of infections in current computational models [
43,
44,
45,
46].
For experiment replicability and reliability purposes, it is essential to select a well-known but vast attack dataset publicly available to other researchers. The KDDCUP’99 [
39] dataset developed by the MIT Lincoln Labs is widely used to validate most proposed NIDSs [
47]. This dataset of approximately 2,000,000 network records has approximately 4,900,000 single connection threat vectors, with each threat vector having 41 normal or attack labeled features. Based on our selected threat description, we choose attacks that fall into the DoS category, and probing attacks as shown in
Table 1. The malicious hosts selected in
Section 4.2 are simulated as inimical source nodes performing an attack. The attack dataset we use has a wide range of DoS and probing attack vectors, as detailed in
Table 1, which allows our model a comprehensive array of attack scenarios, thereby enabling a rigorous validation of our detection capabilities against both volumetric (DoS) and reconnaissance (probing) activities.
4.4. Network Model
To effectively design and evaluate our model’s essential constituents, we need to evaluate the network prerequisites in terms of handling communication latency. This is crucial for Algorithm 2, where a
resolve module is triggered to hosts with anomalous connections as part of
MO-4. In this section, we abstractly describe our consideration of a dynamic
step model [
48] network simulation approach using the network state we derived through the process in
Section 3.2 and
Section 4.1. We place fixed latency estimation values used to consider routing decision time as routing delay (
), router passing cycle-time as switch delay (
), link passing cycle-time as link propagation delay (
), and link bandwidth (
).
All packets sent at time interval Δ
t use a modeled average latency
L or fixed network parameters. For different network parameters, the implementer would need to recompute
L and cover expanded areas, such as routing algorithms or different policies. Applying the queue and regression models from [
49], we quantify source–destination packet behavior in our model network and describe the
resolve module latency to a selected destination host as follows:
where
represents the minimal source–destination path physical latency accumulated by a particular packet. We assume
is given only by network constraints, e.g., the distance between hosts, meaning that there is no resource contention among packets.
represents the dynamic contention interaction of packets given network constraints, e.g., link bandwidth.
| Algorithm 2 Visualization of defense effects () |
Require: All hosts S, time-intervals t
Ensure: Total Cyberattack Effect (TCE%)
- 1:
Start Timer - 2:
for
,t
do - 3:
for ,S do ▹ hosts ordered by IP address - 4:
if then ▹ Check in intervals - 5:
break; - 6:
end if - 7:
if Solve then - 8:
- 9:
Solve ( 21) Color Blue; - 10:
LineWidthSize Single; - 11:
- 12:
- 13:
end if - 14:
end for - 15:
end for - 16:
Stop Timer - 17:
return
(TCE)
|
4.4.1. Physical Delays (f(P))
In our calculation of the source–destination path
P, we define the time taken to cross a link by the first packet header byte as burst time
and time taken for one packet to cross a switch as switching time
over a path containing
W switches. Switching techniques are essential considerations, as they determine how internal switches connect the input to output and message transfer time. We adopt Virtual Cut-Through [
50], which is highlighted by Duato et al. [
51] as the most used switching technique. Hence, our calculations use the following:
where
denotes the packet full size in bits,
denotes the packet header size in bits, and
denotes the link bandwidth in bit/sec.
4.4.2. Contention Delays ()
We assume that network synchronization occurs at fixed time intervals, as this augments simulation speed with minimal accuracy loss, as described in [
52]. Consequently, packets are sent to the network asynchronously until the next synchronization interval Δ
t. Our model calculates
by evaluating simulated destination hosts using a uniform distribution of arrival times, which represents a queue over the time interval Δ
t. This can introduce additional delays if consecutive packets overlap upon arrival. For each packet at a time interval, we identify the simulated destination host and compute distributed arrivals including new packets, and then, as per the destination queue and network synchronization, we compute
latency. To avoid recursive dependencies, we define an initial latency,
, which represents the system latency at the start of the simulation or the latency of the first packet when the queue is empty. The
of packet
y per destination
n as follows:
where
is the latency before any packets are processed,
denotes the physical delay of the previous packet in the queue, i.e.,
,
denotes the contention delay of the previous packet,
denotes the synchronization time interval, and
denotes total packets processed in
, all with simulated destination
n. The condition
could occur if a packet is processed without any queuing delay, in which case its latency is only due to processing and transmission times. The initial condition
is a predetermined latency that is assigned before the arrival of the first packet. This latency could be due to various factors such as initial processing delay, propagation delay, or any inherent delays present in the network. The condition
would imply that the preceding packet encountered no queuing delay and was processed within its synchronization interval, which could occur under light network load conditions or when a packet arrives exactly at the synchronization boundary. These conditions ensure that
represents the total latency experienced by packet
y, considering both queuing and processing times. These approaches allow us to test network behavior under different realistic inputs, providing insightful results for our proposed solution. We are also able to model the accumulation of delays due to contention in the network and test behavior under different realistic inputs, providing great results for our proposed solution.
4.5. Intrusion Detection
There are two widely used intrusion detection techniques: anomaly and signature-based detection. An anomaly-based detection approach is based on the hypothesis that any intrusive activity will be distinctive from normal activities. Meanwhile, signature-based detection assumes that each attack has an associated pattern that can be referenced for identification. Before visualizing the effects of a cyberattack, a model has to be adept in various attack detection including DoS [
53], which is the limitation of signature-based detection techniques. The collection of intrusion signatures for comparison is not only
reactive but also onerous with the current growing number of threats.
We innovate our network anomaly detection by analyzing the temporal behavior of network traffic, focusing on the dynamic nature of network interactions, allowing a real-time adaptation to what is considered normal behavior while enabling the detection of anomalies not just based on static patterns but on evolving network conditions. By extracting sufficient TCP connections and network packets from our Wireshark capture, we enhance the traditional anomaly detection model to include a novel data analytics-based technique. The novelty of our model is highlighted in the ability to dynamically interpret network behavior and giving granular analysis of network traffic patterns to improve conventional anomaly detection through open-source tools.
Therefore, as part of
MO-2, we select the anomaly-based detection technique for our intrusion detection based on the available dataset and how it significantly influences data analytics-based techniques. We adopt this consideration from successfully improved performance reviews in [
54], using temporal data to handle anomaly detection. After extracting sufficient TCP connections and network packets from our Wireshark capture, we transition our model to include a novel data analytics-based anomaly detection technique. To differentiate success rates between intruders and benign hosts based on targeted services running, we combine part a) failure rate (FR) and part b) established connections (ECs) to develop a failure rate and established connections-based network intrusion detection system named FREC-NIDS. Within the scope of our proposed model, the failure rate and established connections-based network intrusion detection system (FREC-NIDS) employs a unique blend of network data analytics to identify potential threats. By definition, FREC-NIDS analyzes network traffic through two primary lenses as described: the failure rate (FR) of connection attempts and the volume of successfully established connections (ECs). This dual analysis allows for enhanced detection of sophisticated intrusion attempts.
We consider that malicious hosts have a higher number of failed connections attempting many different host connections within a short period than non-malicious hosts. Malicious connection requests are mostly rejected because not all hosts would be running the targeted service, resulting in a low connection success rate. By contrast, non-malicious hosts attempt connection requests with near certainty for positive response, resulting in a high success rate.
4.6. Failure Rate (FR)
The FR comparison allows us to check “apples to apples” on client nodes requesting data exchange to a particular active host, instead of comparing client nodes to all active hosts. This is crucial because not all active hosts are identical in operations, although data exchange from a particular host might be similar to different client nodes. For example, in a real-life scenario, when a computer user cannot connect to a mail server, they will confirm with their colleagues if access is impossible on their computers too. Thus, the FR of all computers trying to connect to the mail server in that subnet will be similar, whereas it would be odd if other computers can connect except one computer.
Malicious hosts try maximizing their exploits by attempting sundry connections within a short period. Thus, we stratify normal and anomalous network connections considering the ratio of failed connections
to overall connections
as the number of connections made within a particular time window
. If we depict the network with
k number of client nodes as
and
m number of active hosts as
, a successful TCP connection is confirmed when an
from an active host
is received for a particular
request:
Similarly, the failure of a client node requesting a TCP connection is confirmed when there is a
response from an active host
to a particular
request:
Overall connections initiated to a particular active host
are obtained through:
Now, we define the FR
of client
in the network as the ratio of the number of failures in
C from each active host
which is
where
i =
. The average FR denoted as
of all client nodes to
in the network is defined as a threshold
, which is the ratio of the sum of client FRs to all clients present in the network at a constant time interval
.
Threshold
is dynamically determined to effectively distinguish between benign and malicious network connection through
of all network connections within a predefined timeframe. In our experiment description,
Section 5, we will give a sample predefined timeframe. By analyzing historical network traffic data,
is calibrated to reflect the network’s typical behavior, ensuring that only significant deviations, which could indicate malicious intent, are flagged. Our adaptive thresholding approach allows FREC-NIDS to maintain high sensitivity to the attack dataset while minimizing false positives. Based on
, we compare
with individual client nodes FRs. A client node
is classified as malicious when
is greater than our threshold
as follows:
However, this is insufficient, as
cannot be examined in isolation in a networked environment. It is important to examine FRs from all clients in the network to positively identify a malicious client node. We use the comparison in Equation (
10) to process respective FR events distances in an empirical distribution function. We assigned the FR of each client as
p independent and identically distributed arbitrary variable set
. The FR distribution function is as follows:
where
denotes the indicator function that differentiates between malicious clients whose
is greater than the threshold
and a benign client whose
is less than the threshold
. Thus, the indicator function
is 1 when the given random variable
x is greater than
, ranging from
; otherwise, it is 0.
To quantify the distance among client nodes’ FRs, we apply the Kolmogorov–Smirnov (KS) two-sided test statistic [
55] based on the difference between the empirical distribution function and cumulative distribution function.
where
of a subset
in a partially ordered set
is the least element in
, which is greater than or equal to all elements of
, and
represents the cumulative distribution function. Finally, FR is classified as malicious if
To better understand the context of these equations, Equation (
11) calculates the empirical distribution of failure rates across network client nodes to help in visualizing and understanding the distribution of connection failures, which is critical for identifying patterns that may indicate malicious activity. By assessing how these failure rates spread across the network, the model can better distinguish between normal and suspicious behaviors. Additionally, we use the indicator function Equation (
12) to classify network connections based on their failure rates, comparing them against a predefined threshold. This aids in filtering out benign activities from potentially malicious ones. If a connection’s failure rate exceeds the threshold, it is flagged for further inspection, ensuring that the model focuses on connections that more likely represent genuine threats. In KS test statistic, Equation (
13) measures the maximum deviation between the empirical distribution of observed network behaviors and the expected distribution under normal conditions to assess the significance of observed anomalies and confirm whether observed patterns of network behavior deviate from what is typically expected in a way that suggests malicious activity. Finally, Equation (
14) applies the KS test results to make a decision on whether a network behavior is considered normal or anomalous by providing a concrete criterion that flags nodes as potentially malicious based on statistical evidence. This enables our mode to take action on connections that most strongly deviate from normal behavior patterns.
4.7. Established Connections (ECs)
Because TCP defines ECs to be maintained until data exchange or transfer between a client and a host is complete, it is essential to obtain all existing connections in the network following an FR alert for a malicious host. To ensure that the malware is not replicated to other hosts, an aggregate of hosts in the network connected to the malicious host is obtained. As mentioned before, we induce random generated network malicious hosts into the network running the KDDCUP’99 attack data. Once we receive an alert from the FR part of FREC-NIDS, we need to check all hosts connected to the malicious client and flag them as unavailable. We assume that having infiltrated a network host, connections to the malicious host would be under the attacker’s control and malware is replicated. To present a lucid picture of actualized threats in the realization of
MO-2 and
MO-3, our visual display system will output all affected connections as described in
Section 4.9.
We model the FREC-NIDS parameters in our simulated environment to visualize cyberattack effects through Algorithm 1 and Equation (
21), as will be explained in
Section 4.9. The relationship between our visualization parameters defines
as the set for the total number of network hosts, including all client nodes and active hosts, and as per Equation (
5), then, the total number of hosts is given by
at a set of time intervals
. For each
, let
be an undirected graph with vertex set
as connections to other hosts, with edge set
. The degree
of a vertex
v is the number of edges incident to it. Malicious connections
in the EC part of FREC-NIDS are given by
where
S denotes the number of nodes at time interval
; with this, we calculate the network capacity as:
where
denotes the total number of connections at time interval
. Then, the network capacity helps obtain average network unavailability, the calculated comparison of all established malicious connections, to the network capacity at
This gives the security analyst all cyber-assets affected as the TCE%.
4.8. Malicious Connection Defense
A simple mitigation approach for dealing with malicious connections would include the termination of malicious connections, but this can be insolent, particularly for false positives. Additionally, the termination only gives an attacker feedback to try other options. One of the best alternatives we found and adopted to achieve high resilience to compromised hosts without relying on static or localized network information is [
56], which proposes a polynomial-based compromise-resilient en-route filtering scheme against false data. Therefore, to achieve
MO-4, i.e., mitigation of attacks in the
resolve-module, we place a compromised hosts report
from Equation (
14) on the main network controller verifiable by intermediate hosts through:
Condition 1: Message authentication polynomial (MAP) on the compromised host
,
Condition 2: Timestamp
T on network controller.
is obtained by:
where
is the MAP stored in host
i. Using the proposed approach of handling malicious connections in [
57] that takes over malicious connections as a transparent proxy by migrating TCP states to a user-level TCP stack, we design our malicious connection resolve module to attract packets from compromised hosts by fallaciously claiming fresh shortest packet routes but not forwarding them onward. This is achieved through a neighboring host having an EC to the compromised host, as described in
Section 4.7, always responding to a malicious host
route request (RREQ), with the best alternative route reply (RREP).
Despite the process just described, to stop routing packets through a compromised connection, any RREP of a fresh route from any malicious host is dropped. We assume that this process continues until the security analyst takes the compromised host off the network for subsequent malware check. To prevent resource lock-up in case of a delayed malware check response from a security analyst, we purge malicious connections through timeout guidelines proposed in [
58]. We use a timeout configuration that accommodates RFC 2988 [
59] dynamics as
, where
is the timeout value in seconds. The value for
is adaptively set based on different settings checked at time
t, with the total number of entries
given by:
where
denotes the benign connection and
denotes the malicious connection rate. Effectively,
cannot process the threats described in
Section 3.3 as the packets are absorbed and dropped without forwarding. As the attack is mitigated, Algorithm 2 explains this module together with our stated parameters to show how available resources are visually recognized at given time intervals. We propose this defense strategy to handle all malicious connections and then, in our display system, transform the connection color from red to blue, and size from double to single, once malicious connection activities are nulled with dropped packets.
The implemented code snippet after our FREC alerts is:
FREC alerts ← Solve (14)
GenerateReport(R) ← Solve (18)
//check for a hostcompromised host
while FRCi == malicious {
VerifyReport(R)
if SRHCi == RREQ() {
//get existing host connection
//send false fresh route
q ← sendFalseRREP(in(Solve(15)Ci ), True)
drop(q.packets)
}
if SRHCi == RREP() {
drop(SRHCi.packets)
}
}//SRH is Segment Request Header
4.9. Visual Display
Our visual display module involves real-time visualization of network activities reported from FREC with two state declaration flags, normal and malicious connections, to disambiguate our structured representations and facilitate easy user comprehension. As much as NIDS gives intrusion alerts, it is crucial to visualize the network system state holistically rather than via single intrusion alerts. The best technique to determine the true severity of a cyberattack on technical assets is to critically monitor all malicious hosts in the network compared with all benign hosts. To achieve simplicity in deducing the severity of a cyberattack and cyber-defense effects through our visualization module, we consider a cyberattack parameter and a cyber-defense parameter .
To express the status of host
i in multiple dimensions within a single function as the cyberattack and cyber-defense are in progress, we consider the vector function of
, where
and
denote the coordinate functions of time
t. Notably,
has a limit given by the vector
L when
t approaches
, denoted as
iff for every
there exists
such that
. We use
for the time derivative of
with continuous-time
, and because we expect abrupt changes in values, we consider the
of discrete-time
with the superscript indicating time step of
S. We apply two discrete-time models to obtain the granularity of attack and defense effects reflected in the visual representation. We derive the first discrete-time model from a continuous-time model:
where
denotes the attack level in host
i,
denotes the attack rate,
denotes the defense rate, and
denotes the edge weights between hosts. Afterward, we apply Euler’s method [
60] to Equation (
20) to derive the second discrete-time model with time index
m and a random sample
as:
To achieve
MO-3 and
MO-4, we use the granularity obtained from Equation (
21) to display blue lines with single-width sizes for normal connections and red with double-width sizes for anomalous connections. The granularity depth represents the severity of the attack, i.e., the ratio of compromised host connections to total network connections, or the effectiveness of defense measures, i.e., the ratio of benign host connections to total network connections. This choice of colors leverages common associations of red with danger and blue with safety, thereby utilizing established psychological principles to enhance user comprehension and response efficiency. The width is an additional layered property to help users who might be color blind, primarily when visualizing an extensive network with many connections.
From the visual system, we assume that initially, when network service discovery is made, everything is normal, and host connections are displayed in blue. Later, when an intrusion occurs, hosts connected to a malicious host are indicated with red color as described in Algorithm 1. Because real attacks might not occur simultaneously in a network, we introduce all induced malicious hosts simultaneously for a finite experiment setup. The granularity of the network connection colors, i.e., blueish or reddish, changes on the fly as attacks are detected and as our defense module neutralizes the malicious connections.
5. Results and Performance Evaluation
To evaluate our prototype and mitigation strategy, we implemented our experiment inside our Data Science and Cybersecurity Center (DSC
2) lab, Howard University, Washington, DC 20059, USA, on a MS Windows server 2016 Intel(R) Xeon CPU E5-2676 v3 @
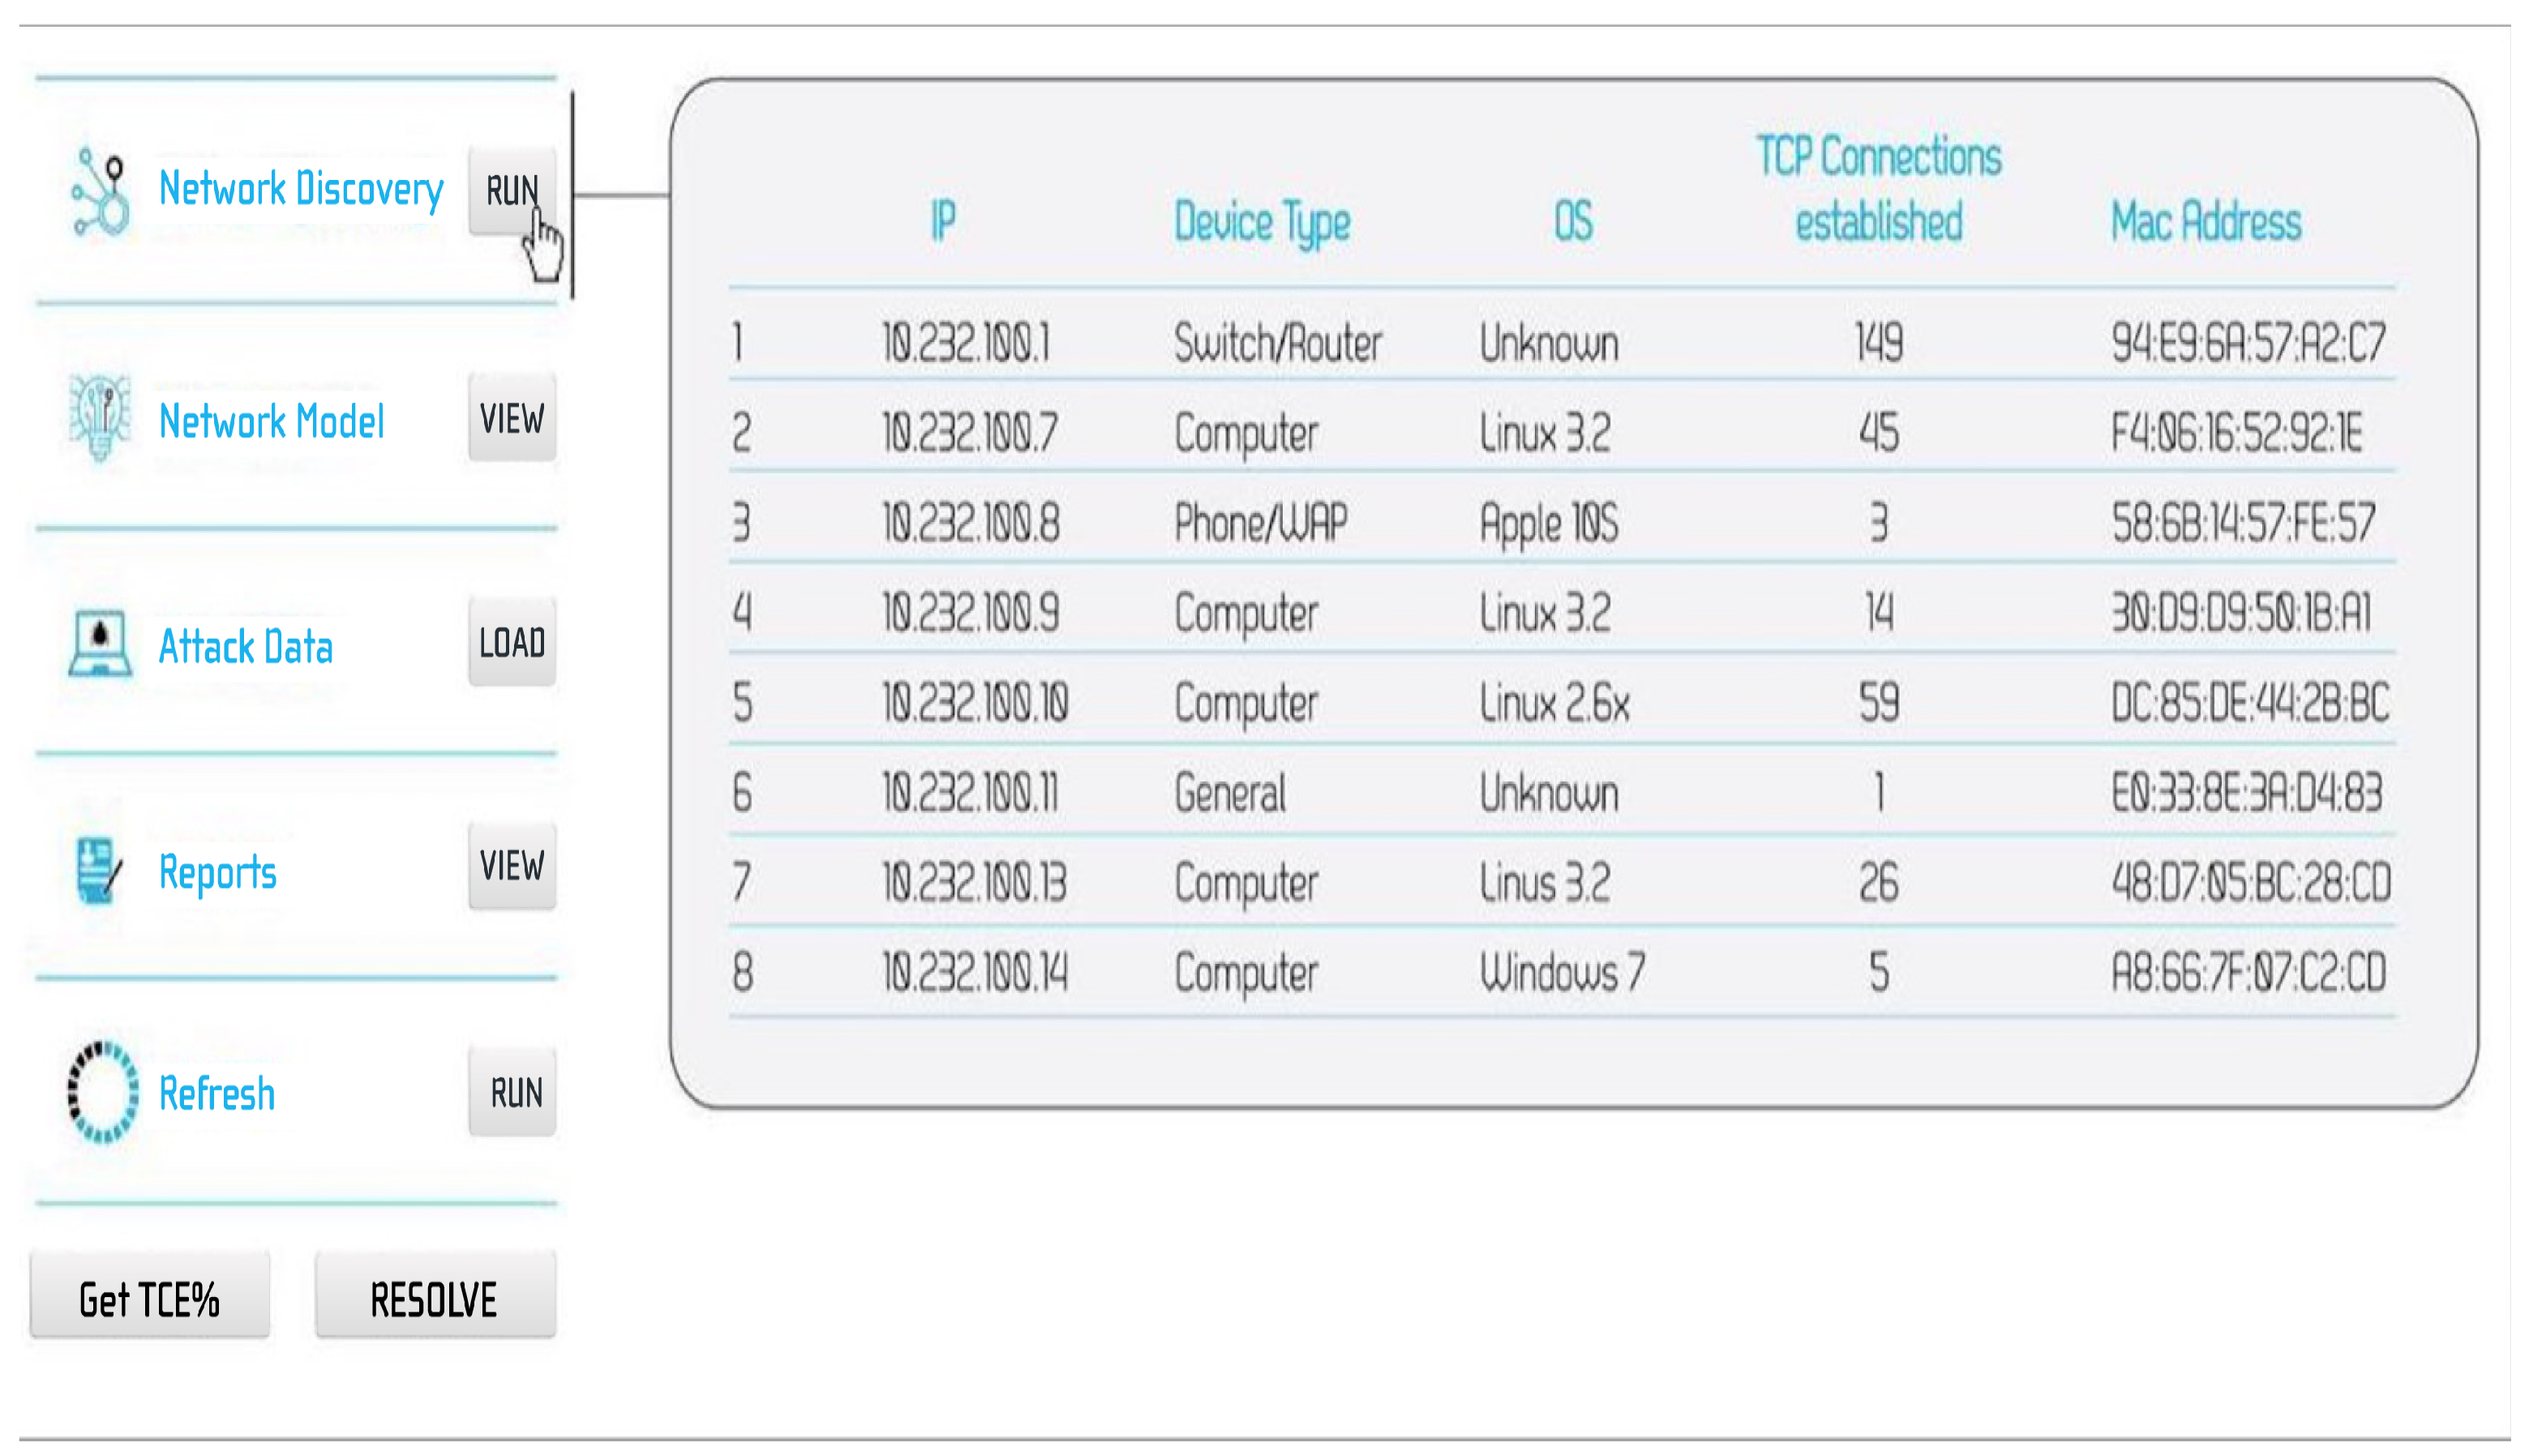
GHz with 4GB RAM. We extracted a network topology from our (DSC
2) computer lab as per
service discovery described in
Section 4.4 to obtain 101 computing devices in two subnets, as summarized in
Figure 2. The network module in our visual display system contains information about network devices and topology from the computer running the application.
We designate
attack hosts launched to the network simultaneously to perform the probing and DoS attack described in
Section 4.3. Each attack host simulates the attack data in a 3-low rate (
, 1, 10 packets/s) and 2-high rate (100, 1000 packets/s) instance, up to a period where the experiment output is stable and does not vary much, i.e., 5 min. This time interval allowed collection of sufficient data to accurately identify anomalies without overwhelming our analysis process, but any subsequent research can vary the interval appropriately. Each attack packet IP header is distinctively labeled by setting a reserved bit. Our experiment closely mimicked an actual network environment having the performance evaluation executed on a real-time environment with a finite target. We assume the network obtains no new connections once the experiment starts, but we surmise that the scenario could be different in the real world. The prevalent strategy for identifying anomaly-based cyberattacks is using outlier detection.
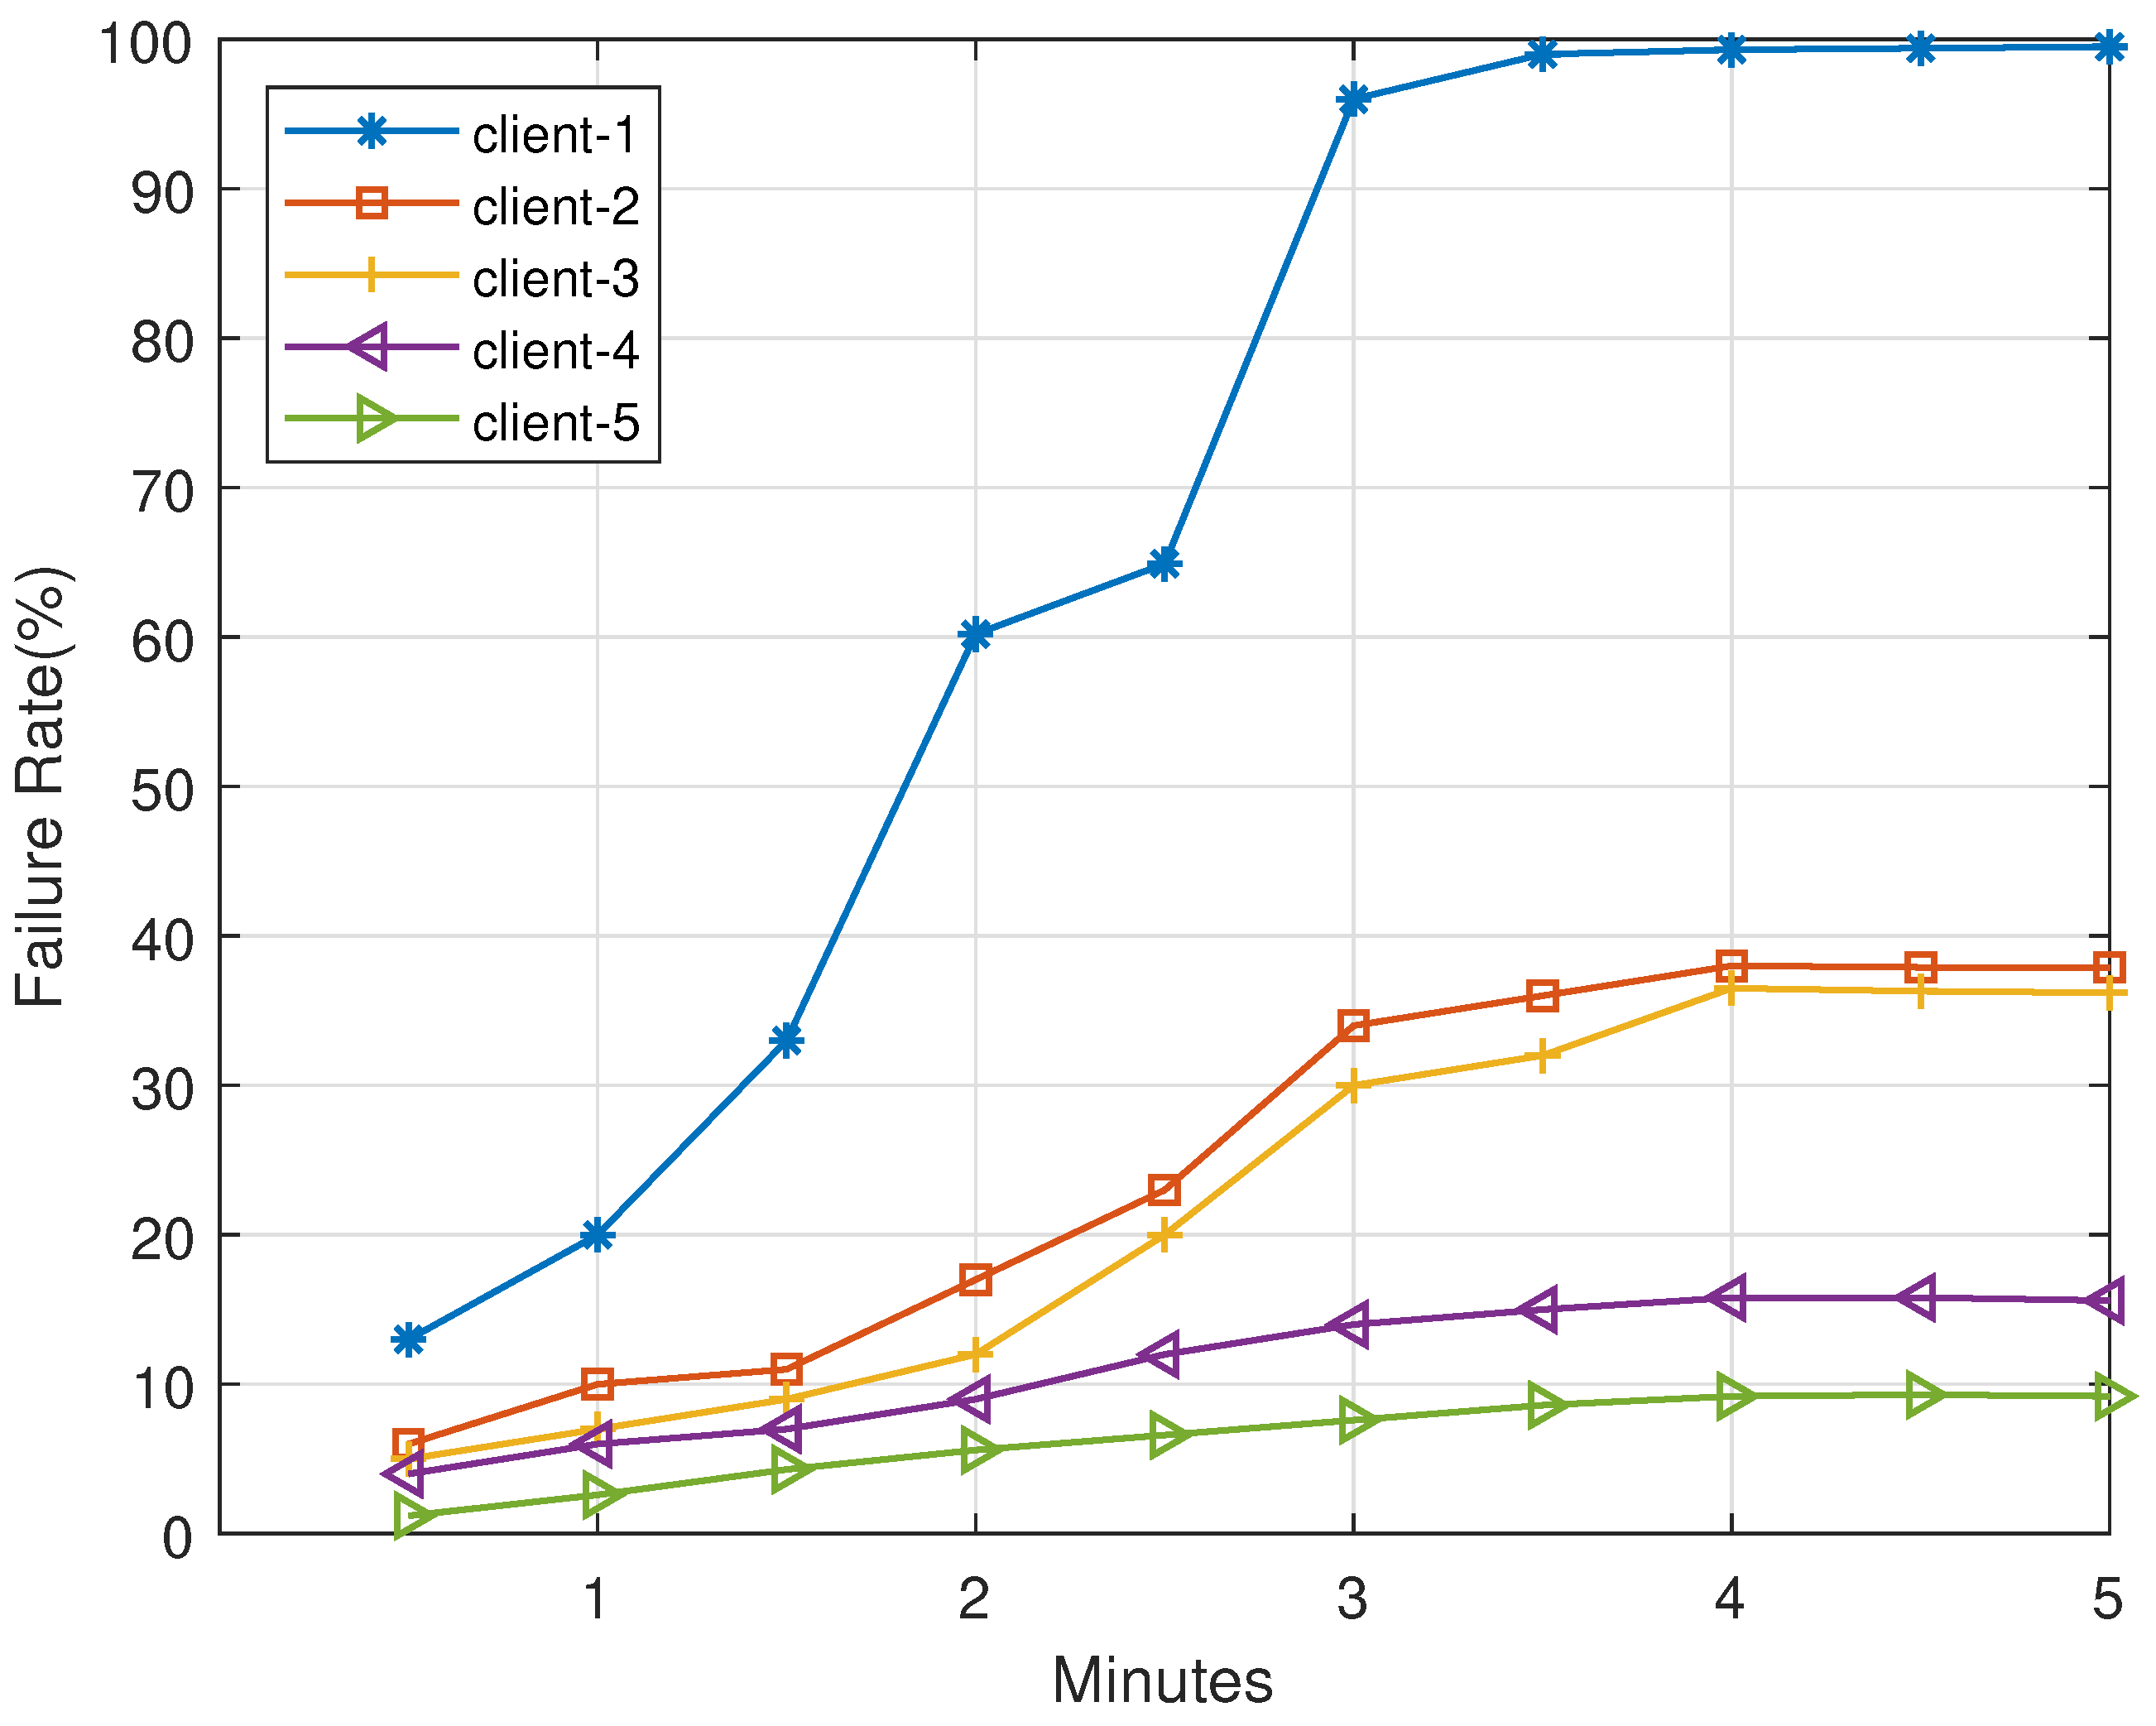
To demonstrate a clear identification of a malicious host having undefined arbitrary connection attempts as with the case of worm attacks,
Figure 3 shows a malicious sample host
detected as an outlier to seven other active hosts. The malicious host
tries maximizing the exploit by attempting sundry connections within a short period. However, the connection requests sent from
are mostly rejected, as not all hosts would be running the targeted service, resulting in a low connection success rate; meanwhile, the other non-malicious hosts attempt connection requests with near certainty for a positive response, resulting in a high success rate. Client
and
have slightly higher failure rate than Client
and
because of normal network resource contention, but they are not flagged as outliers.
Therefore, with a finite target, precision, recall, and
score become crucial to our analysis based on the attack dataset. Accuracy is our first step to understanding what we are obtaining correctly or incorrectly numerically. We extract true and false positives at different time intervals when FREC-NIDS is running and calculate precision and recall as:
where
,
, and
denote true positive, false positive, and false negative, respectively.
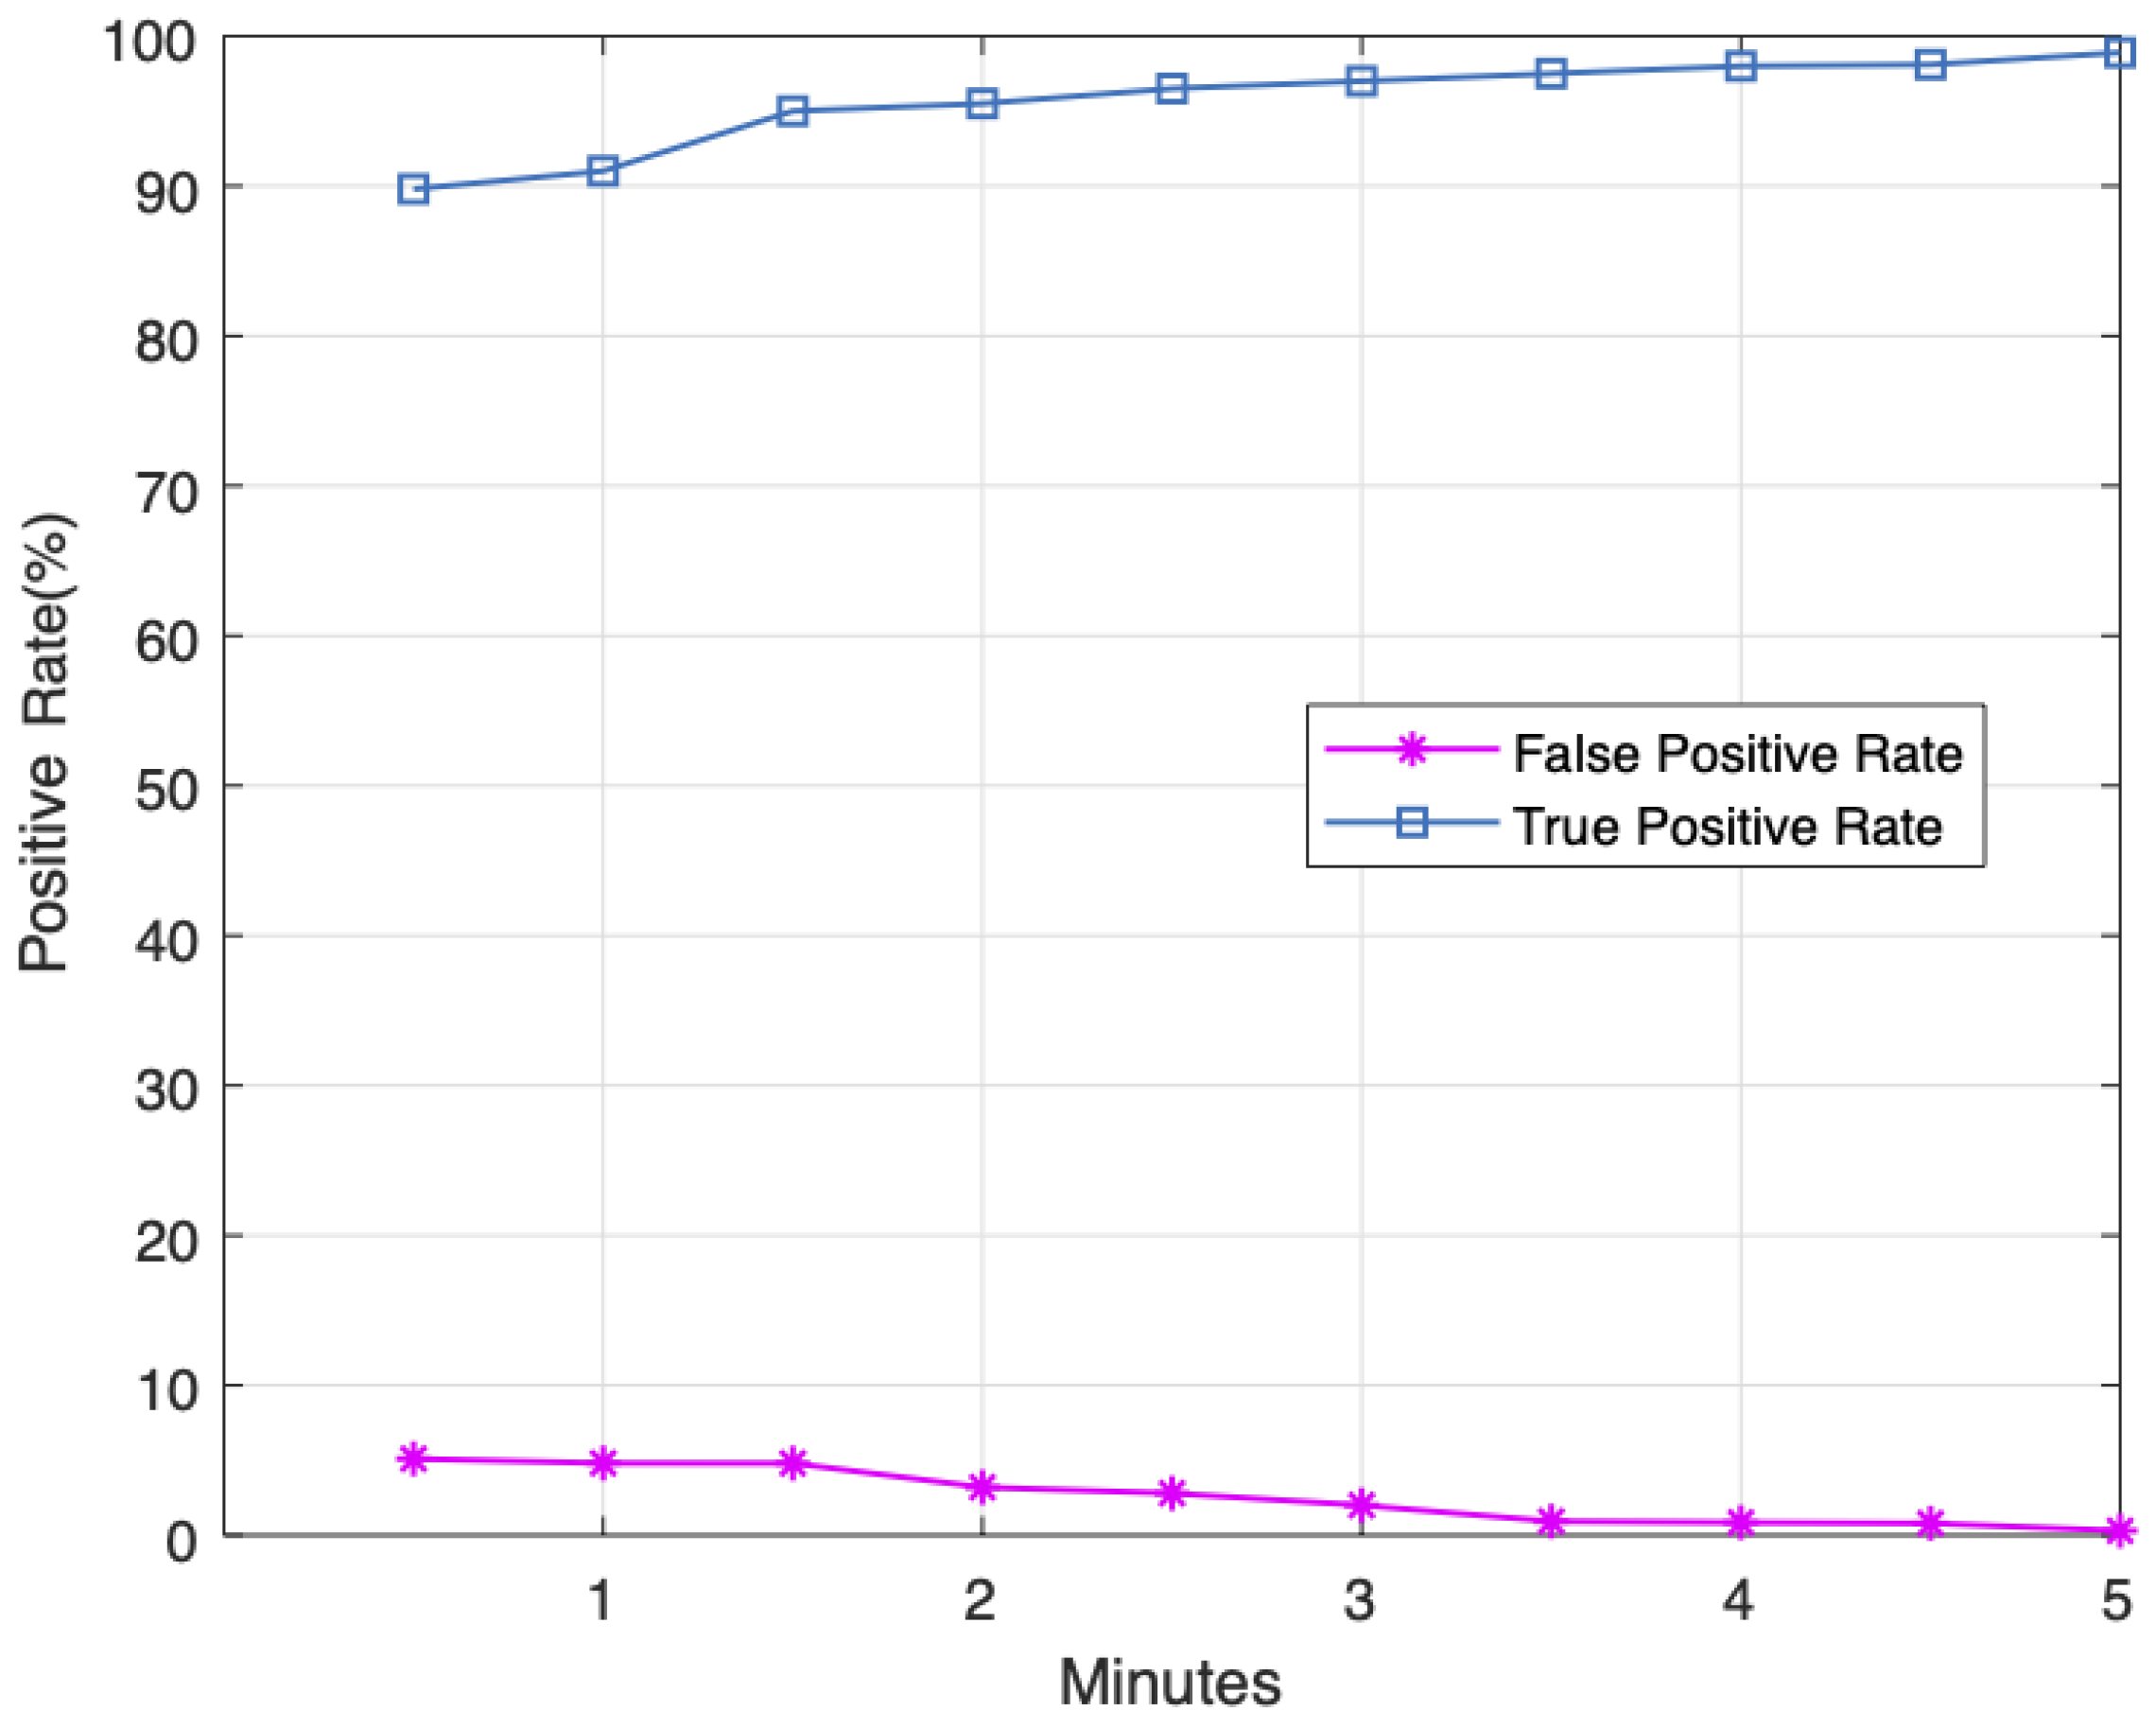
Subsequently, precision and recall in Equation (
22) help us evaluate if our model identifies most attack data without pulling many false positives, i.e., only what is relevant to the attacks. As shown in
Figure 4, our false positive rate (FPR) at the beginning of the experiment is
but improves to
at the end of the experiment. TP at the beginning of the experiment was
and ended at a good ratio of
. The FPR experimental results summarized in
Table 2 show a higher overall precision and recall for FREC-NIDS than the models from [
15,
16,
17,
18,
19] described in
Section 2. We apply the same attack dataset and experiment setup to all algorithms in the selected related works. For any related model that did not specify the percentage of attack dataset used in their implementation, we applied the full attack dataset, and we applied the same to our FREC-NIDS, while following revisions on the dataset given by [
61]. By invoking
of the dataset, we demonstrated the replicability of implementing FREC-NIDS to real-world attack datasets without selecting which parts of the datasets can apply. Depending on the cost of FN, recall is essential as a consideration of attacks incorrectly predicted as benign. However, the weighted average (or harmonic mean) of precision and recall, calculated as the
score, provides a better overall performance balance. We obtain
score as:
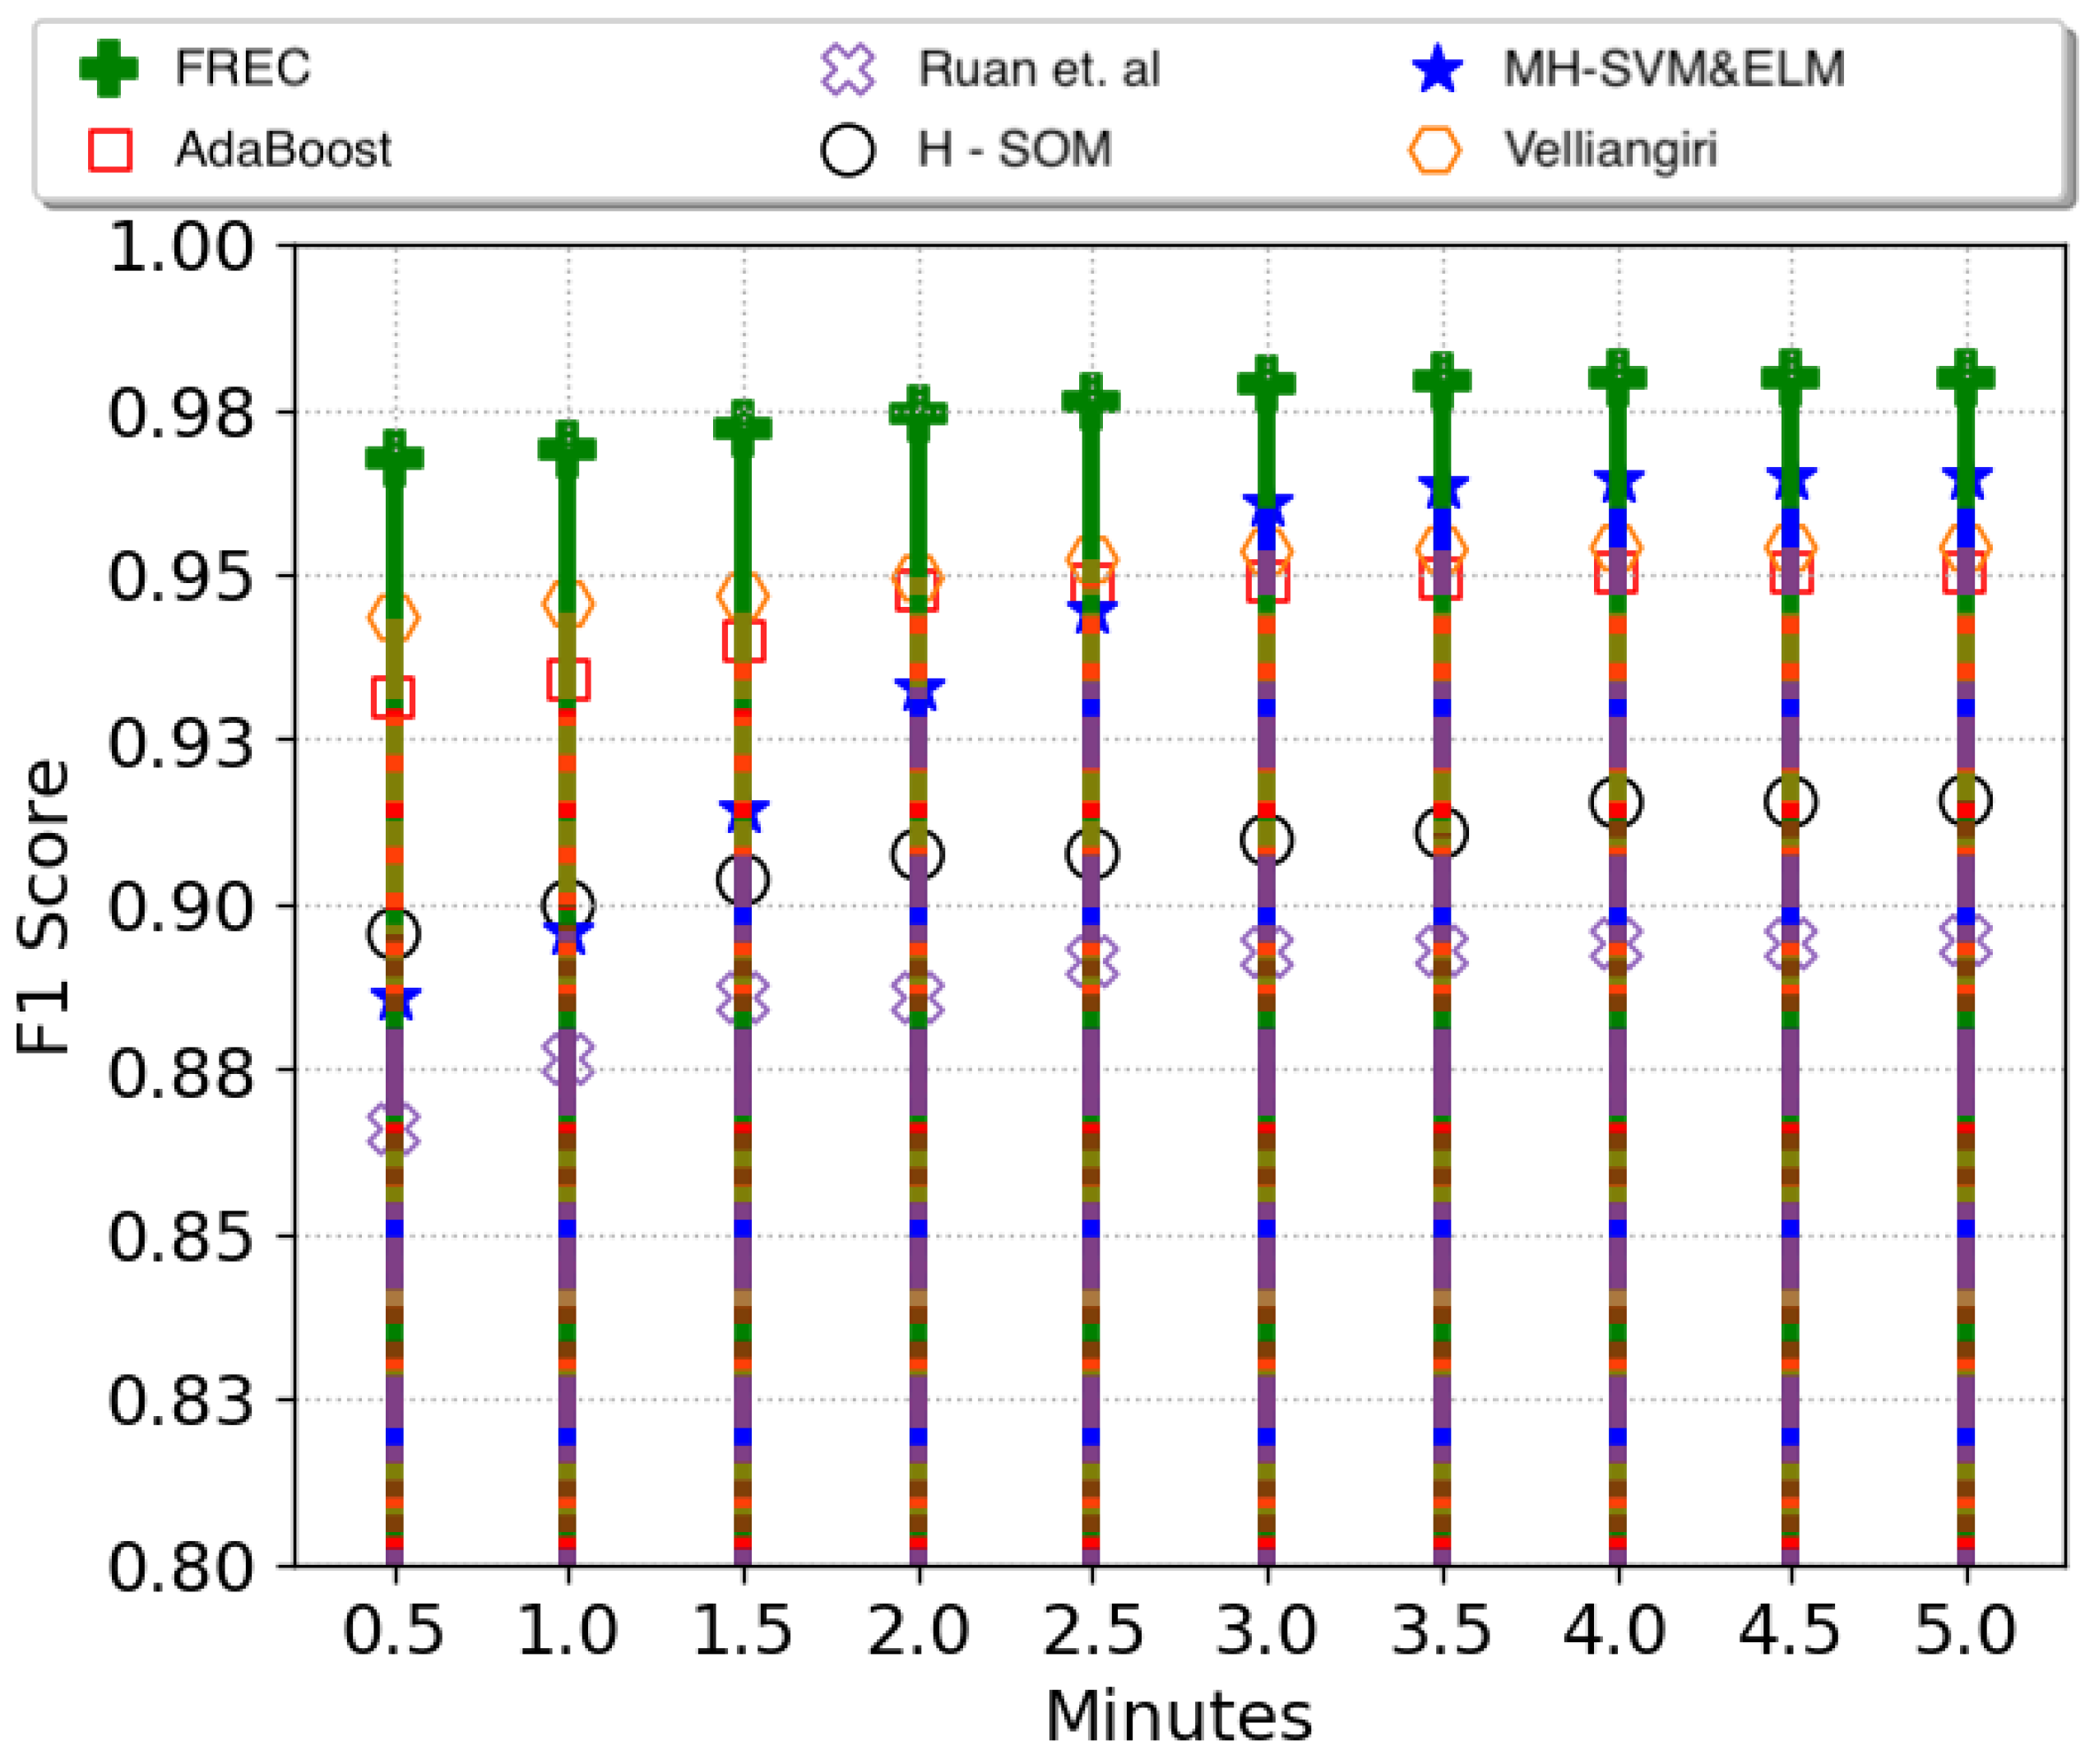
Figure 5 summarizes the
score results, where FREC-NIDS starts with an
of
and ends with a high value of
. Multi-level hybrid SVM [
18] finished closest to FREC-NIDS with
but having started with a low value of
. Actually, most models compared in our experiment started with a low performance score, possibly because of the required extensive training. Our network model, shown in
Section 4.4, is a complex network model to subject all related models, as well as FREC-NIDS, to a robust experiment.
Ruan et al. [
16] start the experiment with the worst performance, followed by Hierarchical SOM [
17] and Velliangiri [
19], having performance scores between
and
. The difference in performance between Bagged C5 and the other related models [
15,
16,
17,
18,
19] is possibly due to the different classifiers from multiple decision trees. Notably, although we used the full KDDCUP’99 dataset, FREC-NIDS achieved better results.
The core objective of our research was articulated through MO-1 in
Section 1, aiming at presenting a low-cost and straightforward technique for dynamic network data extraction then significantly enhancing network anomaly detection. Our findings in
Section 5, demonstrating an
F1 score of 97.9% and a minimal false positive rate of 0.3%, not only corroborate the achievement of this objective but also represent a critical step in network security. These outcomes directly address the prevailing challenges highlighted by Ferrag et al. [
1] and Chowdhury & Gkioulos [
2], where traditional NIDS often lag in adapting to the fast-evolving cyber threats. Our approach for MO-1 further elaborated in
Section 4 utilizes open-source tools for network data extraction, coupled with a data analytics-based intrusion detection system, which enables us to achieve MO-2 by ensuring replicability and operational efficiency without necessitating extensive training data or bespoke closed-source solutions.
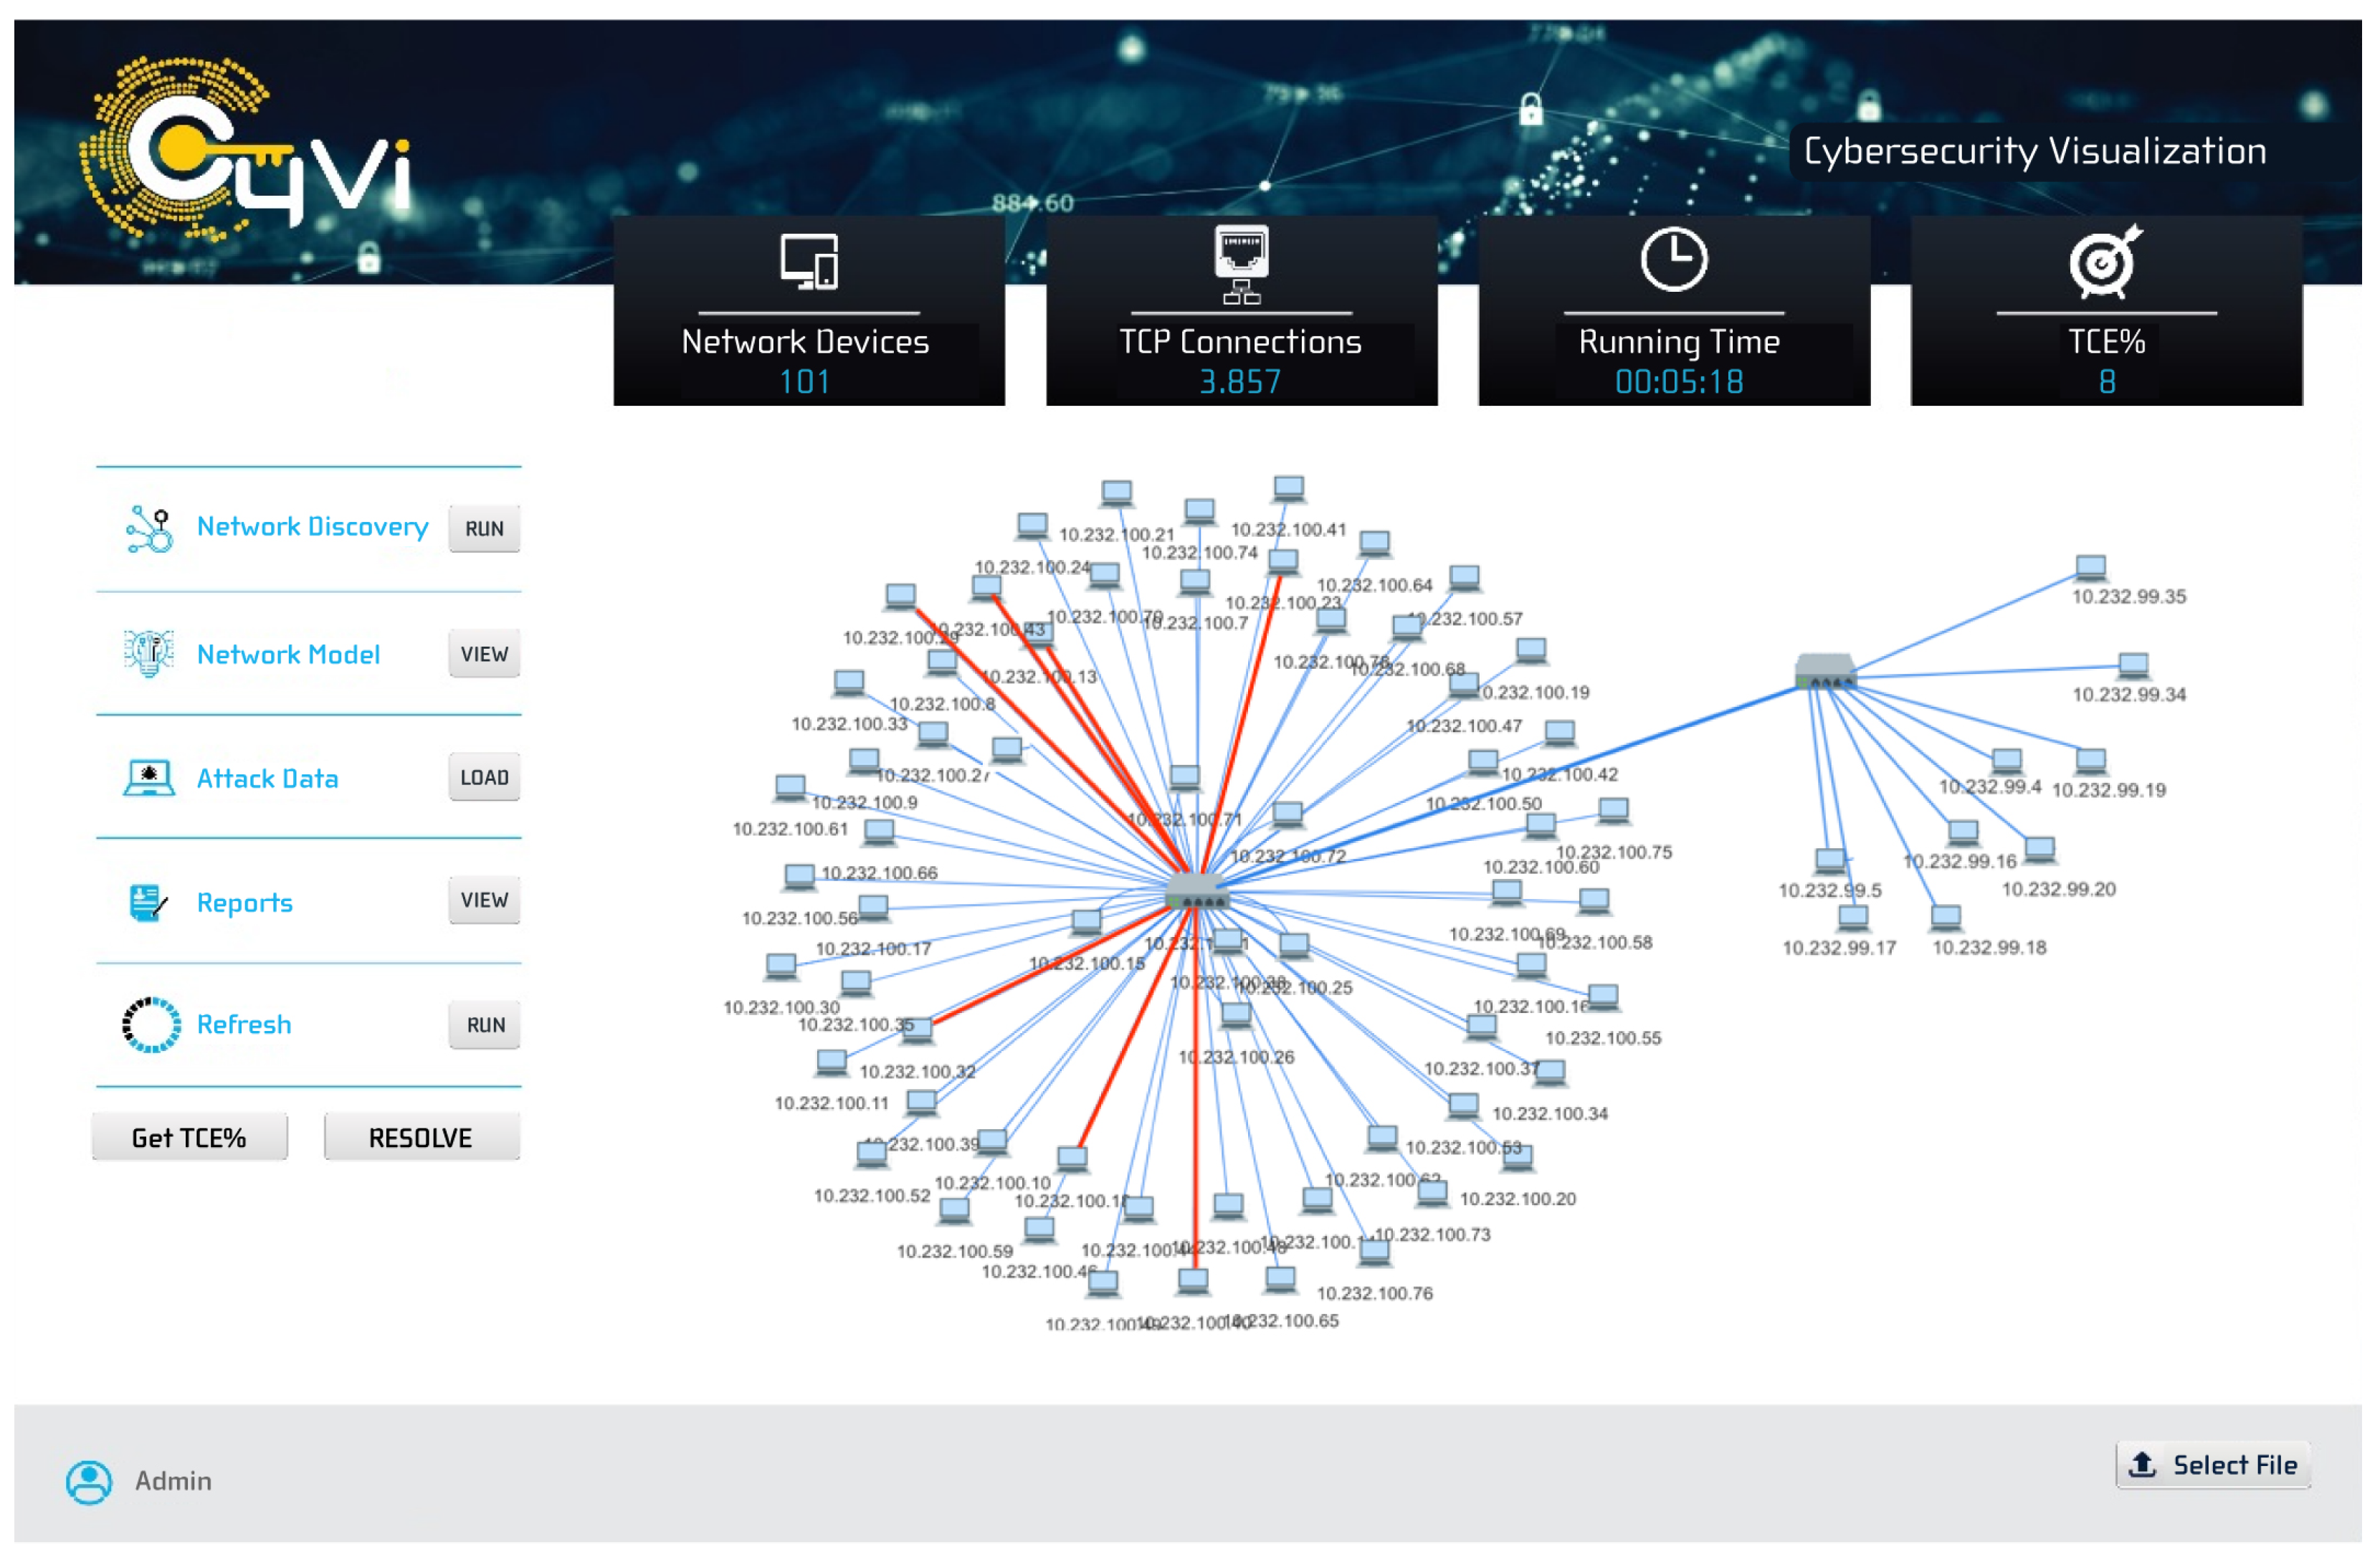
6. Prototype
This paper includes an exploratory proof-of-concept demonstration developed as a web service that queries required data from a MySQL database and sends them to a visual display. The front-end is developed through a combination of JavaScript and C# published as a WebGL project from the new Unity software Entity Component System (ECS) [
62].
Figure 6 shows our high-fidelity prototype with self-explanatory iconography and simple categorization of system functions. System navigation is placed on the left side with the following:
Network Discovery: This executes an automated
bash script described in
Section 4.1. In case of network discovery performed outside our prototype, the data can be loaded as a CSV file through the
select file icon on the bottom left side of the page.
Network Model: This displays the scanned network topology.
Attack Data: This allows loading the attack data described in
Section 4.3. These data can be
completely loaded as used in our experiment but can also be modified for different studies.
Reports: This summarizes exportable data from the experiment.
Refresh: This allows a new experiment to be conducted.
GET TCE%: This calculates the TCE and displays it on the top right side of the page.
Resolve: This runs the defense mitigation strategy described in
Section 4.8.
The top dashboard summarizes our experiment including 3857 TCP connections, a total experiment time of 5 min, and an initial TCE of
. However, in a real environment, immediate defense and mitigation should occur on detection, and our visual system is set only to deploy the
resolve module on
Section 4.8 on execution from the user so that cyberattack effects can be viewed first.
These technical details and functional aspects of our proof-of-concept prototype build on our prototype’s topology, as summarized in
Figure 6, that depicts a real-time interactive network model having an array of network devices and connections. This high-level overview demonstrates the prototype’s structural and operational accuracy, reflecting a complex network. As explained, the technical backbone combines a MySQL database queried by a web service, with a responsive front-end JavaScript and Unity’s ECS interface, emphasizing real-time data processing. For a practical demonstration of the system’s versatility, the prototype incorporates various simulated attack scenarios. The attack data function facilitates the loading of specific attack types from the KDDCup’99 dataset, such as DoS and probing attacks, to validate the detection and visualization mechanisms.
The prototype’s layout, with dedicated controls for network discovery, data loading, and mitigation strategy implementation (“Resolve”), provides real-time observations of threats, thus verifying the prototype’s effectiveness and practical contribution within the field of cybersecurity visualization. The introduction of a real-time visualization layer achieves our MO-3 by presenting a novel mechanism for network security monitoring that enables informed decision-making. This feature directly addresses the gap in effective threat visualization noted in existing NIDS solutions and marks a significant step in layering effective threats identification and mitigation. The utilization of color-coded connection statuses simplifies the complexity associated with network monitoring amid massive network events. The prototype’s design also achieves our MO-4 through changing network link colors from red to blue, indicating the mitigation of threats in real time. This feature directly reflects our objective to not only detect but also visually signify the neutralization of network threats for enhanced clarity and immediacy of security responses.
7. Conclusions
In light of the challenges posed by intricate NIDS schemes, there has been a surge in network breaches. Multilayered strategies that embed cyber visualization of NIDS alerts have emerged as a countermeasure, albeit accompanied by inherent constraints. Recognizing that most cyberattacks stem from unauthorized network connections, we introduced a novel NIDS, which gleans network information through processes easily replicated from network scanning utilities. Our approach monitors TCP connections, handshake FR, and the count of ECs at specific intervals, generating alerts to identify benign or malicious network connections. In our strategy, a visual-interactive prototype is designed to highlight suspicious connections, with color-coded outcomes based on cyberattack and cyber-defense rates. This enhancement provides cyber-analysts with a more informed decision-making tool, especially in situations where rapid termination of malicious connections prompts attackers to constantly switch targets. Central to our defense approach is the introduction of a verified report on compromised hosts, presented on the primary network controller. This is complemented by the deceptive broadcast of incorrect packet destination routes to compromised entities.
Once a false route is accepted by the malicious hosts and packets forwarded, these packets are subsequently dropped. Our visual tool provides the status of networked hosts’ availability at given intervals rather than mere visualization of cyberattack effects on the physical world, i.e., non-technical space. Our experiment shows a significant improvement in
score compared with other models [
15,
16,
17,
18,
19], which have a lowest performance score of
. Our model showed only a 0.3% FPR and a high
score of
. However, we are limited in differentiating high-level network components, such as hubs and network switches, that might not operate the same as data point networked hosts. Nonetheless, main network controllers have in the past been poorly configured and breached as high-priced attack targets, necessitating special attention. Our future work will cluster network components differently, including network computing hosts handled diversely like main network controllers.
Testing our model in expansive networks will yield more detailed data on network events, potentially enhancing our false positive rate metrics. A controlled network environment allowed us to closely monitor the model’s performance and fine-tune its detection mechanisms but does not offer the ability to capture important computation complexity metrics. Recognizing the importance of this aspect for real-world applications, our future works will include processing time and memory usage processing as the model analyzes live network traffic over time. This will set up the stage for future investigations into its computational complexity. This next step is crucial for ensuring FREC-NIDS meets the dynamic demands of modern network security challenges. Our future plans also involve expanding our model to include behavioral analysis for anomaly detection that will enhance the model’s ability to analyze patterns of behavior within the network traffic and adapt to new patterns of network behavior over time. Furthermore, as an expansion of our mitigation strategy, future iterations of our model will consider integration with other security systems such as open-source firewalls and intrusion prevention systems. This integrated approach will advance our model’s fingerprint of malicious connections in a holistic defense approach.


