Abstract
Machine learning is a powerful tool for data classification and has been used to classify movement data recorded by wearable inertial sensors in general living and sports. Inertial sensors can provide valuable biofeedback in combat sports such as boxing; however, the use of such technology has not had a global uptake. If simple inertial sensor configurations can be used to automatically classify strike type, then cumbersome tasks such as video labelling can be bypassed and the foundation for automated workload monitoring of combat sport athletes is set. This investigation evaluates the classification performance of six different supervised machine learning models (tuned and untuned) when using two simple inertial sensor configurations (configuration 1—inertial sensor worn on both wrists; configuration 2—inertial sensor worn on both wrists and third thoracic vertebrae [T3]). When trained on one athlete, strike prediction accuracy was good using both configurations (sensor configuration 1 mean overall accuracy: 0.90 ± 0.12; sensor configuration 2 mean overall accuracy: 0.87 ± 0.09). There was no significant statistical difference in prediction accuracy between both configurations and tuned and untuned models (p > 0.05). Moreover, there was no significant statistical difference in computational training time for tuned and untuned models (p > 0.05). For sensor configuration 1, a support vector machine (SVM) model with a Gaussian rbf kernel performed the best (accuracy = 0.96), for sensor configuration 2, a multi-layered perceptron neural network (MLP-NN) model performed the best (accuracy = 0.98). Wearable inertial sensors can be used to accurately classify strike-type in boxing pad work, this means that cumbersome tasks such as video and notational analysis can be bypassed. Additionally, automated workload and performance monitoring of athletes throughout training camp is possible. Future investigations will evaluate the performance of this algorithm on a greater sample size and test the influence of impact window-size on prediction accuracy. Additionally, supervised machine learning models should be trained on data collected during sparring to see if high accuracy holds in a competition setting. This can help move closer towards automatic scoring in boxing.
1. Introduction
Wearable inertial sensors are fast becoming a validated technology to provide data for athlete performance analysis in a range of sports [1]. The development of microelectromechanical systems (MEMS) means that wearable, unobtrusive inertial sensors and global positioning system (GPS) units can be manufactured at relatively low cost and are more readily available for coaching teams [2]. Machine learning and artificial intelligence (AI) techniques are powerful tools for regression modelling and classification in data analytics. The sporting world is becoming increasingly data driven and thus machine learning and AI algorithms are being used more frequently for athlete performance monitoring. An abundance of scientific literature and commercialized technology have used signals obtained by wearable inertial sensors to identify activity type and intensity in sport and general living [3,4,5,6,7,8,9,10,11,12,13,14,15,16,17,18,19,20,21,22,23,24,25,26,27,28].
Boxing is a highly demanding sport both physically and mentally. It requires high levels of endurance, strength, specific fitness, mental toughness and skill acquisition [29]. A professional boxing athlete will enter a 6–10-week training camp ahead of a competition. The camp will usually abide by periodization training (Figure 1) to minimise the risk of injury and ensure the athlete is in peak condition when entering the bout.
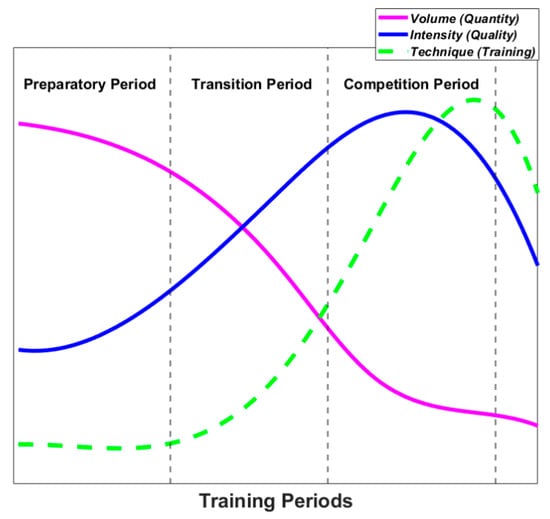
Figure 1.
Periodisation graph showing variations in training volume, intensity and technique when preparing for competition [30].
Farrow and Robertson [31] developed a periodization framework focused on skill acquisition of high-performance sport. These researchers focused on the skill of passing in soccer; however, this can easily be substituted for striking performance in a sport like boxing. Fundamental training exercises for boxing consist of pad work and sparring. Pad work increases the athletes muscle memory, allowing them to instinctively throw effective striking combinations during certain fight situations. Sparring has high specificity; it can be designed to closely reflect the competition bout through selection of sparring partners who are similar height, weight and style of the upcoming opponent.
Due to the vast availability of data and video footage of professional boxers, coaches can conduct thorough analysis of opponents before a fight, exposing areas of weakness which their fighter can exploit. This may be a certain striking combination that they work on during the training camp. Video analysis is a common method used by high-performance coaches and biomechanists to review training sessions and determine areas of weakness their athlete needs to address. Nonetheless, the analysis of complex strike patterns often requires observational coding and notational analysis which is a time-consuming task [22,29]; therefore, technologies and algorithms that can automate this process are desirable.
Catapult™ (Catapult, VIC, AUS) is one of the world-leaders in GPS sport performance units [32]. They work with over 2970 teams around the world at all levels of eight sports. Their GPS sensors incorporate sensor fusion algorithms with inbuilt inertial sensors to extract metrics that give a good insight into sports performance. The sensors are designed to fit into the back pocket of custom-made sport harnesses. Using the GPS inertial sensor unit in conjunction with physical descriptors of the athlete, metrics such as distance covered, sprint distance, energy output, top speed and distance covered per minute can be calculated. Another outputted metric is player load (PL), calculated using data recorded solely by the inertial sensor. PL uses the cumulative instantaneous rate of change of the acceleration magnitude vector (vertical, anterior-posterior, and medial-lateral) to quantify the workload of an athlete [33]. Boxing-specific training is typically executed within an indoor environment and as a result GPS signal strength is hindered. Inertial sensors do not rely on external technology and thus metrics such as PL that depend only on inertial sensor data are preferable for indoor performance monitoring. Farrow and Robertson [31] concluded that a more pertinent research question after implementing their framework is whether algorithms can be developed so that wearable technologies can automate workload and skill performance measures of athletes. This will help eliminate time-consuming tasks such as video analysis.
To produce maximum strike force, maximum speed should be produced at the end of the distal segment in a kinetic chain [34]. In boxing, the kinetic chain and thus biomechanical processes vary for different strike types. This variation in movement between the different punches can be captured by an inertial sensor(s) and used with supervised machine learning classification algorithms to automatically classify different punch types. If accurate, inertial sensors and machine learning algorithms can be used to bypass video-labelling of complex strike patterns. Additionally, performance descriptors of strikes such as peak acceleration, linear velocity and angular velocity can be automatically assigned to their respective strike classes. The previous scientific literature has been published describing algorithms to automatically classify strike types [6,35]. However, they predominantly use computer-vision methods, full inertial sensor suits or inertial sensors used synergistically with other biofeedback technologies such as optical motion capture to achieve this. Athletes can be reluctant to wear multiple sensors as it can hinder movement and complex systems such as optical motion capture are highly expensive and typically require a laboratory environment for calibration. Recently, commercial smart boxing gloves (Move It Swift™) [36] were released. The smart gloves can be used to classify punches, monitor punch force and speed and estimate calories burnt in real time glove-embedded 6DOF inertial sensors (3-axis accelerometer, 3-axis gyroscope). It also uses continual machine learning techniques to adapt to the punch style of each user. Inertial sensors have also been able to provide measures of punch approach angle and boxer fatigue [37].
Despite the vast amount of scientific research (36 manuscripts as of September 2018) [35] and increased availability of inertial sensor technology, it is still not commonly used in boxing training. Coaches still resort to using primitive, indirect and cumbersome technologies such as video analysis. The authors postulate reasons for the slow uptake of this technology [35]:
- (i)
- There is no consensus among the scientific literature for measurement protocol (i.e., number of sensors used, sensor placement, properties of sensor used);
- (ii)
- There is no consensus among the scientific literature for the signal processing of the data extracted from the sensors. The algorithms may not be shared amongst the wider scientific community;
- (iii)
- Many of the inertial sensor classification algorithms rely on inertial sensor suits or external technologies such as optical motion capture to be available.
This investigation aims to address these concerns by defining in full how 9DOF (3-axis accelerometer, 3-axis gyroscope and 3-axis magnetometer) inertial sensors and supervised machine learning models can be used to automatically classify punch type in boxing. No single model is optimal for classification in sport, performance can vary based on inertial sensor properties, inertial sensor positioning, feature engineering and type of activity being classified [14,38]. For this reason, two inertial sensor positioning configurations are evaluated: 1—Two inertial sensors (one positioned on the inside of each boxing gloves Velcro™ strap); 2—Three inertial sensors (one positioned on the inside of each boxing gloves Velcro™ strap and one positioned in a specially designed sports harness with a tight fitting sensor pocket in close proximity to the third thoracic vertebrae [T3]) and six different supervised machine learning models; logistic regression (LR), support vector machine (SVM—linear and Gaussian radial basis function (rbf) kernels), multi-layer perceptron neural network (MLP-NN), random forest (RF) and gradient boosting (XGB).
There are trade-offs associated with both sensor configurations:
Configuration 1:
- -
- Inertial sensors positioned near the glove are likely to over-range if the sensor properties are not suitable for high impact events such as punching. However due to the vast array of sensor channels available in a 9DOF sensor, this may not have a drastic effect on classification. However, high-range sensors are required for accurate measurements of punch impact acceleration, velocity and angular velocity etc.
- -
- One less sensor is needed for a complete configuration.
- -
- The complete algorithm can be implemented by embedding sensors into boxing gloves to produce smart boxing gloves, like those developed by Move it Swift™ [36].
Configuration 2:
- -
- In this configuration, the glove positioned sensors are being used purely for punch detection (high impact event) and thus over-range on these sensors is not a concern for classification model training. The supervised machine learning models are trained using features obtained from the T3 positioned sensor. As the T3 is positioned nearer the user’s centre of mass (CoM) and the punch impact acceleration is attenuated by the musculoskeletal structure, the sensor is not likely to over range.
- -
- Boxing punch form is highly dependent on the movement of the kinetic chain which starts at the torso (requires high rotation for power and stability). Using only boxing glove sensors for classification means that the torso movement must be inferred. Valuable performance metrics regarding more of the kinetic chain can be obtained by using glove sensors in combination with a T3 positioned sensor.
- -
- Many sporting organisations already use Catapult sensors in their training and competitive games. Thus, athletes are used to wearing a sensor in the T3 region. It is advantageous to deliver more metrics from this location.
For both sensor configurations, the supervised machine learning models were evaluated using precision, recall, accuracy, F1-score and computational training time. This manuscript will provide an insight to readers on which sensor configuration and machine learning classification model type is optimal for boxing punch classification. A wearable inertial sensor boxing punch classification algorithm which is both accurate, not demanding computationally and not reliant on full-body inertial sensor suits or external technologies offers coaches, athletes and recreational users accessibility to automated workload and performance monitoring in training [6,26,39]. Additionally, biofeedback metrics such as punch impact acceleration, velocity, approach angle and fatigue can be automatically paired with its punch type allowing progressive tracking in training camp. If sensor configuration 2 is chosen, then other metrics such as torso rotation angle and torso angular velocity can also be obtained. It is envisaged that this manuscript will act as a guide so that sport scientists and sport engineers can implement this algorithm in their own sporting organisations.
2. Experimental Section
2.1. Participants
One healthy participant (n = 1) (weight = 85 kg, height = 175 cm) with experience in Muay Thai, a striking-dominant form of martial arts took part in the study. Ethical approval was granted by the Human Research Ethics Committee at Griffith University (GU 2017/587).
2.2. Materials
Three synchronised identical 9DOF inertial sensors (SABELSense, Griffith University, Nathan Australia) [40,41,42] with properties (250 Hz sampling frequency, ±16 g accelerometer, ±2000 deg/s gyroscope, ±7 Gauss magnetometer, 23 g weight) dimensions 55 mm × 30 mm × 13 mm (L × W × H) (Figure 2) were used in this study. Two sensors were attached underneath the boxing glove of the left and right wrists using Velcro™ bands and one sensor was placed into a specially designed sports harness with a sensor pocket located in close proximity to the third thoracic vertebrae (T3) on the upper spine (Figure 3). Data analysis can be implemented for sensor configurations 1 and 2 using this sensor position arrangement. Measurements of the sensors’ 3-D orientation in terms of Euler’s angles (roll, pitch and yaw) were obtained using Madgwick’s AHRS algorithm (static root mean square (RMS) error <0.8°, dynamic RMS error <1.7°) [43]) The algorithm has proven successful previously in other sports such as sprint running and netball when validated against optical motion capture [44,45]. In anatomical position, the orientation of the sensors are as follows: x-axis (superior–inferior), y-axis (medio–lateral) and z-axis (anterior–posterior/longitudinal). Yaw describes the rotation angle about the sensors’ vertical axis, pitch describes the rotation angle about the sensors’ mediolateral axis and roll describes the rotation angle about the sensors’ longitudinal axis. The Euler angles are unwrapped, that is, if the change between two consecutive angles is greater than or equal to π radians, and it is shifted by adding multiples of ±2π until the change is less than π radians. If the sensors are positioned correctly, gimbal lock should be avoided as the sensor will not reach an orientation aligning multiple Euler angles. A Panasonic video came HC-V750M (120 fps) was used to record the session. Notational video analysis was used as the ground-truth reference for the supervised machine learning model predictions.
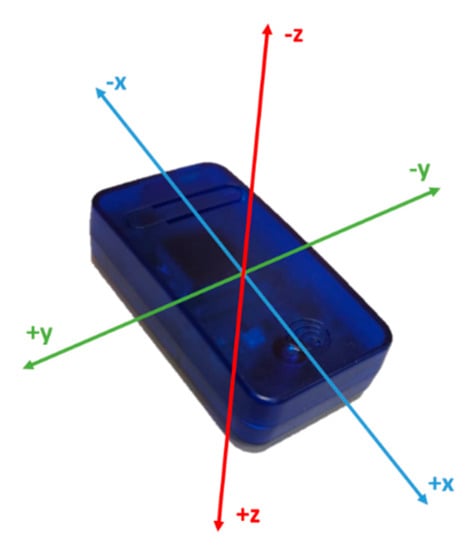
Figure 2.
Diagram showing the SABELSense inertial sensor and axes orientation.
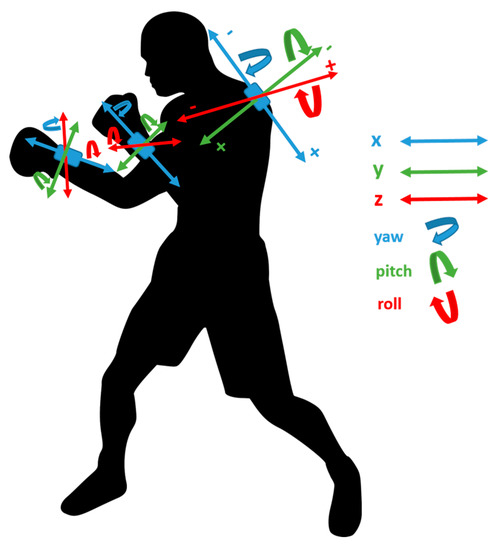
Figure 3.
Diagram highlighting the inertial sensor configuration and axis orientation for the participant.
2.3. Methods
The methodology was designed to mimic a basic pad-work boxing drill using 12 oz Everlast™ boxing gloves and mitts. The data collection was divided into two sessions: A training data collection session and an evaluation/testing data collection session. The training data collection session consisted of the participant performing common pad-work punch types (Figure 4) (Left Jab (LJ), Right Cross (RC), Left Hook (LH), Left Uppercut (LUC) and Right Uppercut (RUC) fifty times each resulting in a total of (n = 250) punches thrown. The participant was instructed to perform common pad-work punch types (Left Jab (LJ), Right Cross (RC), Left Hook (LH), Left Uppercut (LUC), Right Uppercut (RUC) fifty times each resulting in a total of (n = 250) punches thrown. The evaluation/testing data collection session consisted of the participant performing a random combination of the aforementioned punches to reflect pad-work training. The participant threw 18 LJs, 16 RCs, 15 LHs, 20 LUCs and 13 RUCs (n = 82).
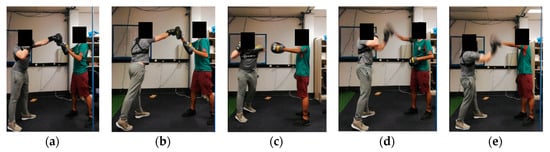
Figure 4.
Diagram demonstrating the types of punches thrown; (a) left jab; (b) right cross; (c) left hook; (d) left uppercut; and (e) right uppercut.
2.4. Data Pre-Processing and Feature Engineering
Data pre-processing was conducted in MATLAB (release 2020a, The MathWorks Inc., Natick, MA, USA). The maximum value of the left and right gloves inertial sensor acceleration x-axis (axis in line with the punch impact) was calculated. Peaks in the acceleration x-axis greater than 60% of this maximum value, separated by at least 0.5 s were used to determine possible punching events. A 1.2 s window (0.6 s either side of punch event) is then generated (Figure 5). This punching event detector is similar to those used previously in impact-based sport action detection [14,26,46,47,48]. Pad work training is typically dynamic as the coach and athlete will try to mimic a bout. This can cause the sensors to undergo transformations into different orientation frames which can appear as drift in the signal. However, the respective range in the Euler angle values throughout a punch window does not change and is repeatable. Therefore, to combat this, the Euler angles are zeroed at the start and end of each punch window.
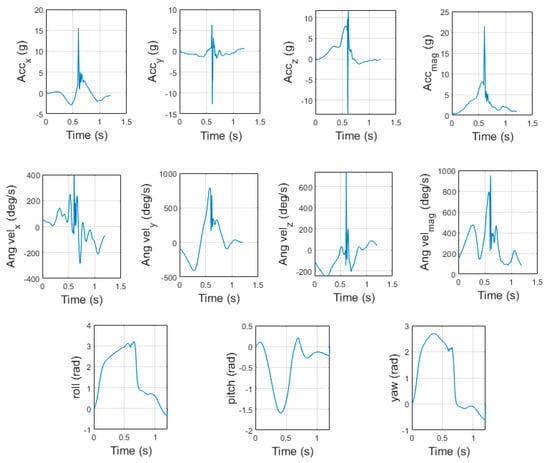
Figure 5.
Boxing punch impact window profile for all sensor channels for one left hook punch (sensor configuration 1—left boxing glove sensor).
From each punch window, a total of 132 features are extracted from the time and frequency domains. The extracted features are similar to those proven successful in other sporting event classification research studies [14,49]. The extracted features can be seen in their entirety in Table A1.
Principal component analysis (PCA) was used to reduce the dimensionality of the extracted feature matrix [50]. PCA transforms the feature matrix into orthogonal variables called principal components. Each principal component represents a percentage of variance within the feature space. The number of principal components retained were those needed to explain 95% of the variance within the feature space. Using PCA is beneficial as it can remove noisy/redundant features that hinder the accuracy of the machine learning models, improves computational efficiency by reducing the number of features needed for model training and can assist with data visualization. The top three principal components for both sensor configurations are displayed in Figure 6 and Figure 7. PCA was executed using the scikit-learn decomposition library in Python [51].
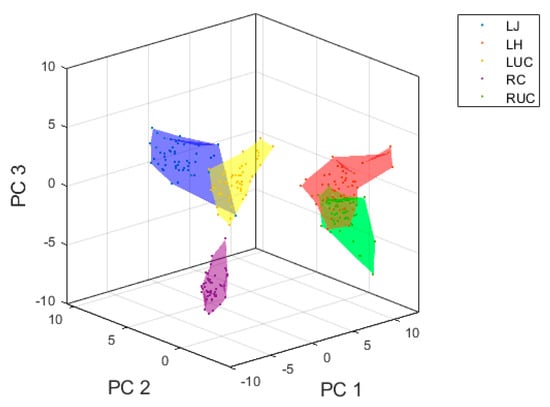
Figure 6.
Visualization of top three principal components for inertial sensor data using features extracted from the boxing glove inertial sensors.
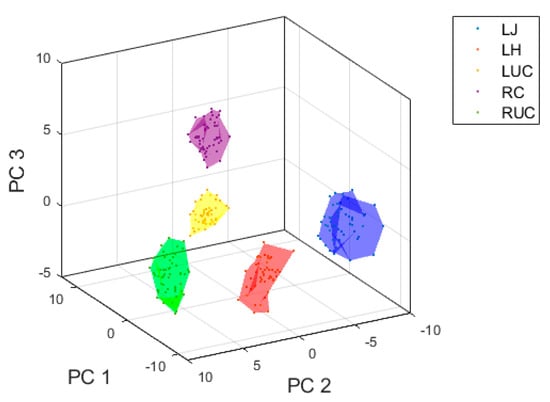
Figure 7.
Visualization of top three principal components for inertial sensor data using features extracted from the T3 inertial sensor.
There is a clear separation boundary between the different punch types, particularly when extracting statistical features from the T3 sensor. When extracting features from the boxing glove inertial sensors, there is an overlap between left hook and right uppercut, and left jab and left uppercut in the feature space. The plots only visualize the top three principal components, the actual number of principal components used for model training are those that explain 95% variance within the feature space and thus the separation boundaries will be heightened.
2.5. Supervised Machine Learning Model Training and Evaluation
The same model training process was conducted for feature matrices obtained using both sensor configurations, all model training and testing was executed in Python using the scikit-learn module [51]. Feature matrices were imported into the Python Jupyter Notebook integrated development environment (IDE) using the pandas module [52]. Six machine learning models were evaluated, this included the logistic regression (LR), linear support vector machine (LSVM), Gaussian rbf support vector machine (GSVM), multi-layer perceptron neural network (MLP-NN), random forest (RF) and gradient boosting (XGB) algorithms. These models have proven effective classifying other sporting activities with inertial sensor data.
LR utilises a logistic sigmoid hypothesis function in combination with a cost function and optimization technique (e.g., gradient descent) to output probability values which can be mapped to two or more discrete classes. SVMs are sometimes referred to as large-margin classifiers. This is because they create a decision boundary which maximizes the minimum distance from the boundary point to the nearest example of each class (hyperplane). They also use a cost function and optimization technique however the class choice is absolute, that is, depending on which side of the hyperplane a feature vector lies, is what class it is assigned (no probability values are assigned). When classes cannot be separated by a linear boundary, SVMs can use a kernel trick to transform the data into a feature space in which a clearer linear separation may be possible.
MLP-NN is a feed forward network. It is divided into an input layer (feature vector), L hidden layers and an output layer (class prediction). The hidden layers consist of S nodes plus a bias node to enhance the networks flexibility. Each node has an activation functioned used for prediction and a series of adjustable weights that modify the outcome of the activation function. Each layer is a classifier in itself, so the more layers added, the more complex classification problems can be solved. A technique called backpropagation is used for optimization. Using a cost function, backpropagation calculates the cost each node is responsible for and then uses an optimization technique (e.g., gradient descent) to update these weights in order to reduce the cost and hence optimise the network.
A decision tree consists of a series of nodes; root node (the node at the top of the tree), internal nodes and leaf nodes (only have arrows point towards them). The root node and internal nodes each contain conditional statements regarding the features used for classification. Each feature is evaluated on its ability to classify the data on its own and the one that performs the best is taken as the root node. Common evaluation metrics are Gini and Entropy. For context, a decision tree using Gini as the evaluation metric is explained. The feature that achieves the lowest Gini score is one that attains the best split of classes in the data and thus is taken as the root node. This process is repeated for each internal node (consecutively selecting features that achieve the lowest Gini score) until all features are used with conditional statements or a Gini score of 0 is reached. The final nodes then become leaf nodes whereby hopefully a feature vector has been assigned to its correct class. RF is a classifier which builds upon decision trees to enhance classification performance. RF extracts random data subsets from the original feature matrix to make N bootstrapped feature Decision trees matrices. A decision tree is then trained on all N bootstrapped feature matrices, generating N different decision tree algorithms. A prediction is then made based on the majority vote of all N decision trees.
XGB is a method of transforming weak learners into strong learners, in this case the weak learner is a decision tree. XGB identifies weaknesses in a decision tree by assessing gradients in a cost function. This allows subsequent models to be added with the aim to minimise the cost function.
Each of the models consist of tunable hyperparameters (e.g., hidden layer sizes in MLP-NN and number of estimators (decision trees) in RF). The models were trained using both their default hyperparameters and optimised hyperparameters subject to an exhaustive grid search (5-fold cross validation) using the scikit-learn function GridSearchCV and F1_macro as the scorer. The hyperparameter optimization process is repeated for each fold of the 5-fold cross validation. The classifier which presents the best F1-score is taken as the optimised classifier. Classification performance of the default models was then compared to that of the optimised models. The optimal parameters for each model are as follows:
Configuration 1:
- -
- LR: Inverse of regularization strength (C) = 100, solver = newton-cg, penalty = l2.
- -
- SVM: Regularization parameter (C) = 1, kernel = Radial basis function, Kernel coefficient (gamma) = 0.001.
- -
- MLP-NN: Activation = tanh, alpha = 0.0001, hidden layer sizes = 8, 8, 8 (3 hidden layers with 8 nodes each), learning rate = constant, solver = lbfgs.
- -
- RF: criterion = gini, maximum features =, number of estimators = 70.
- -
- XGB: criterion = mae, loss = deviance, max depth = 6, maximum features = log2 (number of features), number of estimators = 150.
Configuration 2:
- -
- LR: Inverse of regularization strength (C) = 100, solver = newton-cg, penalty = l2.
- -
- SVM: Regularization parameter (C) = 1, kernel = Radial basis function, Kernel coefficient (gamma) = 0.001.
- -
- MLP-NN: Activation = tanh, alpha = 0.0001, hidden layer sizes = 10 (1 hidden layer with 10 nodes), learning rate = constant, solver = lbfgs.
- -
- RF: criterion = gini, maximum features =, number of estimators = 60.
- -
- XGB: criterion = friedman_mse, loss = deviance, max depth = 1, maximum features = log2 (number of features), number of estimators = 150.
The definition of the parameters for each model can be found online in the scikit-learn documentation [53]. The default model hyperparameters can be found in Table A2. The models were trained on the 250 punches (50 of each punch type) collected in the training data session. They were then evaluated on the unseen punch data collected in the evaluation/testing data session (82 punches). Training size can have an effect on classifier performance; therefore, learning curves are plotted for each model of both sensor configurations (Figure 8 and Figure 9). Please note that 200 was the maximum train size when using 5-fold cross validation (250/5 = 50) and therefore 50 punches are held back to achieve a validation score at a training size of 200.
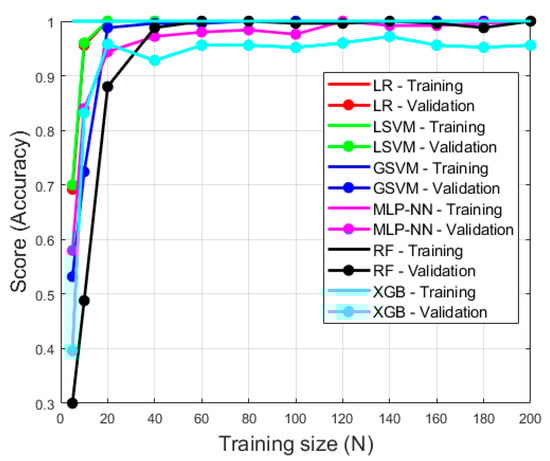
Figure 8.
Learning curve for models trained on feature data extracted using sensor configuration 1. All models except gradient boosting (XGB) reach a validation score of 1.0 at a training size of approximately 120. Note, the training score was 1 or close to 1 for each model and training size.
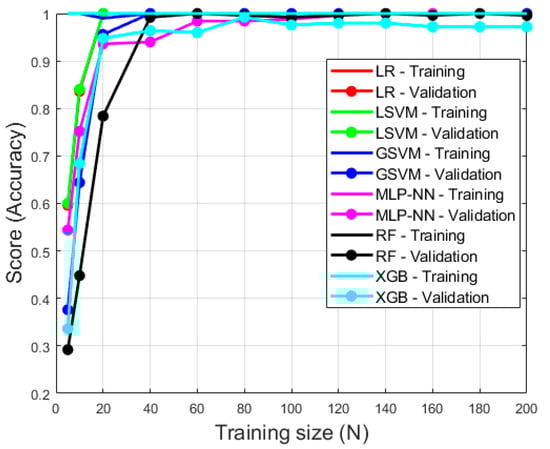
Figure 9.
Learning curve for models trained on feature data extracted using sensor configuration 2. All models reach a validation score of 1.0 at a training size of approximately 100. The validation score of XGB then slightly declines at a training size of 200 (0.97). Note, the training score was 1.0 or close to 1.0 for each model and training size.
Figure 8 and Figure 9 demonstrate the performance of each model type when trained on different quantities of punch examples. The training score is always at 1.0 or extremely close to 1.0 for all models using both sensor configurations. This demonstrates that all models are learning exceptionally. It is evident that all models except MLP-NN and XGB for both sensor configurations achieve a high validation score when training on a relatively low number of examples (approximately training size of 40 for both sensor configurations). When a training size of 200 is used, all models except XGB express a validation score of 1.0. This demonstrates all of the models except XGB achieve maximum generalization using a training size of 200. Although XGB did achieve high generalization using a training size of 200 (0.96 and 0.97 for sensor configurations 1 and 2 respectively), it is evident that the validation score would continue to improve with an increased training size. In this investigation, all models were trained using 250 punch events and thus the authors believe the amount of training data is sufficient for both model learning and generalization. It is clear that the performance of all the models increased with training size, however, and thus it is encouraged to collect and train on as much data as possible.
2.6. Statistical Analysis
Model training time, precision, recall, F1-score and accuracy were used to assess model classification performance on the evaluation data. In multi-class classification, these metrics are computed for each class separately (except accuracy). The formulae for these metrics are shown (Equations (1)–(4)).
where TP is true positive, FP is false positive and FN is false negative. Precision defines the proportion of feature vectors the model predicted to be relevant are actually relevant. Recall defines the model’s ability to detect all feature vectors of interest in a dataset. F1-score is the harmonic mean of precision and recall. Maximizing F1-score results in an optimal balance of recall and precision. F1-score is not influenced by class distribution and thus is a good model performance metric in imbalanced datasets. Accuracy expresses the percentage of correct predictions in respect to all classes (overall model prediction accuracy). Two sample t-tests (α = 0.05) were used to identify if significant statistical differences existed between
- -
- Prediction accuracy of sensor configuration 1 and 2;
- -
- Prediction accuracy of tuned and untuned supervised machine learning models;
- -
- Computational training time of tuned and untuned supervised machine learning models.
The models were trained using a PC running on a windows 10 enterprise v.1709 operating system with 8.00 GB RAM, a 3.41 GHz clock speed and intel® core™ i5-7500CPU processor.
3. Results
Model performance metrics for all six model types (tuned and untuned) using sensor configuration 1 are displayed in Table 1. The performance of all six models (tuned and untuned) using sensor configuration 1 are further described using a confusion matrix (Table 2) which highlights the most frequent punch misclassifications. The performance of all six models (tuned and untuned) using sensor configuration 2 are presented in the same fashion (Table 3 and Table 4). There was no significant difference in overall model accuracy between sensor configurations (p = 0.26). Sensor configuration 1 had a mean model accuracy of 0.90 ± 0.12 and sensor configuration 2 had a mean model accuracy of 0.87 ± 0.09. Using sensor configuration 1, LR (tuned and untuned) and GSVM demonstrated the best classification performance (0.96 accuracy). XGB (untuned) had the worst classification performance (0.79 accuracy). Using sensor configuration 2, MLP-NN (untuned) showed the best classification performance (0.98 accuracy) and again, XBG (untuned) had the worst classification performance (0.80). In totality, classification accuracy was ≥0.79. For sensor configuration 1, there was not a significant difference between the computational training times (p = 0.16, α = 0.05) or prediction accuracy (p = 0.63, α = 0.05) for tuned and untuned models. The same was for sensor configuration 2, p = 0.13 and p = 0.84, respectively.

Table 1.
Classification results for models trained using sensor configuration 1; Tuned models are bold and denoted by a ‘.
Table 2.
Confusion matrix for models trained using sensor configuration 1; correct predictions are in bold.
Table 3.
Classification results for models trained using sensor configuration 2; Tuned models are bold and denoted by a ‘.
Table 4.
Confusion matrix for models trained using sensor configuration 2; correct predictions are in bold.
4. Discussion
Boxing punch classification performance of six types of supervised machine learning models (tuned and untuned hyperparameters) using features extracted from two types of 9DOF inertial sensor configurations was evaluated. The results demonstrate that both sensor configurations can be used to accurately classify punch type in boxing pad work (sensor configuration 1 mean overall accuracy: 0.90 ± 0.12, sensor configuration 2 mean overall accuracy: 0.87 ± 0.09). Sensor configuration 1 demonstrated greater overall classification accuracy for all models; however, this was not statistically significant (p = 0.26). This was not expected as the principal components extracted from the training data for sensor configuration 2 (Figure 7) displayed more distinct separation boundaries between the punch types than sensor configuration 1. The authors postulate that when more complex pad work combinations are being executed (as those in the evaluation/testing data) the challenge of differentiating punch type from data extracted from the T3 sensor becomes more complex (trunk movement changes when flowing into different punches); however, when using glove inertial sensors, it remains similar.
There was no significant statistical difference between model training times when using default hyperparameters and tuning these parameters using a grid search for both sensor configurations (p = 0.16, p = 0.13). However, there was also no significant statistical advantage gained when tuning the hyperparameters for both sensor configurations (p = 0.63, p = 0.84). In fact, the accuracy of some models decreased when the parameters were tuned. This may be the result of overfitting to the training data, even though 5-fold cross validation was used to minimise this. As the models are trained on the statistical features extracted from the inertial sensors in certain positions, it may be the case that the sensor positioning slightly varies due to vibrational motion endured during punch impacts. This would then result in the models predicting on data collected from sensors in slightly different positions. This emphasizes the importance of placing the sensors in the correct position when collecting data, highlighting the advantage of commercial products like Move it Swift™ [36] where the sensor is unable to change position as it is already embedded. Nonetheless, the prediction accuracy of the majority of models was excellent for both sensor configurations.
The most frequent misclassification made was predicting a left jab punch as a left hook for both sensor configurations (Table 2 and Table 4). For sensor configuration 1, this is explainable as in a time window close to the point of impact, the movement of a glove positioned inertial sensor is very similar for a left hook and left jab. This misclassification may be eradicated by expanding the impact window time duration to ensure the fast, rotational movement of the left hook punch is captured. However, this also introduces a higher chance of different types of punches overlapping within impact windows. Future research should investigate the effect of different sized impact windows on classification performance. For sensor configuration 2, the reasoning is not as clear. It is thought that the T3 sensor would capture the increased angular velocity and rotation angle associated with a left hook and use this to decipher between that and a left jab. With onsets of physical and mental fatigue however, punching technique may decrease and features extracted from a poorly thrown left hook may resemble those of a left jab. It must be noted that to evaluate the performance of the models in their entirety, a hierarchical machine learning approach was not used. On a commercial system, it would be possible to distinguish between left and right punches automatically based on which sensor an impact window as detected on. Thus, a machine learning model would only have to decipher between three punches on the left side and two punches on the right side. Hierarchical classification has shown to increase classification performance in combat sport [22].
Inertial sensors have proven successful as a tool for strike classification in other research investigations. Worsey et al. [35] conducted a systematic review of the literature pertinent to the use of inertial sensors in a combat sport performance analysis setting. Three of the papers reviewed investigated classification of striking. Wang et al. [24] used joint trajectory maps with convolutional neural networks to classify a multitude of movements. This research group however used data collected by an inertial sensor in conjunction with a kinetic motion capture system and did not distinguish between different punch types, just differentiated between right and left punches. They achieved 96% accuracy for punch right and 100% accuracy for punch left. Hachaj et al. [9] used a dynamic time warping (DTW) classifier with angle-based features from body worn (full body) inertial sensors to classify a variety of karate kicks performed by highly-skilled black belt karate athletes. Using this method, the researchers achieved 100% classification accuracy. Soekarjo et al. (2018) looked to classify the striking limb and technique using limb trajectory data Using KNN and support vector classification (SVC) 99% prediction accuracy was achieved. Both models achieved 86% prediction accuracy for technique classification. The researchers found that using hierarchical classification (classify limb first then technique) improved classification accuracy. The authors also demonstrate that a KNN classifier was able to differentiate the same strike-type based on skill-level of the athlete with 73.3% accuracy. The striking classification papers discussed above all achieved notable prediction accuracies. However the novelty of the method proposed in this paper is that it uses a maximum of three inertial sensors for the full classification algorithm and can classify a range of common pad work punches to high accuracies (90 ± 12%/87 ± 9%) without using hierarchical classification. Moreover, this paper also uses simple statistical feature extraction from the impact windows (i.e., mean, standard deviation, max etc.) from a range of sensor channels rather than using more complex methods such as dynamic time warping and trajectory mapping. Additionally, this paper evaluates the classification performance using two different sensor configurations, one which demonstrates smart boxing gloves and another which is beneficial as many professional sporting organisations already use a GPS/inertial sensor unit located at the T3. To the best of the author’s knowledge, this is also the first paper to compare the performance of six different supervised machine learning model types for this task. Not one model is optimal for all movement classifications in sport and thus it is important to assess the performance of different types. In this investigation, the untuned GSVM and MLP-NN were the best performing models for sensor configuration 1 and 2, respectively.
5. Conclusions
Overall, the classification framework proposed in this paper demonstrates a high-level of performance for both sensor configurations (sensor configuration 1 mean overall accuracy: 0.90 ± 0.12, sensor configuration 2 mean overall accuracy: 0.87 ± 0.09). There were no statistically significant differences in classification performance between the two sensor configurations or tuned and untuned models (p > 0.05). There was no statistically significant difference in the computational training time for tuned and untuned models (p > 0.05). Automatic strike classification can be used to evaluate and automatically label complex pad-work combinations executed in training, bypassing cumbersome notional analysis and video labelling. Using simple sensor configurations means a foundation for automated athlete workload monitoring in combat sports has been set. There is potential for the strike types to be paired with other biofeedback metrics such as punch impact acceleration, velocity, approach angle, torso angular velocity, and rotation angle, calories burnt and fatigue level. Classification algorithms can be embedded in athlete’s periodisation training framework to reduce injury incidence and assist in performance monitoring throughout elite-athlete training camp or recreational users’ gym routines. The authors hope this paper brings attention to the value of inertial sensor performance feedback and availability of commercially available systems such as the Move it Swift™ [36] in combat sport and that it will now be integrated more frequently.
The presented algorithm has proven to be effective and is reproducible for any athlete. The inclusion of a wide range of combat sport athletes of all levels (recreational to elite) will generalize the algorithm. Nevertheless, the minute computational training times means it is possible to train the supervised machine learning models on an individual basis. Moreover, a continual learning technique can be implemented such as that in the Move It Swift™ [36] smart boxing gloves. Future research will aim to combine strike classification with other biofeedback metrics obtainable through inertial sensors. Additionally, it would be interesting to compare performance of the supervised machine learning algorithms for impact windows of different time durations. Additionally, if data can be collected in a competitive setting (i.e., sparring or competitive boxing match), then the boxing punch prediction accuracy can be evaluated in a non-training environment. If the high levels of accuracy hold, then this can assist ringside judges make more informed decisions and move closer towards automatic scoring of boxing bouts [54].
Author Contributions
Conceptualization, M.T.O.W. and J.B.S.; methodology, M.T.O.W.; data collection, M.T.O.W.; data analysis, M.T.O.W.; manuscript preparation, M.T.O.W.; manuscript editing, H.G.E. and J.B.S. and D.V.T.; project supervision, H.G.E. and J.B.S. and D.V.T. All authors have read and agreed to the published version of the manuscript.
Funding
This research received no external funding.
Conflicts of Interest
The authors declare no conflict of interest.
Appendix A
Table A1.
List of all extracted features.
Table A1.
List of all extracted features.
| Feature | Accelerometer | Gyroscope | Sensor Orientation |
|---|---|---|---|
| Mean | x,y,z, mag | x,y,z, mag | Roll,pitch,yaw |
| Standard deviation | x,y,z, mag | x,y,z, mag | Roll,pitch,yaw |
| Maximum | x,y,z, mag | x,y,z, mag | Roll,pitch,yaw |
| Sample number of maximum | x,y,z, mag | x,y,z, mag | Roll,pitch,yaw |
| Minimum | x,y,z, mag | x,y,z, mag | Roll,pitch,yaw |
| Sample number of minimum | x,y,z, mag | x,y,z, mag | Roll,pitch,yaw |
| Skewness | x,y,z, mag | x,y,z, mag | Roll,pitch,yaw |
| Kurtosis | x,y,z, mag | x,y,z, mag | Roll,pitch,yaw |
| Frequency amplitude | x,y,z, mag | x,y,z, mag | Roll,pitch,yaw |
| Frequency | x,y,z, mag | x,y,z, mag | Roll,pitch,yaw |
| Energy | x,y,z, mag | x,y,z, mag | Roll,pitch,yaw |
| Absolute difference | x,y,z, mag | x,y,z, mag | Roll,pitch,yaw |
Mag is magnitude of x, y and z. It should be noted that principal component analysis as used on the feature matrix and principal components were used for model training.
Table A2.
List of supervised machine learning model default hyperparameters.
Table A2.
List of supervised machine learning model default hyperparameters.
| Model | Hyper-Parameters |
|---|---|
| LR | C = 1.0, solver = lbfgs, penalty =l2 |
| LSVM | C = 1.0. kernel = linear, gamma =scale |
| GSVM | C = 1.0, kernel = rbf, gamma = scale |
| MLP-NN | Activation = relu, alpha = 0.0001, hidden layer sizes = 8,8,8, (3 hidden layers with 8 nodes each) learning rate = constant, solver = adam |
| RF | , number of estimators = 20 |
| XGB | Criterion = friedman_mse, loss = deviance, max depth = 3, maximum features = None, number of estimators = 100 |
The definition of the parameters for each model can be found online in the scikit-learn documentation [53].
References
- Espinosa, H.G.; Shepherd, J.B.; Thiel, D.V.; Worsey, M.T.O. Anytime, anywhere! Inertial sensors monitor sports performance. IEEE Potentials 2019, 38, 11–16. [Google Scholar] [CrossRef]
- Camomilla, V.; Bergamini, E.; Fantozzi, S.; Vannozzi, G. Trends supporting the in-field use of wearable inertial sensors for sport performance evaluation: A systematic review. Sensors 2018, 18, 873. [Google Scholar] [CrossRef]
- Bai, L.; Efstratiou, C.; Ang, C.S. weSport: Utilising wrist-band sensing to detect player activities in basketball games. In Proceedings of the 2016 IEEE International Conference on Pervasive Computing and Communication Workshops (PerCom Workshops), Sydney, Australia, 14–18 March 2016; pp. 1–6. [Google Scholar]
- Buckley, C.; O’Reilly, M.A.; Whelan, D.; Farrell, A.V.; Clark, L.; Longo, V.; Gilchrist, M.D.; Caulfield, B. Binary classification of running fatigue using a single inertial measurement unit. In Proceedings of the 2017 IEEE 14th International Conference on Wearable and Implantable Body Sensor Networks (BSN), Eindhoven, The Netherlands, 9–12 May 2017; pp. 197–201. [Google Scholar]
- Crema, C.; Depari, A.; Flammini, A.; Sisinni, E.; Haslwanter, T.; Salzmann, S. IMU-based solution for automatic detection and classification of exercises in the fitness scenario. In Proceedings of the 2017 IEEE Sensors Applications Symposium (SAS), Glassboro, NJ, USA, 13–15 March 2017; pp. 1–6. [Google Scholar]
- Cust, E.E.; Sweeting, A.J.; Ball, K.; Robertson, S. Machine and deep learning for sport-specific movement recognition: A systematic review of model development and performance. J. Sports Sci. 2019, 37, 568–600. [Google Scholar] [CrossRef]
- Davey, N.; Anderson, M.; James, D.A. Validation trial of an accelerometer-based sensor platform for swimming. Sports Technol. 2008, 1, 202–207. [Google Scholar] [CrossRef]
- Groh, B.H.; Reinfelder, S.J.; Streicher, M.N.; Taraben, A.; Eskofier, B.M. Movement prediction in rowing using a Dynamic Time Warping based stroke detection. In Proceedings of the 2014 IEEE Ninth International Conference on Intelligent Sensors, Sensor Networks and Information Processing (ISSNIP), Singapore, 21–24 April 2014; pp. 1–6. [Google Scholar]
- Hachaj, T.; Piekarczyk, M.; Ogiela, M. Human actions analysis: Templates generation, matching and visualization Applied to motion capture of highly-skilled karate athletes. Sensors 2017, 17, 2590. [Google Scholar] [CrossRef]
- Jensen, U.; Prade, F.; Eskofier, B.M. Classification of kinematic swimming data with emphasis on resource consumption. In Proceedings of the 2013 IEEE International Conference on Body Sensor Networks, Cambridge, MA, USA, 6–9 May 2013; pp. 1–5. [Google Scholar]
- Karmaker, D.; Chowdhury, A.Z.M.E.; Miah, M.S.U.; Imran, M.A.; Rahman, M.H. Cricket shot classification using motion vector. In Proceedings of the 2015 Second International Conference on Computing Technology and Information Management (ICCTIM), Johor, Malaysia, 21–23 April 2015; pp. 125–129. [Google Scholar]
- Khan, A.; Nicholson, J.; Plötz, T. Activity recognition for quality assessment of batting shots in cricket using a hierarchical representation. Proc. ACM Interact. Mob. Wearable Ubiquitous Technol. 2017, 1, 1–31. [Google Scholar] [CrossRef]
- Kos, M.; Zenko, J.; Vlaj, D.; Kramberger, I. Tennis stroke detection and classification using miniature wearable IMU device. In Proceedings of the 2016 International Conference on Systems, Signals and Image Processing (IWSSIP), Bratislava, Slovakia, 23–25 May 2016; pp. 1–4. [Google Scholar]
- McGrath, J.W.; Neville, J.; Stewart, T.; Cronin, J. Cricket fast bowling detection in a training setting using an inertial measurement unit and machine learning. J. Sports Sci. 2019, 37, 1220–1226. [Google Scholar] [CrossRef]
- Mooney, R.; Corley, G.; Godfrey, A.; Quinlan, L.; ÓLaighin, G. Inertial sensor technology for elite swimming performance analysis: A systematic review. Sensors 2016, 16, 18. [Google Scholar] [CrossRef]
- Ohgi, Y.; Kaneda, K.; Takakura, A. Sensor data mining on the cinematical characteristics of the competitive swimming. Procedia Eng. 2014, 72, 829–834. [Google Scholar] [CrossRef]
- O’Reilly, M.A.; Whelan, D.F.; Ward, T.E.; Delahunt, E.; Caulfield, B.M. Classification of deadlift biomechanics with wearable inertial measurement units. J. Biomech. 2017, 58, 155–161. [Google Scholar] [CrossRef]
- O’Reilly, M.; Whelan, D.; Chanialidis, C.; Friel, N.; Delahunt, E.; Ward, T.; Caulfield, B. Evaluating squat performance with a single inertial measurement unit. In Proceedings of the 2015 IEEE 12th International Conference on Wearable and Implantable Body Sensor Networks (BSN), Cambridge, MA, USA, 9–12 June 2015; pp. 1–6. [Google Scholar]
- Rawashdeh, S.; Rafeldt, D.; Uhl, T. Wearable IMU for shoulder injury prevention in overhead sports. Sensors 2016, 16, 1847. [Google Scholar] [CrossRef]
- Sharma, A.; Arora, J.; Khan, P.; Satapathy, S.; Agarwal, S.; Sengupta, S.; Mridha, S.; Ganguly, N. CommBox: Utilizing sensors for real-time cricket shot identification and commentary generation. In Proceedings of the 2017 9th International Conference on Communication Systems and Networks (COMSNETS), Bengaluru, India, 4–8 January 2017; pp. 427–428. [Google Scholar]
- Siirtola, P.; Laurinen, P.; Roning, J.; Kinnunen, H. Efficient accelerometer-based swimming exercise tracking. In Proceedings of the 2011 IEEE Symposium on Computational Intelligence and Data Mining (CIDM), Paris, France, 11–15 April 2011; pp. 156–161. [Google Scholar]
- Soekarjo, K.M.W.; Orth, D.; Warmerdam, E. Automatic classification of strike techniques using limb trajectory data. In Proceedings of the 2018 Workshop on Machine Learning and Data Mining for Sports Analytics, Dublin, Ireland, 10 September 2018. [Google Scholar]
- Steven Eyobu, O.; Han, D. Feature representation and data augmentation for human activity classification based on wearable IMU sensor data using a deep LSTM neural network. Sensors 2018, 18, 2892. [Google Scholar] [CrossRef]
- Wang, P.; Li, W.; Li, C.; Hou, Y. Action recognition based on joint trajectory maps with convolutional neural networks. Knowl. Based Syst. 2018, 158, 43–53. [Google Scholar] [CrossRef]
- Whelan, D.; O’Reilly, M.; Huang, B.; Giggins, O.; Kechadi, T.; Caulfield, B. Leveraging IMU data for accurate exercise performance classification and musculoskeletal injury risk screening. In Proceedings of the 2016 38th Annual International Conference of the IEEE Engineering in Medicine and Biology Society (EMBC), Orlando, FL, USA, 16–20 August 2016; pp. 659–662. [Google Scholar]
- Whiteside, D.; Cant, O.; Connolly, M.; Reid, M. Monitoring hitting load in tennis using inertial sensors and machine learning. Int. J. Sports Physiol. Perform. 2017, 12, 1212–1217. [Google Scholar] [CrossRef]
- Worsey, M.T.O.; Espinosa, H.G.; Shepherd, J.B.; Thiel, D.V. A systematic review of performance analysis in rowing using inertial sensors. Electronics 2019, 8, 1304. [Google Scholar] [CrossRef]
- Zhang, Z.; Xu, D.; Zhou, Z.; Mai, J.; He, Z.; Wang, Q. IMU-based underwater sensing system for swimming stroke classification and motion analysis. In Proceedings of the 2017 IEEE International Conference on Cyborg and Bionic Systems (CBS), Beijing, China, 17–19 October 2017; pp. 268–272. [Google Scholar]
- Ashker, S.E. Technical and tactical aspects that differentiate winning and losing performances in boxing. Int. J. Perform. Anal. Sport 2011, 11, 356–364. [Google Scholar] [CrossRef]
- Kraemer, W.J.; Fleck, S.J. Optimizing Strength Training: Designing Nonlinear Periodization Workouts; Human Kinetics: Champaign, IL, USA, 2007; ISBN 10-0-7360-6068-5. [Google Scholar]
- Farrow, D.; Robertson, S. Development of a skill acquisition periodisation framework for high-performance Sport. Sports Med. 2017, 47, 1043–1054. [Google Scholar] [CrossRef]
- Catapult Sports. Available online: https://www.catapultsports.com/ (accessed on 14 November 2018).
- Catapult Fundamentals: What Can PlayerLoad Tell Me about Athlete Work? Available online: https://www.catapultsports.com/blog/fundamentals-playerload-athlete-work (accessed on 3 October 2019).
- Marshall, B.; Elliott, B.C. Long-axis rotation: The missing link in proximal-to-distal segmental sequencing. J. Sports Sci. 2000, 18, 247–254. [Google Scholar] [CrossRef]
- Worsey, M.T.O.; Espinosa, H.G.; Shepherd, J.B.; Thiel, D.V. Inertial sensors for performance analysis in combat sports: A systematic review. Sports 2019, 7, 28. [Google Scholar] [CrossRef]
- Move It Swift: Smart Boxing Gloves. Available online: https://www.indiegogo.com/projects/move-it-swift-smart-boxing-gloves?utm_source=KOL&utm_medium=Reedy%20Kewlus&utm_campaign=MoveItSwift#/ (accessed on 6 October 2020).
- Shepherd, J.B.; Thiel, D.V.; Espinosa, H.G. Evaluating the use of inertial-magnetic sensors to assess fatigue in boxing during intensive training. IEEE Sens. Lett. 2017, 1, 1–4. [Google Scholar] [CrossRef]
- Attal, F.; Mohammed, S.; Dedabrishvili, M.; Chamroukhi, F.; Oukhellou, L.; Amirat, Y. Physical human activity recognition using wearable sensors. Sensors 2015, 15, 31314–31338. [Google Scholar] [CrossRef] [PubMed]
- McGrath, J.; Neville, J.; Stewart, T.; Cronin, J. Upper body activity classification using an inertial measurement unit in court and field-based sports: A systematic review. Proc. Inst. Mech. Eng. Part P J. Sports Eng. Technol. 2020. [Google Scholar] [CrossRef]
- Shepherd, J.; James, D.; Espinosa, H.G.; Thiel, D.V.; Rowlands, D. A literature review informing an operational guideline for inertial sensor propulsion measurement in wheelchair court sports. Sports 2018, 9, 55. [Google Scholar] [CrossRef] [PubMed]
- Thiel, D.V.; Shepherd, J.; Espinosa, H.G.; Kenny, M.; Fischer, K.; Worsey, M.; Matsuo, A.; Wada, T. Predicting Ground Reaction Forces in Sprint Running Using a Shank Mounted Inertial Measurement Unit. Proceedings 2018, 6, 34. [Google Scholar] [CrossRef]
- Worsey, M.T.O.; Espinosa, H.G.; Shepherd, J.; Lewerenz, J.; Klodzinski, F.; Thiel, D.V. Features observed using multiple inertial sensors for running track and hard-soft sand running: A comparison study. Proceedings 2020, 49, 12. [Google Scholar] [CrossRef]
- Madgwick, S.O.H.; Harrison, A.J.L.; Vaidyanathan, R. Estimation of IMU and MARG orientation using a gradient descent algorithm. In Proceedings of the 2011 IEEE International Conference on Rehabilitation Robotics, Zurich, Switzerland, 29 June–1 July 2011; pp. 1–7. [Google Scholar]
- Wada, T.; Nagahara, R.; Gleadhill, S.; Ishizuka, T.; Ohnuma, H.; Ohgi, Y. Measurement of pelvic orientation angles during sprinting using a single inertial sensor. Proceedings 2020, 49, 10. [Google Scholar] [CrossRef]
- Shepherd, J.B.; Giblin, G.; Pepping, G.-J.; Thiel, D.; Rowlands, D. Development and validation of a single wrist mounted inertial sensor for biomechanical performance analysis of an elite netball shot. IEEE Sens. Lett. 2017, 1, 1–4. [Google Scholar] [CrossRef]
- Schuldhaus, D.; Zwick, C.; Körger, H.; Dorschky, E.; Kirk, R.; Eskofier, B.M. Inertial sensor-based approach for shot/pass classification during a soccer match. In Proceedings of the 21st ACM KDD Workshop on Large-Scale Sports Analytics, Sydney, Australia, 10–13 August 2015; pp. 1–4. [Google Scholar]
- Anand, A.; Sharma, M.; Srivastava, R.; Kaligounder, L.; Prakash, D. Wearable motion sensor based analysis of swing sports. In Proceedings of the 2017 16th IEEE International Conference on Machine Learning and Applications (ICMLA), Cancun, Mexico, 18–21 December 2017; pp. 261–267. [Google Scholar]
- Ó Conaire, C.; Connaghan, D.; Kelly, P.; O’Connor, N.E.; Gaffney, M.; Buckley, J. Combining inertial and visual sensing for human action recognition in tennis. In Proceedings of the First ACM International Workshop on Analysis and Retrieval of Tracked Events and Motion in Imagery Streams—ARTEMIS ’10, Firenze, Italy, 25–29 October 2010; p. 51. [Google Scholar]
- Kautz, T.; Groh, B.H.; Hannink, J.; Jensen, U.; Strubberg, H.; Eskofier, B.M. Activity recognition in beach volleyball using a Deep Convolutional Neural Network: Leveraging the potential of Deep Learning in sports. Data Min. Knowl. Discov. 2017, 31, 1678–1705. [Google Scholar] [CrossRef]
- Abdi, H.; Williams, L.J. Principal component analysis. Wiley Interdiscip. Rev. Comput. Stat. 2010, 2, 433–459. [Google Scholar] [CrossRef]
- Pedregosa, F.; Varoquaux, G.; Gramfort, A.; Michel, V.; Thirion, B.; Grisel, O.; Blondel, M.; Prettenhofer, P.; Weiss, R.; Dubourg, V.; et al. Scikit-learn: Machine learning in python. J. Mach. Learn. Res. 2011, 12, 2825–2830. [Google Scholar]
- McKinney, W. Data Structures for Statistical Computing in Python. In Proceedings of the 9th Python in Science Conference (SciPy 2010), Austin, TX, USA, June 28–July 3 2010; pp. 56–61. [Google Scholar]
- Scikit-Learn: Machine Learning in Python. Available online: https://scikit-learn.org/stable/index.html (accessed on 6 October 2020).
- Hahn, A.G.; Helmer, R.J.N.; Kelly, T.; Partridge, K.; Krajewski, A.; Blanchonette, I.; Barker, J.; Bruch, H.; Brydon, M.; Hooke, N.; et al. Development of an automated scoring system for amateur boxing. Procedia Eng. 2010, 2, 3095–3101. [Google Scholar] [CrossRef]


Publisher’s Note: MDPI stays neutral with regard to jurisdictional claims in published maps and institutional affiliations. |
© 2020 by the authors. Licensee MDPI, Basel, Switzerland. This article is an open access article distributed under the terms and conditions of the Creative Commons Attribution (CC BY) license (http://creativecommons.org/licenses/by/4.0/).