Article

Experimental and Theoretical Studies on DNA Binding and Anticancer Activity of Nickel(II) and Zinc(II) Complexes with N– (8–Quinolyl) Salicylaldimine Schiff Base Ligands

by
Bussaba Pinchaipat
1,2,*,
Ratanon Chotima
2,
Malinee Promkatkaew
1,
Sunan Kitjaruwankul
1,
Kittipong Chainok
3 and
Teerawat Khudkham
2
1
Department of Basic Science and Physical Education, Faculty of Science at Sriracha, Kasetsart University Sriracha Campus, Chonburi 20230, Thailand
2
Department of Chemistry, Faculty of Science, Naresuan University, Phitsanulok 65000, Thailand
3
Multifunctional Crystalline Materials and Applications, Materials and Textile Technology, Faculty of Science and Technology, Thammasat University, Khlong Luang, Pathum Thani 12121, Thailand
*
Author to whom correspondence should be addressed.
Chemistry 2024, 6(4), 618-639; https://doi.org/10.3390/chemistry6040037
Submission received: 30 June 2024 / Revised: 19 July 2024 / Accepted: 23 July 2024 / Published: 28 July 2024
(This article belongs to the Section Bioinorganics)

Abstract

:
Transition metal complexes of nickel(II) with 5–bromo–N–(8–quinolyl)salicylaldimine (HqsalBr, HL1); [Ni(qsalBr)2] (1) and 3,5–dibromo–N–(8–quinolyl)salicylaldimine (HqsalBr2, HL2); [Ni(qsalBr2)2] (3) including zinc(II) complex with HL1, [Zn(qsalBr)2] (2), have been synthesized and successfully characterized using various techniques, namely IR, NMR, mass spectrometry, thermogravimetric analysis (TGA), and single crystal X–ray crystallography. DFT calculations were employed to examine the structural and electronic parameters of the complexes at their optimized geometries. The complexes showed strong DNA-binding activities, assessed by UV-Vis and fluorescence spectroscopy, primarily through intercalation. Molecular docking investigations were carried out to provide profound insights into the interaction mechanisms of these complexes with DNA and lung cancer cells. These computational studies revealed that [Ni(qsalBr2)2] (3) exhibits the most favorable negative binding energies, −9.1 kcal/mol with DNA and −9.3 kcal/mol with cancer cells, facilitated by hydrogen bonding and hydrophobic interactions. Furthermore, the in vitro anticancer activity was evaluated against the A549 human lung adenocarcinoma cell line, with [Zn(qsalBr)2] (2) exhibiting the highest potency against this cancer cell line.

Graphical Abstract

1. Introduction

Schiff bases, known for their versatility as ligands through the azomethine N–atom, are synthesized via the reaction of amines with substituted salicylaldehydes. Additionally, these N–containing ligands have been intensively used as chelating ligands in coordination chemistry, serving as bidentate N,O–, tridentate N,O,O–, N,O,N–, and tetradentate N,N,O,O– donors [1,2,3,4,5,6,7,8]. Consequently, transition metal complexes of these ligands have found applications in various fields, including sensors [9,10], catalysts for organic synthesis [11,12], and some biological activities [13,14]. The biological and physical properties of transition metal Schiff base complexes are influenced by the coordinating characteristics of the ligands towards the transition metal centers. A wide range of biological activities, including antibacterial, antifungal, antimicrobial, and anticancer activities, have been exhibited by different families of nickel(II) and zinc(II) complexes. Schiff base metal complexes also aid in the design of more effective anticancer agents, potentially with fewer side effects than traditional platinum-based drugs [15,16]. DNA serves as a valuable tool in studying the interaction of transition metal complexes with biological molecules. Literature reviews have indicated that protein and enzyme synthesis involved in the replication and transcription of hereditary information carried by DNA [17]. Hence, nucleic acids can be utilized to design the effective anticancer agents [18], as DNA is the primary target for these complexes to bind with. The interaction between DNA and these substrates causes DNA damage, preventing cell division and leading to cell death [19,20]. Several attempts have been made to investigate the use of Schiff base complexes for inhibiting cancer cell growth, especially Schiff base metal complexes in anticancer and antibacterial evaluations [21]. In Thailand, lung cancer incidence has been rising, reflecting global trends. This makes it a critical area for research within the country. Apart from smoking, which is a primary risk factor for lung cancer, the increase in industrialization in Thailand has led to broader exposure to pollutants and hazards which contribute to lung cancer risk [22].
In the present study, 5–bromo–N–(8–quinolyl)salicylaldimine (HqsalBr, HL1) and 3,5–dibromo–N–(8–quinolyl)salicylaldimine (HqsalBr2, HL2), derived from the condensation of salicylaldehyde with 8–aminoquinoline, along with their complexes (1, 2, and 3) where the metal atoms are nickel(II) and zinc(II), were synthesized and characterized using spectroscopic techniques and X–ray crystallography. The biological study with calf thymus DNA (CT–DNA), the minimum inhibitory concentration (IC50) in anticancer activity, and the molecular docking of Schiff base ligands and their complexes were also reported.

2. Materials and Methods

2.1. Materials

All chemicals used were of analytical grade and of the highest purity available. They included 8–aminoquinoline (Sigma, Singapore), 5–bromosalicylaldehyde (Sigma, Singapore), and 3,5–dibromosalicylaldehyde (Sigma, Singapore). The metal salts used were Ni(OAc)2·4H2O (Sigma, Singapore) and Zn(NO3)2·6H2O (Sigma, Singapore). Organic solvents, namely diisopropyl ether, dichloromethane (DCM), tetrahydrofuran (THF), methanol, and ethanol, were used without further purification unless otherwise stated. Protein-free calf thymus DNA (CT–DNA), sourced from Invitrogen, was kept at temperatures between 0 and 4 °C. The purity of this DNA was verified by assessing its absorbance at 260 nm. Tris(hydroxymethyl) aminomethane hydrochloride (Tris–HCl) buffer (5 mM Tris-HCl, 50 mM NaCl, pH of 7.2) was used for preparing DNA stock solutions. Ethidium bromide (EB) was purchased from Loba Chemie and used without further purification. The A549 cell line (human lung carcinoma) was kindly provided by National Center for Genetic Engineering and Biotechnology (BIOTEC), National Science and Technology Development Agency (NSTDA), Thailand.. Fetal bovine serum (FBS) and 3–(4,5–dimethylthiazol–2–yl) –2,5–diphenyltetrazolium bromide (MTT) were supplied by Sigma–Aldrich and Tokyo Chemical Industry (Bangkok, Thailand), respectively. Minimum essential medium Eagle (MEM), Trypsin–EDTA, and penicillin–streptomycin (Pen–Strep) were purchased from Gibco (Bangkok, Thailand).

2.2. Instruments

IR spectra were obtained through the ATR technique using a Perkin–Elmer FT–IR spectrophotometer, model 1650, covering the wavenumber range of 4000–400 cm−1. 1H NMR spectra were collected with a 400 MHz Bruker instrument. Spectrophotometric measurements in solution were conducted using a UV–Vis spectrophotometer (SPECORD® 200 PLUS, Analytik Jena, Jena, Germany). Mass spectrometry was conducted using an electrospray ionization (ESI) method on an Agilent 6540 LC/MS system (United States). Thermogravimetric analysis was carried out using simultaneous thermogravimetry and differential scanning calorimetry (LINSEIS, STA PT 1600, Selb, Germany). The binding study with CT–DNA was conducted by absorption titration using a UV–Vis spectrophotometer (SPECORD® 200 PLUS, Analytik Jena, Jena, Germany) and fluorescence titration using a spectrofluorometer FluoroMax–4 (HORIBA Scientific, Kyoto, Japan). The absorbance of forming formazan at 570 nm was measured using an EnSpire Multimode Plate Reader (PerkinElmer, MA, USA).
The molecular structure of [Ni(qsalBr2)2] (3) was determined by single crystal X–ray diffraction using a Bruker D8 VENTURE diffractometer. The crystal was irradiated with MoKα radiation (λ = 0.71073 Å). The structure was solved by Olex2 1.5 with ShelXS and the anisotropic thermal parameters were refined to all non-hydrogen atoms. Hydrogen atoms were inserted at calculated positions using a riding model. The Mercury 3.10 programs were utilized to prepare the materials and molecular graphics for publication.

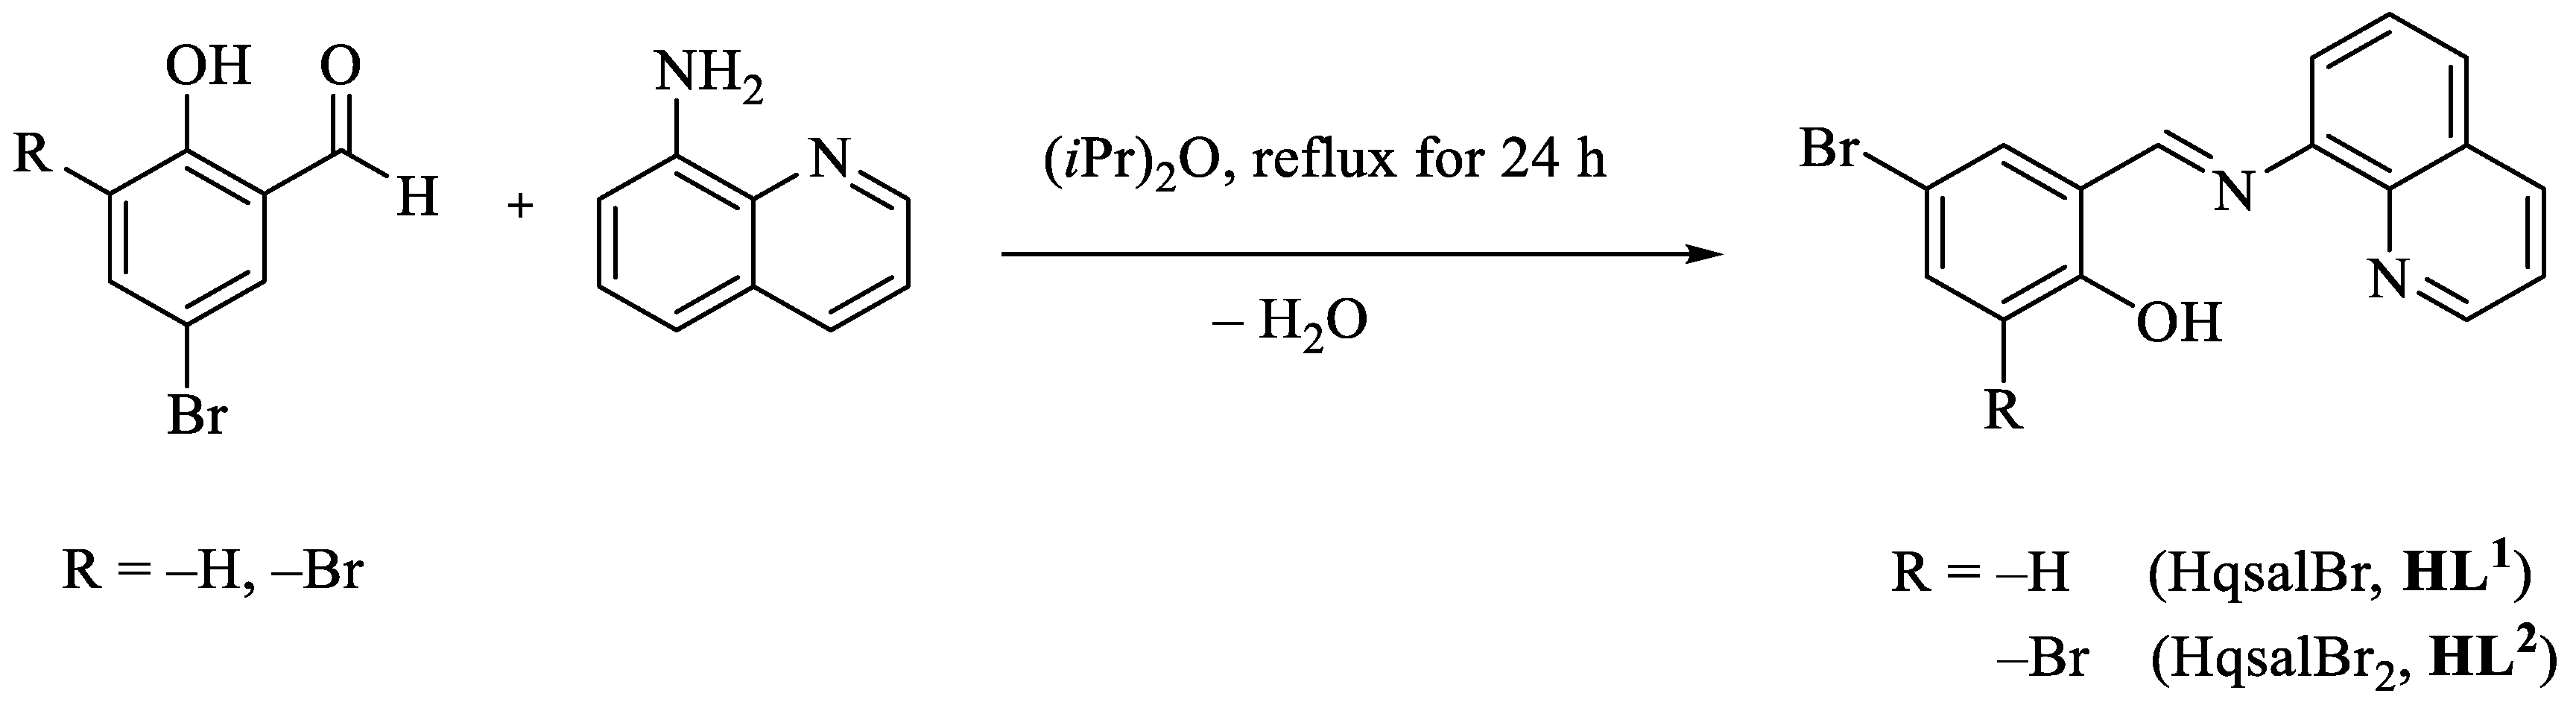
2.3. Synthesis of Schiff Base Ligands

5–bromo–N–(8–quinolyl)salicylaldimine (HqsalBr, HL1) was synthesized according to the literature (68.0%) [23]. 3,5–dibromo–N–(8–quinolyl)salicylaldimine (HqsalBr2, HL2) was synthesized from condensing 8–aminoquinoline (4 mmol, 579.1 mg) dissolved in hot di-isopropyl ether (20 mL, 60 °C) with 3,5–dibromosalicylaldehyde (4 mmol, 578.0 mg). The reaction mixture was refluxed for 24 h. The slow evaporation of the solution to approximately 5 mL yielded red crystals of the desired product. The product was filtered, washed with ethanol several times, and dried at room temperature (86.9%). The reactions are presented in Scheme 1.

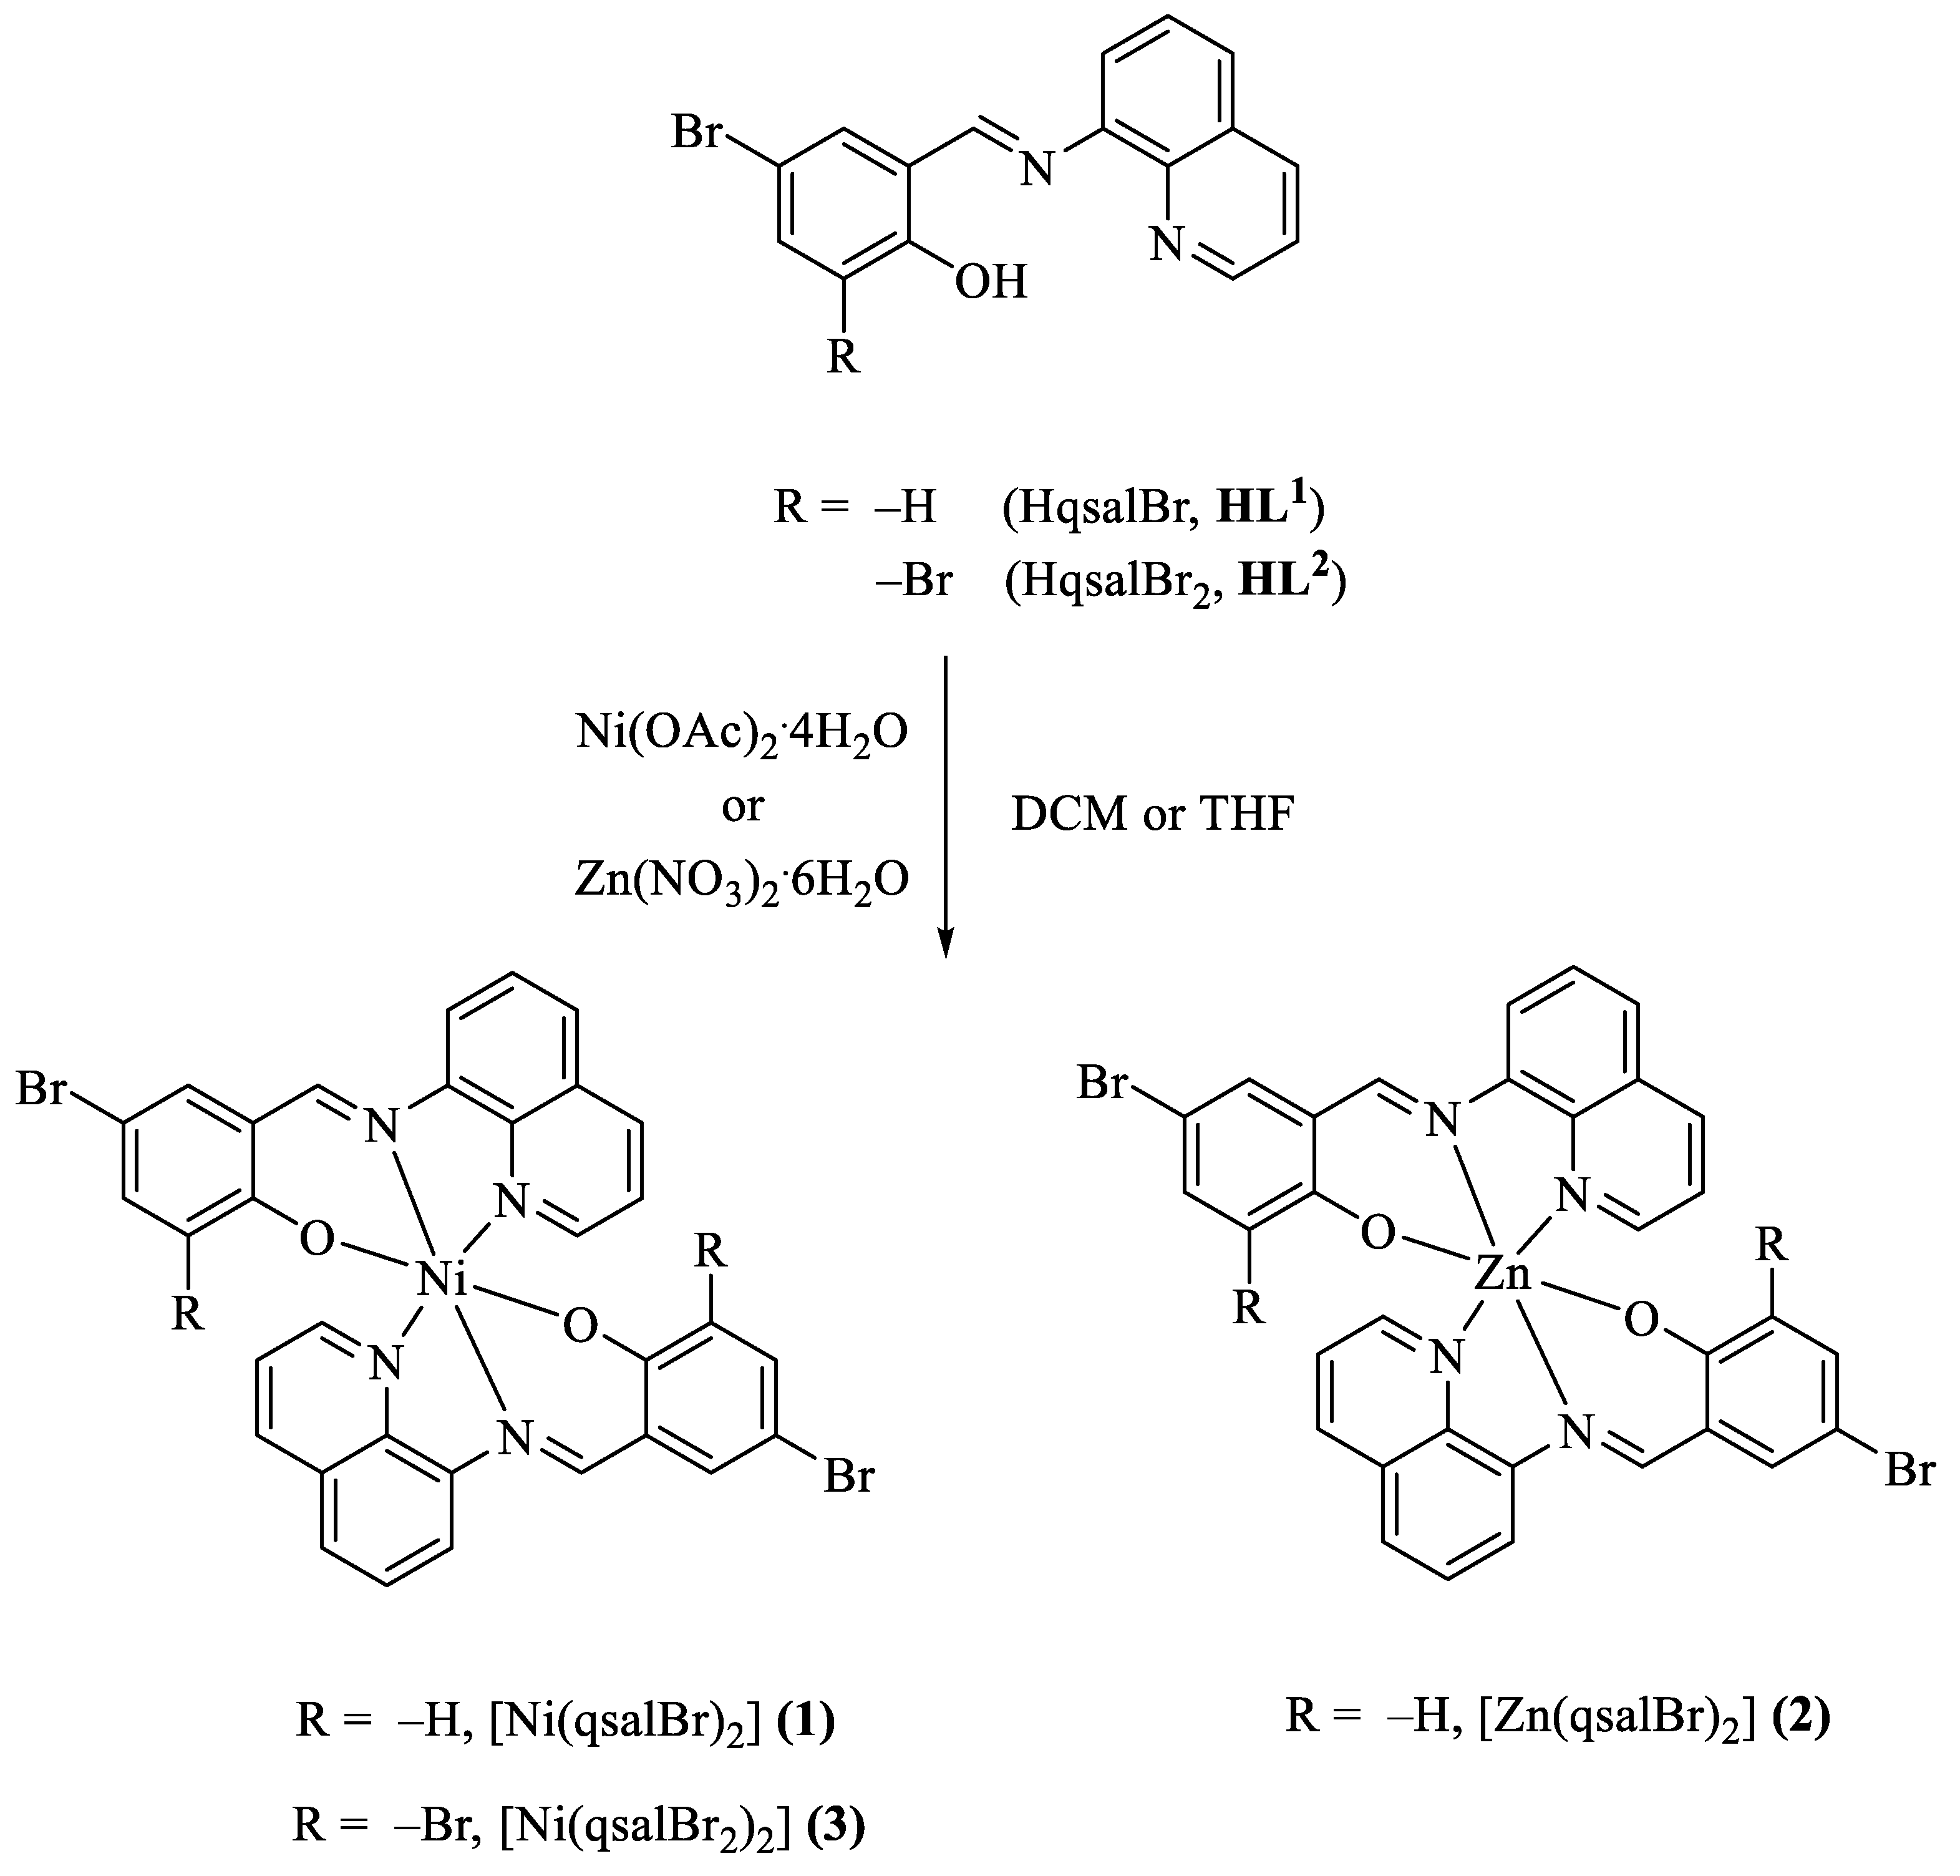
2.4. Synthesis of Complexes

2.4.1. Synthesis of Complex [Ni(qsalBr)2] (1)

The metal salt Ni(OAc)2·4H2O (0.25 mmol, 62.7 mg) dissolved in methanol (1.5 mL) was added dropwise to a stirred solution of HL1 (0.50 mmol, 163.8 mg) in DCM (3.5 mL). The mixture was refluxed for 4 h, leading to the formation of a precipitate. The product was separated by filtration, washed with ethanol several times, and dried at room temperature (96.7%).

2.4.2. Synthesis of Complex [Zn(qsalBr)2] (2)

Complex [Zn(qsalBr)2] was synthesized using the same procedure as complex 1, with Zn(NO3)2·6H2O (0.25 mmol, 74.6 mg) substituted for Ni(OAc)2·4H2O (85.9%).

2.4.3. Synthesis of Complex [Ni(qsalBr2)2] (3)

The metal salt of Ni(OAc)2·4H2O (0.25 mmol, 62.3 mg) dissolved in methanol (1.5 mL) was added dropwise to a stirred solution of HL2 (0.50 mmol, 203.2 mg) in THF (5.5 mL). The mixture was refluxed for 4 h, resulting in the formation of a precipitate. The product was separated by filtration, washed with ethanol several times, and dried at room temperature (94.4%). Single crystals of complex 3 were obtained in a reddish-yellow color from recrystallization of the product in DCM [24].
The reactions for the synthesis of all complexes are presented in Scheme 2.

2.5. DFT Calculations

The optimized geometries and molecular properties of ligands HL1 and HL2, along with their corresponding complexes with nickel(II) and zinc(II) metal ions, were investigated. All structures were fully optimized using the hybrid DFT (B3LYP) [25,26] functional with the 6–311G(d,p) [27] basis set for the H, C, N, O, and Br atoms. The Los Alamos effective core potential (ECP) including relativistic effects plus double atomic orbitals (LANL2DZ) [28,29,30] basis set was employed for the metal center (Ni and Zn atoms). All calculations were performed using the Gaussian 09 suite of programs [31]. The following equations were used to compute the reactivity descriptors: HOMO–LUMO energy gap (ΔE), absolute hardness (η), softness (S, chemical potentials (μ), absolute electronegativity (χ), and global electrophilicity (ω). These were computed using Equations (1)–(6) below [29,30,32], as follows:
ΔE = (ELEH)
η = (ELEH)/2
S = 1/2η
μ = (EL + EH)/2
χ = −μ
ω = μ2/2η

2.6. DNA Binding Study

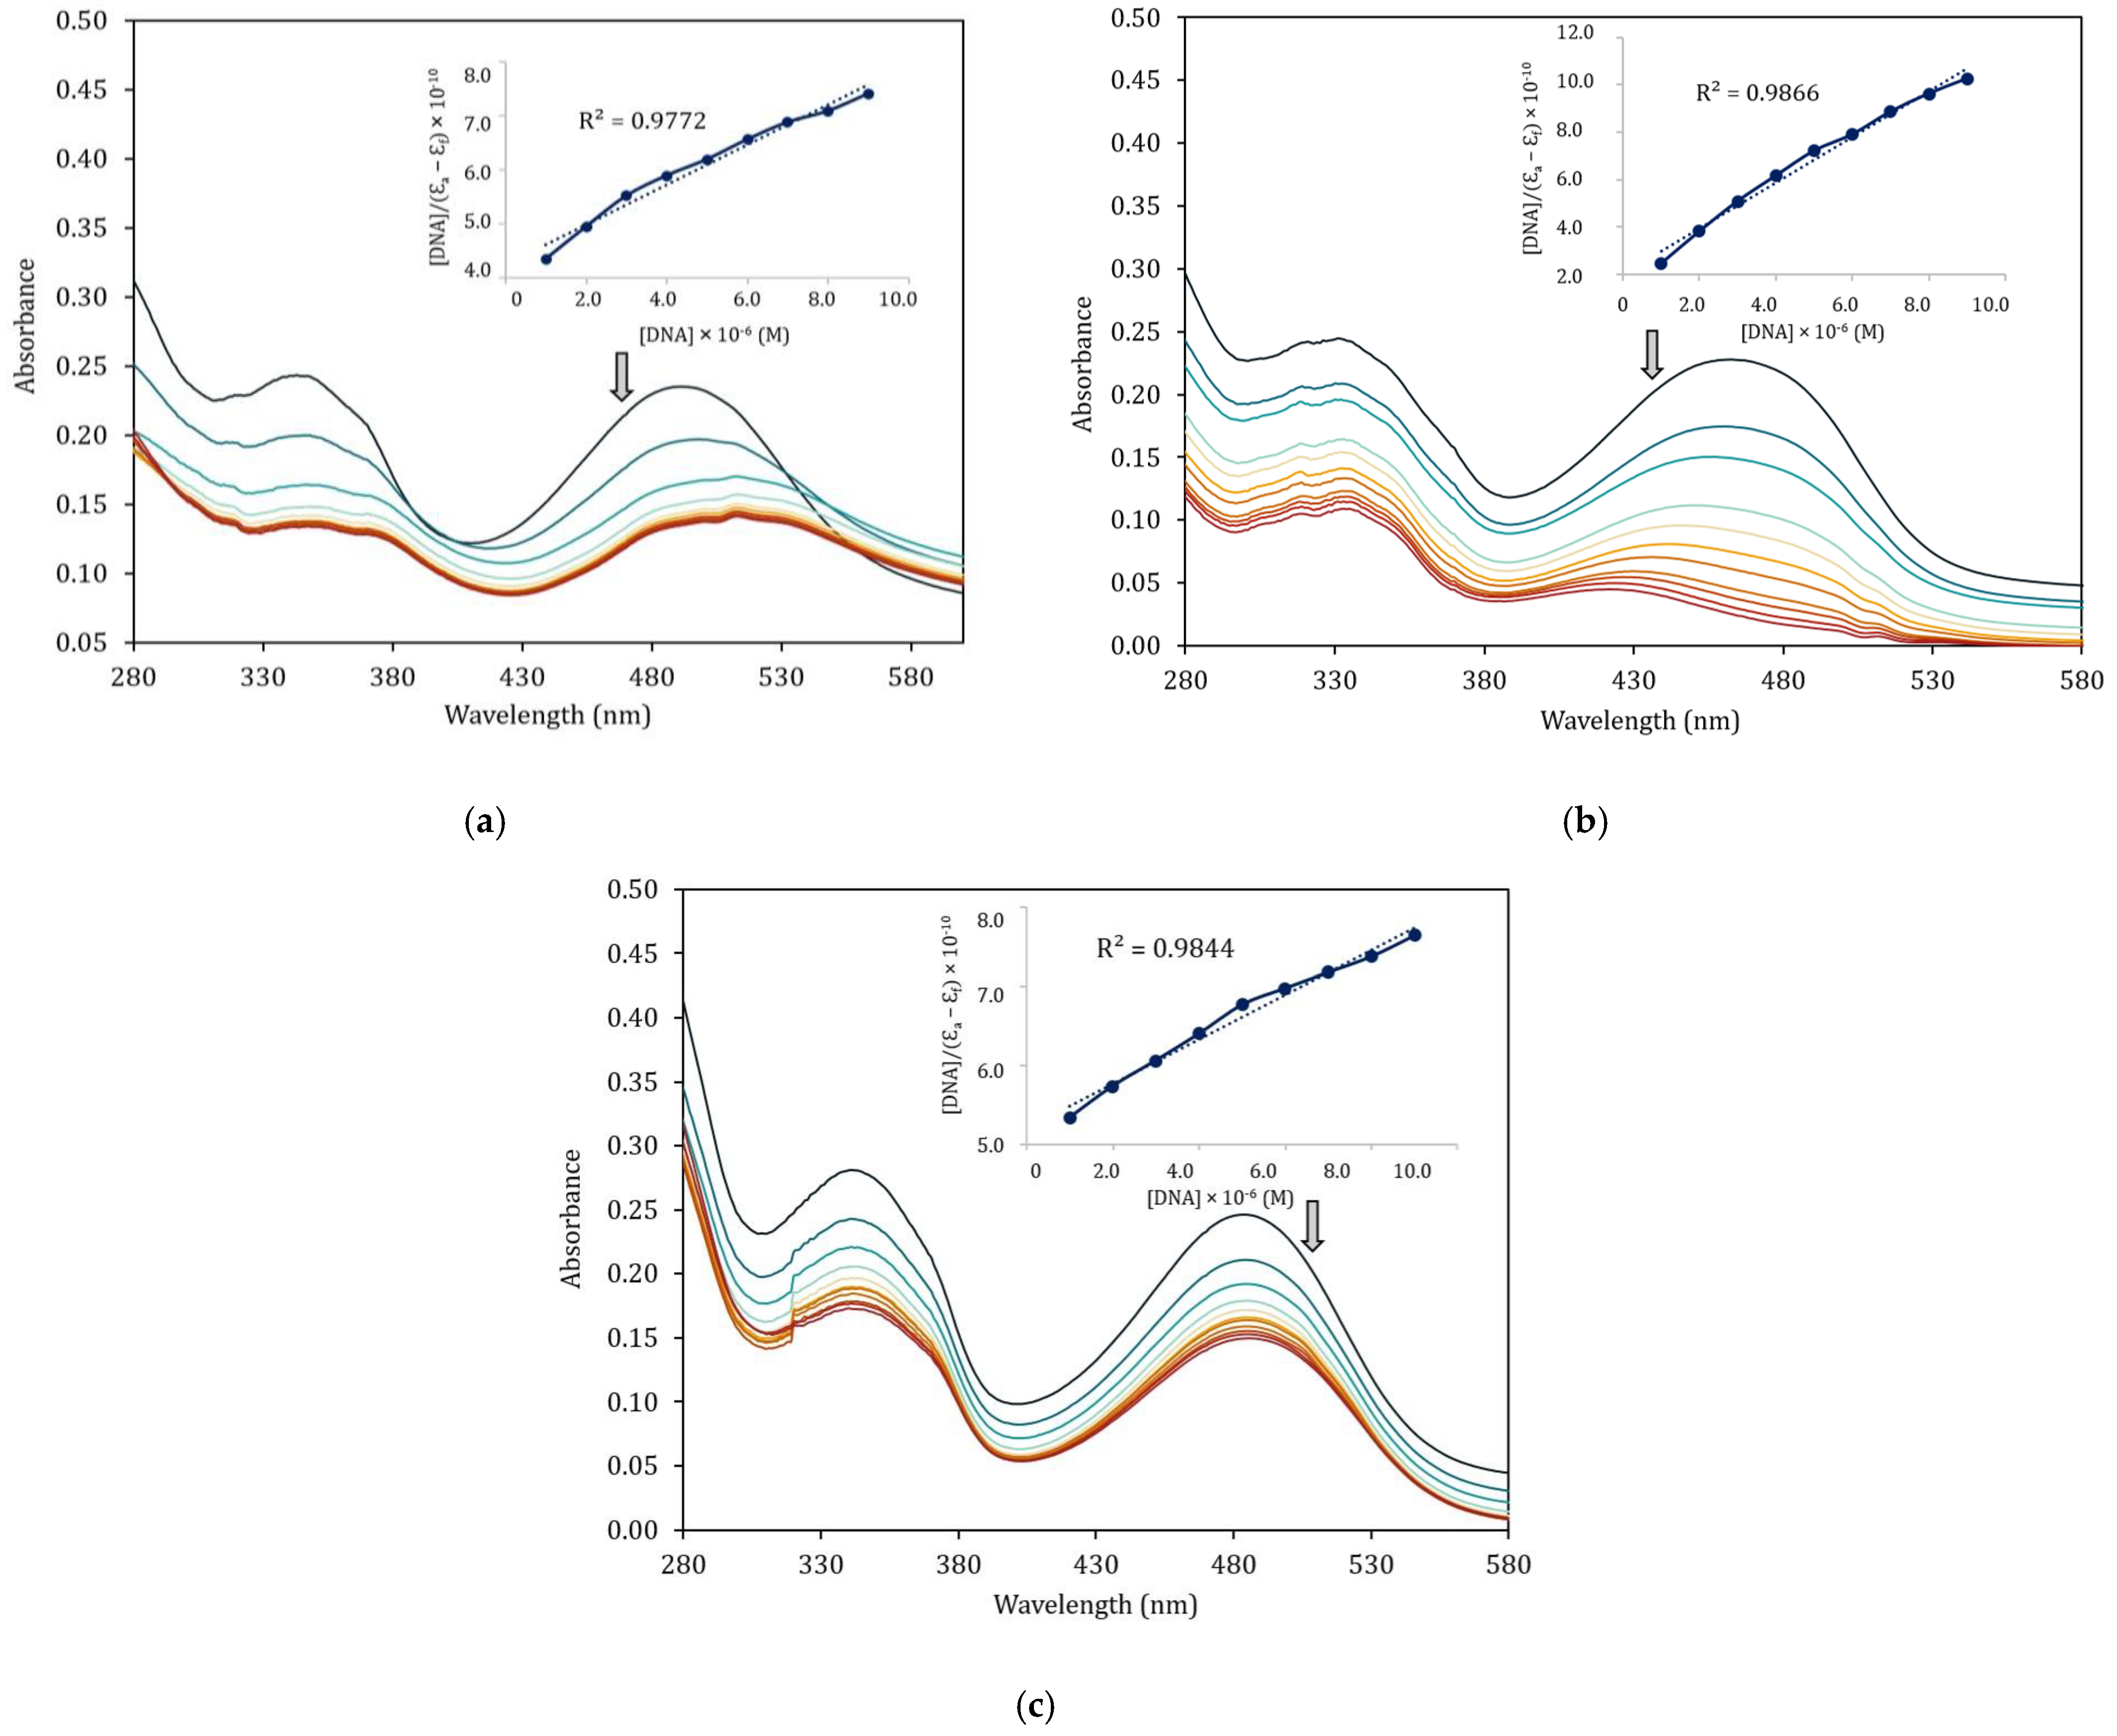
2.6.1. Electronic Absorption Titration

The interaction between the complexes and CT–DNA was assessed using a UV–Vis spectrophotometer, with the absorption spectrum set to scan from 280 to 600 nm. The experimental solutions were prepared by combining a fixed concentration of 50 µM of the complex dissolved in DMSO with different concentrations of CT–DNA, successively added in the presence of a buffer. The range of CT–DNA concentration was 0–10 µM. After each addition, the solution was mixed and allowed to equilibrate for 10 min. A reference cell containing DNA and solvent (at the same concentration as DMSO in the complex solution) was used simultaneously to nullify the absorbance of DNA at the measured wavelength. The binding constant (Kb) of the complexes with CT–DNA was determined from the absorption titration data using the Wolfe–Shimer equation [33].
[DNA]/Ɛa − Ɛf = [DNA]/Ɛb − Ɛf + 1/Kbb − Ɛf)
where [DNA] denotes the concentration of DNA in base pairs and Ɛa, Ɛf, and Ɛb represent the observed absorbance (Aobs) per [complex], the extinction coefficient for unbound Schiff base complexes, and the extinction coefficient for the complexes when fully bound to DNA, respectively. A graph of [DNA]/(Ɛa − Ɛf) plotted against [DNA] allows for the calculation of the binding constant (Kb), determined by the ratio of the graph’s slope to its intercept.

2.6.2. Fluorescence Titration

Emission intensity measurements were recorded on a fluorescence spectrometer with excitation wavelength (λex) and emission wavelength (λem) ranges set at 525 nm and 545–700 nm, respectively. Successive additions in fluorescence experiments were performed by adding Schiff base complexes ranging from 0 to 10 µM to the sample containing 10 µM of CT–DNA in buffer and 4 µM of ethidium bromide. After each addition, the solution was mixed and allowed to equilibrate for 15 min. The quenching efficiency was determined by the linear Stern–Volmer equation [34].
Io/I = 1 + Kqԏo[Q] = 1 + Ksv[Q]
Ksv = Kqԏo
where I and Io represent the emission intensities of the EB–DNA solution in the presence and absence of the quencher (Schiff base complex), respectively; meanwhile, [Q] denotes the concentration of the complex. The ԏo represents the average lifetime of the emitting system without quencher ( 3 ns), and Kq is the quenching constant. Ksv is calculated from the Stern–Volmer plots by the slope of the diagram Fo/F versus [Q], with ԏo [35]. The quenching constants and Stern–Volmer constants of the compounds can be determined according to Equations (8) and (9). Additionally, the number of binding sites (n) were calculated from the Scatchard Equation (10).
log[(Fo − F)/F] = log K + n log[Q]

2.7. Anticancer Study

A549 (lung carcinoma) cells were cultured in modified Eagle’s medium (MEM) supplement with 10% fetal bovine serum (FBS) and 100 unit/mL penicillin-streptomycin, and then incubated in a standard tissue culture incubator at 37 °C and 5% CO2. The culture medium was changed twice a week. Subsequently, 96-well culture plates were seeded with A549 cell at a density of 10,000 cells/100 µL/well and incubated for 12 h to allow cell adherence. The cells were then treated with different concentrations of ligands and complexes (0–100 µM). After a 48 h incubation period, the medium in each well was replaced with 100 µL of MTT solution (0.5 mg/mL in culture medium) and further incubated at 37 °C for 3 h. Following this, the MTT solution was aspirated, and the formed formazan crystals were suspended in 100 µL of DMSO. The absorbance at 570 nm was measured, and the half maximal inhibitory concentration (IC50) was calculated from the plot between %inhibition and log[concentration] using GraphPad Prism8 software. The experiment was performed in triplicate.

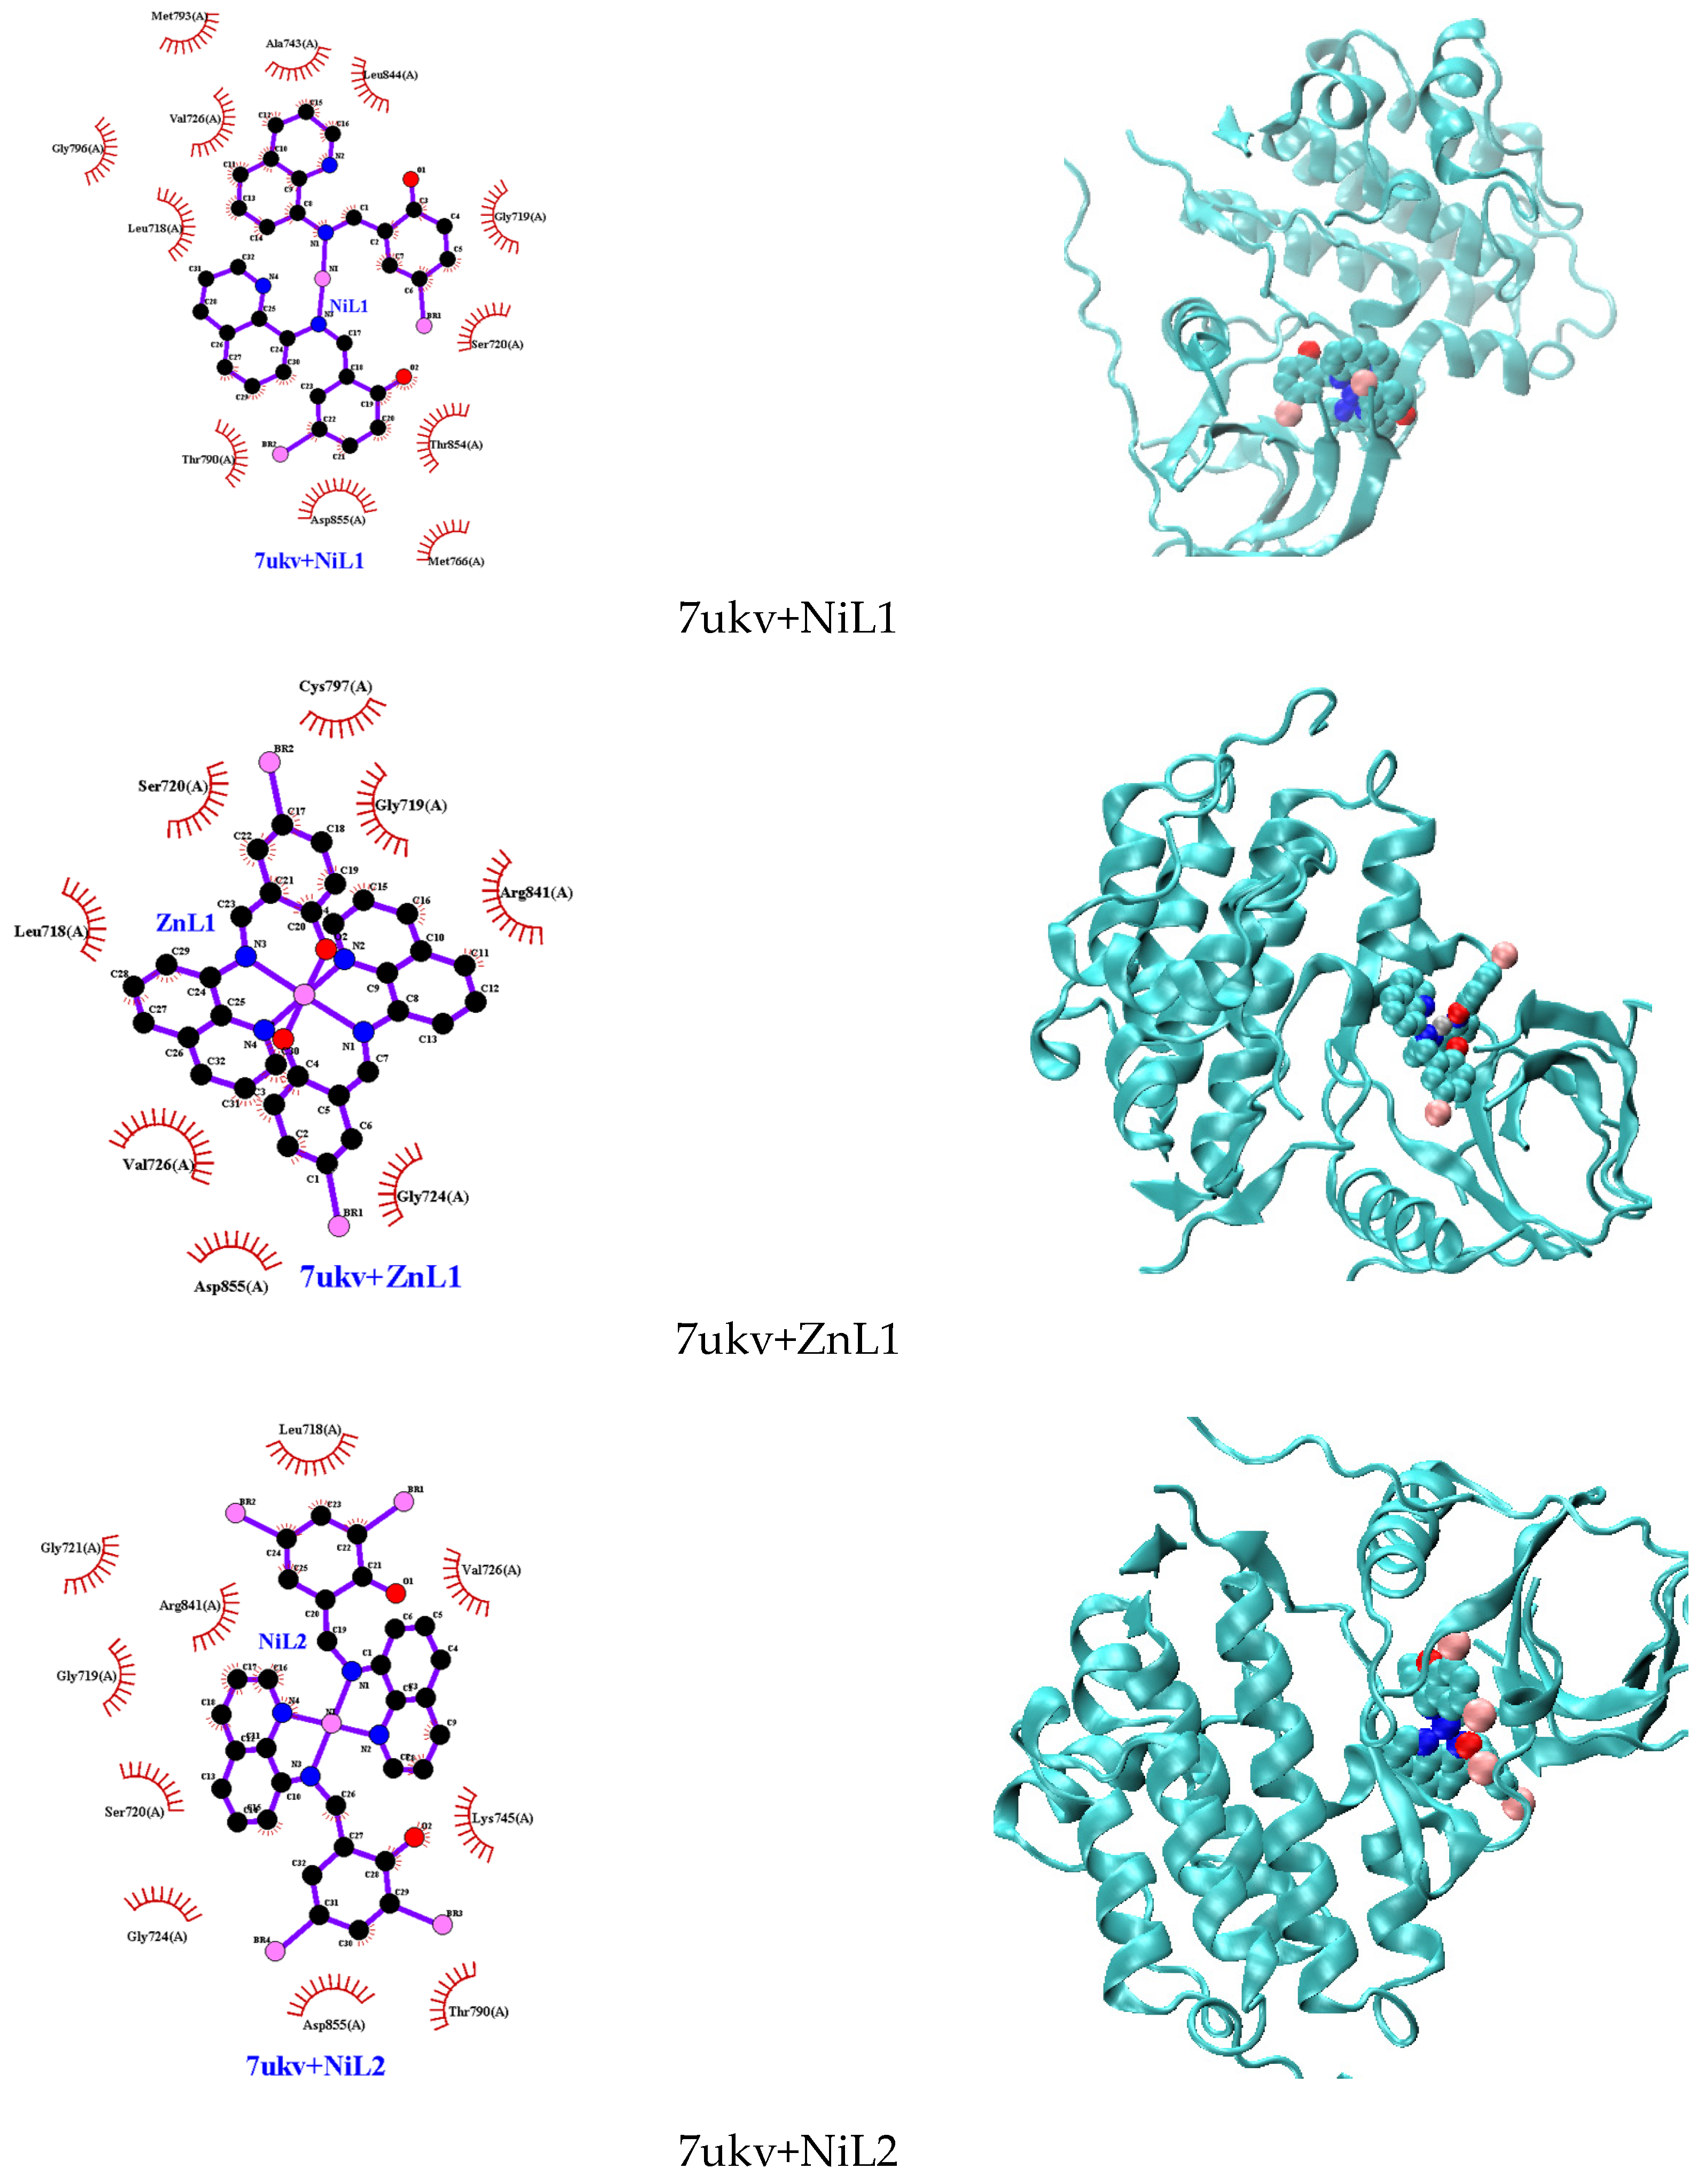
2.8. Molecular Docking

To gain insights into the molecular interactions of the synthesized complexes with DNA and lung cancer cells, the targets of our docking study were downloaded from the Protein Data Bank. These targets included the synthetic DNA dodecamer (PDB id: 1bna) [36] and the epidermal growth factor receptor (EGFR) kinase domain, implicated in non-small cell lung cancer (PDB id: 7ukv) [37]. The docking studies were performed using AutoDock Vina (v.1.1.2), with protein and compound structures prepared using AutoDockTools (ADT v.1.5.7) to convert the PDB files to PDBQT formats containing all information about atom types and charges for both compounds and protein. All docking protocols were executed on the Windows 10 operating system.

3. Results

3.1. IR Spectra

The infrared spectra of ligands and complexes displayed several modes of vibrations with variable intensities in the region of 4000–400 cm−1. The main stretching frequencies of the ligands and their complexes are shown in Table 1.
The stretching of azomethine and quinoline in free Schiff base ligand HL2 was observed at 1607 cm−1 and 1425 cm−1, respectively [23]. These numbers were found at lower frequencies for [Ni(qsalBr2)2] (3) (1604 cm−1 and 1413 cm−1). The observed wavenumbers indicated the coordination of these functional groups towards the metal centers for the complex formation. Additionally, the band at 1283 cm−1 belongs to C–O of the Schiff base ligand and also shifts to 1240 cm−1 in complex 3. The changes in wavenumbers observed in complex 1 and complex 2 with ligand HL1 are also similar to those in the complex of ligand HL2. Moreover, new bands appeared in the spectra of all the complexes in the region of 468–489 cm−1 and 416–426 cm−1 which were assigned to the vibrations of ν(M–O) and ν(M–N), respectively [38].

3.2. UV–Vis Absorption Spectra

The UV–Vis absorption spectra of Schiff base ligands and their complexes with a concentration of 1.0 × 10⁻³ M were recorded in THF solvent within the wavelength range of 300–600 nm at room temperature. The spectra of ligands and complexes are presented in Figure 1.
The free Schiff base ligands HL1 and HL2 displayed moderated absorption at 357 nm and 351 nm, respectively, which can be contributed to the n–π* transition of the azomethine group, whereas the d–d transition also appeared as a broad peak at approximately 475 nm [39]. The stoichiometric ratio between metal ions and Schiff base ligand was determined using Job’s method. All measurements were made at different wavelengths according to the observed λmax (1; 484 nm, 2; 460 nm and 3; 487 nm). The results revealed the mole fraction of 1:2 for metal to ligands. The stability constants of the synthesized complexes were evaluated, and the results are shown in Table 2. Among the synthesized complexes, nickel(II) with d8 electron configuration provided a higher formation constant compared to zinc(II) with d10 electron configuration. Furthermore, the mono–substituted Schiff base ligand also contributed a greater formation constant for the nickel(II) complex. This might be attributed to the steric and electronic effects caused by the bromo–substituent at the meta-position of the azomethine. Such a group might withdraw electron density from the metal to –O, N, N bond, leading to a weaker coordination binding and consequently reducing the formation constant.

3.3. Thermogravimetric Analysis (TGA)

The thermal properties of complexes were characterized using the thermogravimetric analysis (TGA) method in the temperature range of 30–1000 °C (Figure 2). The effects of temperature and the percentage of mass loss are listed in Table 3.
The TGA curve of complex 1 shows the following three decomposition steps: the first stage at the temperature range of 138–467 °C related to the loss of two bromine atoms (found 22.64%; calc. 22.89%), the second stage at 467–685 °C related to the loss of C9H2NO (found 20.48%; calc. 19.78%), and the third stage at 685–1000 °C correlated with the elimination of C20H18N3 (found 43.37%; calc. 42.40%), leaving carbon atoms and NiO as residue (found 13.51%; calc. 14.93%). Complex 2 also exhibited similar decomposition as shown in the TGA curve. Like complexes 1 and 2, complex 3 also exhibited three stages of decomposition. The first step involved the loss of four bromine substitutions on the aromatic ring at the temperature range of 137–467 °C (found 36.33%; calc. 36.54%). The second stage at 467–575 °C was related to the elimination of C18H4N2 (found 27.92%; calc. 28.72%), and the last stage was associated with the loss of the remaining (found 35.75%; calc. 34.74%). Notably, no residue was observed for this compound.

3.4. 1H NMR Spectra

The 1H NMR spectra of HL1 and its zinc(II) complex 2 were determined. In the free ligand, the distinct peak of the azomethine HC=N was observed at 9.10 ppm, and a significant downfield shift of this proton to 9.36 ppm (Figure S7) was detected in complex 2. These results indicated the coordination of the nitrogen of the azomethine to the metal center. The chemical shift at 14.07 ppm, corresponding to the proton of the hydroxyl group (–OH) of HL1, disappeared upon complex formation. The deprotonation of this proton leads to the coordination of the oxygen atom toward the zinc(II) ion. Moreover, chemical shifts in the range of 8.98–6.98 ppm, assigned to protons of the quinoline ring of ligand HL1, also presented significant shifts upon the formation of complex 2. This result could affirm the binding of the nitrogen donor of this heterocyclic aromatic ring to such a metal center.

3.5. Mass Spectra

The mass spectra of the synthesized Schiff bases and their complexes were determined by relative intensity molecular ion peaks at 100 eV. The mass spectra of HL1, HL2, and complexes 13 provided good evidence for the molecular formula, with well-defined signals at m/z (cal.) = 327.01 (327.18) [M]+, 406.91 (406.07) [M]+ (HL1 and HL2), 710.93 (711.13) [M]+, 716.95 (717.71) [M]+, and 868.74 (868.82) [M]+ (complexes 13), respectively.

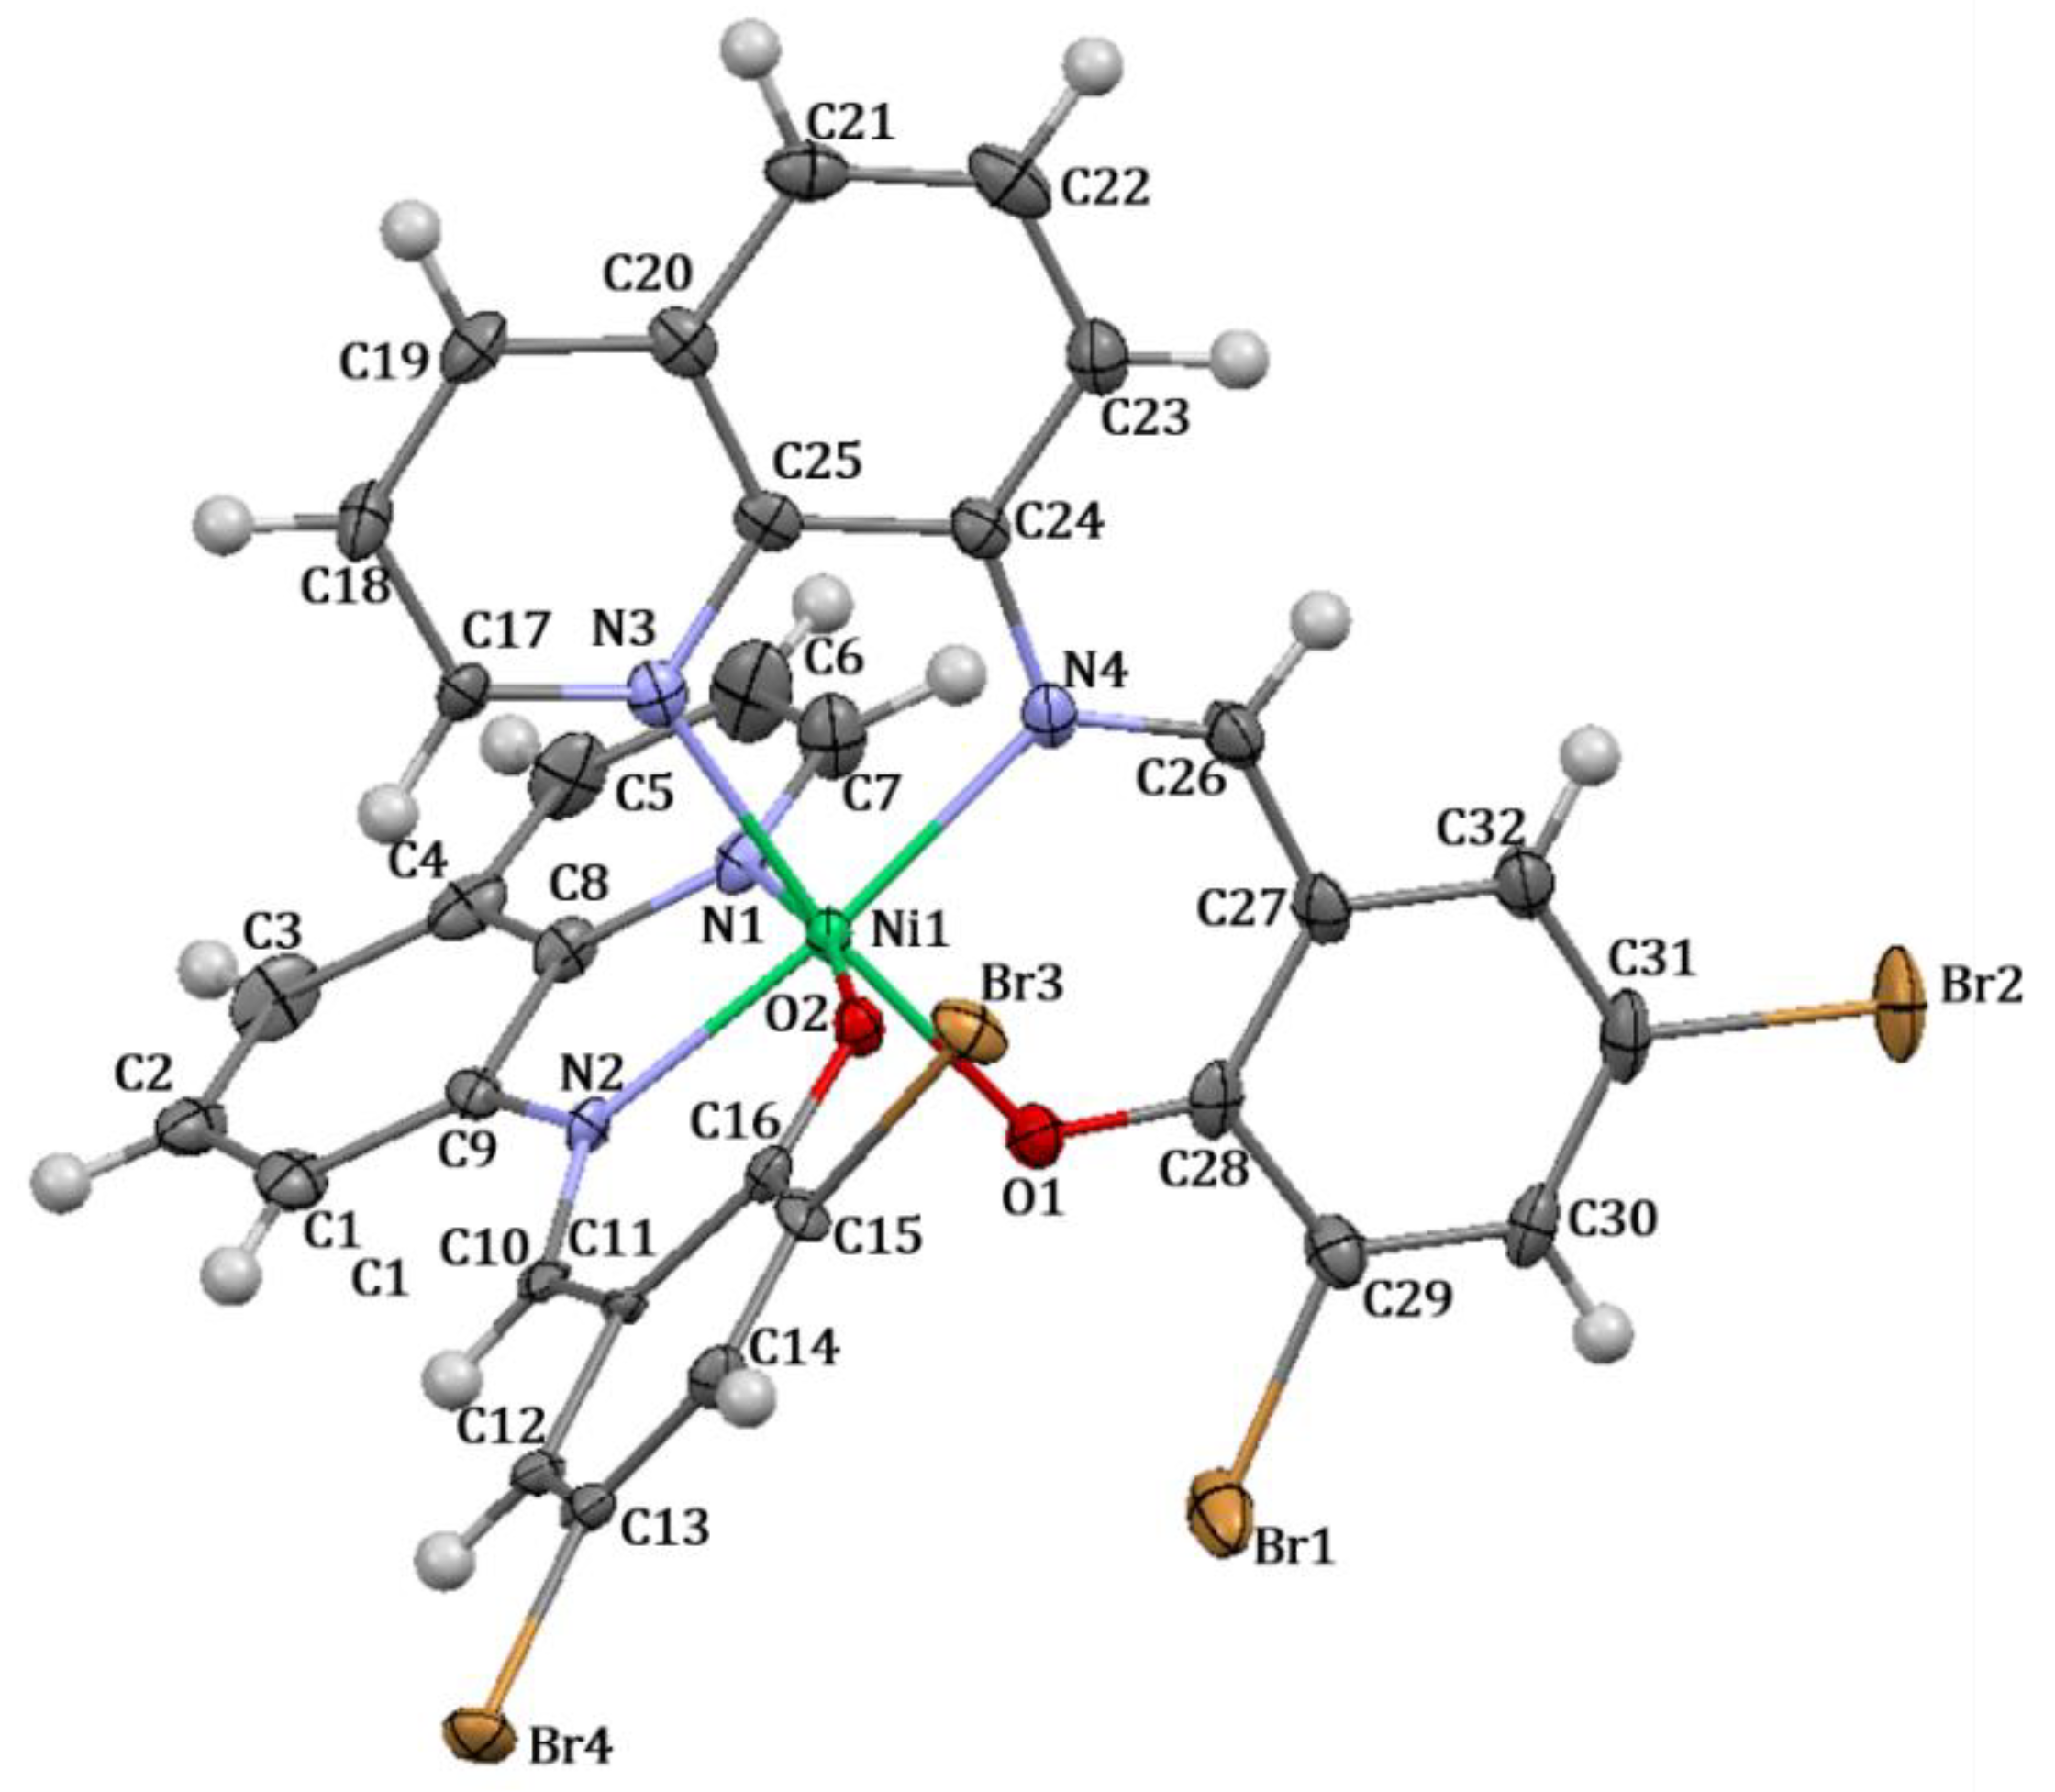
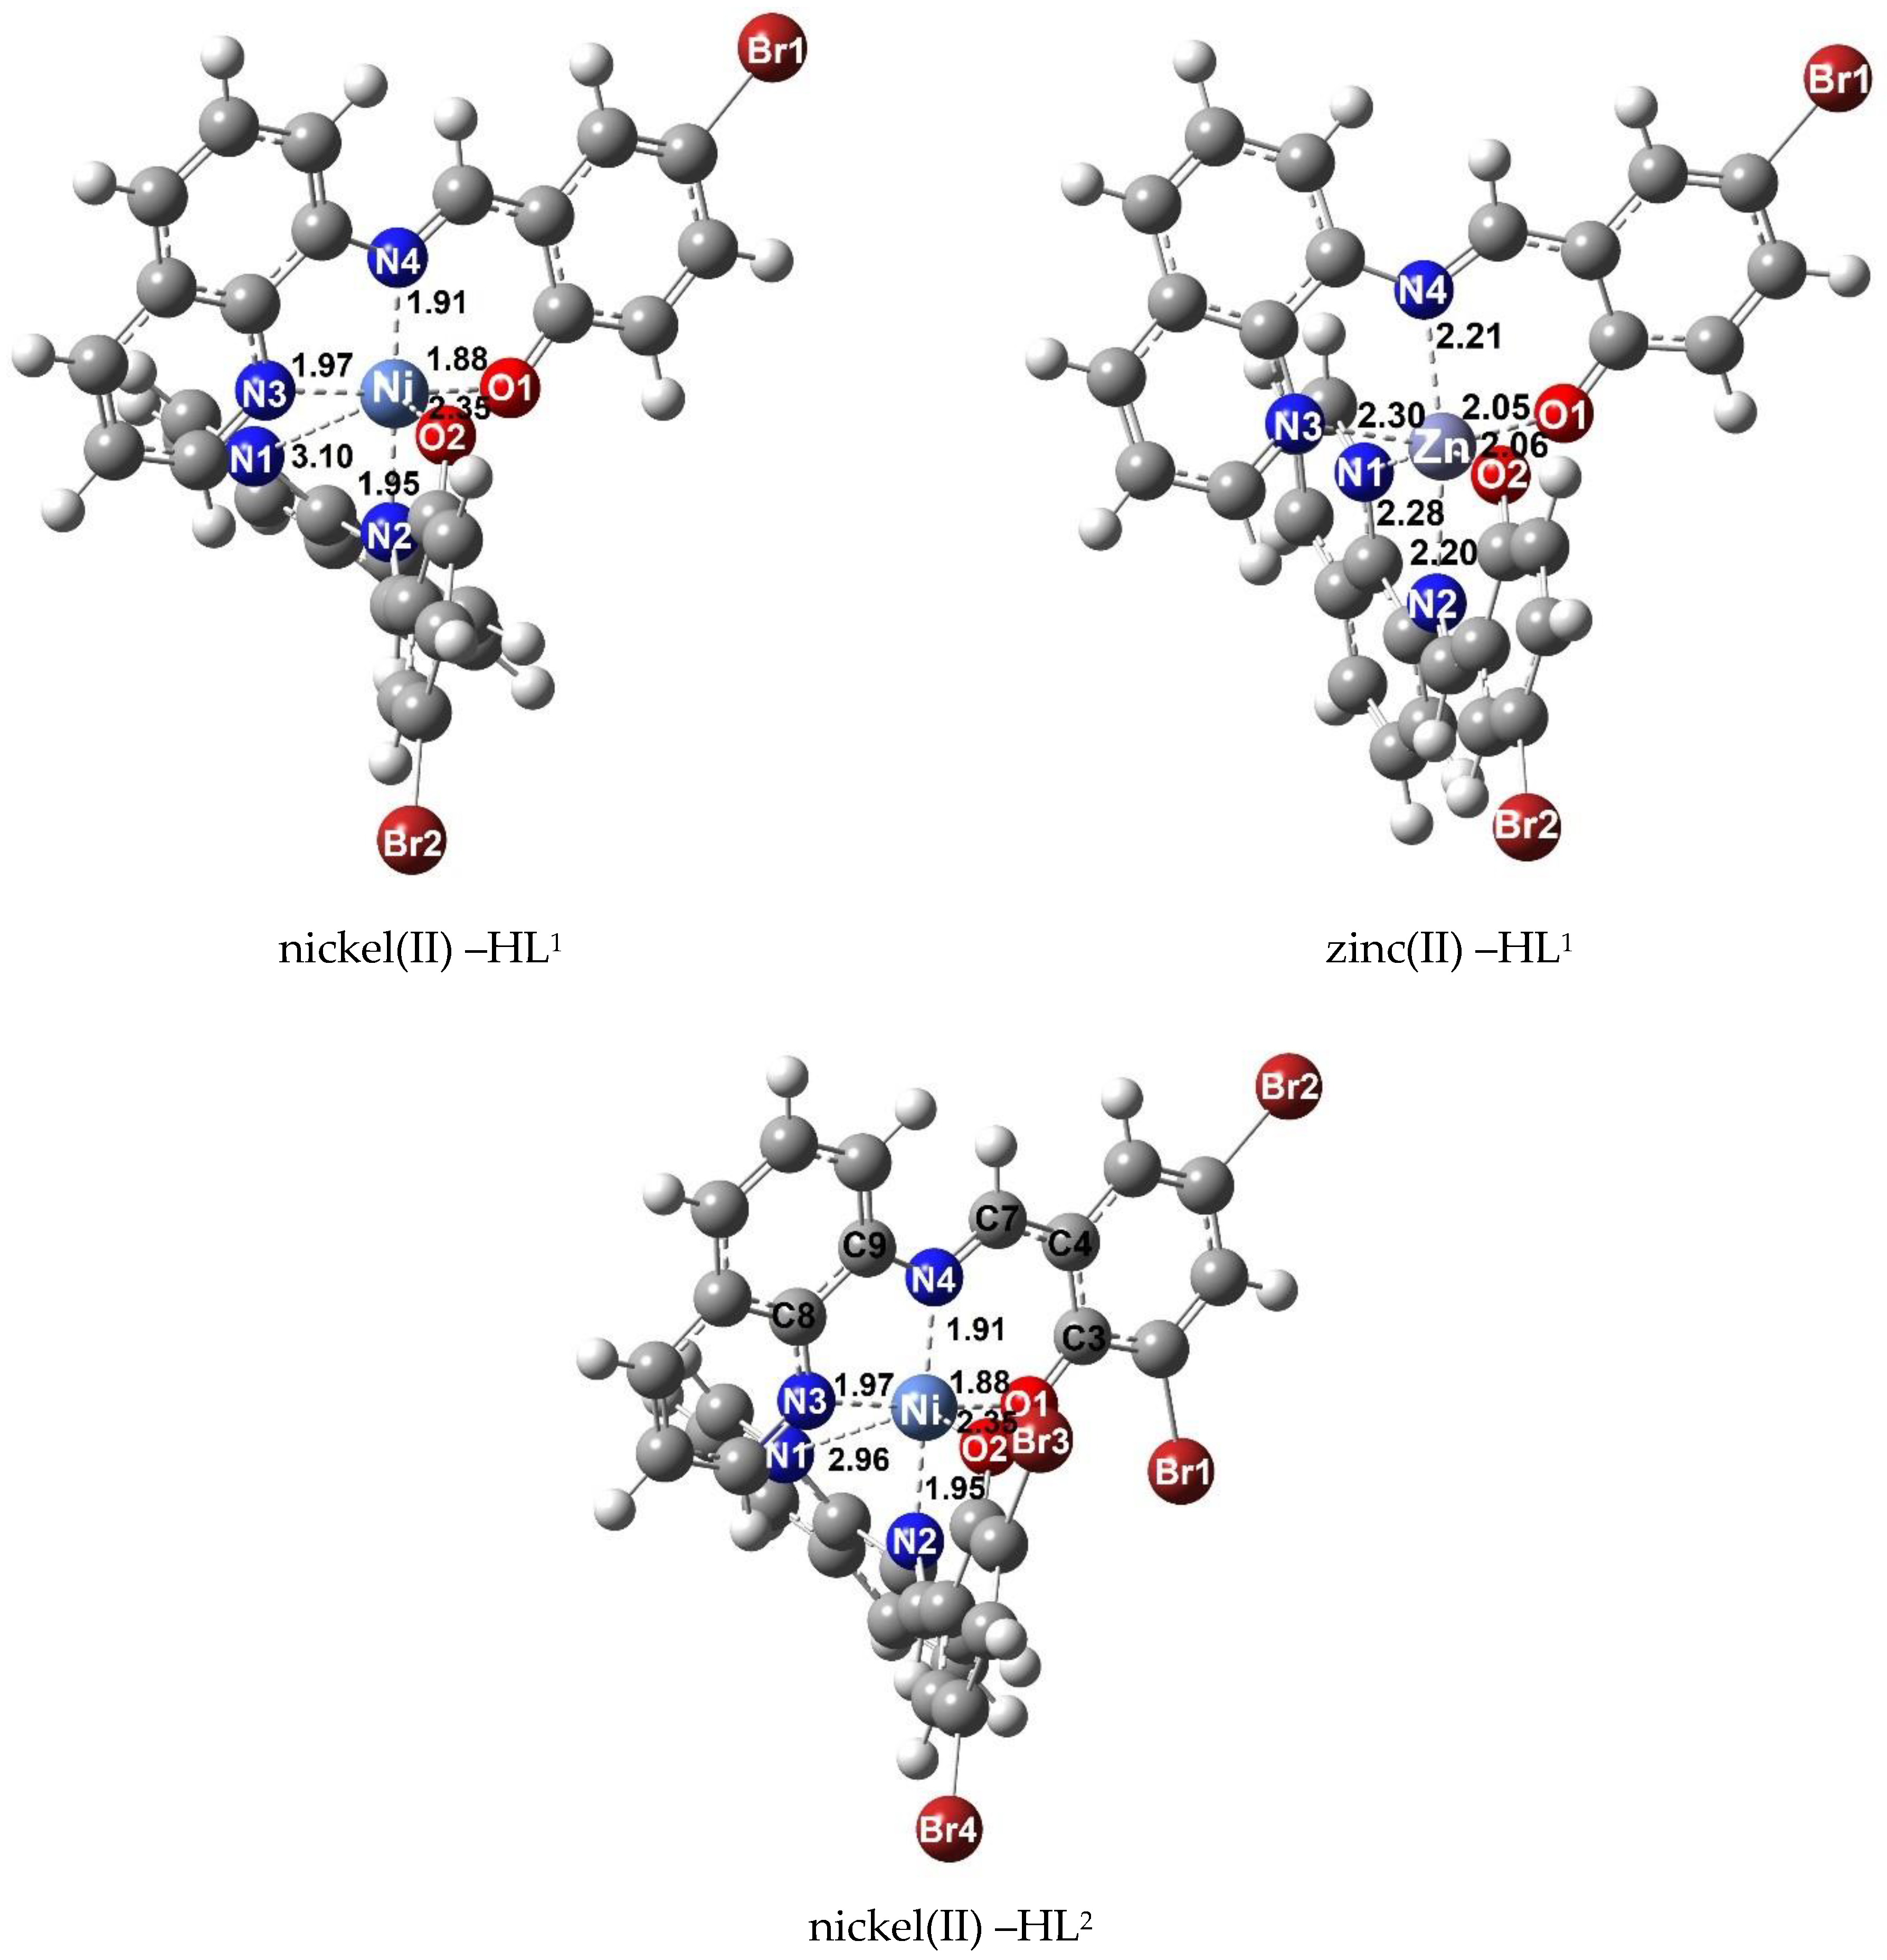
3.6. Description of the Molecular Structure

Complex 3 was characterized by single–crystal X–ray crystallography. The experimental details of the X–ray data of the synthesized complex are presented in Table 4.
The structure of complex 3 (Figure 3) reveals that the nickel(II) metal center is coordinated with two molecules of ligand HL2 in a tridentate fashion, involving a deprotonated oxygen atom and two atoms of nitrogen from the quinoline and azomethine functional groups, respectively. The two nitrogen atoms (N1 and N3) of the quinoline ring and two oxygen atoms (O1 and O2) are located within the square plane, while the two azomethine nitrogen atoms (N2 and N4) occupy the axial positions. The two oxygen atoms are positioned in a cis configuration to each other. Additionally, the complex adopts a distorted octahedral geometry.
Selected bond lengths, bond angles, and torsion angles are shown in Table 5. The C−N(H) bond of HL2 with a distance of 2.312 (2) (Table S1) is shortened to 1.316 (8) in complex 3, specifically the N2−C10 bond, upon the coordination of the nitrogen atom towards the metal center. Typically, the C−N distance of a Schiff base compound represents the double bond of the azomethine functional group; therefore, after complex formation, this bond is normally lengthened. However, in this study, the obtained crystal structure of HL2 displays an enamine form (Figure S8, Scheme S1), in which after the formation of a coordinative covalent bond, such a ligand has converted to an imine form, leading to the lower bond distance. Other relevant bonds in complex formation also exhibit similar tendencies to the aforementioned C−N bond, all indicating changes in bond lengths upon coordination.
According to the orientation of complex 3, the nickel(II) ion exhibits a fairly repulsive distribution of electrons, as the two nitrogen atoms (N1 and N3) of the quinoline ring and two oxygen atoms (O1 and O2) are located in a cis geometry. This results in a reasonably adjustment in the bond angles and torsion angles of the Schiff base compound. Bond angles of C16−C11−C10, C12−C11−C10, and C10−N2−C9 with values of 118.1 (2), 120.4 (2), and 127.1 (2) for ligand HL2 (Table S1) have shifted by around six or seven degrees to become C12−C11−C10; 124.9 (6), C16−C11−C10; 114.1 (5), and C10−N2−C8; 120.0 (5) in complex 3. The angles of the complex display more deviation from planarity with the torsion angles of C11−C10−N2−C8; 168.7 (6), C13−C12−C11−C10; 175.1 (6), and C10−N2−C9−C1; 15 (1). This appearance is a result of the steric hindrance generated from two molecules of Schiff base compounds being in a cis conformation. Thus, each molecule undergoes a repulsive orientation in which all N,N,O atoms could properly donate their electrons towards the nickel(II) metal center.

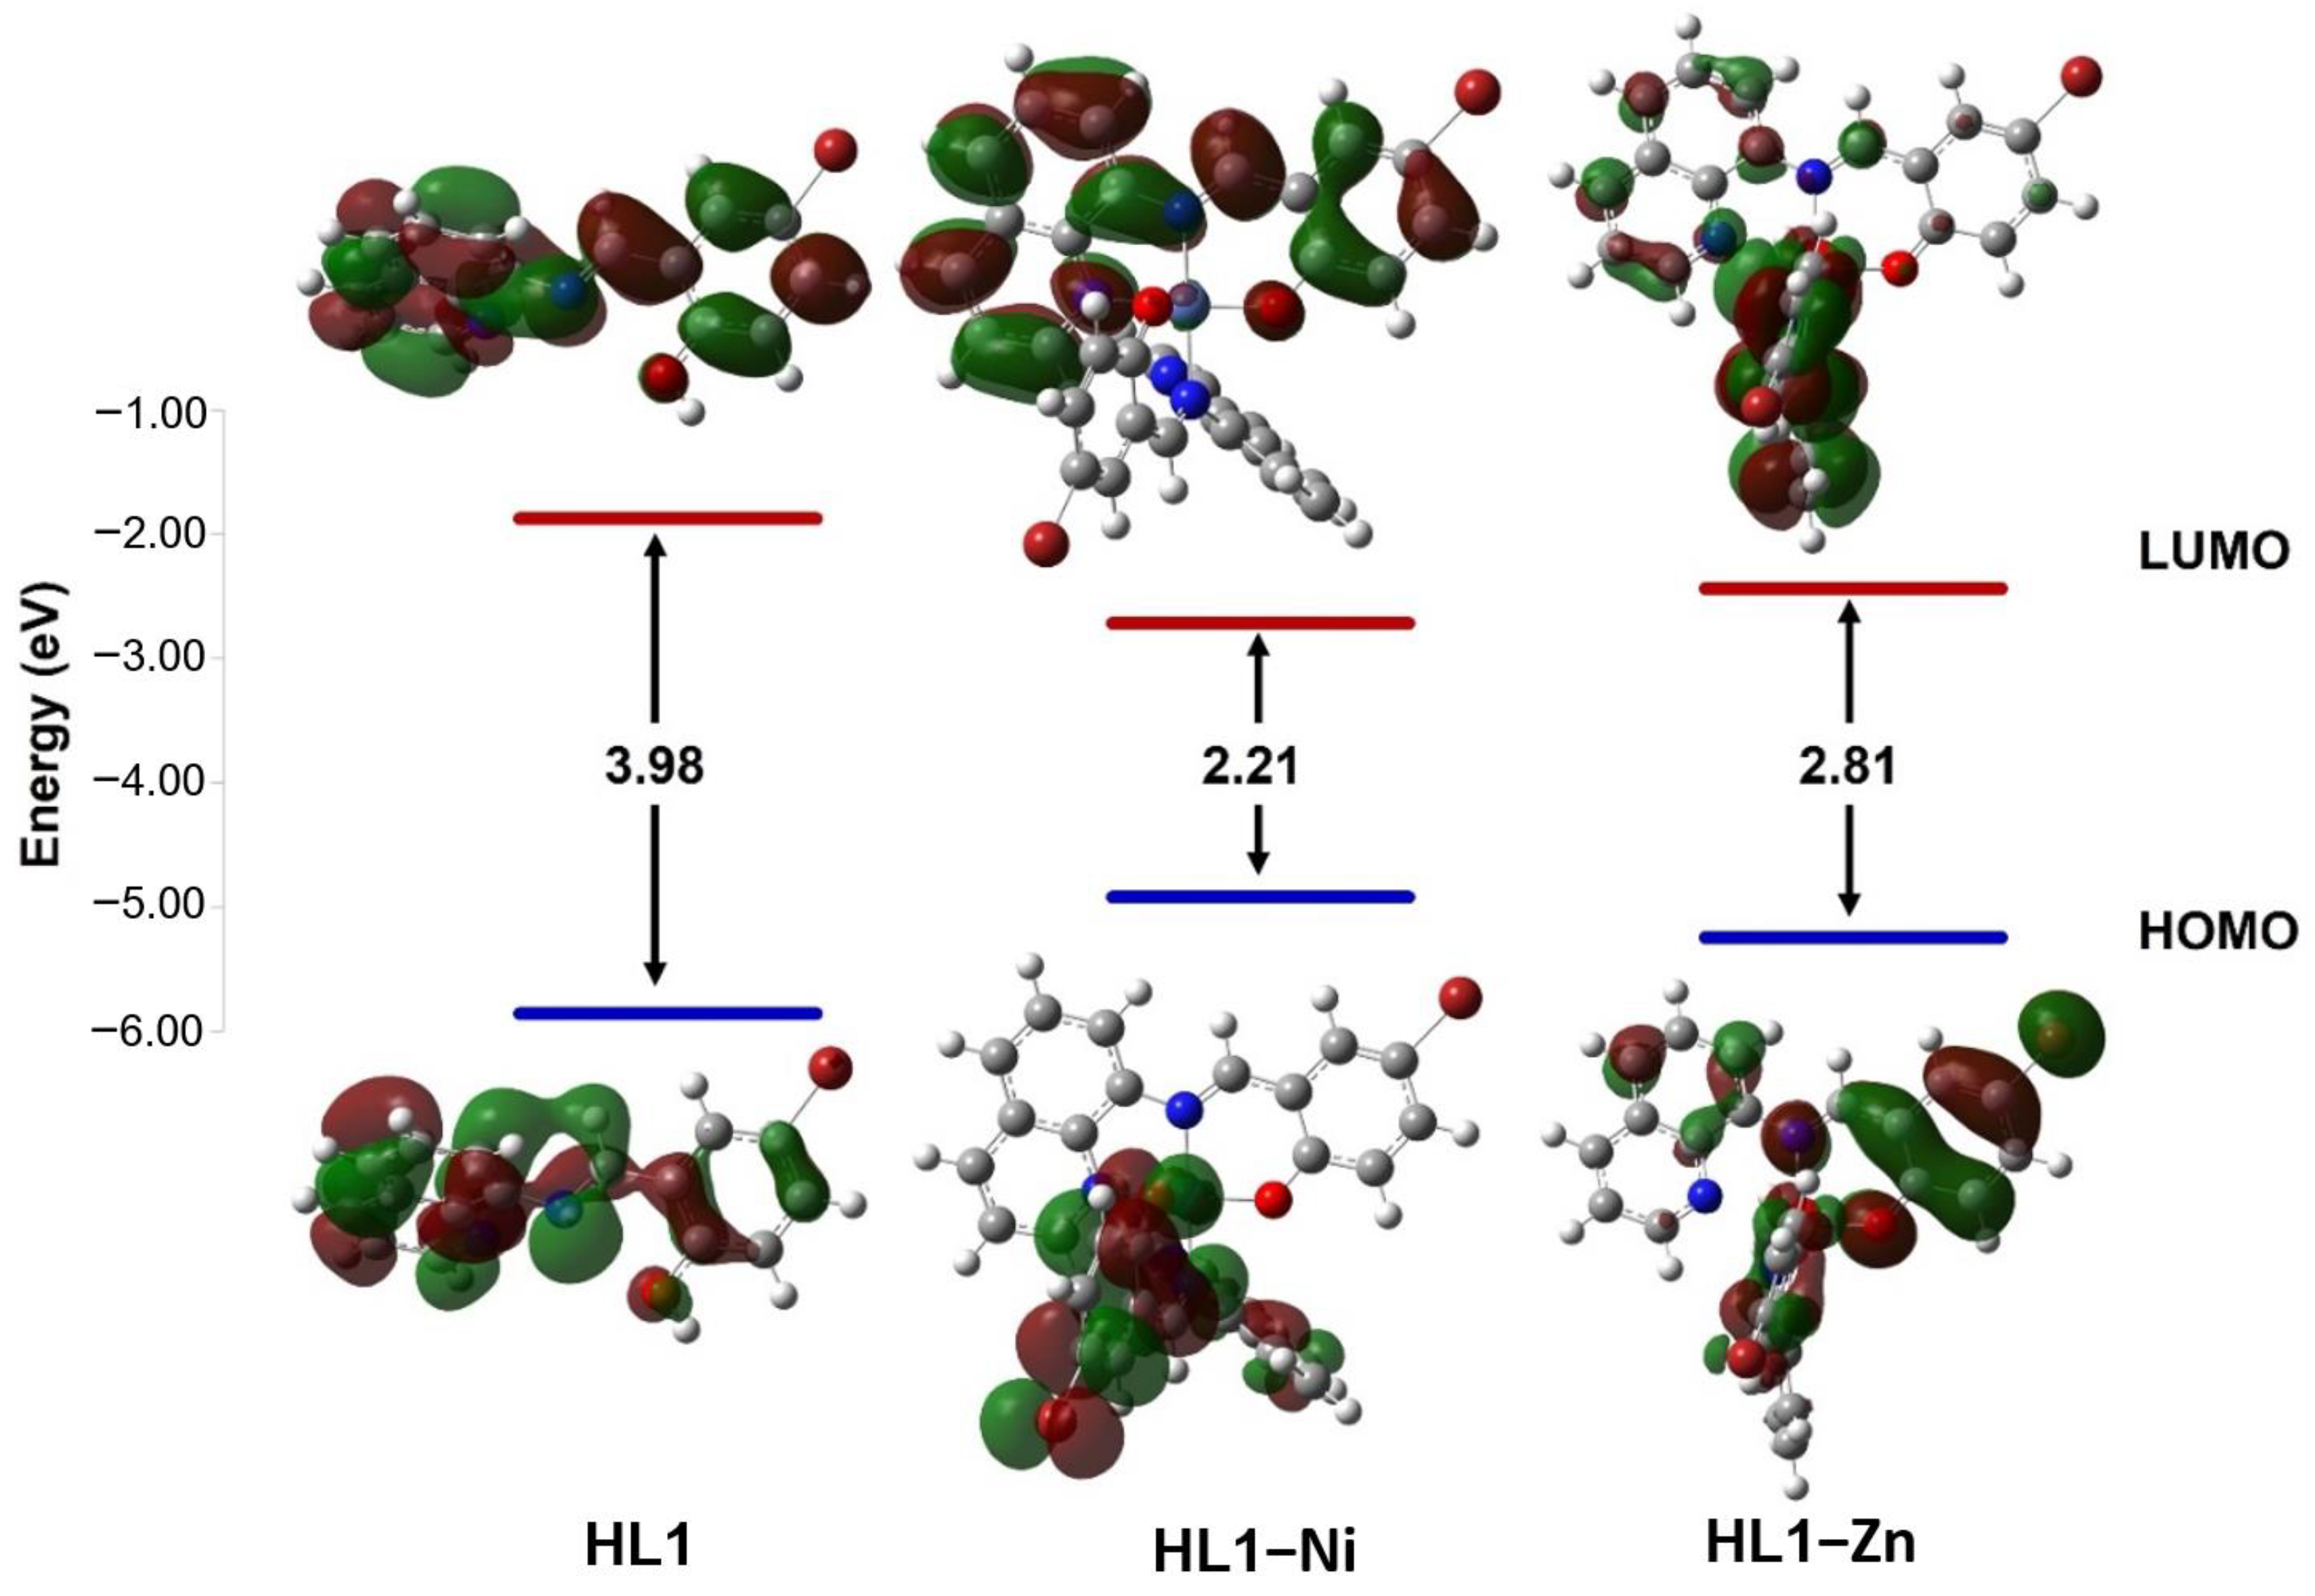
3.7. DFT Investigation

3.7.1. Geometry Optimization of Ligands

Figure 4 displays the optimized structures of nickel(II) and zinc(II) complexes. These findings align with X–ray crystallographic results, indicating the trans conformation with a tridentate fashion of the ligand upon the formation of complex 3. Furthermore, the optimized structure geometry confirms that the two nitrogen atoms (N1 and N3) of the quinoline ring and two oxygen atoms (O1 and O2) are located in a cis orientation. The detailed geometric parameters, including bond lengths and bond angles, are presented in Table S3.

3.7.2. Global Reactivity Descriptors

The chemical reactivity of compounds was estimated by calculating quantum chemical parameters using the density functional theory (DFT) approach. These parameters describe stability and reactivity and suggest the most bioactive compound. Therefore, the lowest unoccupied molecular orbital (LUMO) and the highest occupied molecular orbital (HOMO) are presented in (Figure 5 and Figure 6 and Table 6) along with the difference between their energies (ΔE). The narrowing of the HOMO (electron donor) and LUMO (electron acceptor) energy gaps indicates that an intramolecular charge transfer (ICT) is occurring within the complex molecule and is responsible for the molecular activity. For the ligands, the HOMO and LUMO orbitals are distributed around the whole molecule with energy gaps of 3.98 and 3.91 eV for HL1 and HL2, respectively. The interaction of the metal ions with the ligands has lowered the energy gap, suggesting that these compounds have the capacity for electron transitions, demonstrating favorable reactivity and stability. The synthesized compounds were organized based on their reactivities as follows: HL–Ni > HL–Zn > HL. Small ΔE values indicate the low stability and high chemical reactivity of the compounds. From the results presented in Table 6, the energy gaps of the complexes are increasing in the sequence of [Ni(qsalBr)2] (1) < [Ni(qsalBr2)2] (3) < [Zn(qsalBr)2] (2), respectively. Therefore, [Ni(qsalBr)2] (1) defined as HL1–Ni has the smallest energy gap, which means it is the most bioactive compound and has the highest reactivity compared with other synthesized complexes.
Absolute hardness (η), softness (S), chemical potentials (μ), absolute electronegativity (χ), and global electrophilicity (ω) are important tools in the study of the stability order of molecular systems.

3.8. DNA Binding Study

3.8.1. Electronic Absorption Titrations

UV–Vis absorption spectroscopy is a typical method employed to determine the binding characteristics of metal complexes with DNA [40]. Generally, hyperchromism and hypochromism are the spectral characteristics of DNA regarding the changes in its double helix structure. In addition, a red shift in spectroscopic studies indicates a change in the electronic environment of the DNA base pairs, suggesting that the synthesized complexes contribute to the stabilization of the DNA structure [41].
Figure 7 presents the absorption spectra of the Schiff base with and without progressively increasing amounts of CT–DNA by successive addition. The arrows indicate the changes accompanying the increasing amounts of CT–DNA, demonstrating a hypochromic effect, and spectra of the complexes also exhibit a red shift around 2–8 nm. These changes could indicate the interaction between the synthesized complexes and the added CT–DNA. The interaction observed between the synthesized complexes 13 and CT–DNA is likely an indication of the intercalation mode of binding [42,43]. To quantify the extent of binding of the complexes to CT–DNA, the binding constant (Kb) of each complex is determined by the ratio of the slope to the intercept in plots employing the Wolfe–Shimmer equation [44], and the results are presented in Table 7. The Kb values of the complexes are 1.13 × 10⁶ M−1, 4.82 × 10⁶ M−1, and 6.02 × 10⁵ M−1 for complexes 13, respectively. It is clearly seen that the zinc(II) complex shows superior binding to the CT–DNA than the binding of the nickel(II) complexes for both mono- and di-substituted ligands. This might be related to the formation constant of such complexes in which nickel(II) complexes with higher stability (2.52 × 10⁶ and 8.69 × 10⁵ for complexes 1 and 3) could weakly interact with CT–DNA in comparison to zinc(II) complex with the formation constant of 5.67 × 10⁵. Furthermore, the zinc(II) complex also provides a higher Kb value than the classical intercalator, ethidium bromide (EB), with a value of Kb = 1.40 × 10⁶ M−1 [45].

3.8.2. FluorescenceTitration

Fluorescence spectroscopy has been helpful for characterizing the binding mode of complex–DNA interactions [46]. Ethidium bromide (EB) is a favorable tool to examine the change in fluorescent spectra upon interaction with DNA [47]. Typically, EB has a planar conjugate structure and fluoresces weakly, while its solution with DNA emits sharply at 610 nm. This is due to the strong stacking of its planar ring and base pairs on the DNA via an intercalation mode of binding [48]. The emission intensities for EB–DNA in the absence and presence of the complexes in the range from 545 to 700 nm were measured. When the additive complexes displace the bound ethidium bromide (EB), competitive binding to DNA occurs, leading to the quenching of the fluorescence from the EB–DNA complex.
Figure 8 presents the effect of the complexes at different concentrations on the fluorescence intensity of the EB–DNA system, with the arrows indicating the changes upon increasing concentrations of complexes. It is obvious that the emission intensity of EB–DNA gradually decreases with the increasing concentration of the complexes. The findings suggest that the complexes are capable of quenching the fluorescence of EB–DNA by displacing EB with the synthesized complexes. This is owing to the interaction between the aromatic chromophore of the ligand and the base pairs of the DNA [48].
Furthermore, the quenching ability was evaluated using the Stern–Volmer equation, with the quenching constant (Kq) derived as the slope from the plot of Io/I against the concentration of the complexes. The Kq values for the complexes were found to be 7.74 × 10¹¹ M−1 s−1, 8.70 × 10¹¹ M−1 s−1, and 7.22 × 10¹¹ M−1 s−1, respectively. The obtained Kq constant of the complexes is also consistent with the UV–Vis titration results, which indicates that the zinc(II) complex intercalated more strongly than the nickel(II) complexes. From the results presented in Table 7, DNA–binding activities observed by both titration methods are increasing in the order of [Ni(qsalBr2)2] (3) < [Ni(qsalBr)2] (1) < [Zn(qsalBr)2] (2). These results are also associated with the formation constants of the complexes in which [Zn(qsalBr)2] (2) with the least formation constant provides the highest activity in binding with CT–DNA. Additionally, the number of binding sites (n) was also calculated from the linear plots according to the Scatchard equation (10). The values of n for complexes 1 and 2 suggest the one binding site available on the CT–DNA. On the contrary, complex 3 gives a smaller ligand–binding site value of n of about a half (Figure S10).
According to the ability of such complexes in the interaction of CT–DNA via intercalation, the complexes are supposed to perform their ability in the inhibition of cell growth. Therefore, the anticancer activities of the synthesized complexes were further investigated.

3.9. In Vitro Anticancer Activity

The cytotoxicity against A549 lung cancer cells of Schiff base ligands, nickel(II), and zinc(II) complexes obtained from MTT assays are summarized in Table 8. Media (DMSO/media) and etoposide were used as controls under the same experimental conditions. The results indicated that all the complexes exhibited lower activity against lung cancer cells than the standard etoposide and cisplatin. Categorized by types of complexes, zinc(II) complex 2 with IC50 of 88.59 ppm provided better results than nickel(II) complexes 1 and 3 with IC50 values of 258.43 and 315.00 ppm, respectively. These results are precisely associated with the capability of such complexes in the interaction with CT–DNA which are in the sequence of [Ni(qsalBr2)2] (3) < [Ni(qsalBr)2] (1) < [Zn(qsalBr)2] (2). While the compounds tested did not inhibit lung cancer cell growth as effectively as standard treatments like etoposide and cisplatin, it is still necessary to further investigate their anticancer activities against other cancer cell types, along with their pharmacological and toxicological properties, through in vivo studies.
Nevertheless, there are discrepancies in the reactivity between experimental and theoretical studies. DFT calculation exhibits the highest energy gap of [Zn(qsalBr)2] (2), suggesting the least chemical reactivity of such compound. On the contrary, DNA binding and anticancer studies reveal the highest capability of this zinc(II) complex among the tested compounds. This may arise from subtle differences in the geometric structures of the complexes. As previously reported by our group, the zinc(II) complex bearing HqsalBr2 exhibited a more planar orientation of its Schiff base ligands, resulting in a less distorted octahedral structure compared to the nickel(II) complex 3. This enhanced planarity likely contributes to the superior reactivity of the zinc(II) complex 2 in interactions with CT–DNA and its anticancer activity [24].
Furthermore, our findings indicate that complex 1, featuring a mono-substituted Schiff base ligand, demonstrates reduced steric repulsion in comparison to complex 3, as evidenced by the lower torsion angles reported in Table S3. Notably, the torsion angles of complex 1 and 3 from the crystallographic determination show significant differences; however, these angles were similar in computational studies (Table S4). The minor disparity between the theoretical and experimental outcomes suggest that the orientation of ligands might influence the observed reactivity among the complexes.

3.10. Molecular Docking

To validate the experimental findings regarding how the complexes interact with DNA, molecular docking simulations focusing on the binding site and modes of interaction with 1bna were conducted. It was observed that HL1 and HL2 bound to B–DNA (PDB id: 1bna) at the minor groove (Figure S11), while the complexes bound to DNA at the major groove are as depicted in Figure 9. Among the complexes examined, [Ni(qsalBr2)2] (3) exhibited the most favorable binding energies towards DNA (Table 9). The results also indicate that the tested complexes are capable of engaging in both major groove binding and intercalation. However, a comparison of binding energies calculated using the AutoDock program suggests a preference for major groove binding in which the stability primarily relies on the hydrogen bonds and hydrophobic interactions. The relative binding energies of the docked ligands and complexes with DNA fall within the range of −7.7 to −9.1 kcal/mol.
The molecular docking investigation involving the EGFR kinase domain (PDB id: 7ukv) and the complexes depicted in Figure 10 revealed that all interactions predominantly occurred via hydrophobic bonds, except for HL1 and HL2, which formed hydrogen bonds with MET793 (for HL1) and THR790 (for HL2) (Figure S12). The binding energies of the docked ligands and complexes with lung cancer cells range from −7.2 to −9.3 kcal/mol. Interestingly, despite this variation in interaction types, all studied complexes exhibited more negative binding energies compared to ZRT, the native compound in the EGFR kinase domain structure.
In our study, the molecular docking performed for [Ni(qsalBr2)2] (3) indicated the highest binding affinity and more favorable interaction. However, investigations involving DNA binding and anticancer activity showed that this complex demonstrated the least effectiveness compared to the other compounds. The difference occurring between theoretical studies and experimental results may arise from omitting the solvent from the molecular docking calculations.
Solvent molecules can affect the conformation of both the complexes and the receptors. The nickel(II) complexes display the dissociated bonds of the nickel(II) center with the N,O– donor atoms during the synergy in a biological environment, as presented in Figure 9 and Figure 10. In the presence of solvent in an experiment, the zinc(II) complex of [Zn(qsalBr)2] (2) might perform an orientation with some unbound Zn–O and Zn–N bonds that favor optimal interaction with biological targets. These experimental conditions could facilitate the interaction of the zinc complex with 1bna and 7ukv via the hydrogen bonds and hydrophobic interactions as aforementioned for nickel(II) complexes, leading to the highest potency of [Zn(qsalBr)2] (2). Although the incorporation of solvent should be executed to improve the reliability of the molecular docking studies, the obtained results in this study certainly demonstrate potential binding targets of all synthesized complexes with DNA and lung cancer cells.

4. Conclusions

This research involved the synthesis of nickel(II) and zinc(II) complexes with 5–bromo–N–(8–quinolyl)salicylaldimine (HqsalBr, HL1) and 3,5–dibromo–N–(8–quinolyl) salicylaldimine (HqsalBr2, HL2) via simple condensation reaction. All the ligands and complexes underwent structural characterization using spectroscopic techniques, confirming the formation of the desired products. The complexes were utilized to study the interaction with calf thymus DNA (CT–DNA). Electronic absorption and fluorescence titration tests indicate that the complexes bind to DNA via intercalation. The experimental results revealed that complex [Zn(qsalBr)2] (2) with a higher binding constant (Kb) and quenching constant (Kq) values exhibited superior efficacy in inhibiting cancer cells growth compared to nickel(II) complexes. However, the computational studies revealed that [Ni(qsalBr2)2] (3) exhibits the most favorable negative binding energies, −9.1 kcal/mol with DNA and −9.3 kcal/mol with cancer cells, facilitated by hydrogen bonding and hydrophobic interactions. Despite the dissimilarity in biological activity through molecular docking, this exploratory study suggests potential binding targets of the synthesized complexes with DNA and lung cancer cells.

Supplementary Materials

CCDC 1918638 contains the supplementary crystallographic data for complex 3. These data can be obtained via http://www.ccdc.cam.ac.uk/conts/retrieving.html (accessed on 29 June 2024). The following supporting information can be downloaded at: https://www.mdpi.com/article/10.3390/chemistry6040037/s1, Figure S1: The FT-IR spectrum of [Ni(qsalBr)2] (1); Figure S2: The FT-IR spectrum of [Zn(qsalBr)2] (2); Figure S3: The FT-IR spectrum of [Ni(qsalBr2)2] (3); Figure S4: Job’s plot for stability constant of [Ni(qsalBr)2] (1); Figure S5: Job’s plot for stability constant of [Zn(qsalBr)2] (2); Figure S6: Job’s plot for stability constant of [Ni(qsalBr2)2] (3); Figure S7: 1H NMR spectrum of [Zn(qsalBr)2] (2) in DMF-d7; Figure S8: Crystal structure with thermal ellipsoid of HqsalBr2 (HL2); Scheme S1: Tautomerization of HqsalBr2 (HL2); Table S1: Selected bond lengths [Å], angles [°] and torsion angles [°] for HL2; Table S2: Crystal data and structure refinement for HL2; Table S3: Selected bond lengths [Å], angles [°] and torsion angles [°] for complex 1; Table S4: Selected geometric bond lengths and torsion angles of the optimized ligand and its metal complexes; Figure S9: The optimized geometry with a numbering system for the HL2 ligand and nickel(II)-HL2 complex; Figure S10: Number of binding sites determined by Scatchard plot of EB−DNA; Figure S11: Molecular docking revealed 2D and 3D interactions into B-DNA (PDB id: 1bna); Figure S12: Molecular docking revealed 2D and 3D interactions into the EGFR kinase domain (PDB id: 7ukv).

Author Contributions

Conceptualization, B.P. and R.C.; methodology, B.P. and R.C.; software, M.P. and S.K.; validation, B.P. and R.C.; formal analysis, B.P. and R.C.; investigation, B.P., M.P., S.K., K.C., and T.K.; resources, K.C.; data curation, B.P.; writing—original draft preparation, B.P., M.P., S.K., and T.K.; writing—review and editing, B.P.; visualization, B.P. All authors have read and agreed to the published version of the manuscript.

Funding

The authors would like to thank the Faculty of Science, Naresuan University, for financial support and the Development and Promotion of Science and Technology Talents Project (DPST) for a scholarship.

Data Availability Statement

The original contributions presented in the study are included in the article and supplementary, further inquiries can be directed to the corresponding author.

Acknowledgments

The authors would like to thank Sarawut Kumphune for his help during testing of the anticancer activity and Thammasat University for the X–ray diffractometer.

Conflicts of Interest

The authors declare no conflicts of interest.

References

  1. Zhou, X.Q.; Li, Y.; Zhang, D.Y.; Nie, Y.; Li, Z.J.; Gu, W.; Liu, X.; Tian, J.L.; Yan, S.P. Copper complexes based on chiral Schiff-base ligands: DNA/BSA binding ability, DNA cleavage activity, cytotoxicity and mechanism of apoptosis. EJMECH 2016, 114, 244–256. [Google Scholar] [CrossRef] [PubMed]
  2. Li, Z.; Niu, M.; Chang, G.; Zhao, C. Chiral manganese (IV) complexes derived from Schiff base ligands: Synthesis, characterization, in vitro cytotoxicity and DNA/BSA interaction. J. Photochem. Photobiol. B 2015, 153, 473–482. [Google Scholar] [CrossRef]
  3. Jia, A.Q.; Shi, L.M.; Wu, F.; Xin, Z.F.; Zhang, Q.F. Syntheses, structures and immobilization of ruthenium complexes bearing N,O-Schiff-base or N,N′-diamine ligands functionalized with alkoxysilyl groups. J. Organomet. Chem. 2018, 855, 33–43. [Google Scholar] [CrossRef]
  4. Basak, T.; Ghosh, K.; Gómez-García, C.J.; Chattopadhyay, S. Synthesis, structure and magnetic characterization of a dinuclear and two mononuclear iron(III) complexes with N,O-donor Schiff base ligands. Polyhedron 2018, 146, 42–54. [Google Scholar] [CrossRef]
  5. Khosravi, I.; Hosseini, F.; Khorshidifard, M.; Sahihi, M.; Rudbari, H.A. Synthesis, characterization, crystal structure and HSA binding of two new N,O,O-donor Schiff-base ligands derived from dihydroxybenzaldehyde and tert-butylamine. J. Mol. Struct. 2016, 1119, 373–384. [Google Scholar] [CrossRef]
  6. Grzegorczyk, M.; Kapturkiewicz, A.; Sanjuan-Szklarz, F.; Nowacki, J. Monomeric complexes of Re(CO)3+ ion with tridentate N∩N∩Oligands-Schiff base derivatives of salicylic aldehyde. Inorg. Chem. Commun. 2014, 46, 103–106. [Google Scholar] [CrossRef]
  7. Li, B.Y.; Yao, Y.M.; Wang, Y.R.; Zhang, Y.; Shen, Q. Synthesis, reactivity and structural characterization of ytterbium complexes bearing a tridentate [O,N,N] Schiff base ligand. Polyhedron 2011, 30, 207–212. [Google Scholar] [CrossRef]
  8. Sedighipoor, M.; Kianfar, A.H.; Mohammadnezhad, G.; Görls, H.; Plass, W. Unsymmetrical palladium(II) N,N,O,O-Schiff base complexes: Efficient catalysts for Suzuki coupling reactions. Inorganica Chim. Acta 2018, 476, 20–26. [Google Scholar] [CrossRef]
  9. Ozdemir, O. Synthesis and characterization of a new diimine Schiff base and its Cu2+ and Fe3+ complexes: Investigation of their photoluminescence, conductance, spectrophotometric and sensor behaviors. J. Mol. Struct. 2019, 1179, 376–389. [Google Scholar] [CrossRef]
  10. Das, R.; Bandyopadhyay, R.; Pramanik, P. Stereo-regulated Schiff base siloxane polymer coated QCM sensor for amine vapor detection. Mater. Chem. Phys. 2019, 226, 214–219. [Google Scholar] [CrossRef]
  11. Egekenze, R.; Gultneh, Y.; Butcher, R. Catalysis of alkene epoxidation by manganese(II) and (III) complexes of both Schiff base and reduced Schiff base ligands utilizing environmentally benign H2O2. Polyhedron 2018, 144, 198–209. [Google Scholar] [CrossRef]
  12. Al Zoubi, W.; Ko, Y.G. Organometallic complexes of Schiff bases: Recent progress in oxidation catalysis. J. Organomet. Chem. 2016, 822, 173–188. [Google Scholar] [CrossRef]
  13. Taha, R.H.; El-Shafiey, Z.A.; Salman, A.A.; El-Fakharany, E.M.; Mansour, M.M. Synthesis and characterization of newly synthesized Schiff base ligand and its metal complexes as potent anticancer. J. Mol. Struct. 2019, 1181, 536–545. [Google Scholar] [CrossRef]
  14. Bahron, A.; Khaidir, S.S.; Tajuddin, A.M.; Ramasamy, K.; Yamin, B.M. Synthesis, characterization and anticancer activity of mono- and dinuclear Ni(II) and Co(II) complexes of a Schiff base derived from o-vanillin. Polyhedron 2019, 161, 84–92. [Google Scholar] [CrossRef]
  15. Alexiou, M.; Tsivikas, I.; Dendrinou-Samara, C.; Pantazaki, A.A.; Trikalitis, P.; Lalioti, N.; Kyriakidis, D.A.; Kessissoglou, D.P. High nuclearity nickel compounds with three, four or five metal atoms showing antibacterial activity. J. Inorg. Biochem. 2003, 93, 256–264. [Google Scholar] [CrossRef] [PubMed]
  16. Luo, W.; Meng, X.; Sun, X.; Xiao, F.; Shen, J.; Zhou, Y.; Cheng, G.; Ji, Z. Synthesis, crystal structure and bioactivity of a novel linear trinuclear nickel(II) complex. Inorg. Chem. Commun. 2007, 10, 1351–1354. [Google Scholar] [CrossRef]
  17. Ni, Y.N.; Wei, M.; Kokot, S. Electrochemical and spectroscopic study on the interaction between isoprenaline and DNA using multivariate curve resolution-alternating least squares. Int. J. Biol. Macromol. 2011, 49, 622–628. [Google Scholar] [CrossRef]
  18. Mansouri-Torshizi, H.; I-Moghaddam, M.; Divsalar, A.; Saboury, A. 2,2′-Bipyridine butyldithiocarbamatoplatinum(II) and palladium(II) complexes: Synthesis, characterization, cytotoxicity, and rich DNA-binding studies. Bioorg. Med. Chem. 2008, 16, 9616–9625. [Google Scholar] [CrossRef]
  19. Tabassum, S.; Ahmad, M.; Afzal, M.; Zaki, M.; Bharadwaj, P.K. Synthesis and structure elucidation of a copper(II) Schiff-base complex: In vitro DNA binding, pBR322 plasmid cleavage and HSA binding studies. J. Photochem. Photobiol. B 2014, 140, 321–331. [Google Scholar] [CrossRef]
  20. Hartinger, C.G.; Metzler-Nolte, N.; Dyson, P.J. Challenges and Opportunities in the Development of Organometallic Anticancer Drugs. Organometallics 2012, 31, 5677–5685. [Google Scholar] [CrossRef]
  21. Shahraki, S.; Majd, M.H.; Heydari, A. Novel tetradentate Schiff base zinc(II) complex as a potential antioxidant and cancer chemotherapeutic agent: Insights from the photophysical and computational approach. J. Mol. Struct. 2019, 1177, 536–544. [Google Scholar] [CrossRef]
  22. Virani, S.; Bilheem, S.; Chansaard, W.; Chitapanarux, I.; Daoprasert, K.; Khuanchana, S.; Leklob, A.; Pongnikorn, D.; Rozek, L.S.; Siriarechakul, S.; et al. National and Subnational Population-Based Incidence of Cancer in Thailand: Assessing Cancers with the Highest Burdens. Cancers 2017, 9, 108. [Google Scholar] [CrossRef] [PubMed]
  23. Sirirak, J.; Phonsri, W.; Harding, D.J.; Harding, P.; Phommon, P.; Chaoprasa, W.; Hendry, R.M.; Roseveare, T.M.; Adams, H. Halogen substituted quinolylsalicylaldimines: Four halogens three structural types. J. Mol. Struct. 2013, 1036, 439–446. [Google Scholar] [CrossRef]
  24. Pinchaipat, B.; Khudkham, T.; Wongsuwan, S.; Chotima, R.; Chainok, K.; Pila, T. The novel zinc(II) complex with dibromo substituted Schiff base and its biological activity. Mater. Lett. 2021, 293, 129749. [Google Scholar] [CrossRef]
  25. Becke, A.D. Density-functional thermochemistry. III. The role of exact exchange. J. Chem. Phys. 1993, 98, 5648–5652. [Google Scholar] [CrossRef]
  26. Lee, C.; Yang, W.; Parr, R.G. Development of the Colle-Salvetti correlation-energy formula into a functional of the electron density. Phys. Rev. B 1988, 37, 785–789. [Google Scholar] [CrossRef] [PubMed]
  27. Krishnan, R.; Binkley, J.S.; Seeger, R.; Pople, J.A. Self-consistent molecular orbital methods. XX. A basis set for correlated wave functions. J. Chem. Phys. 1980, 72, 650–654. [Google Scholar] [CrossRef]
  28. Hay, P.J.; Wadt, W.R. Ab initio effective core potentials for molecular calculations. Potentials for the transition metal atoms Sc to Hg. J. Chem. Phys. 1985, 82, 270–283. [Google Scholar] [CrossRef]
  29. Promkatkaew, M.; Boonsri, P.; Hannongbua, S. Structural and Spectroscopic Properties of Metal Complexes with Ruhemann’s Purple Compounds Calculated Using Density Functional Theory. Key Eng. Mater. 2019, 824, 204–211. [Google Scholar] [CrossRef]
  30. Alshaikh, N.E.; Zaki, M.; Sharfalddin, A.A.; Al-Radadi, N.S.; Hussien, M.A.; Hassan, W.M.I. Synthesis, structural characterization, DNA/HSA binding, molecular docking and anticancer studies of some D-Luciferin complexes. Arab. J. Chem. 2023, 16, 104845. [Google Scholar] [CrossRef]
  31. Frisch, M.J.; Trucks, G.W.; Schlegel, H.B.; Scuseria, G.E.; Robb, M.A.; Cheeseman, J.R. Gaussian 09, Revision A.02; Gaussian, Inc.: Wallingford, CT, USA, 2009. [Google Scholar]
  32. Geerlings, P.; De Proft, F.; Langenaeker, W. Conceptual Density Functional Theory. Chem. Rev. 2003, 103, 1793–1874. [Google Scholar] [CrossRef] [PubMed]
  33. Movahedi, E.; Rezvani, A.R. New silver(I) complex with diazafluorene based ligand: Synthesis, characterization, investigation of in vitro DNA binding and antimicrobial studies. J. Mol. Struct. 2017, 1139, 407–417. [Google Scholar] [CrossRef]
  34. Niu, M.J.; Li, Z.; Chang, G.L.; Kong, X.J.; Hong, M. Crystal Structure, Cytotoxicity and Interaction with DNA of Zinc (II) Complexes with o-Vanillin Schiff Base Ligands. PLoS ONE 2015, 10, e0130922. [Google Scholar] [CrossRef] [PubMed]
  35. Kazemi, Z.; Rudbari, H.A.; Mirkhani, V.; Sahihi, M.; Moghadam, M.; Tangestaninejad, S.; Mohammadpoor-Baltork, I. Synthesis, characterization, crystal structure, DNA- and HSA-binding studies of a dinuclear Schiff base Zn(II) complex derived from 2-hydroxy naphtaldehyde and 2-picolylamine. J. Mol. Struct. 2015, 1096, 110–120. [Google Scholar] [CrossRef]
  36. Drew, H.R.; Wing, R.M.; Takano, T.; Broka, C.; Tanaka, S.; Itakura, K.; Dickerson, R.E. Structure of a B-DNA dodecamer: Conformation and dynamics. Proc. Natl. Acad. Sci. USA 1981, 78, 2179–2183. [Google Scholar] [CrossRef] [PubMed]
  37. Heppner, D.E.; Wittlinger, F.; Beyett, T.S.; Shaurova, T.; Urul, D.A.; Buckley, B.; Pham, C.D.; Schaeffner, I.K.; Yang, B.; Ogboo, B.C.; et al. Structural Basis for Inhibition of Mutant EGFR with Lazertinib (YH25448). ACS Med. Chem. Lett. 2022, 13, 1856–1863. [Google Scholar] [CrossRef] [PubMed]
  38. Mohamed, G.G.; Omar, M.M.; Hindy, A.M.M. Synthesis, characterization and biological activity of some transition metals with Schiff base derived from 2-thiophene carboxaldehyde and aminobenzoic acid. Spectrochim. Acta Part A 2005, 62, 1140–1150. [Google Scholar] [CrossRef]
  39. Abd El-Halim, H.F.; Mohamed, G.G.; Khalil, E.A.M. Synthesis, spectral, thermal and biological studies of mixed ligand complexes with newly prepared Schiff base and 1,10-phenanthroline ligands. J. Mol. Struct. 2017, 1146, 153–163. [Google Scholar] [CrossRef]
  40. Long, E.C.; Barton, J.K. On Demonstrating DNA Intercalation. Acc. Chem. Res. 1990, 23, 271–273. [Google Scholar] [CrossRef]
  41. Efthimiadou, E.K.; Karaliota, A.; Psomas, G. Metal complexes of the third-generation quinolone antimicrobial drug sparfloxacin: Structure and biological evaluation. J. Inorg. Biochem. 2010, 104, 455–466. [Google Scholar] [CrossRef]
  42. Mathur, S.; Tabassum, S. Synthesis and characterization of a new macrocyclic copper(II) complex with an N-glycosidic pendant arm: In vitro cytotoxicity and binding studies with calf-thymus DNA. Chem. Biodiversity. 2006, 3, 312–325. [Google Scholar] [CrossRef] [PubMed]
  43. Alagesan, M.; Bhuvanesh, N.S.P.; Dharmaraj, N. An investigation on new ruthenium(II) hydrazone complexes as anticancer agents and their interaction with biomolecules. Dalton Trans. 2014, 43, 6087–6099. [Google Scholar] [CrossRef] [PubMed]
  44. Wolfe, A.; Shimer, G.H., Jr.; Meehan, T. Polycyclic aromatic hydrocarbons physically intercalate into duplex regions of denatured DNA. Biochemistry 1987, 26, 6392–6396. [Google Scholar] [CrossRef]
  45. Yilmaz, V.T.; Gocmen, E.; Icsel, C.; Cengiz, M.; Susluer, S.Y.; Buyukgungor, O. Di- and polynuclear silver(I) saccharinate complexes of tertiary diphosphane ligands: Synthesis, structures, in vitro DNA binding, and antibacterial and anticancer properties. J. Biol. Inorg. Chem. 2014, 19, 29–44. [Google Scholar] [CrossRef] [PubMed]
  46. Wang, Q.; Yang, Y.Z.; Qi, G.F.; Qin, D.D. Synthesis, crystal structure, antioxidant activities and DNA-binding studies of the Ln(III) complexes with 7-methoxychromone-3-carbaldehyde-(4'-hydroxy) benzoyl hydrazone. EJMECH 2009, 44, 2425–2433. [Google Scholar] [CrossRef] [PubMed]
  47. Sujatha, S.; Balasubramanian, S.; Varghese, B.; Jayaprakashvel, M.; Mathivanan, N. Synthesis, characterization and DNA interaction of hexaaza macrotricyclic copper(II) complexes. Inorganica Chim. Acta 2012, 386, 109–115. [Google Scholar] [CrossRef]
  48. Vikneswaran, R.; Eltayeb, N.E.; Ramesh, S.; Yahya, R. New alicyclic thiosemicarbazone chelated zinc(II) antitumor complexes: Interactions with DNA/protein, nuclease activity and inhibition of topoisomerase-I. Polyhedron 2016, 5, 89–95. [Google Scholar] [CrossRef]
  49. Haribabu, J.; Sabapathi, G.; Tamizh, M.M.; Balachandran, C.; Bhuvanesh, N.S.P.; Venuvanalingam, P.; Karvembu, R. Water-Soluble Mono- and Binuclear Ru(η6-p-cymene) Complexes Containing Indole Thiosemicarbazones: Synthesis, DFT Modeling, Biomolecular Interactions, and In Vitro Anticancer Activity through Apoptosis. Organometallics 2018, 37, 1242–1257. [Google Scholar] [CrossRef]
Scheme 1. Preparation of Schiff base ligands.
Chemistry 06 00037 sch001
Scheme 2. Preparation of zinc(II) and nickel(II) complexes.
Chemistry 06 00037 sch002
Figure 1. UV–Vis spectra of HL1, HL2, and complexes 13 in THF.
Chemistry 06 00037 g001
Figure 2. Thermogravimetric analysis (TGA) of Schiff base ligand and complexes.
Chemistry 06 00037 g002
Figure 3. Crystal structure with thermal ellipsoid of complex 3.
Chemistry 06 00037 g003
Figure 4. Optimized structures of HL1 and HL2 binding with nickel(II) and zinc(II).
Chemistry 06 00037 g004
Figure 5. HOMO and LUMO charge density maps and the energy gaps (ΔE) of the HL1 ligand and its nickel(II) and zinc(II) complexes.
Chemistry 06 00037 g005
Figure 6. HOMO and LUMO charge density maps and the energy gaps (ΔE) of the HL2 ligand and its nickel(II) complex.
Chemistry 06 00037 g006
Figure 7. Electronic absorption spectra of Schiff base complexes in the absence and presence of increasing amount of CT–DNA. (a) [Ni(qsalBr)2] (1); (b) [Zn(qsalBr)2] (2); (c) [Ni(qsalBr2)2] (3).
Chemistry 06 00037 g007
Figure 8. Fluorescence quenching spectra (λex = 525 nm) of EB–DNA in the absence and presence of increasing amounts of the complexes. (a) [Ni(qsalBr)2] (1); (b) [Zn(qsalBr)2] (2); (c) [Ni(qsalBr2)2] (3).
Chemistry 06 00037 g008
Figure 9. Molecular docking with 2D and 3D interactions of the complexes into the B–DNA (PDB id: 1bna).
Chemistry 06 00037 g009
Figure 10. Molecular docking with 2D and 3D interactions of the complexes into the EGFR kinase domain (PDB id: 7ukv).
Chemistry 06 00037 g010
Table 1. IR spectroscopic data of HL1, HL2, and Complexes 13.
Compounds IR (cm−1)
ν(C=N)ν(C–O)ν(C=N) (Quinoline)ν(M–O)ν(M–N)
HqsalBr (HL1)160612821423--
HqsalBr2 (HL2)160712831425--
[Ni(qsalBr)2] (1)160312311417470419
[Zn(qsalBr)2] (2)160512341415468416
[Ni(qsalBr2)2] (3)160412401413489426
Table 2. Appearance, maximum wavelength, and formation constant of complexes.
CompoundsColor
(Solid)
Color (Solution)λmax (nm),
ɛ (M−1cm−1)
Formation Constant
HqsalBr (HL1)OrangePale yellow357 (12,428)-
HqsalBr2 (HL2)RedPale yellow351 (13,732)-
[Ni(qsalBr)2] (1)BrownDeep orange484 (20,545)2.52 × 10⁶
[Zn(qsalBr)2] (2)OrangeLight orange460 (15,690)5.67 × 10⁵
[Ni(qsalBr2)2] (3)BrownDeep orange487 (14,810)8.69 × 10⁵
Table 3. Thermogravimetric analytical results of Schiff base ligand and complexes.
CompoundsTG Range (°C)Weight Loss Exp. (Calcd.)%Total Weight Loss Exp. (Calcd.)%AssignmentResidue
[Ni(qsalBr)2] (1)
C32H20Br2N4NiO2
138–467
467–685
685–1000
22.64 (22.89)
20.48 (19.78)
43.37 (42.40)
86.49 (85.07)Br2
C9H2NO
C20H18N3
NiO, C atom
[Zn(qsalBr)2] (2)
C32H20Br2N4ZnO2
137–466
466–682
682–1000
22.22 (22.11)
20.83 (19.62)
41.59 (42.08)
84.64 (83.81)Br2
C9H2NO
C20H18N3
ZnO, C atom
[Ni(qsalBr2)2] (3)
C32H18Br4N4NiO2
137–467
467–575
575–1000
36.33 (36.54)
27.92 (28.72)
35.75 (34.74)
100 (100)Br4
C18H4N2
C14H14N2O2Ni
-
Table 4. Crystal data and structure refinement for complex 3.
Crystal DataComplex 3
Compound[Ni(qsalBr2)2]
Empirical formula C32H18Br4N4NiO2
Formula weight 868.83
Temperature/K 100.01
Crystal system monoclinic
Space group P21/c
a/Å 21.8302 (12)
b/Å 10.1217 (6)
c/Å 13.4878 (8)
α/° 90
β/° 103.808 (2)
γ/° 90
Volume/Å3 2894.1 (3)
Z 4
ρcalc g/cm3 1.9939
μ/mm−1 6.232
F (000) 1685.8
Crystal size/mm3 0.63 × 0.62 × 0.13
Radiation MoKα (λ = 0.71073)
2Θ range for data collection/° 4.46 to 51.56
Index ranges −26 ≥ h ≥ 26, −12 ≥ k ≥ 12, −16 ≥ l ≥ 16
Reflections collected 54,704
Independent reflections 5542 [Rint = 0.1105, Rsigma = 0.0519]
Data/restraints/parameters 5542/0/388
Goodness-of-fit on F2 1.096
Final R indexes [I ≥ 2σ (I)] R1 = 0.0532, wR2 = 0.0942
Final R indexes [all data] R1 = 0.0744, wR2 = 0.1008
Largest diff. peak/hole/e Å−3 1.27/−1.27
Table 5. Selected bond lengths [Å], bond angles [°], and torsion angles [°] for complex 3.
Bond Lengths [Å]Ligand
HL2
Complex 3Bond
Angles [°]
Ligand
HL2
Complex 3Torsion
Angles [°]
Ligand
HL2
Complex 3
C8−C91.431 (3)1.437 (8)C15−C16−C11115.0 (2)114.3 (6)C11−C10−N2−C9178.0 (2)168.7 (6)
C11−C161.447 (2)1.427 (9)C16−C11−C10120.4 (2)124.9 (6)C9−C8−N1−C7−178.6 (2)176.8 (6)
C15−C161.437 (3)1.43 (1)C12−C11−C10118.1 (2)114.1 (5)N1−C8−C4−C3178.4 (2)176.8 (6)
O2−C161.280 (2)1.275 (7)C10−N2−C9127.1 (2)120.0 (5)C13−C12−C11−C10177.2 (2)175.1 (6)
N2−C91.416 (3)1.424 (9)C7−N1−C8117.2 (2)119.0 (6)C10−N2−C9−C13.8 (3)15 (1)
N2−C102.312 (2)1.316 (8)N2−C9−C8115.4 (2)114.3 (5)C15−C14−C13−C12−0.3 (4)−3 (1)
N1−C71.318 (3)1.322 (8)N1−C8−C4118.2 (2)118.3 (6)N1−C8−C9−N21.8 (3)−0.7 (8)
N1−C81.367 (3)1.351 (9)N2−C9−C1123.7 (2)126.3 (6)
O2−C16−C11122.1 (2)125.7 (6)
O2−C16−C15123.0 (2)119.9 (6)
Table 6. HOMO and LUMO energy (eV) and quantum parameters are calculated based on energy gaps for the ligands and their metal complexes.
eVEHELΔEηSμχω
HL1−5.86−1.873.981.99185.82−3.873.873.75
HL1–Ni−4.92−2.712.211.10335.41−3.823.826.60
HL1–Zn−5.25−2.442.811.41263.50−3.843.845.25
HL2−5.97−2.063.911.95189.49−4.014.014.12
HL2–Ni−5.10−2.882.221.11332.91−3.993.997.15
Table 7. The binding constant (Kb), the Stern–Volmer constant (Ksv), and the quenching constant (Kq) between the complexes with CT–DNA.
ComplexesKb (M−1)Ksv (M−1)Kq (M−1 s−1)
[Ni(qsalBr)2] (1)1.13 × 1061.78 × 1047.74 × 1011
[Zn(qsalBr)2] (2)4.82 × 1062.00 × 1048.70 × 1011
[Ni(qsalBr2)2] (3)6.02 × 1051.66 × 1047.22 × 1011
Table 8. IC50 values for A549 cell line.
CompoundIC50 (µM)CompoundIC50 (µM)
HL1N/A a[Ni(qsalBr)2] (1)258.43 ± 6.25
HL2N/A[Zn(qsalBr)2] (2)88.59 ± 5.90
Etoposide18.61 ± 1.25[Ni(qsalBr2)2] (3)315.00 ± 9.20
Cisplatin [49]21.3
a IC50 value could not be determined.
Table 9. Binding energy into the B–DNA and the EGFR kinase domain.
CompoundBinding Energy (kcal/mol)
1bna7ukv
HL1−8.07ukv
HL2−7.7−7.8
[Ni(qsalBr)2] (1)−7.8−7.2
[Zn(qsalBr)2] (2)−8.7−9.0
[Ni(qsalBr2)2] (3)−9.1−8.6
ZRT (Lazertinib)−9.3
Disclaimer/Publisher’s Note: The statements, opinions and data contained in all publications are solely those of the individual author(s) and contributor(s) and not of MDPI and/or the editor(s). MDPI and/or the editor(s) disclaim responsibility for any injury to people or property resulting from any ideas, methods, instructions or products referred to in the content.

