Article

Enhancing the Wetting Properties of Activated Biochar by Oxidation with Hydrogen Peroxide

Biorefinery Laboratory, Latvian State Institute of Wood Chemistry, Dzerbenes Street 27, LV-1006 Riga, Latvia
*
Author to whom correspondence should be addressed.
Chemistry 2024, 6(5), 911-921; https://doi.org/10.3390/chemistry6050053
Submission received: 23 July 2024 / Revised: 16 August 2024 / Accepted: 30 August 2024 / Published: 3 September 2024
(This article belongs to the Section Chemistry of Materials)

Abstract

:
In order to explore the possibilities of increasing the hydrophilicity of carbon-based adsorbents, catalysts, or electrode materials in aqueous solutions, the oxidation of wood-based activated biochar using H2O2 was investigated. The properties of oxidized activated biochar obtained at different activation temperatures (600, 700, and 800 °C) and H2O2 oxidized for 15–180 min were investigated using the characteristics of surface functionality, elemental composition, porous structure, contact angle measurements, FTIR spectroscopy, and immersion calorimetry. It was observed that the optimal oxidation time was different for each sample depending on activation temperature, and the degree of oxidation can be tailored by changing the oxidation time. The course of oxidation depends on the degree of graphitization and functionalization, determined by the activation temperature. It was established that the highest degree of oxidation and increase in wettability is observed for samples with the lowest degree of activation obtained at a temperature of 600 °C.

1. Introduction

Interfacial interactions play an important role in a variety of processes used in a number of technologies. Understanding the mechanisms and knowing the parameters of particle interaction with a surface are necessary for the successful functioning of many systems and devices. Wetting of a solid material, that is, hydrophobicity (lipophilicity) or hydrophilicity, is an important property that determines the ability of a liquid to establish and maintain contact with the surface of a solid [1,2]. One of the factors that determines wetting is the surface tension of the liquid, in which lower surface tension results in a smaller contact angle (CA) and causes the liquid to spread over the surface of the solid. Generally, a contact angle of less than 90° means that the wetting of the solid is favorable, and complete wetting occurs when the angle is 0° [3,4]. Another important factor is interfacial tension between the liquid and the solid. Here, wetting depends on the properties of the solid, especially its surface, and is determined by the chemistry and topography of the available surface [1,5]. In general, increasing surface roughness further increases the wetting of hydrophilic materials (CA below 90°) but decreases the wetting of materials that are already hydrophobic (CA above 90°). The porosity of the solid also plays a role since porous materials will absorb the liquid, and this can result in a decrease in contact angle; however, this is not always true and depends on the pore morphology [6,7]. When it comes to water wetting, the best effect will be on hydrophilic surfaces containing polar surface groups [8].
A lot of research has been devoted to the wetting properties of carbon materials, as these materials are often used in aqueous environments [9]. For example, enhanced wetting is an important property for materials used in electrochemistry, as it improves contact with electrolyte and charge transfer; additionally, it can reduce surface resistance, mass transfer, and competing reactions, altogether leading to better performance [6]. The aliphatic (alkyl) functional groups CH and CH3 are reported to make the carbon surface more hydrophobic. On the other hand, oxygen-containing functional groups such as C=O-containing carboxyl groups should make the carbon surface more hydrophilic through electrostatic interactions and hydrogen bonding, but some experimental data do not provide a clear correlation [10,11]. For example, graphene is considered hydrophobic or hydrophilic, with a contact angle ranging from 30° to 127° depending on the substrate and environmental factors [12]. Research has shown that the water wetting of graphene can be altered by p- and n-type doping. Another important factor affecting the water wettability of graphene is the presence of functional groups on the surface: Polar oxygen-containing groups on the surface of graphene enhance its wettability [2].
Unlike 2D graphene, biochar is a much more complex 3D structure containing disordered layers of graphene along with amorphous carbon and pores of varying sizes. Pore wetting will depend on capillary forces, which depend on the surface tension of water, the width of the pores, and the surface chemistry of the pore walls. A hydrophilic pore surface will create positive capillary pressure, drawing water into the pores, while a hydrophobic surface will have the opposite effect [10].
Different wet and dry methods for the oxidation of carbon materials have been employed. Air oxidation is a relatively cheap and simple oxidation method to increase the porosity and oxygen content of coal or biochar. However, this method does not achieve a high degree of oxidation and results in a decrease in porosity when used on highly porous materials (BET over 1000 m2 g−1) and higher burn-off [13,14]. Another dry oxidation method uses ozone instead of air, and this allows for the reaction to take place at lower temperatures and still deliver effective oxidation with less burn-off and less damage to porous structure [14]. Wet oxidation methods usually employ HNO3 or H2O2 as oxidizing agents. Experiments on the oxidation of materials made from carbon nanotubes with a mixture of nitric and sulfuric acids showed a sharp decrease in the water contact angle, and the material thus passes from a superhydrophobic state to a hydrophilic one, opening up new possibilities for using this material [15]. Activated carbon has also been successfully oxidized using HNO3 and H2O2. HNO3 introduced more surface groups than H2O2 but resulted in a high decrease in porosity (around 30%) [14]. Such research demonstrates the importance of surface chemistry on the wetting properties of carbon materials as well as the negative aspects of some oxidation methods, such as decrease in porosity and yield loss due to high burn-off. Oxidation experiments with biochar have shown H2O2 as an effective, cheap, and environmentally friendly option for the introduction of oxygen-containing surface groups into the biochar’s structure [16,17]. These studies have explored the effects of H2O2 concentration and mixing on the oxidation process.
Our research aimed at producing an effective and environmentally friendly activated biochar catalyst for use in electrochemistry. For this purpose, high wettability had to be archived without destroying the porous structure; for these reasons, the H2O2 oxidation method was chosen. In this work, we studied the oxidation kinetics of 30% H2O2 on alkali-activated biochars by varying the treatment time from 15 to 180 min; furthermore, we examined the effect this oxidation had on the water wetting properties of oxidized samples.

2. Materials and Methods

2.1. Synthesis and Modification of Materials

Activated biochar was used as precursor for oxidation experiments. Lump charcoal (commercial alder charcoal produced by KRK Vidzeme Ltd., Riga, Latvia) was produced by indirect heating retort [18] at 450–500 °C, crushed with Retsch SM 100 mill (Haan, Germany) with 1.5 mm sieve, and ground in a Fritsch Pulverisette 5 (Bavaria, Germany) ball mill to obtain particles size distribution d50 = 8 µm. The obtained powder was mixed with NaOH in a ratio of 1:3 biochar to NaOH, followed by heating at temperatures 600 °C, 700 °C, and 800 °C in a stream of Ar (100 l h−1). The obtained samples where then demineralized with 10% HCl and rinsed to neutral pH with deionized water and dried for 24 h at 105 °C. More information about our chemical activation method is available in [19,20]. This process resulted in three different activated biochar samples labeled according to their activation temperature as 600, 700, and 800. Oxidation experiments were then performed for all three activated biochar samples as follows: 5 g of activated biochar was mixed with 50 mL of 30% H2O2, and the resulting suspension was mixed at 60 °C under reflux conditions for 15, 30, 60, 120, and 180 min. Afterward, the samples were filtered, washed using distilled water, and dried for 24 h at 105 °C. The resulting samples were labeled by the activation temperature and oxidation time; for example, the sample activated at 600 °C and oxidized for 15 min is labeled as 600–15 min.

2.2. Characterization of Synthesized Materials

Carbon, nitrogen, and hydrogen content was determined using the Vario Macro CHNSO (Elementar Analysensysteme GmbH, Langenselbold, Germany) device. The oxygen content was calculated from a difference of 100%. The porous structure (specific surface area, total volume of micro- and mesopores, and pore sizes) was determined from isotherms of low-temperature nitrogen adsorption–desorption at 77 K on a Nova 4200e device (Quantachrome, Boynton Beach, FL, USA). Surface chemistry was characterized using Boehm titration [21,22]. Samples were treated with 0.075 M NaOH or HCl solution for 24 h, and then, filtration and titration of the filtrate allowed us to determine the amount of acidic and basic surface groups expressed in mmol per g of sample. Two replicates were performed for each sample. To further characterize the surface, FTIR spectra were recorded for untreated samples and samples treated for 60 min using the Thermo Scientific Nicolet iS50 spectrometer (ThermoFisher Scientific, Waltham, MA, USA) with ATR method. These analyses were used to determine how treatment time affected the degree of oxidation and to determine the optimal treatment time for each type of activated biochar—60 min was determined to be the average optimal treatment time for all types of activated biochars, so these samples along with untreated and 15 min treated samples were investigated further.
Further analysis focused on examining how the oxygen and surface groups introduced by oxidation affected the wetting properties. Contact angle measurements were performed using a goniometer Dataphysics OCA20 (Filderstadt, Germany), using the static sessile drop technique where 10 μL of distilled water was deposited on the sample’s surface, a digital camera took pictures of the droplet every second, and the computer software traced the contour of the droplet and calculated the average contact angle from both sides of the droplet contour. As the contact angle changed during measurement, data were recorded for at least 70 s after the droplet deposition on the sample surface, and the experiment was repeated three times for each sample. To prepare powdered samples for such analysis, two-sided adhesive tape was attached to a microscope slide, and the sample was applied onto the tape and compressed.
The other method for evaluation of wetting was immersion calorimetry. This method measures the heat that is released when a solid comes in contact with a liquid, providing information about the surface chemistry of the solid sample. The sample was weighed into a glass ampule, followed by degassing at 300 °C and 6 mBar for 3 h, which was completed by sealing the ampule using a propane–oxygen torch. The sealed ampule was then placed in a high-precision Calvet-type calorimeter Setaram C80 (Caluire-et-Cuire, France), where the ampule was broken, the sample was allowed to mix with water, and the resulting heat flow was measured as a function of time. Experimentation using an empty ampule was also performed to serve as a blank and to correct for the endothermic reaction of water evaporation upon entering the vacuumed ampule.

3. Results and Discussion

The results of the elemental analysis are presented in Table 1. For all samples, the oxidation treatment was successful as attributed to an increase in oxygen content with increased oxidation time. All samples seemed to exhibit an optimal treatment time dependent on the activation temperature, after which no further increase in the degree of oxidation occurred, which can be explained by the absence of free unreacted reaction centers on the surface. Biochar activated at the lowest temperature of 600 °C oxidized more intensely, reaching its maximum of 25% oxygen content after 30 min treatment. Biochars activated at higher temperatures reached their maximum after longer treatment time and with a lower maximum oxygen content of 15% after 60 min for 700 °C and 11% after 120 min for 800 °C samples. This difference in the rate and degree of oxidation for the 600 °C sample might be explained by the features of the polyaromatic structure and presence of active centers, which did not react with alkali due to the low activation temperature. It is known that distinct reactions of carbonized wood with alkali take place at temperatures above 500 °C and are accompanied by the evolution of volatiles and formation of carbon’s porous structure [23]. An increase in activation temperature leads to the growth and reconfiguration of formed graphene layers, thus creating a more thermostable polyaromatic structure and increasing the specific surface area [24,25]
Previously, we demonstrated using X-ray diffraction [20] that, contrary to the samples of carbons activated with alkali at 600 °C, with the increase in temperature appears maximum C (002) (graphite–graphite) [26], which corresponds to amorphous carbon with certain quantities of graphitized carbon embedded into the amorphous matrix. This type of carbon forms via partial transformation of amorphous carbon into its more ordered form, which, in turn, forms a carbonaceous matrix.
The results of the Boehm titration are presented in Figure 1, where total surface functionality is the sum of acidic and basic surface groups and is expressed in mmol surface groups per gram of sample. The oxygen content from the elemental analysis is also plotted in Figure 1 to illustrate the relationship between the oxygen content and surface functionality.
During oxidation, the content of surface groups increased alongside the increase in oxygen content, indicating that oxygen is introduced in the form of oxygen-containing surface groups. It was also observed that these groups are mostly acidic. However, the change in surface groups is not entirely proportional to the changes in oxygen content; comparing samples 600 and 700, we see a significant difference in oxygen content (about 10%); however, the difference in surface groups is insignificant. This could be explained by the difference in the type of surface groups present, their availability towards acid or base solutions used in the Boehm titration, or the comparatively intense oxidation reaction for the 600 °C sample characterized by intense bubbling and steam release; these conditions might have disrupted the formation of active surface groups and could also explain the drop in oxygen content at 120 min. Comparing samples 700 and 800, the amount of surface groups is proportional to the oxygen content. Sample 700 is also characterized by decrease in oxygen-containing groups at the longest oxidation duration of 180 min, which could be explained by the changes in the type and availability of these surface groups.
Figure 2 shows the FTIR spectra of the activated biochar before and after oxidation and their differential spectra. The absorption bands of FTIR spectra were assigned in accordance with the literature [27,28]. The activated biochars did not show any significant absorbance in the range of the free OH stretching vibration 3700–3600 cm−1 and hydrogen-bonded OH vibration 3600–3000 cm−1 that indicate a negligible amount of OH groups. After oxidation, the absorbance intensity at 3400 cm−1 increased, and this confirmed the presence of hydrogen-bonded OH groups on the surface or/and within the pores of activated biochar. The highest absorbance at 3400 cm−1 was observed for the activated biochar obtained at 600 °C and oxidized for 60 min, and this was in good accordance with previous data where the highest oxygen content after oxidation was observed for sample 600. Low absorbance at the range 3000–2800 cm−1 indicated that the amount of aliphatic carbon in the activated biochars was very small. Different oxygen-containing structures were identified in the carbonyl C=O and ester C-O-R groups’ vibration regions. All samples under study showed absorption around 1700 cm−1, typical for a carbonyl group. After oxidation, their intensity significantly increased, especially in the case of the activated biochar obtained at 600 °C; this is also in good accordance with the elemental analysis. The intensity of carbonyl group absorption maximum decreased with the increase in carbonization temperature. After oxidation, absorption at 1100 cm−1 also increased. Aromatic structure vibration can be observed at 1580–1560 cm−1 (ring stretching vibrations) and 1000–650 cm−1 (out of plane C-H deformation vibrations). The shifting of the absorption maxima and increase in the absorption intensity of aromatic structure after oxidation can be explained as a result of the formation of a different polycyclic structure compared to the activated biochar before oxidation.
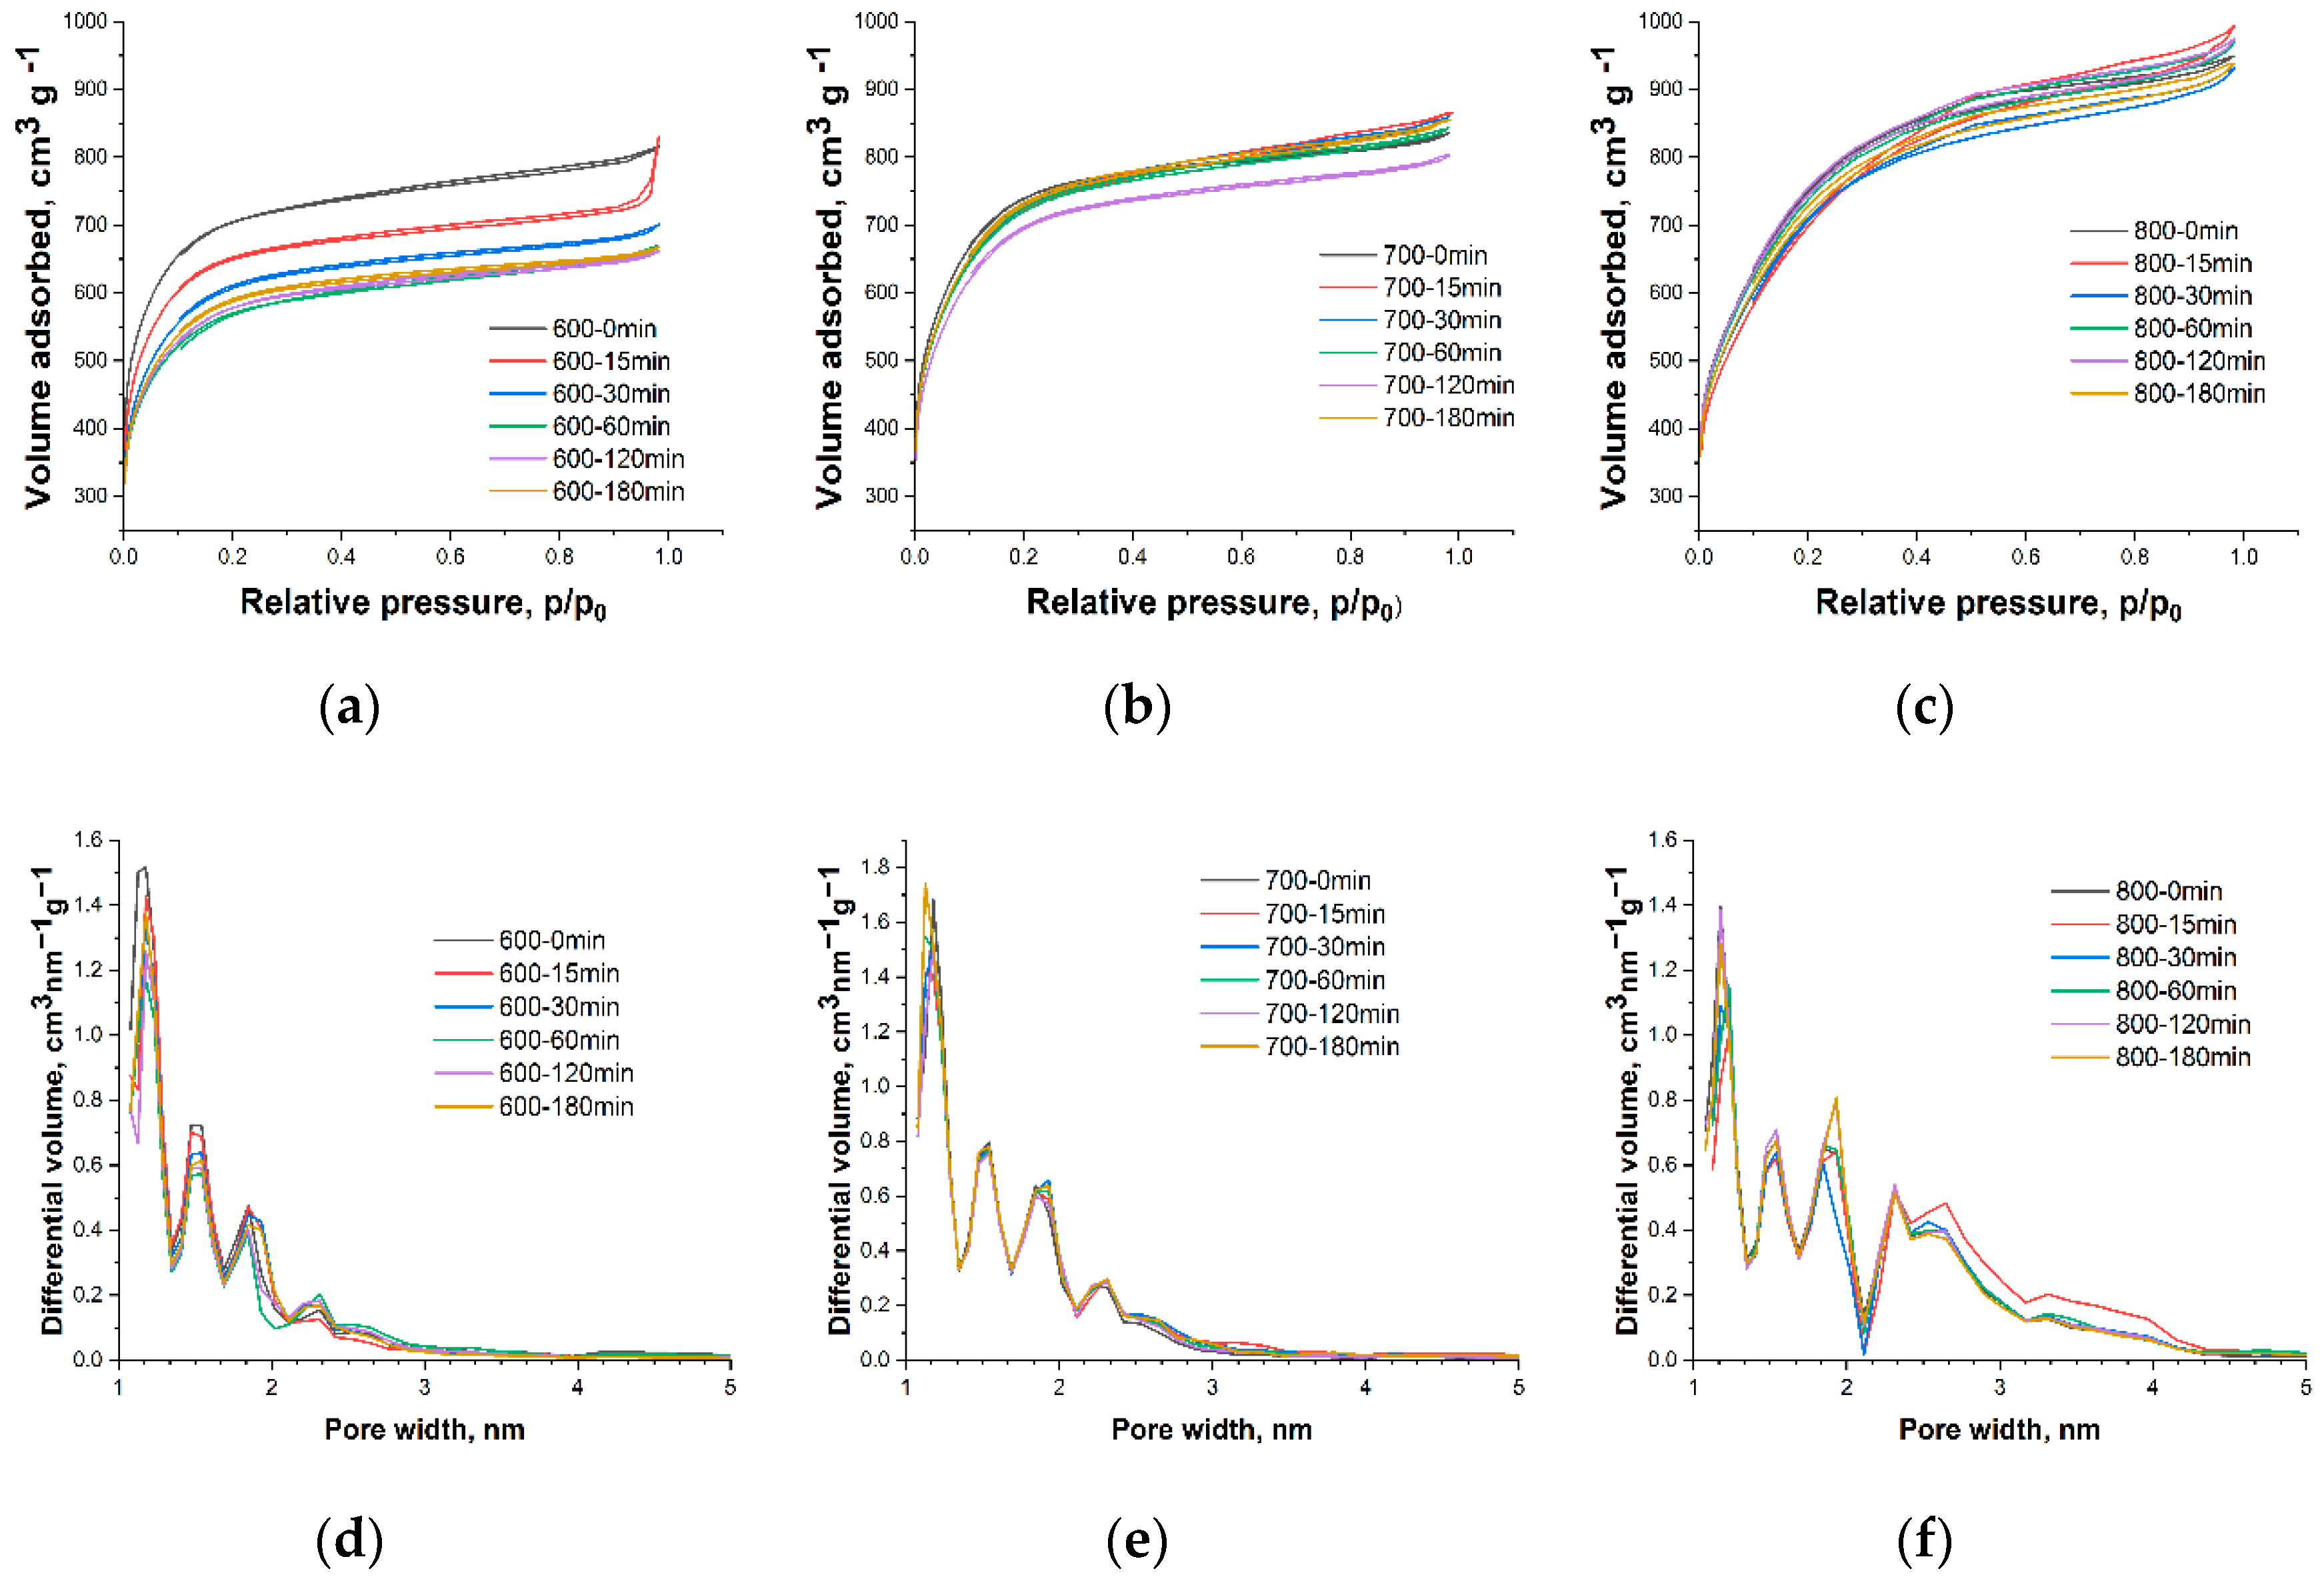
To study changes in the porous structure of activated biochar after oxidation, low-temperature nitrogen sorption was used (Figure 3).
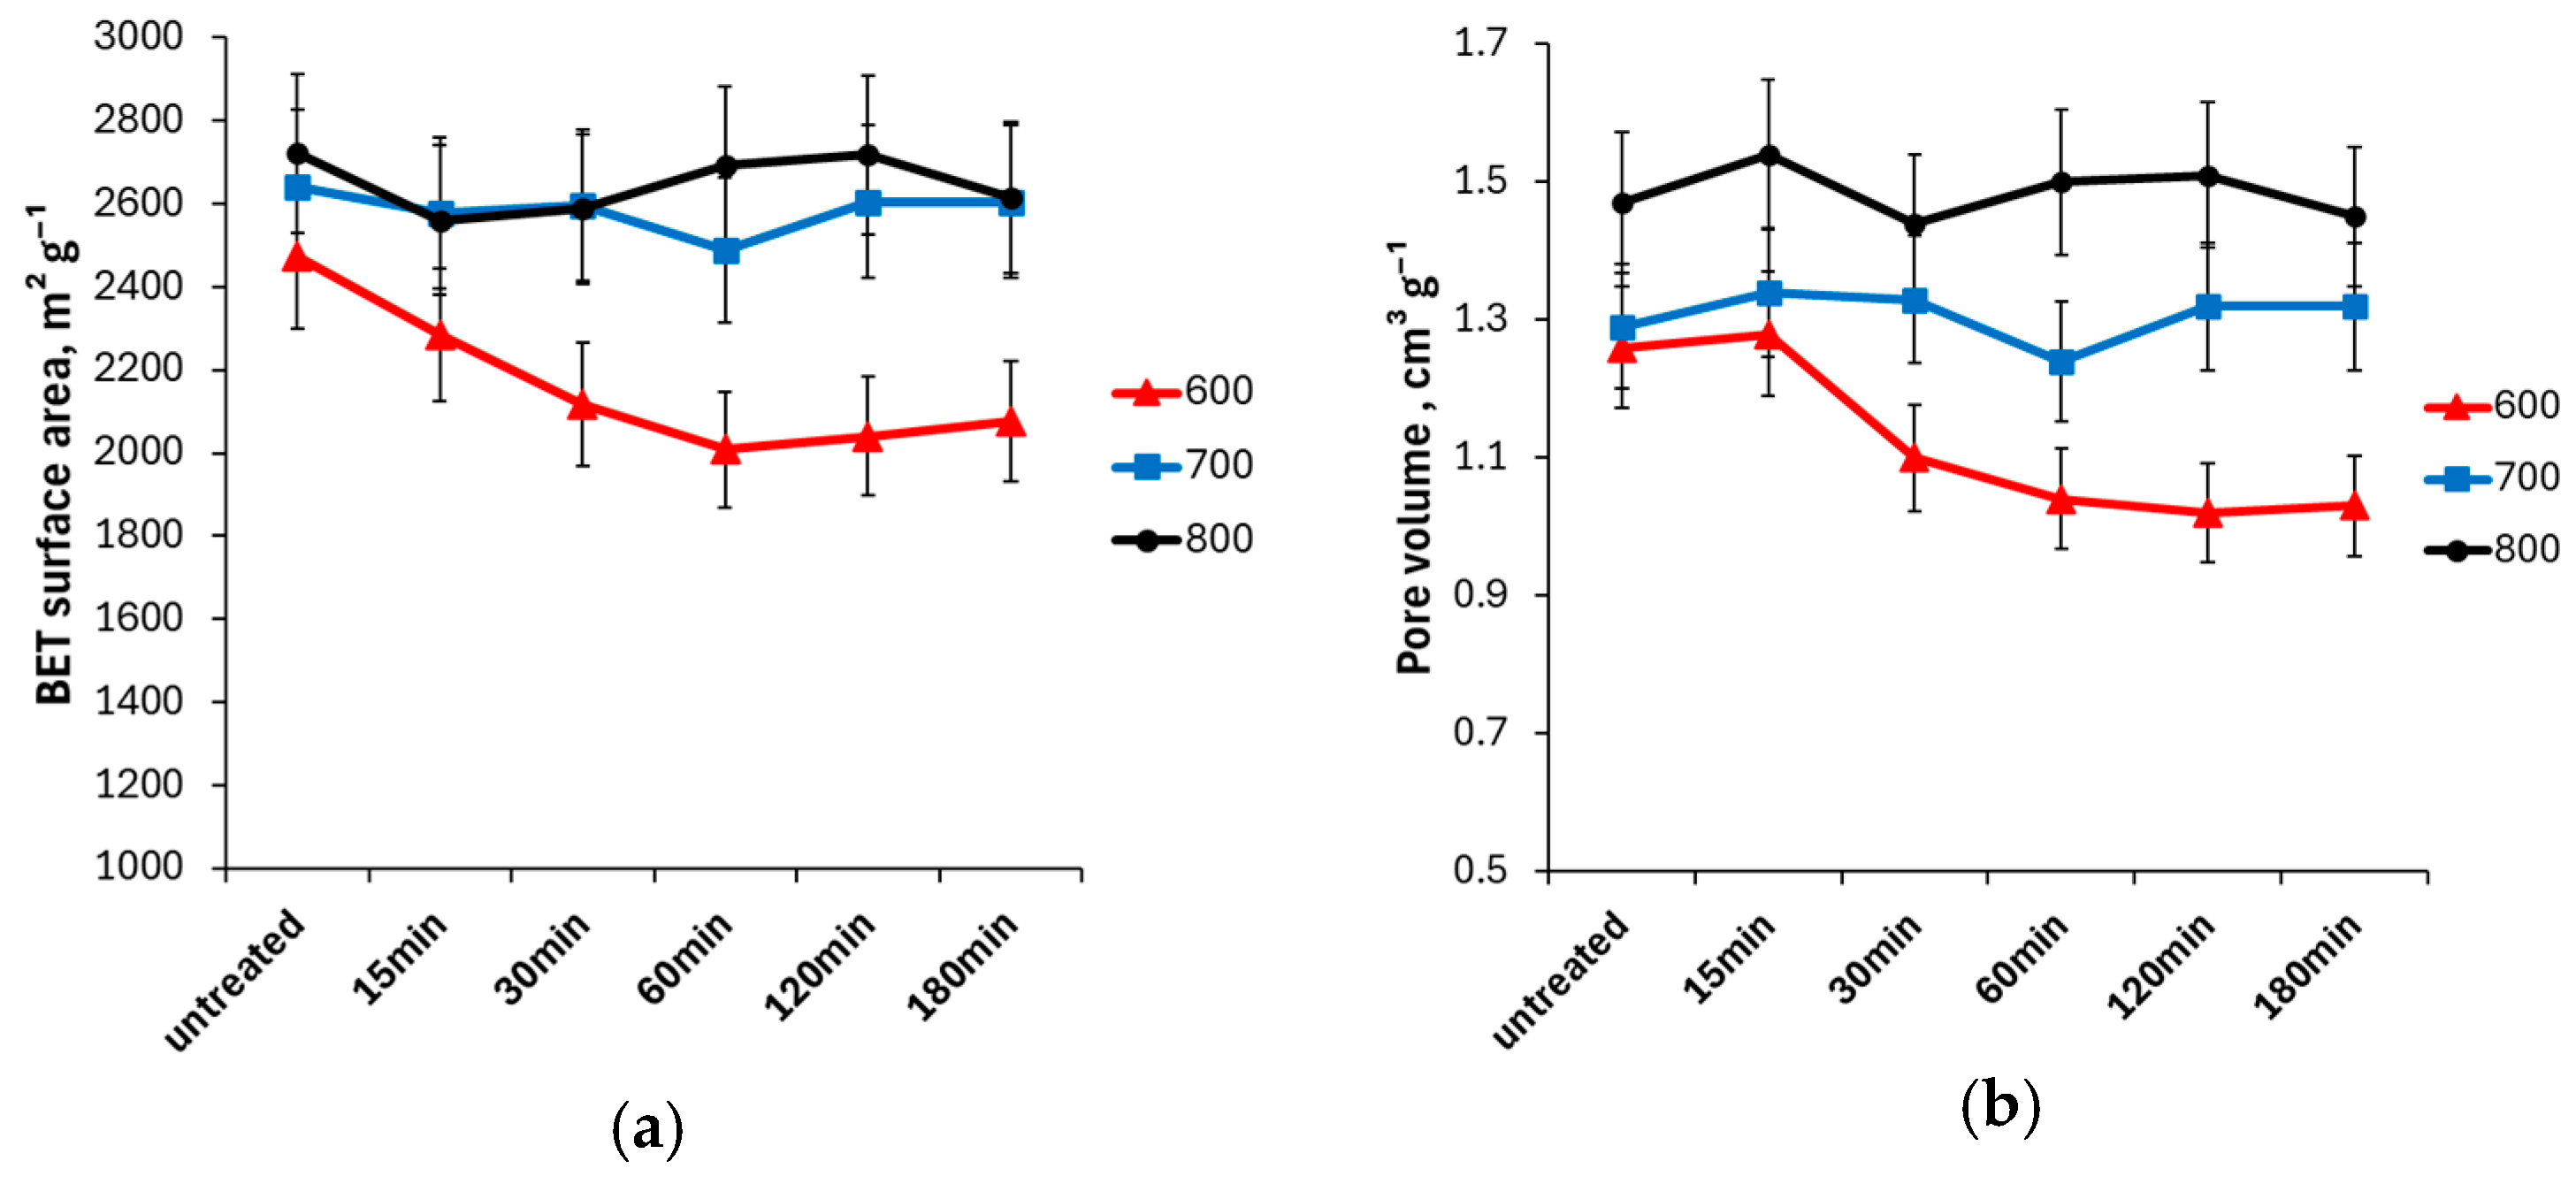
All the samples under study are micro-mesoporous. The different slopes of the nitrogen sorption isotherms indicate the influence of the activation temperature on the porous structure. With an increase in activation temperature from 600 to 800 °C, the specific surface area SBET of untreated materials increased from 2474 to 2722 m2 g−1. A higher activation temperature leads to an increase in the total pore volume and a redistribution of pore volumes, namely a reduction in micropores and an increase in mesopore volumes due to the destruction of the walls of smaller pores. This high surface area is the main desirable property of activated carbons including activated biochar, so it is preferable for oxidation treatment to not interfere with the porous structure of the material.
Experimental data (Figure 4) revealed that in the case of biochar activated at higher temperatures (700 and 800), there was no significant change in the surface area or micropore volume. This indicates that the carbon structure in these samples was stable under this oxidation treatment, and oxidation occurred only at the surface. Activated biochar 600 showed a steady decrease in surface area during oxidation up to 60 min as well as a decrease in pore volume, indicating changes in the carbon structure. This could be correlated with the significant increase in oxygen content for sample 600 and can be explained by the less thermostable carbon structure as discussed above.
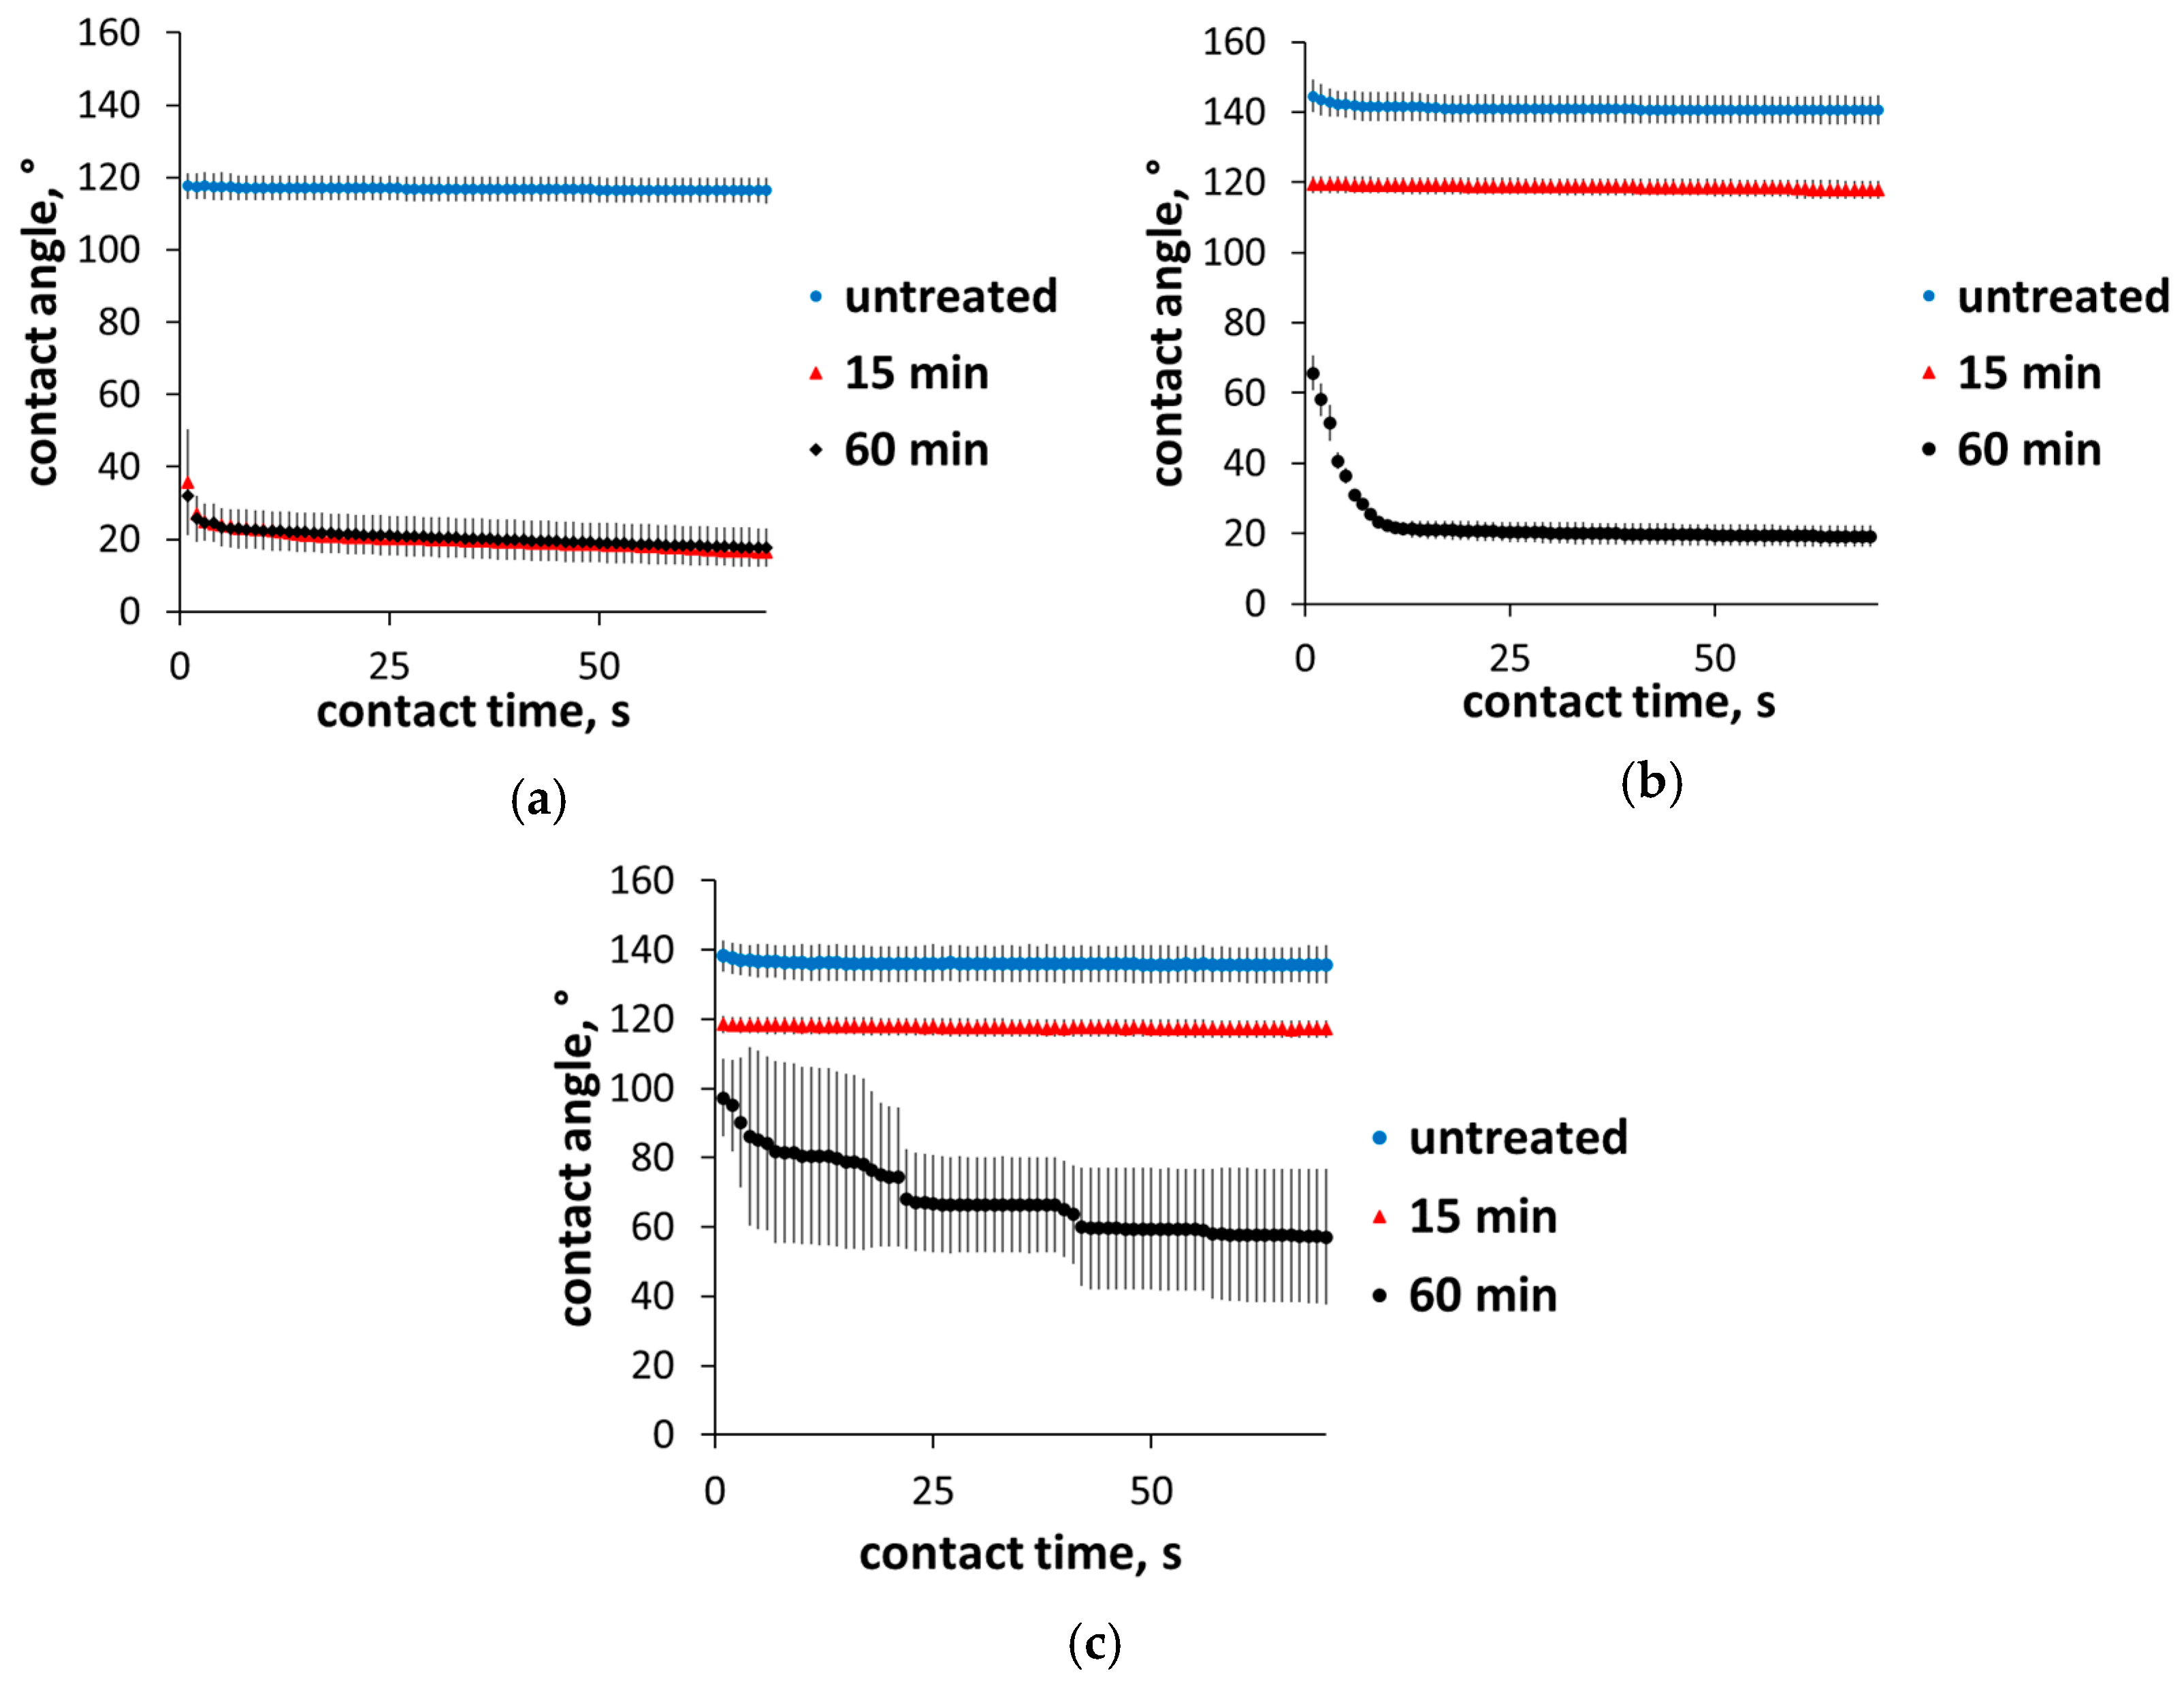
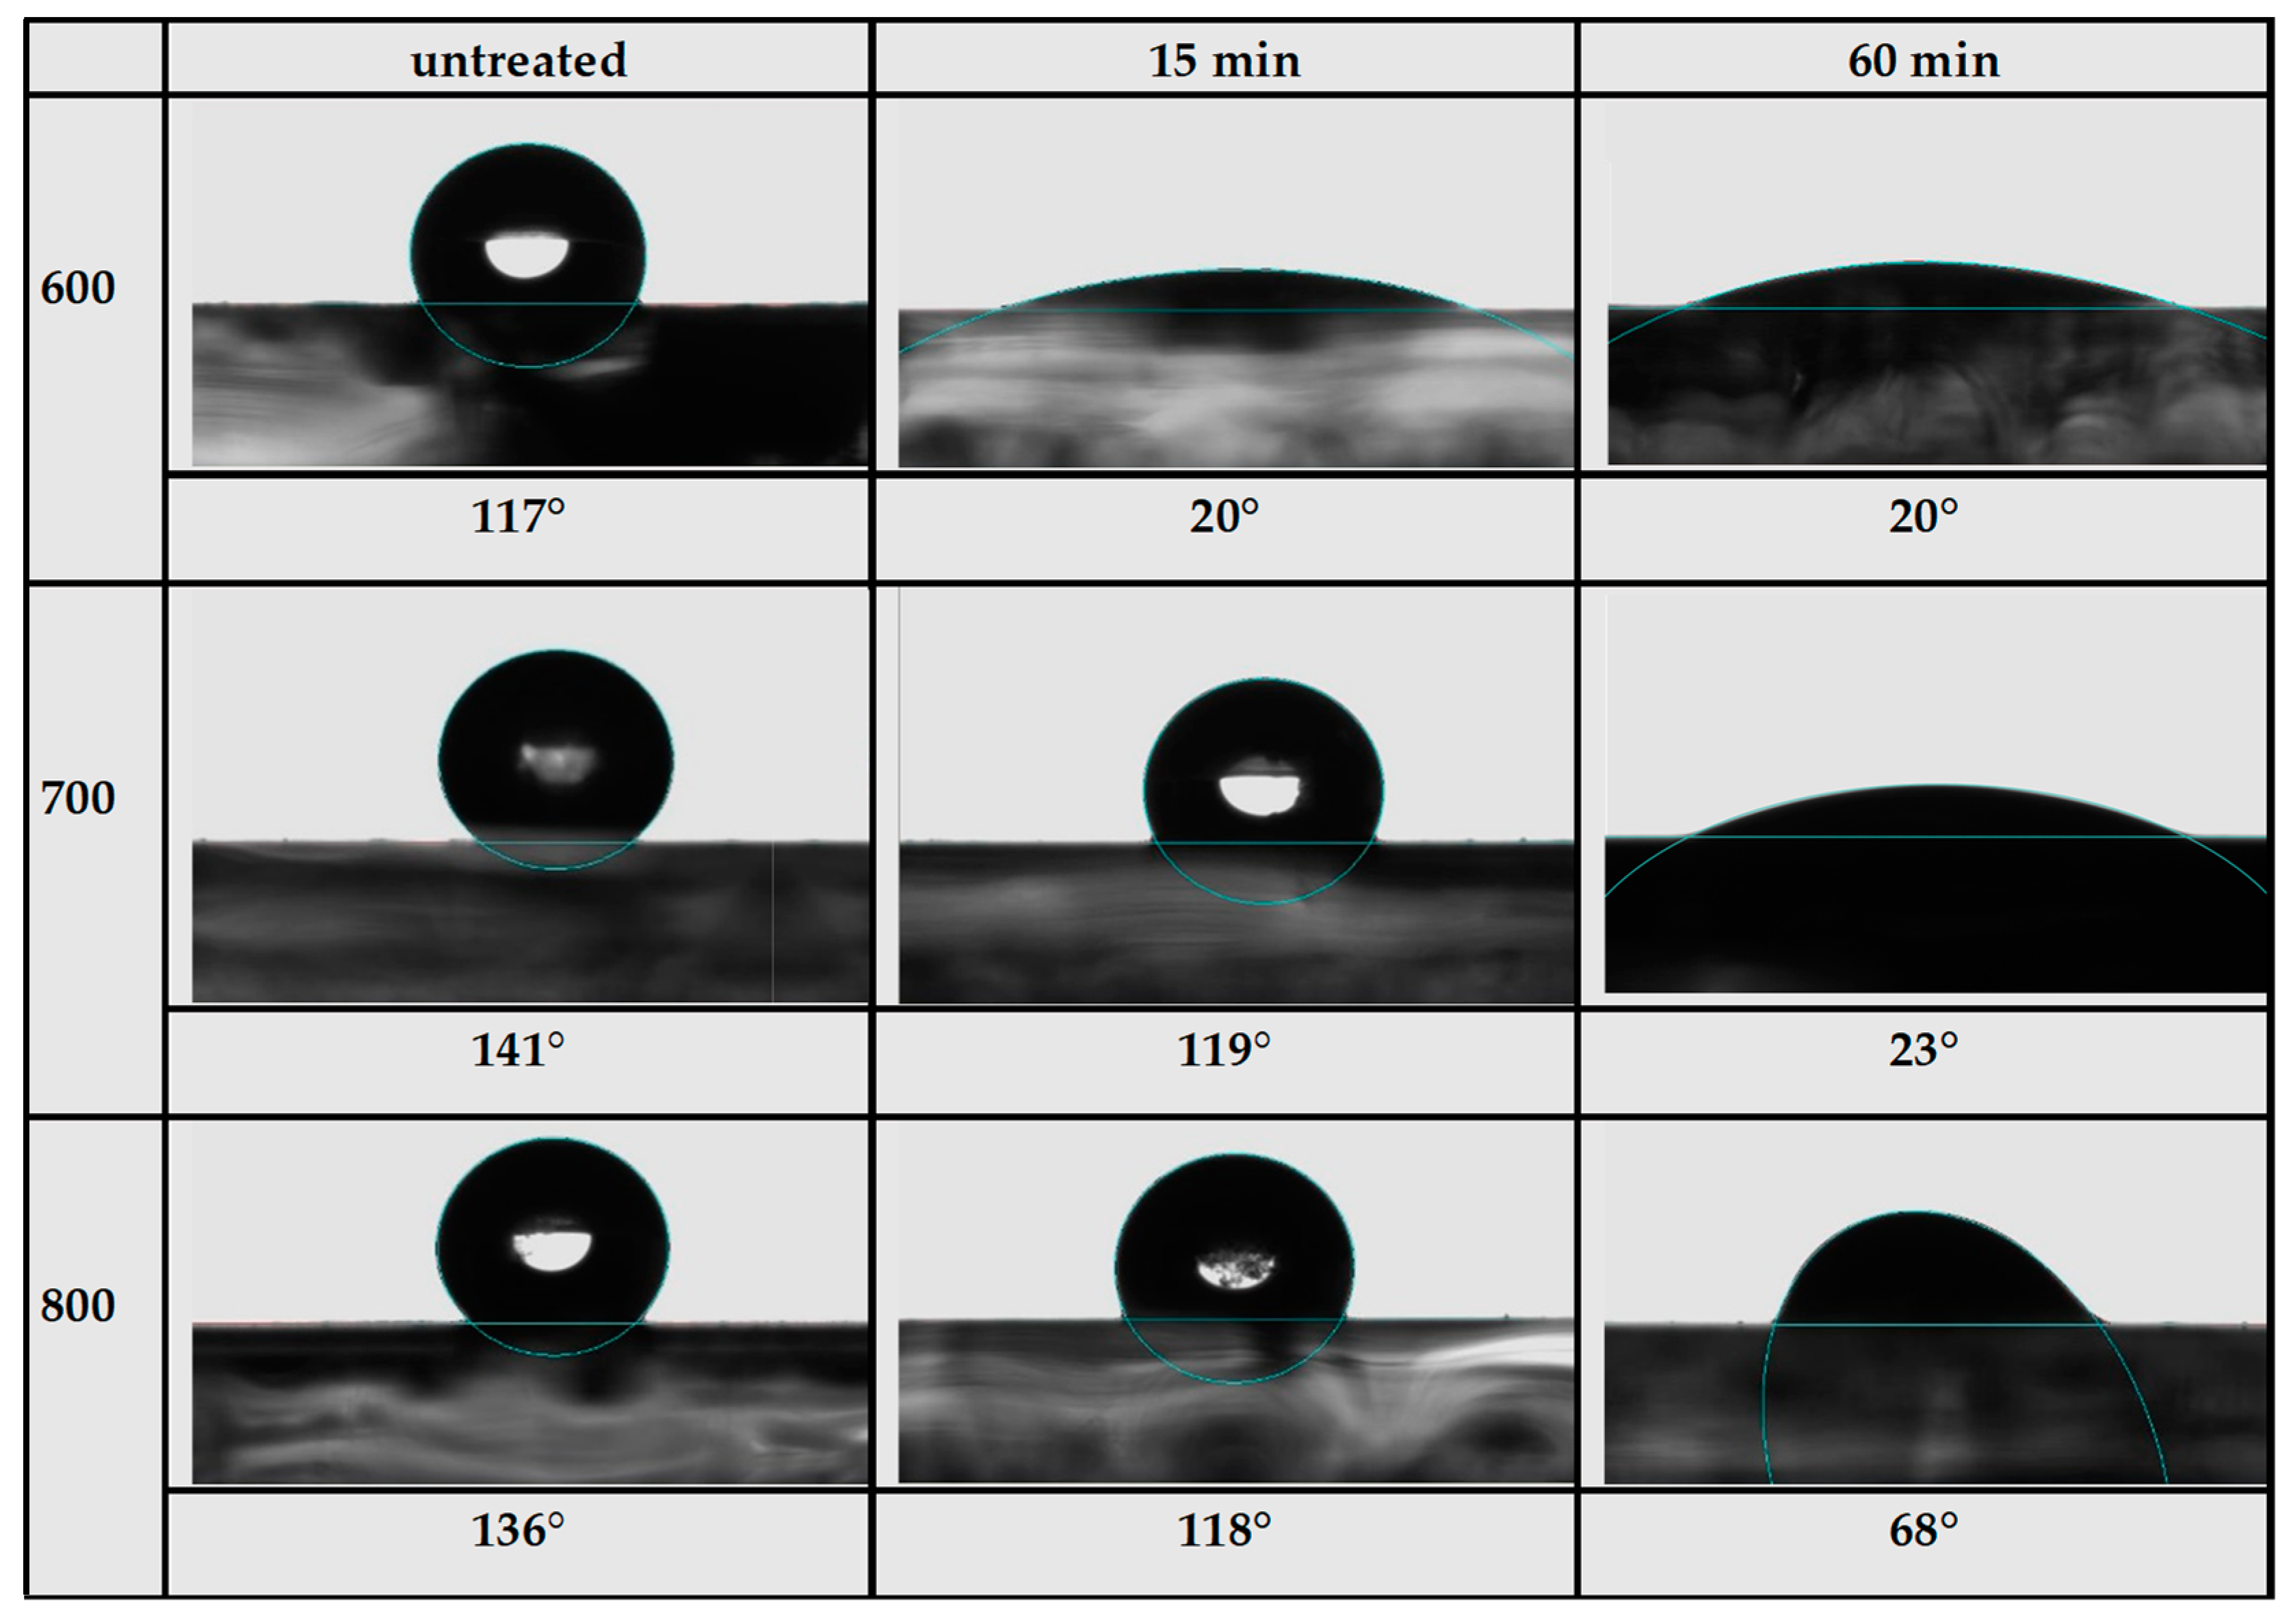
Contact angle measurements are presented in Figure 5, and the average contact angles along with a picture for each sample are presented in Figure 6. The average contact angle is the average value for the contact angle starting from 1 s up to 70 s. The equilibrium contact angle was not used because some of the samples did not reach a stable equilibrium. Untreated samples, despite having some oxygen content and surface groups, exhibited a hydrophobic surface with a contact angle above 90°. After 15 min of oxidation, the contact angle decreased slightly by about 20° for higher-temperature samples 700 and 800 and decreased significantly for sample 600, reaching a hydrophilic surface with a contact angle of 20°. Increasing oxidation time to 60 min led to a further decrease in contact angle for samples 700 and 800. After 60 min oxidation, sample 700 showed a hydrophilic surface with an average contact angle of 23°. Sample 800 also showed a decrease in contact angle, but it was not as significant, reaching an average contact angle of 68°. Sample 600 did not further demonstrate a decrease in contact angle since the degree of oxidation probably reached a maximum at 15 min. This is consistent with the increase in oxygen content, where the increase was faster for sample 600, which almost reached a maximum after 15 min, but was slower and less pronounced for samples 700 and 800.
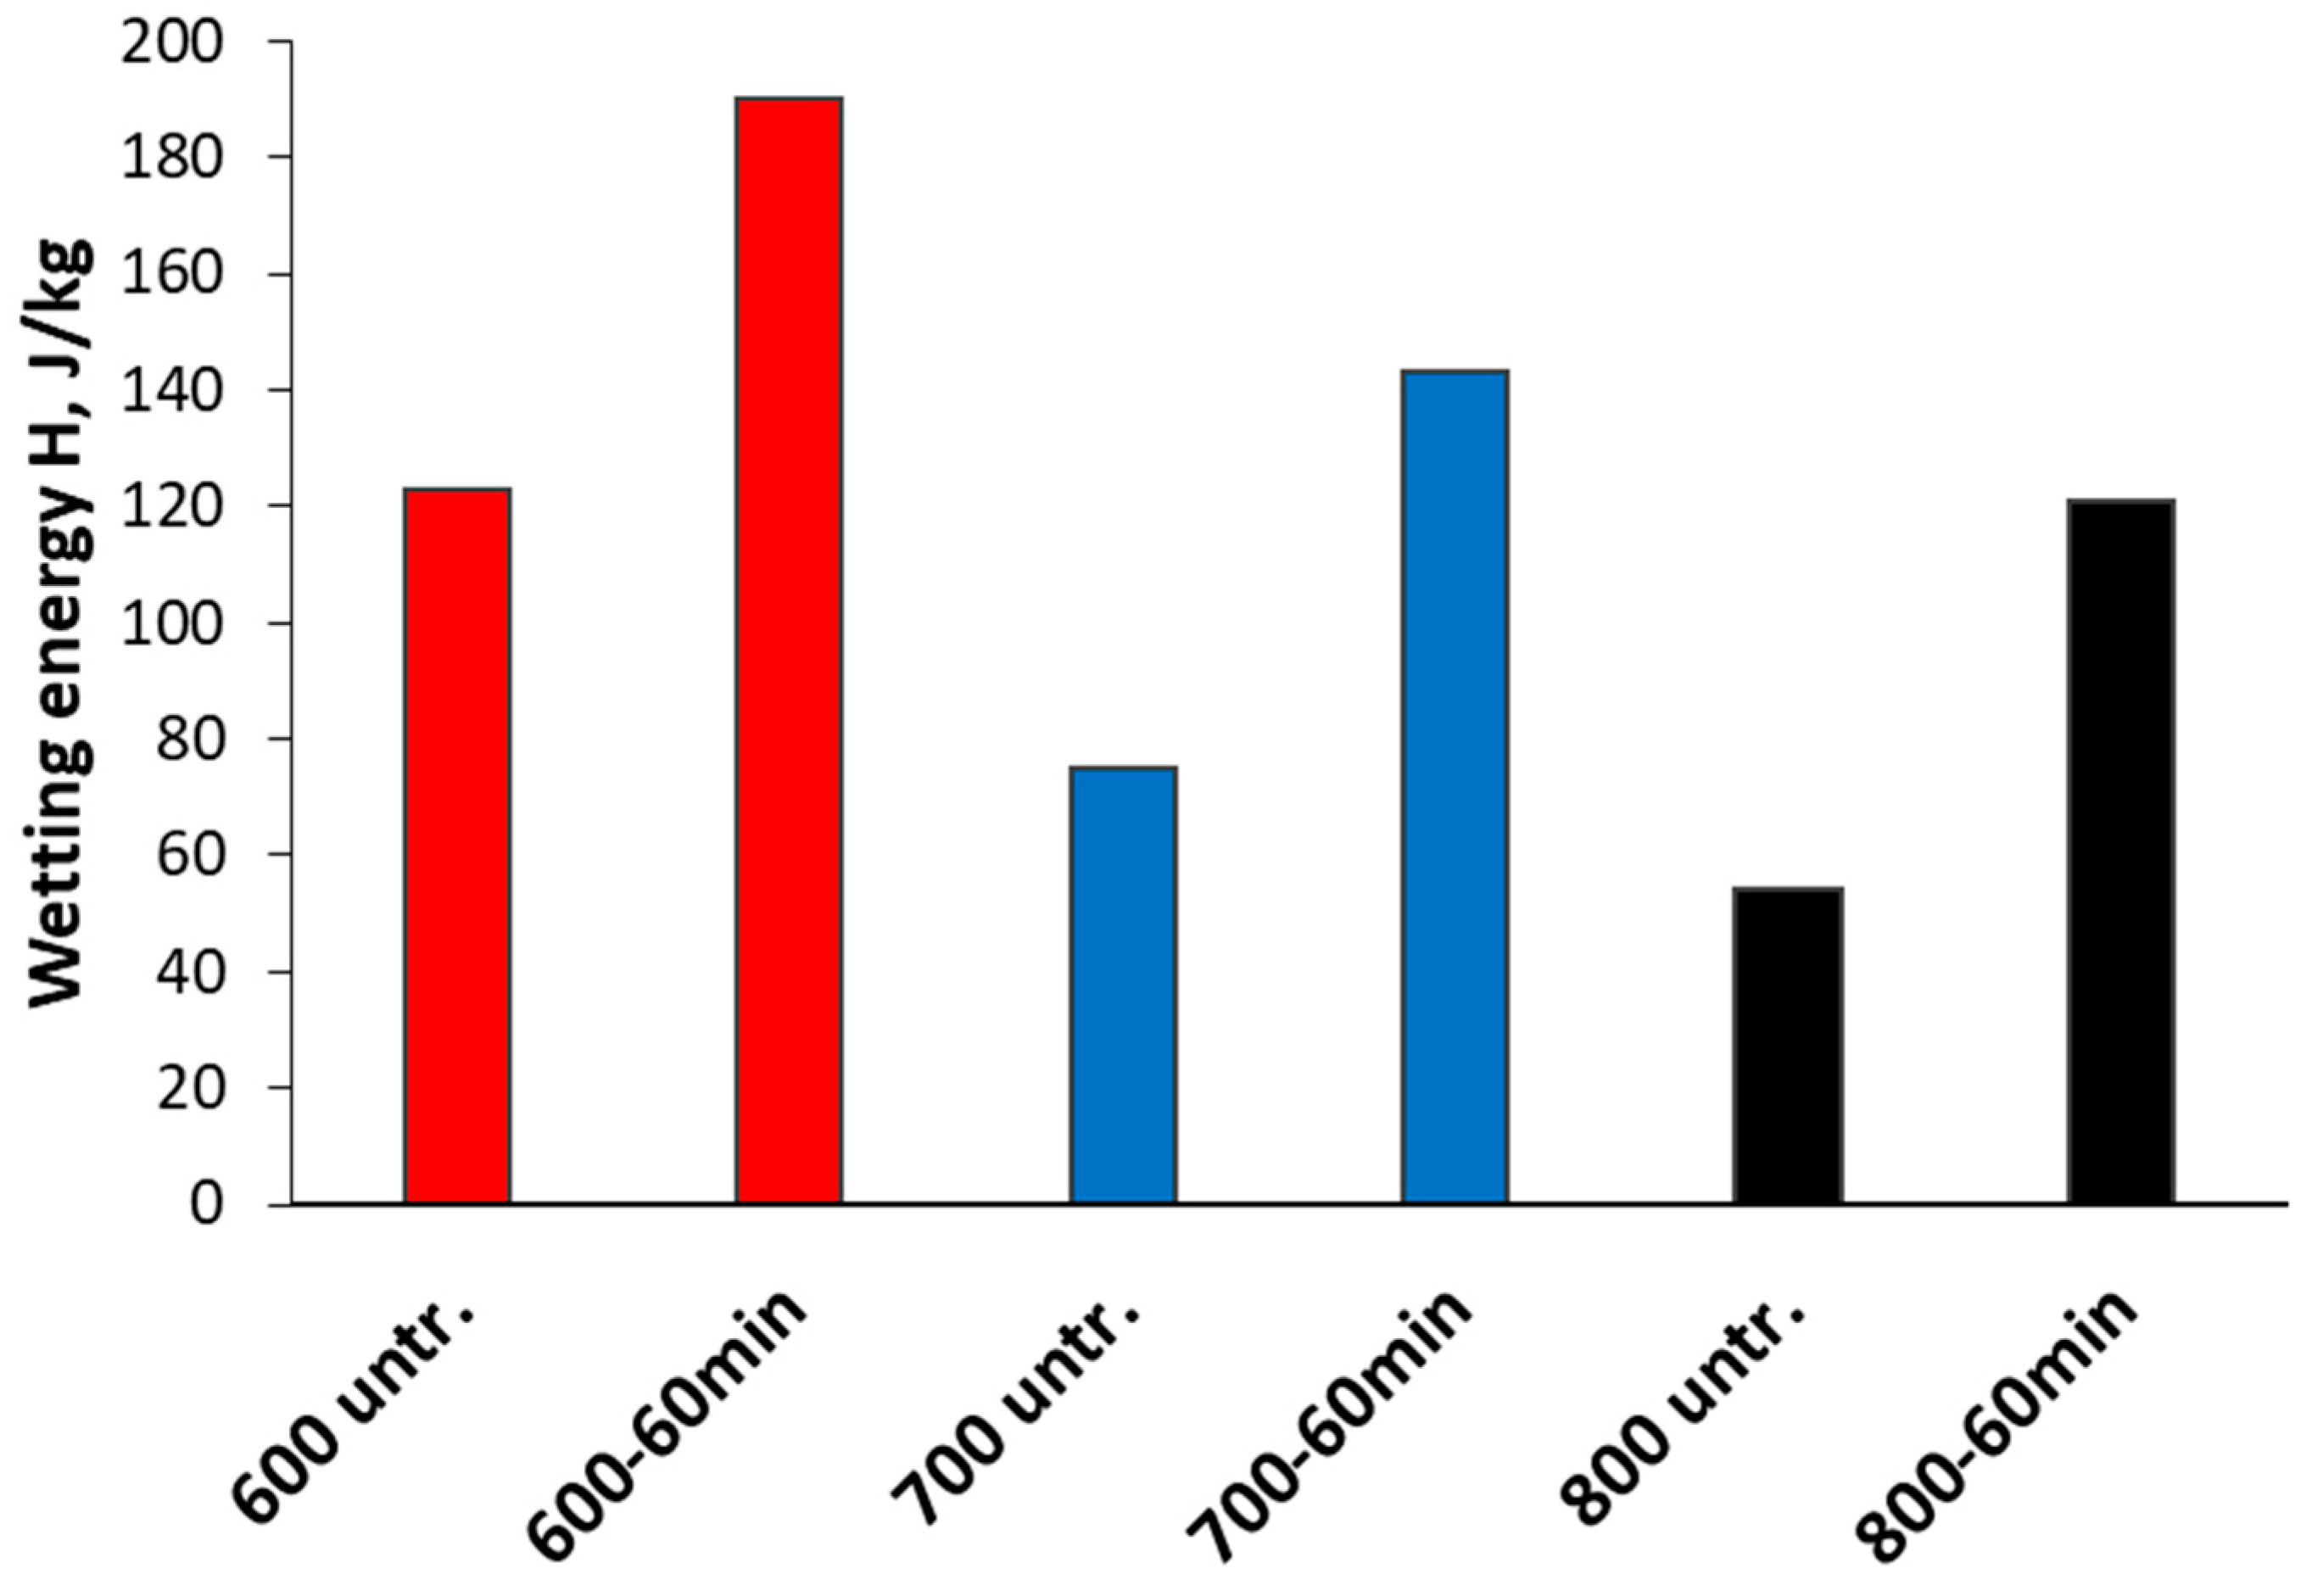
The results of the immersion calorimetry were obtained in the form of heat flow as a function of time with a single peak resulting from the heat released by the wetting of the sample, and the area of this peak can be integrated to obtain the wetting energy presented in Figure 7. Unlike the contact angle measurements, this method provided information on the degree of oxidation not only on the surface of the sample aligned at the tape but also inside the pores, which can be reached by the water molecules in vacuum.
Figure 7 illustrates that with the increase in the activation temperature, the wetting energies (H) of samples decreased, which signifies the decrease in oxygen-containing surface groups and is in good accordance with elemental analysis data (Table 1). The highest wetting energy was observed in the case of sample 600 and the lowest one for 800, respectively. The treatment with H2O2 considerably increased heat evolution in contact with water, while the previously observed trend remained the same for all samples after the 60 min oxidation, which is also in a good accordance with the data shown in this paper. Sample 600 showed a 54% increase, and samples 700 and 800 showed a 91% and 125% increase in H values, respectively, after 60 min of H2O2 treatment (Figure 7).

4. Conclusions

The oxidation of activated biochar using 30% H2O2 is a simple and effective way to increase its oxygen content in the form of surface groups, thereby increasing the wetting towards polar solvents and electrolytes. It was demonstrated that the oxidation process is dependent on time, where a longer oxidation time resulted in a higher state of oxidation, allowing the state of oxidation to be controlled accordingly. The course of oxidation also depends on the degree of graphitization and functionalization, determined by the activation temperature. The activated biochar obtained at 600 °C, while having less porosity, was oxidized more intensively, which led to a significant improvement in wetting properties. However, the low degree of activation of biochar at 600 °C leads to lower stability of its porous structure and is accompanied by a decrease in its porosity during the oxidation process. Thus, to increase the wettability of biochars by H2O2 oxidation method, it is necessary to take into account the stability of their porous structure.

Author Contributions

Conceptualization, K.L., G.D. and A.P.; data curation, K.L.; formal analysis, K.L., O.B. and E.S.; funding acquisition, A.Z.; investigation, K.L., A.V., O.B. and E.S.; methodology, K.L., G.D. and A.P.; project administration, A.Z.; resources, A.Z.; supervision, G.D. and A.P.; visualization, K.L.; writing—original draft, K.L.; writing—review and editing, A.V., G.D. and A.P. All authors have read and agreed to the published version of the manuscript.

Funding

The study was funded by VPP-EM-FOTONIKA-2022/1-0001 “Smart Materials, Photonics, Technologies and Engineering Ecosystem (MOTE)” 5.WP “Smart Materials”.

Data Availability Statement

The authors confirm that the data supporting the findings of this study are available within the article.

Conflicts of Interest

The authors declare no conflicts of interest. The funders had no role in the design of the study; in the collection, analyses, or interpretation of data; in the writing of the manuscript; or in the decision to publish the results.

References

  1. Duta, L.; Popescu, A.C.; Zgura, I.; Mihailescu, I.N. Wettability of Nanostructured Surfaces. In Wetting Wettability; Intechopen: London, UK, 2015; p. 60808. [Google Scholar] [CrossRef]
  2. Feng, J.; Guo, Z. Wettability of graphene: From influencing factors and reversible conversions to potential applications. Nanoscale Horiz 2019, 4, 339–364. [Google Scholar] [CrossRef] [PubMed]
  3. Ferrero, F.; Periolatto, M.; Ferrero, F.; Periolatto, M. Modification of Surface Energy and Wetting of Textile Fibers. In Wetting Wettability; Intechopen: London, UK, 2015; p. 60812. [Google Scholar] [CrossRef]
  4. Yuan, Y.; Lee, T.R. Contact angle and wetting properties. Springer Ser. Surf. Sci. 2013, 51, 3–34. [Google Scholar] [CrossRef]
  5. Daniel, D.; Vuckovac, M.; Backholm, M.; Latikka, M.; Karyappa, R.; Koh, X.Q.; Timonen, J.V.I.; Tomczak, N.; Ras, R.H.A. Probing surface wetting across multiple force, length and time scales. Commun. Phys. 2023, 6, 152. [Google Scholar] [CrossRef]
  6. Wang, X.Y.; Xia, X.H.; Wang, H.X.; Yang, Y.X.; Yang, S.L.; Zhang, A.Y.; Yuan, R.; Zhu, H.; Wang, B.; Zhang, Y.B.; et al. Special-wettability-mediating electrode interfaces for new energy devices: Opportunities and challenges. Nano Energy 2024, 120, 109185. [Google Scholar] [CrossRef]
  7. Krainer, S.; Hirn, U. Contact angle measurement on porous substrates: Effect of liquid absorption and drop size. Colloids Surf A Physicochem Eng Asp. 2021, 619, 126503. [Google Scholar] [CrossRef]
  8. Butkus, M.A.; Grasso, D. The nature of surface complexation: A continuum approach. Environ. Geology 2001, 40, 446–453. [Google Scholar] [CrossRef]
  9. Qiu, C.; Jiang, L.; Gao, Y.; Sheng, L. Effects of oxygen-containing functional groups on carbon materials in supercapacitors: A review. Mater Des. 2023, 230, 111952. [Google Scholar] [CrossRef]
  10. Gray, M.; Johnson, M.G.; Dragila, M.I.; Kleber, M. Water uptake in biochars: The roles of porosity and hydrophobicity. Biomass Bioenergy 2014, 61, 196–205. [Google Scholar] [CrossRef]
  11. Kinney, T.J.; Masiello, C.A.; Dugan, B.; Hockaday, W.C.; Dean, M.R.; Zygourakis, K.; Barnes, R.T. Hydrologic properties of biochars produced at different temperatures. Biomass Bioenergy 2012, 41, 34–43. [Google Scholar] [CrossRef]
  12. Belyaeva, L.A.; Schneider, G.F. Wettability of graphene. Surf Sci Rep. 2020, 75, 100482. [Google Scholar] [CrossRef]
  13. Sun, Z.; Dai, L.; Lai, P.; Shen, F.; Shen, F.; Zhu, W. Air oxidation in surface engineering of biochar-based materials: A critical review. Carbon Res. 2022, 1, 32. [Google Scholar] [CrossRef]
  14. Jaramillo, J.; Álvarez, P.M.; Gómez-Serrano, V. Oxidation of activated carbon by dry and wet methods: Surface chemistry and textural modifications. Fuel Process. Technol. 2010, 91, 1768–1775. [Google Scholar] [CrossRef]
  15. Pavese, M.; Musso, S.; Bianco, S.; Giorcelli, M.; Pugno, N. An analysis of carbon nanotube structure wettability before and after oxidationtreatment. J. Phys. Condens. Matter 2008, 20, 474206. [Google Scholar] [CrossRef]
  16. Huff, M.D.; Lee, J.W. Biochar-surface oxygenation with hydrogen peroxide. J Environ Manage 2016, 165, 17–21. [Google Scholar] [CrossRef]
  17. Chemerys, V.; Baltrėnaitė-Gedienė, E.; Baltrėnas, P.; Dobele, G. Influence of H2O2 Modification on the Adsorptive Properties of Birch-Derived Biochar. Pol J Environ Stud. 2019, 29, 579–588. [Google Scholar] [CrossRef] [PubMed]
  18. Zhurinsh, A.; Zandersons, J. Lump charcoal production in Latvia: State of the art and prospects. In Pyrolysis and Gasification of Biomass and Waste; Bridgwater, A.V., Ed.; CPL Press: Newbury, UK, 2003; pp. 307–314. [Google Scholar]
  19. Volperts, A.; Plavniece, A.; Dobele, G.; Zhurinsh, A.; Kruusenberg, I.; Kaare, K.; Locs, J.; Tamasauskaite-Tamasiunaite, L.; Norkus, E. Biomass based activated carbons for fuel cells. Renew Energy 2019, 141, 40–45. [Google Scholar] [CrossRef]
  20. Volperts, A.; Plavniece, A.; Kaare, K.; Dobele, G.; Zhurinsh, A.; Kruusenberg, I. Influence of Chemical Activation Temperatures on Nitrogen-Doped Carbon Material Structure, Pore Size Distribution and Oxygen Reduction Reaction Activity. Catalysts 2021, 11, 1460. [Google Scholar] [CrossRef]
  21. Boehm, H.P. Chemical Identification of Surface Groups. Adv. Catal. 1966, 16, 179–274. [Google Scholar] [CrossRef]
  22. Schönherr, J.; Buchheim, J.R.; Scholz, P.; Adelhelm, P. Boehm Titration Revisited (Part I): Practical Aspects for Achieving a High Precision in Quantifying Oxygen-Containing Surface Groups on Carbon Materials. C 2018, 4, 21. [Google Scholar] [CrossRef]
  23. Sun, J.; Niu, J.; Liu, M.; Ji, J.; Dou, M.; Wang, F. Biomass-derived nitrogen-doped porous carbons with tailored hierarchical porosity and high specific surface area for high energy and power density supercapacitors. Appl Surf Sci. 2018, 427, 807–813. [Google Scholar] [CrossRef]
  24. Tratnik, B.; Van de Velde, N.; Jerman, I.; Kapun, G.; Tchernychova, E.; Tomšič, M.; Jamnik, A.; Genorio, B.; Vizintin, A.; Dominko, R. Correlating Structural Properties with Electrochemical Behavior of Non-graphitizable Carbons in Na-Ion Batteries. ACS Appl Energy Mater 2022, 5, 10667–10679. [Google Scholar] [CrossRef] [PubMed]
  25. Leng, L.J.; Xiong, Q.; Yang, L.H.; Li, H.; Zhou, Y.Y.; Zhang, W.J.; Jiang, S.J.; Li, H.L.; Huang, H.J. An overview on engineering the surface area and porosity of biochar. Sci. Total Environ. 2021, 763, 144204. [Google Scholar] [CrossRef] [PubMed]
  26. Zhao, C.; Wang, Q.; Lu, Y.; Li, B.; Chen, L.; Hu, Y.S. High-temperature treatment induced carbon anode with ultrahigh Na storage capacity at low-voltage plateau. Sci. Bull. 2018, 63, 1125–1129. [Google Scholar] [CrossRef] [PubMed]
  27. Ibarra, J.V.; Muñoz, E.; Moliner, R. FTIR study of the evolution of coal structure during the coalification process. Org Geochem. 1996, 24, 725–735. [Google Scholar] [CrossRef]
  28. Bellamy, L.J. The Infra-red Spectra of Complex Molecules; Springer Dordrecht: Dordrecht, The Netherlands, 1975. [Google Scholar] [CrossRef]
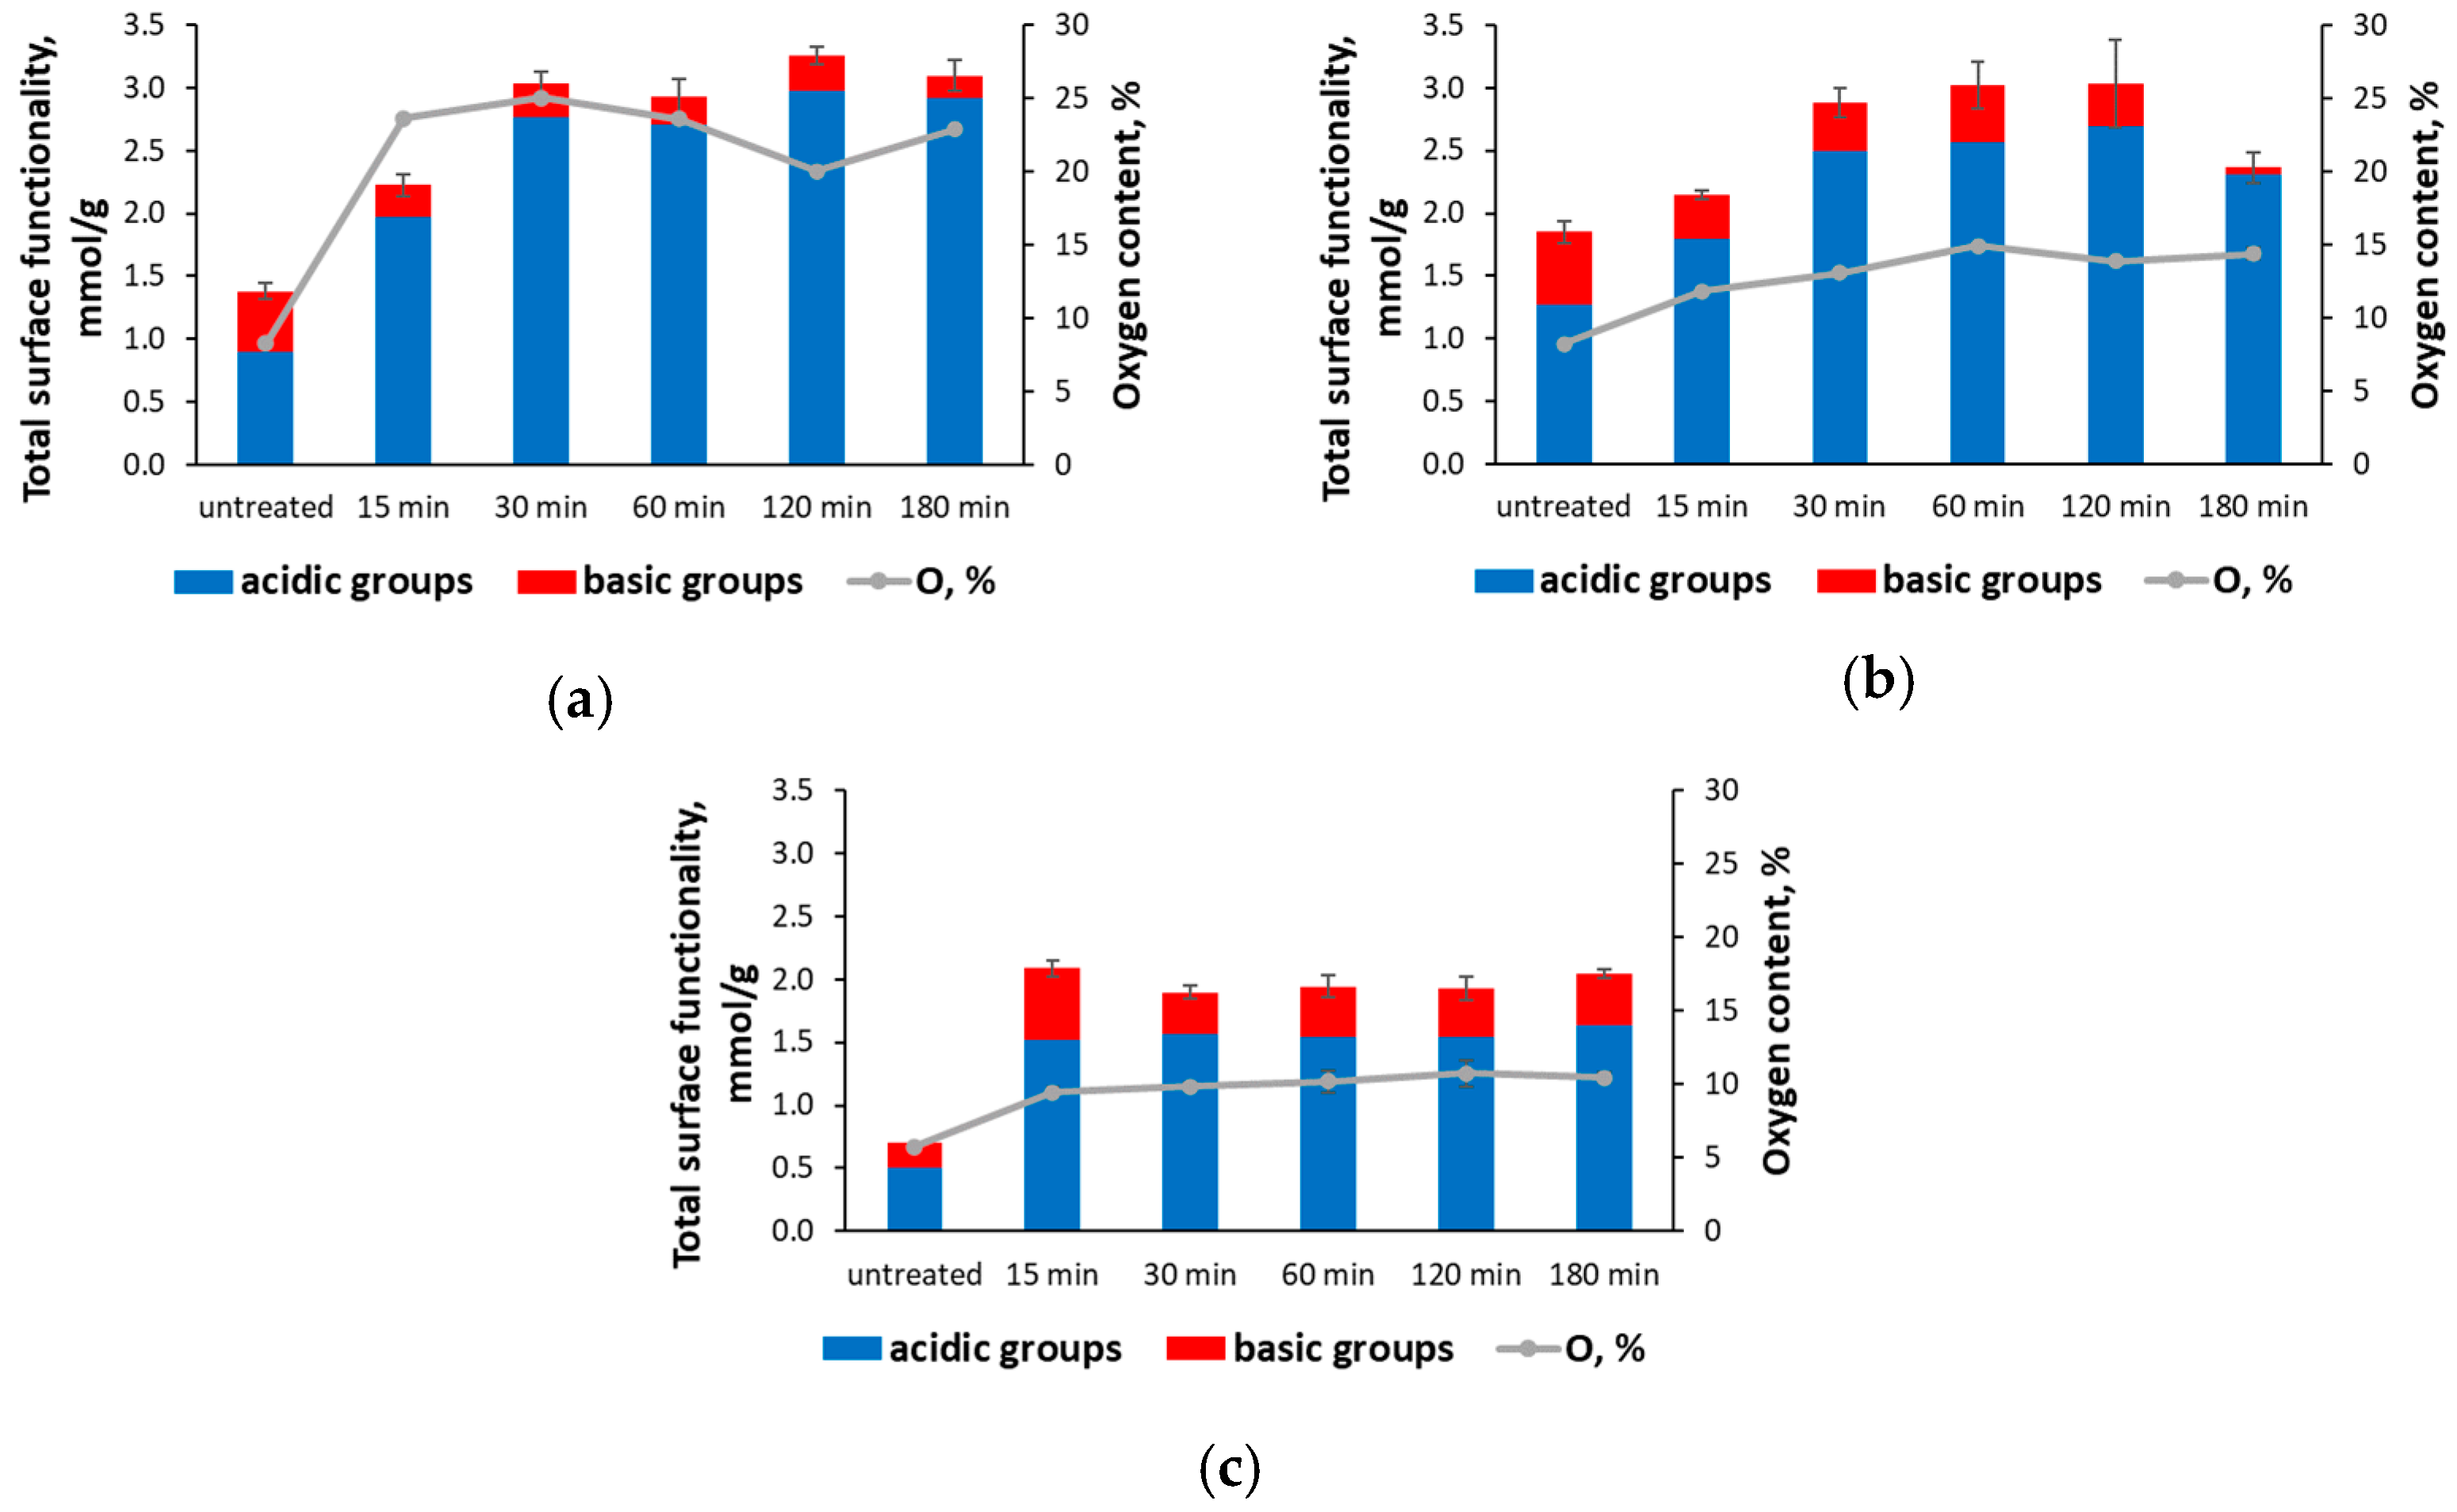
Figure 1. Effect of oxidation duration on surface functionality and oxygen content for activated biochar samples 600 (a), 700 (b), and 800 (c).
Chemistry 06 00053 g001
Figure 2. FTIR spectra of activated biochars 600 (a), 700 (b), and 800 (c) before and after oxidation for 60 min and their differential spectra.
Chemistry 06 00053 g002
Figure 3. N2 adsorption-desorption isotherms (ac) and pore size distribution (df) of activated biochars 600, 700, and 800 after different oxidation duration.
Chemistry 06 00053 g003
Figure 4. Specific surface area (BET) (a) and total pore volume (b) of activated biochars 600, 700, and 800 after different oxidation duration.
Chemistry 06 00053 g004
Figure 5. Contact angle measurements for 70 s from initial contact time for samples 600 (a), 700 (b), and 800 (c) untreated and oxidized for 15 and 60 min.
Chemistry 06 00053 g005
Figure 6. Average contact angle and the corresponding water droplet image for samples 600, 700, and 800 untreated and oxidized for 15 and 60 min.
Chemistry 06 00053 g006
Figure 7. Wetting energies for untreated samples and samples oxidized for 60 min obtained from immersion calorimetry.
Chemistry 06 00053 g007
Table 1. Elemental composition of activated biochars obtained at 600, 700, and 800 °C and oxidized for 15 to 180 min.
Activation Temperature, °COxidation TimeN, %C, %H, %O, %
6000 min0.547 ± 0.00590.24 ± 0.260.95 ± 0.038.26 ± 0.23
15 min0.28 ± 0.0375.31 ± 0.240.78 ± 0.0523.63 ± 0.16
30 min0.30 ± 0.0973.61 ± 0.141.040 ± 0.01625.05 ± 0.04
60 min0.243 ± 0.00475.36 ± 0.190.81 ± 0.0423.59 ± 0.24
120 min0.34 ± 0.0680.1 ± 1.90.84 ± 0.1220 ± 2
180 min0.257 ± 0.01676.11 ± 0.330.75 ± 0.1722.88 ± 0.14
7000 min0.53 ± 0.0790.973 ± 0.0150.270 ± 0.0128.23 ± 0.06
15 min0.54 ± 0.1487.18 ± 0.070.473 ± 0.01611.81 ± 0.08
30 min0.41 ± 0.0585.7 ± 0.20.823 ± 0.01213.1 ± 0.2
60 min0.55 ± 0.1083.6 ± 0.20.93 ± 0.0714.95 ± 0.18
120 min0.60 ± 0.0684.59 ± 0.140.93 ± 0.0313.88 ± 0.17
180 min0.54 ± 0.1884.19 ± 0.190.912 ± 0.01014.3 ± 0.4
8000 min0.6 ± 0.392.80 ± 0.020.88 ± 0.125.74 ± 0.11
15 min0.6 ± 0.389.4 ± 0.20.51 ± 0.159.5 ± 0.4
30 min0.63 ± 0.0889.00 ± 0.090.55 ± 0.159.8 ± 0.3
60 min0.57 ± 0.1288.9 ± 0.80.36 ± 0.1010.2 ± 0.7
120 min0.47 ± 0.1988.3 ± 0.80.45 ± 0.1110.8 ± 0.9
180 min0.57 ± 0.1288.540 ± 0.0040.4 ± 0.210.5 ± 0.3
Disclaimer/Publisher’s Note: The statements, opinions and data contained in all publications are solely those of the individual author(s) and contributor(s) and not of MDPI and/or the editor(s). MDPI and/or the editor(s) disclaim responsibility for any injury to people or property resulting from any ideas, methods, instructions or products referred to in the content.