Article

The Role of TiO2 during the Accelerated Aging of Recycled Rubber Tiles

1
Faculty of Geotechnical Engineering, University of Zagreb, Hallerova aleja 7, HR-42000 Varazdin, Croatia
2
Faculty of Metallurgy, University of Zagreb, Aleja Narodnih Heroja 3, HR-44000 Sisak, Croatia
3
Gumiimpex—GRP d. d., Pavleka Miskine 64c, HR-42000 Varazdin, Croatia
*
Author to whom correspondence should be addressed.
Chemistry 2024, 6(5), 1111-1132; https://doi.org/10.3390/chemistry6050065
Submission received: 23 July 2024 / Revised: 18 September 2024 / Accepted: 20 September 2024 / Published: 26 September 2024
(This article belongs to the Section Chemistry of Materials)

Abstract

:
Titanium dioxide (TiO2) was added in different proportions as a filler to the mixture for the production of recycled rubber tiles in order to improve their existing properties. The mechanical properties of novel rubber tiles were analyzed in the context of abrasion resistance, maximum stress (TS), stress at break (TSb), deformation at break (Eb), and hardness. An optimal mixture composition was found comparing the obtained results of mechanical tests; successful improvement of abrasion by 22.1%, Eb by 10.46% and hardness by 17.65% was achieved. Finally, the characterization of the new rubber tile by SEM/EDS and FTIR analysis was carried out, along with the stability and environmental impact assessment based on the leaching test. The accelerated aging test was conducted using a solar simulator, after which the mechanical properties, SEM/EDS, FTIR, and leaching test were re-examined. The results after the accelerated aging test showed that tiles with the addition of TiO2 have better mechanical properties compared to the reference ones; TS improved by 85.71%, Eb by 75.53%, and hardness by 9.43%. Therefore, we concluded that TiO2 as a filler in interaction with rubber and polyurethane composites significantly contributed to the improvement of the existing rubber tile, and the achieved improvements are useful for the original application of these tiles, which is the protection from injuries on playgrounds and sports fields. Also, the improvement achieved extends the service life of this type of tile, which contributes to the quality of this type of material.

Graphical Abstract

1. Introduction

Today, polymers are one of the widest available types of materials with a wide range of properties. Unlike metals, polymers are highly elastic, which makes them suitable for a variety of applications. Polymers are composed of long-chain molecules made up of repeating units known as monomers. By altering the basic monomer units and incorporating different additives, a wide range of properties can be achieved. Polymers can achieve better properties by adding different fillers, which is called polymer compounding [1]. For instance, advanced polymers are used in the process of water purification, tires, bulletproof vests, biological applications, automobile structures, plastic utensils, etc. [2]. In this paper, the emphasis is placed on recycled rubber tiles obtained from waste tires, which represent a valuable raw material. Recycled rubber tiles are used to cover children’s playgrounds and sports fields, and with this research, we will try to improve their properties by adding fillers. The tiles are composed of rubber granulate and polyurethane, so attention should be paid to the interaction of the filler in the polyurethane mixture and with the rubber material.
Inorganic fillers in composites based on natural or synthetic rubber have increasing technological importance [3], as well as with polyurethane composites [4,5,6,7,8]. Over the last few years, several fillers were proposed to advance processability, physical properties modifying the composites, and cost reduction, such as titanium dioxide, zinc oxide, magnesium hydroxide, silanes, carbon black, carbon nanotubes, silver nanoparticles, etc. [3,8]. The performance of the composites is determined by filler dispersion and filler–rubber and filler-polyurethane interaction. At the same time, the other factors are the filler particles’ size, shape, structure, surface area, and surface reactivity [3]. Fillers in the mixture have three types of effects on composite microstructures. Firstly, more obstacles are formed to impede micro-crack propagation in the matrix. Secondly, the stress level of neighboring particles gets better, and spacing between particles decreases, and lastly, there is an increase in aggregates which leads to easier separation from the matrix [9]. One of the most important discoveries in material science is the reinforcement of rubber by rigid particles, such as titanium dioxide, silica, carbon black, calcium carbonate, clays, etc. [10]. Titanium dioxide is widely used as a photocatalyst because of its high chemical stability, nontoxicity, inexpensiveness, commercial availability, and optical electronic properties [11,12]. Since it has photocatalytic and bactericidal effects [3] and is safe for humans and animals [3], it is generally used as a photocatalyst for environmental applications such as air and water purification, hazardous waste remediation, and water disinfection [12].
TiO2 is an interesting nanofiller for many reasons: it has the ability to photocatalytically decompose organic substances [13,14,15], which positively affects the self-cleaning of surfaces [16,17,18], achieves an antibacterial effect [19,20,21], helps reduce photoaging through the absorption of ultraviolet light [22,23] and improves the mechanical properties of the material [21]. On the other hand, one of the disadvantages of TiO2 is its high bandgap, which is active only in a small fraction of the solar spectrum, so it can absorb only the UV part of the spectrum (<380 nm), which consists of 6.6% [11]. The advantage of this kind of self-cleaning surface is that TiO2 under ultraviolet (UV) illumination can decompose organic contaminants and/or kill bacteria adhering to the surface [24], i.e., decompose a wide variety of organic compounds to water, carbon dioxide, and mineral acids or their salts [25]. Nowadays, TiO2 is already used in polymer materials, including rubber materials and polyurethanes, to improve the resistance to wear, chemical corrosion, rigidity, and oil, as a UV stabilizer and as a protective and antibacterial agent, for the achievement of photocatalytic properties, etc. [3,4,6,7]. Since rubber substrates are exposed to UV radiation throughout their lifetime, our primary goal is to reduce photoaging and enable a longer lifetime of the substrates while preserving and even improving the initial mechanical properties. Regarding the improvement of mechanical and physical properties, TiO2 significantly impacts polymer composite reinforcement and thermal stability, making the final polymer product more economical. For these reasons, TiO2 as a filler can be the most important additive, followed by the base polymer in rubber and polyurethane compounding [6,10]. Furthermore, because of the small size of particles and relatively high elastic modulus, TiO2, compared with other fillers, achieves better interaction with polymer composites such as rubber and polyurethane [3]. A literature review found that TiO2 particles have free surface hydroxyl groups, which leads to good dispersion in polymer composites and causes a low tendency for aggregation [3].
As stated earlier, this work aims to achieve a stable mixture with the addition of TiO2 as a filler to produce tiles from recycled tires. In relation to the literature review that is closely related to this topic, this work represents a great innovation for several reasons. Primarily, these tiles are of great environmental importance because they are made from recycled waste tires, i.e., the secondary raw material is used as the main raw material to produce the final product. Then, the modification is carried out using the non-toxic, easily available, and economically acceptable filler TiO2, which many available literatures have confirmed to have excellent compatibility in both rubber and polymer compounds. Finally, for the first time, an experimental investigation of the effect of TiO2 as a filler in a mixture containing both rubber and polyurethane was carried out. The goal of the work is based on the reduction of aging caused by UV radiation and, therefore, the extension of the service life of the substrate while preserving the necessary mechanical properties such as resistance to wear, hardness, and elasticity. In the future, this work will represent the basis for testing and achieving photocatalysis.

2. Experimental Part

2.1. Materials

Recycled rubber tiles were obtained from Gumiimpex GRP d.o.o., a company that collects waste tires of all types, which are then divided and separated into passenger, cargo (dumper and truck), semi-truck, tractor, and forklift. The collected tires are crushed by mechanical processing into a granulate, which is the main ingredient of our rubber tiles. A commercial formulation for the production of reference rubber tiles measuring (1000 × 1000 × 10) mm is obtained by mixing 9 kg of recycled rubber granulate (0.5–2.0 mm), 380 g of binder (polyurethane STOBICOLL 352.00) and 5 g of catalyst (DABCO K 2097). The commercial mixture of ingredients is pressed for 4 min at 120 °C and then cooled down.

2.2. Preparation of Novel Rubber Tile Mixture

The filler and photocatalyst titanium dioxide, TiO2 (Evonik, Aeroxid®, TiO2 P25, 30 nm, 56 m2/g, 75:25 anatase to rutile mass ratio) is added to a commercial formulation for the production of a reference rubber tile (hereafter RRT). Table 1 shows the total masses of all necessary ingredients for producing an RRT and new tiles with the addition of TiO2, and each tile is approximately (1000 × 1000 × 10) mm.
The added mass of TiO2 was calculated in percentages of 2, 4, and 10% of the total mass of polyurethane and catalyst (380 g + 5 g). Also, the addition of TiO2 was performed in different time periods for samples with 2% and 4%.
By adding fillers at different times, we want to investigate whether the mixing time affects the final properties and prove whether there are differences in the later results. The assumption is that it is not only the amount of added filler that is important but attention should also be paid to the time in which the filler will be added to the mixture.
Immediately after placing the mixture in the press mold, T/TiO2 (2% end) and T/TiO2 (4% end), we noticed that TiO2 particles were not evenly distributed within the mixture, and we concluded that adding TiO2 at the beginning was better due to achieving more uniform properties within the entire tile. Uneven distribution of TiO2 can lead to deterioration of the properties and result in tile cracking. Since the TiO2 particles in T/TiO2 (2% end) and T/TiO2 (4% end) were not evenly distributed, the analysis of these tiles will not be relevant. We conclude on the spot that the assumption about the time of adding the filler to the mixture was correct and that the time of addition also affects the final properties.
Due to the previous conclusion, the next tile was made only with the addition of TiO2 at the beginning of mixing. In the sample T/TiO2 (10% beginning), 38.5 g of TiO2 was added at the beginning of mixing the mixture. After the tile was removed from the press mold, it was immediately noticed that the tile began to crumble. Consequently, we conclude that it is necessary to add more binders to make the final product more resistant to crumbling. For this reason, we decided to increase the mass of polyurethane to 700 g. As a result of the above, we obtain a modified rubber tile (hereafter MRT), which consists of 9 kg of rubber granulate with a particle size of 0.5–2.0 mm, 700 g of polyurethane, 7 g of catalyst and 38.5 g of TiO2. By increasing the binder, the structure of the tile is improved, and there is no more crumbling.

2.3. Characterization

The characterization of the newly obtained materials was analyzed before and after the accelerated aging test in the form of mechanical properties, SEM/EDS, FTIR, and leaching tests.

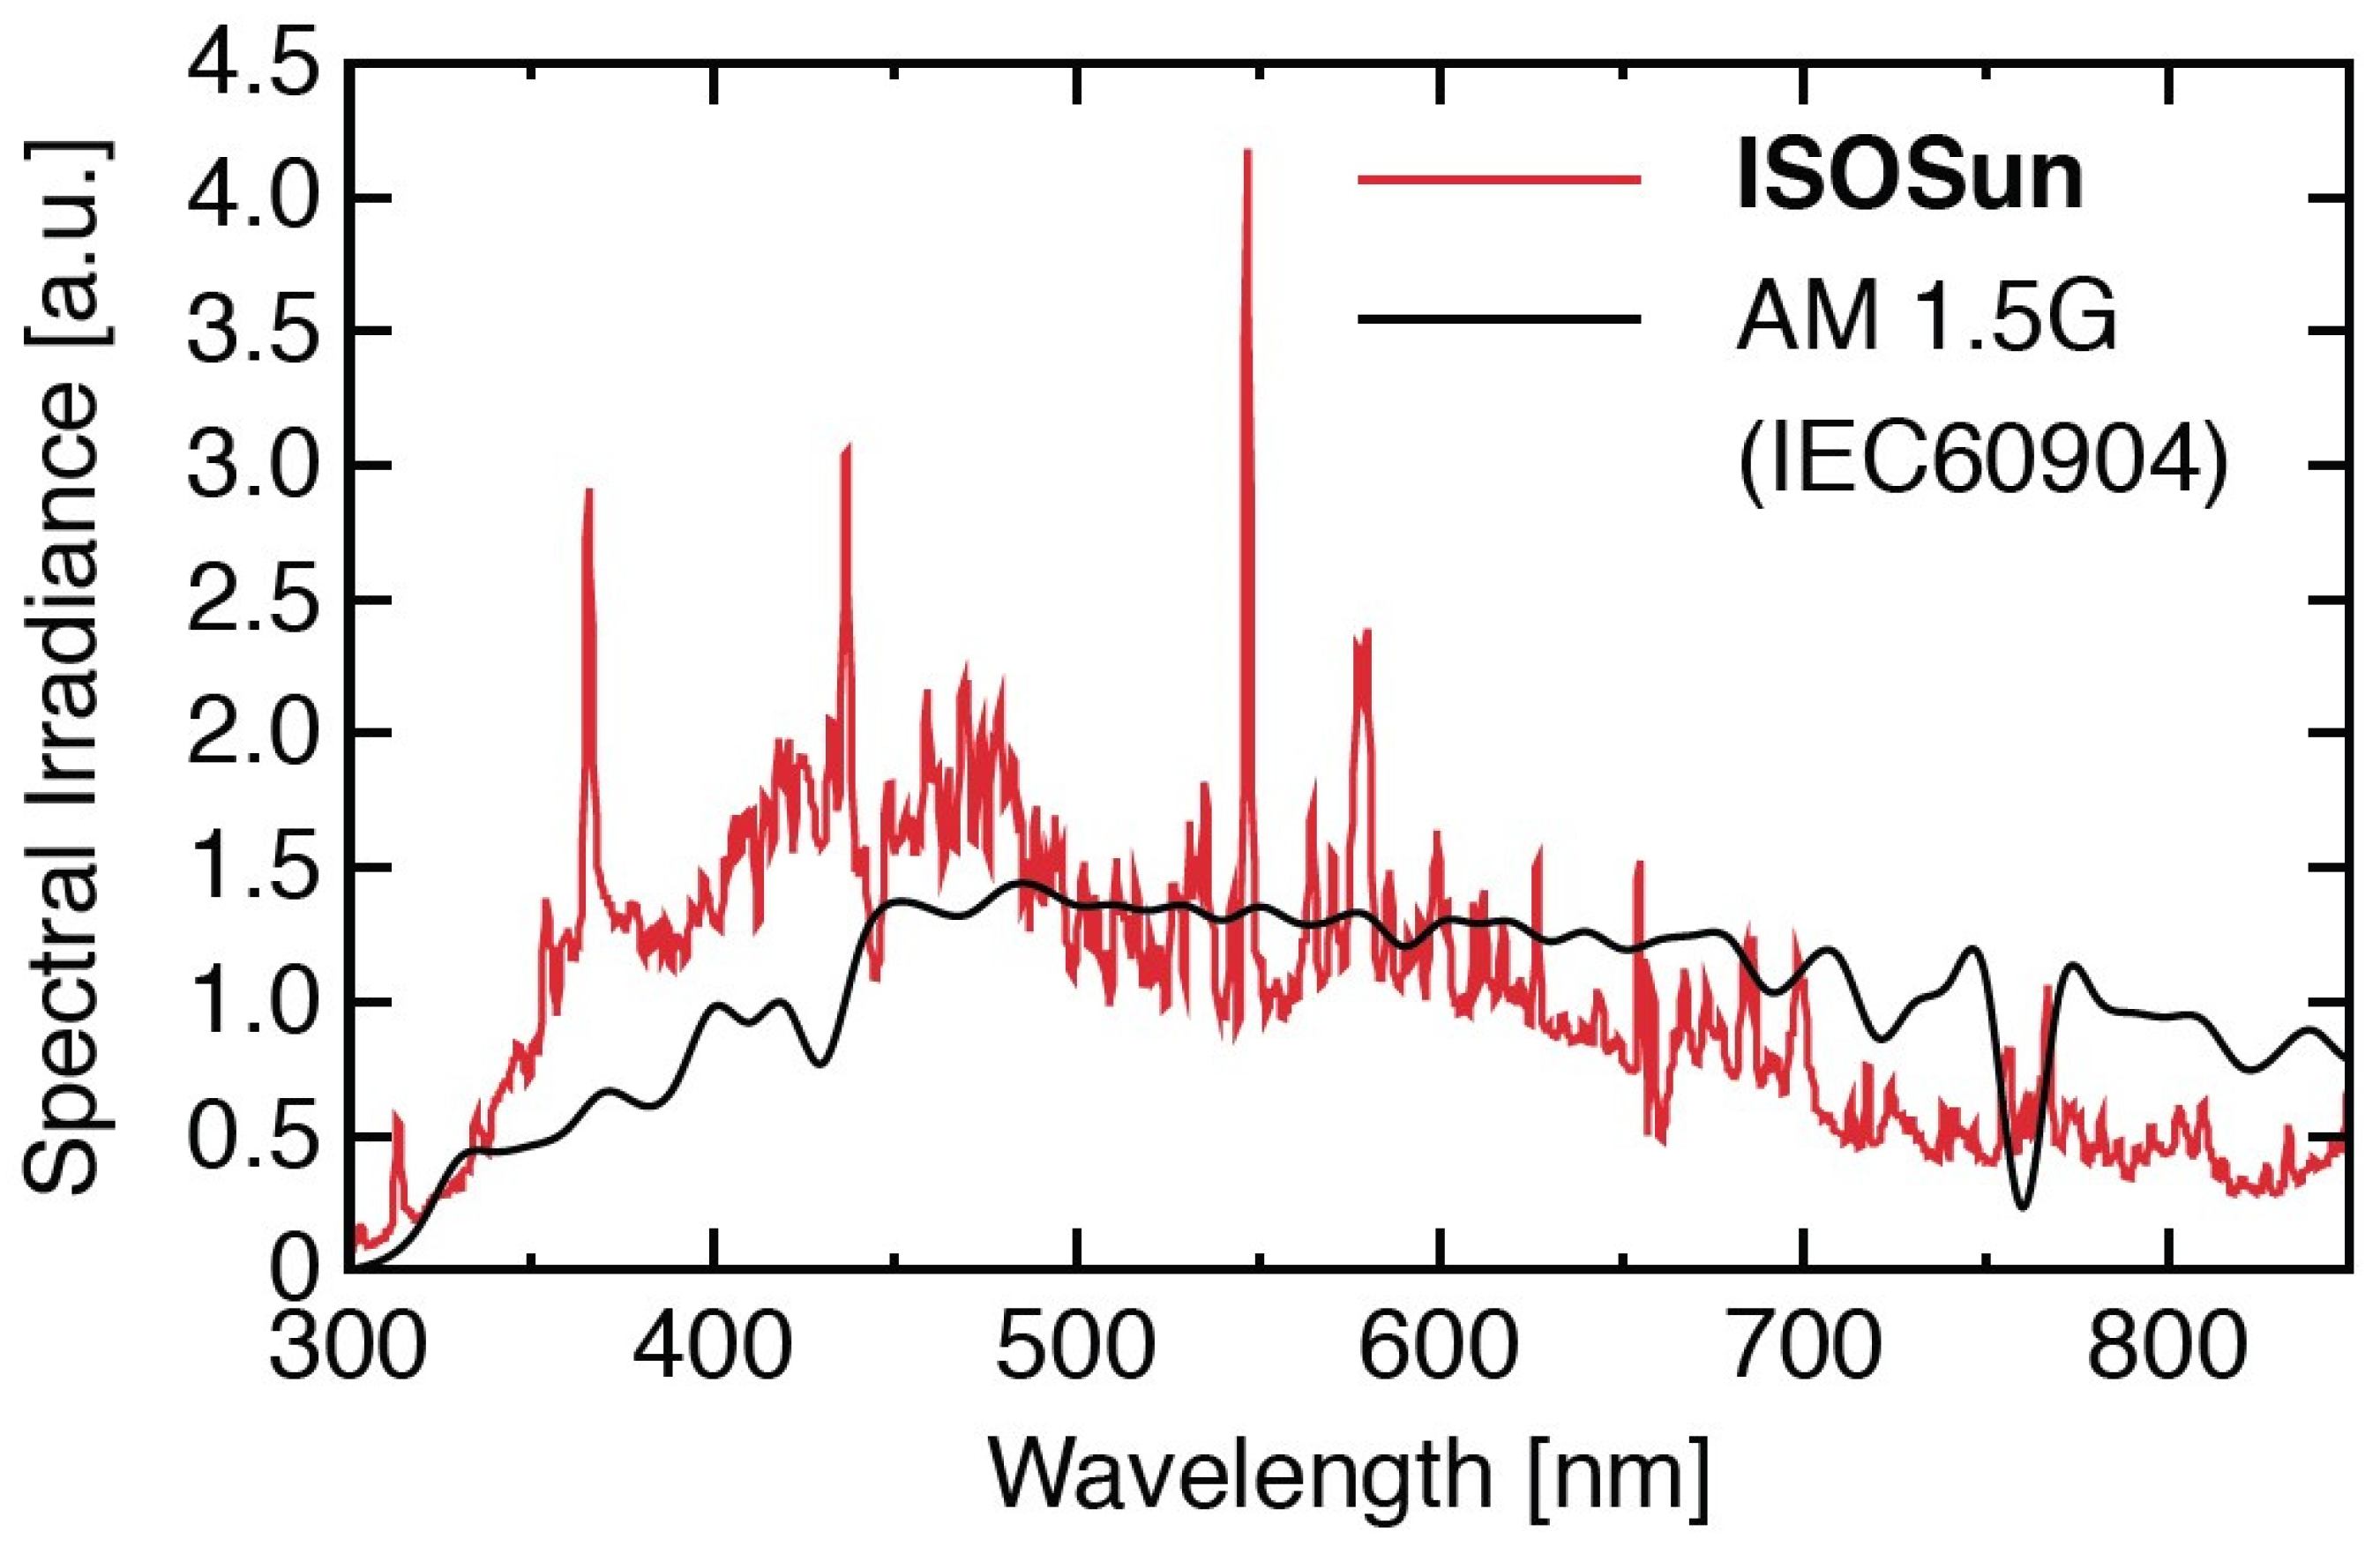
2.3.1. The Experimental Investigation of the Accelerated Aging Test

The mechanical properties, SEM/EDS, FTIR, and leaching test will be examined before and after exposure to the experimental investigation of the accelerated aging test.
The properties of polymeric materials vary based on the exposure conditions at the site of use. The most crucial exposure factors are incidental solar radiation and the temperature of the object [26]. This research does not consider other environmental conditions, such as humidity, rain, or air pollution. The used device, the ISOSun, was manufactured by infinityPV ApS, Møllehaven 12A, DK-4040 Jyllinge, Denmark (CVR: 36420367) to comply with EU regulations on electrical equipment (CE regulation). The system measures 96 cm in height, 57 cm in depth, and 52 cm in width. The system operates from a 240 VAC power line and has a power rating of 1490 Watts AC. A metal halide lamp with a power of 1200 W is used as a UV source, which also heats the room. With the help of a fan, it is possible to control the temperature inside the case. Depending on the filter used, the ISOSun can provide an intensity in the range of 0.5–1.5 sun equivalents. The solar simulator generates strong white light approaching the solar spectrum and generates ozone and much heat. The spectral irradiance (standard filter) of the solar simulator (ISOSun) compared with the reference global horizontal irradiance spectrum (AM 1.5G) is shown in Figure 1. AM 1.5G is commonly used in terrestrial solar cell research, in accordance with the American Society for Testing and Materials (ASTM) G-173 as well as with the International Electrotechnical Commission IEC60904.
The exposed area of the sample was approximately (11 × 15) cm. Due to unavoidable thermal edge effects, only a (9 × 13) cm area (2 cm smaller than the whole area) was used for the analyses. The samples were placed in the chamber and subjected to UV light for periods of 28, 42, and 56 days, which correspond to 4, 6, and 8 weeks. The relationship between the accelerated aging time and the actual time for the material (rubber tiles) is determined using the following equation [27,28]:
Accelerated   Aging   Time   ( AAT ) = Desired   Real   Time   ( RT ) Q 10 ( T AA T RT 10 )
The target real-time (RT) is established at 180 months, equivalent to 15 years. The accelerated aging temperature (TAA) was set at 85 °C, while the ambient temperature (TRT) was 19 °C. The aging factor (Q10) for ambient temperature (TRT) generally ranges from 1.8 to 2.5, with 2.0 being the most used value. Under these conditions, to replicate 15 years of aging, the material (rubber tiles) must undergo accelerated aging for 56.5 days [27,28]. Consequently, the accelerated aging experiment spanned 8 weeks (56 days), with some samples aged for only 4 and 6 weeks to observe changes throughout the process.

2.3.2. Mechanical Properties Testing

Abrasion Testing

The rubber wear test was conducted using a Gibitre Abrasiometre A (Gibitre Instruments, Bergamo, Italy), which estimates the sample’s abrasion resistance according to the DIN 53516.11 standard [29]. The test involves pressing the sample against a rotating drum covered with standardized sandpaper, applying a defined force, and measuring abrasion over a rotating length of 40 m. Each sample was tested three times, with the results expressed as the average of the three measurements.

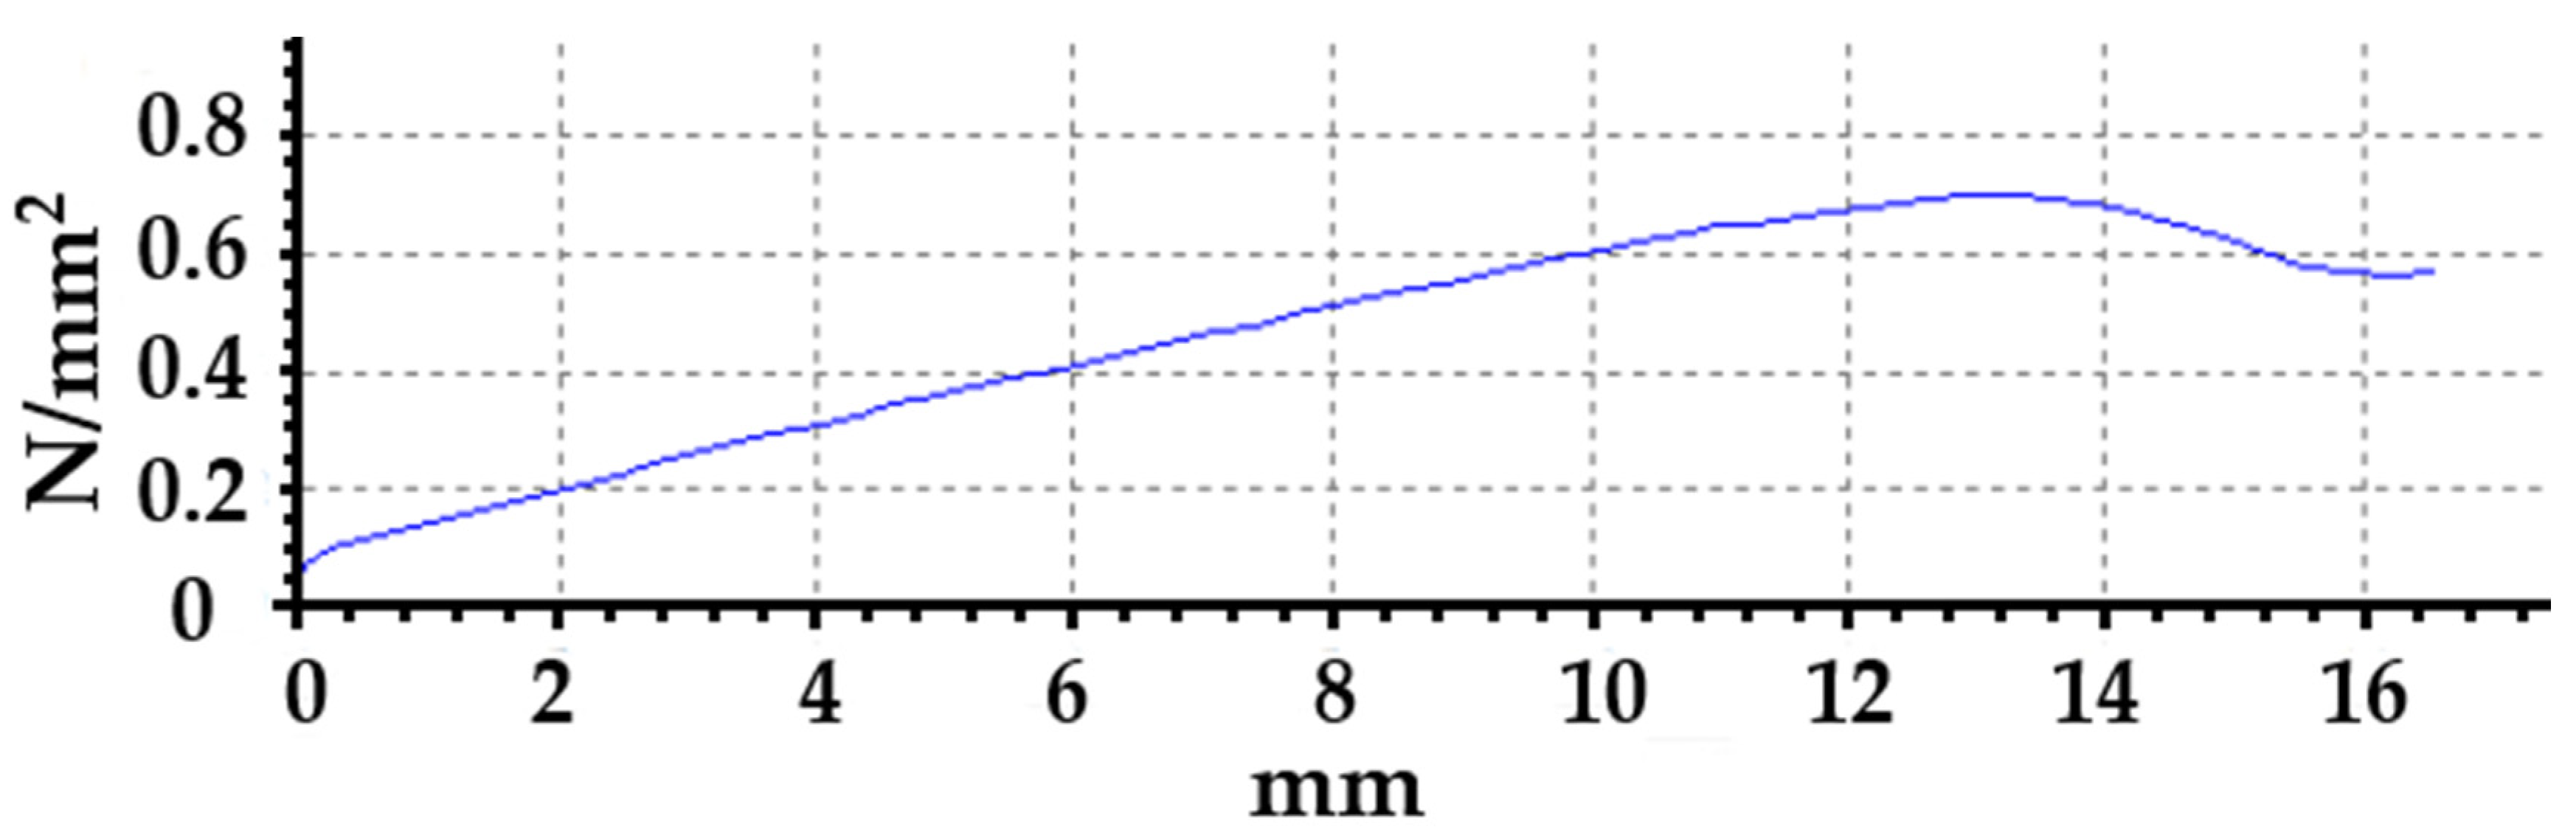
Tensile Strength Test

Mechanical properties were determined using a tensile tester (Tensor Check Profile, Gibitre Instruments, Bergamo, Italy) according to the DIN 53504.8 standard [30], measuring maximum stress (TS), stress at break (TSb), and elongation at break (ε). Each sample was tested three times, with the results averaged. During the measurement, knives were used to cut samples according to a certain standard (DIN 53504) (length and width are standard, defined by the size of the knife), and the thickness was measured on the device during the measurement itself.

Hardness Test

A hardness test was conducted using a Shore hardness tester (Shore hardness tester micro, Gibitre Instruments, Bergamo, Italy) to measure the material’s resistance when the device’s needle is pressed into the sample. The test follows the DIN 53505.9 standard [31], using the Shore A scale (ShA) for measurement. Each sample was tested five times, and the results were averaged.

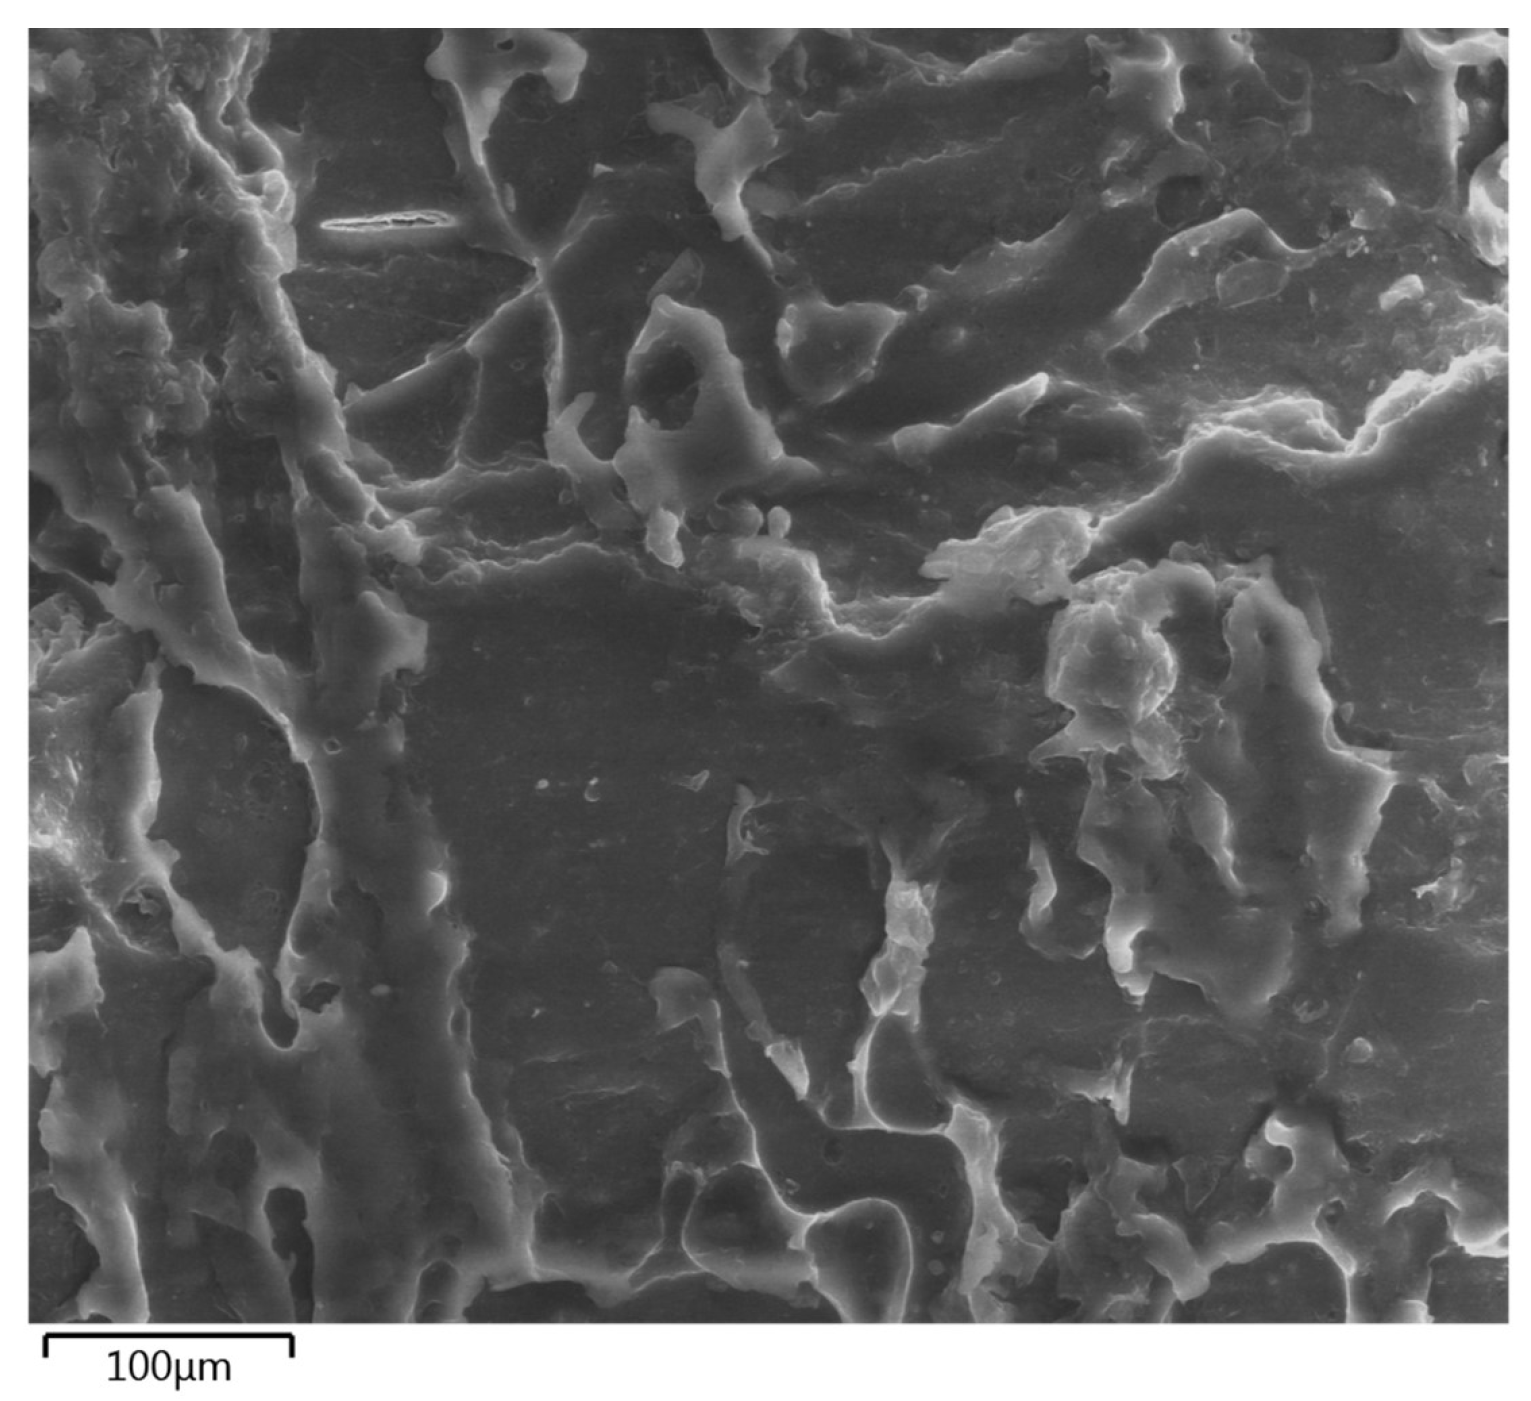
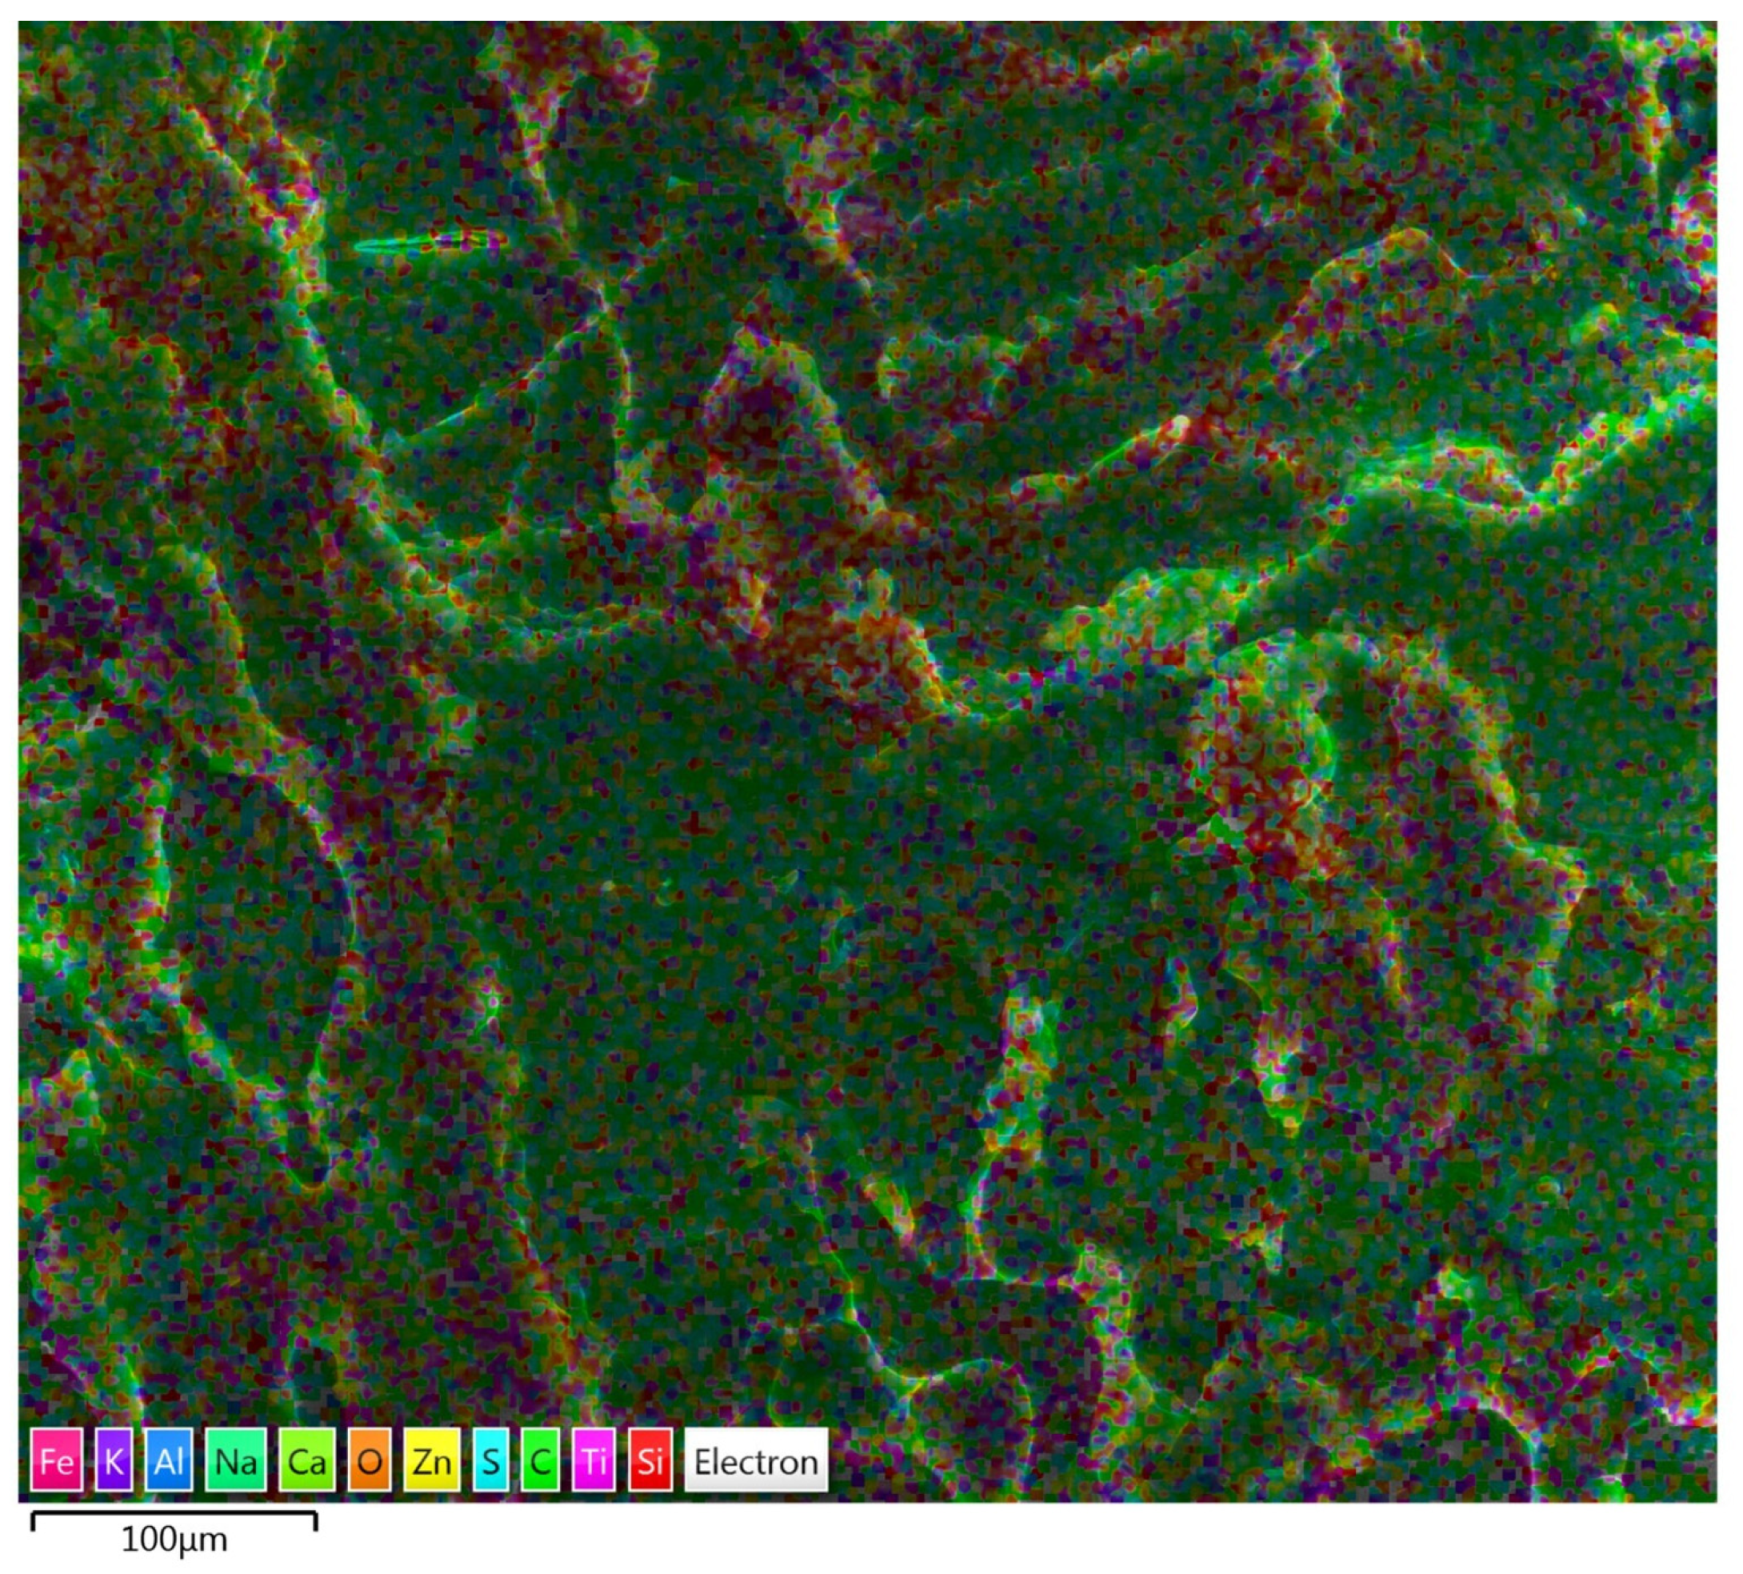
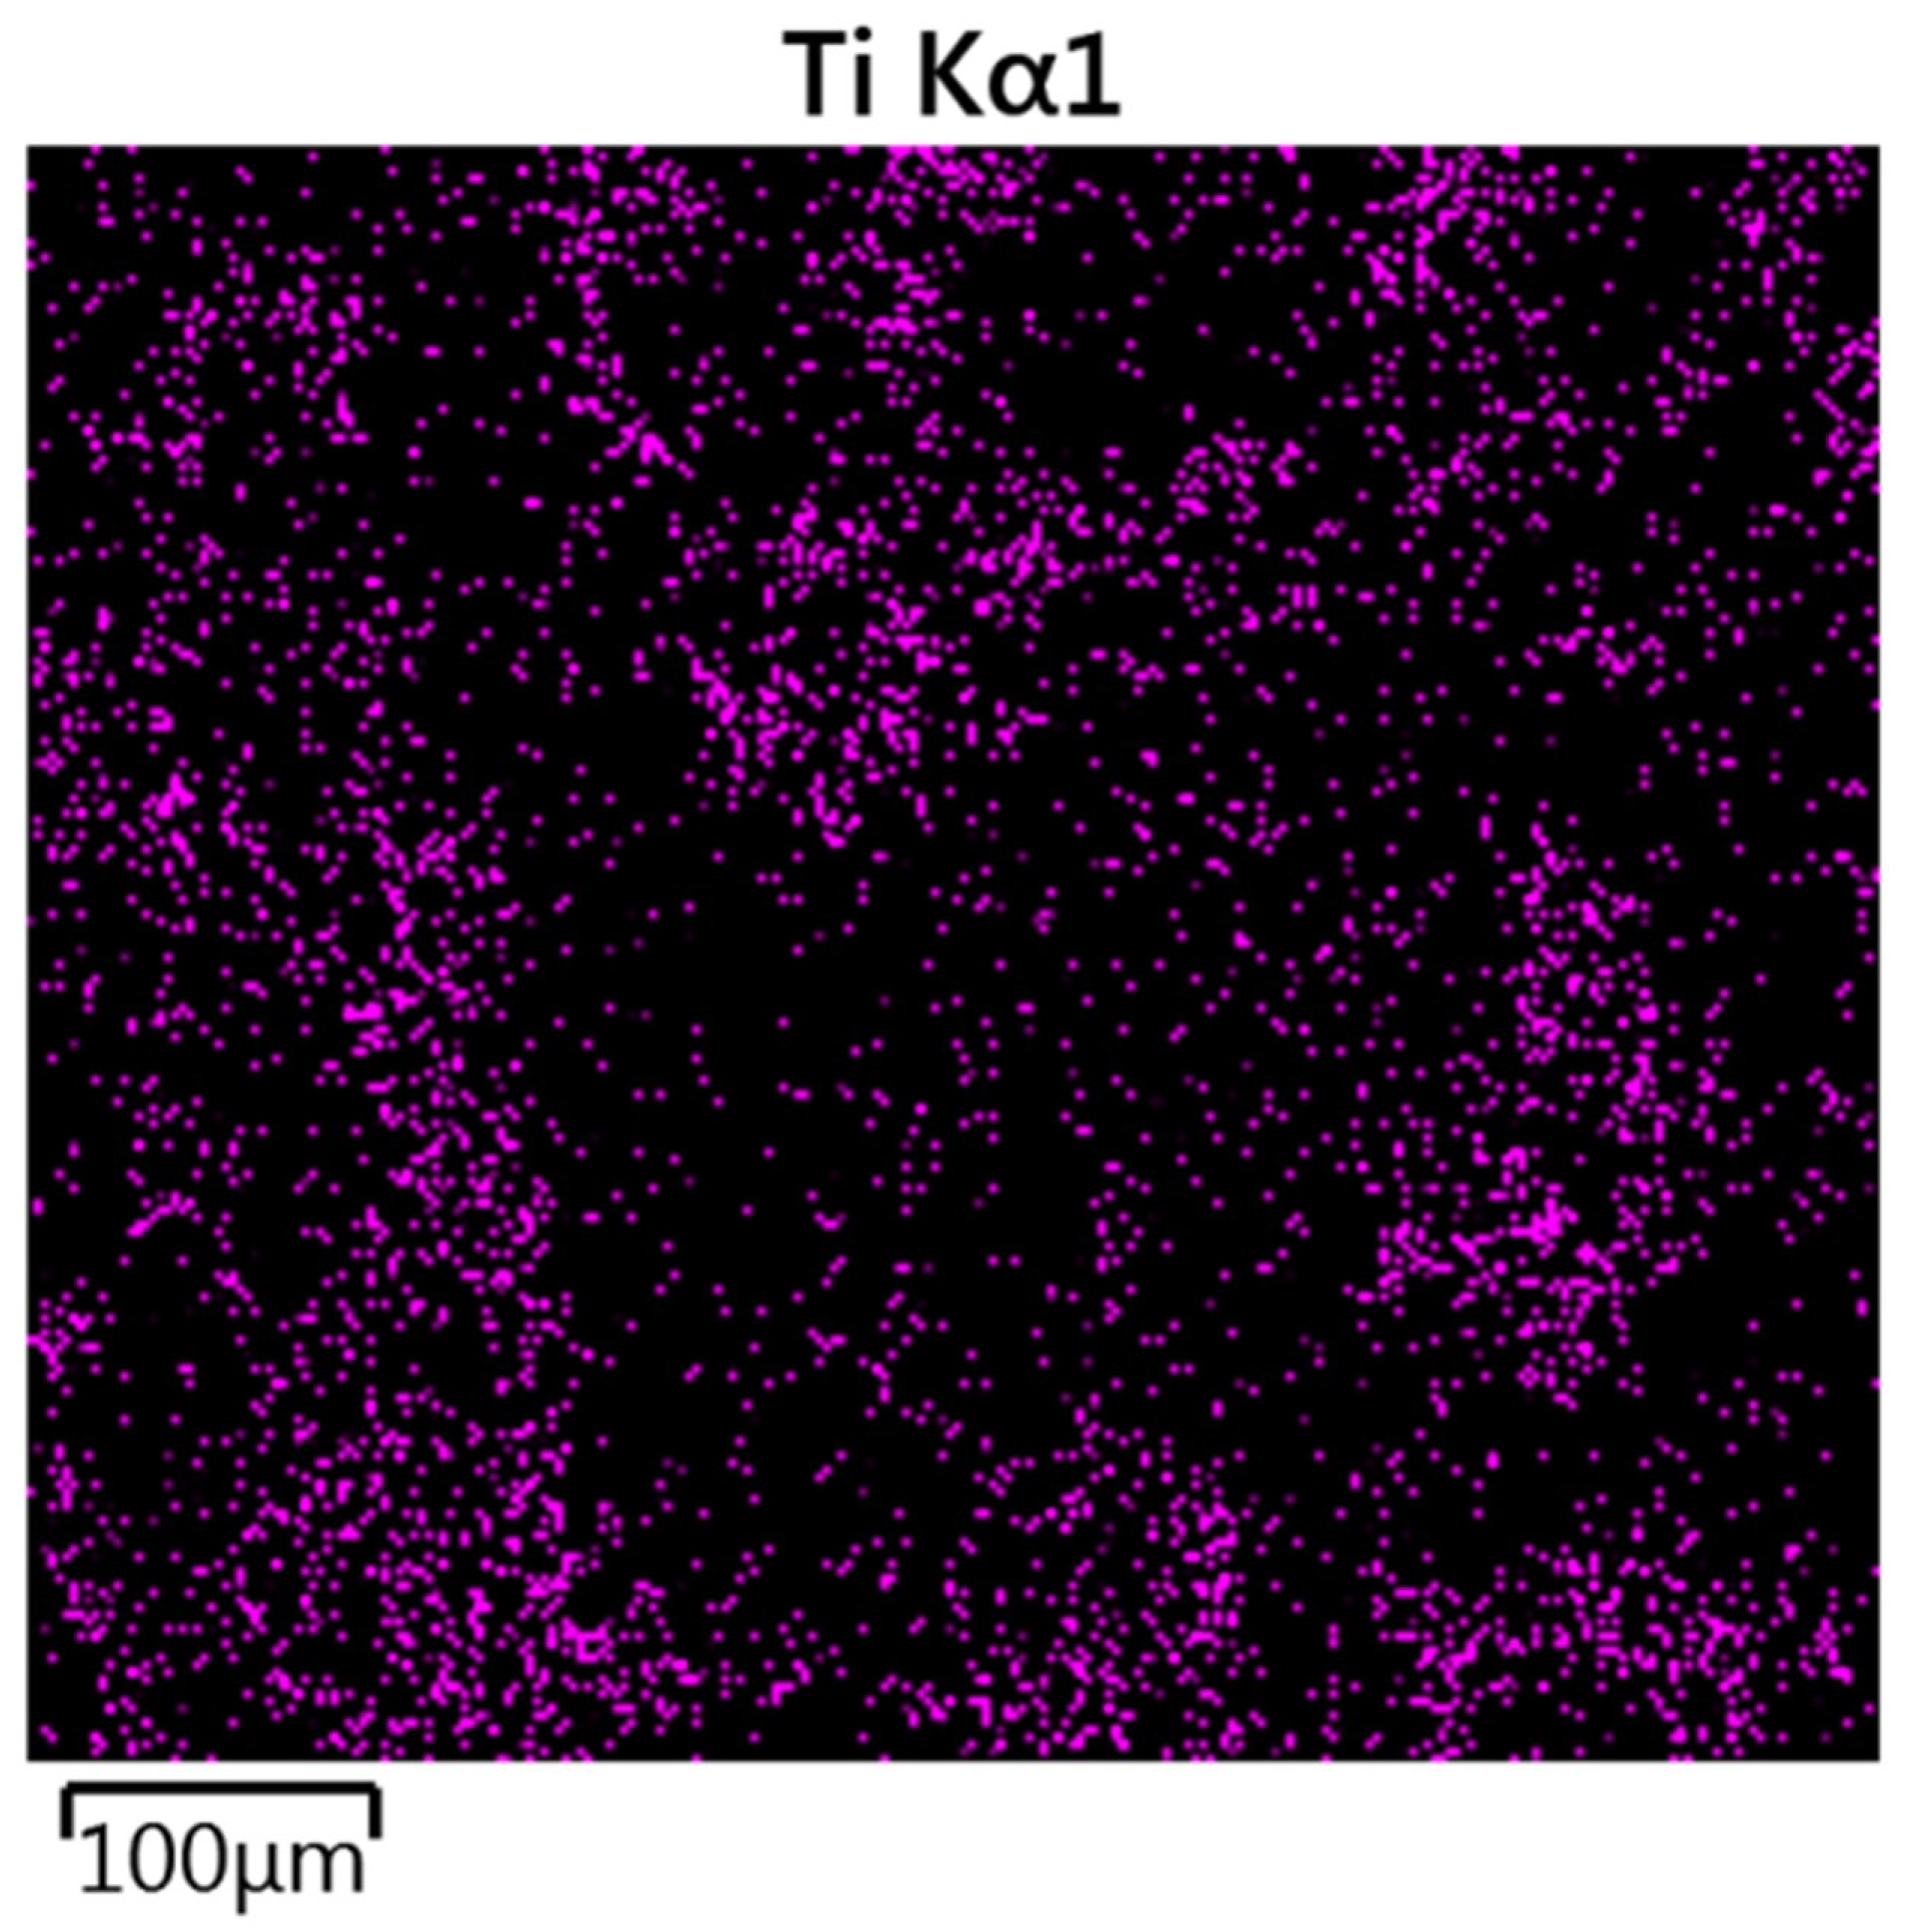
2.3.3. Scanning Electron Microscopy (SEM) and Energy Dispersion Spectroscopy (EDS)

Characterization was conducted using a FEG SEM Quanta 250 FEI (FEI Company, Hilsboro, OR, USA equipped with OXFORD PENTAFET EDS detector, Oxford Instruments, Abingdon, Oxfordshire, UK) scanning electron microscope, operating at 20 kV with a working distance of 20 mm, under low vacuum conditions (“as is”) without evaporation.

2.3.4. Fourier Transform Infrared Spectroscopy (FTIR)

The infrared spectra of the materials were recorded using a Fourier transform infrared (FTIR) spectrometer (Bruker Vertex 70, Billerica, MA, USA) equipped with an attenuated total reflection (ATR) accessory featuring a diamond crystal. For each measurement, 32 scans were collected across the spectral range of 375–4000 cm⁻¹ with a resolution of 2 cm⁻¹.

2.3.5. Leaching Test

The analysis of Total Dissolved Solids (TDS) was conducted using a Hach Lange Sension 156 multimeter (Hach Company, Ames, IA, USA), while Dissolved Organic Carbon (DOC) was measured with a Shimadzu TOC/TN analyzer (Shimadzu, Kyoto, Japan). Chlorides, fluorides, and sulfates were analyzed using a Hach Lange DR 5000 spectrophotometer (Hach Company, Ames, IA, USA), and metals were examined with a PerkinElmer AAnalyst 800 spectrometer (PerkinElmer, Waltham, MA, USA). Three techniques were employed for the metal analysis: flame atomic absorption spectroscopy (FAAS) for zinc (Zn), chromium (Cr) and copper (Cu); graphite furnace atomic absorption spectroscopy (GFAAS) for arsenic (As), barium (Ba), cadmium (Cd), molybdenum (Mo), nickel (Ni), lead (Pb), selenium (Se), silicon (Si) and titanium (Ti); and flow injection atomic spectroscopy (FIAS) for mercury (Hg).
For the study, samples were cut and rinsed in deionized water for 24 h, with a liquid-to-sample ratio (L/S) of 1/10. The water used for leaching the rubber samples was then filtered through a 0.45 μm filter. The leaching test results of the rubber tiles, both before and after the addition of TiO2, were compared with the limit values for waste disposal as outlined in the Ordinance on methods and conditions for landfill waste, specifically for the stabilized waste fraction following mechanical-biological treatment [32]. The results were also compared to the Toxicity Characteristic Leaching Procedure (TCLP) protocol [33], which is used by the U.S. Environmental Protection Agency (EPA) to assess how much toxic content from products would leach under normal conditions. Products that do not exceed regulatory limits for toxic material leaching are considered TCLP compliant [33].
For easier comparison, due to differences in units, the measured leaching concentrations were converted using a specific conversion formula (Equation (2)) [34]:
Leached substance [mg/kg] = leaching concentration [mg/L] × L/S ratio (l/kg),

3. Results and Discussion

3.1. Results before Accelerated Aging Test

3.1.1. Mechanical Properties (Before Accelerated Aging Test)

Table 2 presents the mechanical properties of the reference rubber tile (RRT) and various newly developed rubber tiles with TiO2 addition, including T/TiO2 (2% beginning), T/TiO2 (2% end), T/TiO2 (4% beginning), T/TiO2 (4% end) and MRT. The tested properties include abrasion, maximum stress (TS), stress at break (TSb), elongation at break (Eb), and hardness. Recent studies indicate that materials with nano-scale structures significantly improve the mechanical properties of polymeric materials [9,35]. Abrasion resistance is measured as either volume loss in cubic millimeters or as an abrasion resistance index in percentage. The results in Table 2 reveal that the MRT sample exhibits superior abrasion resistance compared to the RRT, T/TiO2 (2% beginning), T/TiO2 (2% end), T/TiO2 (4% beginning) and T/TiO2 (4% end) samples.
Given that metallic particles generally have higher thermal conductivity than the polymer matrix, it is expected that TiO2 enhances mechanical properties, such as wear resistance. This is supported by literature data [35], which indicates that the abrasion resistance of nanocomposite samples, including those with added TiO2, is significantly better compared to pure samples [35].
Tensile strength refers to the maximum mechanical tension a material can endure before cracking, while tear resistance, or tensile strength at break, measures the tensile stress at the exact moment of tearing. Both are expressed in N/mm2 or MPa. For elastomers, such as rubber, the maximum tensile stress and tensile stress at break are usually similar, so the terms are often used interchangeably [36]. In this study, since rubber is an elastomer, the TS and TSb values (Table 2) are nearly identical. Elongation at break describes the maximum percentage of elongation a tensile specimen undergoes at the point of breaking, reflecting the material’s deformability under tension [36]. The results indicate that the RRT has the highest TS and TSb values, while T/TiO2 (4% beginning) has the lowest. Increasing the TiO2 nanoparticle content enhances the tensile strength of the tiles. However, as shown by the results, an increase in elongation at break (Eb) corresponds with a decrease in TS and TSb, which is expected since these values are inversely related [37]. Higher elongation at break signifies greater ductility, meaning the material is more likely to deform rather than fracture under tensile load. Conversely, lower ductility suggests the material is more brittle and will fracture before significant deformation occurs [37].
The MRT sample has the highest elongation at break (Eb) value, indicating it is the most elastic and can undergo significant deformation under tensile load without breaking. This is desirable for rubber tiles used on children’s playgrounds, as a more elastic and softer surface offers better protection against injuries from falls. The tensile strength and elongation at break are key indicators of surface durability [38]. According to the IAAF Certification System, the minimum tensile strength required is 0.5 N/mm2 for non-porous surfaces and 0.4 N/mm2 for porous surfaces, with a minimum elongation at break of 40% for all surfaces [38].
Also, Young’s modulus (E) was calculated according to (Equation (3)) [39]:
E = σ ε
The stress is expressed as N/mm2, which is equivalent to MPa (1 N/mm2 = 1 MPa), while the elongation is expressed in %, so we multiplied the value by the number 100. The calculation was made using the stress and elongation values shown in Table 2.
Young’s modulus (E) for tire pieces is usually around 1 MPa [39]. Table 2 shows the results, and the conclusion is that a lower concentration of TiO2 in the tiles leads to a decrease in E. Also, here we see again how the mixing time of the composites before making the tiles affects the final quality. This is the case, for example, with T/TiO2 (4% beginning) and T/TiO2 (4% end), which contain the same ingredients just added at different times, and the results differ greatly.
Figure 2 shows the stress–strain curves. The units of measurement in the presented stress–strain curves (Figure 2 and Figure 8 (later, page 1124)) are not common, but they are equivalent to real ones. Namely, the curves shown could be said to represent load–displacement, which is correct in one sense, but our load, i.e., force, is defined on a precisely determined surface; for this reason, it represents stress, i.e., it is equivalent to stress. The displacement is defined as strain because we know exactly what the initial length of the test tube is, so the elongation is calculated from that. Furthermore, related to strain, the device prints elongation values (x-axis) either in mm or in %. The practice of our technicians who performed tests in the company’s laboratory is to print the strain value in mm for long-standing practical reasons. And it is calculated from the initial length prescribed by the standardized pattern. Although the device expresses elongation as machine displacement, since the width and length of the sample are clearly defined by the standard, it is always equivalent. The device used for stress and strain tests is standard in the rubber industry and gives results equivalent to stress–strain curves.
The difference between the curves appears after deformations greater than 0.3, which indicates the high sensitivity of the tested tile to the deformation rate. However, it is known that stress-strain responses of elastomers generally exhibit nonlinear rate-dependent elastic behavior, and they are sensitive to loading conditions: the rate and the state of loading [40,41]. RRT, MRT, and T/TiO2 (4% end) had much longer elongation and higher tensile strength at break than T/TiO2 (2% beginning), T/TiO2 (2% end), T/TiO2 (4% beginning), which is also perfectly represented by Young’s modulus. MRT and T/TiO2 (4% end) had longer elongation and higher tensile strength because they were reinforced with a higher concentration of TiO2. RRT is not compared here because it is the reference tile that is expected to have the best results at the beginning, but it will be evaluated after the accelerated aging test.
The hardness measurements revealed that the RRT was the hardest at 53.48 Shore A (ShA), while T/TiO2 (2% beginning) had the lowest hardness at 34.82 ShA. The addition of TiO2 resulted in decreased hardness values for T/TiO2 (2% beginning), T/TiO2 (2% end), T/TiO2 (4% beginning), T/TiO2 (4% end), and MRT, which corresponds to a reduction in TS and TSb across all samples.
Given that MRT demonstrated the best wear resistance while also showing reduced hardness compared to RRT, it is considered the most suitable for further testing. Higher proportions of TiO2 nanoparticles enhance wear resistance, elasticity, and hardness, though TS and TSb values are reduced. The superior performance of MRT can be attributed to its higher binder content. Since MRT showed the best mechanical properties, substrate characterization was performed only for MRT in comparison to RRT.

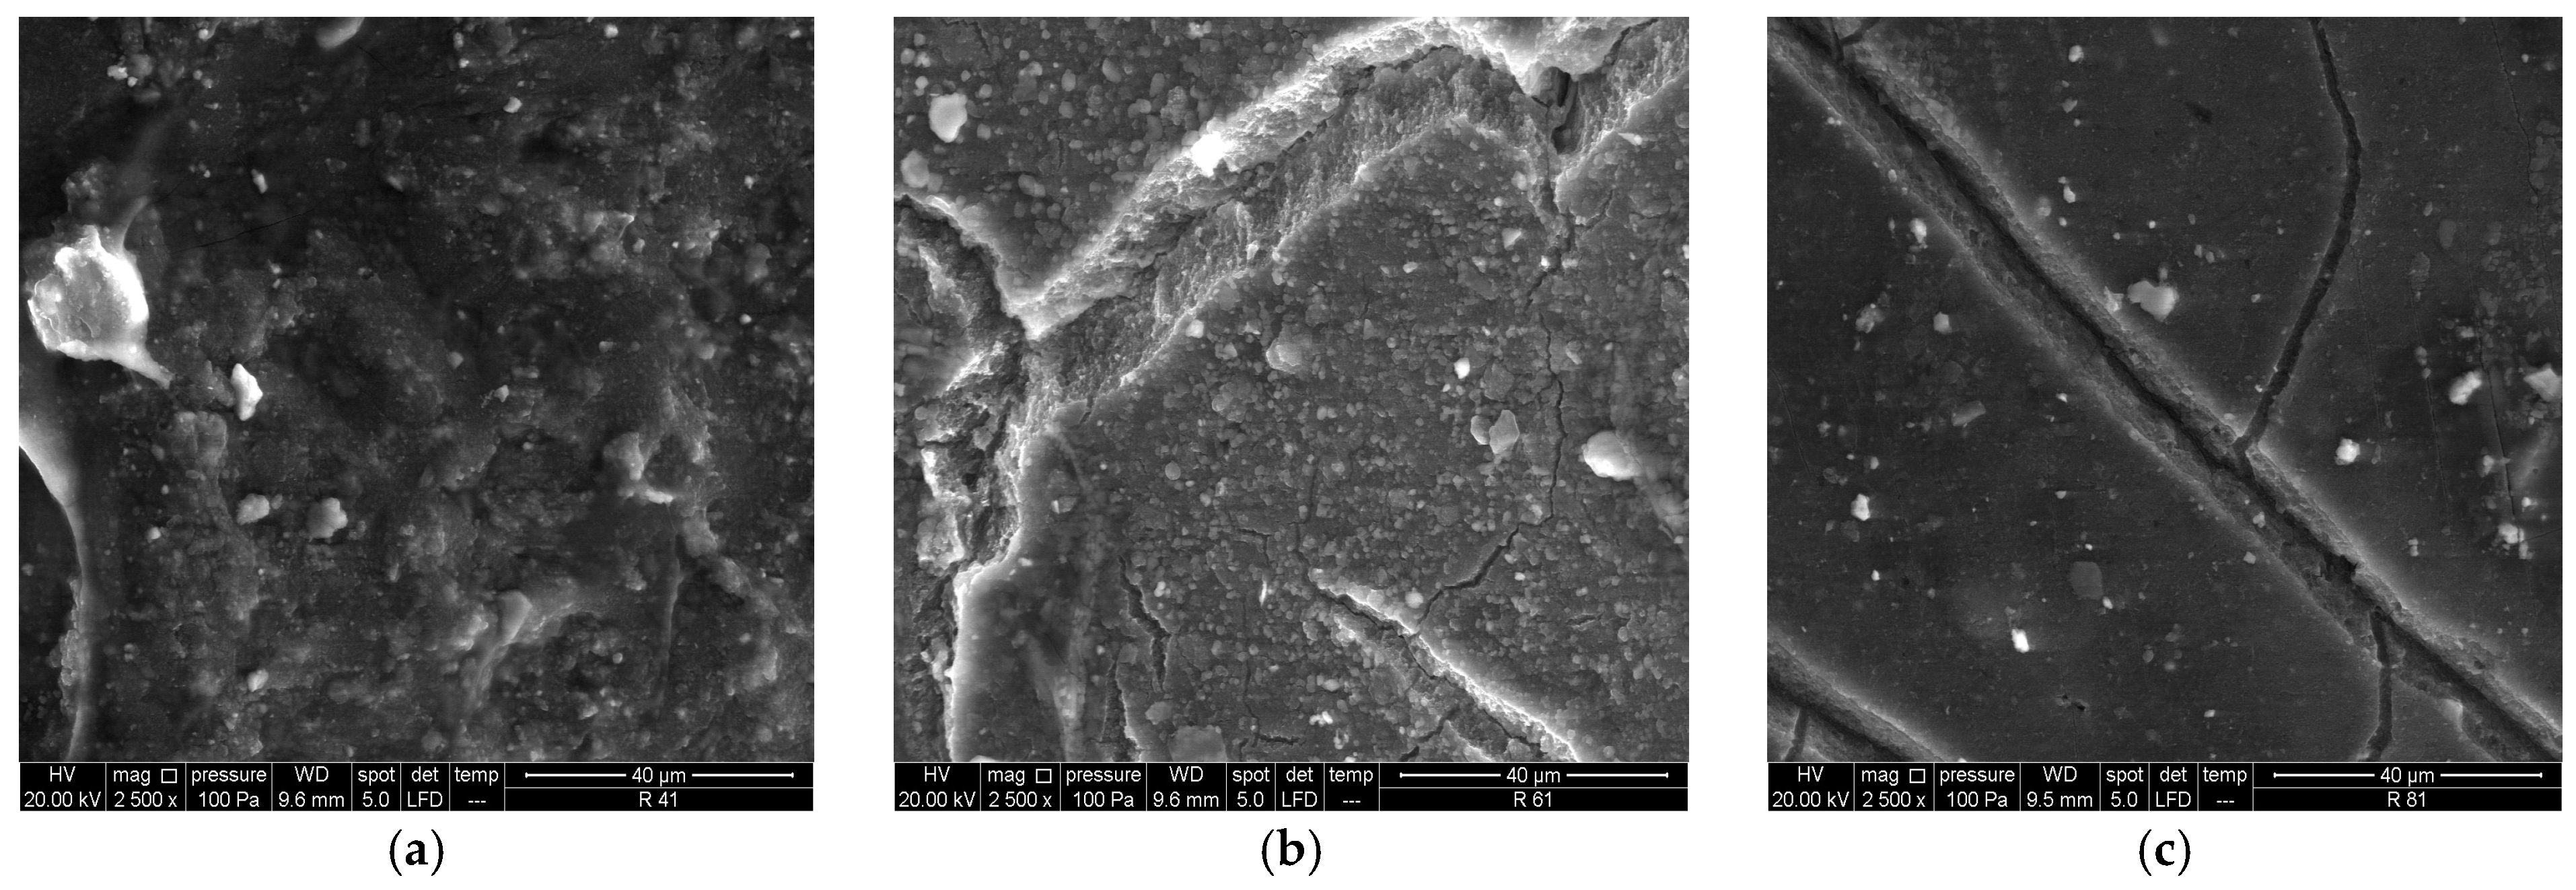
3.1.2. SEM/EDS Analysis (Before Accelerated Aging Test)

The morphology may strongly impact the properties of polymer nanocomposites; thus, it is important to clearly understand the basic mechanisms of morphology development [42]. Analysis of the structure of MRT is presented in Figure 3.
As we can see in Figure 3, morphology is slightly rough, as expected, since the tiles are primarily composed of rubber granules of irregular shape, approximately size 0.5–2.0 mm. Rubber tiles that are placed on children’s playgrounds must represent a stable surface for walking, so the surface must be rough to prevent slipping. The particles of TiO2 are randomly distributed in the mixture using a mixer. In most cases, the critical role in particle dispersion depends on the chemical compatibility between the matrix and the filler [43]. MRT also showed that morphology is uniform without larger aggregates, but with the aim of even better distribution of the mixture and filler, additional tests are needed regarding the mixing time. Longer mixing sometimes leads to agglomeration and separation of particles, and sometimes, it is used precisely for phase separation. Dispersion of particles can influence material properties because some aggregation may cause an increase in the permeability, fracture of material, and decrease of its mechanical and other properties [44]. Respectfully, the dispersion of TiO2 should be improved to achieve an increase in the specific surface, which improves the mechanical properties and, for further research, TiO2 would serve to make the surface of the rubber tiles photocatalytically active.
Figure 4 shows a colored map (EDS layered image) of the recorded surface on which are marked all found elements, as well as the exact locations where each one is located. Additionally, the EDS mapping graph is shown in Figure 5.
Figure 5 shows that the highest concentrations were detected for carbon and oxygen. In contrast, sulfur, silicon, zinc, titanium, barium, calcium, sodium, potassium, iron, and aluminum were detected in lower concentrations. The elements iron and zinc are detected because the tires originally contain galvanized iron sheaths that are removed from the tires before mechanical processing. During this process, a small percentage of particles are always left behind. The remaining detected elements are the elements originally contained in the tires and the particles that have stuck to the surface of the tires of cars, trucks, tractors, etc., during driving. In this paper, the attention is focused on TiO2, which was added as a filler to the reference mixture to produce rubber tiles. Therefore, Figure 6 shows the dispersion of Ti particles in the MRT sample (the purple color represents Ti).
The particles of Ti are distributed throughout the entire recorded surface but more densely distributed in some parts. Therefore, as we concluded earlier, after adding the TiO2 powder, different times of the mixing should be tested to achieve a more uniform distribution of particles within the tile.

3.1.3. FTIR Analysis (Before Accelerated Aging Test)

FTIR is a simple technique, making it much easier for us to understand the interaction between the components [45]. The RRT and the MRT were recorded, and the spectra are shown in Figure 7.
From the spectral analysis, it is observed that both samples show –OH stretching vibrations at 3300 cm−1 [24,44]. Peaks at 2966 cm−1, 2918 cm−1, and 2850 cm−1, visible in Figure 7, correspond to the characteristic vibration bands for C-H groups for asymmetric and symmetric stretching [45]. In addition, the intensity of the peak at 1730 cm−1 corresponding to the vibration of C-O groups has also increased in comparison to the reference rubber tile [24].
Absorption bands at 1730 cm−1, 1541 cm−1, and 1510 cm−1 are present in both samples, although they are more pronounced in the MRT sample, and it can assumed that these bands can be assigned to C=O stretching and N–H vibration, respectively [46]. Another band is around 1092 cm−1, and it is assumed that the peak is for ether stretching [46]. As evident from the spectra, the peak at 922 cm−1 is specific to the polyurethane material [47]. In Figure 7, the broadband spectrum below ~800 cm−1 corresponds to the characteristic vibrational mode of TiO2 (Ti–O stretching mode Ti–O–Ti) [48,49,50,51]. The addition of TiO2 did not change the spectrometry of the reference tile; the spectra of RRT and MRT have identical peaks, except that the peaks of MRT are slightly more pronounced. The only important difference is that the MRT sample has the presence of new bonds attributed to TiO2, which also indicates that TiO2 has been successfully incorporated into the tile.

3.1.4. Leaching Test Analysis (Before Accelerated Aging Test)

The disposal of waste tires leads to the problem of leaching of the constituents from the tire and the subsequent potentially harmful impact on the environment [52]. A leaching test analysis was conducted to investigate possible toxic leaching from MRT. The RRT and the MRT were tested, and the results are shown in Table 3.
Results of As, Ba, Cd, Cr, Cu, Hg, Mo, Ni, Pb, and Se for MRT are within the prescribed ordinances [32,33]. Although the concentrations of Si and Ti are not regulated by the prescribed ordinances, it was interesting to observe them because a certain amount of TiO2 was added in the experimental part, and later, the amount of polyurethane was additionally increased. Also, in the previous work, concentrations of Ti and Si were observed together [53], so we wanted to make a link with this research. The concentration of Si decreased from 1472.6 μg/L to 374.5 μg/L, while the concentration of Ti increased from 26.09 μg/L to 97.86 μg/L. An increase in Ti concentration is expected due to the addition of TiO2 to the reference mixture. Since there was an increase in Ti concentration, which was expected, it is important to know if there is a maximum permissible Ti concentration. According to [54], no normative references were found on the permissible limits for Ti concentration in water.
According to the European Chemicals Agency (ECHA, 2022), micro- and nano-TiO2 are not acutely or chronically toxic to aquatic organisms [55]. Data on terrestrial toxicity also show that micro- and nano-sized TiO2 materials are not harmful to soil organisms, including microbes, plants, and invertebrates, at concentrations up to at least 1000 mg/kg dry weight of soil [55]. Therefore, it can be concluded that the Ti concentrations measured in our research are unlikely to have an environmental impact [55].
Therewithal, the concentration of Zn for a reference rubber tile was 73 mg/kg. However, after the addition of TiO2, it decreased to 47.4 mg. Therefore, the limit value of the eluate parameter for zinc is 50 mg/kg, which would mean that the value of the reference rubber tile was higher than the allowed value and that the sample with the addition of TiO2 showed a better result, i.e., it is within the limit values [32].
Chlorides, fluorides, and sulfates remained the same after adding TiO2 to the reference mixture (Table 3) and were within the prescribed limit values [32].
Before applying TiO2, DOC concentrations were 395 mg/kg, and they decreased to 240.7 mg/kg after application, which is a significant reduction and well below the maximum allowable value of 3000 mg/kg [32]. Although there was a slight increase in TDS concentration, it remains within the prescribed limits [32]. The decrease in all detected components may be attributed to the higher binder content in the MRT sample, leading to lower values after leaching.
Typical tire structures include synthetic rubber, natural rubber, sulfur and its compounds, silica, phenolic resin, pigments, carbon black, oil, fabric, petroleum waxes, inert materials, fatty acids, and steel wire. Consequently, leachates may contain heavy metals, sulfur, and polyaromatic hydrocarbons (PAHs) [52]. Therefore, analyzing leachates from the tiles is crucial to prevent potential environmental pollution from harmful components. This paper’s analysis confirms that all detected components are within permissible limits according to the Ordinance on landfill waste management [32], the Toxicity Characteristic Leaching Procedure (TCLP) [33], and the European Chemicals Agency (ECHA, 2022) [55].

3.2. Results after Accelerated Aging Test

3.2.1. Mechanical Properties (After Accelerated Aging Test)

After we proved above that the mixing of 10% TiO2 into the mixture to produce rubber tiles was the most optimal, the newly obtained rubber tile (MRT) and the reference rubber tile (RRT) were tested for the accelerated aging test. Table 4 shows the results of the mechanical properties after the RRT and MRT were tested in a solar simulator for accelerated aging for 4, 6, and 8 weeks (hereafter RRT 4/6/8W and MRT 4/6/8W).
The abrasion results (Table 4) show that for both RRT and MRT samples, the values increase proportionally with the duration of the accelerated aging test. The TS and TSb values for the samples after the test are nearly identical, as the rubber used is an elastomer, as previously mentioned [36].
RRT 4W exhibits the highest initial TS value (1.55 N/mm2), while RRT 8W has the lowest (0.10 N/mm2). Conversely, MRT 4W started with a slightly lower TS value (0.71 N/mm2) compared to RRT 4W, but its tensile stress values remained almost unchanged even after 8 weeks of accelerated aging (MRT 8W = 0.70 N/mm2). This suggests that TiO2 as a filler improved the properties of the tile, as the tensile stresses remained nearly constant after 8 weeks of accelerated aging test.
The elongation at break for the RRT sample significantly decreased during aging. Initially, after 4 weeks of accelerated aging, it was 3.39%, which then slightly increased to 19.61% after 6 weeks. However, after 8 weeks, RRT 8W had a value of 16.21%. This represents a considerable drop from the initial 64.48% reported for RRT (Table 2). In comparison, the MRT sample had an elongation at a break of 72.01% before aging (Table 2). After 4 weeks of aging, MRT 4W was at 38.88%, dropping further to 28.65% after 6 weeks but rising to 66.24% after 8 weeks. This indicates that the addition of TiO2 significantly enhanced the mechanical properties of the rubber substrates, maintaining most of their crucial properties even after 8 weeks of accelerated aging, which equates to 15 years in real-time.
Furthermore, Young’s modulus after the accelerated aging test is the most interesting to compare for RRT 8W and MRT 8W, and it was calculated according to Equation (3), mentioned above. The reference substrate significantly lost its initial properties while MRT continued to maintain its performance, so E for MRT 8W was 41.51% higher than RRT8W. In addition to the tabular presentation, you can see the stress–strain curve for MRT 8W in Figure 8. Namely, RRT 8W could not be qualitatively tested after aging because the sample crumbled, and the results were not relevant. If we compare it with the tabular presentation, we can conclude that TiO2 has a strong impact on the protection of rubber surfaces.
Regarding hardness (Table 4), the decrease was less pronounced compared to tensile stresses. Both RRT and MRT samples showed an initial increase in hardness at the beginning of the aging process (RRT 4W was 59.6 ShA, increasing to 80.7 ShA at 6 weeks; MRT 4W was 50.6 ShA, rising to 76.3 ShA at 6 weeks), followed by a decline (RRT 8W decreased to 79.5 ShA, and MRT 8W to 72.0 ShA) [56]. The results indicate that the rubber becomes harder during the early stages of exposure to high temperatures and becomes softer in later stages [56].
The hardness of MRT 8W is 72.0 ShA, which, compared to RRT 8W (79.5 ShA), is an indication that the TiO2 filler made the rubber softer over a longer period, which is positive for the reason it is primarily used—as protection against injuries on children’s playgrounds when falling. Also, it is interesting to compare the hardness of RRT (53.48 ShA) (Table 2) with MRT 4W (50.6 ShA) (Table 4), from which we can conclude that the rubber tile with the addition of TiO2 was softer to use after 4 weeks of accelerated aging than the original RRT.
The results indicate that adding TiO2 to the standard recipe for rubber tile production enhances the tiles’ properties and prolongs their lifespan [22,23]. The observed increase in tensile strength is likely due to the dispersion of nanoparticles within the rubber compound, which increases the cross-sectional area and force and forms a cross-linked structure in the composite material [22]. Thus, this study provides clear evidence that incorporating TiO2 nanoparticles into elastomers strengthens the material.

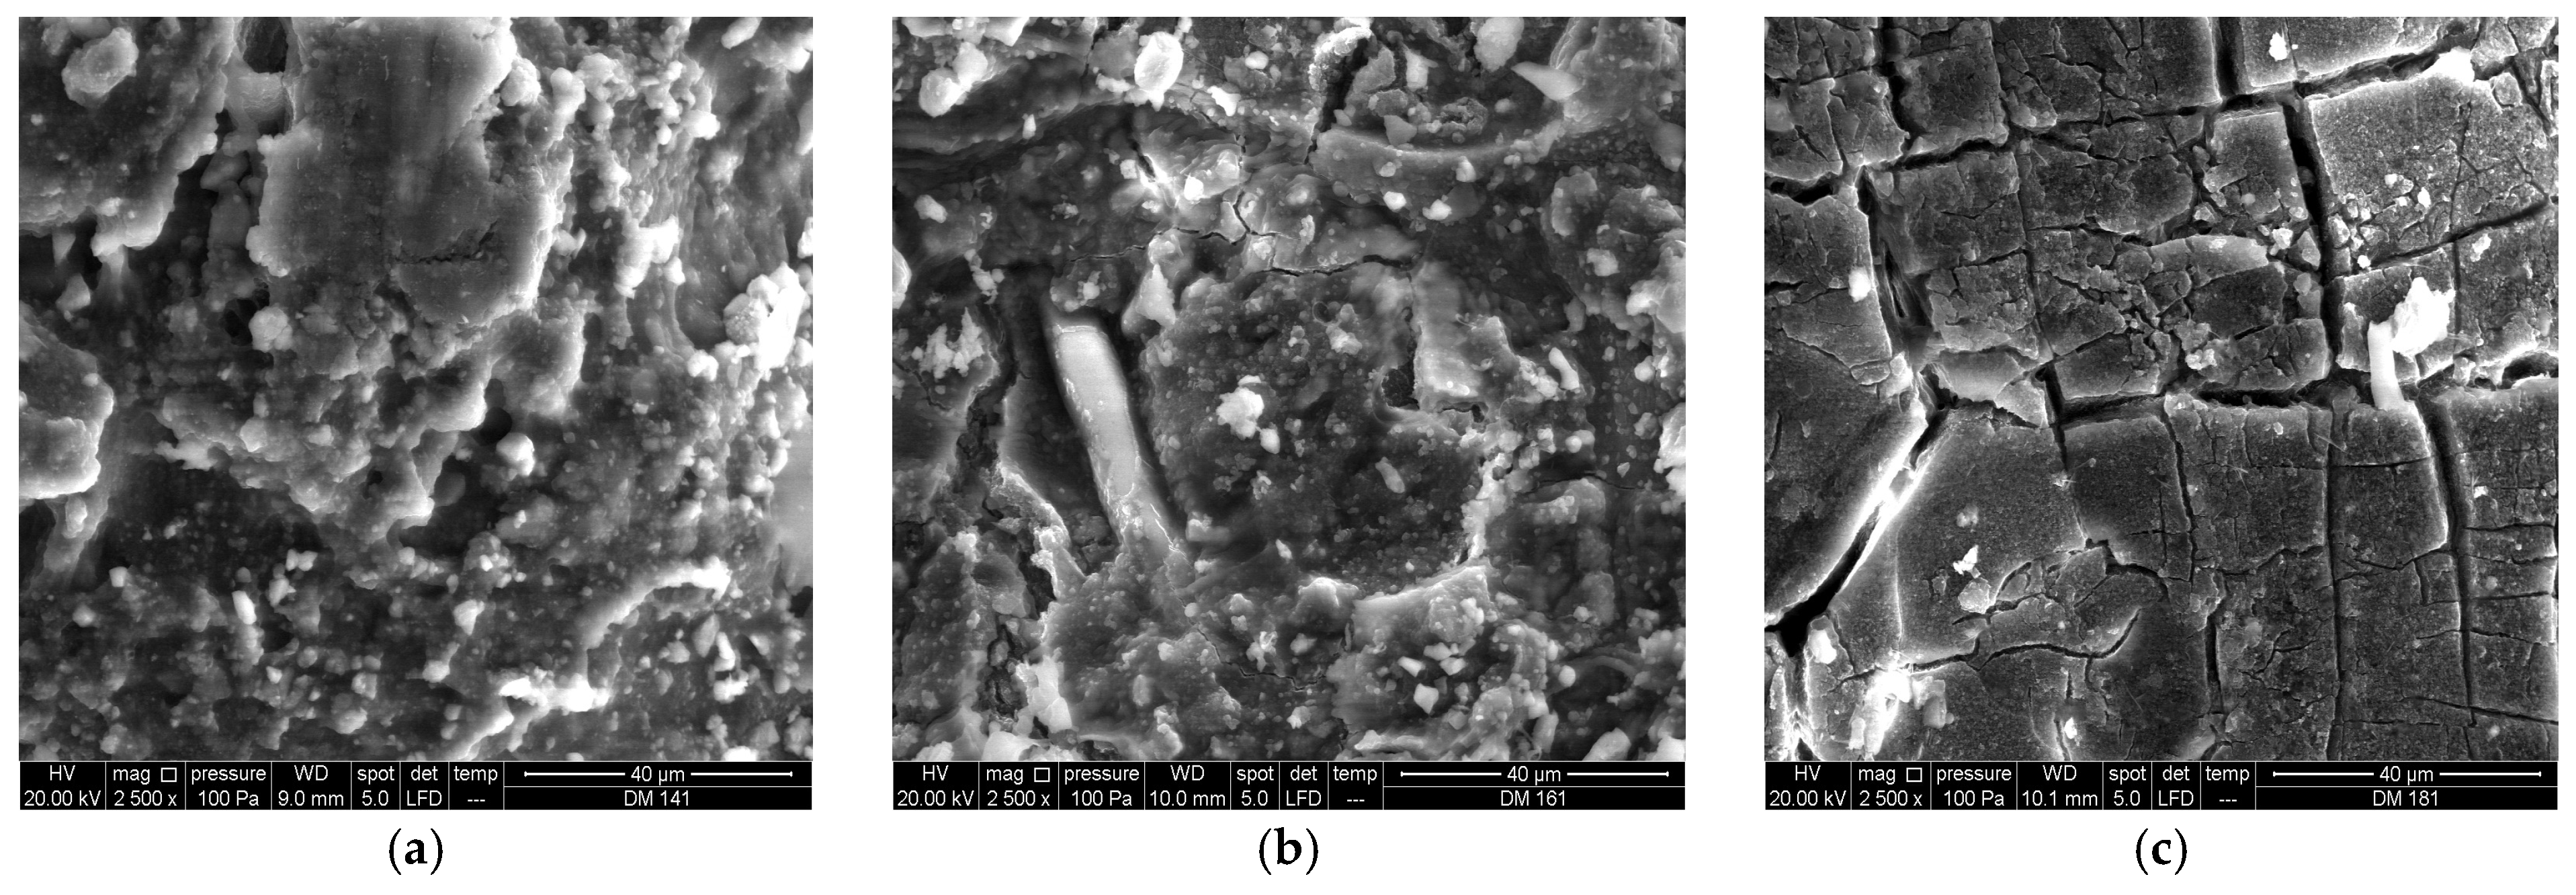
3.2.2. SEM/EDS Analysis (After Accelerated Aging Test)

The SEM analysis of RRT 4/6/8W and MRT 4/6/8W provides an overview of the surface changes of rubber tiles that occurred during the accelerated aging period. Figure 9 and Figure 10 show SEM results of RRT 4/6/8W and MRT 4/6/8W.
If we compare samples in Figure 9a–c, it can be observed that after 4 weeks of the accelerated aging test, the tile was still compact without visible cracks. In Figure 9b, there are large cracks and several smaller ones that connect to the main one. After 8 weeks (Figure 9c), the cracks are even more pronounced, and we can conclude that the tile is no longer usable. If we compare Figure 9a and Figure 10a, we can see that in Figure 10a, the surface is much more compact and connected. Related to that, Figure 10b has visibly fewer cracks and remains more compact compared to Figure 9b. In Figure 10c, smaller cracks appear, while the tile structure remains connected, compared to Figure 9c, where the cracks are visibly and significantly larger. The main factor in rubber aging is oxidation, i.e., the presence of oxygen due to the double bonds in the rubber. Oxidation has a strong dependence on temperature, which is consistent with the observation of the importance of temperature in rubber aging. Due to the temperature, the oxygen molecules break down and shorten, which leads to a loss of elasticity and the appearance of a network of cracks on the surface of aged rubber, and leads to chemical and physical changes in the rubber [57].
Also, EDS was performed for RRT 8W and MRT 8W, and the results are shown in Figure 11 and Figure 12, and more detailed elemental compositions in Table 5 and Table 6. If we compare the obtained mass concentrations from Figure 11 and Figure 12, it is evident that RRT 8W mostly consists of C—70.56% and O—22.95%, and the following elements are found in slightly lower concentrations: Na, Al, Si, S, Cl, K, Ca, Fe, Zn. On the other hand, MRT 8W contains slightly less C—55.09% and slightly more O—36.71%. The following elements were identified in lower concentrations: Al, Si, S, K, Ca, Ti, Fe, and Zn. It is also important to mention the presence of Ti—2.89%, which is stable in the tile even after 8 weeks of accelerated aging test. The obtained EDS results can relate to the previously explained SEM results.
The results showed that RRT 8W hardens and cracks faster than MRT 8W. The mass concentration showed that RRT 8W contains a higher percentage of carbon (C) and a lower proportion of oxygen (O) compared to MRT 8W, which indicates a stronger achieved oxidation in RRT 8W, and thus the breaking of more bonds, which resulted in the formation of cracks. Carbon–oxygen cross-links break due to high temperatures, and carbon–carbon cross-links are formed, which eventually break again, and the surface cracks [57].

3.2.3. FTIR Analysis (After Accelerated Aging Test)

Figure 13 shows the FTIR spectrum for the RRT 8W and MRT 8W. In both spectra, there are identical peaks at 2370 and 2320 cm−1, representing trapped CO2 (carbon dioxide) [38]. On the RRT 8W spectra, the peaks at 2370 and 2320 cm−1 are significantly lower compared to the spectrum of MRT 8W, which confirms that degradation occurs faster in the reference rubber tile (RRT 8W).
Furthermore, regarding the spectral analysis of RRT 8W, peaks at 1100 cm−1, 1418 cm−1, 1737 cm−1, and 3300 cm−1 were observed. The peak at 1100 cm−1 is due to the stretching of the C–O–C group [58], while the peak at 1418 cm−1 is identified by the CH2 vibration [59]. In addition, the absorption band at 1737 cm−1 is associated with a C=O group in polyurethane [59]. The band at 3300 cm−1 is assigned to OH bending and stretching vibrations, respectively [60]. Moreover, regarding the spectral analysis of MRT 8W, peaks at 875 cm−1, 1100 cm−1, and 1180 cm−1 were observed. The peak at 875 cm−1 can be attributed to the calcium carbonate band [61]. The peak at 1100 cm−1 is due to the stretching of the C–O–C group [58], while the peak at 1180 could be associated with CH stretching [59]. By comparing RRT 8W and MRT 8W, it is evident that in MRT 8W, there is no longer a band at 3300 cm−1, which is assigned to OH bending and stretching vibrations.

3.2.4. Leaching Test (After Accelerated Aging Test)

After the accelerated aging test, the leaching test for rubber surfaces RRT 8W and MRT 8W was repeated to ensure that the leaching of certain elements remained within the prescribed limits. Comparing Table 3 and Table 5, it was concluded that the accelerated aging test did not significantly alter the results. Additionally, comparing RRT 8W and MRT 8W with the regulatory limits [32,33] showed that the levels of As, Ba, Cd, Cr, Cu, Hg, Mo, Ni, Pb, and Se (Table 7) were below their respective limits. Although there were slight increases in Ba, Hg, and Mo concentrations in both samples, with RRT 8W showing slightly higher levels than MRT 8W, all values remained within the permissible limits [32,33].
Ti and Si concentrations are not regulated in the regulations used for other elements, but they are interesting to compare. If we compare the Si results from Table 3 and Table 7, we can see that in RRT, the Si concentration increased from 1472.6 µg/L to 2104 µg/L in RRT 8W. Regarding MRT, before the accelerated aging test, the Si concentration was 347.5 µg/L, and after the accelerated aging (MRT 8W) test, it was 244.4 µg/L.
Ti results from Table 3 indicate that the concentration in RRT was 26.09 µg/L, while in MRT, it was 97.86 µg/L. Comparing the Ti results from Table 3 and Table 7, the concentration of Ti in RRT 8W decreased to 18.82 µg/L, whereas in MRT 8W, it increased to 116.1 µg/L. The addition of Ti to RRT resulted in a reduction in Si concentration after the accelerated aging test. According to the ECHA (European Chemicals Agency) report from July 2020, there are no normative references for permissible Ti concentration limits in water. Regarding water toxicity, micro- and nano-TiO2 are not acutely or chronically toxic to aquatic or soil organisms, including microbes, plants, and invertebrates, up to at least 1000 mg/kg soil. For sediments, it appears to have a low potential for acute and chronic toxicity to freshwater and marine sediments based on available data for insect, crustacean, and annelid species [55].
The concentration of Zn for RRT 8W was 85.2 mg/kg, while for MRT 8W, it was 42.2 mg/kg. Comparing these results with [32], it is clear that the Zn level in RRT 8W exceeds the permissible limits, whereas MRT 8W remains within the acceptable range.
Chlorides, fluorides, and sulfates were all within their maximum allowable limits [32], while RRT 8W had a higher level of sulfates. The levels of DOC and TDS rose slightly in MRT 8W, but they remained within the acceptable range [32].

4. Conclusions

This study demonstrated that adding TiO2 to recycled rubber tiles significantly enhances their mechanical properties and environmental performance, particularly after accelerated aging. The modified rubber tiles (MRT) showed increased softness, elasticity, and tensile strength (0.70 N/mm2 for MRT 8W vs. 0.10 N/mm2 for RRT 8W), making them safer and more effective for playground use. Despite aging, MRT maintained acceptable elongation at break (66.24%) and exhibited less surface cracking compared to the reference rubber tiles (RRT). Also, Young’s modulus after accelerated aging in RRT 8W dropped to 0.62 MPa, while it was 1.06 MPa in MRT 8W. Additionally, TiO2 reduced the leaching of harmful zinc, with levels dropping from 73 mg/kg in RRT to 47.4 mg/kg in MRT and further to 42.2 mg/kg after aging. This highlights the dual benefit of improved durability and reduced environmental impact.
The addition of TiO2 to recycled rubber tiles not only improves their mechanical properties, making them safer and more durable for playground use but also reduces environmental risks by lowering harmful Zn leaching. This research offers an optimal recipe for producing eco-friendly, long-lasting rubber tiles and opens avenues for future enhancements, such as integrating photocatalytic properties to further boost environmental sustainability.

Author Contributions

Conceptualization, P.B., M.T., A.P.S. and I.B.; methodology, P.B., M.T., A.P.S. and I.B.; software, F.F.; validation, A.P.S., I.B., F.F. and I.G.; formal analysis, I.B. and F.F.; investigation, P.B.; resources, I.G.; data curation, P.B.; writing—original draft preparation, P.B.; writing—review and editing, P.B., M.T., A.P.S., I.B. and I.G.; visualization, P.B. and M.T.; supervision, A.P.S., I.B. and I.G.; project administration, I.G.; funding acquisition, I.G. All authors have read and agreed to the published version of the manuscript.

Funding

This work has been supported by the project, “Recycling rubber & solar photocatalysis: ecological innovation for passive air and health protection”, supported by the European Regional Development Fund, KK.01.1.1.07.0058.

Data Availability Statement

The data presented in this study are available on request from the corresponding author.

Acknowledgments

The authors would also like to acknowledge the Gumiimpex Ltd. company as the partner on the stated project for providing the materials and performing analyses.

Conflicts of Interest

Author Franjo Florijanić (F.F.) was employed by the company Gumiimpex—GRP d. d. The remaining authors declare that the research was conducted in the absence of any commercial or financial relationships that could be construed as a potential conflict of interest. The sponsors had no role in the design, execution, interpretation, or writing of this study.

References

  1. Kulkarni, P.; Jose, B.; Sambhudevan, S.; Shankar, B. Influence of SiC and TiO2 on the cure characteristics and mechanical properties of natural rubber composites. Mater. Today Proc. 2020, 46, 4451–4453. [Google Scholar] [CrossRef]
  2. Sivaselvi, K.; Varma, V.S.; Harikumar, A.; Jayaprakash, A.; Sankar, S.; Krishna, C.Y.; Gopal, K. Improving the mechanical properties of natural rubber composite with carbon black (N220) as filler. Mater. Today Proc. 2020, 42, 921–925. [Google Scholar] [CrossRef]
  3. Datta, J.; Kosiorek, P.; Włoch, M. Effect of high loading of titanium dioxide particles on the morphology, mechanical and thermo-mechanical properties of the natural rubber-based composites. Iran. Polym. J. 2016, 25, 1021–1035. [Google Scholar] [CrossRef]
  4. Che, X.C.; Jin, Y.Z.; Lee, Y.S. Preparation of nano-TiO2/polyurethane emulsions via in situ RAFT polymerization. Prog. Org. Coat. 2010, 69, 534–538. [Google Scholar] [CrossRef]
  5. Król, P.; Szlachta, M.; Pielichowska, K. Hydrophilic and hydrophobic films based on polyurethane cationomers containing TiO2 nanofiller. Prog. Org. Coat. 2022, 162, 106524. [Google Scholar] [CrossRef]
  6. Mahesh, K.P.O.; Kuo, D.H.; Huang, B.R.; Ujihara, M.; Imae, T. Chemically modified polyurethane-SiO2/TiO2 hybrid composite film and its reusability for photocatalytic degradation of Acid Black 1 (AB 1) under UV light. Appl. Catal. A Gen. 2014, 475, 235–241. [Google Scholar] [CrossRef]
  7. Athir, N.; Shah, S.A.A.; Shehzad, F.K.; Cheng, J.; Zhang, J.; Shi, L. Rutile TiO2 integrated zwitterion polyurethane composite films as an efficient photostable food packaging material. React. Funct. Polym. 2020, 157, 104733. [Google Scholar] [CrossRef]
  8. Kasanen, J.; Suvanto, M.; Pakkanen, T.T. Self-cleaning, titanium dioxide based, multilayer coating fabricated on polymer and glass surfaces. J. Appl. Polym. Sci. 2009, 111, 2597–2606. [Google Scholar] [CrossRef]
  9. Naphon, P.; Wiriyasart, S.; Naphon, N. Thermal, mechanical, and electrical properties of rubber latex with TiO2 nanoparticles. Compos. Commun. 2020, 22, 100449. [Google Scholar] [CrossRef]
  10. Hayeemasae, N.; Rathnayake, W.G.I.U.; Ismail, H. Nano-sized TiO2 -Reinforced Natural Rubber Composites Prepared by Latex Compounding Method. J. Vinyl Addit. Technol. 2015, 23, 200–209. [Google Scholar] [CrossRef]
  11. Loddo, V.; Bellardita, M.; Camera-Roda, G.; Parrino, F.; Palmisano, L. Heterogeneous Photocatalysis: A Promising Advanced Oxidation Process. In Current Trends and Future Developments on (Bio-) Membranes; Elsevier: Amsterdam, The Netherlands, 2018. [Google Scholar] [CrossRef]
  12. Sriwong, C.; Wongnawa, S.; Patarapaiboolchai, O. Photocatalytic activity of rubber sheet impregnated with TiO2 particles and its recyclability. Catal. Commun. 2008, 9, 213–218. [Google Scholar] [CrossRef]
  13. Leng, Z.; Yu, H. Novel Method of Coating Titanium Dioxide on to Asphalt Mixture Based on the Breath Figure Process for Air-Purifying Purpose. J. Mater. Civ. Eng. 2016, 28, 04015188. [Google Scholar] [CrossRef]
  14. Boonen, E.; Beeldens, A. Recent photocatalytic applications for air purification in Belgium. Coatings 2014, 4, 553–573. [Google Scholar] [CrossRef]
  15. La Russa, M.F.; Rovella, N.; Alvarez De Buergo, M.; Belfiore, C.M.; Pezzino, A.; Crisci, G.M.; Ruffolo, S.A. Nano-TiO2 coatings for cultural heritage protection: The role of the binder on hydrophobic and self-cleaning efficacy. Prog. Org. Coat. 2016, 91, 1–8. [Google Scholar] [CrossRef]
  16. Gherardi, F.; Maravelaki, P.N. Advances in the application of nanomaterials for natural stone conservation. RILEM Tech. Lett. 2022, 7, 20–29. [Google Scholar] [CrossRef]
  17. Ruffolo, S.A.; Francesco, M.; Russa, L. Nanostructured Coatings for Stone Protection: An Overview. Front. Mater. 2019, 6, 147. [Google Scholar] [CrossRef]
  18. Esposito, C.; Ingrosso, C.; Petronella, F.; Comparelli, R.; Striccoli, M.; Agostiano, A.; Frigione, M.; Curri, M.L. Progress in Organic Coatings A designed UV—Vis light curable coating nanocomposite based on colloidal TiO2 NRs in a hybrid resin for stone protection. Prog. Org. Coat. 2018, 122, 290–301. [Google Scholar] [CrossRef]
  19. Nazir, M.; Irfan, M.; Ali, I.; Abdul, M. Photonics and Nanostructures—Fundamentals and Applications Revealing antimicrobial and contrasting photocatalytic behavior of metal chalcogenide deposited P25-TiO2 nanoparticles. Photonics Nanostruct.—Fundam. Appl. 2019, 36, 100721. [Google Scholar] [CrossRef]
  20. Dds, A.S.; Bahador, A.; Khalil, S.; Saffar, A.; Dds, S.; Zaman, M. The effect of TiO2 and SiO2 nanoparticles on flexural strength of poly (methyl methacrylate) acrylic resins. J. Prosthodont. Res. 2013, 57, 15–19. [Google Scholar] [CrossRef]
  21. Salama, A.; Kamel, B.M.; Osman, T.A.; Rashad, R.M. Investigation of mechanical properties of UHMWPE composites reinforced with HAP þ TiO2 fabricated by solvent dispersing technique. J. Mater. Res. Technol. 2022, 21, 4330–4343. [Google Scholar] [CrossRef]
  22. Wang, L.; Liu, Q.; Jing, D.; Zhou, S.; Shao, L. ScienceDirect Biomechanical properties of nano-TiO2 addition to a medical silicone elastomer: The effect of artificial ageing. J. Dent. 2014, 42, 475–483. [Google Scholar] [CrossRef] [PubMed]
  23. Elsaka, S.E.; Hamouda, I.M.; Swain, M.V. Titanium dioxide nanoparticles addition to a conventional glass-ionomer restorative: Influence on physical and antibacterial properties. J. Dent. 2011, 39, 589–598. [Google Scholar] [CrossRef] [PubMed]
  24. Jin, M.; Zhang, X.; Emeline, A.V.; Numata, T.; Murakami, T.; Fujishima, A. Surface modification of natural rubber by TiO2 film. Surf. Coat. Technol. 2008, 202, 1364–1370. [Google Scholar] [CrossRef]
  25. Grčić, I.; Papić, S.; Brnardić, I. Photocatalytic Activity of TiO2 Thin Films: Kinetic and Efficiency Study. Int. J. Chem. React. Eng. 2018, 16, 20160153. [Google Scholar] [CrossRef]
  26. Kockott, D. New method for accelerated testing of the aging behavior of polymeric materials as a function of radiation and temperature. Polym. Test. 2022, 110, 107550. [Google Scholar] [CrossRef]
  27. Krug, N.; Zarges, J.-C.; Heim, H.-P. Influence of ethylene oxide and gamma irradiation sterilization processes on the degradation behaviour of poly(lactic acid) (PLA) in the course of artificially accelerated aging. Polym. Test. 2024, 132, 108362. [Google Scholar] [CrossRef]
  28. Lamberti, M.; Maurel-Pantel, A.; Lebon, F. Experimental and numerical evaluation of hydro-thermal ageing’s effects on adhesive connections in offshore structures. Ocean Eng. 2023, 290, 116303. [Google Scholar] [CrossRef]
  29. Determination of Abrasion Resistance, Dtsch. Norm. (1987). Available online: https://www.scribd.com/document/491624773/DIN-53516-1987 (accessed on 24 September 2024).
  30. DIN 53504 Testing of Rubber—Determination of Tensile Strength at Break, Tensile Stress at Yield, Elongation at Break and Stress Values in a Tensile Test, Dtsch. Norm. (2009). Available online: https://www.scribd.com/document/604097259/DIN-53504-2009 (accessed on 24 September 2024).
  31. DIN 53505, Ind. Phys. (n.d.). Available online: https://industrialphysics.com/ (accessed on 24 September 2024).
  32. Narodne Novine, Službeni List Republike Hrvatske. Available online: https://narodne-novine.nn.hr/clanci/sluzbeni/2015_10_114_2184.html (accessed on 25 March 2024).
  33. USEPA-Method:1311; Toxicity Characteristic Leaching Procedure (TCLP). Hong Kong Accredit. LOR: Hong Kong, China, 2011.
  34. van der Sloot, H.A.; van Zomeren, A.; Meeussen, J.; Hoede, D.; Rietra, R.; Stenger, R.; Lang, T.; Schneider, M.; Spanka, G.; Stoltenberg-Hansson, E.; et al. Environmental Criteria for Cement Based Products Phase I: Ordinary Portland Cement Phase II: Blended Cements and Methodology for Impact Assessment; Energy Research Centre of the Netherlands ECN: Petten, The Netherlands, 2008; Volume 2011, p. 224. [Google Scholar]
  35. Fasahat, F.; Dastjerdi, R.; Mojtahedi, M.R.M.; Hoseini, P. Wear properties of high speed spun multi-component PA6 nanocomposite fabrics; abrasion resistance mechanism of nanocomposites. Wear 2015, 322–323, 117–125. [Google Scholar] [CrossRef]
  36. Elastomer Institut Richter Tensile Strength, Tear Resistance and Elongation at Break. Available online: https://elastomer-institut.de/en/ (accessed on 18 April 2024).
  37. Xometry Elongation at Break: Definition, Calculation, Benefits, Limitations, and Examples. Available online: https://www.xometry.com/ (accessed on 18 April 2024).
  38. Track, I.; Surface, S.; Specifications, T. IAAF Track Synthetic Surface Testing Specifications IAAF Certification System Track Synthetic Surface Testing Specifications. 2010. Available online: https://worldathletics.org/ (accessed on 14 April 2024).
  39. Edeskär, T. Technical and Environmental Properties of Tyre Shreds Focusing on Ground Engineering Applications; Luleå Tekniska Universitet: Luleå, Sweden, 2004; Available online: https://www.diva-portal.org/smash/record.jsf?pid=diva2%3A996312&dswid=-1211 (accessed on 15 May 2024).
  40. Baranowski, P.; Janiszewski, J.; Małachowski, J. Tire rubber testing procedure over a wide range of strain rates. J. Theor. Appl. Mech. 2017, 55, 727–739. [Google Scholar] [CrossRef]
  41. Janiszewski, J.; Bużantowicz, W.; Baranowski, P. Correction Procedure of Wave Signals for a Viscoelastic Split Hopkinson Pressure Bar. Probl. Mechatronics. Armament Aviat. Saf. Eng. 2016, 7, 17–30. [Google Scholar] [CrossRef]
  42. Ptiček Siročić, A.; Rešček, A.; Katančić, Z.; Hrnjak-Murgić, Z. Effect of modifiers; casein, zeolite and magnetite on the properties of bilayer polyethylene/polycaprolactone films. J. Adhes. Sci. Technol. 2020, 34, 2537–2550. [Google Scholar] [CrossRef]
  43. Ptiček Siročić, A.; Rešček, A.; Katančić, Z.; Hrnjak-Murgić, Z. Development of PE/PCL Bilayer Films Modified with Casein and Aluminum Oxide. Molecules 2021, 26, 3090. [Google Scholar] [CrossRef] [PubMed]
  44. Rešček, A.; Krehula, L.K.; Katančić, Z.; Hrnjak-Murgić, Z. Active bilayer PE/PCL films for food packaging modified with zinc oxide and casein. Croat. Chem. Acta 2015, 88, 461–473. [Google Scholar] [CrossRef]
  45. Jarnthong, M.; Liao, L.; Zhang, F.; Wang, Y.; Li, P.; Peng, Z.; Malawet, C.; Intharapat, P. Characterization of interaction between natural rubber and silica by FTIR. AIP Conf. Proc. 2017, 1846, 020014. [Google Scholar] [CrossRef]
  46. Manap, S.M.; Ahmad, A.; Anuar, F.H. Characterization of poly(L-lactide/Propylene glycol) based polyurethane films using ATR-FTIR spectroscopy. AIP Conf. Proc. 2016, 1784, 03002. [Google Scholar] [CrossRef]
  47. Badri, K.B.H.; Sien, W.C.; Shahrom, M.S.B.R.; Hao, L.C.; Baderuliksan, N.Y.; Norzali, N.R. Adawiyah Ftir Spectroscopy Analysis of the Prepolymerization of Palm-Base Polyurethane. Solid State Sci. Technol. 2010, 18, 1–8. [Google Scholar]
  48. Vijayalakshmi, U.; Chellappa, M.; Anjaneyulu, U.; Manivasagam, G.; Sethu, S. Influence of Coating Parameter and Sintering Atmosphere on the Corrosion Resistance Behavior of Electrophoretically Deposited Composite Coatings. Mater. Manuf. Process. 2016, 31, 95–106. [Google Scholar] [CrossRef]
  49. Sriwong, C.; Choojun, K.; Sriwong, S. High photocatalytic performance of 3D porous-structured TiO2@natural rubber hybrid sheet on the removal of indigo carmine dye in water. SN Appl. Sci. 2019, 1, 864. [Google Scholar] [CrossRef]
  50. Ingole, S.; Charanpahari, A.; Kakade, A.; Umare, S.S.; Bhatt, D.V.; Menghani, J. Tribological behavior of nano TiO2 as an additive in base oil. Wear 2013, 301, 776–785. [Google Scholar] [CrossRef]
  51. Panwar, K.; Jassal, M.; Agrawal, A.K. TiO2-SiO2 Janus particles with highly enhanced photocatalytic activity. RSC Adv. 2016, 6, 92754–92764. [Google Scholar] [CrossRef]
  52. Selbes, M. Leaching of Dissolved Organic Carbon and Carbon Dioxide Emission. 2009. Available online: https://open.clemson.edu/all_theses/664/ (accessed on 8 May 2024).
  53. Benjak, P.; Radetić, L.; Tomaš, M.; Brnardić, I.; Radetić, B.; Špada, V.; Grčić, I. Rubber Tiles Made from Secondary Raw Materials with Immobilized Titanium Dioxide as Passive Air Protection. Processes 2023, 11, 125. [Google Scholar] [CrossRef]
  54. Jimenez-Relinque, E.; Grande, M.; Duran, T.; Castillo, Á.; Castellote, M. Environmental impact of nano-functionalized construction materials: Leaching of titanium and nitrates from photocatalytic pavements under outdoor conditions. Sci. Total Environ. 2020, 744, 140817. [Google Scholar] [CrossRef] [PubMed]
  55. The European Chemicals Agency. Available online: https://echa.europa.eu/registration-dossier/-/registered-dossier/15560/6/2/1 (accessed on 13 March 2024).
  56. Kashi, S.; Varley, R.; De Souza, M.; Al-Assafi, S.; Di Pietro, A.; de Lavigne, C.; Fox, B. Mechanical, Thermal, and Morphological Behavior of Silicone Rubber during Accelerated Aging. Polym.—Plast. Technol. Eng. 2018, 57, 1687–1696. [Google Scholar] [CrossRef]
  57. Baldwin, O.M.; Bauer, D.R. Rubber oxidation and tire aging—A review. Rubber Chem. Technol. 2008, 81, 338–358. [Google Scholar] [CrossRef]
  58. Boulaouche, T.; Kherroub, D.E.; Khimeche, K.; Belbachir, M. Green strategy for the synthesis of polyurethane by a heterogeneous catalyst based on activated clay. Res. Chem. Intermed. 2019, 45, 3585–3600. [Google Scholar] [CrossRef]
  59. Asefnejad, A.; Khorasani, M.T.; Behnamghader, A.; Farsadzadeh, B.; Bonakdar, S. Manufacturing of biodegradable polyurethane scaffolds based on polycaprolactone using a phase separation method: Physical properties and in vitro assay. Int. J. Nanomed. 2011, 6, 2375–2384. [Google Scholar] [CrossRef] [PubMed]
  60. Riazian, M.; Montazeri, N.; Biazar, E. Nano structural properties of TiO2-SiO2. Orient. J. Chem. 2011, 27, 903–910. [Google Scholar]
  61. Luna, C.B.B.; Araújo, E.M.; Siqueira, D.D.; Morais, D.D.d.S.; Filho, E.A.d.S.; Fook, M.V.L. Incorporation of a recycled rubber compound from the shoe industry in polystyrene: Effect of SBS compatibilizer content. J. Elastomers Plast. 2020, 52, 3–28. [Google Scholar] [CrossRef]
Figure 1. Representation of reference solar spectral irradiance (AM 1.5G—a global horizontal irradiance spectrum) compared with the one of the solar simulator (ISOSun) provided by the manufacturer.
Chemistry 06 00065 g001
Figure 2. Stress–strain curves of tiles from Table 2.
Chemistry 06 00065 g002
Figure 3. SEM analysis of MRT.
Chemistry 06 00065 g003
Figure 4. Colored map—EDS layered image of MRT.
Chemistry 06 00065 g004
Figure 5. EDS of colored map of MRT.
Chemistry 06 00065 g005
Figure 6. Dispersion of Ti particles in MRT.
Chemistry 06 00065 g006
Figure 7. FTIR spectra of RRT and MRT.
Chemistry 06 00065 g007
Figure 8. Stress–strain curve of MRT 8W.
Chemistry 06 00065 g008
Figure 9. Morphology of the RRT surfaces (2500×): (a) after 4 weeks; (b) after 6 weeks; and (c) after 8 weeks.
Chemistry 06 00065 g009
Figure 10. Morphology of the MRT surfaces (2500×): (a) after 4 weeks; (b) after 6 weeks; and (c) after 8 weeks.
Chemistry 06 00065 g010
Figure 11. EDS mapping of RRT 8W.
Chemistry 06 00065 g011
Figure 12. EDS mapping of MRT 8W.
Chemistry 06 00065 g012
Figure 13. FTIR spectra of RRT 8W and MRT 8W.
Chemistry 06 00065 g013
Table 1. Ingredients and masses of individual tiles.
Mass of Rubber Granulates [kg]Mass of Polyurethane [g]Mass of Catalyst [g]Mass of TiO2 [g]
RRT93805-
T/TiO2 (2% beginning)938057.7
T/TiO2 (2% end)938057.7
T/TiO2 (4% beginning)9380515.4
T/TiO2 (4% end)9380515.4
T/TiO2 (10% beginning)—failed9380538.5
MRT9700738.5
RRT—referent rubber tile, T/TiO2—tile with addition of TiO2, MRT—modified rubber tile with addition of TiO2.
Table 2. Results of mechanical properties (before accelerated aging).
A [mm3]SDTS [N/mm2]SDTSb [N/mm2]Eb [%]SDH [ShA]SDE [MPa]
RRT14421.07131.270.15721.2764.485.317153.481.71081.97
T/TiO2 (2% beginning)15224.43360.440.15520.4455.566.739634.825.99640.79
T/TiO2 (2% end)16821.70250.480.17440.4849.486.710940.147.55500.97
T/TiO2 (4% beginning)18426.88870.320.15130.3243.105.260837.784.86180.74
T/TiO2 (4% end)20623.30240.670.18730.6463.225.975736.740.45061.06
MRT112.2124.33920.750.13750.7572.015.972744.045.61231.04
A = Abrasion, H = Hardness, E = Young’s modulus.
Table 3. Results of the leaching test (before the accelerated aging test).
Parameter RRTMRT
As <0.05 µg/L0.054 µg/L
Ba <0.35 µg/L<0.35 µg/L
Cd <0.002 µg/L<0.002 µg/L
Cr <0.003 mg/L<0.003 mg/L
Cu <0.0015 mg/L<0.0015 mg/L
Hg <0.009 µg/L<0.009 µg/L
Mo 1.22 µg/L<0.03 µg/L
Ni <0.07 µg/L<0.07 µg/L
Pb <0.05 µg/L0.14 µg/L
Se <0.05 µg/L<0.05 µg/L
Si 1472.6 µg/L347.5 µg/L
Ti 26.09 µg/L97.86 µg/L
Zn 0.73 mg/L0.474 mg/L
Cl 2.1 mg/L2.4 mg/L
F 0.12 mg/L0.13 mg/L
SO42− 1 mg/L1 mg/L
DOC 39.5 mg/L24.07 mg/L
TDS 13.4 mg/L15.8 mg/L
Table 4. Results of mechanical properties (after accelerated aging).
A [mm3]SDTS [N/mm2]SDTSb [N/mm2]Eb
[%]
SDH [ShA]SDE [MPa]
RRT 4W33731.57531.550.18351.553.391.100159.66.7168
RRT 6W51725.23890.440.12490.4119.616.159280.76.7279
RRT 8W67326.51410.100.03060.0016.213.261879.56.50460.62
MRT 4W66227.40440.710.16990.7038.887.077750.67.2536
MRT 6W91725.53430.520.18330.5028.657.374176.36.7724
MRT 8W76731.19290.700.02360.5766.245.647372.07.31441.06
A = Abrasion, H = Hardness, E = Young’s modulus.
Table 5. Elemental composition of EDX values from Figure 11.
ElementWt%
C70.56
O22.95
Na0.49
Al0.11
Si0.18
S1.59
Cl0.12
K0.23
Ca0.25
Fe0.45
Zn3.08
Total:100.00
Table 6. Elemental composition of EDX values from Figure 12.
ElementWt%
C55.09
O36.71
Al0.10
Si0.29
S2.67
K0.19
Ca0.25
Ti2.89
Fe0.29
Zn1.52
Total:100.00
Table 7. Results of leaching test.
ParameterRRT 8W MRT 8W
As<0.05 µg/L<0.05 µg/L
Ba76.09 µg/L35.31 µg/L
Cd<0.002 µg/L<0.002 µg/L
Cr<0.003 mg/L<0.003 mg/L
Cu0.010 mg/L<0.0015 mg/L
Hg0.427 µg/L0.240 µg/L
Mo7.62 µg/L 2.32 µg/L
Ni0.787 µg/L0.709 µg/L
Pb<0.05 µg/L0.09 µg/L
Se<0.05 µg/L<0.05 µg/L
Si2104 µg/L244.4 µg/L
Ti18.82 µg/L116.1 µg/L
Zn8.52 mg/L4.22 mg/L
Cl3.6 mg/L3.6 mg/L
F0.05 mg/L0.09 mg/L
SO42-9 mg/L4 mg/L
DOC18.16 mg/L97.58 mg/L
TDS21.7 mg/L34.5 mg/L
Disclaimer/Publisher’s Note: The statements, opinions and data contained in all publications are solely those of the individual author(s) and contributor(s) and not of MDPI and/or the editor(s). MDPI and/or the editor(s) disclaim responsibility for any injury to people or property resulting from any ideas, methods, instructions or products referred to in the content.

