Article

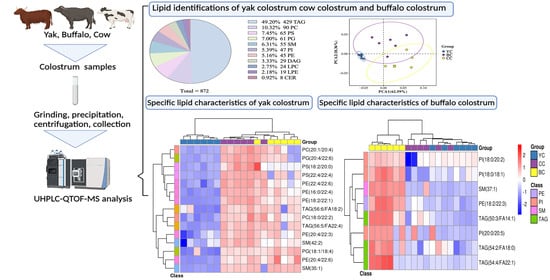
Characterization and Comparison of Lipids in Yak Colostrum, Buffalo Colostrum, and Cow Colostrum Based on UHPLC-QTOF-MS Lipidomics

1
College of Food Science and Nutritional Engineering, China Agricultural University, Beijing 100083, China
2
Guangxi Buffalo Research Institute, Chinese Academy of Agricultural Sciences, Nanning 530001, China
3
Beijing Laboratory of Food Quality and Safety, Department of Nutrition and Health, China Agricultural University, Beijing 100091, China
4
Lanzhou Institute of Husbandry and Pharmaceutical Sciences, Chinese Academy of Agricultural Science, Lanzhou 730050, China
5
College of Food Science and Technology, Hunan Agricultural University, Changsha 410114, China
6
Food Laboratory of Zhongyuan, Luohe 462300, China
*
Author to whom correspondence should be addressed.
These authors contributed equally to this work.
Dairy 2025, 6(2), 14; https://doi.org/10.3390/dairy6020014
Submission received: 2 March 2025 / Revised: 26 March 2025 / Accepted: 26 March 2025 / Published: 27 March 2025
(This article belongs to the Section Metabolomics and Foodomics)

Abstract

:
Colostrum is a nutrient-dense food rich in proteins, immune modulators, and growth factors essential for neonatal development. Its lipids serve as a key energy source and facilitate cellular functions. While yak colostrum (YC) and buffalo colostrum (BC) exhibit high nutritional value, their lipid compositions remain unclear. This study employed lipidomics to analyze and compare the lipid profiles of YC and BC with cow colostrum (CC), identifying 872 lipids across 33 subclasses. Differential analysis revealed 137, 100, and 131 lipids, with significant expression differences between YC vs. CC, BC vs. CC, and YC vs. BC, respectively. YC exhibited higher levels of α-linolenic acid and docosahexaenoic acid, suggesting a potential role in enhancing neurodevelopment and cognitive function. In contrast, the upregulation of specific lipid components in BC, such as phosphatidylethanolamine (PE) and phosphatidylinositol (PI), coupled with the downregulation of specific lysophosphatidylcholine (LPC) and lysophosphatidylethanolamine (LPE), indicated a potential benefit for lipid metabolism and inflammatory regulation. These findings suggest that YC may be particularly suitable for neonates requiring enhanced energy support, while BC may offer advantages in lipid metabolism modulation. The study provides critical insights into the distinct lipid compositions of YC and BC, laying a scientific foundation for the development of tailored nutritional supplements. These results also hold significant implications for the dairy industry, driving innovation and optimization of colostrum-based products to meet diverse nutritional demands.

Graphical Abstract

1. Introduction

Lipids play fundamental roles in biological processes, serving critical roles in energy storage, cell membrane synthesis, and signal transduction [1]. Milk, a primary dietary fat source, possesses a remarkably diverse lipid composition, comprising thousands of lipid species that contribute to its functional and nutritional properties [2]. The composition of milk, including its lipid, protein, and nutrient profiles, is influenced by species, lactation stage, seasonal variations, and environmental factors [3]. With the growing consumer demand for high-quality dairy products, a comprehensive analysis of the nutritional composition of milk from various sources has become increasingly important.
Colostrum, the initial secretion produced by mammals postpartum, significantly differs from mature milk due to its elevated concentrations of bioactive components such as immunoglobulins, lactoferrin, lysozyme, and growth factors. These bioactive molecules confer substantial health benefits, including immune enhancement, improved gut health, and facilitation of tissue growth [4]. Immunoglobulin G, the predominant immunoglobulin in colostrum, plays a pivotal role in passive immunity transfer to neonates [5]. Additionally, the high levels of lactoferrin and lysozyme in colostrum enhance antimicrobial defense and reinforce the body’s innate immune mechanisms.
Yak and buffalo milk possess significant nutritional and functional value in food science. Yak milk is particularly rich in fat, protein, and total milk solids, making it a highly nutritious dairy source [6]. It contains elevated levels of immunoglobulin and lactoferrin, as well as small fat globules that enhance digestibility and nutrient absorption [7]. Furthermore, yak milk is abundant in unsaturated fatty acids, which are associated with cardiovascular benefits [8]. Buffalo milk, recognized for its high fat, lactose, and mineral content, exhibits a creamier texture and richer flavor than cow milk due to its larger fat globules and higher lipid concentration [9]. Additionally, its elevated levels of essential minerals such as calcium, phosphorus, and magnesium further enhance its nutritional profile [10]. Buffalo milk is also a valuable source of lactalbumin, which has been implicated in immune modulation and antimicrobial activity [11]. However, research on the lipid composition of yak and buffalo milk has primarily focused on total fat content or specific fatty acids, leaving the comprehensive lipid profiles of yak colostrum (YC) and buffalo colostrum (BC) largely unexplored.
Mass spectrometry-based lipidomics has emerged as a potent tool for elucidating the complex lipid composition of milk [12]. Ultra-high-performance liquid chromatography coupled with quadrupole time-of-flight mass spectrometry (UHPLC-QTOF-MS) is widely utilized in milk lipidomics due to its high throughput, sensitivity, and accuracy. For instance, Wang et al. employed ultra-performance liquid chromatography-quadrupole time-of-flight mass spectrometry (UPLC-QTOF-MS) to analyze lipid profiles in milk, revealing significantly higher triacylglycerol (TAG) levels in goat milk, while human milk exhibited an elevated concentration of diacylglycerol (DAG) (20:2/20:2) [13]. Similarly, Zhang et al. utilized performance liquid chromatography-quadrupole time-of-flight mass spectrometry (PLC-QTOF-MS) to identify 14 significantly different lipids (DLs) between human and goat milk, whereas only three DLs distinguished cow and goat milk [14].
Building upon these advancements, this study aimed to systematically compare and characterize the lipid profiles of YC, BC, and cow colostrum (CC), identifying distinct DLs across the three groups and elucidating the unique lipid properties of YC and BC. These findings offer valuable insights for optimizing dairy product selection based on scientific nutritional profiling and provide a theoretical foundation for the development of functional dairy-based foods tailored to specific health and dietary needs.

2. Materials and Methods

2.1. Collection of Samples

CC (1–3 days postpartum) samples were obtained from 30 Holstein cows in Beijing, China, in August 2023. The inclusion criteria were that Chinese Holstein cows be healthy, aged 3–7 years, and with a parity of 2–3, a body weight of 700 ± 50 kg, and a uniform diet primarily composed of alfalfa, while being housed under identical feeding conditions. BC (1–3 days postpartum) samples were collected in August 2023 from 30 Nili-Ravi buffaloes under the supervision of the Chinese Academy of Agricultural Sciences and the Buffalo Research Institute of Guangxi Zhuang Autonomous Region. Inclusion criteria were healthy buffaloes aged 5–6 years, with a parity of 2–4 and a body weight of 520 ± 20 kg, consuming the same diet (primarily composed of alfalfa), and raised under uniform environmental conditions. YC (1–3 days postpartum) samples were collected in May 2023 from 30 yaks raised by individual farmers in the Gannan Tibetan Autonomous Prefecture, Gansu Province. The yaks met the inclusion criteria of being healthy, aged 5–6 years, weighing 210 ± 20 kg, and naturally grazing in the same pasture. All samples were collected before feeding. Within each group, five samples were randomly pooled into a test sample in equal volumes of 10 mL. Samples were immediately transported at −20 °C and stored at −80 °C for subsequent analysis.

2.2. Chemicals and Reagents

The chemicals used in the experiment included methanol (A454-4, Thermo Fisher Technologies, Waltham, MA, USA), acetonitrile (A998-4, Thermo Fisher Technologies, Waltham, MA, USA), and formic acid (50144-50mL DIMKA Corporation, MO, USA). d7-Triglycerides, d7-phosphatidylethanolamine, and d7-lysophosphatidylcholine were purchased from Tianjin Alta Technology Co., Ltd. (Tianjin, China).

2.3. Sample Extraction

The lipid extraction procedures followed established protocols [15,16,17]. Each sample was prepared by mixing 10 mL with 320 μL of precooled precipitant (dichloromethane:methanol = 3:1, v:v) and a magnetic bead, followed by grinding at 50 Hz for 180 s. The mixture was then precipitated at −20 °C for 2 h and centrifuged at 25,000× g for 10 min. A 250 μL aliquot of the supernatant was collected, dried, and reconstituted with 250 μL of isopropanol, followed by vortexing for 10 min. Subsequently, 40 μL of each sample were combined with 200 μL of precooled isopropanol in a 96-well plate and vortexed at 1200 rpm for 30 min at 15 °C. The plate was then centrifuged at 4 °C and 4000 rpm for 30 min. A 120 μL aliquot of the supernatant was transferred to a new 96-well plate for negative sample (NEG) analysis. From the NEG plate, 20 μL were transferred to another plate, diluted with 80 μL of isopropanol, and vortexed to prepare the positive sample (POS) plate for analysis. To ensure methodological reliability, six quality control (QC) samples were generated by pooling lipid extracts from YC, BC, and CC samples in equal proportions.

2.4. UHPLC-QTOF-MS Analysis

Lipid measurement was conducted using the HM Lipid Assay (BGI, Shenzhen, China). For liquid chromatographic separation, reverse-phase chromatography was performed using a CSH C18 column (1.7 μm, 2.1 mm × 100 mm, Waters, Milford, MA, USA) [18]. The mobile phase solvent A consisted of 10 mM ammonium in a mixture of 40% isopropyl alcohol, 60% acetonitrile, and 0.1% formic acid. The gradient program began with 30% solvent B (100% isopropanol) at a flow rate of 300 μL/min, maintained for 2 min, then linearly increased to 100% over 20 min, followed by 10 min of re-equilibration at 5% solvent B. Mass spectrometric analysis was conducted using a Q-Exactive Plus (Thermo Fisher Scientific, Waltham, MA, USA) in both positive and negative ionization modes. Multiple reaction monitoring (MRM) mode was employed, incorporating the parent-child ion pair information of target metabolites, collision energy, declustering voltage, and retention period. MS/MS scans were acquired at a resolution of 17,500, while full MS scans were conducted at 70,000. The optimized ESI parameters included a source temperature of 350 °C, a capillary temperature of 400 °C, and ionization voltages of 4500 V (positive mode) and −2500 V (negative mode). The scan ranges were m/z 200–1800 for positive mode and m/z 250–1800 for negative mode.

2.5. Lipid Annotation and Data Processing

Raw data files were converted to mzXML format via ProteoWizard (version 3.0.8789), followed by peak detection, filtering, and alignment using R XCMS (version 3.12.0) with the following parameters: ppm ≤ 5, peak width (5–30 s), and retention time alignment tolerance of 0.1 min. Lipid identification (secondary identification) was performed using LipidSearch software (version 4.1). The product ion threshold was set at 5%, and lipid molecules with missing values exceeding 50% within a group were excluded. Subsequent data normalization employed total intensity scaling and median centering.
The processed data were imported into SIMCA (version 14.1), where unit variance scaling was applied before orthogonal partial least squares discriminant analysis (OPLS-DA) and unsupervised principal component analysis (PCA). A seven-fold cross-validation procedure was used to validate the OPLS-DA models, with R2X and Q2 values assessing model quality.

2.6. Statistical Analysis

Statistical analysis was performed using IBM SPSS (version 25.0), applying one-way ANOVA followed by post hoc Fisher’s LSD tests to determine differences in DLs among YC, BC, and CC. Pathway analysis was conducted using the Kyoto Encyclopedia of Genes and Genomes (KEGG) pathway maps via Search & Color Pathway (https://www.genome.jp/kegg/tool/map_pathway2.html, accessed on 10 December 2024). Additionally, pathway topological enrichment analysis was performed using MetaboAnalyst 4.0 (https://www.metaboanalyst.ca/, accessed on 12 December 2024) to identify altered pathways and evaluate their biological significance.

3. Results and Discussion

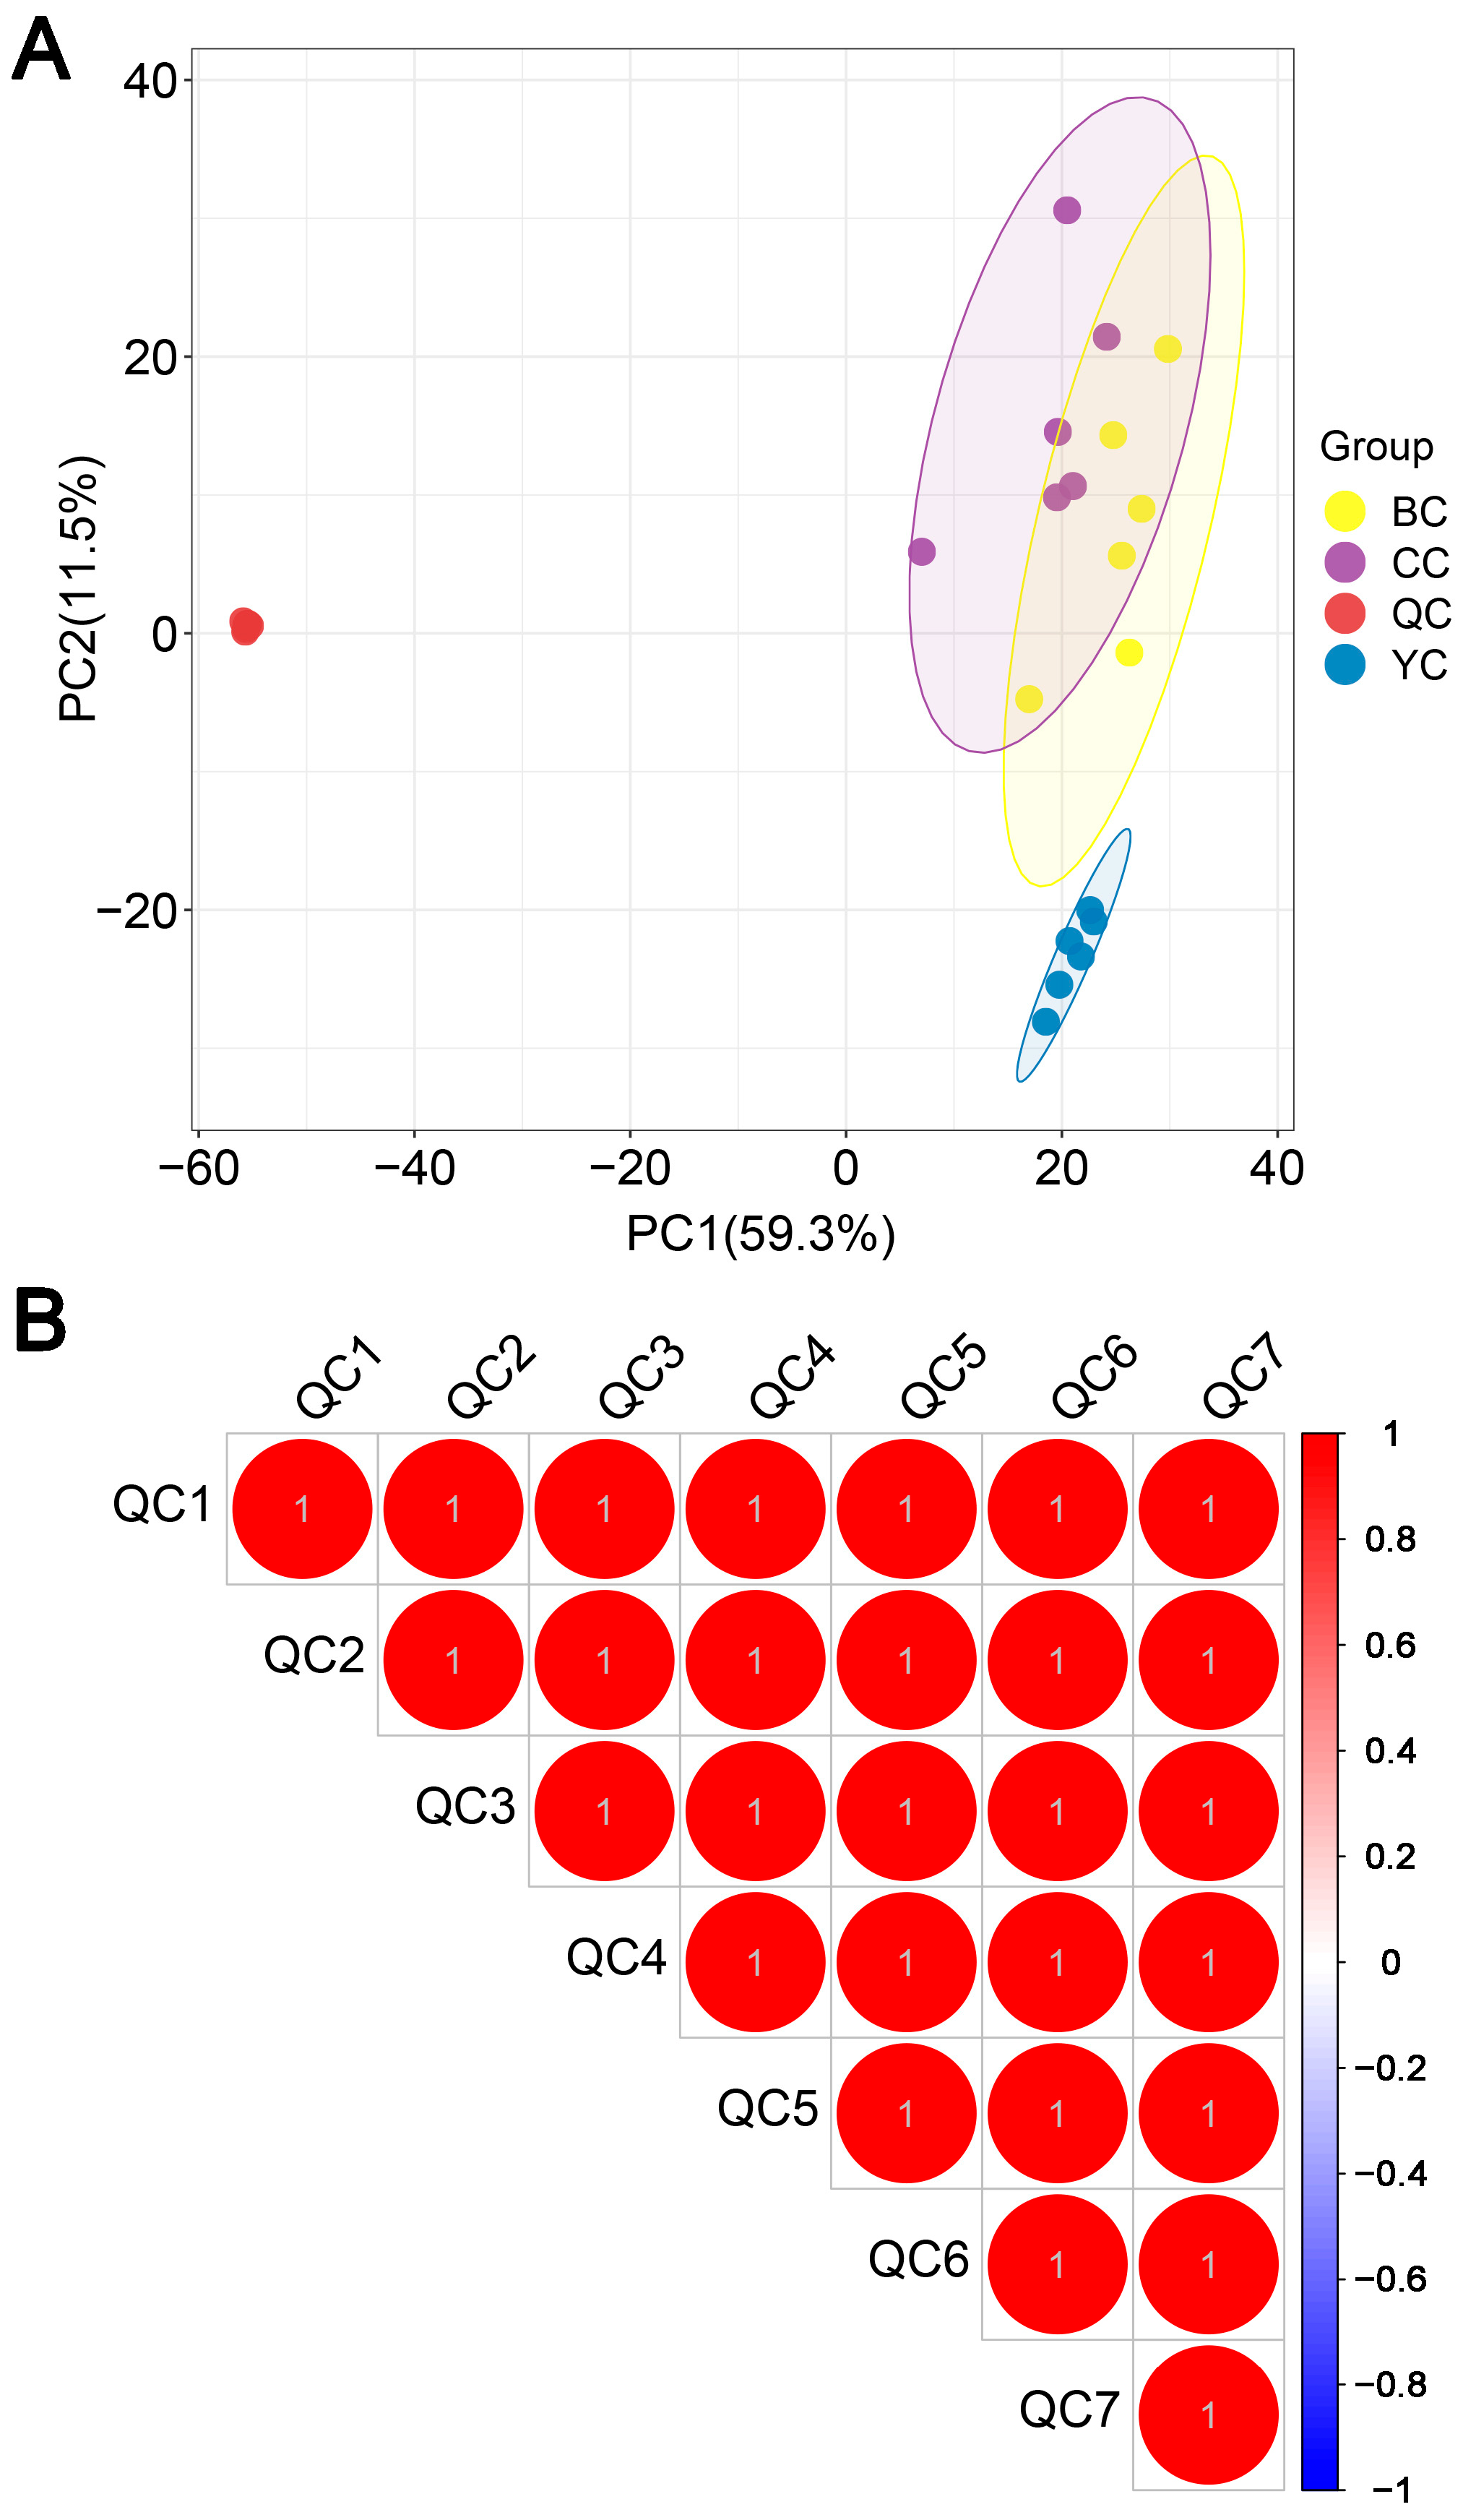
3.1. Feasibility of the Analytical Method

The PCA score plot demonstrated a tight clustering of QC samples, indicating the high reproducibility of the experiment (Figure 1A). Additionally, Spearman correlation analysis of the quantitative values of QC samples revealed strong correlations among them (Figure 1B), confirming the high data quality and its suitability for subsequent analysis.

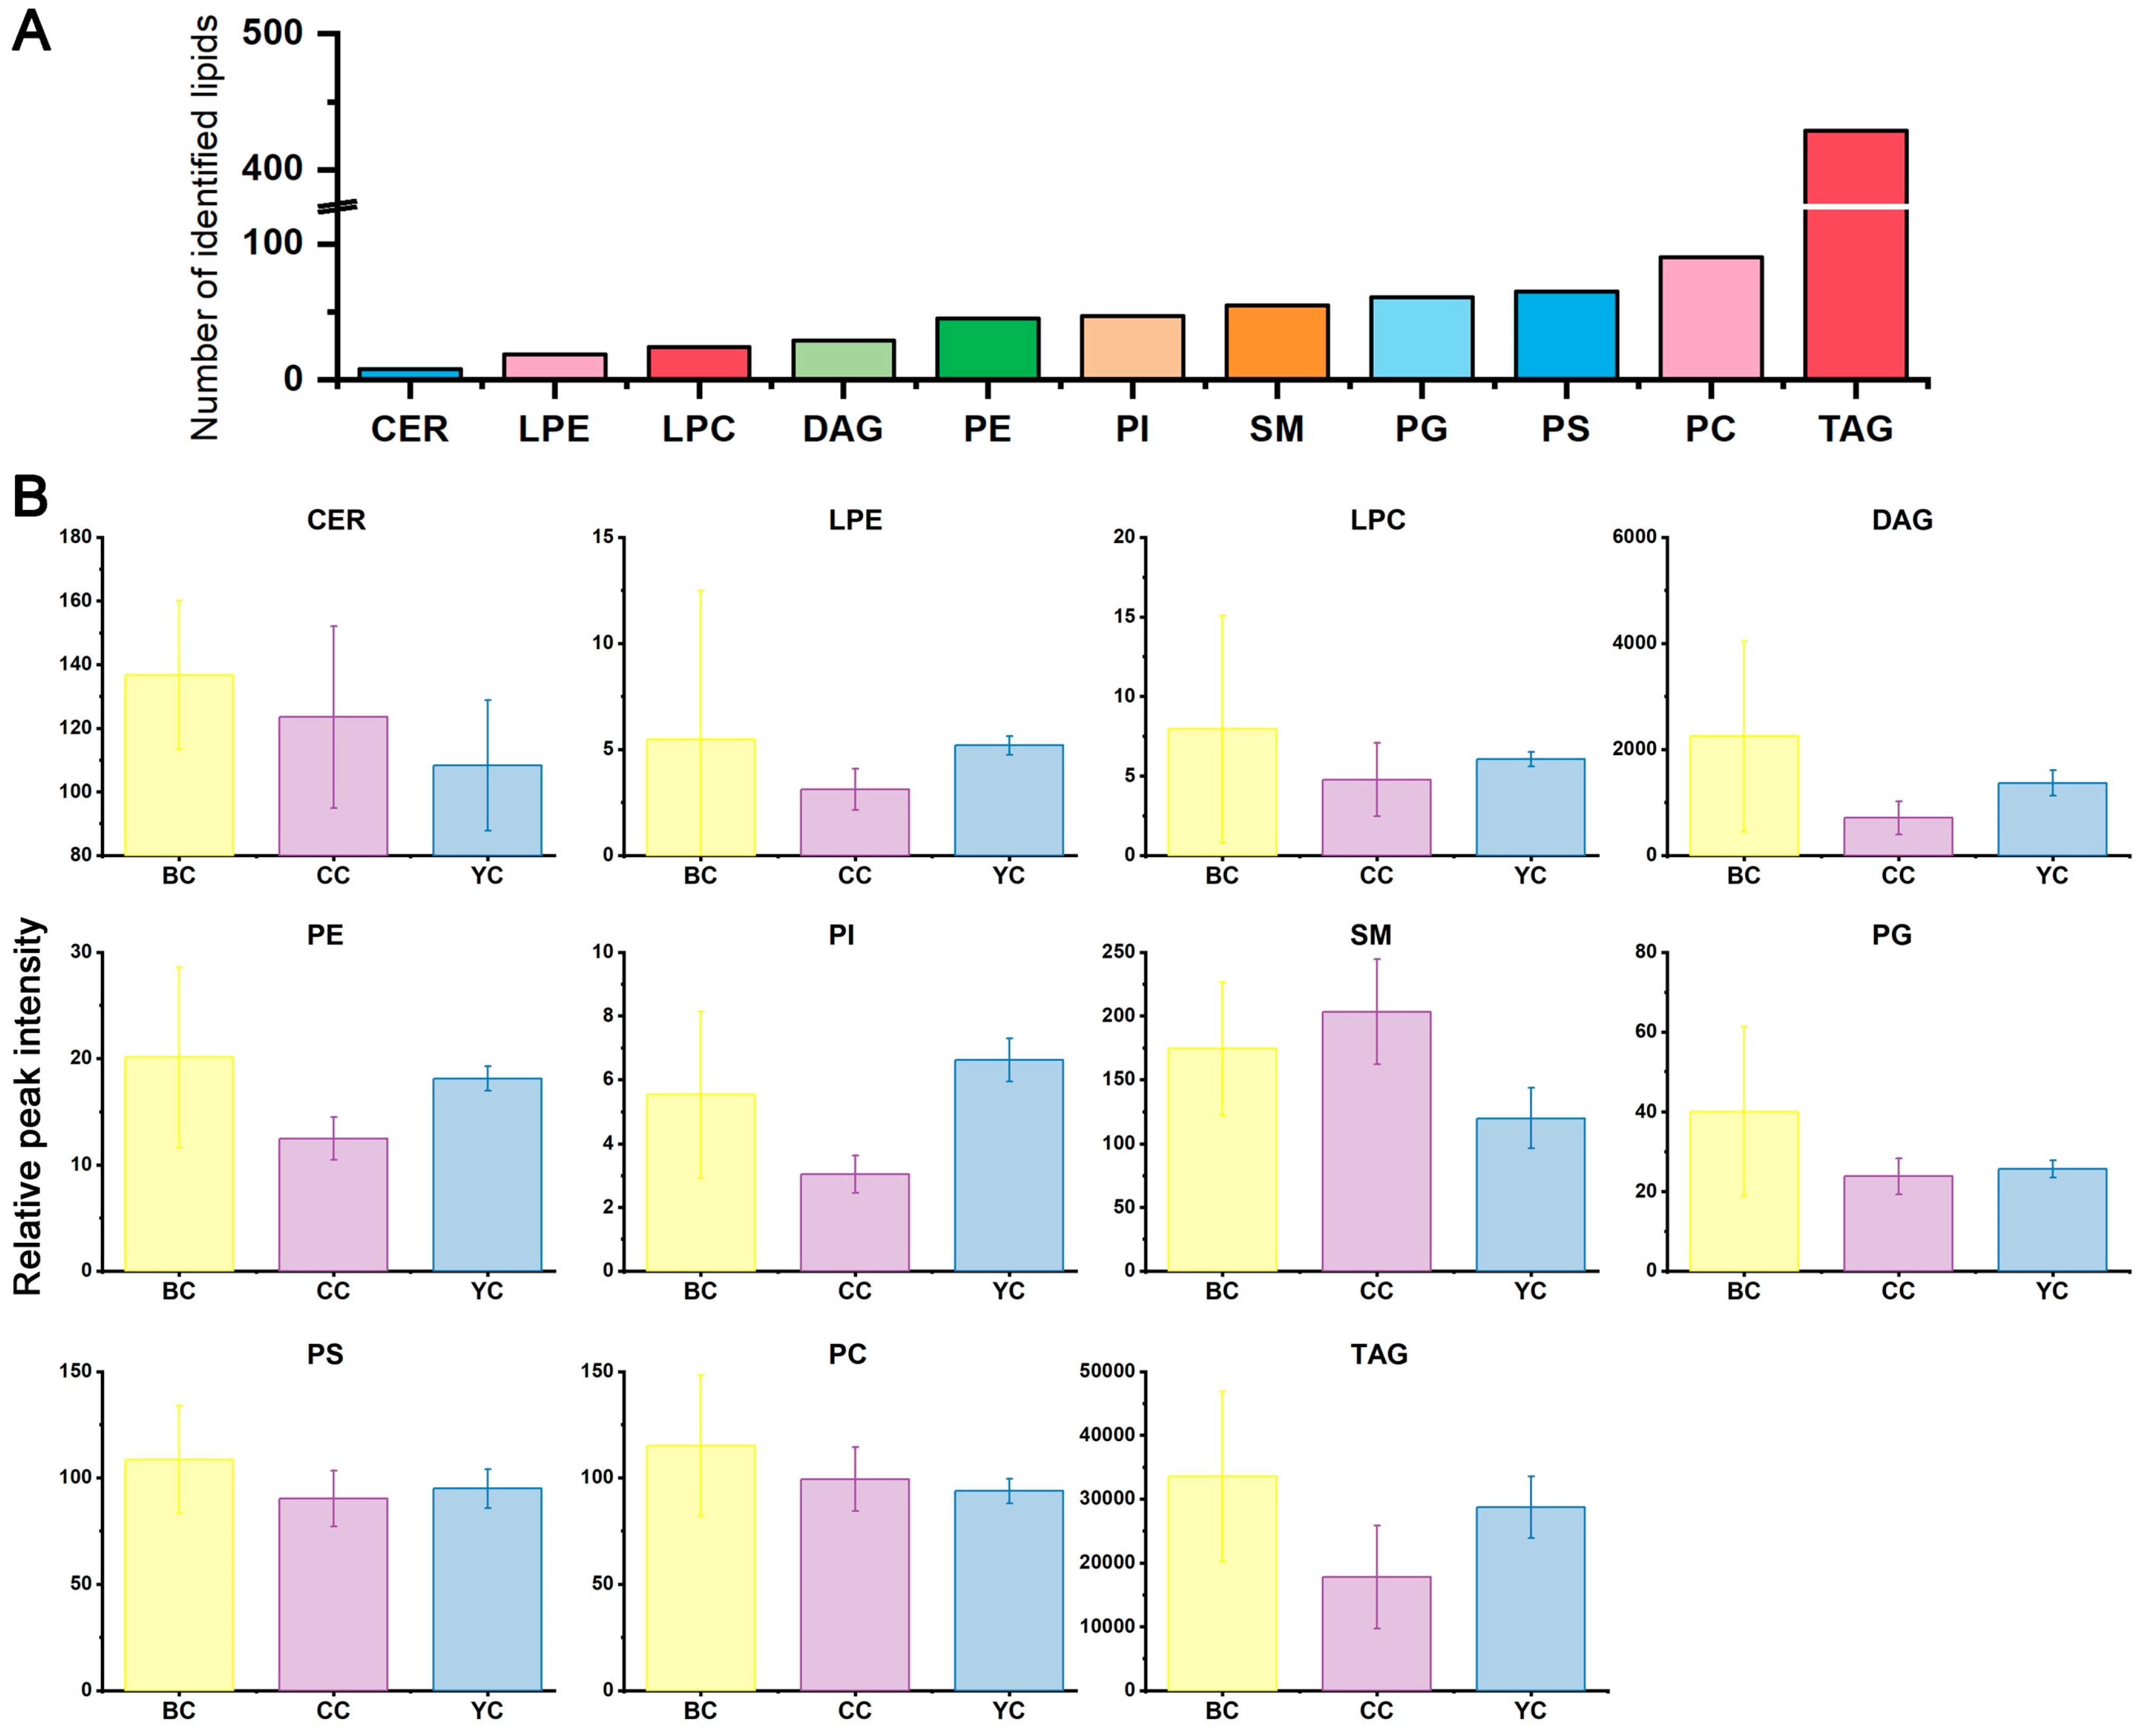
3.2. Lipid Identification of YC, BC, and CC

A total of 872 lipids were identified across YC, BC, and CC, including 9 ceramides (CER), 19 lysophosphatidylethanolamines (LPE), 24 lysophosphatidylcholines (LPC), 29 diacylglycerols (DAG), 45 phosphatidylethanolamines (PE), 47 phosphatidylinositols (PI), 55 sphingomyelins (SM), 61 phosphatidylglycerols (PG), 65 phosphatidylserines (PS), 90 phosphatidylcholines (PC), and 429 triacylglycerols (TAG) (Figure 2A).
The overall contents of PE, PI, DAG, and TAG in BC and YC were higher than those in CC (Figure 2B). PE is a key component of the cell membrane, contributing to membrane fluidity and participating in cell signaling [19]. PI is a precursor for phosphatidylinositol 4,5-bisphosphate and plays a key role in the inositol 1,4,5-trisphosphate/DAG signaling pathway [20]. DAG, as a pivotal intracellular signaling molecule, regulates cell growth, differentiation, and apoptosis through activation of protein kinase C (PKC) and other pathways [21]. TAG serves as a primary energy storage molecule, playing essential roles in energy metabolism and lipid transport [22]. The elevated levels of these lipid subclasses in BC and YC suggest an enhanced involvement in cell signaling, energy metabolism, and cell proliferation, potentially contributing to cellular homeostasis and normal physiological functions.
Additionally, the total SM content in YC was significantly lower than that in CC. SM is a structural component of cell membranes, involved in membrane stability, lipid raft formation, and signal transduction [20]. The reduction in SM levels may influence membrane integrity and signaling efficiency, yet it could also confer specific physiological advantages. Lower SM levels are associated with increased membrane fluidity, which may facilitate cell growth and differentiation [23]. Moreover, diminished lipid raft formation could modulate cellular processes, such as attenuating inflammatory responses. These results suggest that the reduced SM content in YC may enhance cell proliferation and differentiation while potentially altering specific signaling pathways.

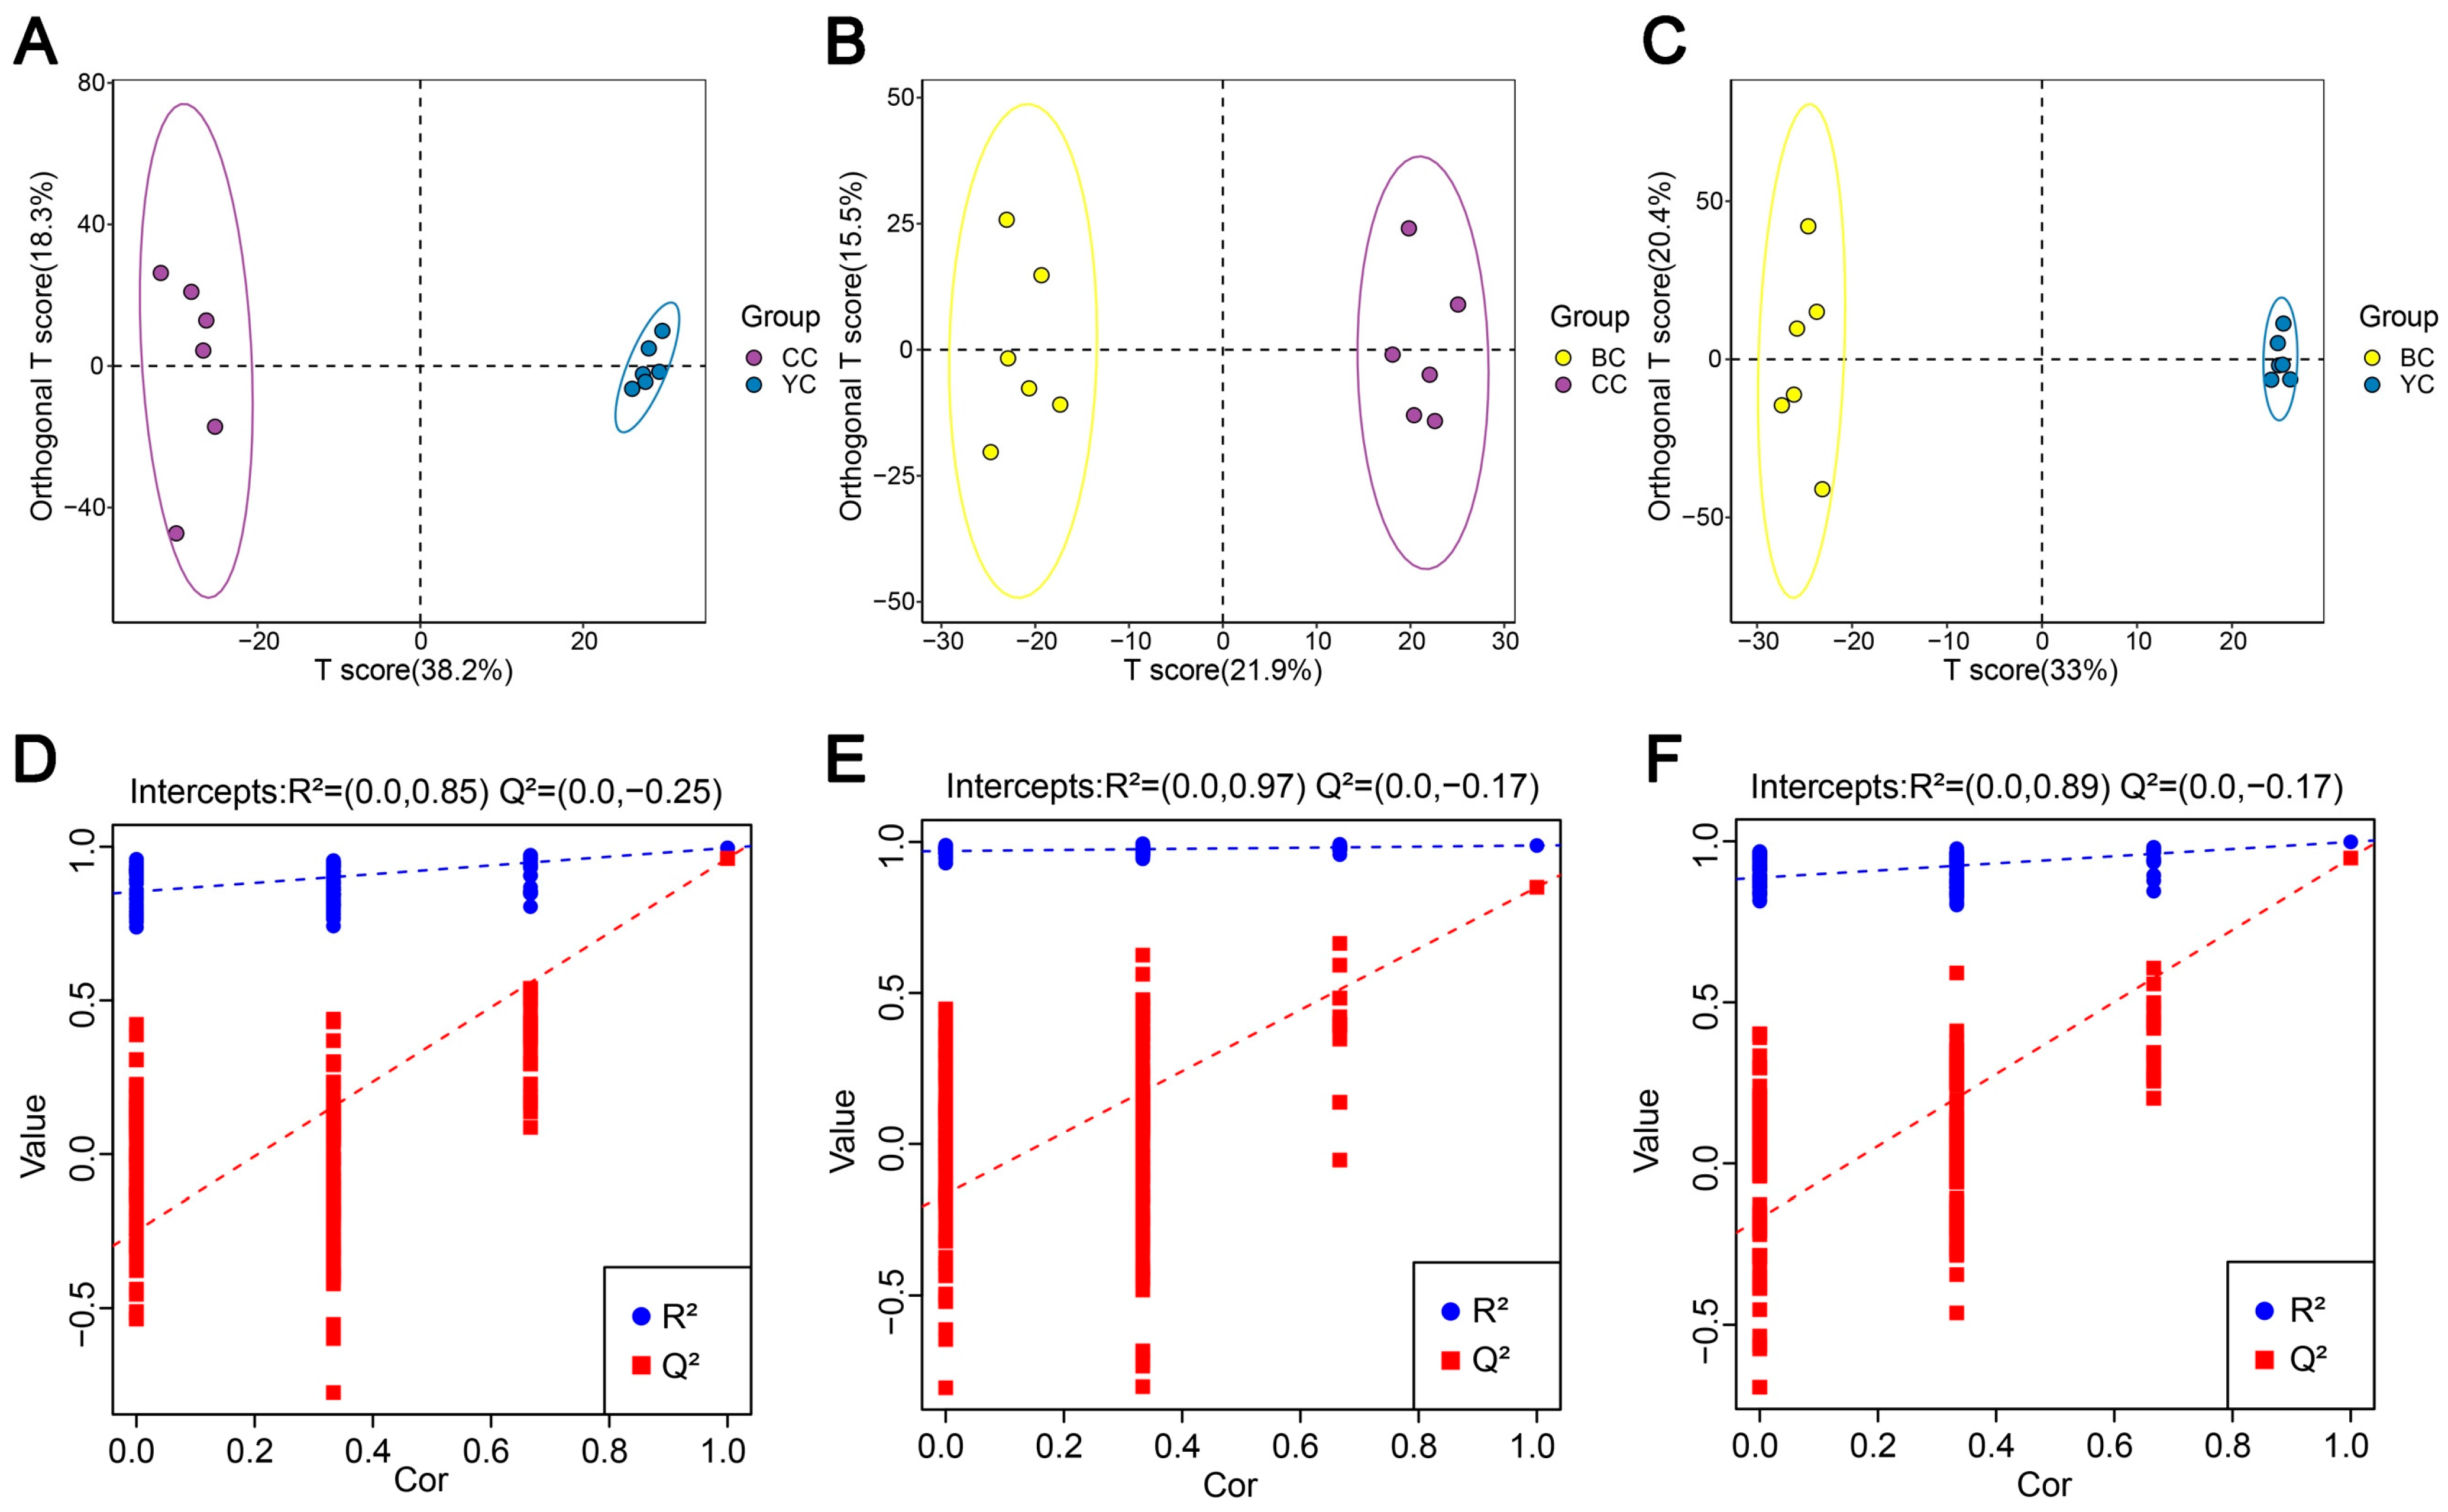
3.3. Multivariate Statistical Comparison of Lipids Between YC, BC, and CC

OPLS-DA, a supervised machine learning approach, is widely employed for multivariate data analysis, effectively reducing data dimensionality while enhancing model interpretability [24]. In this model, the R2 value represented the cumulative variance explanation rate, reflecting the model’s capacity to describe data variation. Values of R2 > 0.5 generally indicated strong explanatory power [25]. The Q2 value, which assesses cross-validated predictive ability, serves as a key metric for model performance, with Q2 > 0.5 considered the threshold for reliable predictive capability [24]. Model reliability was further validated through permutation testing. Permutation analysis of the OPLS-DA models demonstrated clear separation between YC and CC (R2 = [0.0, 0.85], Q2 = [0.0, −0.25]) (Figure 3A,D), BC and CC (R2 = [0.0, 0.97], Q2 = [0.0, −0.17]) (Figure 3B,E), and YC and BC (R2 = [0.0, 0.89], Q2 = [0.0, −0.17]) (Figure 3C,F). These results confirmed the model’s robust predictive capacity, enabling further downstream analyses. The influence and explanatory power of individual lipid expression patterns in sample classification were assessed using the variable importance for projection (VIP) scores derived from the OPLS-DA model. Differential lipids (DLs) were subsequently identified based on the criteria VIP > 1, fold change (FC) > 2 or < 0.5, and p < 0.05.

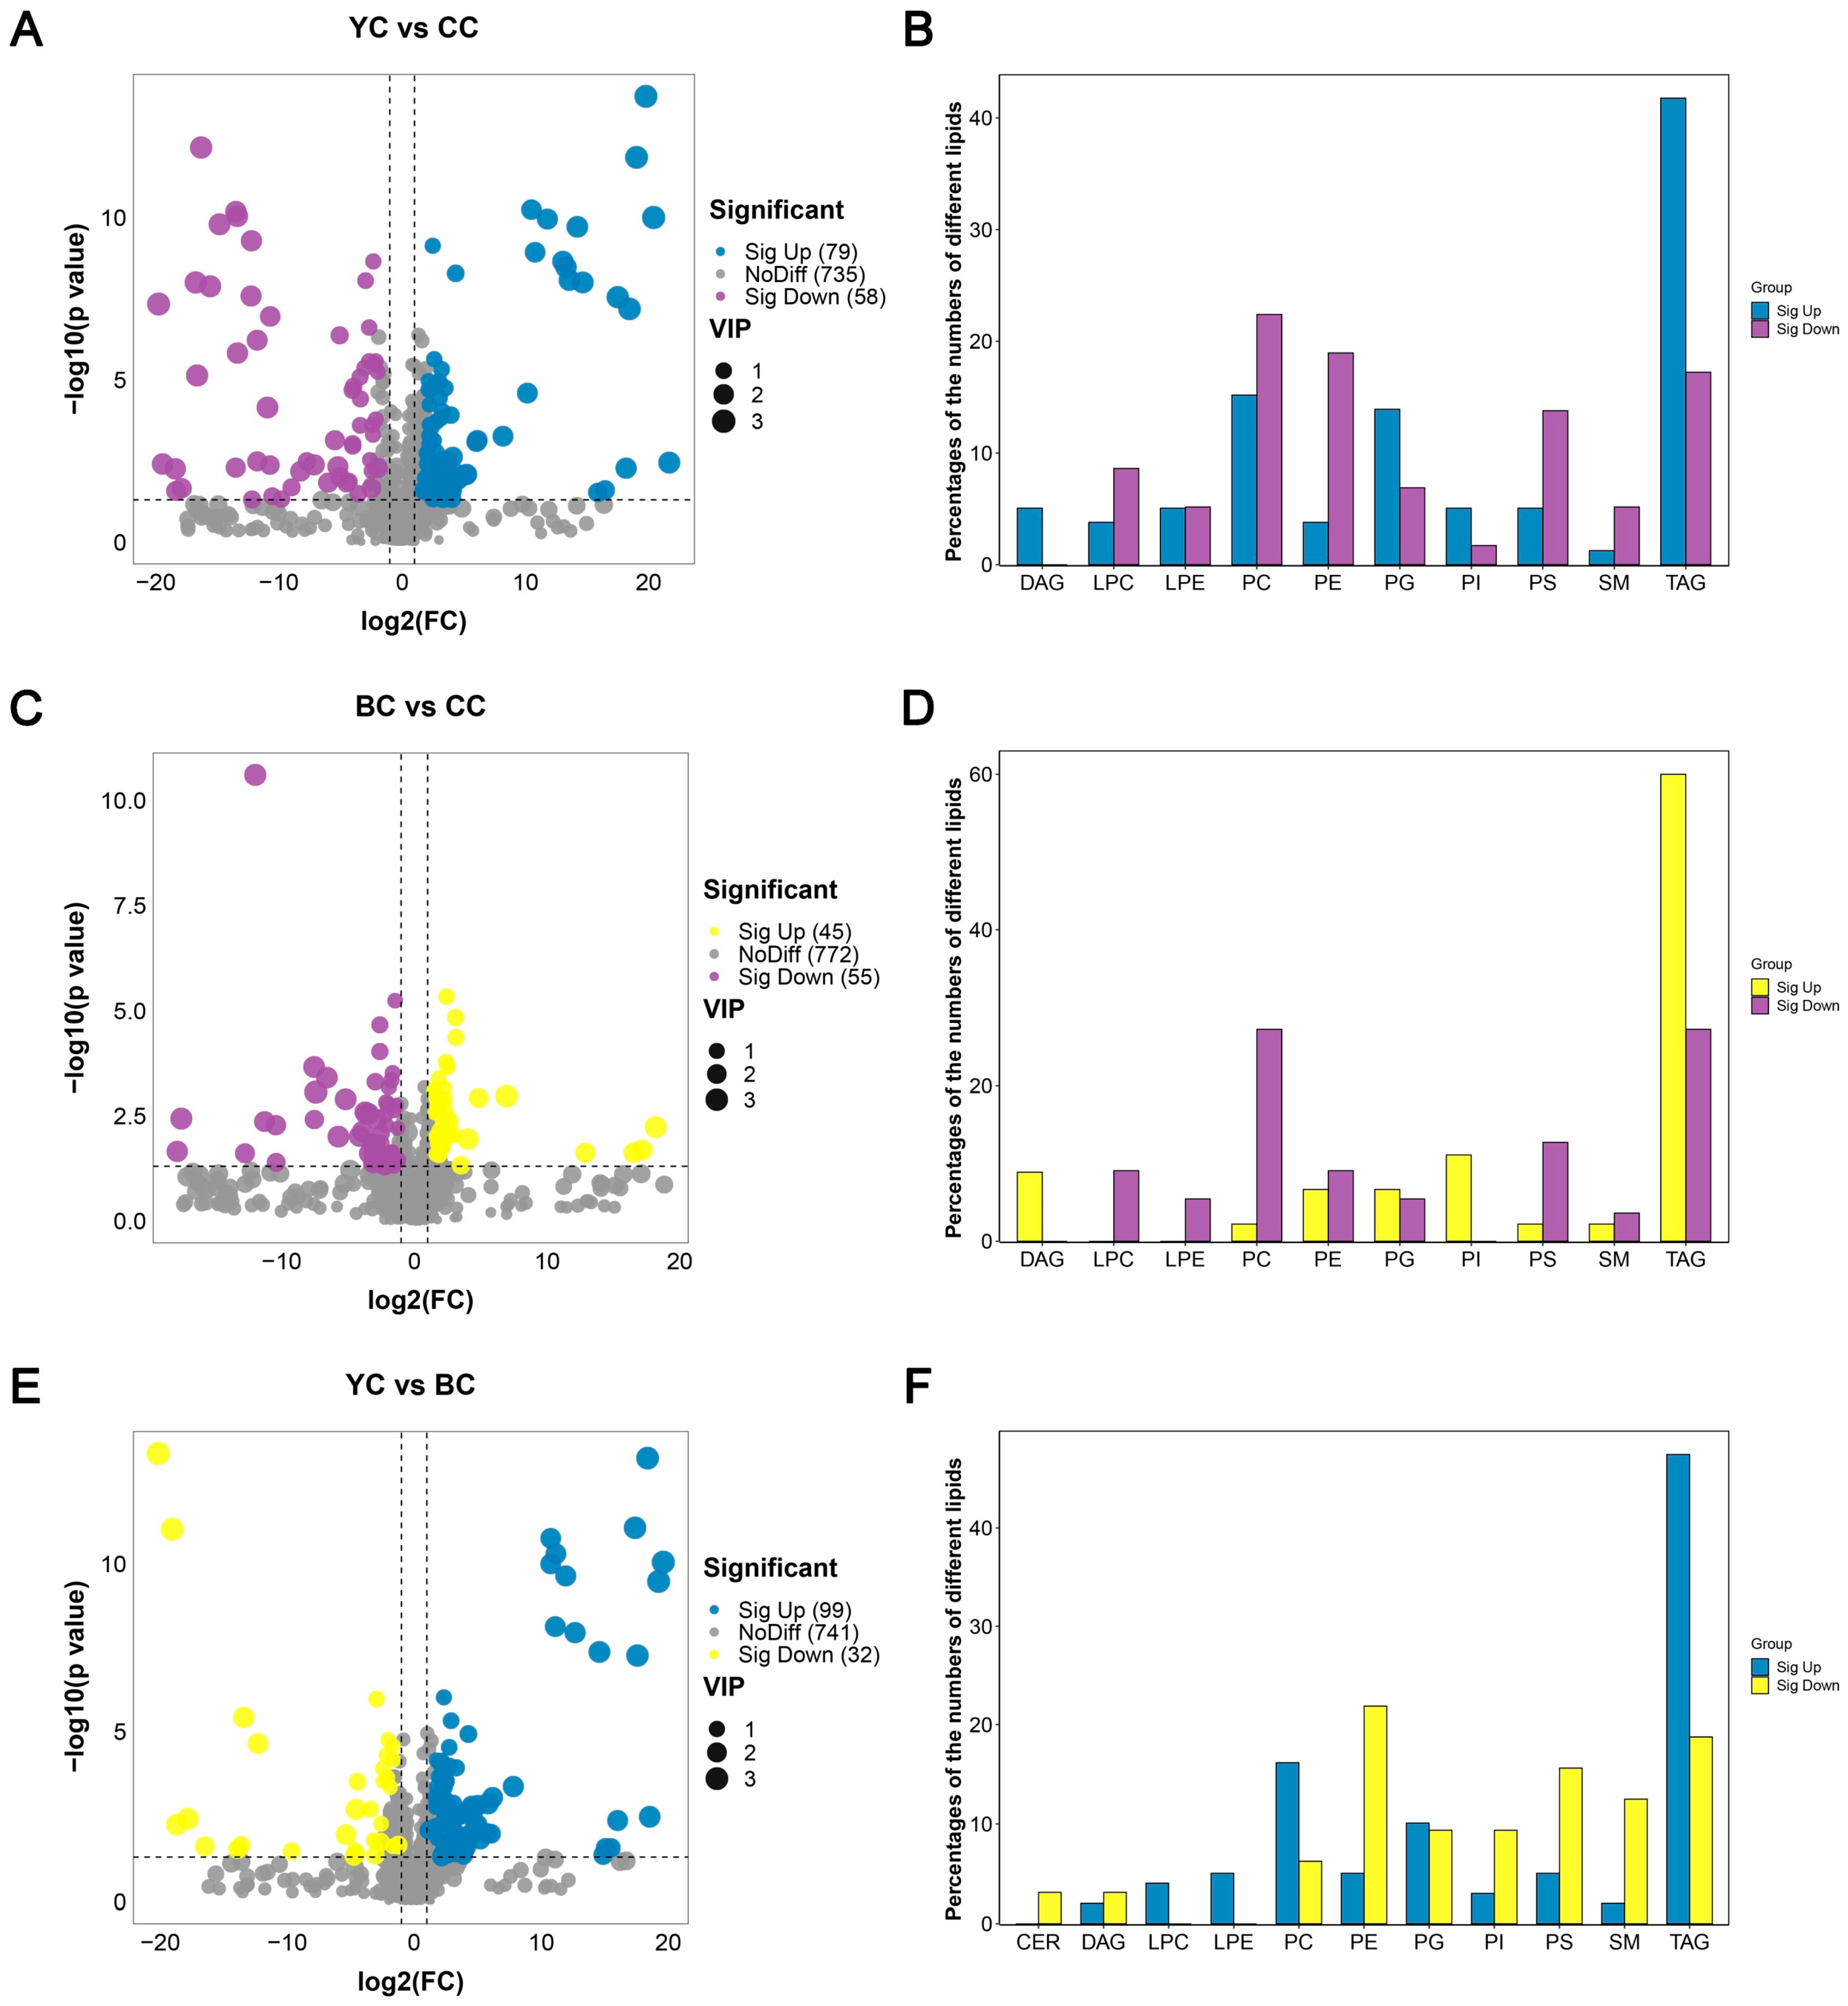
3.4. Identification of DLs Between YC, BC, and CC

A total of 137 DLs were identified between YC and CC, among which 79 were significantly upregulated and 58 were significantly downregulated in YC (Figure 4A). Among the upregulated DLs, 41.8% belonged to TAG (Figure 4B), a critical energy source in colostrum that provides approximately 50% of the energy required for neonatal growth and development [26]. The elevated TAG content in YC likely reflects its higher energy density during early lactation, thereby supporting the rapid growth and neurodevelopment of neonates. Conversely, among the DLs downregulated in YC compared to CC, 22.4% were PC, while 19.0% were PE (Figure 4B). As key structural components of cell membranes, PC and PE are essential for cell signaling, lipid metabolism, and maintaining membrane integrity and fluidity [27]. The lower PC and PE levels in YC may be attributed to its primary role in providing high-energy nutrients and immune protection in early lactation, with membrane lipid synthesis potentially increasing in later stages of lactation [28]. These lipid composition differences highlight the specific physiological adaptations of YC across lactation stages and provide a scientific basis for the development of nutritional supplements tailored for neonates.
A total of 100 DLs were identified between BC and CC, with 45 significantly upregulated and 55 significantly downregulated in BC (Figure 4C). Among the upregulated DLs, 60% were TAG, whereas 27.3% of the downregulated lipids also belonged to TAG (Figure 4D). This pattern suggests that BC may be particularly beneficial in meeting the metabolic demands of neonates and supporting immune system development immediately after birth.
Between YC and BC, 131 DLs were identified, with 99 significantly upregulated in YC and 32 in BC (Figure 4E). Among the upregulated DLs in YC, 47.5% were TAG, 16.2% were PC, and 10.1% were PG (Figure 4F). The elevated TAG content in YC likely reflects its adaptive response to high-altitude environments, where increased energy density in colostrum supports neonatal survival and rapid growth under extreme conditions [29]. PC and PG play critical roles in membrane structure and function, while PG also exhibits anti-inflammatory and antioxidant properties that contribute to cellular homeostasis [30]. Compared to BC, YC exhibits a superior capacity for energy supply, neurodevelopmental support, and maintaining cell membrane function and structure.

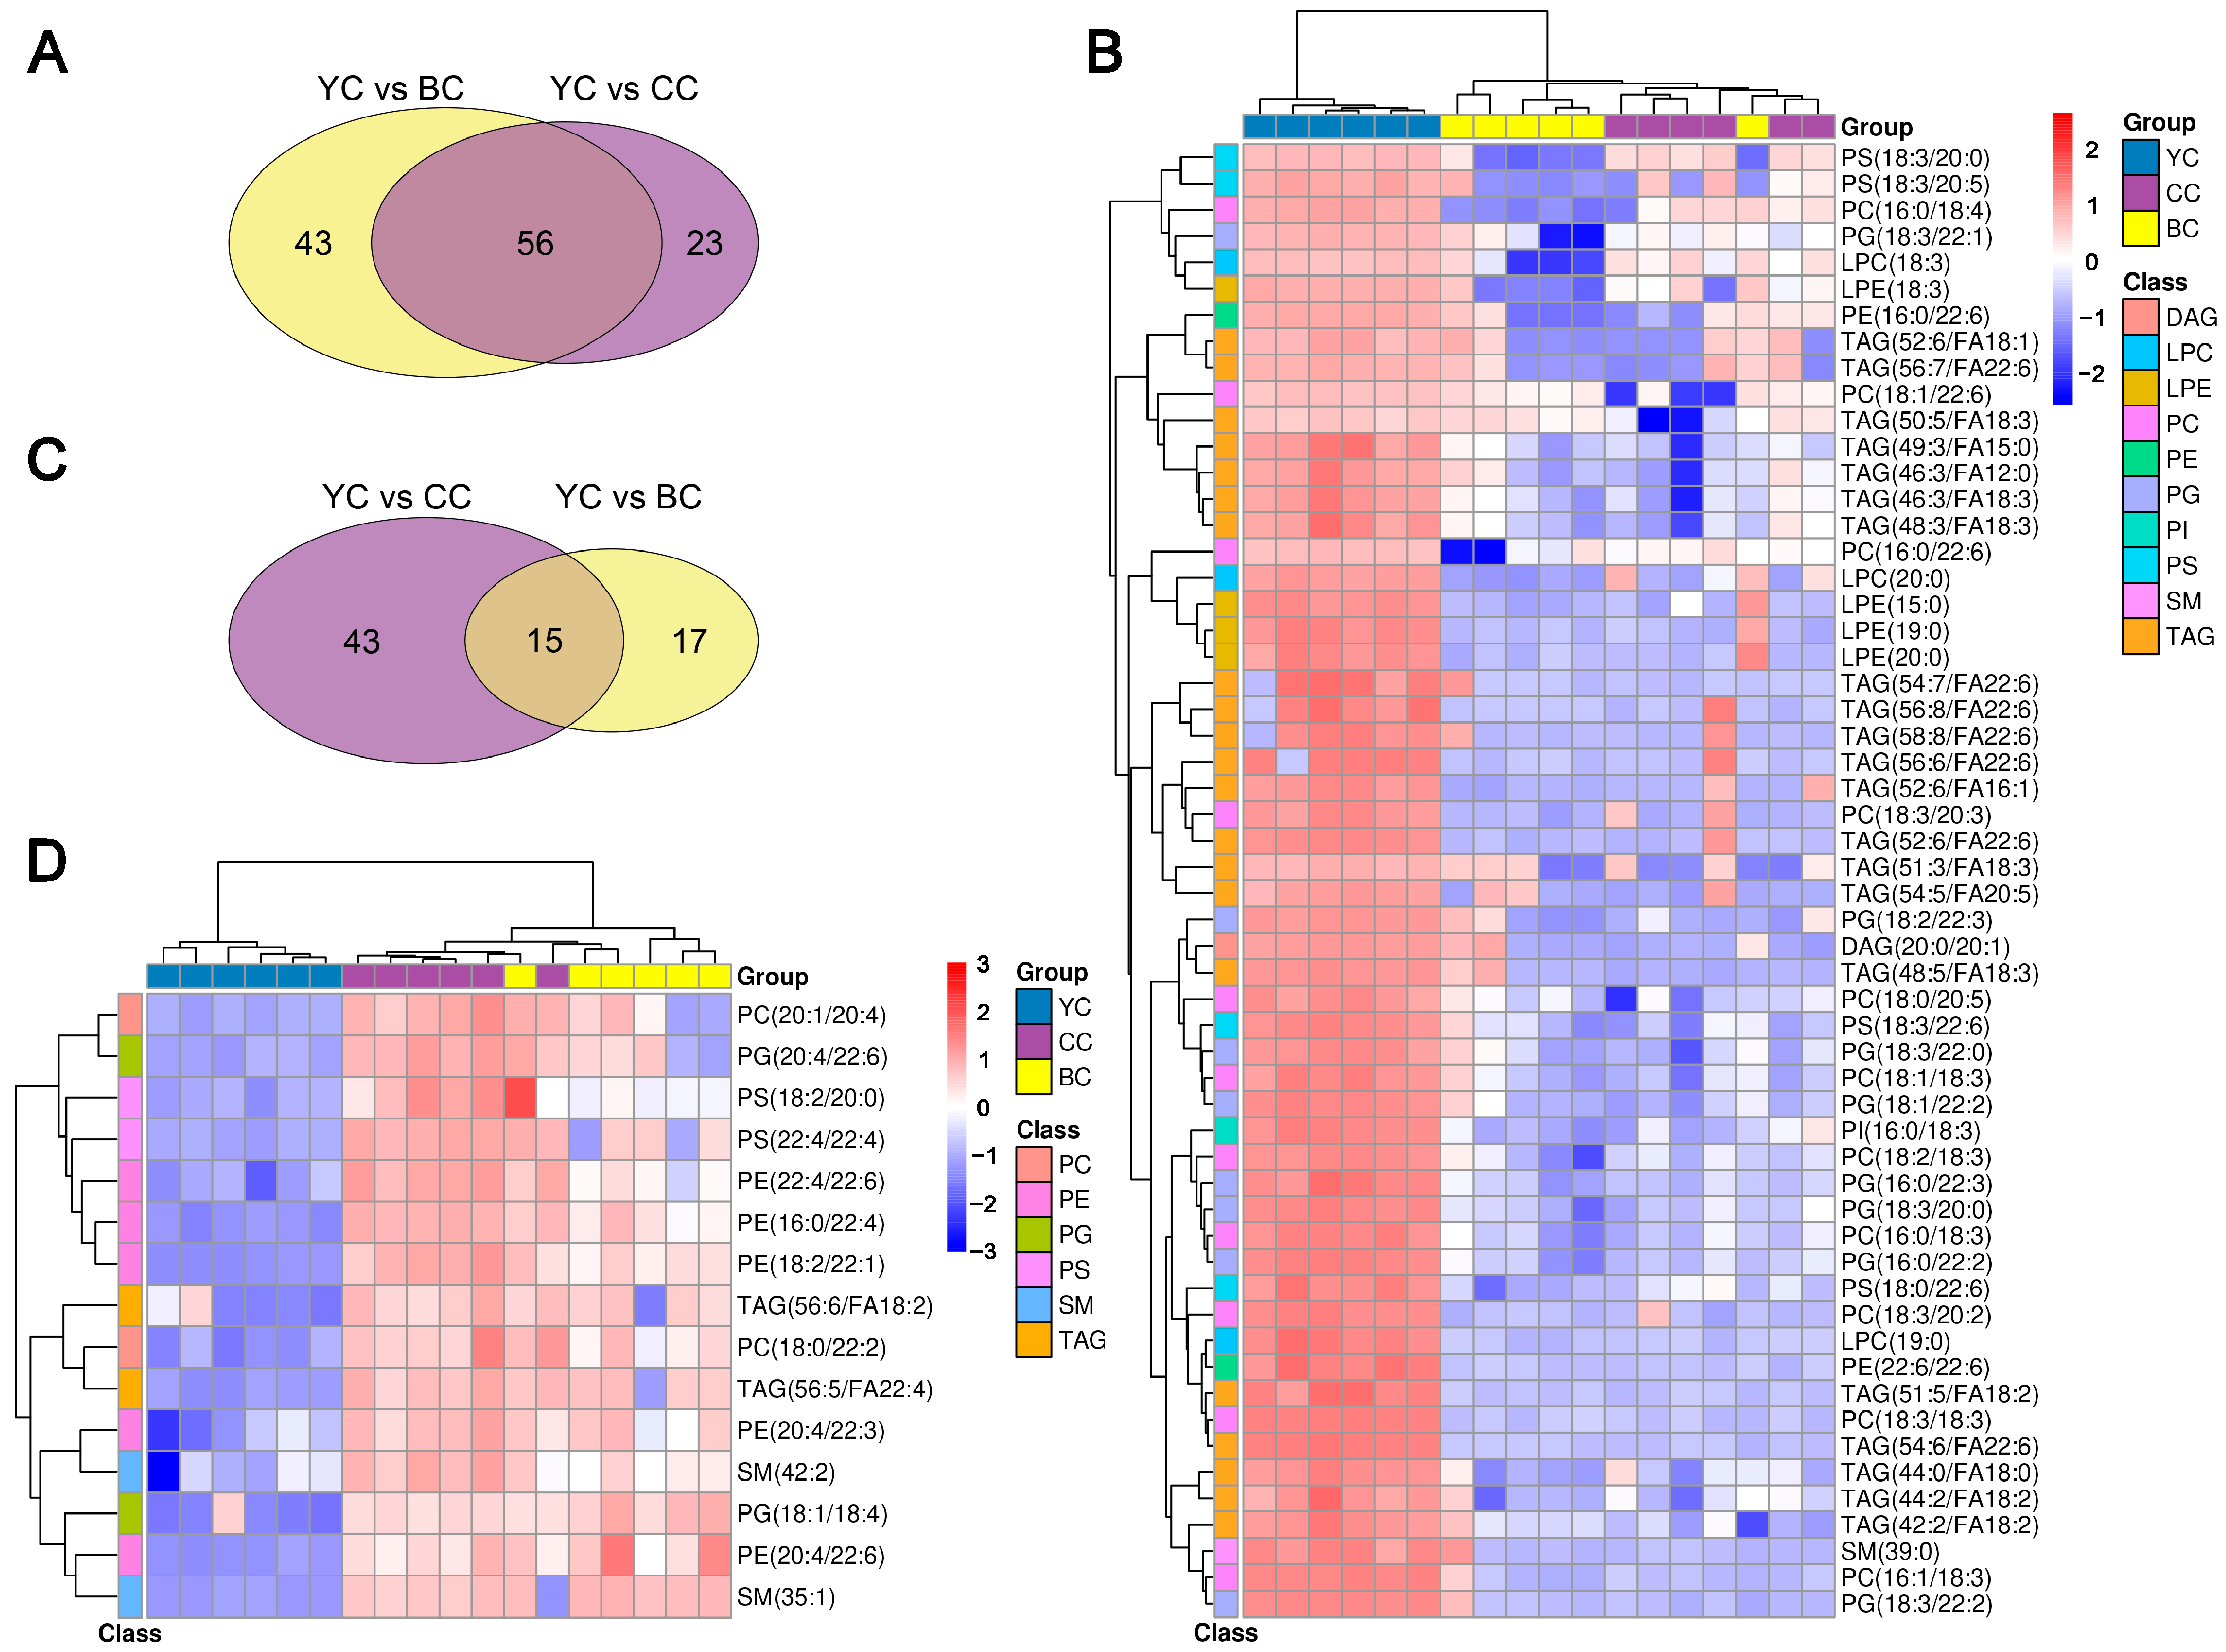
3.5. Specific Lipid Characteristics of YC

A total of 56 lipids were upregulated in YC compared to BC and CC (Figure 5A), with their expression patterns shown in Figure 5B. Notably, YC exhibited higher levels of C18:3 (linolenic acid) and C22:6 (docosahexaenoic acid, DHA) fatty acids, including PS(18:3/20:0), PS(18:3/20:5), PG(18:3/22:1), LPC(18:3), LPE(18:3), PC(18:3/20:3), PS(18:3/22:6), PG(18:3/22:0), PC(18:3/20:2), PC(18:3/18:3), PG(18:3/22:2), TAG(50:5/FA18:3), TAG(46:3/FA18:3), TAG(48:3/FA18:3), TAG(51:3/FA18:3), TAG(48:5/FA18:3), PC(18:1/18:3), PI(16:0/18:3), PC(18:2/18:3), PC(16:0/18:3), PG(16:1/18:3), PE(16:0/22:6), TAG(56:7/FA22:6), PC(18:1/22:6), PC(16:0/22:6), TAG(54:7/FA22:6), TAG(56:8/FA22:6), TAG(58:8/FA22:6), TAG(56:6/FA22:6), TAG(52:6/FA22:6), PS(18:0/22:6), PE(22:6/22:6), and TAG(54:6/FA22:6). Linolenic acid (C18:3) serves as a precursor for omega-3 fatty acids and can be metabolized into DHA and eicosapentaenoic acid (EPA), both of which are essential for brain and retinal development. DHA, a principal structural component of neuronal and retinal membranes, plays a pivotal role in cognitive function and visual acuity. Studies have demonstrated that DHA supplementation enhances cognitive performance and visual development in infants and young children [31]. C22:6 (DHA) is abundantly present in the human brain, retina, and nervous system, forming an essential component of cellular membranes in these tissues [32]. These findings suggest that YC may be particularly well-suited for the development of functional products designed to promote neurodevelopment, visual function, and lipid metabolism regulation; maintain cardiovascular health; and modulate the immune system.
Additionally, 15 lipids were significantly downregulated in YC compared to BC and CC (Figure 5C), and their expression patterns are shown in Figure 5D. Notably, PS and SM levels were lower in YC, including PS (18:2/20:0), PS (22:4/22:4), SM (42:2), and SM (35:1). PS is involved in apoptosis and intracellular signaling, playing a pivotal role in maintaining cellular stability and function, while SM is essential for cell recognition and signaling [33]. Reduced specific PS levels may help mitigate excessive immune responses, maintain microbial homeostasis, and support the proliferation of beneficial gut microbiota. Furthermore, the lower concentrations of specific SM and PS in colostrum may be advantageous for neonatal digestion, as phospholipid metabolism requires specific enzymatic activity, which is often underdeveloped in newborns [34]. This reduction in certain SM and PS could alleviate metabolic burden and minimize gastrointestinal discomfort in neonates.

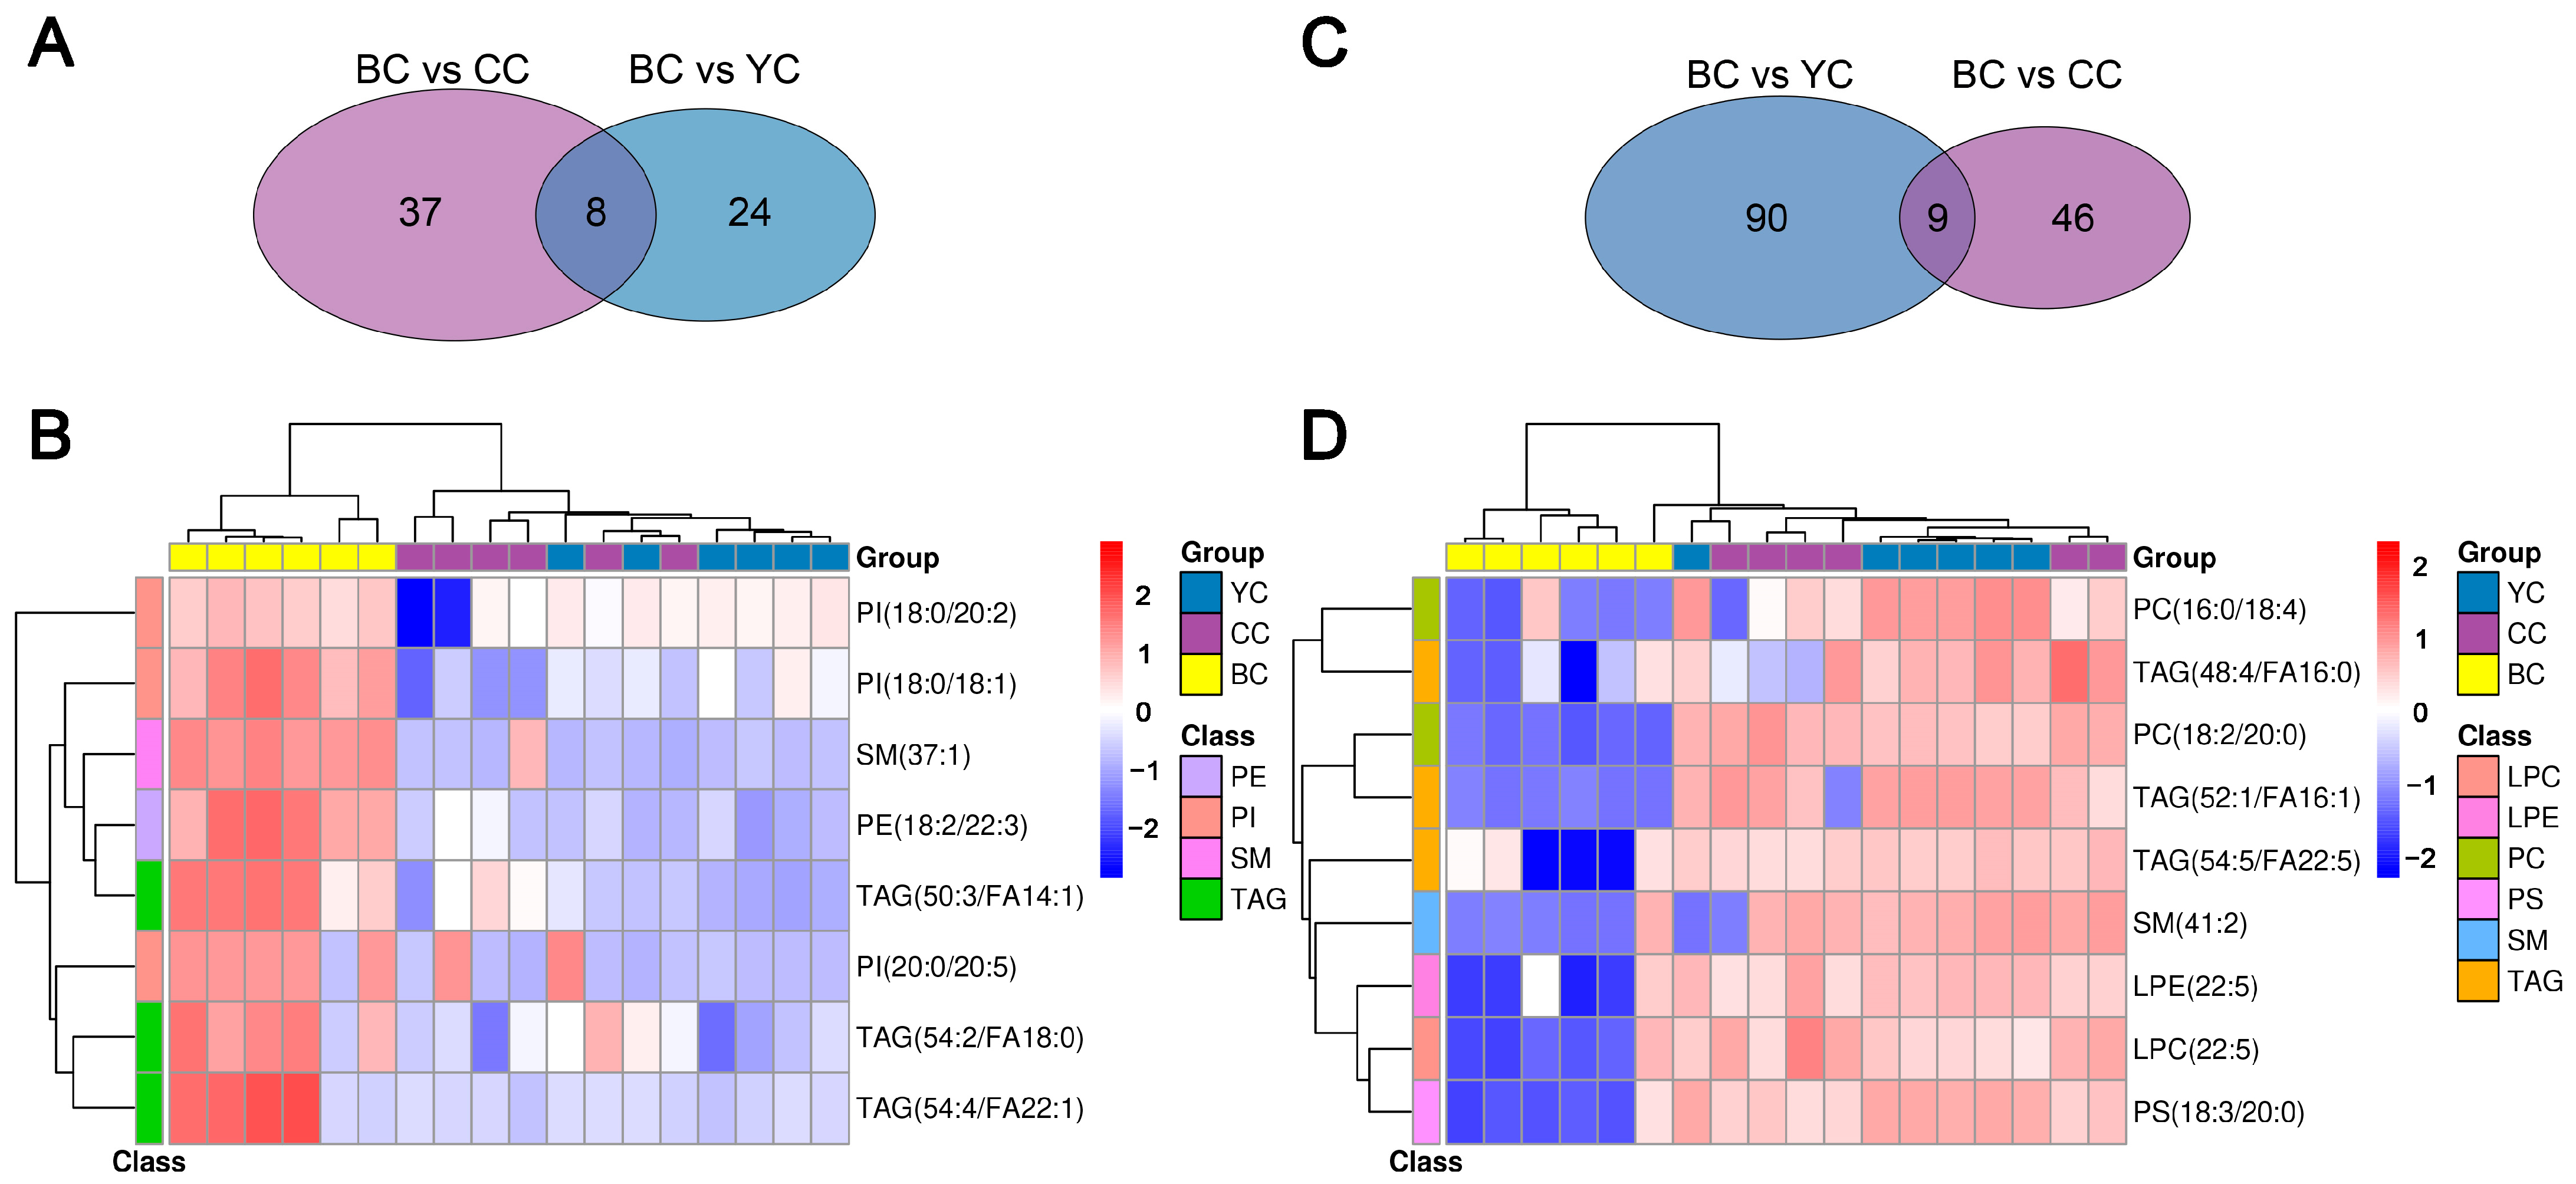
3.6. Specific Lipid Characteristics of BC

Eight lipids were significantly upregulated in BC compared to YC and CC (Figure 6A), including TAG (54:2/FA18:0), TAG (50:3/FA14:1), SM (17:1), PI (18:0/20:2), PI (18:0/18:1), PE (18:2/22:3), PI (20:0/20:5), and TAG (54:4/FA22:1), as shown in Figure 6B. SM, PI, and PE are essential structural components of cell membranes, playing key roles in maintaining membrane integrity and facilitating signal transduction [35]. For premature or low-birth-weight infants, the high energy density and immune-supportive properties of BC may provide critical support for early growth, immune system maturation, and developmental processes. Additionally, specific lipid components in BC, such as PI and PE, may offer neuroprotective benefits by supporting nervous system development and functional maintenance, making BC particularly suitable for infants requiring additional nutritional support [36].
Conversely, nine lipids were significantly downregulated in BC (Figure 6C), including PC (16:0/18:4), TAG (48:4/FA16:0), TAG (52:1/FA16:1), TAG (54:5/FA22:5), SM (41:2), LPE (22:5), LPC (22:5), PS (18:3/20:0), and PC (18:2/20:0). LPE and LPC serve as intermediates in phospholipid metabolism, and their reduced levels may suggest inhibition of phospholipase activity or decreased membrane degradation, potentially contributing to a lower inflammatory response [37]. PS, highly enriched in neural tissues, plays a role in neuronal signaling and exhibits anti-apoptotic properties [38]. Its regulation in BC may be associated with neuroprotection, which could be beneficial in conditions such as neurodegenerative diseases and cognitive decline. Overall, BC appears to influence lipid metabolism and inflammatory homeostasis through multiple pathways, making it an optimal choice for individuals seeking metabolic health benefits or requiring cardiovascular and neuroprotective support.

4. Conclusions

This study presents a comprehensive lipidomic analysis of YC, BC, and CC using UHPLC-QTOF-MS, identifying 872 lipids across 11 subclasses. A total of 137 DLs were detected between YC and CC, 100 between BC and CC, and 131 between YC and BC. Compared with BC and CC, YC exhibited 56 lipids with significantly higher expression and 15 with lower expression. Similarly, BC displayed eight lipids with elevated expression and nine with reduced expression compared with YC and CC. Notably, YC contained higher levels of C18:3 and C22:6, both essential for neonatal brain and retinal development, while PE, PS, and SM, which are involved in membrane fluidity and physiological regulation, were present in lower amounts. These findings suggest that YC provides high-energy nutrition and immune protection while strongly supporting neurodevelopment and cognitive function, making it particularly suited for neonatal growth. In contrast, BC exhibited elevated levels of PI (18:0/20:2), PI (18:0/18:1), and PE (18:2/22:3), which contribute to membrane flexibility and fluidity, whereas LPE (22:5), LPC (22:5), and PS (18:3/20:0) were less abundant. This composition indicates that BC may play a role in lipid metabolism regulation and inflammation modulation, making it more suitable for individuals with metabolic health concerns or cardiovascular and neuroprotective needs. These findings elucidate the distinct lipid compositions of YC and BC, reflecting their specialized physiological functions during early lactation. Furthermore, this study provides a scientific foundation for developing targeted nutritional supplements for neonates and infants while also facilitating innovation and optimization in colostrum-based products to meet diverse nutritional requirements across different populations.
It is worth noting that although liquid chromatogram-mass spectrometry is currently a commonly used lipidomics technology, it cannot discriminate between different isobaric forms of lipids. Therefore, it is necessary to further combine ion mobility technology to improve annotation accuracy in the future.

Author Contributions

Conceptualization, R.L., Y.W. and H.Z.; methodology, R.L., Y.W. and C.L.; software, Y.W.; validation, Y.W.; formal analysis, R.L. and Y.W.; investigation, C.L., J.H., Q.Z., J.L. and H.Z.; resources, L.L., P.Y., P.W., M.C., F.R. and H.Z.; data curation, Y.W.; writing—original draft preparation, Y.W.; writing—review and editing, R.L., Y.W. and H.Z.; visualization, R.L. and Y.W.; supervision, R.L. and Y.W.; project administration, H.Z.; funding acquisition, F.R. and H.Z. All authors have read and agreed to the published version of the manuscript.

Funding

This research was funded by the National Key R&D Program of China, grant number 2022YFD1600102.

Institutional Review Board Statement

Not applicable.

Informed Consent Statement

Not applicable.

Data Availability Statement

The original contributions presented in this study are included in the article. Further inquiries can be directed to the corresponding author.

Conflicts of Interest

The authors declare no conflicts of interest.

Abbreviations

The following abbreviations are used in this manuscript:
UHPLC-QTOF-MSUltra-high-performance liquid chromatography coupled with quadrupole time-of-flight mass spectrometry
UPLC-QTOF-MSUltra-performance liquid chromatography-quadrupole time-of-flight mass spectrometry
PLC-QTOF-MSPerformance liquid chromatography-quadrupole time-of-flight mass spectrometry
YCYak colostrum
BCBuffalo colostrum
CCCow colotrum
TAGTriacylglycerol
PCPhosphatidylcholine
SMSphingomyelin
PSPhosphatidylserine
DLsDifferential lipids
QCQuality control
NEGNegative sample
POSPositive sample
OPLS-DAOrthogonal partial least squares discriminant analysis
KEGGKyoto Encyclopedia of Genes and Genomes
PCAPrincipal component analysis
DAGDiacylglycerols
VIPVariable importance values
PIPhosphatidylinositol
PEPhosphatidylethanolamine
PCPhosphatidylcholine
EPAEicosapentaenoic acid
DHADocosahexaenoic acid
LPCLysophosphatidylcholine
LPELysophosphatidylethanolamine

References

  1. Han, X. Lipidomics for studying metabolism. Nat. Rev. Endocrinol. 2016, 12, 668–679. [Google Scholar] [CrossRef]
  2. Venkat, M.; Chia, L.W.; Lambers, T.T. Milk polar lipids composition and functionality: A systematic review. Crit. Rev. Food Sci. Nutr. 2022, 64, 31–75. [Google Scholar] [CrossRef] [PubMed]
  3. Liu, Z.; Logan, A.; Cocks, B.G.; Rochfort, S. Seasonal variation of polar lipid content in bovine milk. Food Chem. 2017, 237, 865–869. [Google Scholar] [CrossRef] [PubMed]
  4. Khan, T.S.; Akram, N.; Faisal, Z.; Saeed, F.; Rasheed, A.; Ahmed, F.; Afzaal, M. Bovine colostrum: Therapeutic potential and clinical evidence. Int. Dairy J. 2024, 157, 105996. [Google Scholar] [CrossRef]
  5. Castillo-Lopez, E.; Biber, P.; Sener-Aydemir, A.; Hummel, K.; Razzazi-Fazeli, E.; Reisinger, N.; Zebeli, Q.; Kreuzer-Redmer, S.; Hartinger, T. Characterization of the colostrum proteome of Primiparous Holstein cows and its association with colostrum immunoglobulin G concentrations. J. Anim. Sci. Biotechnol. 2025, 16, 10. [Google Scholar] [CrossRef]
  6. Liang, Z.; Chen, X.; Wang, X.; Qi, X.; Zhang, L.; Xin, Y.; Yang, Z.; Fan, R.; Li, Y.; Liu, L.; et al. A systemic review of yak milk and its products on the Qinghai-Tibet Plateau: Unique products, chemical composition, biological activities, and microbial composition. Trends Food Sci. Technol. 2014, 154, 104792. [Google Scholar] [CrossRef]
  7. Gao, Y.; Ma, Y.; Pan, L.; Li, W.; Peng, X.; Zhang, M.; Dong, L.; Wang, J.; Gu, R. Comparative analysis of whey proteins in yak milk from different breeds in China using a data-independent acquisition proteomics method. J. Dairy Sci. 2022, 106, 3791–3806. [Google Scholar] [CrossRef]
  8. Wang, D.; Zhou, Y.; Zheng, X.; Guo, J.; Duan, H.; Zhou, S.; Yan, W. Yak milk: Nutritional value, functional activity, and current applications. Foods 2023, 12, 2090. [Google Scholar] [CrossRef]
  9. Abd El-Salam, M.H.; El-Shibiny, S. A comprehensive review on the composition and properties of buffalo milk. Dairy Sci. Technol. 2011, 91, 663–699. [Google Scholar] [CrossRef]
  10. Vargas-Ramella, M.; Pateiro, M.; Maggiolino, A.; Faccia, M.; Franco, D.; De Palo, P.; Lorenzo, J.M. Buffalo Milk as a source of probiotic functional products. Microorganisms 2021, 9, 2303. [Google Scholar] [CrossRef]
  11. Deverao, P.D.; Vinayak, D.V.; Chandran, D.; Radha, R.; Kumar, M.; Lorenzo, J.M. Comparative effect of cooling on the physico-chemical-sensory properties of ghee from cow and buffalo milk, and evaluation of the low-fat spread prepared from cow and buffalo milk ghee. Food Anal. Methods 2022, 15, 2513–2523. [Google Scholar] [CrossRef]
  12. Sun, T.; Wang, X.; Cong, P.; Xu, J.; Xue, C. Mass spectrometry-based lipidomics in food science and nutritional health: A comprehensive review. Compr. Rev. Food Sci. Food Saf. 2020, 19, 2530–2558. [Google Scholar] [CrossRef]
  13. Wang, L.; Li, X.; Liu, L.; Zhang, H.; Zhang, Y.; Chang, Y.; Zhu, Q. Comparative lipidomics analysis of human, bovine and Caprine milk by UHPLC-Q-TOF-MS. Food Chem. 2020, 310, 125865. [Google Scholar] [CrossRef] [PubMed]
  14. Zhang, H.; Wang, L.; Zhang, Y.; Li, X.; Leng, Y.; Gong, Y.; Jiang, S. Comparative lipidomic analysis of human, bovine, and caprine milk. Food Sci. 2020, 41, 207–213. [Google Scholar] [CrossRef]
  15. Furse, S.; Watkins, A.J.; Koulman, A. Extraction of lipids from liquid biological samples for high-throughput lipidomics. Molecules 2020, 25, 3192. [Google Scholar] [CrossRef]
  16. Sarafian, M.H.; Gaudin, M.; Lewis, M.R.; Martin, F.P.; Holmes, E.; Nicholson, J.K.; Dumans, M.E. Objective set of criteria for optimization of sample preparation procedures for ultra-high throughput untargeted blood plasma lipid profiling by ultra performance liquid chromatography–mass spectrometry. Anal. Chem. 2014, 86, 5766–5774. [Google Scholar] [CrossRef] [PubMed]
  17. Zeng, C.; Wen, B.; Hou, G.; Lei, L.; Mei, Z.; Jia, X.; Chen, X.; Zhu, W.; Li, J.; Kuang, Y.; et al. Lipidomics profiling reveals the role of glycerophospholipid metabolism in psoriasis. Gigascience 2017, 6, 1–11. [Google Scholar] [CrossRef]
  18. Ni, M.; Peng, L.; Zhang, Y.; Wang, L.; Wei, Q.; Li, X.; Zhang, L.; Chen, J. Comparative lipidomics analysis of human colostrum, mature milk and yak mature milk. Food Chem. 2025, 476, 143396. [Google Scholar] [CrossRef]
  19. Han, L.; Zhu, S.; Weiser, M.; Mao, X. Research advances in the nutrient composition and functional characteristics of bovine colostrum. Food Sci. 2023, 44, 397. [Google Scholar] [CrossRef]
  20. Li, Q.; Wang, X.; Zhang, Q.; Wu, Y.; Chen, R.; Sun, Y.; Pan, Y.; Li, S.; Wang, Z. Multi-Omics analysis of five species of milk and specific composition links within each species. Food Chem. 2024, 457, 140028. [Google Scholar] [CrossRef]
  21. Katti, S.S.; Krieger, I.V.; Ann, J.; Lee, J.; Sacchettini, J.C.; Igumenova, T.I. Structural anatomy of protein kinase C C1 domain interactions with diacylglycerol and other agonists. Nat. Commun. 2022, 13, 2695. [Google Scholar] [CrossRef]
  22. Mathiowetz, A.J.; Olzmann, J.A. Lipid droplets and cellular lipid flux. Nat. Cell Biol. 2024, 26, 331–345. [Google Scholar] [CrossRef] [PubMed]
  23. Hannun, Y.A.; Obeid, L.M. Principles of bioactive lipid signalling: Lessons from sphingolipids. Nat. Rev. Mol. Cell Biol. 2008, 9, 139–150. [Google Scholar] [CrossRef] [PubMed]
  24. Trygg, J.; Wold, S. Orthogonal projections to latent structures (O-PLS). J. Chemom. 2002, 16, 119–128. [Google Scholar] [CrossRef]
  25. Worley, B.; Powers, R. Multivariate analysis in Metabolomics. Curr. Metab. 2012, 1, 92–107. [Google Scholar] [CrossRef]
  26. Aralan, A.; Kaplan, M.; Duman, H.; Bayraktar, A.; Erturk, M.; Henrick, B.M.; Frese, S.A.; Karav, S. Bovine colostrum and its potential for human health and nutrition. Front. Nutr. 2021, 8, 651721. [Google Scholar] [CrossRef]
  27. Xu, J.; Huang, X. Lipid metabolism at membrane contacts: Dynamics and functions beyond lipid homeostasis. Front. Cell Dev. Biol. 2020, 8, 615856. [Google Scholar] [CrossRef]
  28. Wang, Y.; Li, C.; Huang, J.; Zeng, Q.; Li, L.; Yang, P.; Wang, P.; Chu, M.; Luo, J.; Ren, F.; et al. Untargeted metabolomics reveals key differences between yak, buffalo, and cow colostrum based on UHPLC-ESI-MS/MS. Foods 2025, 14, 232. [Google Scholar] [CrossRef]
  29. Puppel, K.; Gołębiewski, M.; Grodkowski, G.; Slósarz, J.; Kunowska-Slósarz, M.; Solarczyk, P.; Łukasiewicz, M.; Balcerak, M.; Przysucha, T. Composition and factors affecting quality of bovine colostrum: A Review. Animals 2019, 9, 1070. [Google Scholar] [CrossRef]
  30. German, J.B.; Dillard, C.J. Composition, Structure and absorption of milk lipids: A source of energy, fat-soluble nutrients, and bioactive molecules. Crit. Rev. Food Sci. Nutr. 2006, 46, 57–92. [Google Scholar] [CrossRef]
  31. Crawford, M.A.; Golfetto, I.; Ghebremeskel, K.; Min, Y.; Moodley, T.; Poston, L.; Phylactos, A.; Cunnane, S.; Schmidt, W. The potential role for arachidonic and docosahexaenoic acids in protection against some central nervous system injuries in preterm infants. Lipids 2003, 38, 303–315. [Google Scholar] [CrossRef] [PubMed]
  32. Wang, M.; Shi, Y.; Zhang, J.; Zhang, Y. The role of polyunsaturated fatty acids in infant brain development. J. Pediatr. Gastroenterol. Nutr. 2020, 28, 1227. [Google Scholar] [CrossRef]
  33. Zhao, M.; Chen, Z.; Ye, D.; Yu, R.; Yang, Q. Comprehensive lipidomic profiling of human milk from lactating women across varying lactation stages and gestational ages. Food Chem. 2025, 463, 141242. [Google Scholar] [CrossRef]
  34. Zivkovic, A.M.; German, J.B.; Lebrilla, C.B.; Mills, D.A. Human milk glycobiome and its impact on the infant gastrointestinal microbiota. Proc. Natl. Acad. Sci. USA 2011, 108, 4653–4658. [Google Scholar] [CrossRef] [PubMed]
  35. Morita, S.; Ikeda, Y. Regulation of membrane phospholipid biosynthesis in mammalian cells. Biochem. Pharmacol. 2022, 206, 115296. [Google Scholar] [CrossRef]
  36. Liu, H.N.; Ren, F.Z.; Jiang, L.; Ma, Z.L.; Qiao, H.J.; Zeng, S.S.; Gan, B.Z.; Guo, H.Y. Short communication: Fatty acid profile of yak milk from the Qinghai-Tibetan Plateau in different seasons and for different parities. J. Dairy Sci. 2011, 94, 1724–1731. [Google Scholar] [CrossRef] [PubMed]
  37. Prabutzki, P.; Schiller, J.; Engel, K.M. Phospholipid-derived lysophospholipids in (patho)physiology. Atherosclerosis 2024, 398, 118569. [Google Scholar] [CrossRef]
  38. Ma, X.; Li, X.; Wang, W.; Zhang, M.; Yang, B.; Miao, Z. Phosphatidylserine, inflammation, and central nervous system diseases. Front. Aging Neurosci. 2022, 14, 975176. [Google Scholar] [CrossRef]
Figure 1. Reliability of the analytical method. (A) Principal component analysis (PCA) score plot of yak colostrum (YC), buffalo colostrum (BC), cow colostrum (CC), and quality control (QC) samples. (B) Correlation heatmap of QC samples.
Dairy 06 00014 g001
Figure 2. Overview of lipid identification in YC, BC, and CC. (A) Number of identified lipids categorized into 11 lipid subclasses. (B) Relative peak intensities of each lipid subclass across YC, BC, and CC. Abbreviations: CER, ceramide; LPE, lysophosphatidylethanolamine; LPC, lysophosphatidylcholine; DAG, diacylglycerol; PE, phosphatidylethanolamine; PI, phosphatidylinositol; SM, sphingomyelin; PG, phosphatidylglycerol; PS, phosphatidylserine; PC, phosphatidylcholine; TAG, triacylglycerol.
Dairy 06 00014 g002
Figure 3. Orthogonal partial least squares discriminant analysis (OPLS-DA) and model validation. (AC) OPLS-DA score plots showing discrimination between (A) YC and CC, (B) BC and CC, and (C) YC and BC. (DF) Permutation test validation of the OPLS-DA models for (D) YC vs. CC, (E) BC vs. CC, and (F) YC vs. BC.
Dairy 06 00014 g003
Figure 4. Differential lipid (DL) identification among samples. (A) Volcano plot of DLs between YC and CC. (B) Proportional distribution of DL subclasses in YC compared to CC. (C) Volcano plot of DLs between BC and CC. (D) Proportional distribution of DL subclasses in BC compared to CC. (E) Volcano plot of DLs between YC and BC. (F) Proportional distribution of DL subclasses in YC compared to BC.
Dairy 06 00014 g004
Figure 5. Lipid characteristics of YC. (A) Venn diagram of significantly upregulated DLs in YC compared to BC and CC. (B) Heatmap of significantly upregulated lipids in YC. (C) Venn diagram of significantly downregulated DLs in YC compared to BC and CC. (D) Heatmap of significantly downregulated lipids in YC.
Dairy 06 00014 g005
Figure 6. Lipid characteristics of BC. (A) Venn diagram of significantly upregulated DLs in BC compared to YC and CC. (B) Heatmap of significantly upregulated lipids in BC. (C) Venn diagram of significantly downregulated DLs in BC compared to YC and CC. (D) Heatmap of significantly downregulated lipids in BC.
Dairy 06 00014 g006
Disclaimer/Publisher’s Note: The statements, opinions and data contained in all publications are solely those of the individual author(s) and contributor(s) and not of MDPI and/or the editor(s). MDPI and/or the editor(s) disclaim responsibility for any injury to people or property resulting from any ideas, methods, instructions or products referred to in the content.

