Article

ISQ for Assessing Implant Stability and Monitoring Healing: A Prospective Observational Comparison between Two Devices

by
Giueseppe Bavetta
1,
Carlo Paderni
1,
Giorgio Bavetta
1,†,
Valentina Randazzo
1,†,
Alessio Cavataio
1,
Francesco Seidita
1,
Ahmad G. A. Khater
2,3,‡,
Sergio Alexandre Gehrke
4,
Sergio Rexhep Tari
5,† and
Antonio Scarano
5,*,‡
1
Private Practice, 90100 Palermo, Italy
2
Faculty of Oral and Dental Medicine, Egyptian Russian University (ERU), Badr City 11829, Egypt
3
Health Affairs Directorate, Egyptian Ministry of Health and Population, Banisuif 62511, Egypt
4
Department of Research, Bioface/PgO/UCAM, Montevideo 11100, Uruguay
5
Department of Innovative Technologies in Medicine and Dentistry, University of Chieti–Pescara, 66100 Chieti, Italy
*
Author to whom correspondence should be addressed.
These authors contributed equally to this work as co-first authors.
These authors contributed equally to this work as co-last authors.
Prosthesis 2024, 6(2), 357-371; https://doi.org/10.3390/prosthesis6020027
Submission received: 25 February 2024 / Revised: 2 April 2024 / Accepted: 2 April 2024 / Published: 9 April 2024
(This article belongs to the Section Bioengineering and Biomaterials)

Abstract

:
Background: With the growing use of dental implants, there is an urgent need to determine a prosthetic placement protocol by assessing implant stability and monitoring healing. Implant Stability Quotient (ISQ) values are produced using dental non-invasive devices through resonance frequency analysis, considered as indicators for measuring primary stability (i.e., at implant placement), monitoring biological stability (osseointegration), and prosthetic loading. A systematic and detailed comparison of ISQ measurement devices, for a given patient population, is lacking in the literature. This aspect is the subject of the present work, with the devices being two that are widely used in clinical practice (Osstell® and Osseo®100). The aim of this study was to evaluate the reliability of ISQ measurement using two standard devices most commonly used in clinical practice and to highlight any differences when comparing measurements at undefined time intervals. Methods: We enrolled 50 patients (16 males and 34 females) with a mean age of 55.4 years, who indicated dental implant placement and met the inclusion criteria. The sample was divided into two equal groups based on bone density: A (D1–D2 bone density) and B (D3–D4 bone density); each had 25 patients with 40 implants. ISQ was measured using two devices: Osstell® and Osseo 100®, at different time points (A: three and B: four follow-ups). Results: All enrolled patients completed the study without adverse events; all implants placed were successful, with no implant failure. In each of the study groups, ISQ values increased gradually with increasing follow-up time, and there was no significant difference between Osstell and Osseo 100 values at follow-up times except for the T1 follow-up in group A. Temporal comparisons for the two devices revealed significant differences in T0 vs. T2 in group A, whereas significant differences existed in T0 vs. T1, T2, and T3 in group B. Our findings indicated that the overall effect significantly depended on bone density rather than on the device used to measure ISQ. Conclusion: Regardless of the devices used, the ISQ measurement effectively monitors healing after implant insertion and allows prosthetic load to be modulated according to the ISQ value, especially when prosthetizing implants placed in fine trabecular bone (D4 or regenerated bone).

1. Introduction

Implantology is a dental discipline developing endosseous pillars to support prostheses to replace missing natural teeth [1,2]. Success in implantology depends on osseointegration, which Branemark defines as “the direct structural and functional connection between living bone and the surface of a load-bearing implant” [3]. According to the original Branemark protocol, achieving the primary stability of a sterile implant with an atraumatic surgical procedure is crucial by using surgical motors with controlled speed and torque, irrigation with sterile saline solution, and biocompatible material such as titanium [4]. Moreover, achieving osseointegration demands a three-to-six-month healing period without prosthetic loading after implant placement [5].
Implant stability is defined as the lack of clinical mobility of the implant that is classified as primary or mechanical stability gained after implant placement and secondary or biological stability obtained concurrently with osseointegration [6]. As such, Raghavendra et al. explained that after implant placement, secondary biological stability gradually replaces primary mechanical stability, whereby the healing process at the implant site and the simultaneous replacement of the peri-implant bone tissue with newly formed bone cause this transition [7]. Consequently, there is a critical period between the 20th and 60th day, during which osteoclastic activity reduces the initial mechanical stability, as the newly formed bone has not yet reached the required levels to ensure implant stability; thus, the prosthetic load during this time may cause micro-movements, preventing osseointegration [8,9,10] (Figure 1).
According to Cameron et al., such micro-movements at the bone-implant interface can be tolerated up to a threshold of 50 to 150 µm, above which osseointegration is not determined [11]. However, Brunski et al. clarified that the degree of micro-movement at the bone-implant interface during the healing timing is the determinant factor for attaining osseointegration rather than early loading, thus introducing the theoretical basis for the immediate loading protocols [12]. Therefore, primary implant stability is a prerequisite for predictable and long-term secondary stability (osseointegration) [13]. As a result, factors such as bone quality and quantity, surgical technique (under-preparation and osseodensification), and implant design (diameter, length, conical shape, and treated surface) should be considered during the immediate loading decision-making process since they influence primary stability [14]. The implant protocol’s success (immediate or delayed loading) depends entirely on the clinician’s ability to assess the implant’s degree of primary stability and the changes in stability that occur during the healing period and osseointegration consolidation [15].
The currently available approaches for the pre-, intra-, and post-surgical assessment of implant stability are summarized in Table 1.
Although histological and histomorphometric analyses remain the gold standard, they have several limitations due to legal and ethical constraints.
The percussion test was previously used to evaluate implant stability; however, it has shown to be a helpful method for simply diagnosing pain or implant sensitivity because it can be misleading in assessing the quality and quantity of peri-implant bone, given that the sound produced is similar for bone levels ranging from 2 to 16 mm [6]. Also, the radiographic examination can aid in identifying marginal, mesial, and distal bone losses and changes in bone trabeculae over time; still, it is not an objective tool for assessing changes in bone density during the first loading phase and is not simply reproducible (in terms of distance, angle of the X-ray beam) [23,24]. The Periotest® was originally designed to measure tooth movement in quantitative units and subsequently to measure the stability of the dental implant. Unfortunately, because the Periotest value is strongly related to the excitation direction and position, the reading from the method does not always correspond precisely to a biomechanical parameter [25]. Also, interfacial shear strength values have been used to evaluate implant stability, measured by applying load parallel to the implant–bone interface [26].
However, controlling the insertion torque value (ITV) measured with the recent generation surgical micromotors during implant placement becomes the most effective method for quantitatively assessing primary stability [27]. The ITV value is expressed in N/cm and is frequently used to determine the prosthesis loading time [28,29]. Although ITV is an objective measurement that only assesses primary stability at the time of implant placement, it is insufficient for evaluating the entire osseointegration process. As a result, in 1987, Johansson and Albrektsson introduced and developed the reverse torque test, which is used in the second stage of surgery to clinically verify the initial integration of the dental implant with the bone surface [30]. On the other side, resonance frequency analysis (RFA) is another method for assessing implant stability at the insertion time (i.e., primary stability), and because it is a non-invasive approach, it also allows for monitoring osseointegration consolidation during the healing period and prosthetic loading phases (i.e., secondary stability) [31]. The RFA assesses the rigidity and deflection of the implant–bone complex using the Implant Stability Quotient (ISQ) score, an objective numerical value ranging from 1 to 100, with higher ISQ values indicating more implant stability [32].
Given that assessing implant stability with objective methods is critical, especially when using progressive loading protocols for implants inserted in fine trabecular bone (D4 or regenerated bone), there needs to be a consensus on which approach is the most accurate and reliable. Also, histological examination is an invasive method for assessing implant secondary stability; thus, in removal torque analysis, the implant is regarded stable if the reverse or unscrewing torque is greater than 20 N.cm [33]. However, the disadvantage is that at the time of abutment connection, the implant surface in the process of osseointegration may fracture under the applied torque stress. The aim of this study was to evaluate the reliability of the ISQ measurement using two standard devices most commonly used in clinical practice and to highlight any differences when comparing measurements at undefined time intervals.

2. Materials and Methods
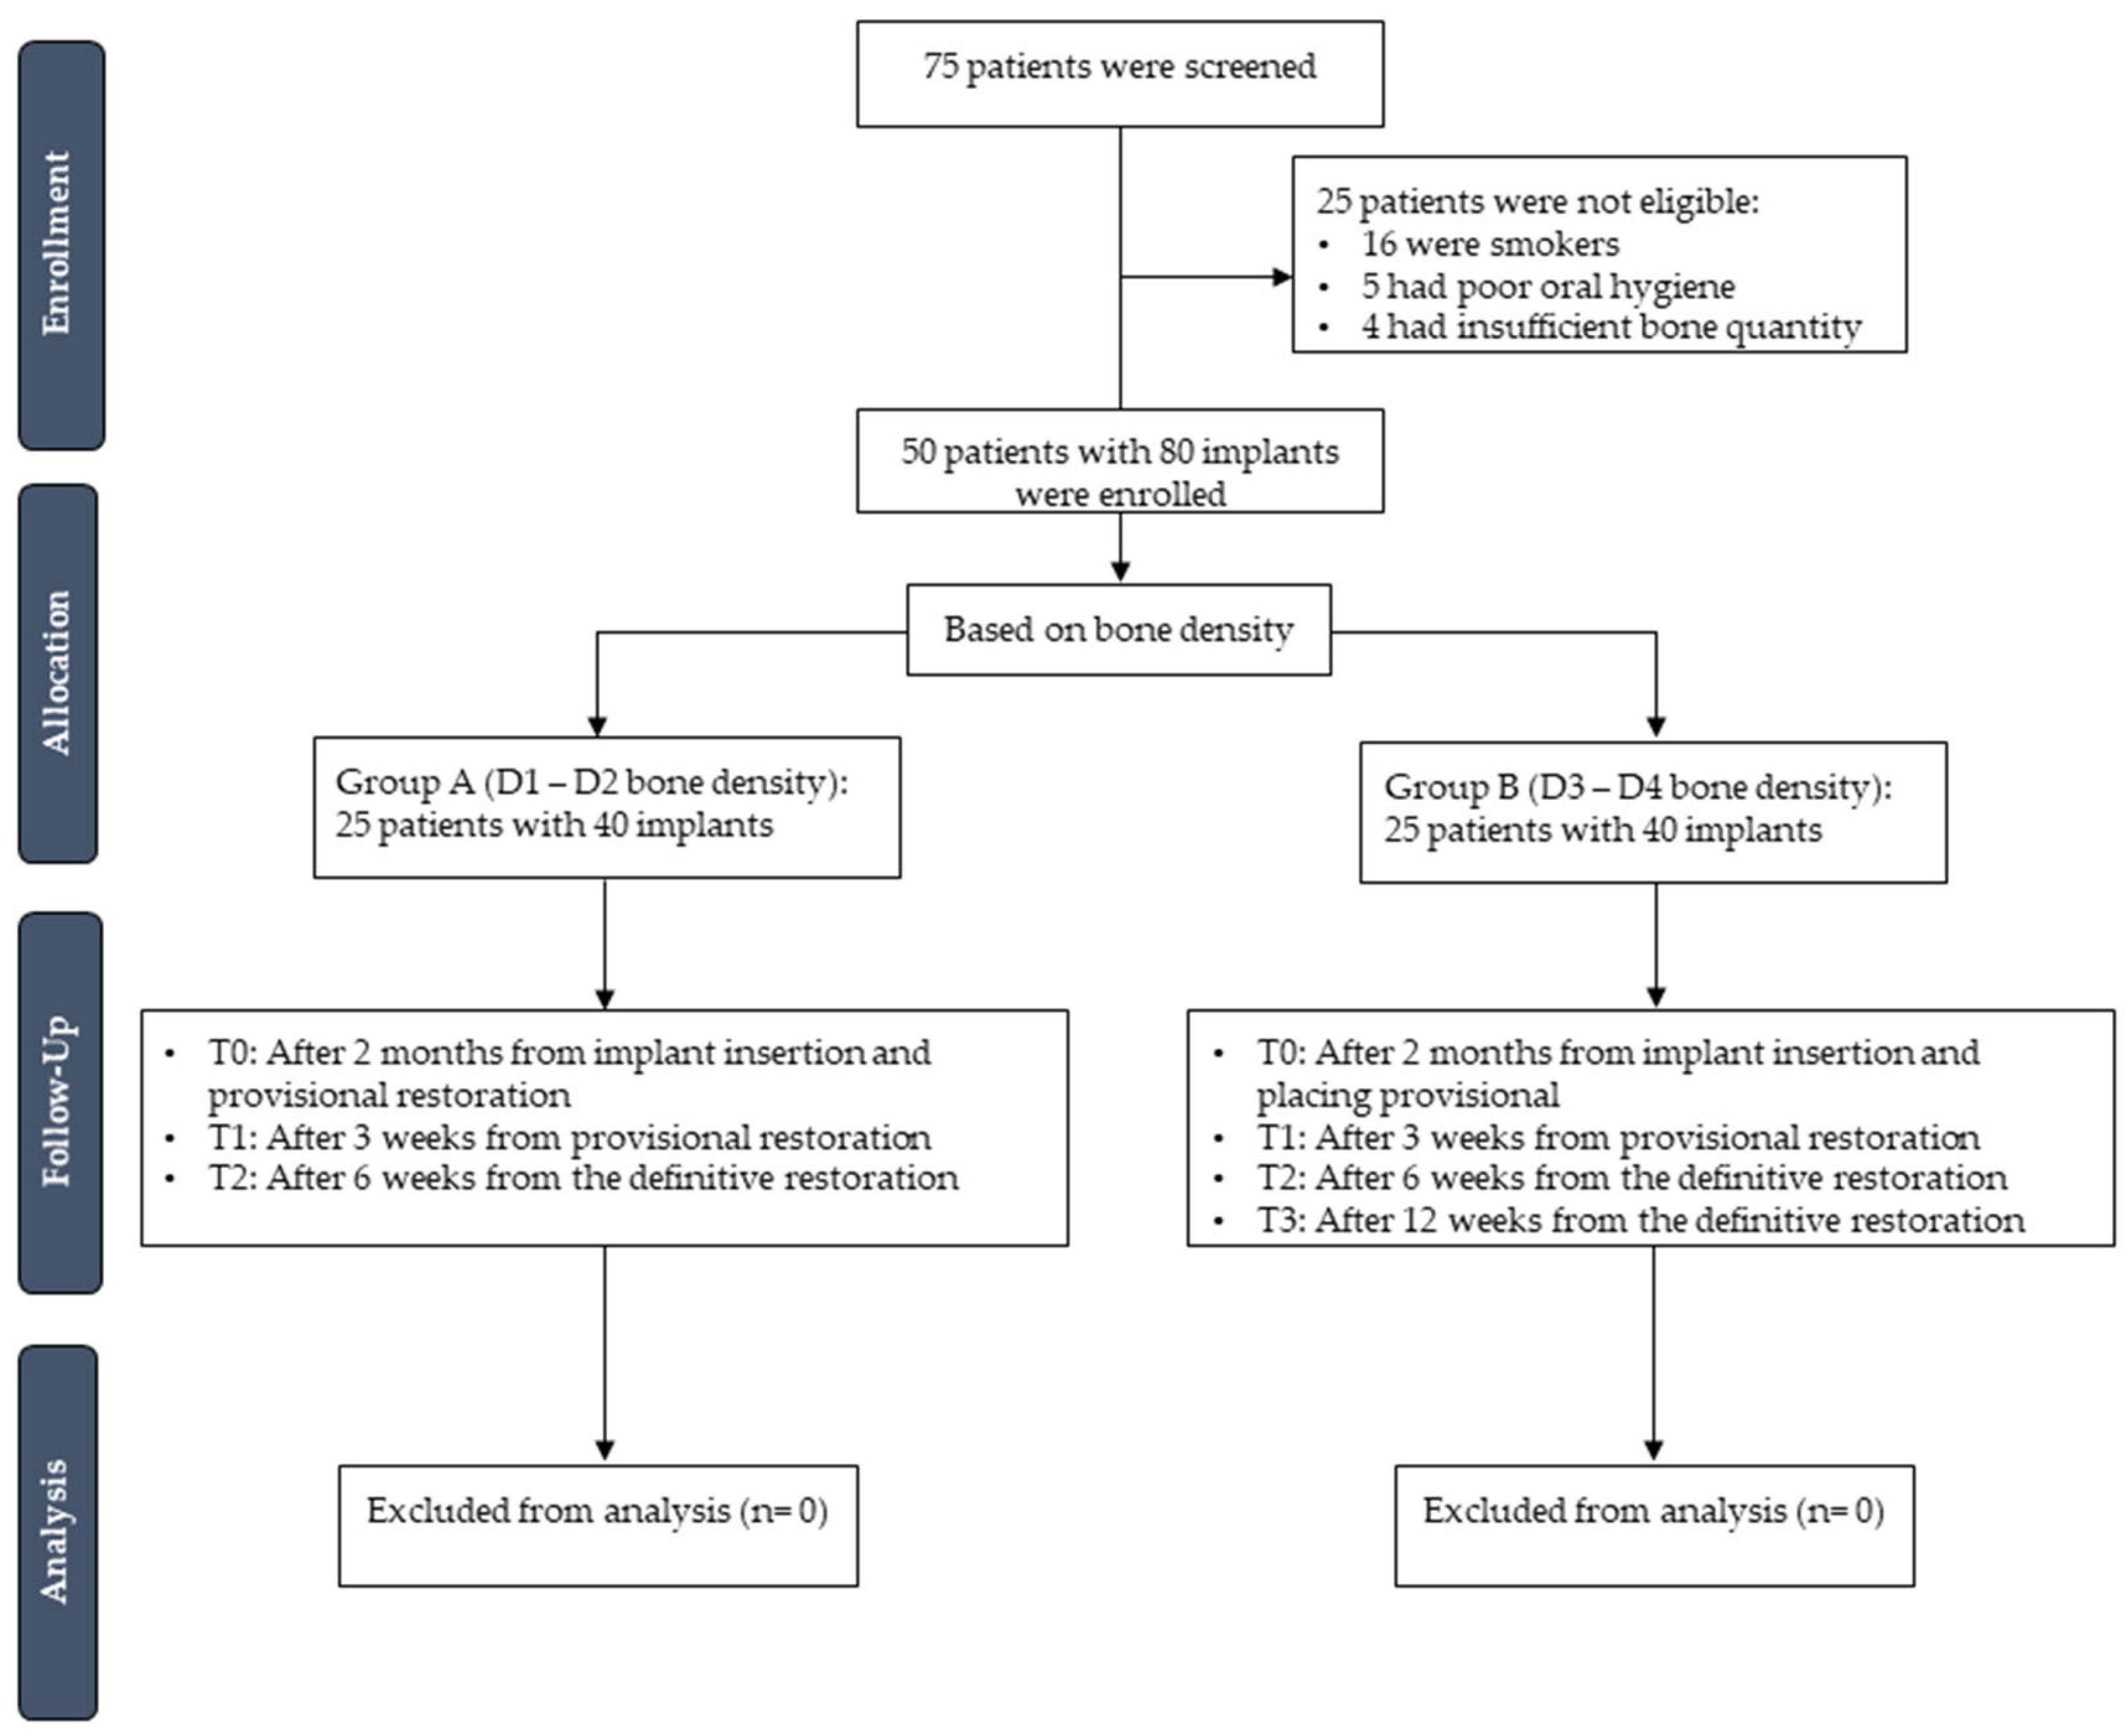
2.1. Study Design

We designed this study as a prospective observational study, following the STROBE guidelines for reporting cohort observational studies [34]. The study was approved by the Internal Review Board of the Department of Innovative Technologies in Medicine and Dentistry, University of Chieti–Pescara, Italy (ID: CRRM;2023;08;02;01) and conducted in compliance with the local good clinical practice procedures for quality control [35]. All participating patients in the study signed a written informed consent under the Helsinki Declaration for experimentation on human subjects.

2.2. Setting and Participants

We used a consecutive sampling method to recruit all adult patients indicated for dental implant placement from May to December 2020 at private dental clinics in Palermo, Italy. Healthy patients requiring dental implants with proper oral health, enough jaw bone, and good compliance with oral hygiene and regular maintenance were examined for participation in the study. Inclusion criteria were (a) adequate oral hygiene, (b) the absence of acute infection, (c) enough bone quantity to achieve primary implant stability, (d) delayed load (>60 days in D1–D2 bone density and >90 days in D3–D4 bone density), (e) more than 20 N.cm ITV; however, patients with ASA III or higher health status, smokers, and a history of head and neck region radiotherapy were excluded.

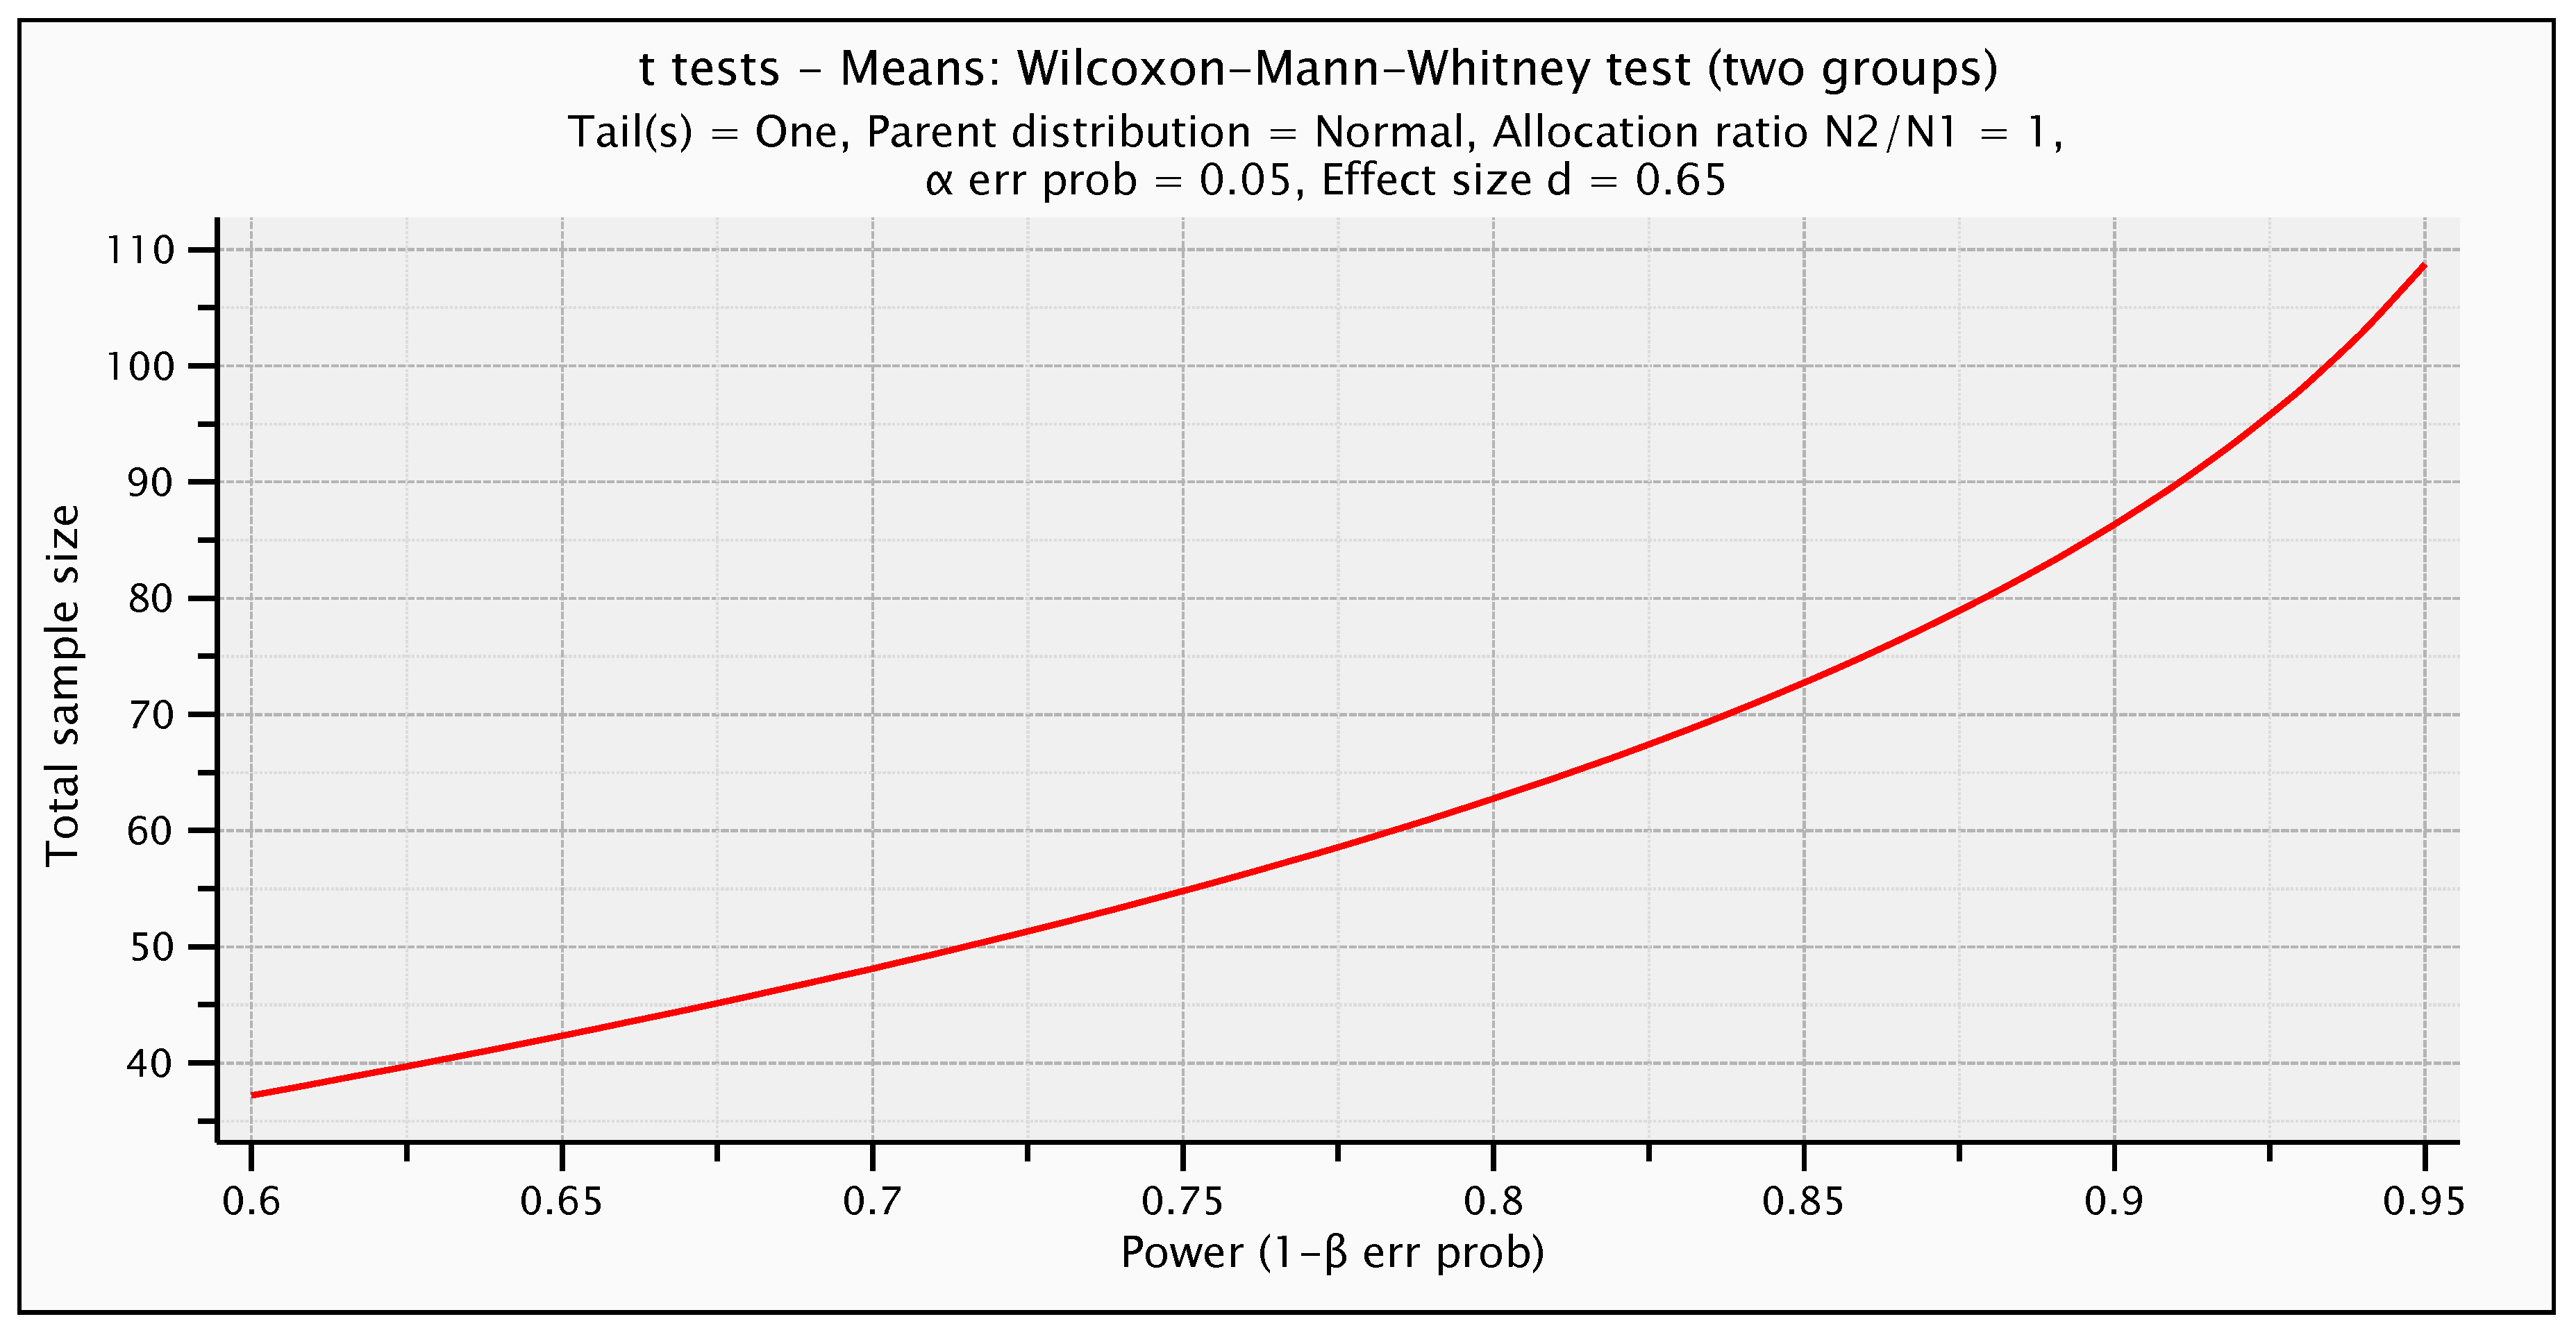
2.3. Study Sample Size

The sample power analysis was performed using clinical software (G*power version 3.1.9.7, Heinrich-Heine-Universität Düsseldorf, Düsseldorf, Germany), and the effect size has been determined considering a previous study [36]. A calculation model has been adopted for dichotomous variables (yes/no effect) with alpha = 0.05, effect size: 0.65, and power = 70%. As a result, the optimal number of patients per group was found to be 24 (Table 2 and Figure 2).

2.4. Pre-Surgical Procedures

Each of the selected patients underwent a pre-operative evaluation that included medical and dental history, clinical examination, and radiographic examination using cone-beam computed tomography (CBCT). The pre-operative radiographic examination was performed using CBCT (Gendex GXDP-700™ Panorex + Cone Beam CBCT X-ray, Chamblee, GA, USA) with exposure parameters of 100 KVp, 4–10 mA and a 5 × 8 field of view (FOV) to assess the bone quantity and whether it was sufficient to achieve primary implant stability. Such radiographic evaluation was performed using Hounsfield units (HU) in pre-operatory CBCT, reported as CT attenuation values according to a linear density scale [6].

2.5. Surgical Procedures

After routine disinfection and local dental anesthesia administration (articaine plus 1:100,000 epinephrine), a full-thickness flap was raised. The implant beds were prepared according to the manufacturer’s specifications, using the dedicated ZimVie kit and implant micromotor with controlled torque and speed under physiological solution irrigation. Then tapered implants (Screw-Vent Implant, ZimVie, Palm Beach Gardens, FL, USA) were placed in healed ridges (at least three months), and the surgical sites were closed with polyester sutures (size 4/0). ITV values were recorded for each implant at implant insertion using a surgical micromotor (OsseoCare Pro Drill Motor from Nobel Biocare, Kloten, Switzerland) to fulfill the inclusion criteria.
Each of the selected patients received detailed post-operative instructions and a prescription for a post-operative antibiotic (amoxicillin 875 mg/clavulanic acid 125 mg) or (clarithromycin 500 mg for allergic patients) twice daily for five days, a pain reliever (ketoprofen lysine salt 80 mg) twice daily for three days, and antiseptic mouthwash (0.2% chlorhexidine) twice daily for seven days.
After seven to ten days, the sutures were removed, and implants were uncovered under local anesthesia using a mucotome with adequate width of adhering gingiva or a vestibular-repositioned flap with inadequate keratinized gingiva. Sequentially, healing screws were applied (diameter: 4.5 mm and height: 5 mm), and digital impressions were taken using the 3 shape® intraoral scanner for provisional restoration (PMMA crowns with Tbase Zfx and no friction fit) and definitive restoration (monolithic zirconia with Tbase GenTek, friction fit, and 30 N.cm torque). In group B, a progressive prosthetic loading protocol was followed, which started with an under-dimensioned temporary crown in sub-occlusion to avoid potential forces that could harm the osseointegration consolidation, then provided a progressive increase to the occlusal contacting surfaces; yet, the eccentric contacts were removed, and temporary crown dimensions were gradually increased in case of habitual occlusion.

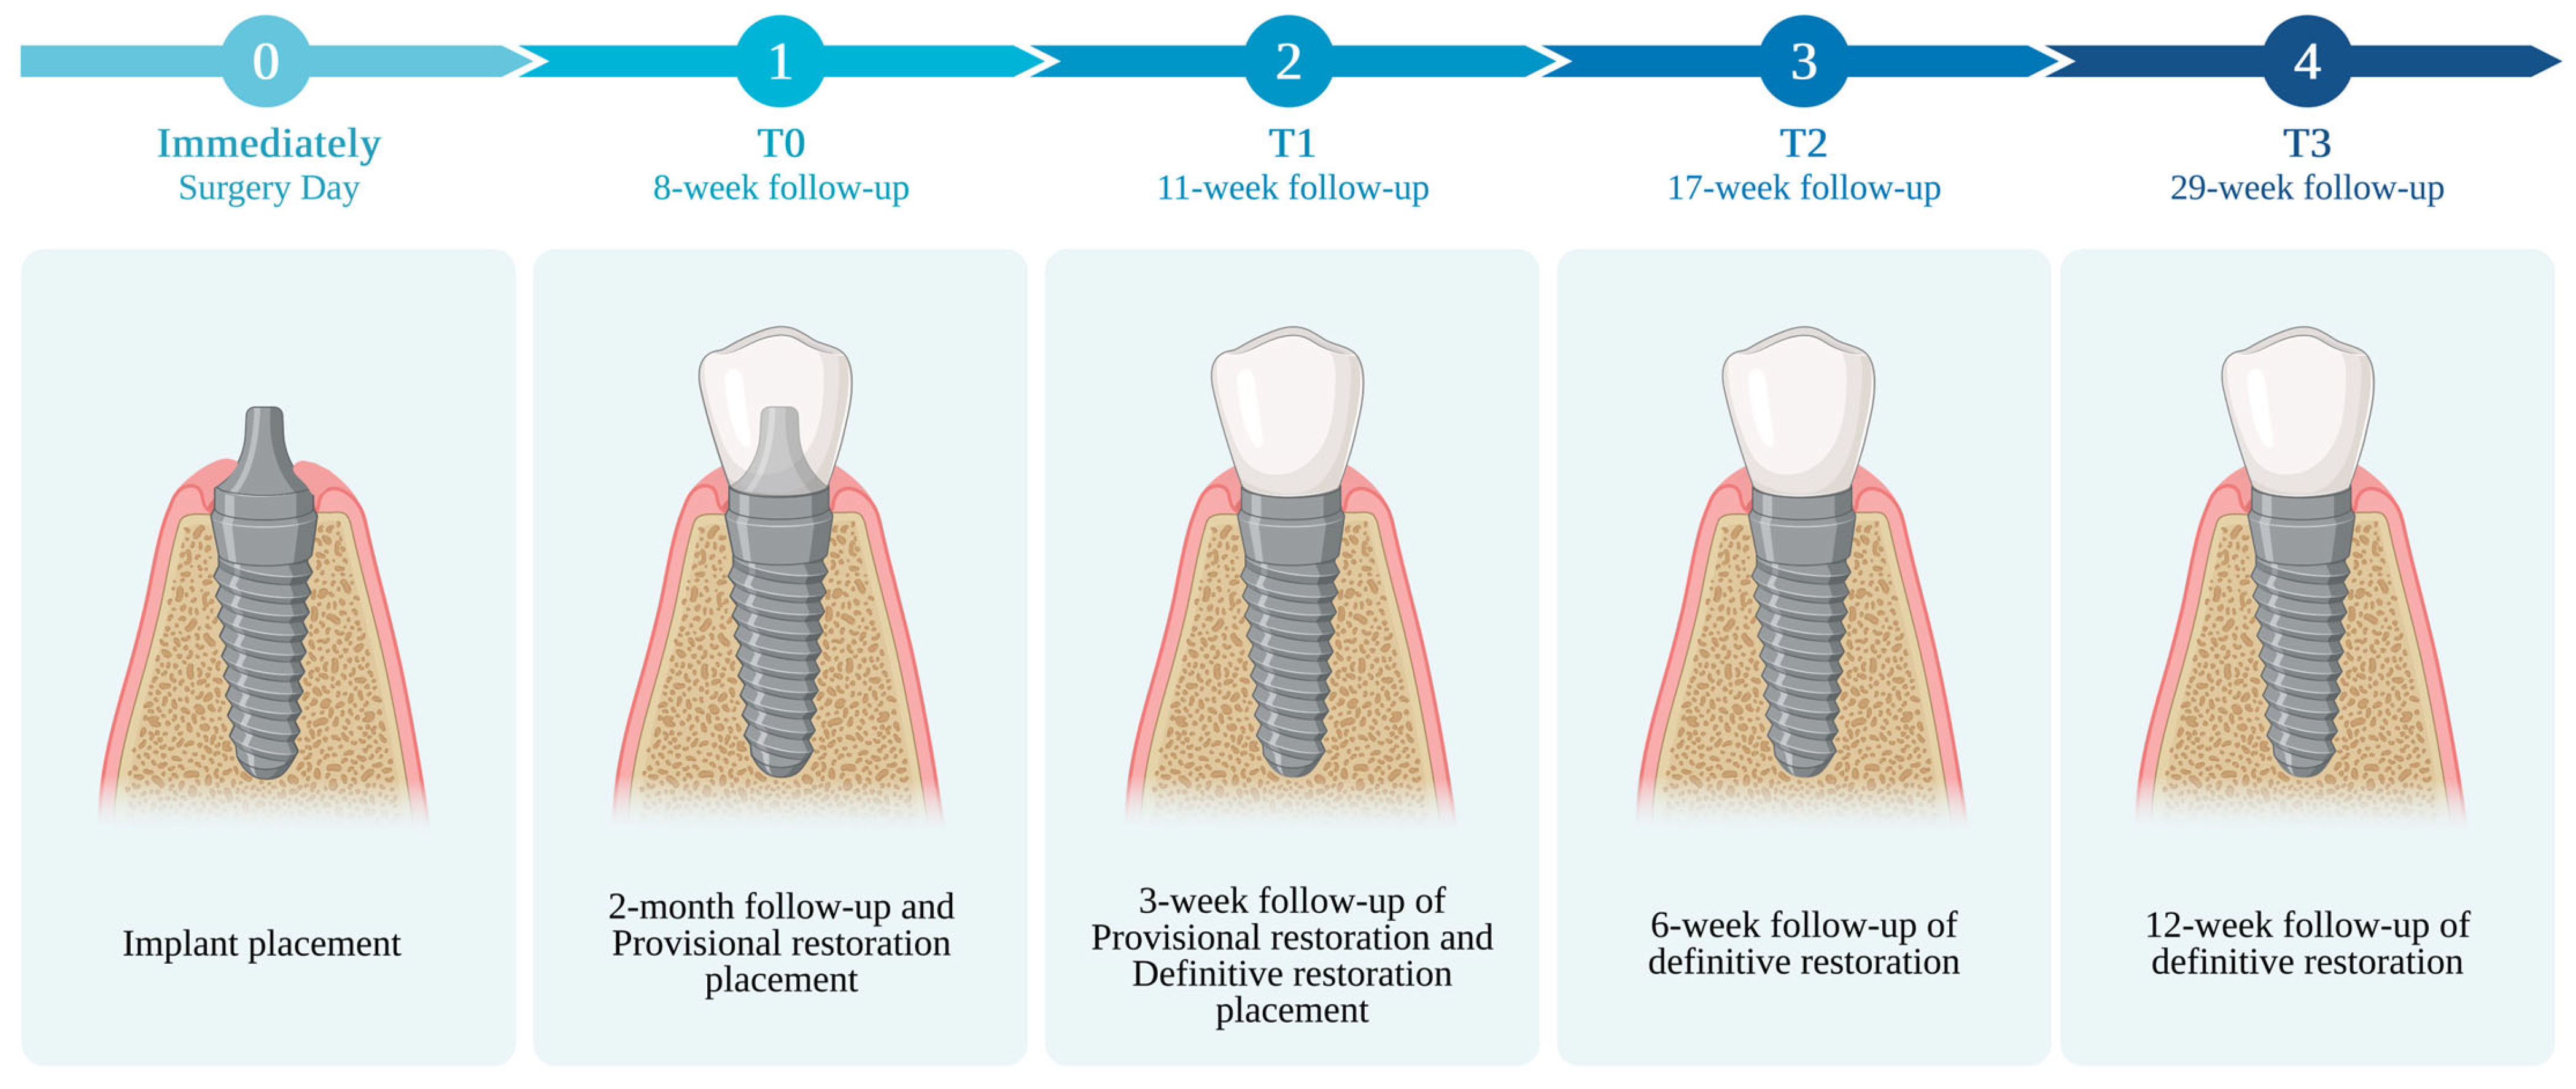
2.6. Outcome Measure

We divided the sample into two groups according to the bone quality and density assessed by HU in pre-operative CBCT. We measured ISQ on each of the patients at various follow-up periods (Figure 3) as follows: Group A (D1–D2 bone density):
-
T0: After 2 months from implant insertion and provisional restoration placement
-
T1: After 3 weeks from provisional restoration
-
T2: After 6 weeks from the definitive restoration
Group B (D3–D4 bone density):
-
T0: After 2 months from implant insertion and placing provisional placement
-
T1: After 3 weeks from provisional restoration
-
T2: After 6 weeks from the definitive restoration
-
T3: After 12 weeks from the definitive restoration
According to Raghavendra et al. [7], such measurements were obtained after achieving osseointegration (T0), three weeks after prosthetic loading with temporary crowns (T1), and after permanent restoration placement (T2) to evaluate changes in implant stability during osseointegration consolidation. The ISQ values were measured using two standard devices—Osstell® (Osstell Mentor—W&H, Gothenburg, Sweden) and Osseo 100 (NSK, Tochi, Japan)—via magnetic impulses produced by a probe and detected by a device screwed onto the implant fixture (SmartPeg™ [W&H, Gothenburg, Sweden] and MulTipeg™ [NSK, Tochi, Japan], respectively). According to the manufacturer’s recommendations, for all implants, two ISQ measurements were taken in each direction (buccolingual and mesiodistal) at 90 degrees perpendicular to each other, and their mean values were recorded. Moreover, all these measurements were recorded in a dry peri-implant area with no bleeding contamination.
Figure 3. Graphical illustration of the study timeline. This figure was created using Biorender.com.
Prosthesis 06 00027 g003

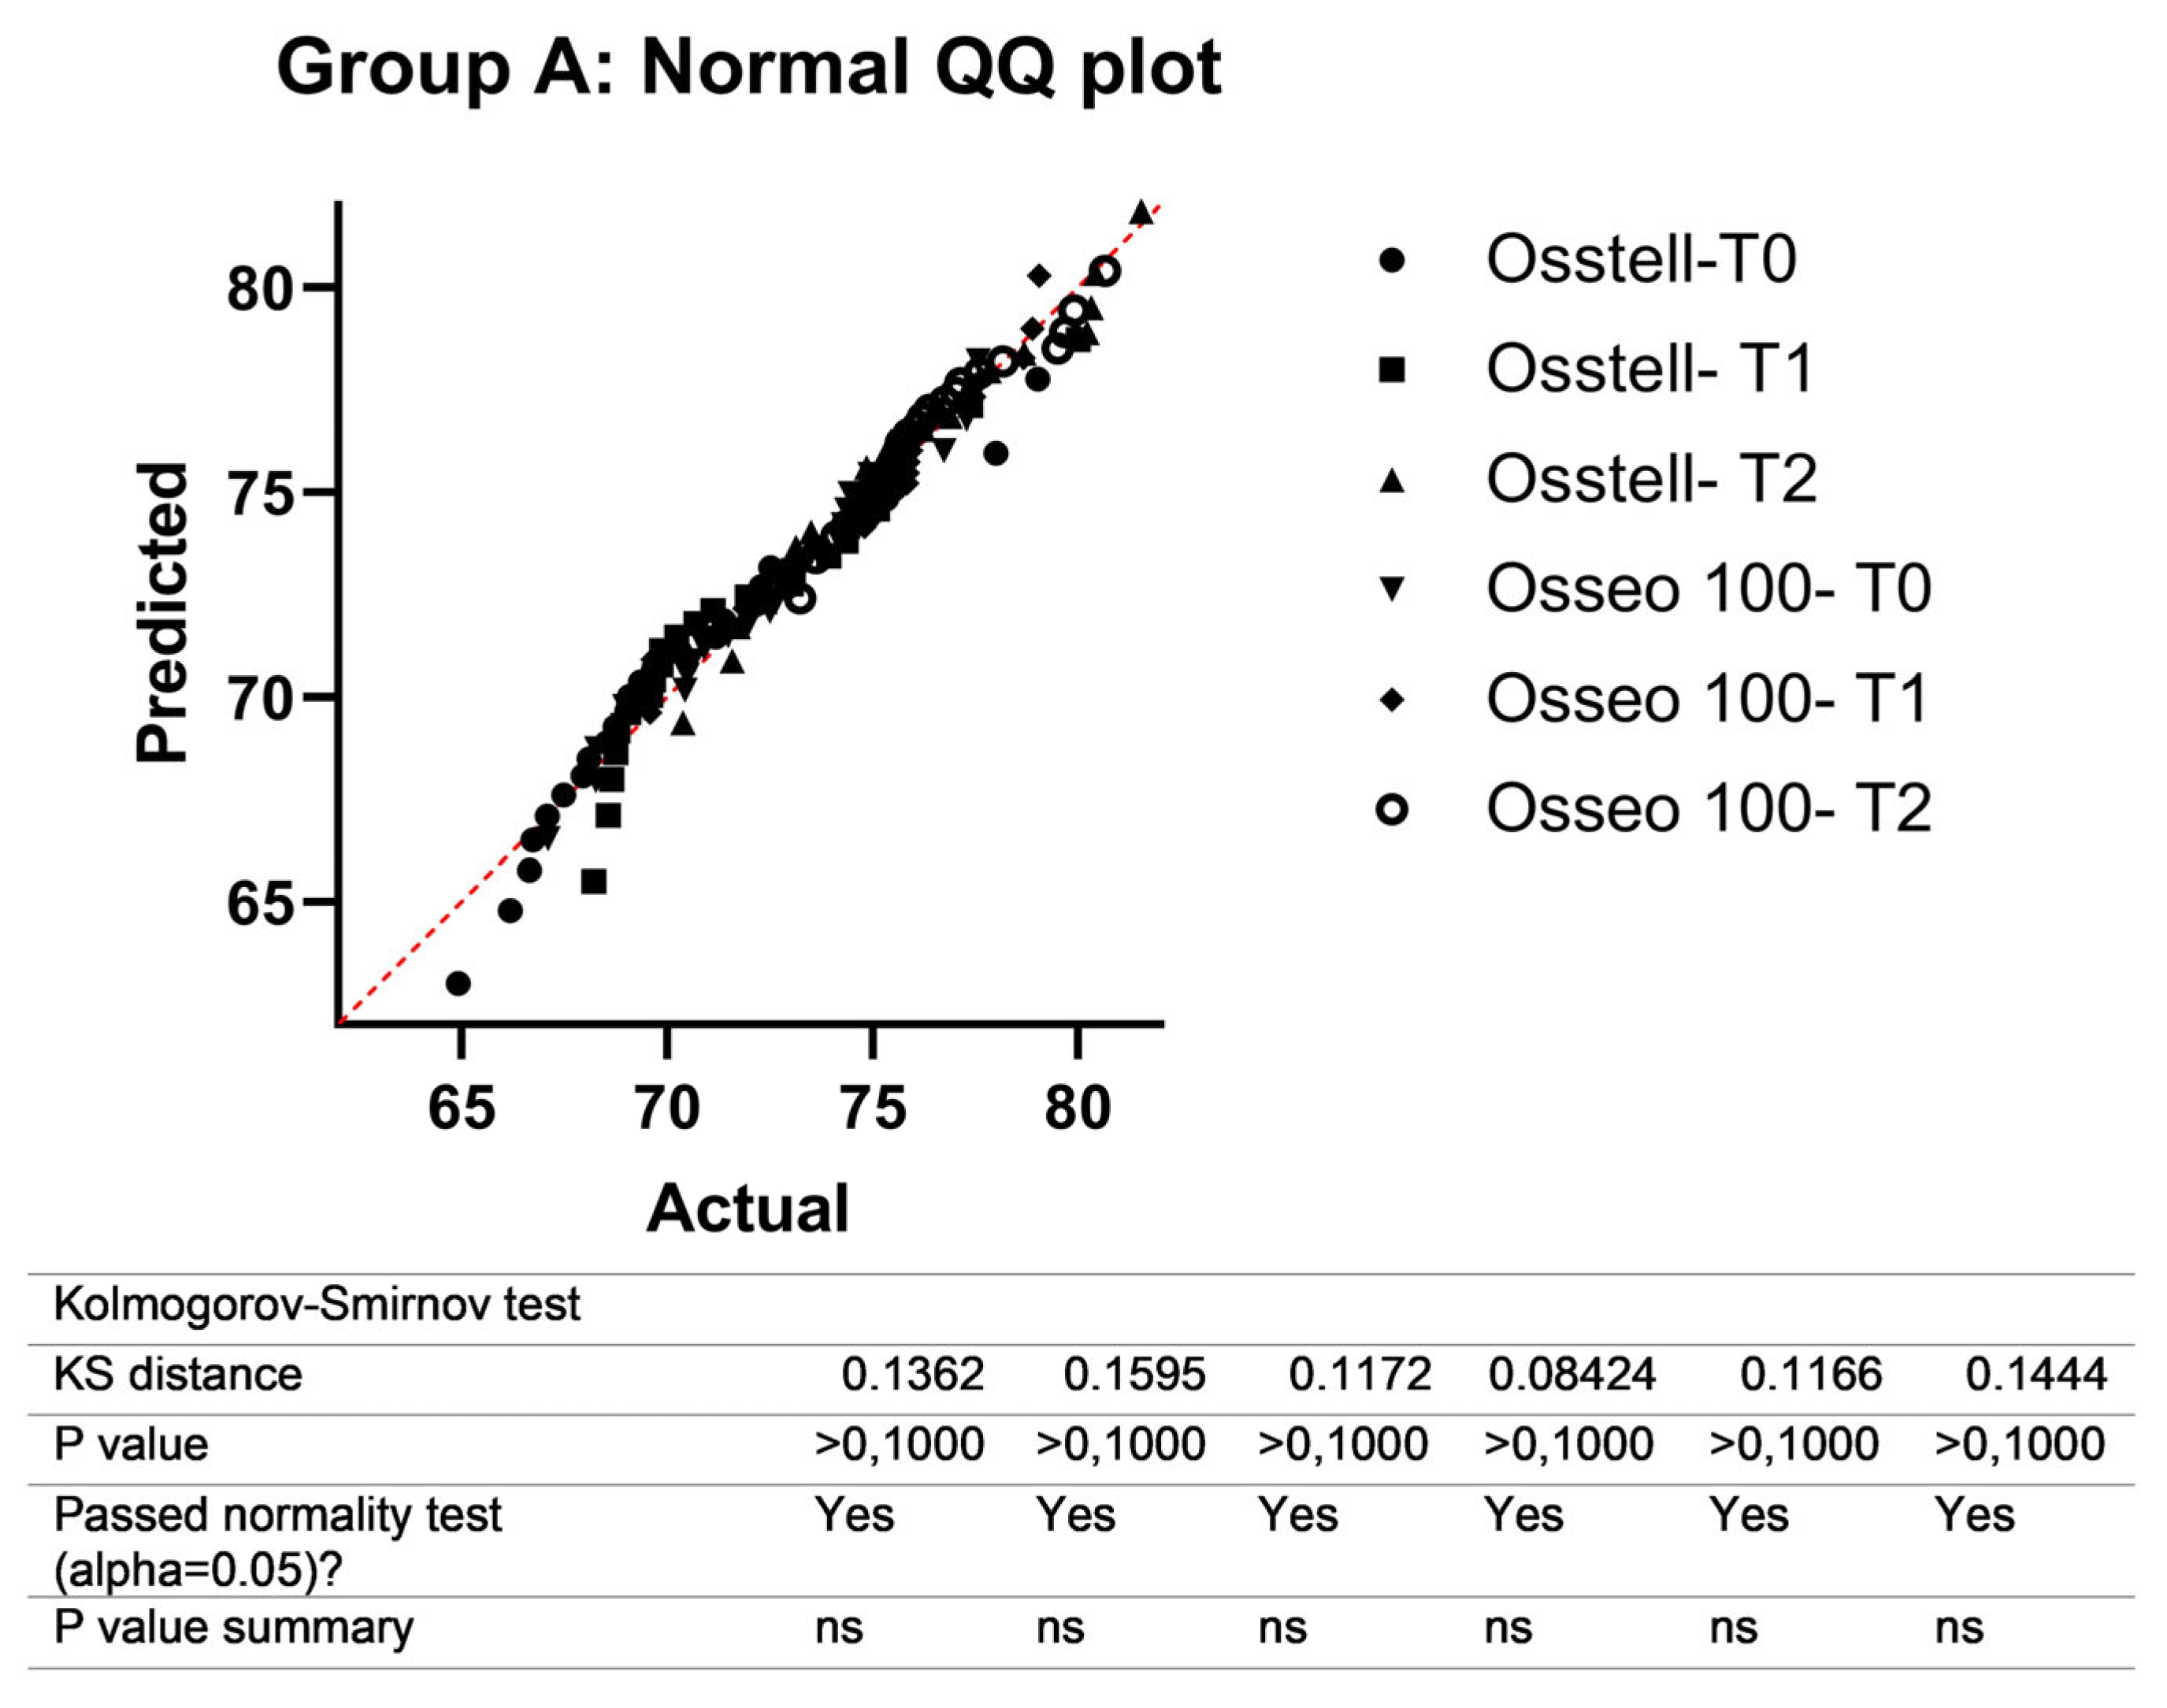
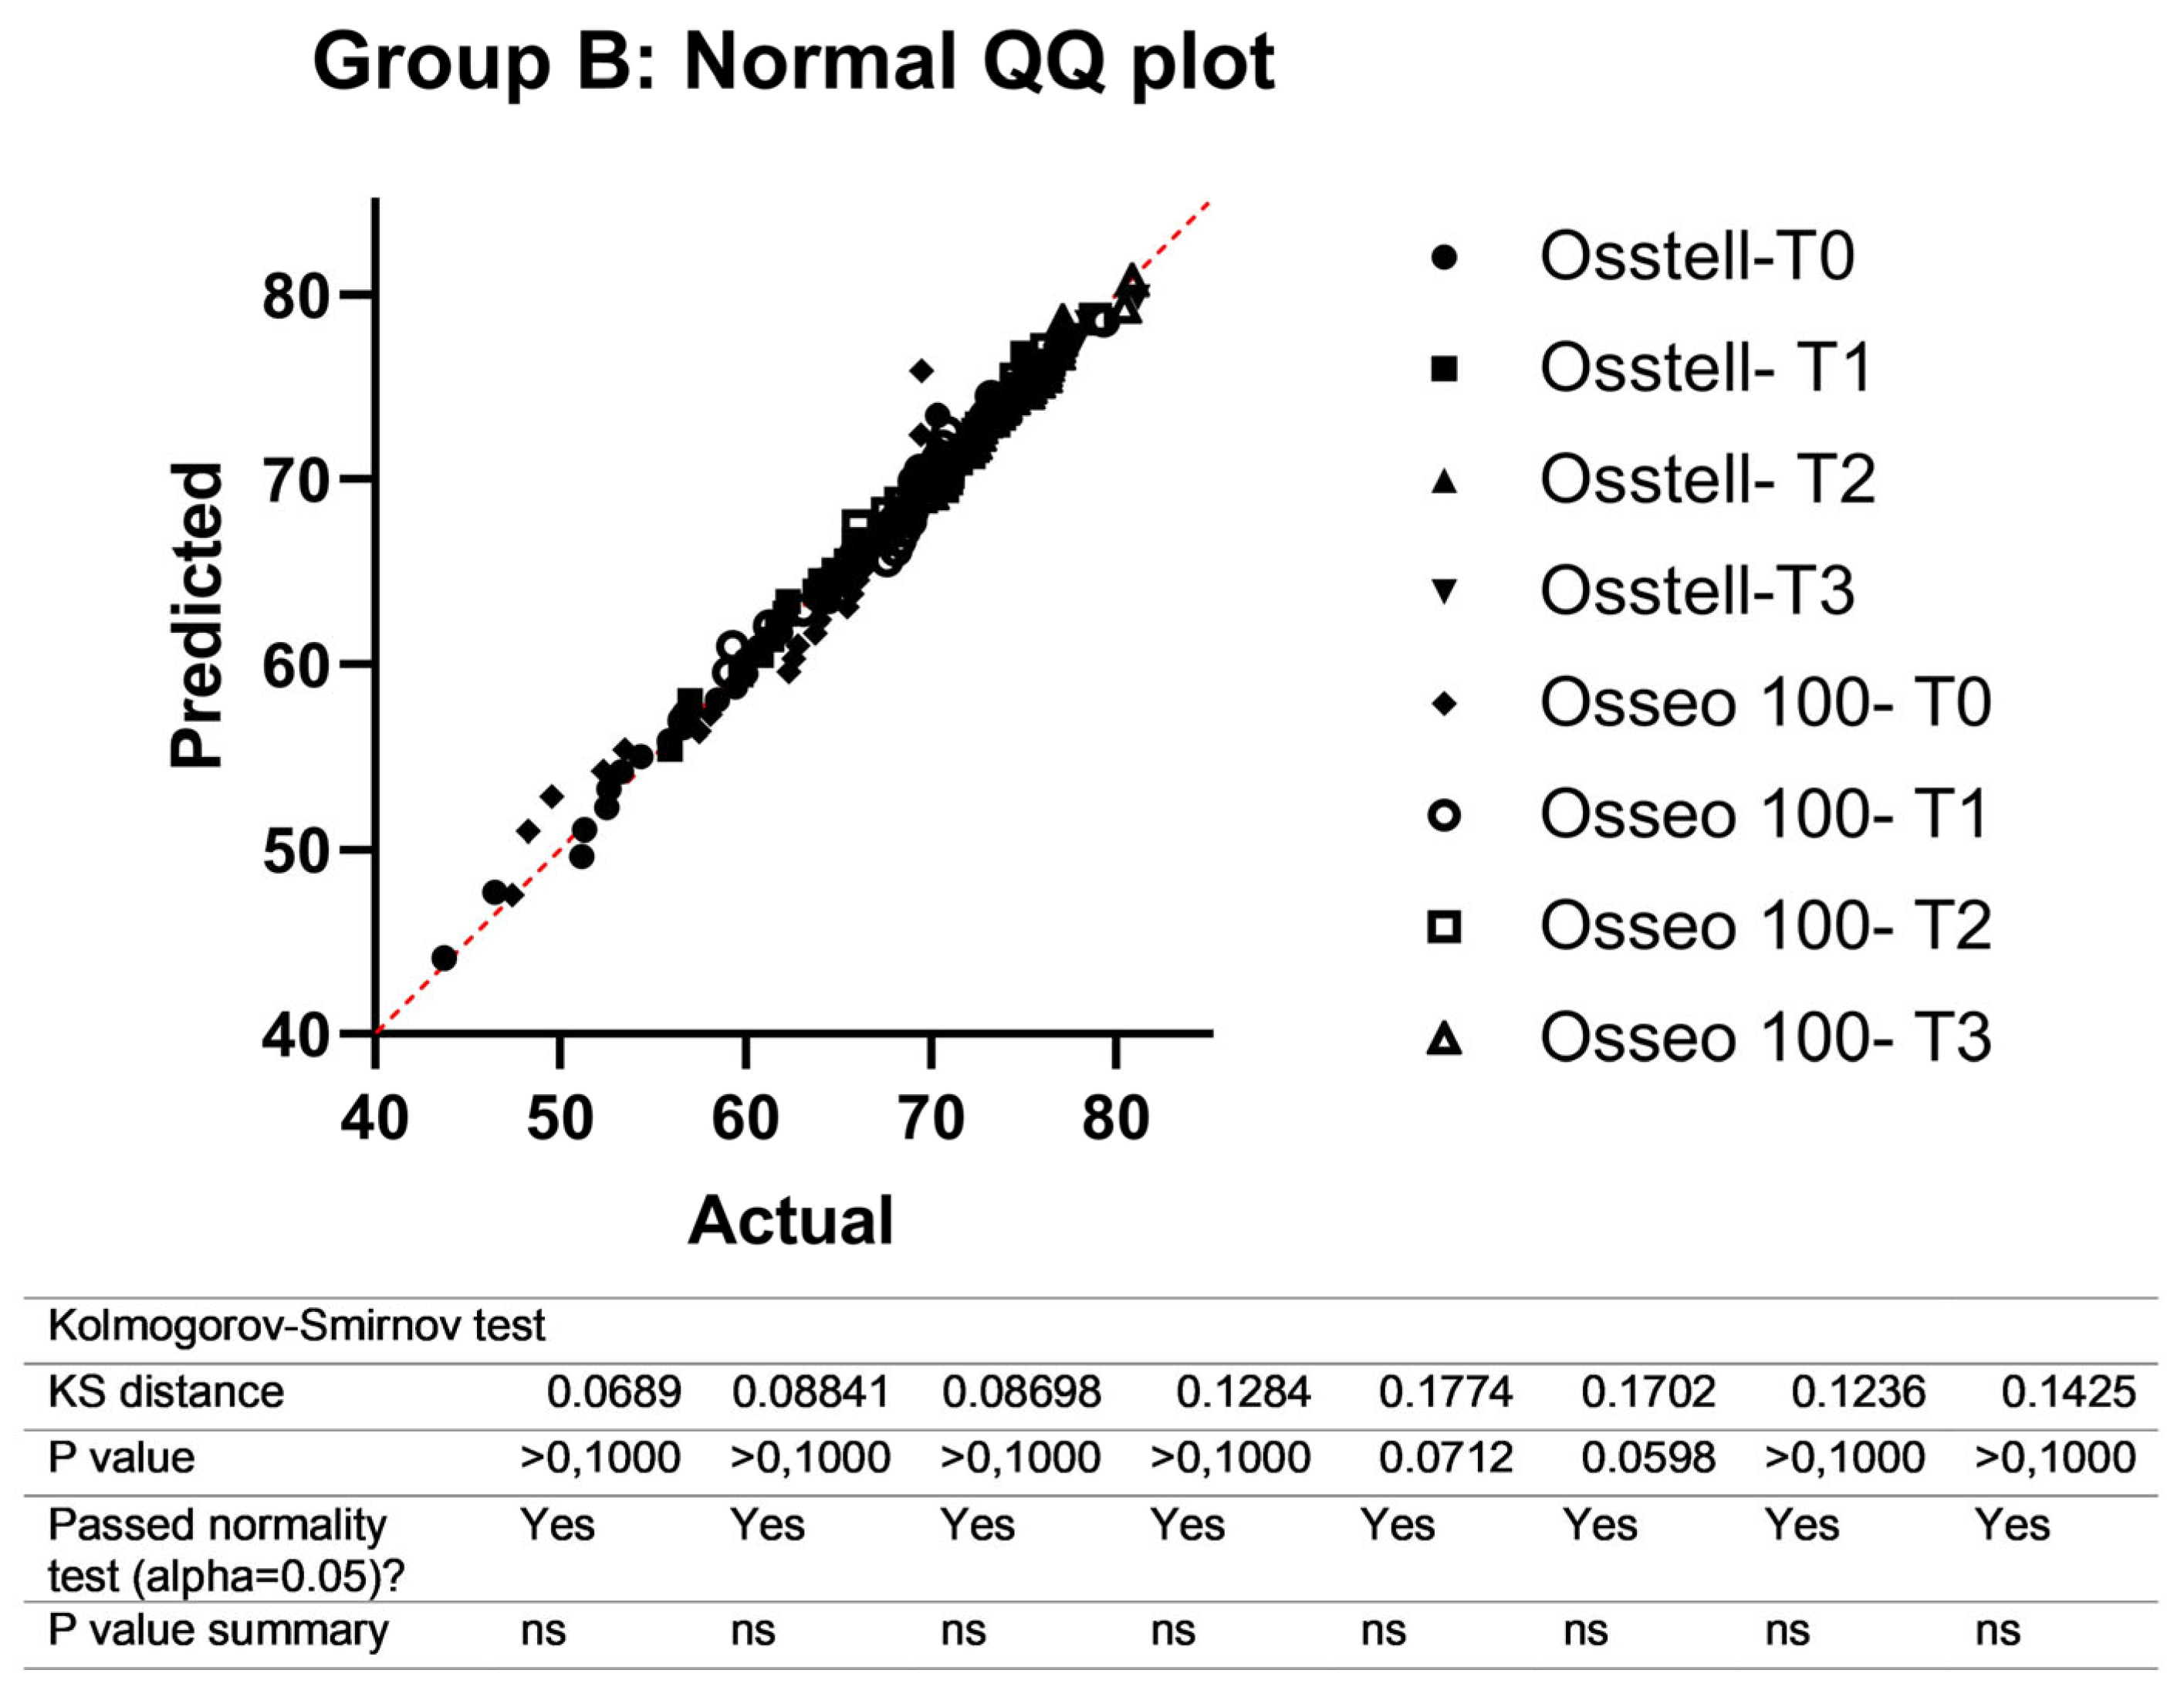
2.7. Statistical Analysis

Descriptive summaries for continuous data are presented as mean ± standard deviation (SD) and as counts and percentages of the study data. We tested for normality of datasets using the Kolmogorov–Smirnov test and QQ-plot. The overall effect of the bone density and the device accuracy according to the rehabilitation restoration time were determined using one-way ANOVA followed by Tukey’s post hoc test. The within-group comparison of ISQ measurements was assessed using the one-way repeated measures ANOVA followed by Tukey’s post hoc test. The significance level was p < 0.05, and all statistical analyses were conducted using STATA/BE 18.0 (StataCrop LLC, College Station, TX, USA) and GraphPad 8 (Prism, San Diego, CA, USA).

3. Results

3.1. Participants and Descriptive Data

A total of 75 patients indicated for dental implant placement were screened to participate in the study, with 25 being excluded since they did not fulfill the inclusion criteria; sixteen were smokers, five had poor oral hygiene, and four had insufficient bone quantity. After excluding ineligible patients, we enrolled 50 patients (16 males and 34 females) aged 23 to 84 years (mean = 55.4 years), who received 80 dental implants. As a result, groups A (D1–D2 bone density) and B (D3–D4 bone density) each had 25 patients with 40 implants (Figure 4).
Table 3 summarizes the included patients’ baseline characteristics and implant settings. All enrolled patients completed the study without any adverse events or post-operative complications; all implants placed were clinically successful, with no implant failure, mobility, suppuration, or peri-implant radiolucency throughout the surgical and prosthetic procedures and follow-up periods.

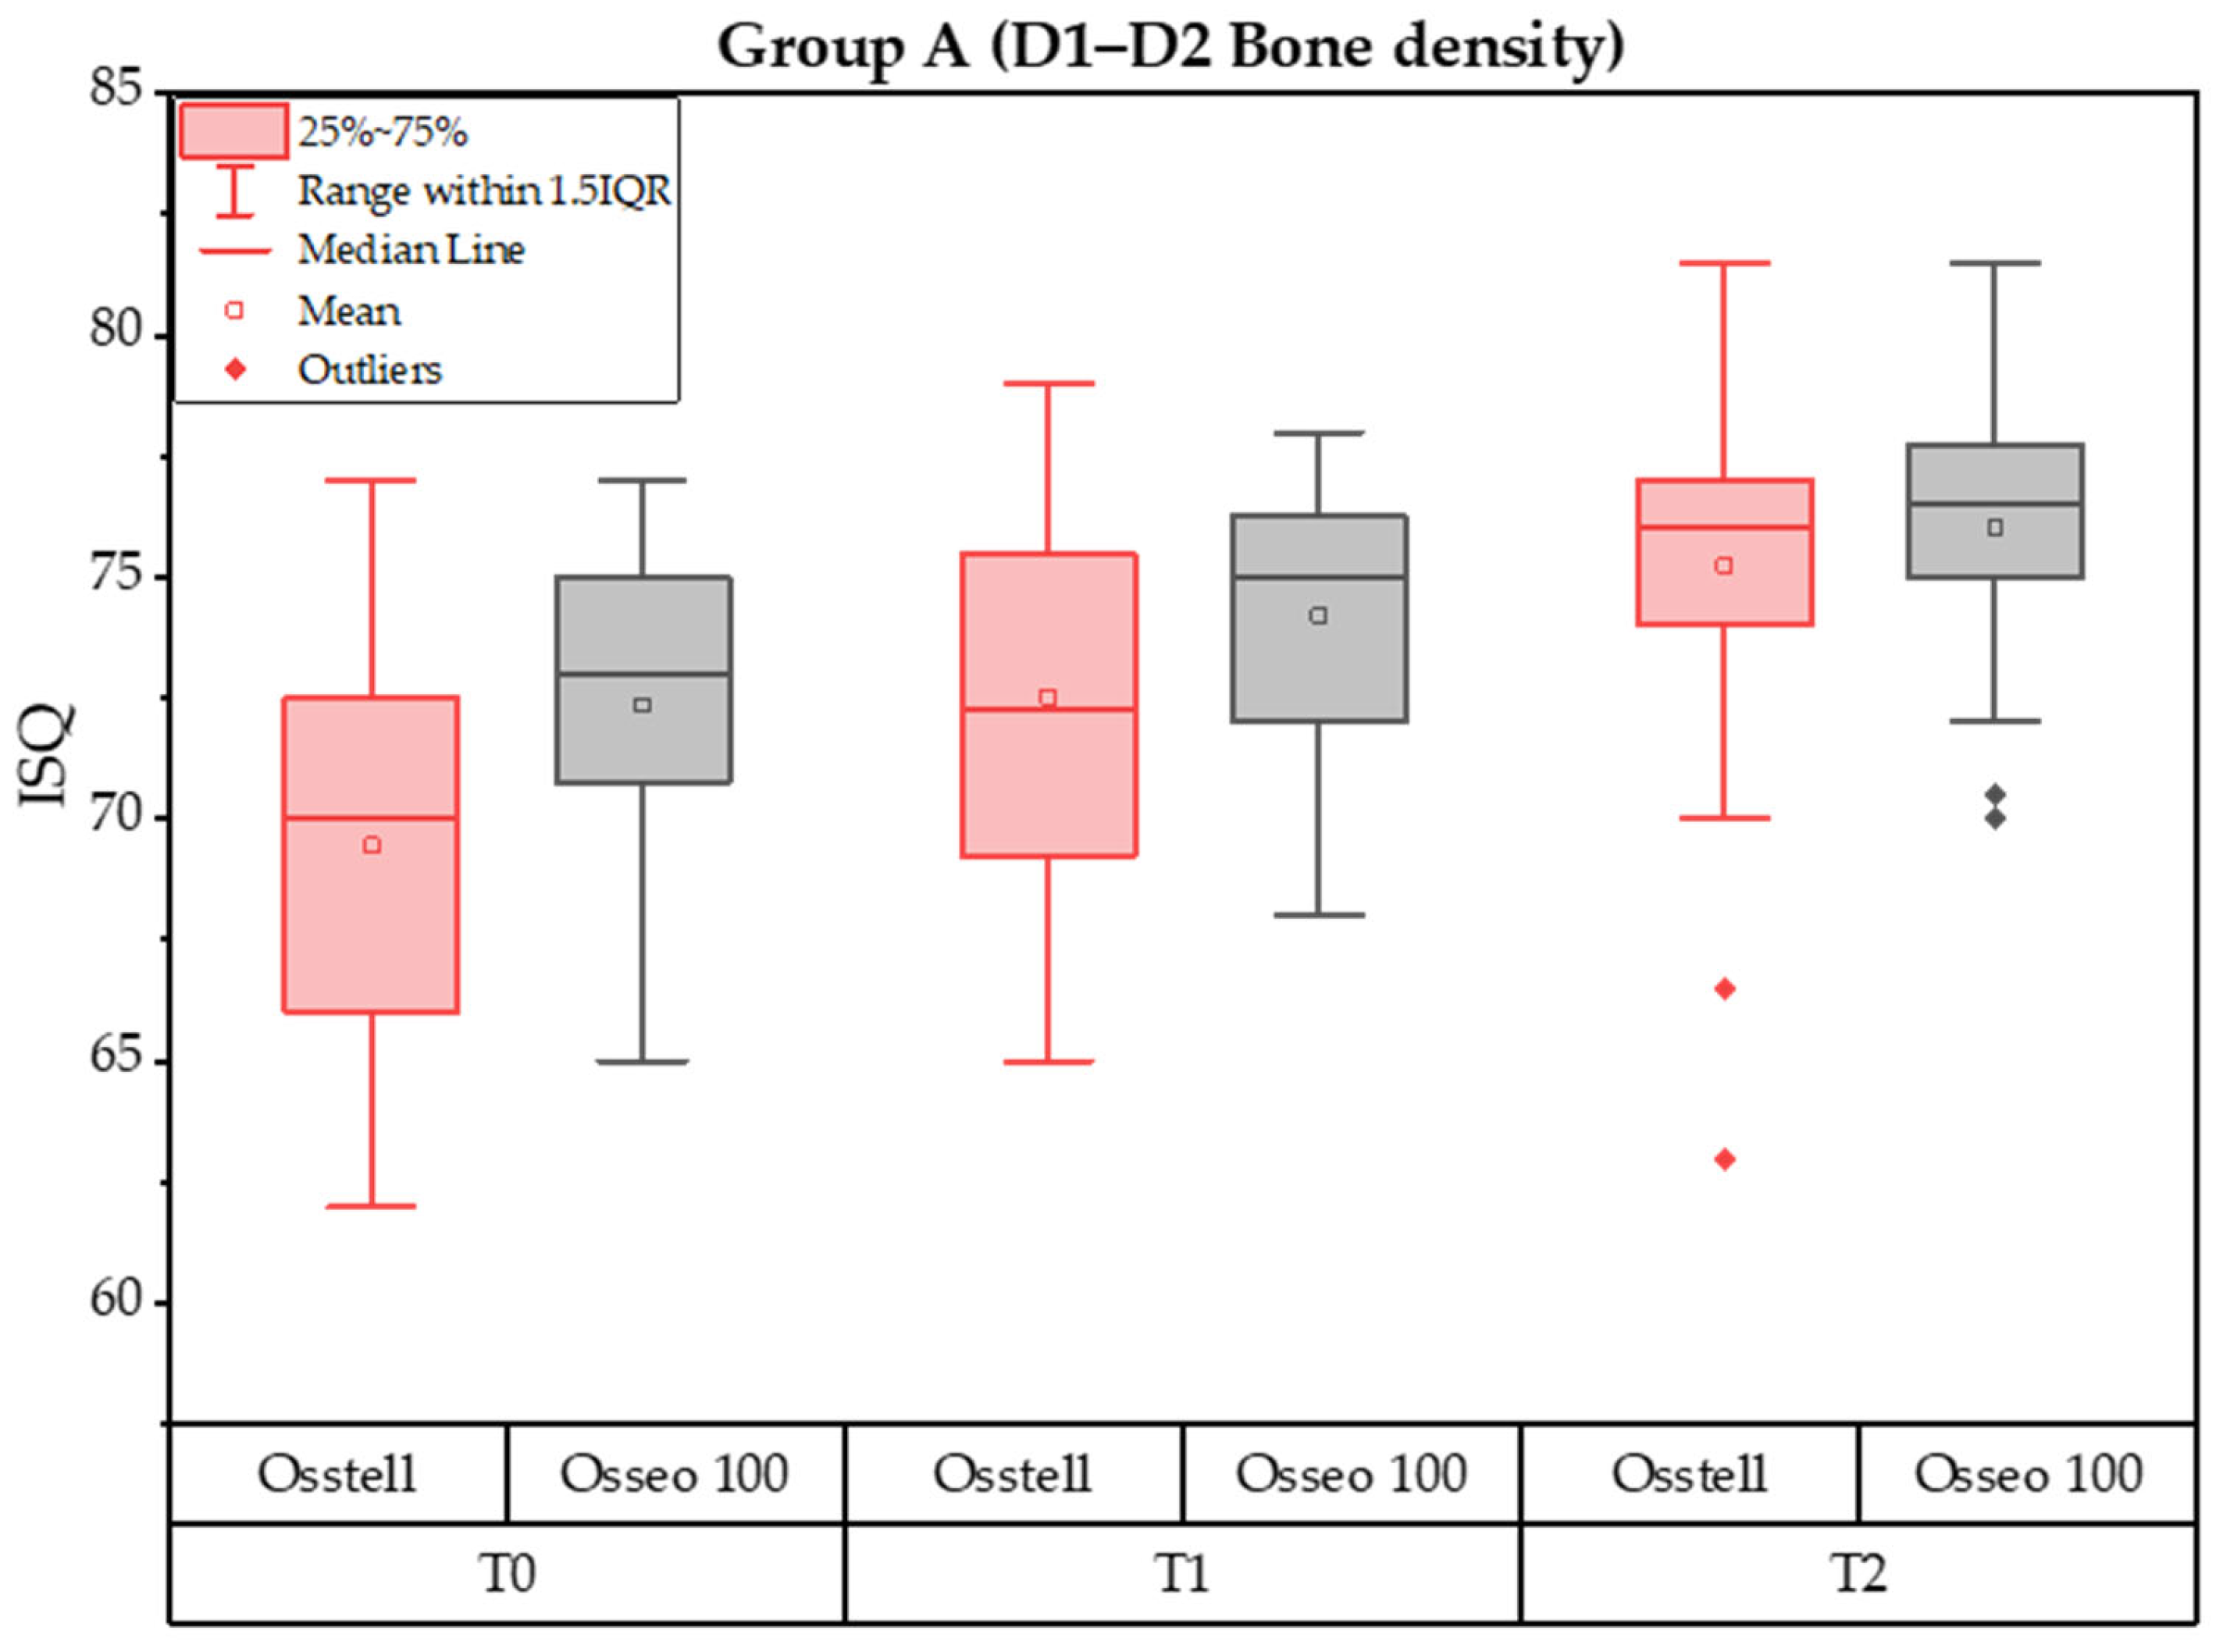
3.2. Group A—Implant Stability Quotient (ISQ)

In group A, Osstell® ISQ measurements at T0, T1, and T2 were 69.46 ± 3.87, 72.51 ± 3.62, and 75.25 ± 3.53, respectively. Temporal comparisons revealed significant differences in T0 vs. T2 (p < 0.0001) and T1 vs. T2 (p = 0.0006). At the same follow-ups, Osseo®100 ISQ measurements were 72.36 ± 3.17, 74.20 ± 2.86, and 76.03 ± 2.33, respectively (Figure 5). Temporal comparisons revealed significant differences in T0 vs. T1 (p = 0.0255) and T2 (p < 0.0001). However the between-group comparisons revealed a significant difference in ISQ values at the T1 follow-up only (Figure 5 and Figure 6 and Table 4).

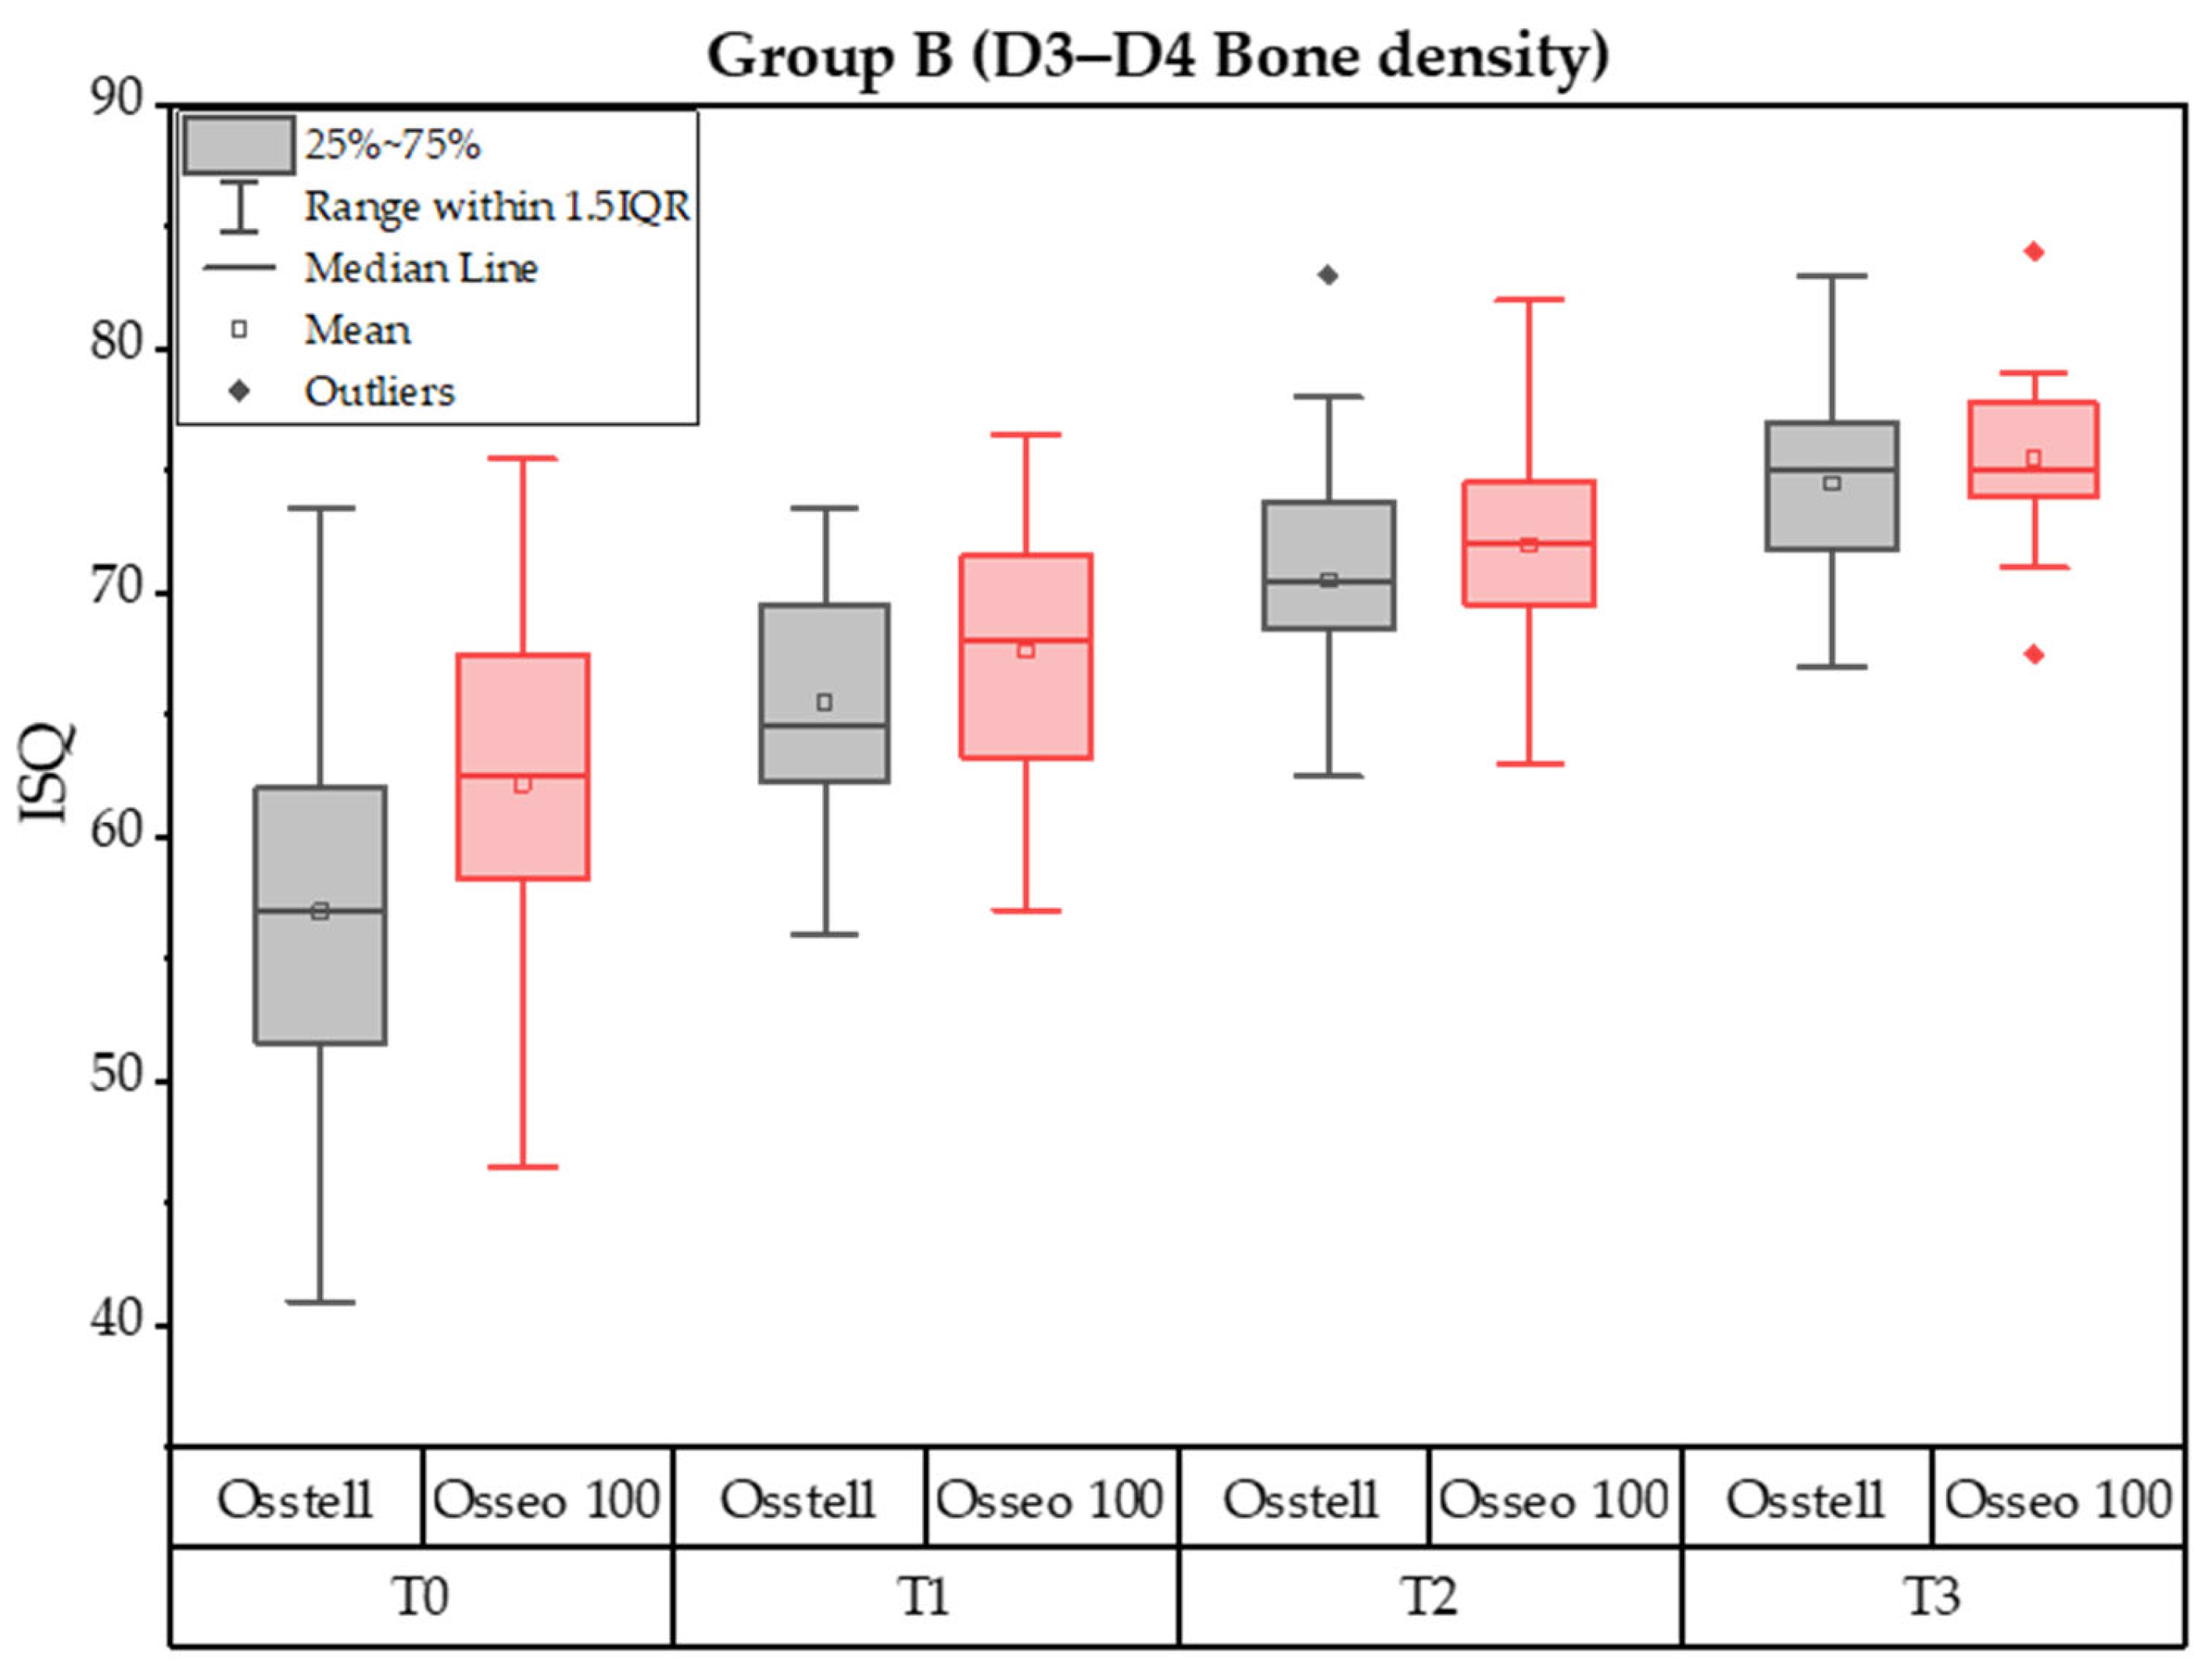
3.3. Group B Implant Stability Quotient

In group B, Osstell® ISQ measurements at T0, T1, and T2 were 56.94 ± 7.53, 65.50 ± 4.71, 70.50 ± 4.24 and 74.50 ± 3.32, respectively. Temporal comparisons revealed significant differences in T0 vs. T1 (p < 0.0001), T2 (p < 0.0001), and T3 (p < 0.0001), and T1 vs. T2 (p = 0.0026) and T3 (p < 0.0001).
At the same follow-ups, Osseo®100 ISQ measurements were 62.16 ± 6.57, 67.64 ± 4.79, 71.98 ± 3.75, and 75.49 ± 2.70, respectively. Temporal comparisons revealed significant differences in T0 vs. T1 (p = 0.0005), T2 (p < 0.0001), T3 (p < 0.0001), and T1 vs. T3 (p < 0.0001).
Between-group comparisons revealed no significant difference in ISQ values at each of the follow-up times (Figure 7 and Figure 8 and Table 5).

4. Discussion

With the growing use of dental implants, measuring implant stability has become vital; there is an urgent need for a reliable method to achieve that, particularly when employing progressive loading protocols for implants placed in fine trabecular bone. As a result, this study aimed to assess whether the ISQ measurements are effective in measuring implant stability and monitoring the osseointegration process using two standard devices most commonly used in clinical practice. Our results revealed significant gradual improvement in groups over the follow-up periods, and there was no significant difference between Osstell and Osseo 100 values at follow-up times except for the T1 follow-up in group A. Temporal comparisons for the two devices revealed significant differences in T0 vs. T2 in group A, and T0 vs. T1 and T0 vs. T2 in group A, and T0 vs. T3 in group B. Additionally, our findings indicated that the overall effect significantly depended on bone density rather than on the measurement device.
Prosthetic restoration of implants with low bone density should be undertaken delicately, employing a progressive prosthetic loading protocol [37]; such protocol features (e.g., under-occlusion, provisional restoration with small dimensions, axial load on the implant, and lever arms absence inside the occlusal table) allow for physiotherapy by exploiting the osteocytes’ ability to adapt bone tissue to the received load. As such, it is critical to use a technology that provides a non-empirical but objective assessment of bone response to the prosthetic load and its degree of calcification around the implant in these situations.
Primary implant stability is influenced by bone density and implant geometries (i.e., the quality and quantity of the local bone, surgical technique used, and implant design); in contrast, secondary implant stability depends on changes that occur during the regenerative phase of bone tissue (i.e., the cellular activity of new formation, resorption, and mineralization around the implant). As such, ITV is an objective measurement; however, it does not allow for assessing implant stability after placing the implant [38].
In contrast, RFA is another objective approach to measuring the practical value of implant stability, as expressed by the ISQ score, as well as given that it is a non-invasive procedure; it can be carried out either after implant insertion or during the healing phase [31]. As a result, it enables the evaluation of implant stability and presumed osseointegration; it is a valuable tool for determining the type and timing of implant loading [28,39], and ISQ is the only approach that allows for monitoring the osseointegration process during the prosthetic loading phases [40].
Several devices have been proposed to measure ISQ; however, in this study, we used two standard devices: Osstell and Osseo. The Osstell® device is manufactured by W&H, Gothenburg, Sweden, which developed the innovative RFA technology and the universal measurement scale (ISQ). Osstell Mentor™ has a magnetic SmartPeg that screws easily inside the implant’s thread; the magnetic SmartPeg will be activated when there are magnetic resonance frequencies released from the probe; thus, the activated peg begins to vibrate, and the magnet induces an electric volt into the probe coil, then the magnetic RFA samples the electric volt, and the values are expressed as ISQ scores ranging from 1 to 100 showed on display [20]. As such, the probe tip should be placed 1–3 mm away from the SmartPeg, at a 90° angle, and 3 mm above the soft tissue to avoid altering the measured values [41], and readings should be taken in two directions (mesiodistal and buccolingual) since bone density is not uniform throughout the implant, with the average of two measurements considered as the ISQ [42].
Osseo®100 device is manufactured by NSK (Tochi, Japan) and functions similarly to the Osstell device. The Osseo 100’s MulTipeg™ probe is made from titanium and has an integrated driver grip on the top; thus, when put into an implant, the MulTipeg™ resonance frequency can vary up to two ISQ units depending on the tightening torque. According to the manufacturers’ instructions, two measurements at 90° perpendicular to each other should be taken to assess implant stability accurately [31].
Based on our findings, there was a difference in ISQ measurements between Osstell and Osseo 100. Such variation in ISQ values could be attributed to the differences in the tool screwed onto the implant fixture (SmartPeg and MulTipeg) in the two devices; Osstell’s SmartPeg is made of an aluminum body and neodymium alloy, while the Osseo 100’s MulTipeg is made of titanium. As such, we believe that the titanium–titanium connection (MulTipeg implant fixture) in the Osseo 100 device is more stable, resulting in less variability in ISQ measurements; additionally, measuring the ISQ in a field without humidity and bleeding contamination is crucial.
Based on our results, the time course of the ISQ measurement in both groups revealed the impact of progressive prosthetic loading in improving the peri-implant bone quality, as there was a statistically significant improvement over the follow-up periods, from T0 to T2 in both groups and from T2 to T3 in group B. Although the implants placed in group B (D3–D4 bone density) had statistically significantly lower ISQ values at T0 than the implants in group A (D1–D2 bone density), they achieved comparable average ISQ values in the period T3 (not statistically significant) to those of group A at T2, which emphasizes the importance of using these devices to optimize the implant prosthetic phase.
Three limitations of this study are recognized. First, the participants were selected based on strict eligibility criteria to ensure a homogeneous population that represents patients in private practices in Palermo, Italy and to maximize the cohort’s internal validity. Second, the patients were recruited using non-probability sampling methods, which limits the generalizability of our results. The third limitation of the study is a marked difference in the distribution of implant sites in group A patients compared to the implant sites of group B patients.

5. Conclusions

Regardless of the devices used, the ISQ measurement effectively monitors healing after implant insertion and allows the prosthetic load to be modulated according to the ISQ value, especially when prosthetizing implants placed in fine trabecular bone (D4 or regenerated bone).

Author Contributions

Conceptualization, G.B.(Giuseppe Bavetta), G.B.(Giorgio Bavetta) and A.S.; methodology, G.B. (Giuseppe Bavetta) and S.A.G.; software, G.B. (Giuseppe Bavetta), C.P., G.B. (Giorgio Bavetta) and V.R.; validation, A.C., F.S., A.G.A.K. and A.S.; formal analysis, A.G.A.K., S.A.G., S.R.T. and A.S.; investigation, G.B. (Giuseppe Bavetta) and G.B.; resources, G.B. (Giuseppe Bavetta); data curation, V.R., A.C. and F.S.; writing—original draft preparation, G.B. (Giorgio Bavetta), C.P., G.B. (Giorgio Bavetta), V.R. and A.C.; writing—review and editing, S.A.G., S.R.T. and A.S.; visualization, S.A.G., S.R.T. and A.S.; supervision, V.R., A.C., F.S. and A.G.A.K.; project administration, G.B. (Giorgio Bavetta) All authors have read and agreed to the published version of the manuscript.

Funding

This research received no external funding.

Institutional Review Board Statement

This study was ethically approved by the Internal Review Board of the Department of Innovative Technologies in Medicine and Dentistry, University of Chieti–Pescara, Italy (ID: CRRM;2023;08;02;01), and all procedures performed in studies involving human participants followed the ethical standards of the institutional and/or national research committee and with the 1964 Helsinki Declaration and its later amendments or comparable ethical standards.

Informed Consent Statement

Informed consent was obtained from all subjects involved in the study.

Data Availability Statement

All experimental data to support the findings of this study are available by contacting the corresponding author upon request.

Conflicts of Interest

The authors declare no conflicts of interest.

References

  1. Scarano, A.; Conte, E.; Mastrangelo, F.; Greco Lucchina, A.; Lorusso, F. Narrow Single Tooth Implants for Congenitally Missing Maxillary Lateral Incisors: A 5-Year Follow-Up. J. Biol. Regul. Homeost. Agents 2019, 33 (Suppl. S2), 69–76, DENTAL SUPPLEMENT. [Google Scholar] [PubMed]
  2. Cecchetti, F.; Di Girolamo, M.; Spuntarelli, M.; Baggi, L.; Ottria, L.; Mazza, D. Sub-crestal implants with platform-switching and one time abutment. Eur. J. Muscoloskel. Dis. 2023, 12, 133–137. [Google Scholar]
  3. Brånemark, P.I. Osseointegration and Its Experimental Background. J. Prosthet. Dent. 1983, 50, 399–410. [Google Scholar] [CrossRef] [PubMed]
  4. Albrektsson, T.; Brånemark, P.I.; Hansson, H.A.; Lindström, J. Osseointegrated Titanium Implants. Requirements for Ensuring a Long-Lasting, Direct Bone-to-Implant Anchorage in Man. Acta Orthop. Scand. 1981, 52, 155–170. [Google Scholar] [CrossRef] [PubMed]
  5. Adell, R.; Lekholm, U.; Rockler, B.; Brånemark, P.I. A 15-Year Study of Osseointegrated Implants in the Treatment of the Edentulous Jaw. Int. J. Oral Surg. 1981, 10, 387–416. [Google Scholar] [CrossRef] [PubMed]
  6. Misch, C.E. Implantologia Contemporanea, 3rd ed.; Elsevier Masson: Amsterdam, The Netherlands, 2009; ISBN 978-88-214-3113-5. [Google Scholar]
  7. Raghavendra, S.; Wood, M.C.; Taylor, T.D. Early Wound Healing around Endosseous Implants: A Review of the Literature. Int. J. Oral Maxillofac. Implants 2005, 20, 425–431. [Google Scholar]
  8. Szmukler-Moncler, S.; Salama, H.; Reingewirtz, Y.; Dubruille, J.H. Timing of Loading and Effect of Micromotion on Bone-Dental Implant Interface: Review of Experimental Literature. J. Biomed. Mater. Res. 1998, 43, 192–203. [Google Scholar] [CrossRef]
  9. Tealdo, T.; Gelpi, F.; Grivetto, F.; Vallerga, E.; Tfaily, A.; De Santis, D.; Alberti, C.; Bevilacqua, M. A Retrospective Multicentric Study Of 56 Patients Treated With 92 Pterygoid Implants For Partial/Full Arch Implant Supported Fixed Rehabilitation: Implant And Prosthesis Success Rate. Eur. J. Musculoskelet. Dis. 2023, 12, 119–126. [Google Scholar]
  10. Greco, G.; Borgia, R.; Casto, C. Immediate Provisional Prosthesis: A possible reality in the office. Technical Notes. Eur. J. Musculoskelet. Dis. 2023, 12, 7–11. [Google Scholar]
  11. Cameron, H.U.; Pilliar, R.M.; MacNab, I. The Effect of Movement on the Bonding of Porous Metal to Bone. J. Biomed. Mater. Res. 1973, 7, 301–311. [Google Scholar] [CrossRef] [PubMed]
  12. Brunski, J.B. In Vivo Bone Response to Biomechanical Loading at the Bone/Dental-Implant Interface. Adv. Dent. Res. 1999, 13, 99–119. [Google Scholar] [CrossRef] [PubMed]
  13. Meredith, N. Assessment of Implant Stability as a Prognostic Determinant. Int. J. Prosthodont. 1998, 11, 491–501. [Google Scholar] [PubMed]
  14. Tarnow, D.P.; Emtiaz, S.; Classi, A. Immediate Loading of Threaded Implants at Stage 1 Surgery in Edentulous Arches: Ten Consecutive Case Reports with 1- to 5-Year Data. Int. J. Oral Maxillofac. Implants 1997, 12, 319–324. [Google Scholar] [PubMed]
  15. Atsumi, M.; Park, S.-H.; Wang, H.-L. Methods Used to Assess Implant Stability: Current Status. Int. J. Oral Maxillofac. Implants 2007, 22, 743–754. [Google Scholar]
  16. Chopra, A.; Mhapuskar, A.A.; Marathe, S.; Nisa, S.U.; Thopte, S.; Saddiwal, R. Evaluation of Osseointegration in Implants Using Digital Orthopantomogram and Cone Beam Computed Tomography. J. Contemp. Dent. Pract. 2016, 17, 953–957. [Google Scholar] [CrossRef] [PubMed]
  17. Semenzin Rodrigues, A.; de Moraes Melo Neto, C.L.; Santos Januzzi, M.; Dos Santos, D.M.; Goiato, M.C. Correlation between Periotest Value and Implant Stability Quotient: A Systematic Review. Biomed. Tech. 2024, 69, 1–10. [Google Scholar] [CrossRef] [PubMed]
  18. Swami, V.; Vijayaraghavan, V.; Swami, V. Current Trends to Measure Implant Stability. J. Indian Prosthodont. Soc. 2016, 16, 124–130. [Google Scholar] [CrossRef] [PubMed]
  19. Simeone, S.G.; Rios, M.; Simonpietri, J. “Reverse Torque of 30 Ncm Applied to Dental Implants as Test for Osseointegration”—A Human Observational Study. Int. J. Implant Dent. 2016, 2, 26. [Google Scholar] [CrossRef] [PubMed]
  20. Satwalekar, P.; Nalla, S.; Reddy, R.; Chowdary, S.G. Clinical Evaluation of Osseointegration Using Resonance Frequency Analysis. J. Indian Prosthodont. Soc. 2015, 15, 192–199. [Google Scholar] [CrossRef] [PubMed]
  21. Tumedei, M.; Piattelli, A.; Degidi, M.; Mangano, C.; Iezzi, G. A Narrative Review of the Histological and Histomorphometrical Evaluation of the Peri-Implant Bone in Loaded and Unloaded Dental Implants. A 30-Year Experience (1988-2018). Int. J. Environ. Res. Public Health 2020, 17, 2088. [Google Scholar] [CrossRef] [PubMed]
  22. Gehrke, S.A.; Júnior, J.A.; Treichel, T.L.E.; da Costa, E.M.; Scarano, A.; Júnior, N.D.B.; Fernandes, G.V.O.; De Aza, P.N. Implant Stability and Histomorphometric Analysis Comparing Two Different Implant Macrogeometries Placed in Fresh Sockets: An Experimental Study in Sheep. Int. J. Oral Maxillofac. Implants 2024. [Google Scholar] [CrossRef] [PubMed]
  23. Nandal, S.; Ghalaut, P.; Shekhawat, H. A Radiological Evaluation of Marginal Bone around Dental Implants: An in-Vivo Study. Natl. J. Maxillofac. Surg. 2014, 5, 126–137. [Google Scholar] [CrossRef] [PubMed]
  24. Scarano, A.; Lorusso, F.; Staiti, G.; Sinjari, B.; Tampieri, A.; Mortellaro, C. Sinus Augmentation with Biomimetic Nanostructured Matrix: Tomographic, Radiological, Histological and Histomorphometrical Results after 6 Months in Humans. Front. Physiol. 2017, 8, 565. [Google Scholar] [CrossRef] [PubMed]
  25. Caulier, H.; Naert, I.; Kalk, W.; Jansen, J.A. The Relationship of Some Histologic Parameters, Radiographic Evaluations, and Periotest Measurements of Oral Implants: An Experimental Animal Study. Int. J. Oral Maxillofac. Implants 1997, 12, 380–386. [Google Scholar]
  26. Brunski, J.B.; Puleo, D.A.; Nanci, A. Biomaterials and Biomechanics of Oral and Maxillofacial Implants: Current Status and Future Developments. Int. J. Oral Maxillofac. Implants 2000, 15, 15–46. [Google Scholar]
  27. Di Stefano, D.A.; Arosio, P.; Perrotti, V.; Iezzi, G.; Scarano, A.; Piattelli, A. Correlation between Implant Geometry, Bone Density, and the Insertion Torque/Depth Integral: A Study on Bovine Ribs. Dent. J. 2019, 7, 25. [Google Scholar] [CrossRef] [PubMed]
  28. Bavetta, G.; Bavetta, G.; Randazzo, V.; Cavataio, A.; Paderni, C.; Grassia, V.; Dipalma, G.; Gargiulo Isacco, C.; Scarano, A.; De Vito, D.; et al. A Retrospective Study on Insertion Torque and Implant Stability Quotient (ISQ) as Stability Parameters for Immediate Loading of Implants in Fresh Extraction Sockets. Biomed. Res. Int. 2019, 2019, 9720419. [Google Scholar] [CrossRef]
  29. Greenstein, G.; Cavallaro, J. Implant Insertion Torque: Its Role in Achieving Primary Stability of Restorable Dental Implants. Compend. Contin. Educ. Dent. 2017, 38, 88–95, quiz 96. [Google Scholar] [PubMed]
  30. Johansson, C.; Albrektsson, T. Integration of Screw Implants in the Rabbit: A 1-Year Follow-up of Removal Torque of Titanium Implants. Int. J. Oral Maxillofac. Implants 1987, 2, 69–75. [Google Scholar]
  31. Sennerby, L.; Meredith, N. Implant Stability Measurements Using Resonance Frequency Analysis: Biological and Biomechanical Aspects and Clinical Implications. Periodontol. 2000 2008, 47, 51–66. [Google Scholar] [CrossRef]
  32. Scarano, A.; Degidi, M.; Iezzi, G.; Petrone, G.; Piattelli, A. Correlation between Implant Stability Quotient and Bone-Implant Contact: A Retrospective Histological and Histomorphometrical Study of Seven Titanium Implants Retrieved from Humans. Clin. Implant Dent. Relat. Res. 2006, 8, 218–222. [Google Scholar] [CrossRef] [PubMed]
  33. Sullivan, D.Y.; Sherwood, R.L.; Collins, T.A.; Krogh, P.H. The Reverse-Torque Test: A Clinical Report. Int. J. Oral Maxillofac. Implants 1996, 11, 179–185. [Google Scholar]
  34. von Elm, E.; Altman, D.G.; Egger, M.; Pocock, S.J.; Gøtzsche, P.C.; Vandenbroucke, J.P. STROBE Initiative the Strengthening the Reporting of Observational Studies in Epidemiology (STROBE) Statement: Guidelines for Reporting Observational Studies. Lancet 2007, 370, 1453–1457. [Google Scholar] [CrossRef] [PubMed]
  35. World Health Organization. Handbook for Good Clinical Research Practice (GCP): Guidance for Implementation; World Health Organization: Geneva, Switzerland, 2005. [Google Scholar]
  36. Scarano, A.; Carinci, F.; Quaranta, A.; Iezzi, G.; Piattelli, M.; Piattelli, A. Correlation between Implant Stability Quotient (ISQ) with Clinical and Histological Aspects of Dental Implants Removed for Mobility. Int. J. Immunopathol. Pharmacol. 2007, 20, 33–36. [Google Scholar] [CrossRef] [PubMed]
  37. Misch, C.E. Progressive Loading of Bone with Implant Prostheses. J. Dent. Symp. 1993, 1, 50–53. [Google Scholar] [PubMed]
  38. Lages, F.S.; Douglas-de Oliveira, D.W.; Costa, F.O. Relationship between Implant Stability Measurements Obtained by Insertion Torque and Resonance Frequency Analysis: A Systematic Review. Clin. Implant Dent. Relat. Res. 2018, 20, 26–33. [Google Scholar] [CrossRef] [PubMed]
  39. Qi, M.; Deng, S.; Tan, Z. Clinical Study to Assess Influence of Immediate Provisionalization and Various Implant Morphologies on Implant Stability: A Prospective Clinical Study. Front. Surg. 2022, 9, 1095741. [Google Scholar] [CrossRef] [PubMed]
  40. Huang, H.-M.; Chiu, C.-L.; Yeh, C.-Y.; Lin, C.-T.; Lin, L.-H.; Lee, S.-Y. Early Detection of Implant Healing Process Using Resonance Frequency Analysis. Clin. Oral Implants Res. 2003, 14, 437–443. [Google Scholar] [CrossRef] [PubMed]
  41. Sim, C.P.C.; Lang, N.P. Factors Influencing Resonance Frequency Analysis Assessed by Osstell Mentor during Implant Tissue Integration: I. Instrument Positioning, Bone Structure, Implant Length. Clin. Oral Implants Res. 2010, 21, 598–604. [Google Scholar] [CrossRef] [PubMed]
  42. Park, J.-C.; Kim, H.-D.; Kim, S.-M.; Kim, M.-J.; Lee, J.-H. A Comparison of Implant Stability Quotients Measured Using Magnetic Resonance Frequency Analysis from Two Directions: A Prospective Clinical Study during the Initial Healing Period. Clin. Oral Implants Res. 2010, 21, 591–597. [Google Scholar] [CrossRef] [PubMed]
Figure 1. Graphical curve illustrates implant stability as a function of time immediately after placement, with primary (mechanical) implant stability decreasing in favor of biological stability (osteointegration).
Prosthesis 06 00027 g001
Figure 2. Graphical representation of the sample size analysis used for the present study.
Prosthesis 06 00027 g002
Figure 4. Flow diagram of the study design.
Prosthesis 06 00027 g004
Figure 5. Box plots illustrate the two devices’ ISQ measurements during all follow-up periods for group A patients.
Prosthesis 06 00027 g005
Figure 6. Sheet of QQ-plot distribution and normality test output of the group A patients.
Prosthesis 06 00027 g006
Figure 7. Box plots illustrate the two devices’ ISQ measurements during all follow-up periods for group B patients.
Prosthesis 06 00027 g007
Figure 8. Sheet of QQ plot distribution and normality test output of the group B patients.
Prosthesis 06 00027 g008
Table 1. Summary of currently available methods for assessing the implant stability at pre-, intra-, and post-surgical stages, with advantages and disadvantages for each method.
MethodEvaluationPresurgeryIntrasurgeryPostsurgeryAdvantagesDisadvantagesObjectivityRef.
Non-invasive methods
Percussion testPercussion with the tool handleQualitative: resonance of the implant in the bone, clear sound, gloomy soundNot possibleCertain reliabilityCertain reliabilitySimple and not expensiveSubjective, poor sensitivityDoubtful reliability[6]
Radiographic analysisEndoral RXQuantitative and qualitative: radiating transparency along the bone-implant surface and marginal bone levelCertain reliabilityCertain reliabilityCertain reliabilitySimple and not expensiveTwo-dimensional examination, not standardizable, not for short follow-ups (<6 weeks)Not evaluable[16]
PeriotestElectronic pulse sequenceQuantitative: damping of the periodontium and tooth mobilityCertain reliabilityCertain reliabilityCertain reliability Subjective, poor sensitivity, and values are not significantCertain reliability, but more information is needed[17]
Measurement of shear strength (Osseo-Care)Surgical, for example, by means of a tapQuantitative: cut resistance of the implant site and bone densityCertain reliabilityHighest reliabilityCertain reliability Limited to surgeryCertain reliability[18]
Reverse torque testReverse torque test of 20 N/cm of the exposed implantQuantitative: unscrewing the implantNot possibleNot possibleCertain reliability Bone deformation, provocation of failures, false positives on implants longer than 13 mmCertain reliability[19]
RFAMagnetic pulses picked up by SmartPegQuantitative and qualitative: evaluation of the degree of bone-implant contact on a scale from 1 to 100Not possibleHighest reliabilityHighest reliabilityEvaluation of immediate loading and evaluation of the increase in the bone-implant contact for final prosthetics Certain reliability, but more information is needed[20]
Invasive methods
Histologic analysisSampling using a milling techniqueBone quantity and bone quality (histomorphometry)Doubtful reliabilityDoubtful reliabilityDoubtful reliabilityHigh qualityInvasiveHighest reliability[21]
Removal torque measurementDisarming test, manual/electronic force application on the implantQuantitative: force necessary to separate bone-implant unitNot possibleDoubtful reliabilityCertain reliability Invasive, depends on the implant geometryCertain reliability[22]
Table 2. Summary of the sample size analysis.
Power Analysis Summary
Options:A.R.E. method
Analysis:Compute required sample size
Input:Tail(s)=One
Effect size d=0.65
α err prob=0.05
Power (1-β err prob)=0.7
Allocation ratio N2/N1=1
Noncentrality parameter δ=2
Output:Critical t=2
Df=44
Sample size group 1=23
Sample size group 2=23
Total sample size=46
Actual power=1
Tail(s)=One
Table 3. Baseline characteristics of the patients and implant site.
CharacteristicGroup A
(D1–D2 Bone Density)
Group B
(D3–D4 Bone Density)
Patients
no.2525
Implants
no.4040
Age—(years)
range23–8429–81
mean (SD)54.96 (15.17)55.92 (12.70)
Sex—no. (%)
Male9 (36)7 (28%)
Female16 (64)18 (72%)
Implant Position—no. (%)
Maxillary anteriors0 (0)1 (2.5)
Maxillary premolars2 (5)31 (77.5)
Maxillary molars0 (0)5 (12.5)
Mandibular premolars18 (45)1 (2.5)
Mandibular molars20 (50)2 (5)
Diameter of implants (mean ± SD)3.717 ± 0.013.765 ± 0.04
Length of implants (mean ± SD)10.35 ± 1.5410.388 ± 0.0922
Table 4. Results of ANOVA within the class comparison of ISQ measurements of group A.
GROUP A
ANOVA Tukey’s Comparisons Test
Mean Diff.95% CI of Diff.Significant?Adjusted p Value
Osstell-T0 vs. Osstell-T1−1.736−4.119 to 0.6473No0.2911A–B
Osstell-T0 vs. Osstell-T2−5.233−7.617 to −2.850Yes<0.0001A–C
Osstell-T0 vs. Osseo 100-T0−1.998−4.381 to 0.3856No0.1559A–D
Osstell-T1 vs. Osstell-T2−3.497−5.881 to −1.114Yes0.0006B–C
Osstell-T1 vs. Osseo 100-T1−2.842−5.225 to −0.4586Yes0.0096B–E
Osseo 100-T0 vs. Osseo 100-T1−2.580−4.964 to −0.1968Yes0.0255D–E
Osseo 100-T0 vs. Osseo 100-T2−4.035−6.419 to −1.652Yes<0.0001D–F
Osseo 100-T1 vs. Osseo 100-T2−1.455−3.838 to 0.9283No0.4926E–F
Test detailsMean 1Mean 2Mean Diff.SE of diff.n1n2q
Osstell-T0 vs. Osstell-T170.3872.11−1.7360.825125252.975
Osstell-T0 vs. Osstell-T270.3875.61−5.2330.825125258.969
Osstell-T0 vs. Osseo 100-T070.3872.38−1.9980.825125253.424
Osstell-T1 vs. Osstell-T272.1175.61−3.4970.825125255.994
Osstell-T1 vs. Osseo 100-T172.1174.96−2.8420.825125254.871
Osstell-T2 vs. Osseo 100-T275.6176.41−0.79980.825125251.371
Osseo 100-T0 vs. Osseo 100-T172.3874.96−2.5800.825125254.422
Osseo 100-T0 vs. Osseo 100-T272.3876.41−4.0350.825125256.916
Osseo 100-T1 vs. Osseo 100-T274.9676.41−1.4550.825125252.494
Table 5. Results of ANOVA within the class comparison of ISQ measurements of group B patients.
GROUP B
ANOVA Tukey’s Comparisons Test
Mean Diff.95% CI of Diff.Significant?Adjusted
p-Value
Osstell-T0 vs. Osstell-T1−7.328−11.56 to −3.100Yes<0.0001A-B
Osstell-T0 vs. Osstell-T2−12.79−17.02 to −8.565Yes<0.0001A-C
Osstell-T0 vs. Osstell-T3−15.53−19.75 to −11.30Yes<0.0001A-D
Osstell-T0 vs. Osseo 100-T0−2.917−7.145 to 1.310No0.4091A-E
Osstell-T1 vs. Osstell-T2−5.465−9.693 to −1.238Yes0.0026B-C
Osstell-T1 vs. Osstell-T3−8.200−12.43 to −3.972Yes<0.0001B-D
Osstell-T1 vs. Osseo 100-T1−1.641−5.868 to 2.587No0.9341B-F
Osstell-T2 vs. Osstell-T3−2.734−6.962 to 1.493No0.4965C-D
Osstell-T2 vs. Osseo 100-T2−0.2086−4.436 to 4.019No>0.9999C-G
Osstell-T3 vs. Osseo 100-T3−0.6472−4.875 to 3.580No0.9998D-H
Osseo 100-T0 vs. Osseo 100-T1−6.051−10.28 to −1.824Yes0.0005E-F
Osseo 100-T0 vs. Osseo 100-T2−10.08−14.31 to −5.857Yes<0.0001E-G
Osseo 100-T0 vs. Osseo 100-T3−13.26−17.48 to −9.030Yes<0.0001E-H
Osseo 100-T1 vs. Osseo 100-T2−4.033−8.261 to 0.1945No0.0735F-G
Osseo 100-T1 vs. Osseo 100-T3−7.206−11.43 to −2.978Yes<0.0001F-H
Osseo 100-T2 vs. Osseo 100-T3−3.173−7.401 to 1.054No0.2989G-H
Test detailsMean 1Mean 2Mean Diff.SE of diff.n1n2q
Osstell-T0 vs. Osstell-T158.7866.11−7.3281.37925257.513
Osstell-T0 vs. Osstell-T258.7871.57−12.791.379252513.12
Osstell-T0 vs. Osstell-T358.7874.31−15.531.379252515.92
Osstell-T0 vs. Osseo 100-T058.7861.70−2.9171.37925252.991
Osstell-T1 vs. Osstell-T266.1171.57−5.4651.37925255.603
Osstell-T1 vs. Osstell-T366.1174.31−8.2001.37925258.406
Osstell-T1 vs. Osseo 100-T166.1167.75−1.6411.37925251.682
Osstell-T2 vs. Osseo 100-T271.5771.78−0.20861.37925250.2139
Osstell-T3 vs. Osseo 100-T374.3174.95−0.64721.37925250.6635
Osseo 100-T0 vs. Osseo 100-T161.7067.75−6.0511.37925256.204
Osseo 100-T0 vs. Osseo 100-T261.7071.78−10.081.379252510.34
Osseo 100-T0 vs. Osseo 100-T361.7074.95−13.261.379252513.59
Osseo 100-T1 vs. Osseo 100-T267.7571.78−4.0331.37925254.135
Osseo 100-T1 vs. Osseo 100-T367.7574.95−7.2061.37925257.388
Osseo 100-T2 vs. Osseo 100-T371.7874.95−3.1731.37925253.253
Disclaimer/Publisher’s Note: The statements, opinions and data contained in all publications are solely those of the individual author(s) and contributor(s) and not of MDPI and/or the editor(s). MDPI and/or the editor(s) disclaim responsibility for any injury to people or property resulting from any ideas, methods, instructions or products referred to in the content.

