Article

Influence of the 3D Printing Fabrication Parameters on the Tensile Properties of Carbon-Based Composite Filament

by
Prodromos Minaoglou
*,
Anastasios Tzotzis
,
Nikolaos Efkolidis
and
Panagiotis Kyratsis
*
Department of Product and Systems Design Engineering, University of Western Macedonia, Campus Kila Kozani, GR50100 Kozani, Greece
*
Authors to whom correspondence should be addressed.
Appl. Mech. 2024, 5(4), 745-761; https://doi.org/10.3390/applmech5040041
Submission received: 11 September 2024 / Revised: 16 October 2024 / Accepted: 22 October 2024 / Published: 24 October 2024

Abstract

:
In this study, the effect of certain 3D printing conditions on the tensile strength of 3D-printed specimens was investigated. The printing material was CARBON: PLUS (NEEMA3D™, Athens, Greece), which consists of Polyethylene Terephthalate Glycol (PET-G) reinforced with 20% carbon fiber. All samples were printed with a closed-type, large-format Fused Filament Fabrication (FFF) 3D printer. Before printing the samples, three parameters related to the 3D printing settings were selected in order to vary their values (flow = the flow of the material, wall = the total thickness of the wall, and layer = the thickness of the print layer). Each parameter was given three different values for experimentation. In this study, all 27 possible combinations of variable parameters were fabricated. Each experiment was repeated twice, and from the test results, the maximum tensile strength was obtained for each specimen separately. From the results of the measurements, the most critical parameter appeared to be the height of the layer. The other two variable parameters, the flow and wall, locally affected the strength of the specimens. Later, an empirical model was developed according to the full factorial design for each combination of values. Finally, the R-sq (pred) value achieved was equal to 97.02%, and together with the residual analysis performed, the accuracy of the proposed maximum tensile strength mathematical model was proven.

1. Introduction

Composite materials are usually composed of two or more different materials. The purpose of these materials is to create new materials that take advantage of the properties of their individual components (e.g., metals, ceramics, and polymers). Mechanical properties are one factor for which such materials are created. In many cases, composite materials contain reinforcing fibers with high mechanical properties. Carbon fibers are among the most common additions with an aim to change mechanical properties. High tensile strength and excellent wear resistance are why they are widely used to strengthen materials. Carbon fibers are easily incorporated into thermoplastics and at the same time can be recycled easily [1]. Another category that is developing is the manufacture of sandwich-type composite materials. A major challenge in these materials is the manner and efficiency of the joining between the individual materials [2]. Three-dimensional printing is a method of rapid prototyping and manufacturing. The material used in 3D printing can be in the form of filament and consists mainly of plastic. A key problem of thermoplastic materials, and by extension their printed geometries, is the low mechanical properties compared to common engineering materials. As mentioned above, the incorporation of carbon fibers is a common strategy to increase mechanical properties. In the case of 3D printing, carbon fiber additions can significantly improve the mechanical properties of both the filament and the printed geometry. The size and shape of the fibers as well as the base thermoplastic to be used play a decisive role in the strength of the final material [3]. Furthermore, in carbon fiber additions, a variety of materials can be found with an aim to change the material properties. The reason for this is the different requirements needed from the material. For example, bamboo can be inserted in a special form into another material in order to change its properties [4]. In recent years, in the field of 3D printing, materials can be found that have additions of wood, metal, recycled solid wastes, and other materials to create complex filaments [5,6,7,8].
Incorporating fibers into a thermoplastic, except for the benefits, can also create some problems. Many of these defects are analyzed by studies in the international scientific literature. The way the fibers are bonded to the thermoplastic, the size and shape of each fiber, the printing conditions, and the orientation of the printed geometry are some of the factors that can create defects in the final printed geometry [9,10]. A common method of testing the strength of a printed specimen is its fracture under tensile loading. The audit can be divided into two phases. In the first, a strength test is performed on the material, which can be a simple thermoplastic or a composite thermoplastic [11,12,13]. In the second phase, a printed geometry is checked based on some international standards for tension. At this stage, the control has to do with the way of printing. Structure orientation and print angles are some of the data that could be varied in different prints in order to evaluate the strength of the final geometry [14]. Similar studies investigated the effects of structural characteristics on the strength of specimens using the material Acrylonitrile Butadiene Styrene (ABS). With various changes in the layer height, the fill density, the line directions, and the fill pattern tests were designed and printed according to a full factorial design. Also, the creation of an empirical model helped to better evaluate the study. Important conclusions are that the filling and height of the layer significantly affect the mechanical properties of the printed sample and that the honeycomb pattern greatly increases its resistance to degradation [15,16,17]. ABS is a polymer to which carbon, glass, or basalt fiber reinforcements are added. Through tests, it was shown that carbon fibers improve the mechanical properties of ABS to a greater extent, in contrast to glass and basalt fibers, which improve the mechanical properties but to a lesser extent [18]. Tensile strength, Young’s modulus, yield stress, and deformation are some of the tests to which the specimens can be subjected. One of the software used to organize and analyze the data is MinitabTM (State University, Pennsylvania, USA) [19].
One category of published studies has dealt with the analysis of printed specimens of composite and non-composite materials under Static Compression and Dynamic Impact methods (SC and DI). The materials of these studies are Polyamide (PA), Polyamide Carbon Fiber-Reinforced Composite (PACF), Polyamide Glass Fiber-Reinforced Composite (PAGF), Nylon (N), and Nylon Carbon Fiber-Reinforced Composite (NACF). With various shapes of geometries (circular, triangular, square, hexagonal) and changes in printing structures, these materials were chosen in compression. In conclusion, it was shown that the shape affects the rate of energy absorption, while the existence and percentages of the reinforcing fibers play an important role in the final strength of the printed specimens [20,21,22].
Three-dimensional printing also includes DLP (digital light processing) additive manufacturing technology. In this technology, a light-curing resin is used, which is solidified layer by layer using UV light. In the scientific literature, there are studies that analyze the parameters that affect the final mechanical properties of printed geometries/specimens. Composite materials can also be created in this class of materials, such as from Acrylated Epoxidized Soybean Oil (AESO), in which we can incorporate single-walled carbon nanotubes (SWCNTs) [23]. Also, another filler material is graphene, which reinforces the polymers and creates a resin composite. The filling percentage of graphene in the polymer affects the mechanical properties of the composite. Specifically, in a test carried out with graphene fillings of 0.5% and 1%, the lower percentage showed higher tensile stress [24].
One of the structure standards used for tensile thermoplastics is ASTM D638 [25]. This particular structure is used in the majority of research that performs strength testing on 3D-printed thermoplastics [26]. Another issue of comparison and analysis is the behavior between normal and recycled thermoplastics. For example, a comparison is made between 3D-printed Polylactic Acid (PLA) and recycled Polylactic Acid (Re-PLA) samples. From the results of similar studies, it appeared that layer thickness is the most effective factor for improving tensile strength. Also, from the results of the recycled tests, it appeared that their 3D printing is possible with excellent results [27,28,29]. A similar study focused on the creation of a composite material from waste Polypropylene (PP) and carbon fibers. With the aim of improving the mechanical properties of the composite material, the printing conditions and the percentage of carbon fibers were parameterized. The results showed that the percentage of carbon particles and their good distribution significantly affect the final strength of the material [30]. Finally, each 3D printer can affect the mechanical properties of the final geometry in a different way. There are studies that look at the strength properties of each printed part in the view of different 3D printers. The color of the material is also a factor that is examined regarding the possible effects it may have on the strength of the material [31,32].
A high number of studies in the past years deal with the investigation of pure polymer filaments, whereas composite filaments remain understudied due to their recent development. In light of the above, the present paper focuses on the effects of three main structural characteristics on the ultimate tensile strength of 3D-printed specimens. NEEMA3D™ CARBON: PLUS, which consists of Polyethylene Terephthalate Glycol (PET-G) reinforced with 20% carbon fiber, was chosen as the study material since carbon-based composites constitute the backbone of the modern lightweight materials used in the aerospace, automotive, and structure industries. The parameters (structural features) used were the material flow (flow), the wall thickness around the printed geometry (wall), and the layer thickness (Layer). With three levels of values for each structural characteristic, the full factorial design was implemented with 27 different experiments (two specimens for each experimental condition). All the specimens were subjected to a tensile force, and the total results of the stresses acquired led to the calculation of a mathematical model. The mathematical model was created with the Response Surface Method (RSM). Through the model, a trend prediction equation was developed for the entire range of values of the parameters used. Also, based on the measured stress of the specimens, the interaction plot diagrams were drawn, which presented the effect of each parameter on the strength of the specimens. From the results, the maximum and minimum stress were found to be 98.48 MPa and 41.26 MPa. The parameters flow and layer appeared to have a greater influence on the trend against the wall. Finally, the relative errors between the measured and calculated stresses were calculated from the equation.
The novelty of this particular work is the different deposition of the reinforcing fibers within the geometry. In composite materials, the direction of the reinforcing fibers plays an important role in the mechanical properties. The wall parameter changes the way in which the specimen will be manufactured and by extension the structure of the reinforcing fibers. More specifically, the continuous lines/paths of the walls deposit the material in a differential way during printing. The layer parameter reduces and increases the thickness of these paths, while the flow parameter tries to fill all the gaps created by the 3D printing process. All specimens were printed with full material fill so that only the three selected parameters were tested.

2. Materials and Methods

Experimental Setup

In the present study, tensile test specimens were fabricated and tested using a 3D printer. By defining the fabrication parameters, specimens were printed under specific conditions. All the parameters that were varied were related to the 3D printing conditions of each sample. Using a tensile testing machine, maximum strength tests were run on each specimen and organized in tables. From the results of the measurements, the most statistically significant parameters were defined. Furthermore, the Response Surface Method (RSM) [33,34,35] was utilized to model the process and develop an empirical mathematical formula for the prediction of the strength across the range of parameters used in the tests. The full factorial design was utilized, leading to the 27 tests. The main reason behind the selection of the specific design is that it evaluates all possible combinations between the variables, without skipping any, improving the reliability of the model. This particular study consists of some basic steps. During the first step, the definition of the parameters and the fabrication of the samples took place. The second step refers to organizing the specimens with names and performing the appropriate categorizations. The third step addresses the checking of the strength of each sample using a tensile testing machine. Finally, in the last step, the analysis of the results and the final conclusions were carried out.
The CreatBotTM D600 Pro (Henan Creatbot Technology Limited, Zhengzhou, China) 3D printer, was chosen to fabricate the samples based on FFF (Fused Filament Fabrication) technology. The printer has maximum specimen printing dimensions of 600 × 600 × 600 mm, which makes it ideal for this study. It was very important that all samples would be printed with the same ambient and bed-zero conditions. With the size of this printer, all the specimens could be printed at once. Another advantage of the printer was that it had an enclosure, which means that it efficiently maintained the temperature of the printing area. The material with which the tests were carried out was NEEMA3D™ CARBON: PLUS. The specific material consists of PET-G reinforced with 20% carbon fibers. Basic properties of the CARBON: PLUS include high impact resistance compared to plain PET-G and greater heat resistance compared to traditional materials. Other characteristics of the material are the matte surface that results after the printing process and the easy printing without distortions in the shape. It is important to mention that for the extrusion of this material, a hardened steel nozzle was used so that any damage to the nozzle could be avoided. Based on the manufacturer datasheet, the properties of the material are included in Table 1 [36].
The universal testing machine InstronTM 3345 (Norwood, MA, USA) was used to conduct the tensile experiments. The maximum force of the tensile machine is 5 kN (1125 lbf). The maximum movement speed of the grips is equal to 500 mm/min (19.68 in/min), while the minimum is 0.05 mm/min (0.002 in/min). The available area in which measurements can be made is 1123 mm (44.2 inches) vertically and 100 mm (3.9 inches) horizontally. The overall height of the machine is 136 cm (54 inches). In the present study, test specimens of all possible combinations were fabricated and tested. Using three differentiating variables and three levels for each resulted in 27 tests with an aim to test all the possible combinations (full factorial analysis). The three variables selected were the flow, wall, and layer.
  • The flow variable is the flow rate and determines the amount of material that passes through the 3D printer nozzle. The flow is expressed as a percentage. The percentage at its original value is equal to 100%. For each increase or decrease in the percentage, the amount of material that passes through the nozzle increases or decreases accordingly.
  • The wall is the wall thickness around the geometry. The walls are expressed by the number of parallel passes of the nozzle, for example, if walls = 2, then the thickness of the printed geometry would be (wall = 2 × 0.6 mm = 1.2 mm) for a nozzle = 0.6 mm.
  • The layer is the last variable to be parameterized. The layer defines the thickness of the layers with which the geometry is to be fabricated. The measurement unit of the layer is millimeters (mm).
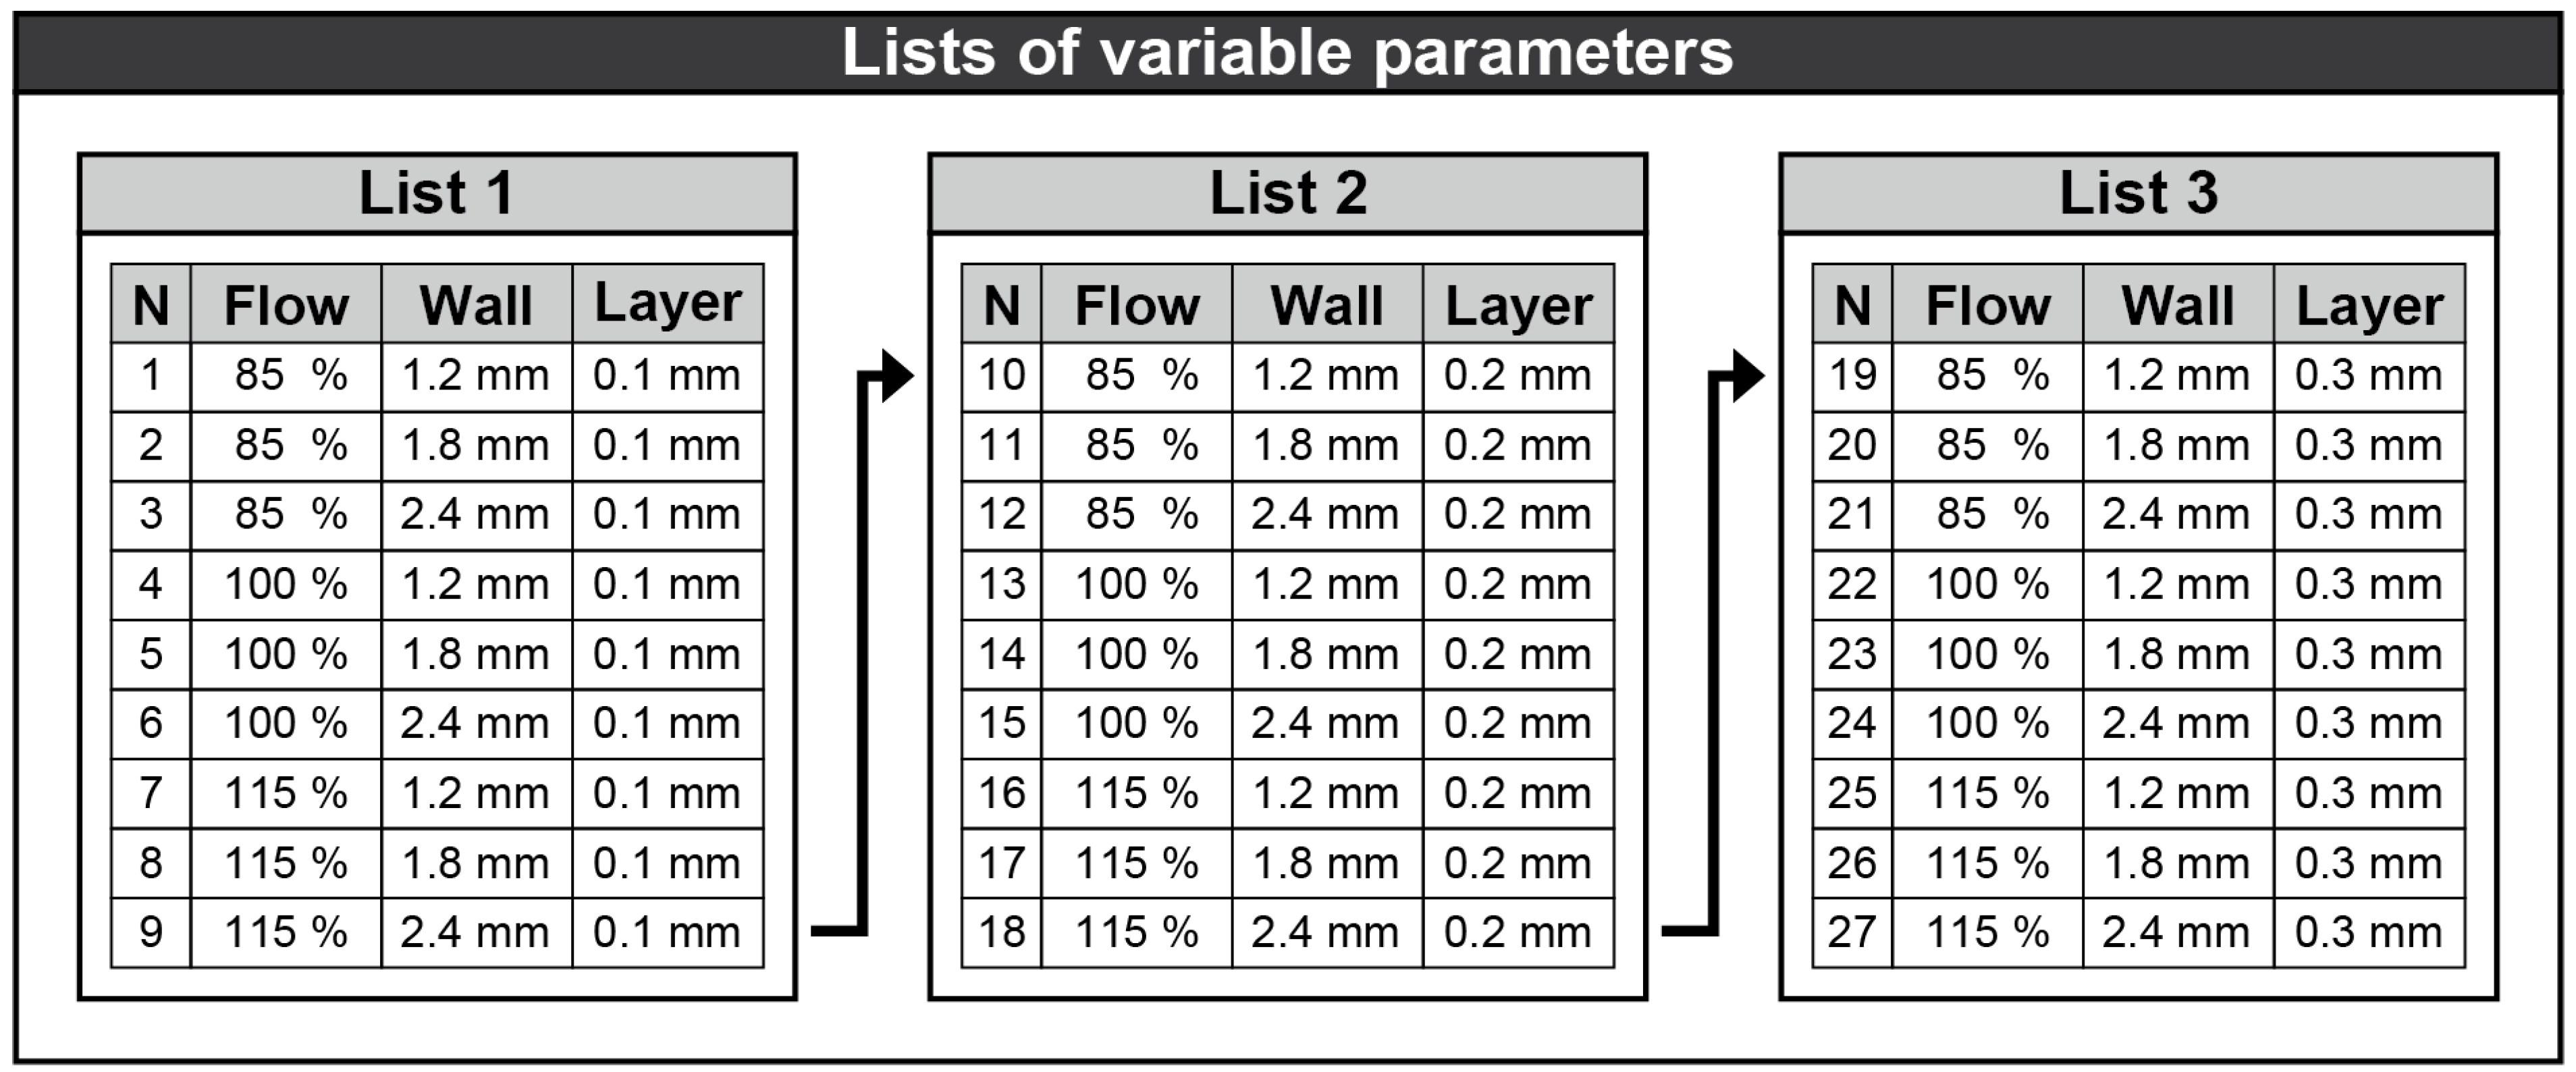
Table 2 presents the three levels of variable parameters used in this study.
Figure 1 depicts schematically the experimental setup used during this study; that is to say, the 3D printer, the filament material, the tensile testing machine, and the variable parameters. The parameters schematically illustrate the path for each case.
Apart from the variable printing parameters, all other settings remained constant. The temperature of the nozzle and the temperature of the bed were set based on the specifications given by the material manufacturer at 245 °C and 60 °C, respectively. The infill parameter was set to 100%, which means that the samples were filled with material and no voids were created. The diameter of the filament and the nozzle were 1.75 mm and 0.6 mm, respectively. Finally, the printing speed was set to 40 mm/s for all tests. The printing speed of the peripheral paths was set at half the speed of the general speed, i.e., 20 mm/s, and the cooling fan of the nozzle in each sample was at 100%. Table 3 presents all the constant parameters used in this study.
In the context of this study, the geometry used for the tests was designed in a Computer-Aided Design (CAD) system according to the standard ASTM D638. This standard is commonly used to study the tensile properties of plastic materials. The critical area of the specimen has a length equal to 33 mm, a width of 6 mm, and a thickness of 3.6 mm. The rest of the dimensions are presented in Figure 2. The InstronTM 3345 tensile machine with a maximum force of 5 kN was sufficient for the fracturing of the specimens and their selected dimensions standard [25].
According to the three variable parameters and the three parameter levels, 27 test combinations were obtained. In Figure 3, all the combinations are presented. The fabrication of the specimens with the 3D printer was initiated based on the 27 combinations with the aim of completing a full factorial analysis.

3. Results

3.1. 3D Printing and Tensile Strength Measurement

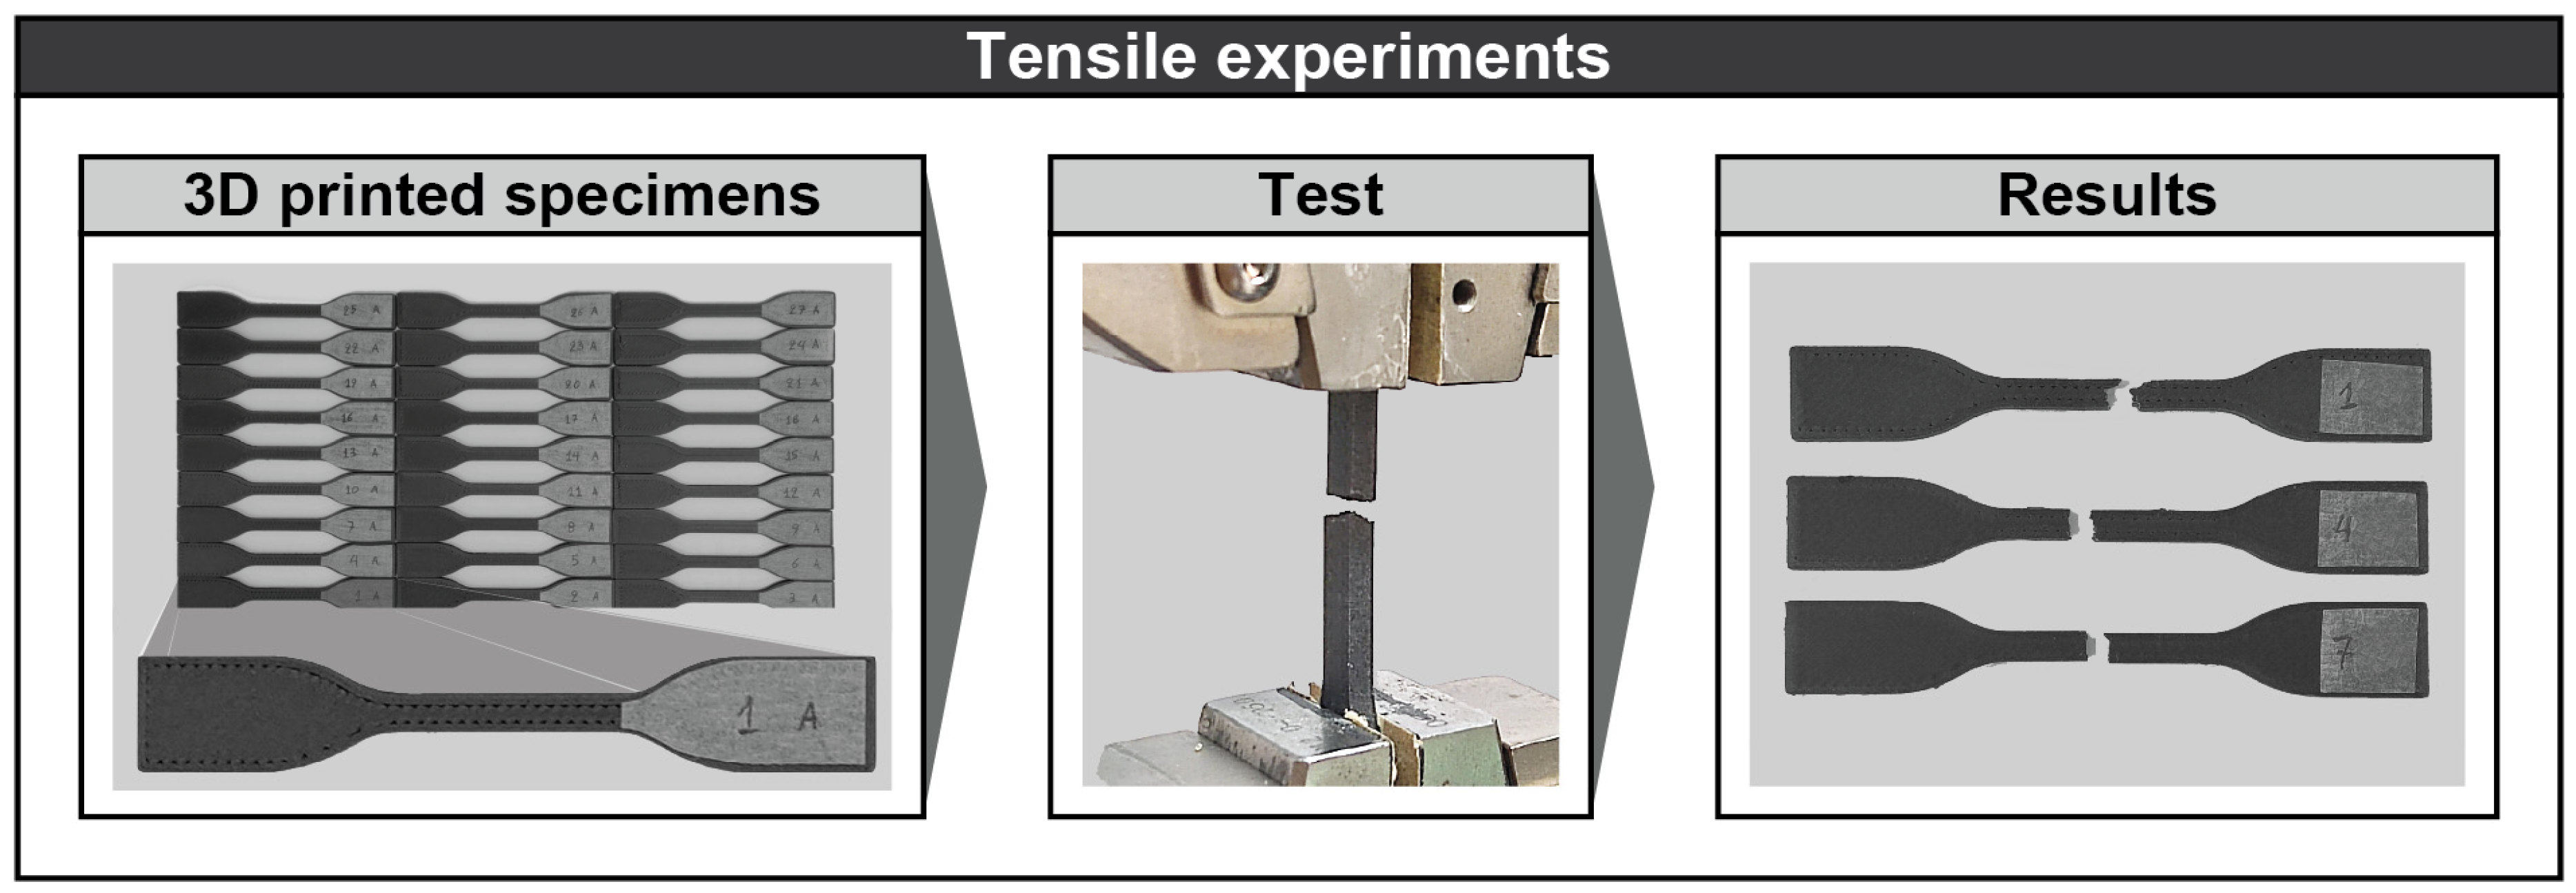
At this point of this study, the results of 3D printing and the experimentally measured tensile strength of the samples were defined. To increase the quality of the results, two sets of 3D prints (A and B) were fabricated for each sample, with the total number of samples being equal to 54 (27 A + 27 B = 54). The specimens of each group (A and B) were all 3D printed together so that they could be fabricated under exactly the same environmental and 3D printer conditions. Each sample was named and grouped accordingly. Each specimen was then tested with the InstronTM 3345 tensile machine. Figure 4 presents photographs of the 3D printing results, the tensile strength tests, and the result of the broken samples.
The results of the overall measurements are presented in Table 4. For each identical specimen, the average value from groups A and B was calculated. The loads were measured and extracted from the tensile testing machine software in kN. Taking into account the dimensions of the sample, the maximum tensile strength (σ) was calculated for each sample. More specifically, area A was equal to 21.6 mm2 (3.6 mm × 6 mm = 21.6 mm2). Based on the calculation of surface A, the average stress (σ) was obtained for each combination of the same samples (σ = Average Max Load/A). Table 4 shows the results for each experiment performed. In each of the samples, the selected variable parameters, the average maximum tensile force in kN, and the average tensile stress based on the dimensions of the sample are shown.
Table 5 below shows the maximum tensile stresses in materials containing percentages of carbon fibers. More specifically, studies were found that control the materials PET (Polyethylene Terephthalate) 15% carbon, PA6/66 (Polyamide) 10% carbon, PLA (Polylactic Acid) 30% carbon, and PLA 5.5% carbon.

3.2. Main Effects Plot Diagrams

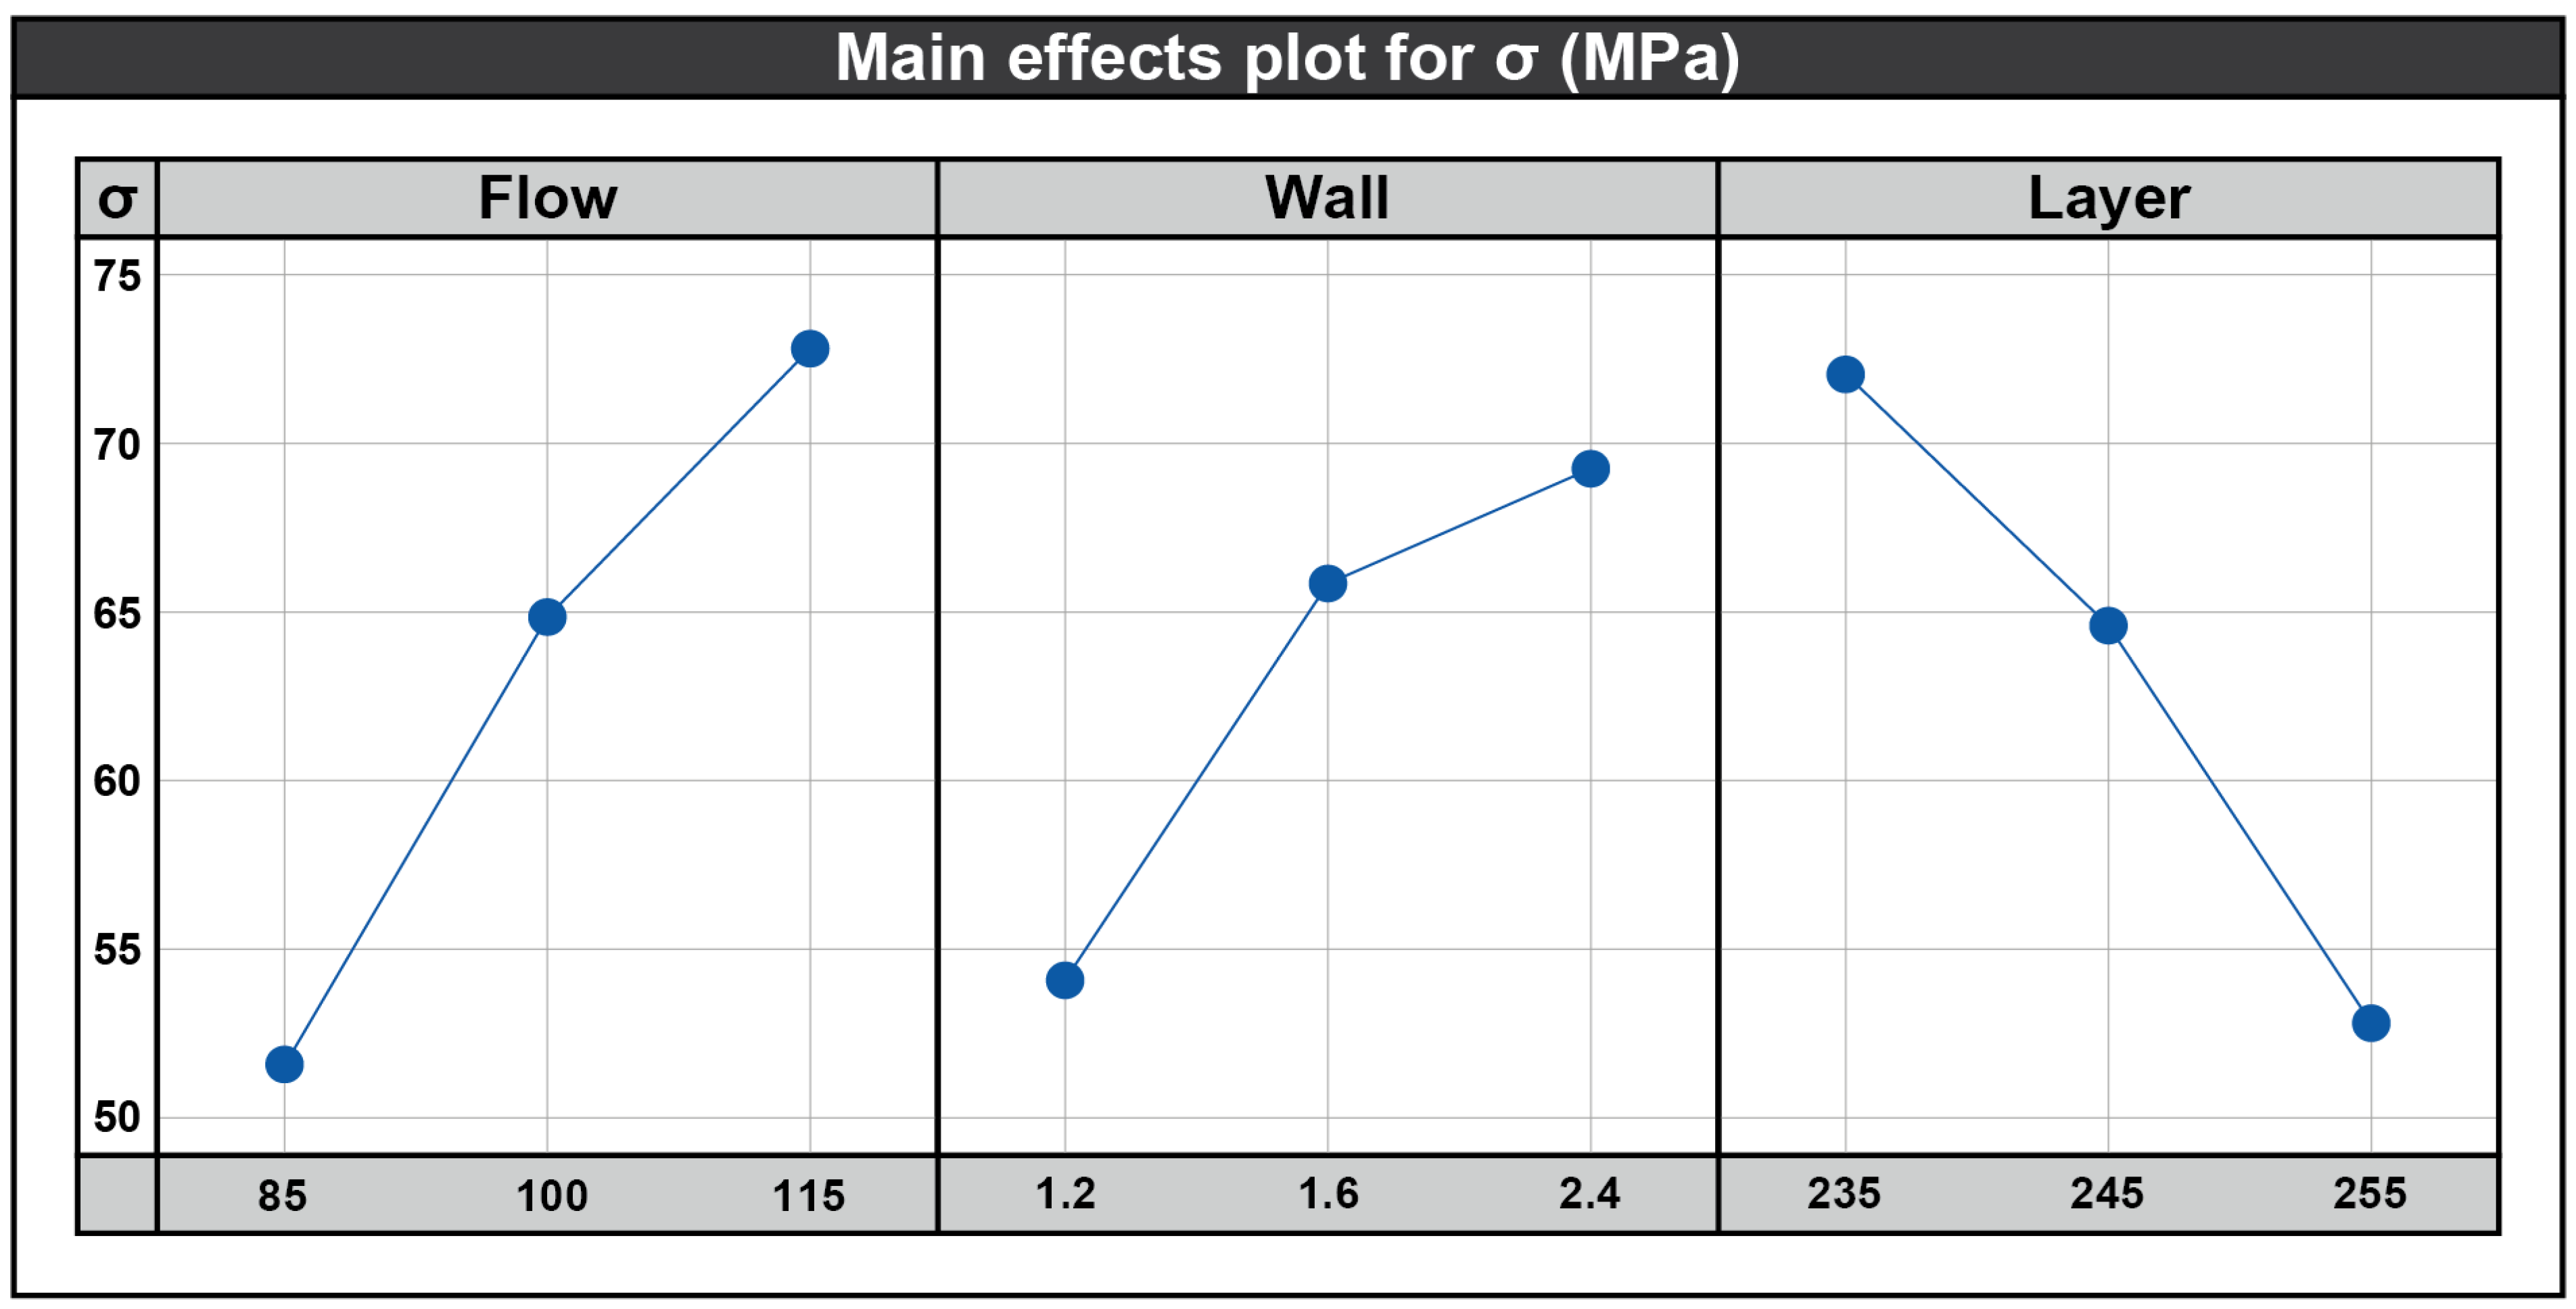
Figure 5 presents the main effects plot diagrams. It is shown that the flow rate increases from 85% to 115% and the tensile strength increases significantly, especially between 85% and 100%. This is due to the fact that the flow percentage controls the amount of material extruded during printing. A higher flow rate results in better bonding between layers and more material being deposited, which increases tensile strength. At lower flow rates (85%), there might be under-extrusion, leading to weak interlayer bonds, which decreases strength.
Increasing the wall thickness from 1.2 mm to 2.4 mm leads to an increase in tensile strength. Especially, between 1.2 mm and 1.8 mm, the increase is sharp. However, after 1.8 mm, the effect diminishes. A thicker wall means more material and a larger surface area to distribute loads. This helps the printed part withstand tensile forces better, as thicker walls provide more rigidity and support. Thin walls (1.2 mm) might be more prone to deformation under stress, whereas thicker walls (2.4 mm) offer greater resistance to mechanical loads, leading to higher tensile strength.
Finally, the tensile strength decreases as the layer thickness increases from 0.1 mm to 0.2 mm. The same pattern is noted when increasing thickness from 0.2 mm to 0.3 mm, but the effect is more significant. Layer thickness affects how well subsequent layers bond to each other. With a thinner layer (0.1 mm), each layer adheres more effectively to the previous one due to smaller gaps between the deposited layers, leading to stronger bonding and higher tensile strength. Conversely, thicker layers (0.3 mm) may result in weaker interlayer adhesion due to larger gaps between layers, which compromises the strength of the printed part.

3.3. Interaction Plot Diagrams

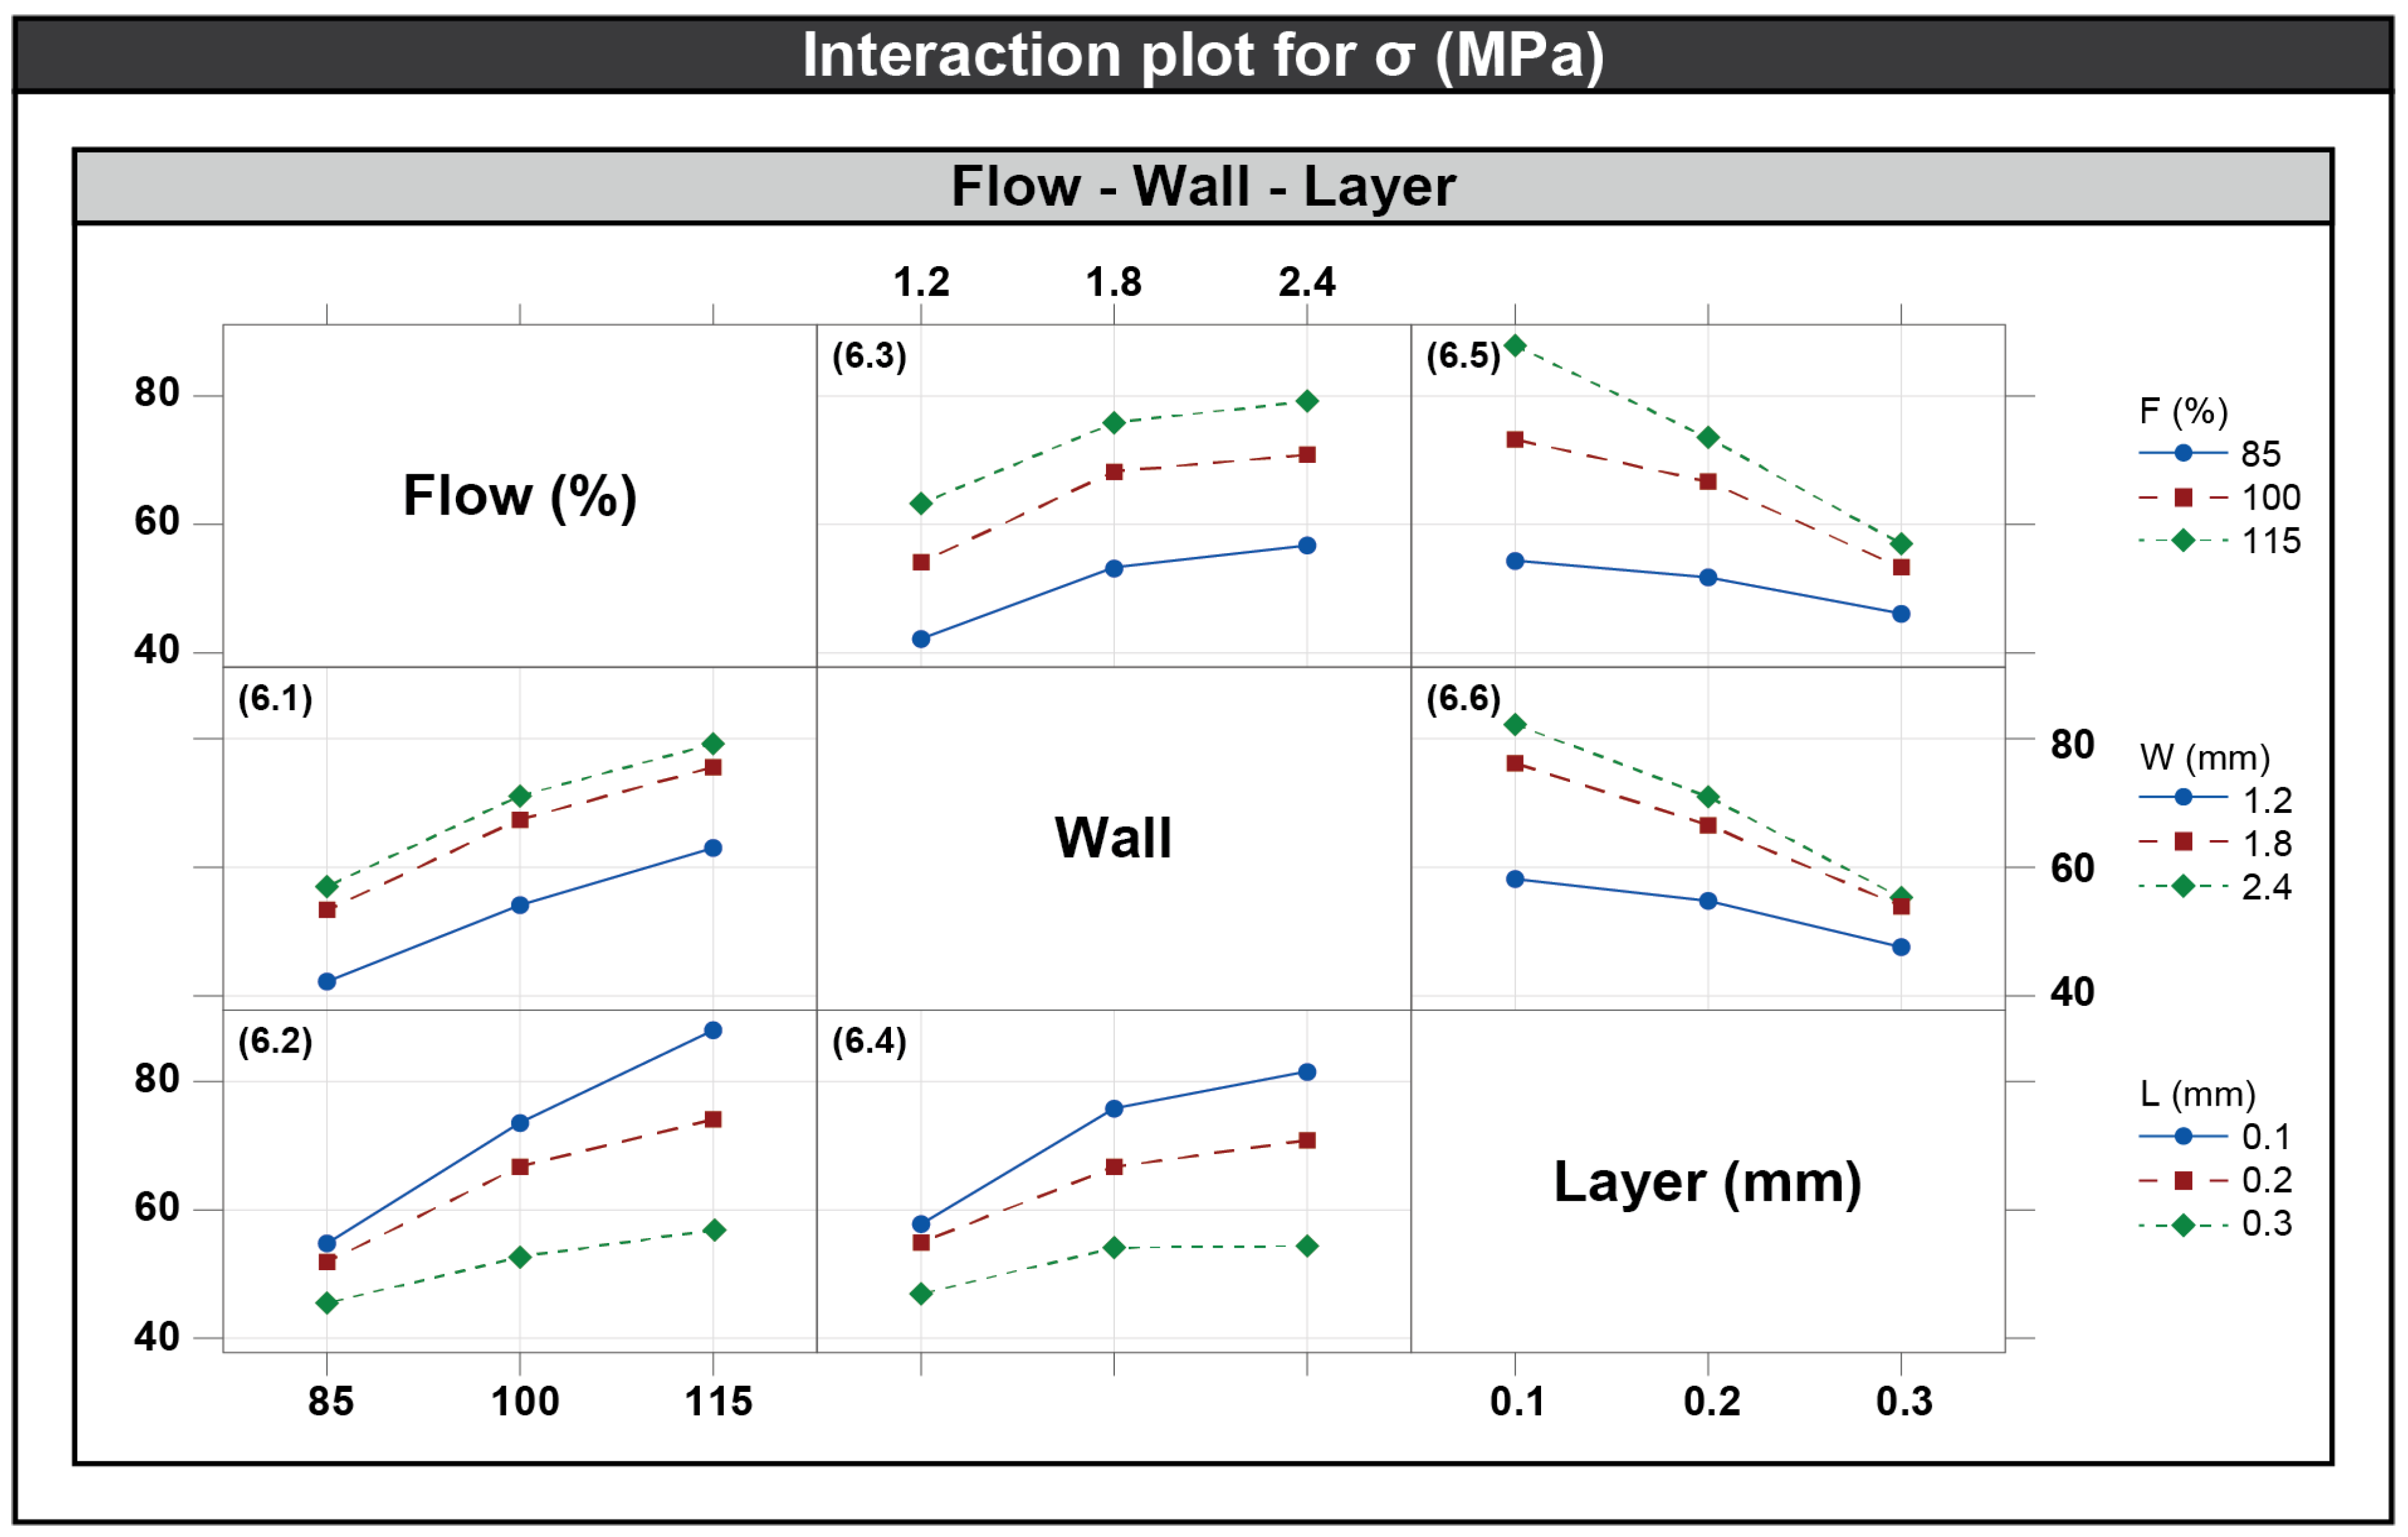
Figure 6 shows the results of the measurements aggregated in six diagrams (interaction plot diagrams). The diagrams visualize the effect of each one of the three variable parameters on the generated stress. By observing the diagrams, the following conclusions can be drawn:
  • The flow affected the strength of the specimens with similar results to those of the wall parameter. In diagrams (6.1) and (6.2), we can see the lines and their slopes. More specifically, the increase in the flow in all cases increased the strength of the samples accordingly. The changes in the wall values did not affect the lines, as shown in diagram (6.1). However, the layer also, in this case, seemed to affect the slopes of the lines in diagram (6.2).
  • The wall parameter with a value of 2.4 mm increased the trend against values of 1.8 mm and 2.4 mm, respectively. The increase in stress does not follow a linear pattern, as seen in diagrams (6.3) and (6.4). The slope of the lines decreased between values of 1.2–1.8 mm and 1.8–2.4 mm.
  • The layer is a parameter that affects the tensile strength of the 3D-printed structure. More specifically, the height of 0.1 mm presented a higher resistance in tension compared to 0.2 mm and 0.3 mm, respectively. In diagrams (6.5) and (6.6), it is evident that the changes in the values of the wall and flow affect the slope rate of the curves separately for each value of the layer. For example, in diagram (6.5), the difference in stress between 0.1 mm and 0.3 mm with constant flow = 115% is equal to 30.22 MPa, while the difference in stress between 0.1 mm and 0.3 mm with constant flow = 85% is equal to 8.23 MPa. The difference between the two stresses is also visible, as there is a large difference in the slope of the lines. A similar trend is depicted in diagram (6.4) with a smaller difference in the influence of the stress. Therefore, the layer directly affects the strength of the printed structure, with the lowest value contributing the most. At the same time, any increase in the flow and wall affects the stress increasingly and, therefore, makes the stress differences more distinct.
As seen from the above, the layer is a parameter that affects either directly or indirectly in each case the tendency of the samples. The maximum tensile strength was found in test number 9 with a value of 98.48 MPa. The variable parameters of test number 9 are layer = 0.1 mm, wall = 2.4 mm, and flow = 115%. The minimum tensile strength was found in test number 19, where the stress was equal to 41.26 MPa. The variable parameters of test 19 are layer = 0.3 mm, wall = 1.2 mm, and flow = 85%.
To summarize, observations on the six diagrams lead to the following generalized facts:
  • Diagram (6.1) illustrates the flow vs. wall interaction on the generated stress. It is observed that as the flow rate increases, so does the stress at a steady rate per wall level. Similarly, when the wall is increasing, the stress rises as well. However, it is noticed that when shifting from wall = 1.8 mm to wall = 2.4 mm, the increase is much lower compared to shifting between 1.2 mm and 1.8 mm.
  • Diagram (6.2) shows the flow vs. layer interaction. The stress rises as the flow rate increases per layer height level. Moreover, it is noted that lower values of layer height act increasingly. The largest increase is observed when shifting from an 85% flow rate to 115% at 0.1 mm layer height.
  • Diagram (6.3), which visualizes the interaction between the wall and flow, presents a similar pattern to diagram (6.1).
  • Diagram (6.4) shows the wall vs. layer interaction. The diagram suggests that increasing the wall thickness affects stress increasingly, regardless of the layer height. The increase, however, is more significant when shifting the wall value from 1.2 mm to 1.8 mm compared to the increase generated when changing the wall value from 1.8 mm to 2.4 mm. Moreover, it is evident that smaller layer height contributes to higher values of strength for each level of the wall.
  • Diagram (6.5) presents the layer vs. flow interaction, indicating that increasing the wall thickness acts decreasingly on the generated stress, regardless of the flow rate level. Contrarily, shifting the flow rate upwards increases the stress. In addition, this increase is more evident at a layer height equal to 0.1 mm.
  • Finally, diagram (6.6) shows the interaction between the layer and wall, with an effect pattern similar to the one in diagram (6.5). The exception here is that a 0.3 mm layer height combined with either a wall thickness of 1.8 mm or 2.4 mm produces the same levels of stress.
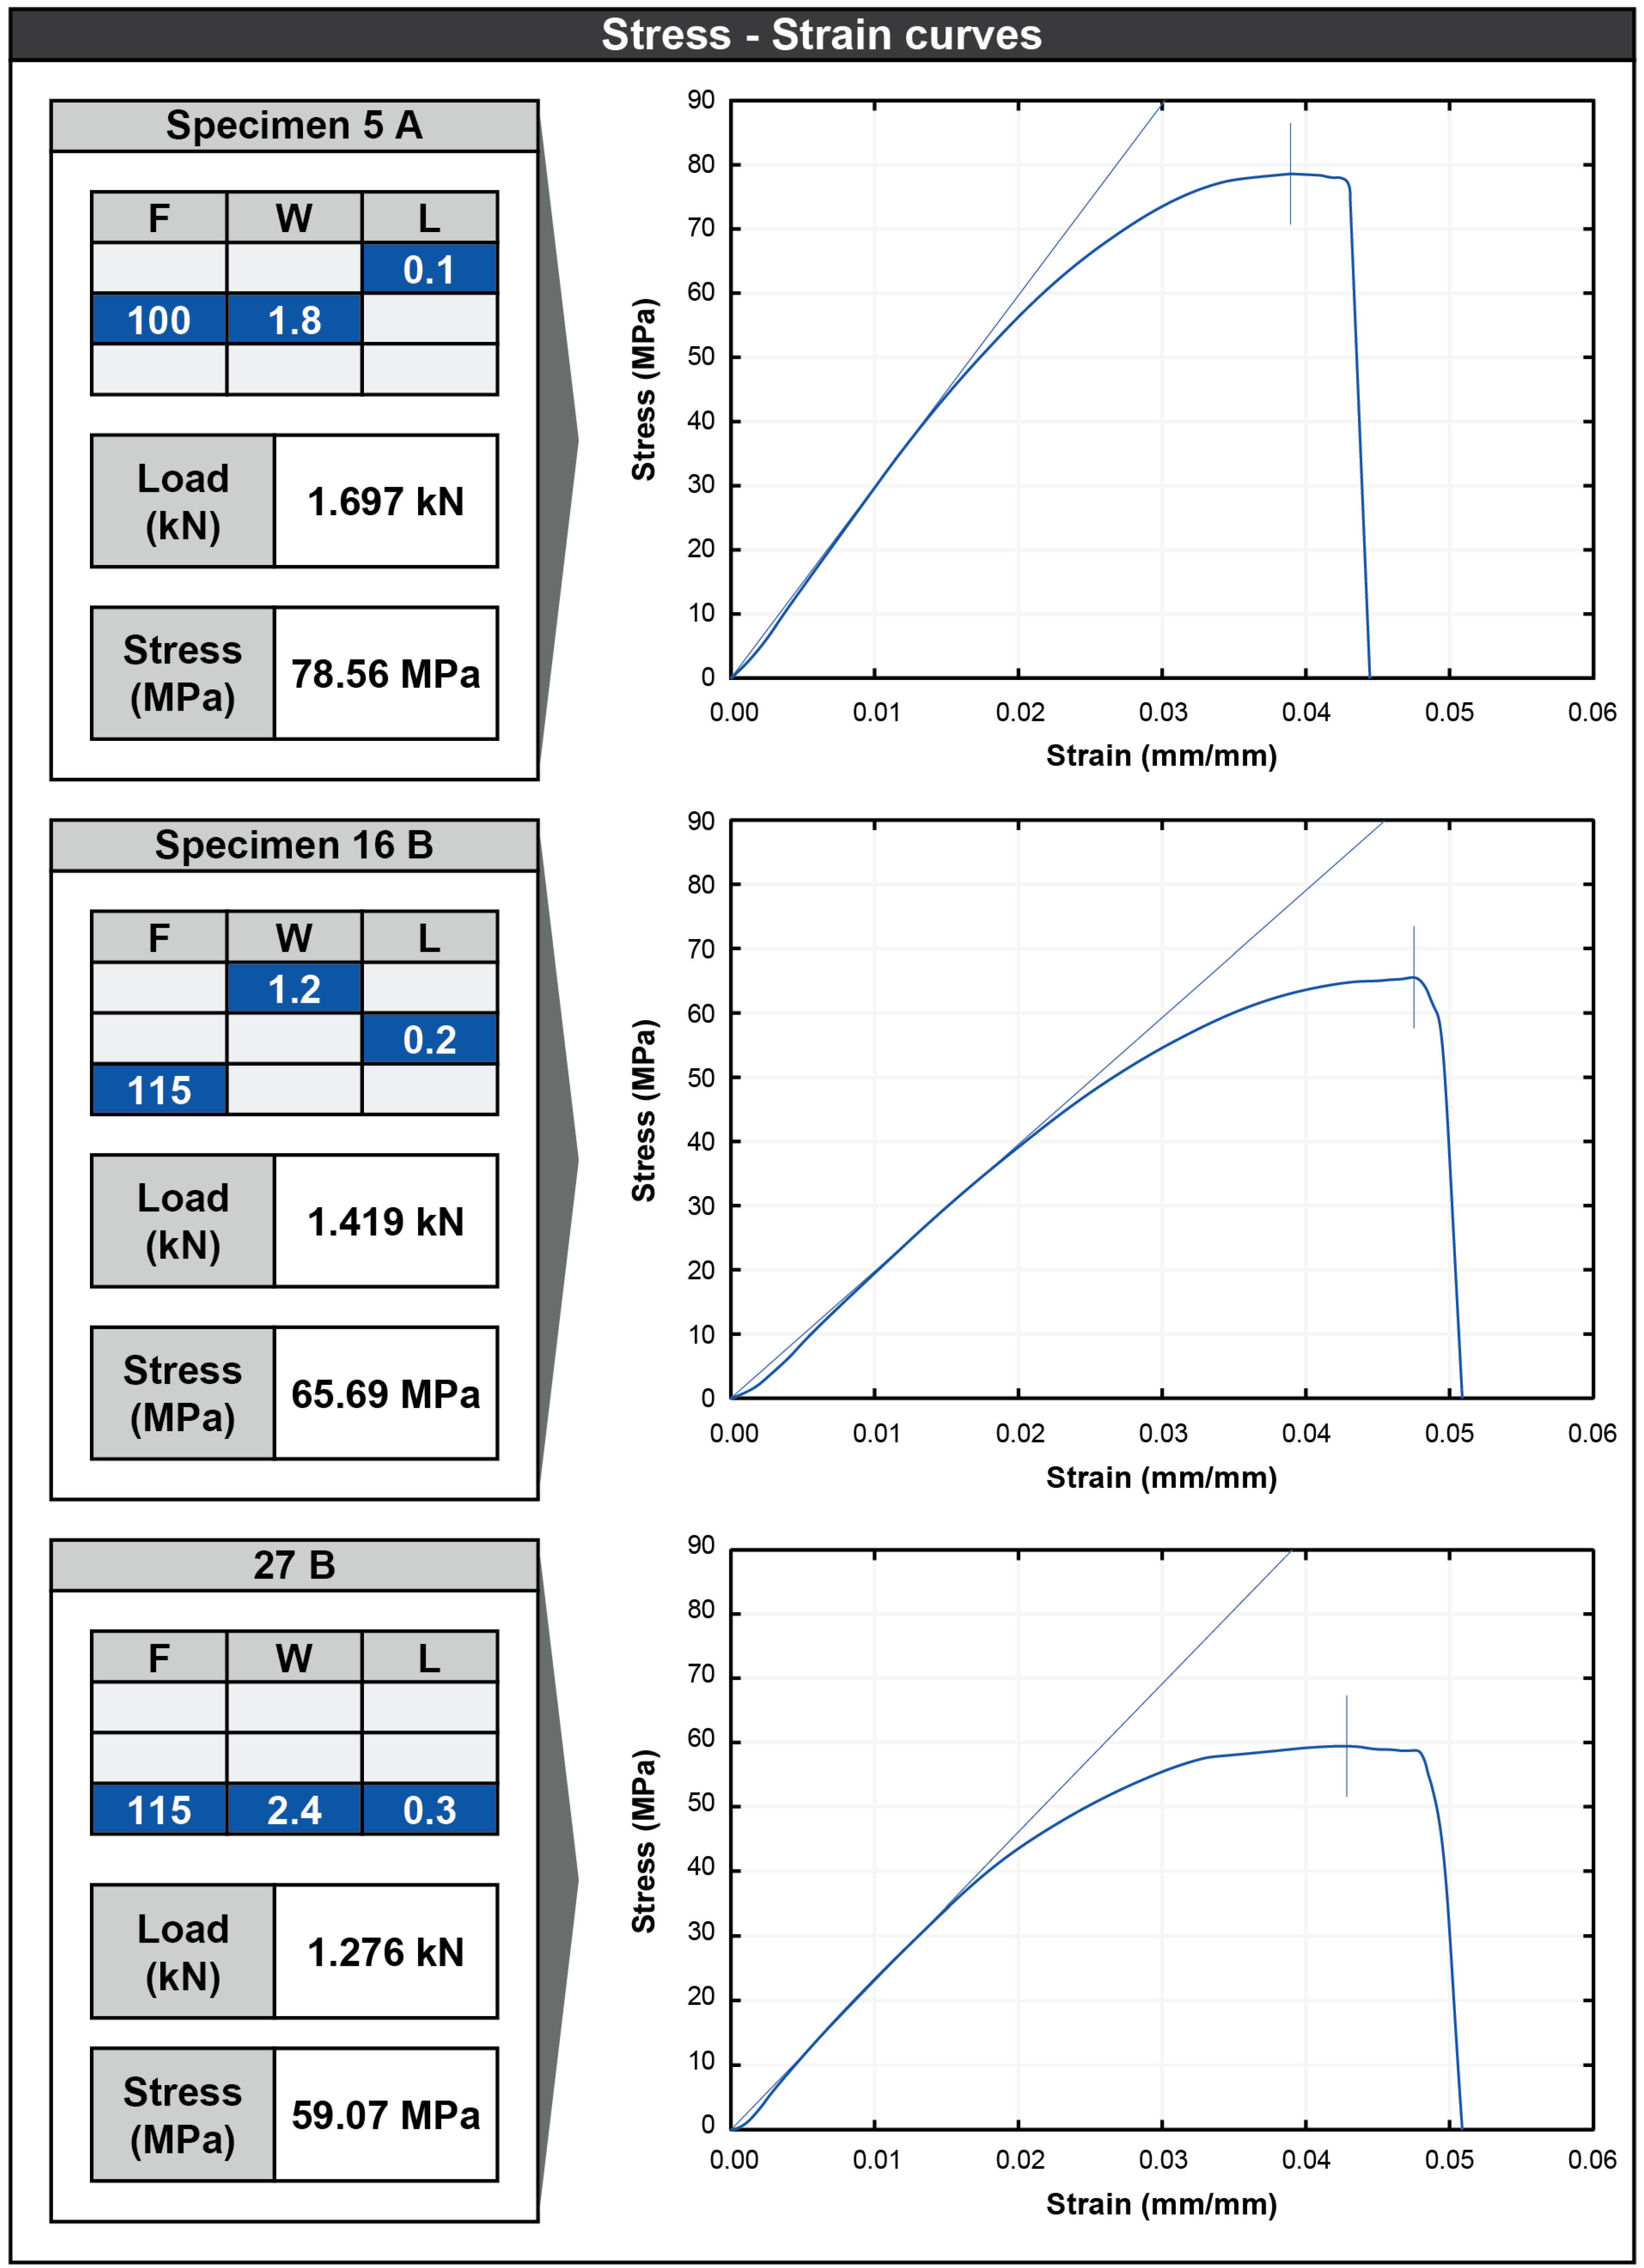
Figure 7 shows three examples of stress–strain curves for specimens 5 A, 16 B, and 27 B. Also, the fabrication parameters and maximum load of each sample are presented. It was observed that all experiments exhibited a similar pattern.

3.4. Definition of the Regression Equation

The next step of the present study was to develop a prediction model using the experimental results. The results were used for defining a second-order polynomials regression, RE Equation (1). It is important to mention that RE Equation (1) contains linear, quadratic, and cross-terms, as the interaction between input and output was non-linear. The resulting equation is as follows:
σ = 253.8 + 3.623 × F + 38.54 × W + 470.8 × L 0.01134 × F 2 4.315 × W 2 209.9 × L 2 + 0.0271 × F × W 3.665 × F × L 38.93 × W × L
where σ = maximum tensile strength, flow = F, wall = W, and layer = L.
Based on the RE equation, the maximum tensile strength can be calculated for each combination of variable parameters. It is important to mention that for the prediction of the maximum tensile strength, the values to be used in the variable parameters should be within the fabrication limits set. For example, for the variable parameter flow, the values used should be in the range of 85% up to 115%, the wall should be between 1.2 mm and 2.4 mm, and finally, the layer value should be between 0.1 mm and 0.3 mm.
Table 6 presents the analysis of variance (ANOVA) results, which were carried out in order to evaluate both the performance of the developed model and the contribution percentages of the terms to the response. The ANOVA was employed with a 0.05 confidence level. The R-sq (pred) = 97.05%, together with the p-value = 0.000 of the mathematical model, offers a solid basis for considering the high accuracy of the maximum tensile strength model calculated.
By checking the p-values of the variables, it is evident that the only non-significant term (with a value greater than 0.05) is the term F × W. It is noted that the terms F × L and L contribute the most towards the generated tensile strength, with percentages equal to 28.4% and 24.2%, respectively. The terms W × L and W produce noteworthy effects on the response as well. The equivalent percentages are 14.3% and 11.5%, accordingly. The W2 and F parameters yielded contributions in the range of 8.8% to 7.5%. Finally, F2 and the L2 are the terms with the least contribution to the model, with percentages close to 3.1% and 2.1%, respectively.

3.5. Residual Analysis Graphs and Relative Error

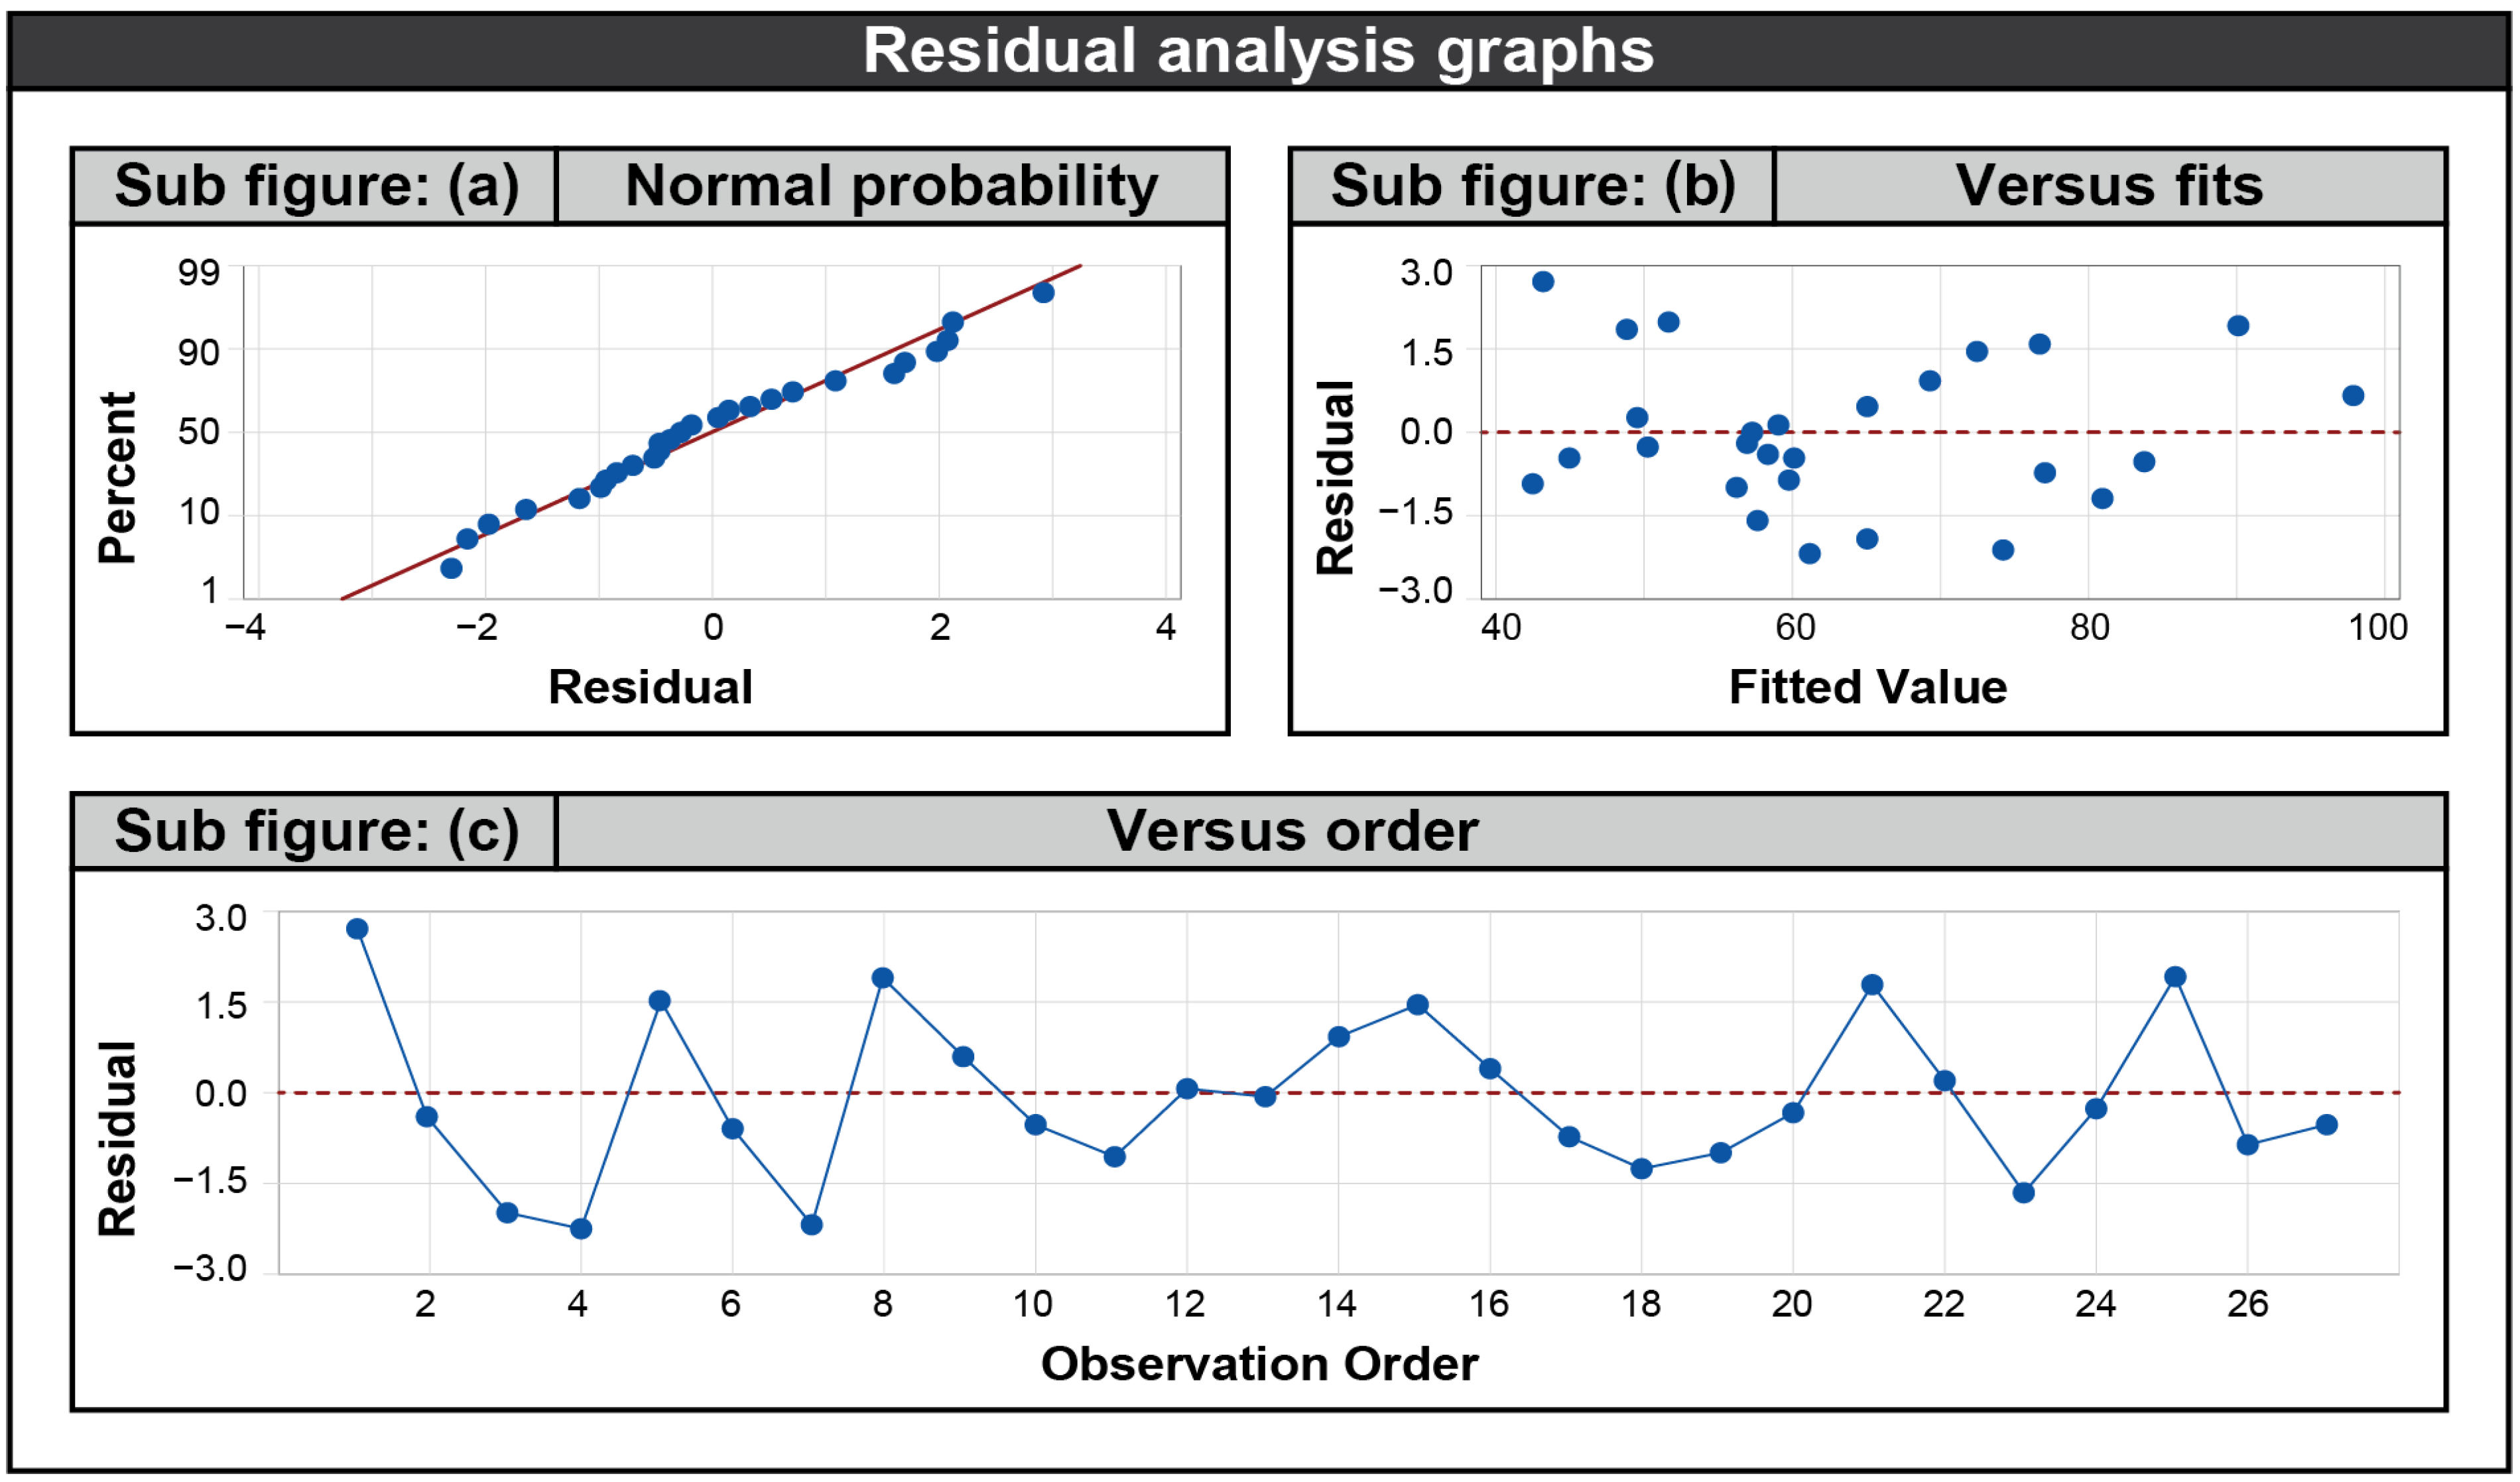
The residual analysis graphs show that the residuals follow a normal distribution, and both the residual vs. fit and residual vs. order graphs prove that there was not any systematic error involved in the process followed in Figure 8.
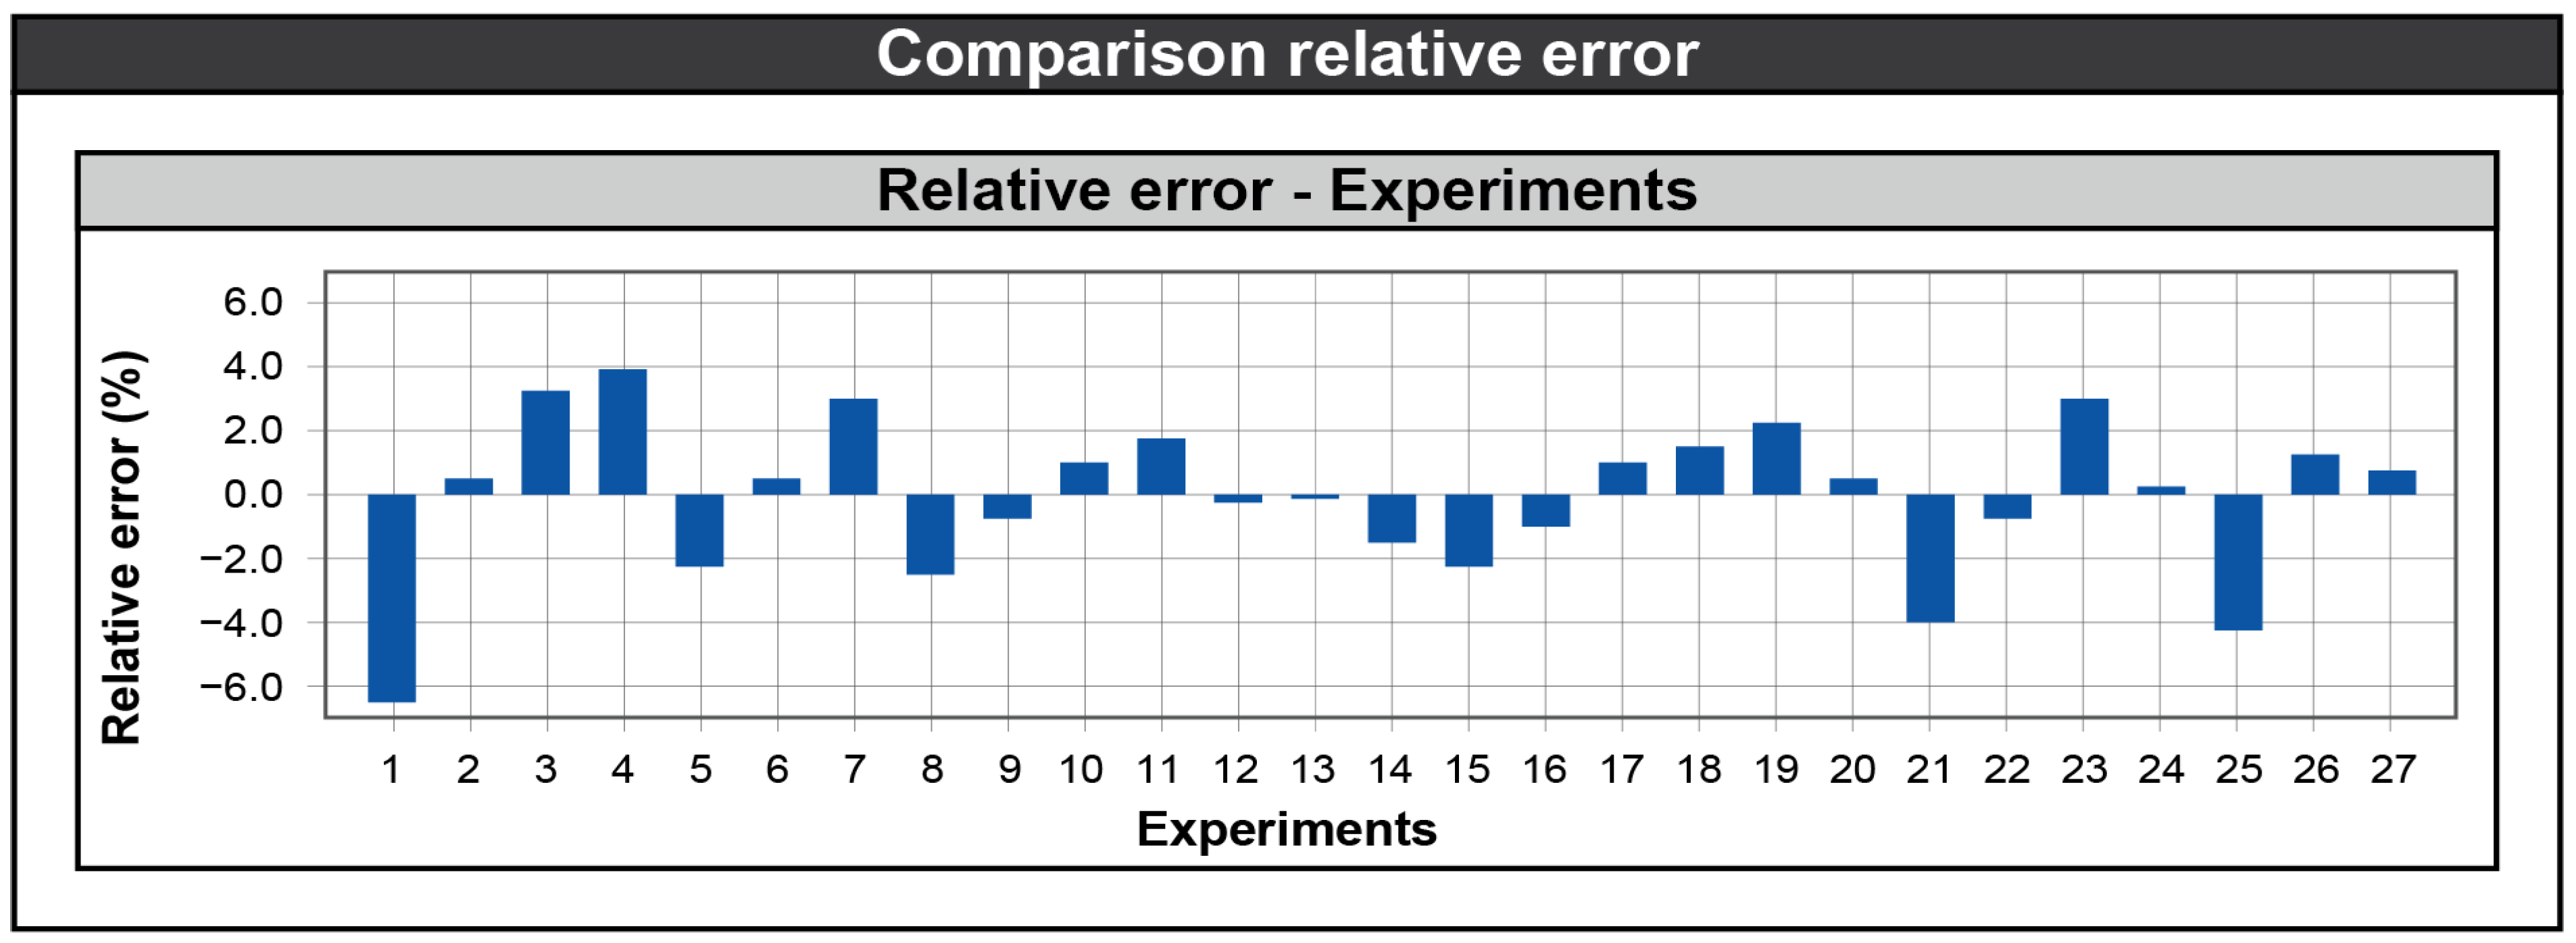
Figure 9 shows the relative error (%) between the actual measurements made in each experiment and the calculations made through the mathematical model acquired. The errors detected were between 3.84% and −6.39%, which is additional proof that the mathematical model is of high accuracy.

3.6. 3D Surface Plots

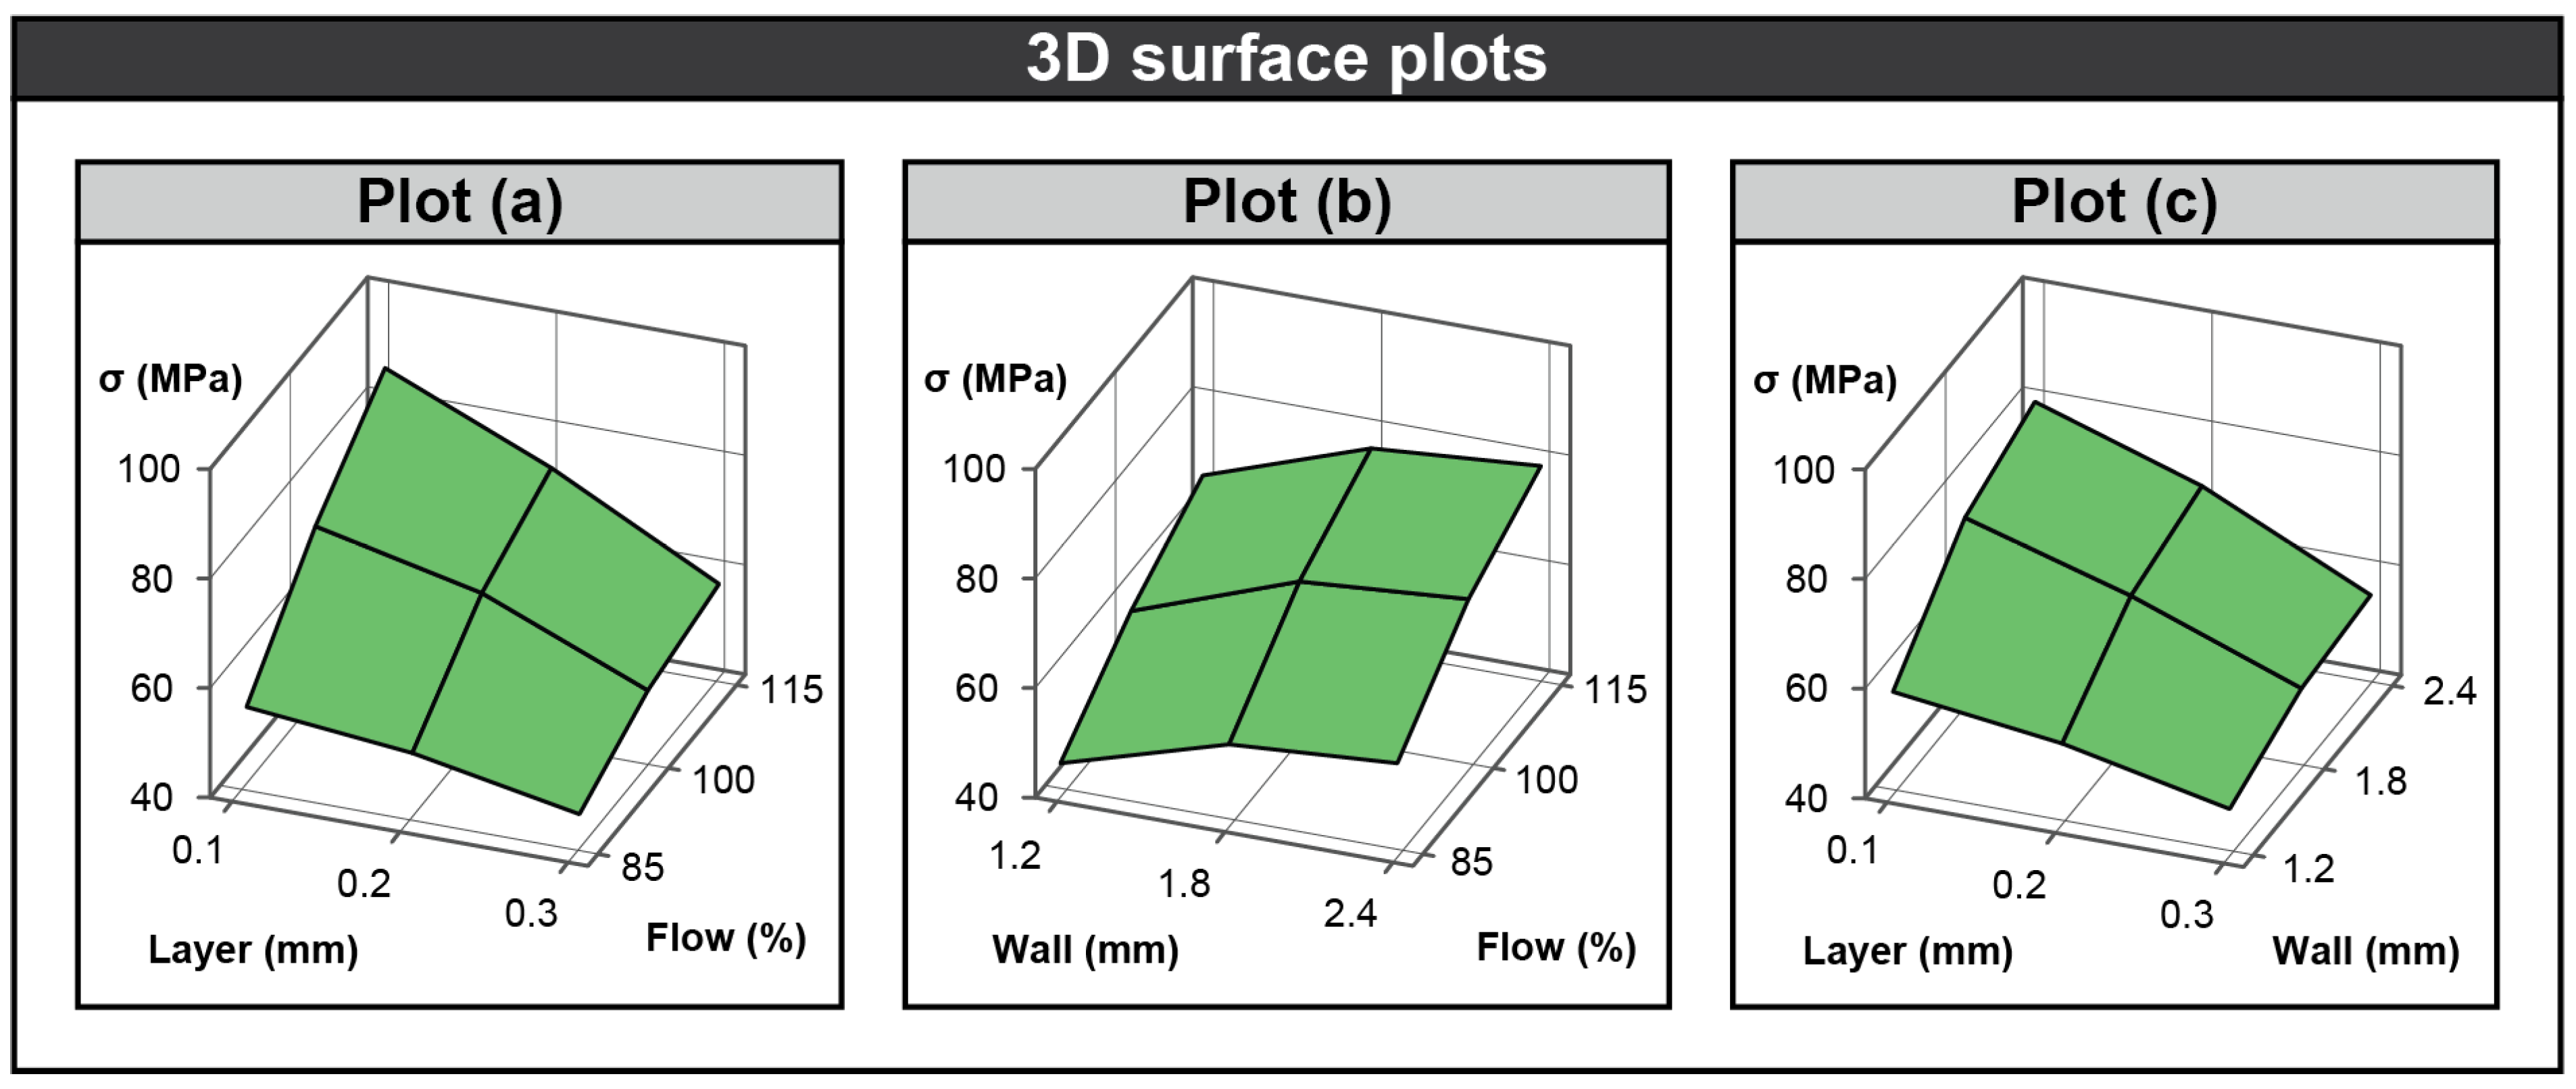
The 3D surface plots depict the relationship between two 3D printing parameters and their combined effect on the measured stress of a 3D-printed specimen. The present variables include the layer height, which affects the surface finish and mechanical properties of the 3D-printed part, the flow percentage, which controls the amount of material extruded during printing, and the wall, which affects the produced strength. Finally, the stress in the 3D-printed specimen, measured in MPa, is the output. Higher stress values indicate that the material can withstand greater mechanical forces.
Plot (a) in Figure 10 visualizes the combined effect of layer height and flow rate on the generated stress. As the flow percentage increases from 85% to 115%, the stress values also increase. This suggests that increasing the flow percentage, and thus the amount of material extruded, generally improves the mechanical strength of the printed part. Over-extruding slightly beyond 100% might create denser layers and stronger bonds between layers, which enhance the overall stress capacity. The plot shows only slight variations in stress for different layer thicknesses (0.1 mm to 0.3 mm). This indicates that layer thickness in this range has a relatively modest impact on the part’s ability to resist stress compared to the flow percentage. However, thinner layers tend to result in better bonding between layers, which may slightly improve the mechanical properties. To summarize, increasing the flow percentage tends to strengthen the part, while layer thickness plays a smaller but still important role in determining the final mechanical properties of the 3D-printed specimen.
Plot (b) in Figure 10 illustrates the relationship between the flow rate and wall thickness, as well as their combined effect on the stress. As the flow rate increases from 85% to 115%, the stress values increase. This suggests that increasing the flow rate beyond the default value leads to stronger parts due to greater material deposition, which improves layer adhesion and overall structural integrity. There is a noticeable trend that as wall thickness increases from 1.2 mm to 2.4 mm, the stress values rise. This indicates that thicker walls result in stronger parts, which is expected as more material contributes to the overall load-bearing capacity of the part. In summary, increasing both wall thickness and flow percentage improves the stress capacity of the 3D printed part, with wall thickness showing a more significant influence on the final strength.
Plot (c) in Figure 10 shows the relationship between wall thickness and layer height, in addition to their combined effect on the stress. The plot shows that as layer height increases from 0.1 mm to 0.3 mm, the stress values slightly decrease. This suggests that thinner layers result in better mechanical strength, likely because smaller layers allow for better bonding between each printed layer, making the part stronger. As wall thickness increases from 1.2 mm to 2.4 mm, the stress values also increase. Thicker walls contribute to a stronger part, which is expected because more material creates a more rigid structure capable of withstanding higher mechanical loads. In conclusion, the plot indicates that decreasing layer height and increasing wall thickness both contribute to stronger 3D-printed parts, with wall thickness playing a larger role in improving stress resistance.

3.7. Prediction and Validation

Testing the reliability of the prediction model is very important. For this reason, at the end of the research, the equation was validated by printing and testing new specimens. More specifically, three new specimens were printed, twice each for V1, V2, and V3. The values of the three parameters given must be within the range of the original tests. Specimen V1 had parameters of flow = 110%, wall = 1.2 mm, and layer 0.15 mm. Specimen V2 had parameters of flow = 90%, wall = 1.8 mm, and Layer 0.25 mm. And finally, specimen V3 had parameters of flow = 95%, wall = 2.4 mm, and layer 0.20 mm. The value of the wall depends on the diameter of the nozzle, so it cannot be further parameterized. A total of six specimens were printed and subjected to tensile strength testing. Table 7 shows the results of the measurements (Max Load), the average values of the measurements (Average Max Load), the average stress (σ), the prediction of the model (regression), and the relative error between prediction and measured stress (relative error). The error validates the reliability of the model as its maximum value is presented in V3 and is 3.72%.

4. Conclusions

The purpose of the present study was to measure the maximum tensile strength of three-dimensional-printed samples using the NEEMA3D™ CARBON: PLUS material. The specific material consists of PET-G reinforced with 20% carbon fiber. The CreatBotTM D600 Pro FFF category 3D printer was used to manufacture the printed samples. For evaluation purposes, three variables related to 3D print settings were defined. The variable parameters were the flow, wall, and layer. Three levels of values were used for each variable: the flow (85, 100, and 115%), wall (1.2, 1.8, and 2.4 mm), and layer (0.1, 0.2, and 0.3 mm). To realize all possible combinations, 27 experiments had to be 3D printed. Printing was carried out twice in order to improve the reliability of the experiments performed. From the results of the tests and observing the results, the following conclusions were drawn:
  • Decreasing the layer parameter significantly increases the strength of the 3D-printed sample. Also, changes to the values of the wall and flow affect the slope rate of the curves separately for each value of the layer.
  • The increase in the wall parameter increased the tensile strength of the structures at a corresponding rate. The increase in tensile stress did not show a linear rate. At the same time, the flow did not seem to affect the rate of stress increase, as the slopes of the lines in the diagram (6.3) in Figure 6 show a uniform increase at all three values of the flow.
  • The smaller the number of the layer, the more incremental the rate of increase was in tensile strength.
  • The flow parameter affected the strength of the specimens with similar results to those of the wall. Increasing the flow in all cases increased the strength of the specimens accordingly. Changes in wall values did not affect the slope of the lines. However, the layer also in this case seemed to affect the gradients of the lines.
  • The flow and layer are two important parameters, as they affect either directly or indirectly in any case the tendency of the essays. This fact can be seen in Figure 6, where the combinations of the flow and layer diagrams (6.2) and (6.5) show the maximum slopes of the lines.
  • The maximum tensile strength was equal to σ = 98.48 MPa and was found in test series 9 (layer = 0.1 mm, wall = 2.4 mm, flow = 115%).
  • The minimum tensile strength was equal to σ = 41.26 MPa and was found in test series 19 (layer = 0.3 mm, wall = 1.2 mm, flow = 85%).
Using RSM (Response Surface Methodology), the imported and exported data of this study were analyzed. Through RSM, the degree of influence of each parameter on the stress of the printed specimens is found. An equation (prediction model) was then developed by RSM, which predicts the trend based on the parameter values.
At the end of this study, the prediction model was validated. Initially, three additional samples were defined with parameters different from the original 27, and through the model, the predicted tensile stress was calculated. Then, the three specimens were printed twice each, and their true tensile stresses were measured. The model appeared to estimate the stress very accurately, as the relative error in the three samples was 0.95%, −1.37%, and 3.72%. In future work, additional experiments on impact, compression, and bending will be performed. In this way, the material will be evaluated as a whole in different types of trends.

Author Contributions

Conceptualization, P.M. and P.K.; methodology, P.M.; software, P.M.; validation, P.M., N.E. and P.K.; formal analysis, P.M. and N.E.; investigation, P.M. and A.T.; resources, P.M. and N.E.; data curation, P.M., A.T. and N.E.; writing—original draft preparation, P.M., A.T., N.E. and P.K.; writing—review and editing, P.M., A.T., N.E. and P.K.; visualization, P.M., A.T. and P.K.; supervision, A.T. and P.K.; project administration, A.T. and P.K.; funding acquisition, P.M. and P.K. All authors have read and agreed to the published version of the manuscript.

Funding

This research received no external funding.

Institutional Review Board Statement

Not Applicable.

Informed Consent Statement

Not Applicable.

Data Availability Statement

The data presented in this study are available in the article.

Conflicts of Interest

The authors declare no conflicts of interest.

References

  1. Yao, S.S.; Jin, F.L.; Rhee, K.Y.; Hui, D.; Park, S.J. Recent Advances in Carbon-Fiber-Reinforced Thermoplastic Composites: A Review. Compos. B Eng. 2018, 142, 241–250. [Google Scholar] [CrossRef]
  2. Grünewald, J.; Parlevliet, P.; Altstädt, V. Manufacturing of Thermoplastic Composite Sandwich Structures: A Review of Literature. J. Thermoplast. Compos. Mater. 2017, 30, 437–464. [Google Scholar] [CrossRef]
  3. Blok, L.G.; Longana, M.L.; Yu, H.; Woods, B.K.S. An Investigation into 3D Printing of Fibre Reinforced Thermoplastic Composites. Addit. Manuf. 2018, 22, 176–186. [Google Scholar] [CrossRef]
  4. Bahari, S.A.; Krause, A. Utilizing Malaysian Bamboo for Use in Thermoplastic Composites. J. Clean Prod. 2016, 110, 16–24. [Google Scholar] [CrossRef]
  5. Tao, Y.; Wang, H.; Li, Z.; Li, P.; Shi, S.Q. Development and Application of Wood Flour-Filled Polylactic Acid Composite Filament for 3d Printing. Materials 2017, 10, 339. [Google Scholar] [CrossRef]
  6. Kechagias, J.D.; Zaoutsos, S.P.; Chaidas, D.; Vidakis, N. Multi-Parameter Optimization of PLA/Coconut Wood Compound for Fused Filament Fabrication Using Robust Design. Int. J. Adv. Manuf. Technol. 2022, 119, 4317–4328. [Google Scholar] [CrossRef]
  7. Mohammadizadeh, M.; Lu, H.; Fidan, I.; Tantawi, K.; Gupta, A.; Hasanov, S.; Zhang, Z.; Alifui-Segbaya, F.; Rennie, A. Mechanical and Thermal Analyses of Metal-PLA Components Fabricated by Metal Material Extrusion. Inventions 2020, 5, 1–11. [Google Scholar] [CrossRef]
  8. Elessawy, N.A.; El Shakhs, A.; Fahmy El-Saka, M.; Youssef, M.E.; Youssef, B.A.B.; Malek Ali, M.A. Sustainable and Eco-Friendly 3D Printing Filament Fabricated from Different Recycled Solid Wastes and Evaluate Its Impact on Interior and Furniture Design. Results Eng. 2024, 23, 102428. [Google Scholar] [CrossRef]
  9. Wickramasinghe, S.; Do, T.; Tran, P. FDM-Based 3D Printing of Polymer and Associated Composite: A Review on Mechanical Properties, Defects and Treatments. Polymers 2020, 12, 1–42. [Google Scholar] [CrossRef]
  10. Baechle-Clayton, M.; Loos, E.; Taheri, M.; Taheri, H. Failures and Flaws in Fused Deposition Modeling (FDM) Additively Manufactured Polymers and Composites. J. Compos. Sci. 2022, 6, 202. [Google Scholar] [CrossRef]
  11. Fetecau, C.; Dobrea, D.V.; Postolache, I. Overmolding injection molding simulation of tensile test specimen. Int. J. Mod. Manuf. Technol. 2010, 2, 45. [Google Scholar]
  12. Takemura, K.; Minekage, Y. Effect of Molding Condition on Tensile Properties of Hemp Fiber Reinforced Composite. Adv. Compos. Mater. Off. J. Jpn. Soc. Compos. Mater. 2007, 16, 385–394. [Google Scholar] [CrossRef]
  13. Pothan, L.A.; Mai, Y.W.; Thomas, S.; Li, R.K.Y. Tensile and Flexural Behavior of Sisal Fabric/Polyester Textile Composites Prepared by Resin Transfer Molding Technique. J. Reinf. Plast. Compos. 2008, 27, 1847–1866. [Google Scholar] [CrossRef]
  14. Sanford, L.T.; Jaafar, I.H.; Seibi, A.; Gohn, A. The Effect of Infill Angle, Build Orientation, and Void Fraction on the Tensile Strength and Fracture of 3D Printed ASA via Fused Filament Fabrication. Manuf. Lett. 2022, 33, 569–573. [Google Scholar] [CrossRef]
  15. Tzotzis, A.; Manavis, A.; Efkolidis, N.; García-Hernández, C.; Kyratsis, P. Analysis of the Influence of Structural Characteristics on the Tensile Properties of Fused Filament Fabricated ABS Polymer Using Central Composite Design. Appl. Mech. 2024, 5, 20–35. [Google Scholar] [CrossRef]
  16. Samykano, M.; Selvamani, S.K.; Kadirgama, K.; Ngui, W.K.; Kanagaraj, G.; Sudhakar, K. Mechanical Property of FDM Printed ABS: Influence of Printing Parameters. Int. J. Adv. Manuf. Technol. 2019, 102, 2779–2796. [Google Scholar] [CrossRef]
  17. Torrado Perez, A.R.; Roberson, D.A.; Wicker, R.B. Fracture Surface Analysis of 3D-Printed Tensile Specimens of Novel ABS-Based Materials. J. Fail. Anal. Prev. 2014, 14, 343–353. [Google Scholar] [CrossRef]
  18. Lobov, E.; Vindokurov, I.; Tashkinov, M. Mechanical Properties and Performance of 3D-Printed Acrylonitrile Butadiene Styrene Reinforced with Carbon, Glass and Basalt Short Fibers. Polymers 2024, 16, 1106. [Google Scholar] [CrossRef]
  19. Abid, S.; Messadi, R.; Hassine, T.; Ben Daly, H.; Soulestin, J.; Lacrampe, M.F. Optimization of Mechanical Properties of Printed Acrylonitrile Butadiene Styrene Using RSM Design. Int. J. Adv. Manuf. Technol. 2019, 100, 1363–1372. [Google Scholar] [CrossRef]
  20. Wang, J.; Liu, Y.; Wang, K.; Yao, S.; Peng, Y.; Rao, Y.; Ahzi, S. Progressive collapse behaviors and mechanisms of 3D printed thin-walled composite structures under multi-conditional loading. Thin-Walled Struct. 2022, 171, 108810. [Google Scholar] [CrossRef]
  21. Forcellese, A.; Simoncini, M.; Vita, A.; Di Pompeo, V. 3D printing and testing of composite isogrid structures. Int. J. Adv. Manuf. Technol. 2020, 109, 1881–1893. [Google Scholar] [CrossRef]
  22. Fisher, T.; Almeida, J.H.S., Jr.; Falzon, B.G.; Kazancı, Z. Tension and compression properties of 3D-printed composites: Print orientation and strain rate effects. Polymers 2023, 15, 1708. [Google Scholar] [CrossRef]
  23. Bragaglia, M.; Paleari, L.; Passaro, J.; Russo, P.; Fabbrocino, F.; Luciano, R.; Nanni, F. 3D printing of biodegradable and self-monitoring SWCNT-loaded biobased resin. Compos. Sci. Technol. 2023, 243, 110253. [Google Scholar] [CrossRef]
  24. Hanon, M.M.; Ghaly, A.; Zsidai, L.; Szakál, Z.; Szabó, I.; Kátai, L. Investigations of the mechanical properties of DLP 3D printed graphene/resin composites. Acta Polytech. Hung 2021, 18, 143–161. [Google Scholar] [CrossRef]
  25. ASTM D638-22; Standard Test Method for Tensile Properties of Plastics. American Society for Testing and Materials: West Conshohocken, PA, USA, 2022. Available online: https://www.astm.org/d0638-22.html (accessed on 1 July 2024).
  26. Rismalia, M.; Hidajat, S.C.; Permana, I.G.R.; Hadisujoto, B.; Muslimin, M.; Triawan, F. Infill Pattern and Density Effects on the Tensile Properties of 3D Printed PLA Material. J. Phys. Conf. Ser. 2019, 1402, 044041. [Google Scholar]
  27. Atakok, G.; Kam, M.; Koc, H.B. Tensile, Three-Point Bending and Impact Strength of 3D Printed Parts Using PLA and Recycled PLA Filaments: A Statistical Investigation. J. Mater. Res. Technol. 2022, 18, 1542–1554. [Google Scholar] [CrossRef]
  28. Anderson, I. Mechanical Properties of Specimens 3D Printed with Virgin and Recycled Polylactic Acid. 3D Print Addit. Manuf. 2017, 4, 110–115. [Google Scholar] [CrossRef]
  29. Breški, T.; Hentschel, L.; Godec, D.; Đuretek, I. Suitability of Recycled PLA Filament Application in Fused Filament Fabrication Process. Teh. Glas. 2021, 15, 491–497. [Google Scholar] [CrossRef]
  30. Ghabezi, P.; Sam-Daliri, O.; Flanagan, T.; Walls, M.; Harrison, N.M. Circular economy innovation: A deep investigation on 3D printing of industrial waste polypropylene and carbon fibre composites. Resour. Conserv. Recycl. 2024, 206, 107667. [Google Scholar] [CrossRef]
  31. Khabia, S.; Jain, K.K. Comparison of Mechanical Properties of Components 3D Printed from Different Brand ABS Filament on Different FDM Printers. Mater. Today Proc. 2019, 26, 2907–2914. [Google Scholar] [CrossRef]
  32. Marșavina, L.; Vălean, C.; Mărghitaș, M.; Linul, E.; Razavi, N.; Berto, F.; Brighenti, R. Effect of the Manufacturing Parameters on the Tensile and Fracture Properties of FDM 3D-Printed PLA Specimens. Eng. Fract. Mech. 2022, 274, 108766. [Google Scholar] [CrossRef]
  33. Tzotzis, A.; Antoniadis, A.; Kyratsis, P. Multivariate Modelling of AA6082-T6 Drilling Performance Using RSM, ANN and Response Optimization. Int. J. Lightweight Mater. Manuf. 2024, 7, 531–545. [Google Scholar] [CrossRef]
  34. Tzotzis, A.; García-Hernández, C.; Huertas-Talón, J.L.; Kyratsis, P. Influence of the Nose Radius on the Machining Forces Induced during AISI-4140 Hard Turning: A CAD-Based and 3D FEM Approach. Micromachines 2020, 11, 798. [Google Scholar] [CrossRef] [PubMed]
  35. Tzotzis, A.; Garciá-Hernández, C.; Huertas-Talón, J.L.; Kyratsis, P. 3D FE Modelling of Machining Forces during AISI 4140 Hard Turning. Stroj. Vestn./J. Mech. Eng. 2020, 66, 467–478. [Google Scholar] [CrossRef]
  36. NEEMA3D™ CARBON: PLUS. Available online: http://www.neema3d.com/neema3dt-plus-sign-materials/carbon-plus (accessed on 1 July 2024).
  37. Blaj, M.I.; Zaharia, S.M.; Pop, M.A.; Oancea, G.H.E.O.R.G.H.E. Tensile properties and manufacturing defectives of short carbon fiber specimens made with the FDM process. Mater. Plast. 2022, 59, 33–43. [Google Scholar] [CrossRef]
  38. Muhamedagic, K.; Berus, L.; Potočnik, D.; Cekic, A.; Begic-Hajdarevic, D.; Cohodar Husic, M.; Ficko, M. Effect of process parameters on tensile strength of FDM printed carbon fiber reinforced polyamide parts. Appl. Sci. 2022, 12, 6028. [Google Scholar] [CrossRef]
  39. Cao, M.; Cui, T.; Yue, Y.; Li, C.; Guo, X.; Jia, X.; Wang, B. Investigation of carbon fiber on the tensile property of FDM-produced PLA specimen. Polymers 2022, 14, 5230. [Google Scholar] [CrossRef]
  40. Kamaal, M.; Anas, M.; Rastogi, H.; Bhardwaj, N.; Rahaman, A. Effect of FDM process parameters on mechanical properties of 3D-printed carbon fibre–PLA composite. Prog. Addit. Manuf. 2021, 6, 63–69. [Google Scholar] [CrossRef]
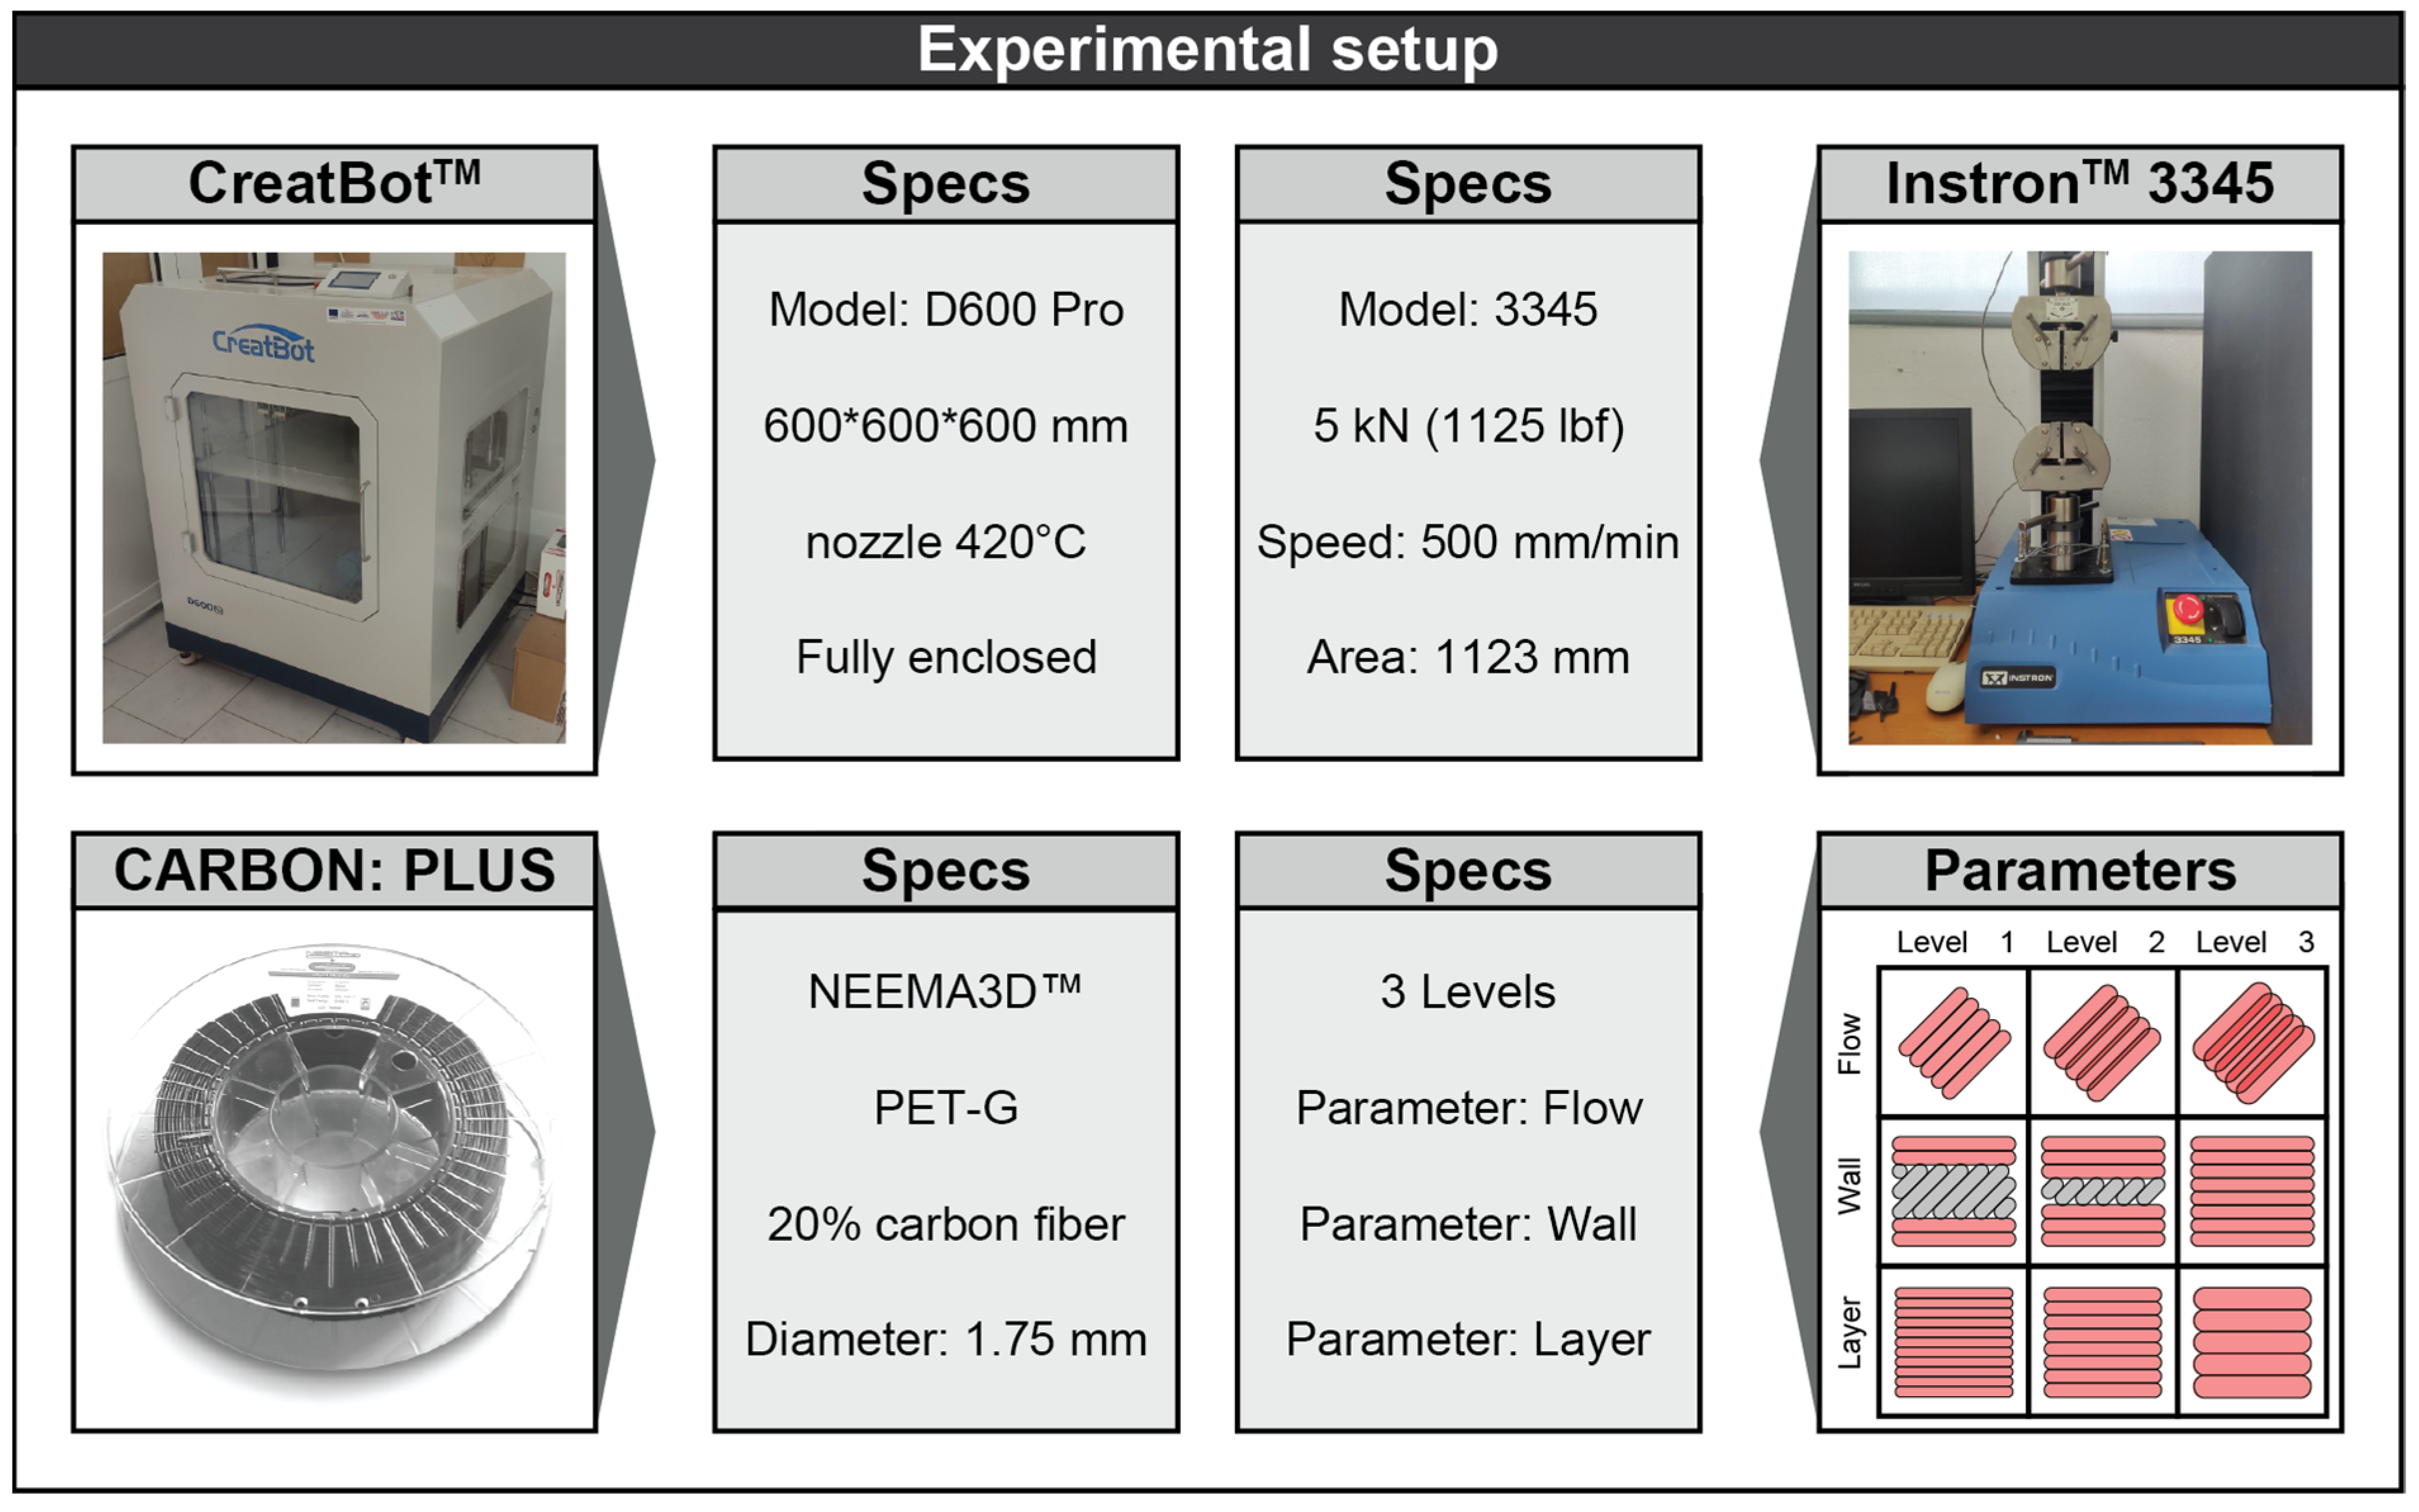
Figure 1. The complete experimental setup of the present study.
Applmech 05 00041 g001
Figure 2. The specimen’s standard dimensions used.
Applmech 05 00041 g002
Figure 3. The complete set of combinations used.
Applmech 05 00041 g003
Figure 4. Three-dimensional printing of the specimens, testing their strength with a tensile testing machine.
Applmech 05 00041 g004
Figure 5. Main effects plot graph for the flow, wall, and layer.
Applmech 05 00041 g005
Figure 6. Interaction plot graph for the flow, wall, and layer.
Applmech 05 00041 g006
Figure 7. Stress–strain curves for three specimens.
Applmech 05 00041 g007
Figure 8. Residual analysis and model summary. (a) Normal probability; (b) Versus fits; (c) Versus order.
Applmech 05 00041 g008
Figure 9. The relative error between the experimental and mathematically derived results.
Applmech 05 00041 g009
Figure 10. Three-dimensional surface plots with the relationship between the parameters and the tensile stress.
Applmech 05 00041 g010
Table 1. Characteristics and test results of the filament NEEMA3D™ CARBON: PLUS.
DescriptionTypical Value
Specific gravity1.19 g/cc
E-modulus 1 mm/min3800 MPa
Yield stress 50 mm/min52.5 MPa
Yield strain 50 mm/min4.2%
Strain at break 50 min/min8%
Impact strength izod notched 23 °C3.8 kJ/m2
Heat distortion80 °C
Table 2. The three variable parameters and their three levels.
LevelFlow (%)Wall (mm)Layer (mm)
−1851.2 (2 walls)0.1
01001.8 (3 walls)0.2
+11152.4 (4 walls)0.3
Table 3. The default 3D printer settings.
Operation ParameterValue
Nozzle Temperature245 °C
Bed Temperature60 °C
Infill100%
Filament Diameter1.75 mm
Nozzle Diameter0.6 mm
Printing Speed40 mm/s
Perimeter Speed50%
Cooling Fan100%
Table 4. The maximum stress results for each set of experiments.
TestFlow (%)Wall (mm)Layer (mm)Flow
Level
Wall
Level
Layer
Level
Average Max Load (kN)σ (MPa)
1851.20.1−1−1−10.98545.606
2851.80.1−10−11.24757.733
3852.40.1−11−11.35762.829
41001.20.10−1−11.26658.633
51001.80.100−11.69378.373
61002.40.101−11.80083.320
71151.20.11−1−11.55171.825
81151.80.110−11.99392.286
91152.40.111−12.12798.483
10851.20.2−1−100.95344.097
11851.80.2−1001.18955.040
12852.40.2−1101.27559.029
131001.20.20−101.23757.290
141001.80.20001.51770.216
151002.40.20101.59974.014
161151.20.21−101.41265.381
171151.80.21001.65276.465
181152.40.21101.72079.635
19851.20.3−1−110.89141.260
20851.80.3−1011.07049.514
21852.40.3−1111.09550.707
221001.20.30−111.07449.724
231001.80.30011.20455.751
241002.40.30111.22256.554
251151.20.31−111.15953.644
261151.80.31011.27659.083
271152.40.31111.27959.219
Table 5. The maximum stress results, based on various studies, for different filaments.
InfoPET 15% carbonPA6/66 10% carbonPLA 30% carbonPLA 5.5% carbon
Max stress (MPa)58.0 MPa91.53 MPa49.41 MPa46.26 MPa
AuthorsMadalina et al.Muhamedagic et al.Cao et al.Kamaal et al.
Reference[37][38][39][40]
Table 6. Analysis of variance results.
SourceDegree of FreedomSum of SquaresMean Squaref-Valuep-ValueContribution%
Regression95440.98604.553202.720.000
Error1750.702.982
Total265491.68
R-sq = 99.08%  R-sq (adj) = 98.59%  R-sq (pred) = 97.05%
Term
F (%)196.0096.00432.190.0007.5
W1147.14147.14049.340.00011.5
L (mm)1308.84308.841103.560.00024.2
F2139.0439.03913.090.0023.1
W21111.72111.72037.460.0008.8
L2126.4526.4468.870.0082.1
F × W11.991.9890.670.4250.2
F × L1362.60362.598121.590.00028.4
W × L1181.86181.86060.980.00014.3
Table 7. Presentation of measurements and validation.
Validation
Test
Flow
(%)
Wall
(mm)
Layer
(mm)
Max Load
(kN)
Average Max
Load (kN)
σ (MPa)Regression (MPa)Relative Error
(%)
V1.11101.20.151.4301.43466.41067.0440.95
V1.21101.20.151.438
V2.1901.80.251.2511.25858.24057.439−1.37
V2.2901.80.251.264
V3.1952.40.201.4361.42565.99568.4443.72
V3.2952.40.201.414
Disclaimer/Publisher’s Note: The statements, opinions and data contained in all publications are solely those of the individual author(s) and contributor(s) and not of MDPI and/or the editor(s). MDPI and/or the editor(s) disclaim responsibility for any injury to people or property resulting from any ideas, methods, instructions or products referred to in the content.