Article

Analysis of Damage Value of Aluminum Alloys—Application of a Continuum Damage Mechanics Model

by
Vishavbandhu Kanwar
,
Vishwanath Managuli
* and
Y. S. Upadhyaya
*
Department of Mechanical & Industrial Engineering, Manipal Institute of Technology, Manipal Academy of Higher Education, Manipal 576104, India
*
Authors to whom correspondence should be addressed.
Appl. Mech. 2024, 5(4), 908-923; https://doi.org/10.3390/applmech5040050
Submission received: 16 September 2024 / Revised: 8 November 2024 / Accepted: 12 November 2024 / Published: 1 December 2024

Abstract

:
Damage refers to the degradation of a material subjected to an external condition such as loading, temperature, and environment. Several investigations have been undertaken to understand the damage of materials like steel, aluminum alloy, titanium alloy, and other materials. However, a comprehensive study on the range of damage values for various materials is scarce. Therefore, an attempt has been made in the current study to investigate the range of damage values of 32 aluminum alloys because of their widespread applications in the aerospace, railway, automotive, and marine industries. The damage value of materials is determined by incorporating the Continuum Damage Mechanics (CDM)-based Bhattacharya and Ellingwood model. This model demands the monotonic properties of materials as inputs, and these are obtained from the literature. The critical damage values of the alloys were determined, and their values vary in the range of 0.1 to 0.9. It was observed that damage value is primarily influenced by plastic strain. The variation in the damage value of aluminum alloys is also analyzed under different plastic strain conditions. The comprehensive results of critical damage value and the variation in the damage value of the aluminum alloys obtained helps in selecting an appropriate aluminum alloy for applications where damage criteria play a significant role.

1. Introduction

In the broad discipline of materials engineering, understanding damage mechanics remains crucial. The term damage is used to describe the loss or change in mechanical properties of a material or component subjected to service loading, environmental exposure, or aging [1]. Damage results in the performance degradation of the component, making it risky to use and may lead to catastrophic failures [2]. The capability to predict and comprehend the initiation and progress of damage is central to achieving the life prediction of structural elements. Damage value varies in the range of 0 to 1 for any material, where 0 represents the undamaged material, and 1 refers to a fully damaged material. This non-dimensional quantity is crucial to determining the degree of damage in a material [1,3]. Critical damage, symbolized by Dc, is related to the growth and linking up of microcracks or microvoids, which in turn form a condition called crack initiation.
Several models are effectively used to simulate and analyze damage in materials [1,4,5]. Application of damage mechanics models for microcracks was developed by Rice and Tracey [6] and Oyane [7]. These methodologies are sensitive to micro-level structural changes and offer alternative qualitative indexes to gauge critical damage values [2,8,9]. The models introduced by Freudenthal [10] and Cockroft-Latham [11] discussed the initiation and progress of a ductile crack with a focus on forming processes. Mashayekhi et al. [12] formulated a Continuum Damage Mechanics (CDM)-based low-cycle thermal fatigue model and assessed the low-cycle thermal fatigue life of a stainless steel engine exhaust manifold during its early design stage. Fan et al. [13] developed a fatigue–creep interaction model using a CDM-based effective stress concept, and the damage model was assessed by conducting high-temperature fatigue–creep interaction experiments on 1.25Cr0.5Mo steel. Bhattacharya and Ellingwood [14] developed and validated a CDM-based fatigue crack initiation model under variable amplitude loading using the fundamental principles of thermodynamics and mechanics. Gautam et al. [15] carried out a detailed review of various CDM-based ductile models and their applications.
In the present study, the CDM-based model developed by Bhattacharya and Ellingwood [3] was used for damage prediction. The extent of damage is analyzed through the damage value, which is primarily influenced by plastic strain. Aluminum alloys are widely used in several applications in the aerospace, automobile, and construction industries, and understanding the damage of such materials is essential from the designers’ perspective. Therefore, the present study focuses on analyzing the variation in damage value and critical damage value of several aluminum alloys subjected to loading conditions using a CDM-based model.

2. Material

Aluminum alloys are favored in various applications because they possess certain valuable features, including low density, a high strength-to-weight ratio, and good resistance to rust [16]. They can be employed in different areas, including the aerospace field and the automobile, construction, and manufacturing industries, among others. Aluminum alloys are grouped into several series based on material composition and the treatment they are subjected to. A series of aluminum alloys are analyzed in this study, with the significance of damage taken into consideration in their selection.
1xxx series: The 1xxx series is essentially pure with a minimum of 99% of aluminum content. These alloys are much sought after in several applications due to their superb corrosion resistance, high thermal and electrical conductivity, and ease of fabrication. The 1xxx series is widely used in chemical equipment, heat exchangers, and decorative applications. 1100-grade aluminum [17] usually has a copper and/or silicon content of up to 5%, so that the corrosion protection is enhanced with high conductivity and the material still maintains good formability.
2xxx series: Most of these alloys contain copper as the primary alloying element, and the materials of this series have better strength and machinability. Worldwide, the 2014-T6 alloy is known to possess better strength and good machinability. It is commonly used in manufacturing aircraft parts and other structures that require high-strength applications. Likewise, there is moderate strength 2017A-T4 alloy, used in aircraft fittings and transportation structures. 2024-T3 [18] and 2024-T351 are used for high-strength and -fatigue applications in aircraft structures such as wings and fuselages. These alloys are also suitable for producing car components because they show decent machining properties. The 2024-T4 aluminum alloy [19] is valued for its high strength-to-weight ratio and machinability and is widely used in aerospace, military, automotive, sports equipment, structural, marine, tooling, consumer goods, and space applications. 2219-T851 is an aluminum alloy that possess excellent fracture toughness, in addition to the advantage of weldability, which makes it highly suitable for aerospace applications such as fuel tanks and structures. 2618A-T651, developed for increased strength while providing some level of corrosion protection, is used in manufacturing engine parts, including in the aerospace and automotive industries.
5xxx series: These alloys are mainly magnesium-based, and they offer superior formability, weldability, and high levels of corrosion resistance. 5052 [20] is one of the most commonly used aluminum alloys because of its moderate strength and immunity to corrosion, particularly in aquatic and automobile applications. 5052-H32 is used in panels and enclosures where there is a need for high corrosion resistance. 5083 is known for its good weldability. The 5454 alloy is particularly useful for marine climatic conditions and is often employed in pressure vessels and chemical storage purposes. 5454-H34 is used in automobiles and marine products due to its high tensile strength, but the 5454-O grade is generally utilized for storage tanks as it can be easily shaped and formed. 5456-H311 is used for constructing ships and pressure vessels due to its ability to offer elevated strength and its resistance to marine corrosion. 5754 [21] and 5754-NG are used in car making and boat manufacturing due to their superior formability and high endurance.
6xxx series: The silicon and magnesium present in these alloys contribute to ts corrosion resistance and mechanical performance. Due to its good formability, high strength, and excellent weldability, it is widely used in structural members, transport vehicles, and pipelines. 6061-T6 is used in applications where strength and corrosion are critical factors [22,23]. 6061-T651 is one common variety that is used in spacecraft and boats because of its strength and serviceability. The 6063 alloy finds extensive usage in architecture, mainly due to its moderate corrosion toughness and good surface finish [24]. 6082-T6, an aluminum alloy with T6 heat treatment, boasts good strength and machinability and is ideal for structural use in car manufacturing and aerospace engineering.
7xxx series: These alloys, with zinc as the chief alloying element, are quite strong, with an extremely high strength-to-weight ratio and good fatigue life. Aluminum 7049-T6 is primarily employed in aircraft and aerospace industries for structural part fabrication on account of its high strength and favorable fatigue properties. 7050-T7351 has favorable properties such as high strength and fracture toughness and is mainly used in airplane structural parts such as the wings and body frames. 7075-T6 is used significantly in aerospace and military vehicles due to its high tensile strength [25,26]. 7075-T651 possesses the high strength and toughness needed to meet demands for highly stressed structural members in aerospace equipment [27]. 7075-T7351 has enhanced mechanical features and has applications in the construction of aerospace parts, such as those requiring strength and resistance to stress. 7175-T73 and 7175-T7351 are used for applications in the aerospace and military industries for their high strength and reasonable corrosion resistance [28].
Other aluminum alloys: These alloys include aluminum–magnesium series of alloys. AlMg4.5Mn provides both acceptable corrosion performance and acceptable mechanical properties that align well with the car and ship industries. AlMg-Si is strong and easily formable, which makes it suitable for use in many structural applications where formability is paramount. LC4CS is a type of high-strength alloy frequently used in sectors such as aerospace and the automotive industry, particularly where its superior strength-to-weight ratio enables it to provide the required performance with a minimum weight penalty. LC9CgS3, with satisfactory mechanical characteristics, is appropriate for use where high strength is associated with high durability. LY12CZ provides good strength combinations and fatigue resistance and is used in parts of aircraft and automobiles.
To determine the damage value of any material, the CDM model by Bhattacharya and Ellingwood demands the use of various material properties such as true fracture strength (σf), plastic strain ( ϵ p), monotonic strength coefficient (K), and strain hardening exponent (n). There is very limited literature where one can find all the required properties. A total of 32 Al alloys were identified, and their monotonic properties are presented in Table 1.

3. Methodology

The CDM model of isotropic damage growth corresponds to monotonic (uniaxial) material loading (Figure 1), and the increment of damage is determined by plastic strain. Critical damage is a significant concept in determining a material’s condition where damage accumulation reaches the final stage of rupture. Chow and Wei [36] postulate that critical damage (DC) is a material constant or material parameter. The value of DC ranges from a purely brittle mode of failure (DC = 0) to a purely ductile mode of failure (DC = 1), and is useful in terms of improving understanding of the failure tendencies of a material [1,3].
Though several CDM-based models are available [15], both for determining damage value at any instant of loading and the critical damage value, the Bhattacharya and Ellingwood [3]-developed CDM-based model is used as it uses the readily available monotonic properties of a material. Bhattacharya and Ellingwood [3] introduced a CDM-based isotropic damage growth model for uniaxial loading, incorporating the constitutive relationships as per the Ramberg–Osgood model [37]. This model investigates the correlation between effective stress and actual strain, whereby actual stress or plastic strain (Equation (1)) influence damage development. The initiation of damage takes place when a certain strain, abbreviated as ε d , is localized in the material. This threshold plastic strain is very small and approximated to zero when no estimates are available [3]. With the help of Equation (1) and using the monotonic properties of materials, the damage of aluminum alloys was evaluated.
D = 1 C 2 ε p 1 + n + C 1
ε p stands for the plastic strain the material has undergone, while n is the strain hardening exponent, which quantitatively describes how the hardening characteristic or material constant of the metal evolves with the plastic strain. The values of C 1 and C 2 , derived from monotonic stress–strain data of the material in Equation (2), show how the material responds under unidirectional stress state. These constraints link the plastic strain to the critical accumulation of damage, representing the onset of crack formation.
C 1 = 3 4 1 + n σ f K ε d 1 + n
C 2 = C 1 ε d ( 1 + n )

4. Results and Discussions

Overall result analysis is carried out by subdividing this section into a result analysis for all materials and a result analysis for various material series.

4.1. Result Analysis of All Materials

Using the Continuum Damage Mechanics (CDM)-based Bhattacharya and Ellingwood damage model, the value of critical damage (DC) is determined for the selected aluminum alloys and presented in Table 2. The result shows that the value of critical damage is primarily influenced by the true fracture ductility ( ε f ) of a material, and a higher value of DC is obtained as the material’s true fracture ductility increases. Figure 2 shows the trend in variation in the critical damage value of materials with true fracture ductility for all 32 materials. The trend shows that critical damage varies linearly with true fracture ductility until true fracture ductility reaches about 0.3, and, beyond this, the relationship is non-linear. Therefore, the curve of best fit is aptly represented by a logarithmic curve, and the curve has a coefficient of determination close to 1. This curve helps in the quick estimate of critical damage value for any given aluminum alloy.
The trend in variation in damage with respect to plastic strain is not the same for the entire range of critical damage values from 0.1 to 0.9. Accordingly, this variation is analyzed in the critical damage value range of 0.1 to 0.3 and 0.31 to 0.8 by observing its trend. All series of materials except the 7xxx series have critical damage values in the range of 0.1 to 0.3, and such materials have a true fracture ductility in the range of 0.14 to 0.45. In this lower range of critical damage values, damage varies linearly with plastic strain for all materials, as shown in Figure 3 (for clarity, only a few materials are shown). All series of materials have critical damage values in the range of 0.31 to 0.8, and such materials have a true fracture ductility in the range of 0.45 to 2.7. In this higher range of critical damage values, damage variation was observed to be non-linear with plastic strain for all materials, as shown in Figure 4 (for clarity, only a few materials are shown).
It can be observed from Table 2 that some materials have the same value of critical damage, though their true fracture ductility is different. This observation has resulted in further analysis of such cases, and, accordingly, all materials with the same critical damage value (only a few cases) are considered. Their variation in damage with plastic strain is shown in Figure 5a–d for materials with critical damage values of 0.16, 0.50, 0.68, and 0.86, respectively. The curves related to the same value of critical damage do not show the same nature. This is due to the influence of other parameters like true fracture strength, strength coefficient, and strain hardening exponent. The results also show that the damage variation trend changes after a plastic strain of about 0.13 for materials with a critical damage value of 0.16.

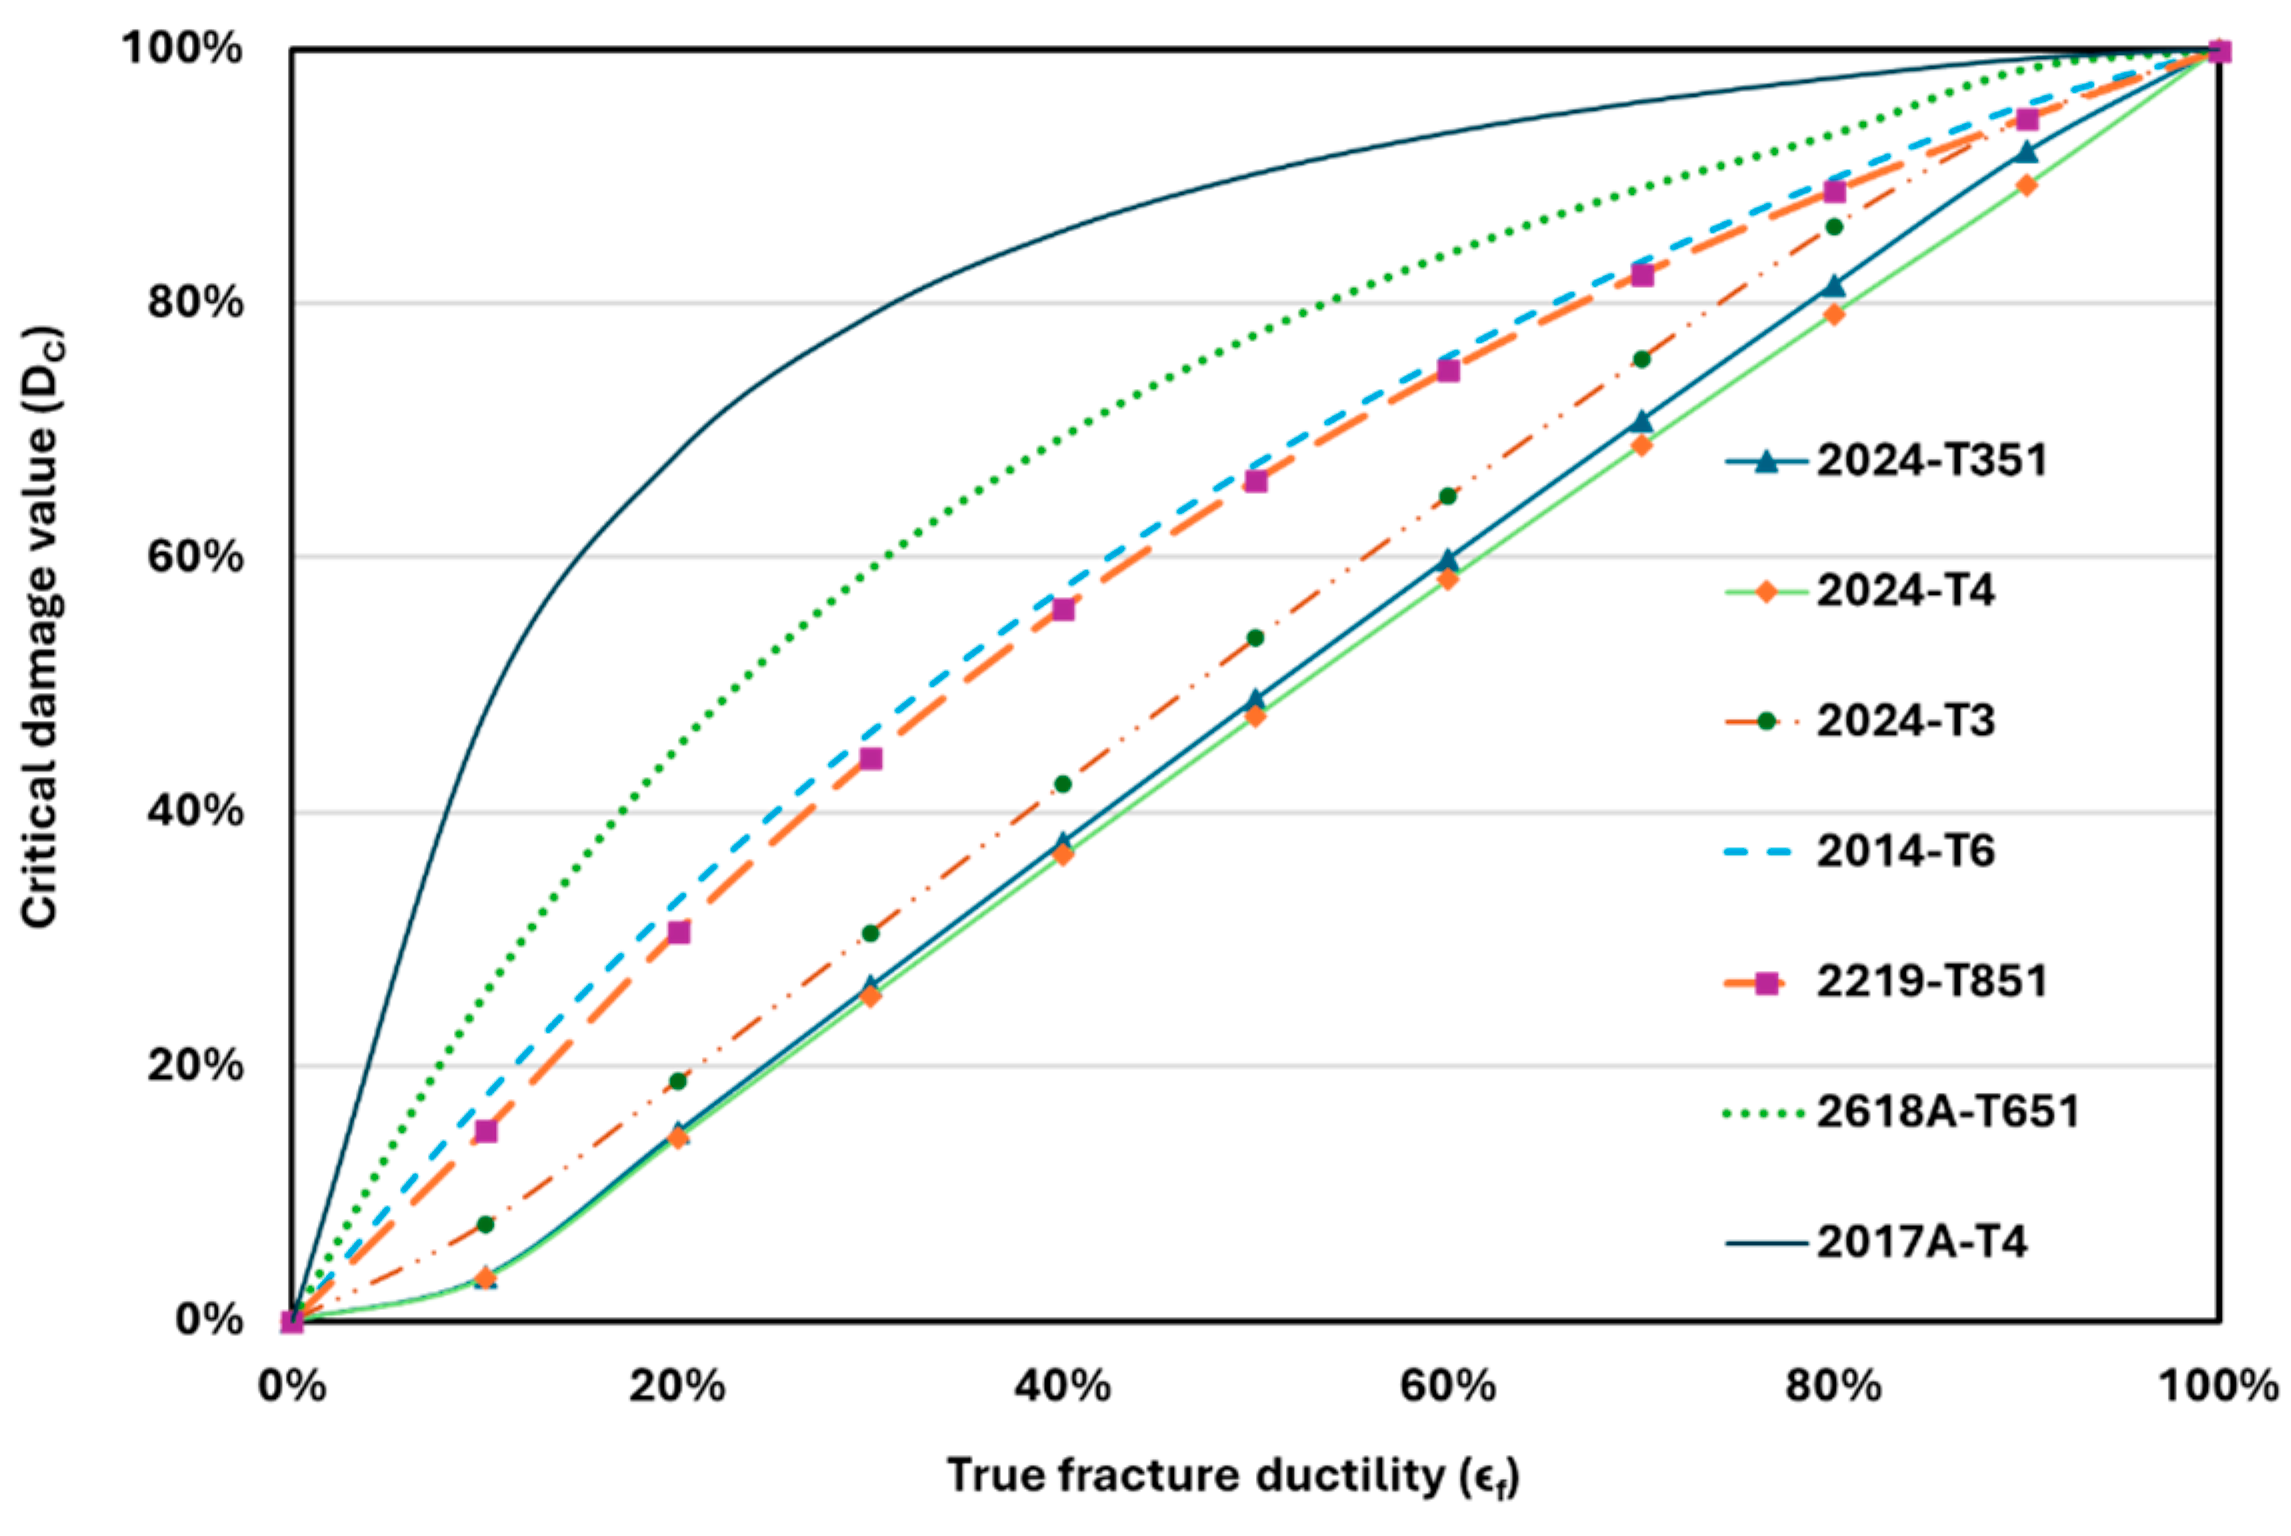
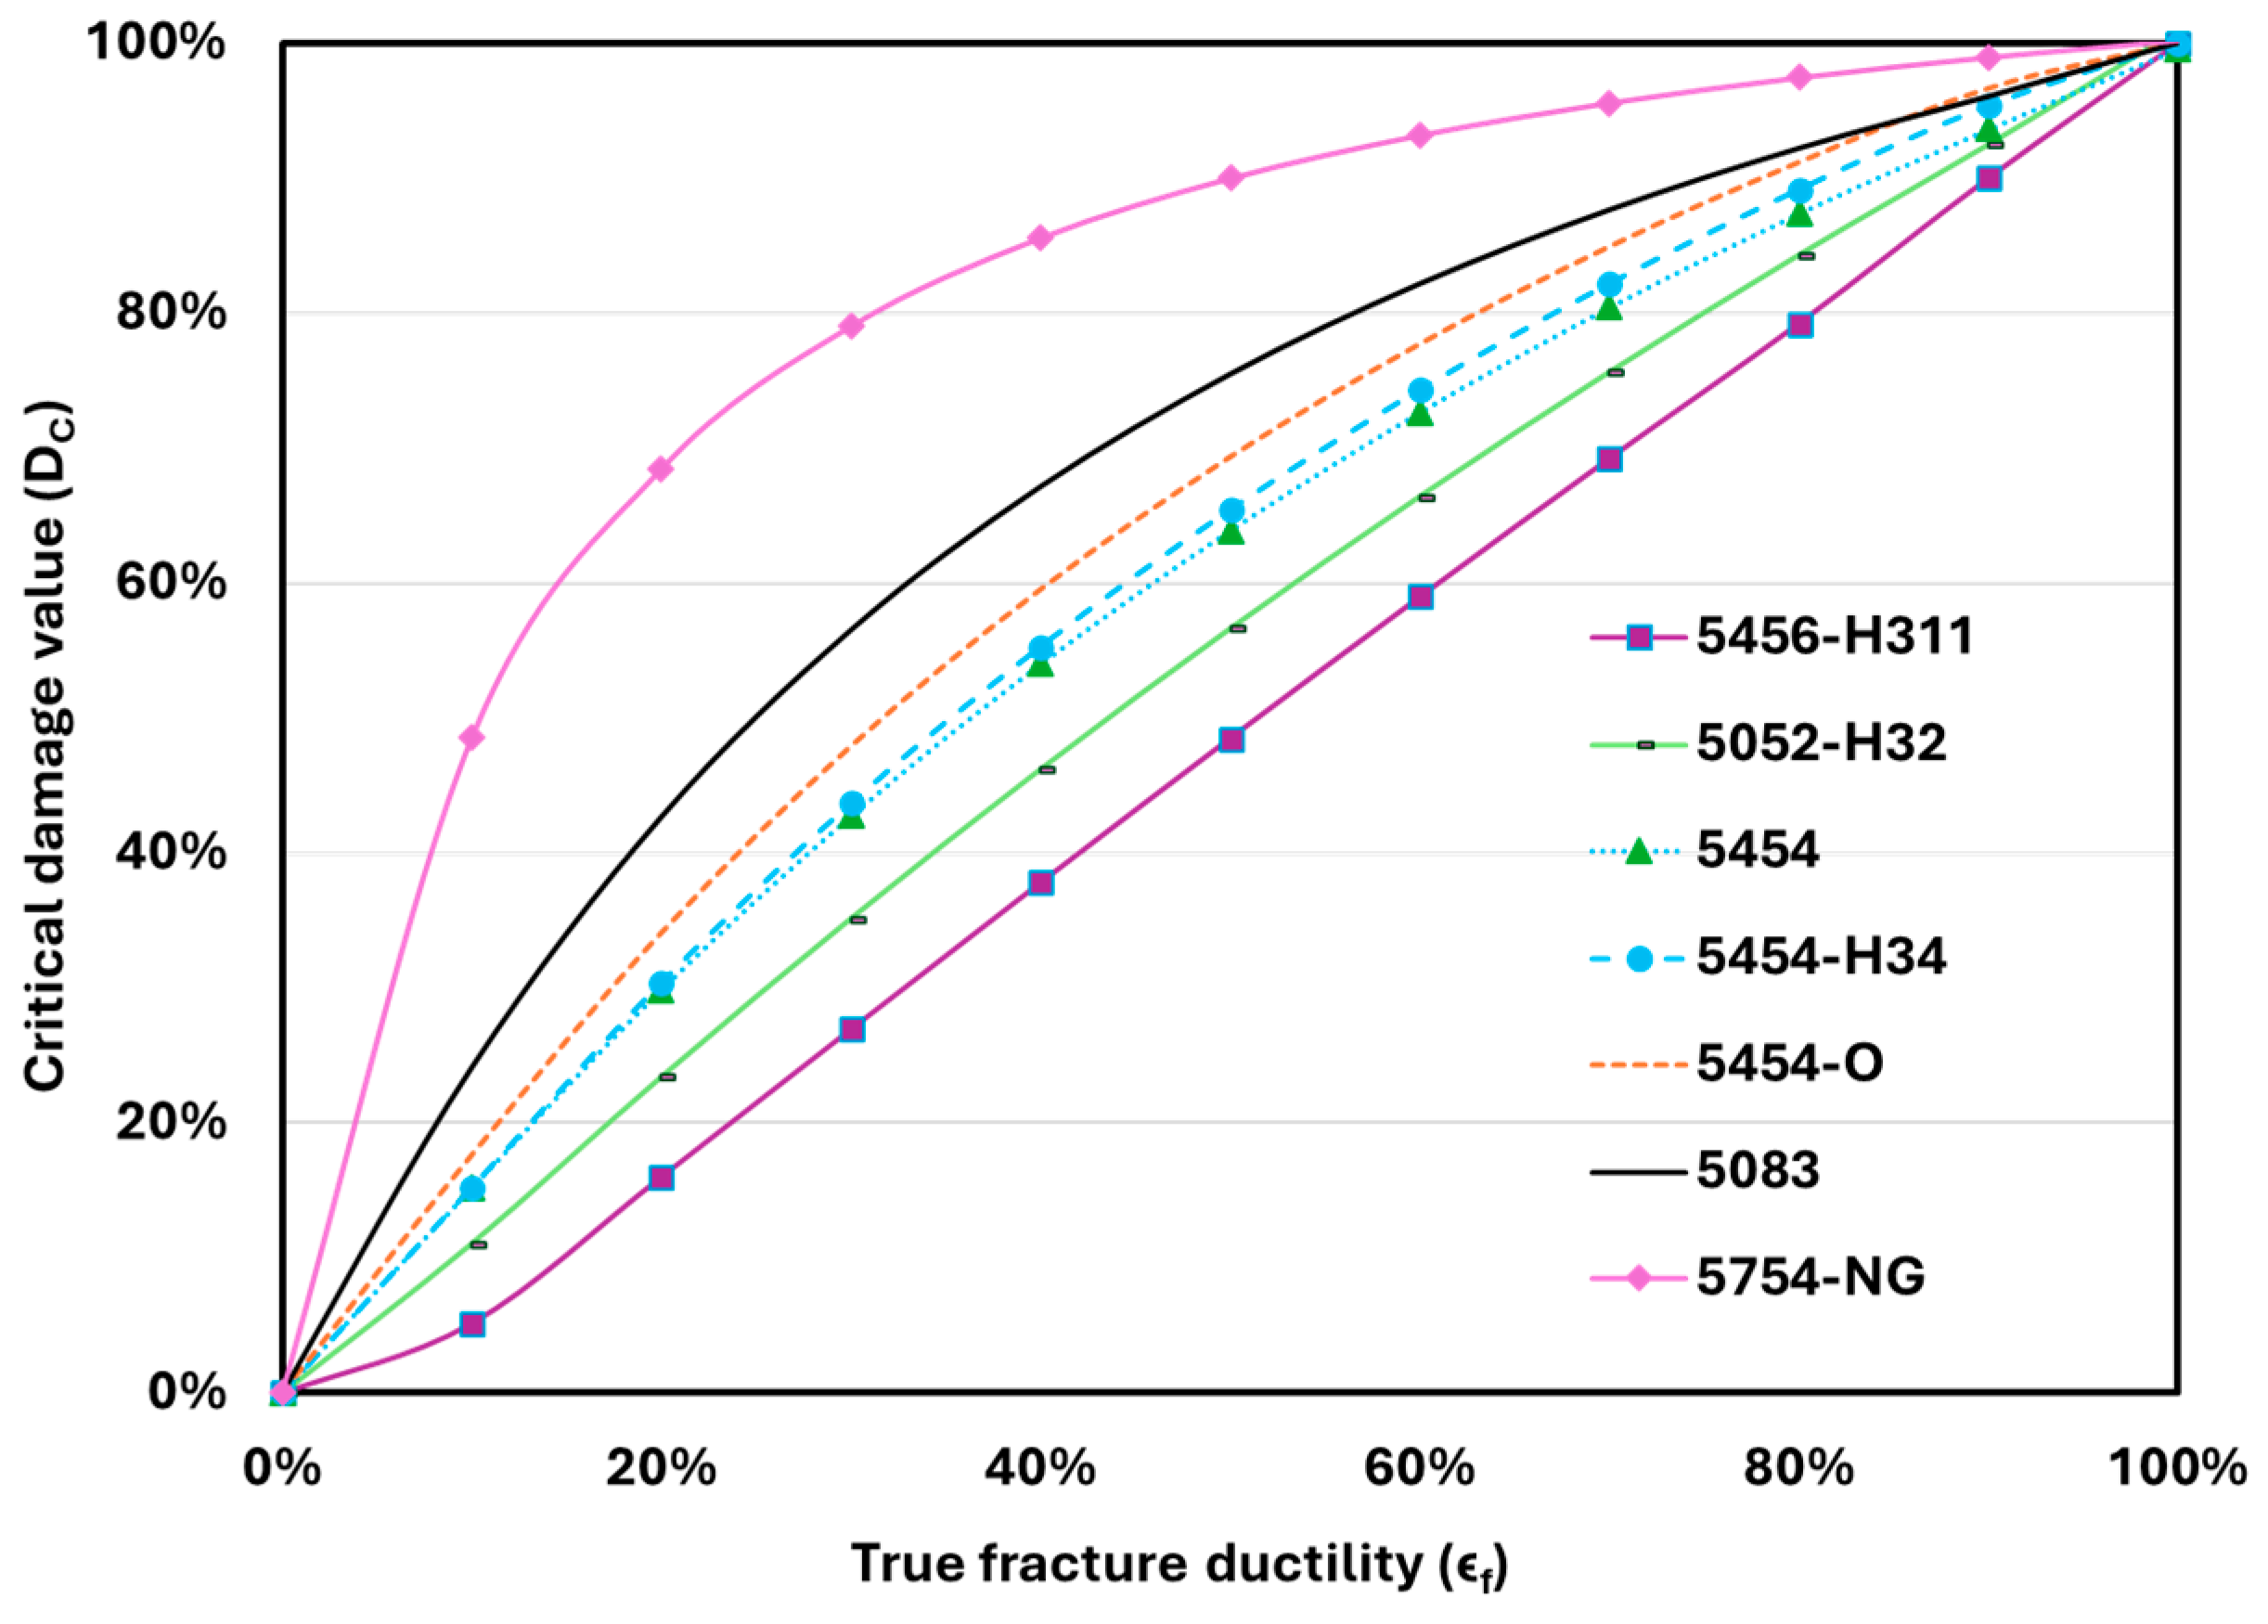
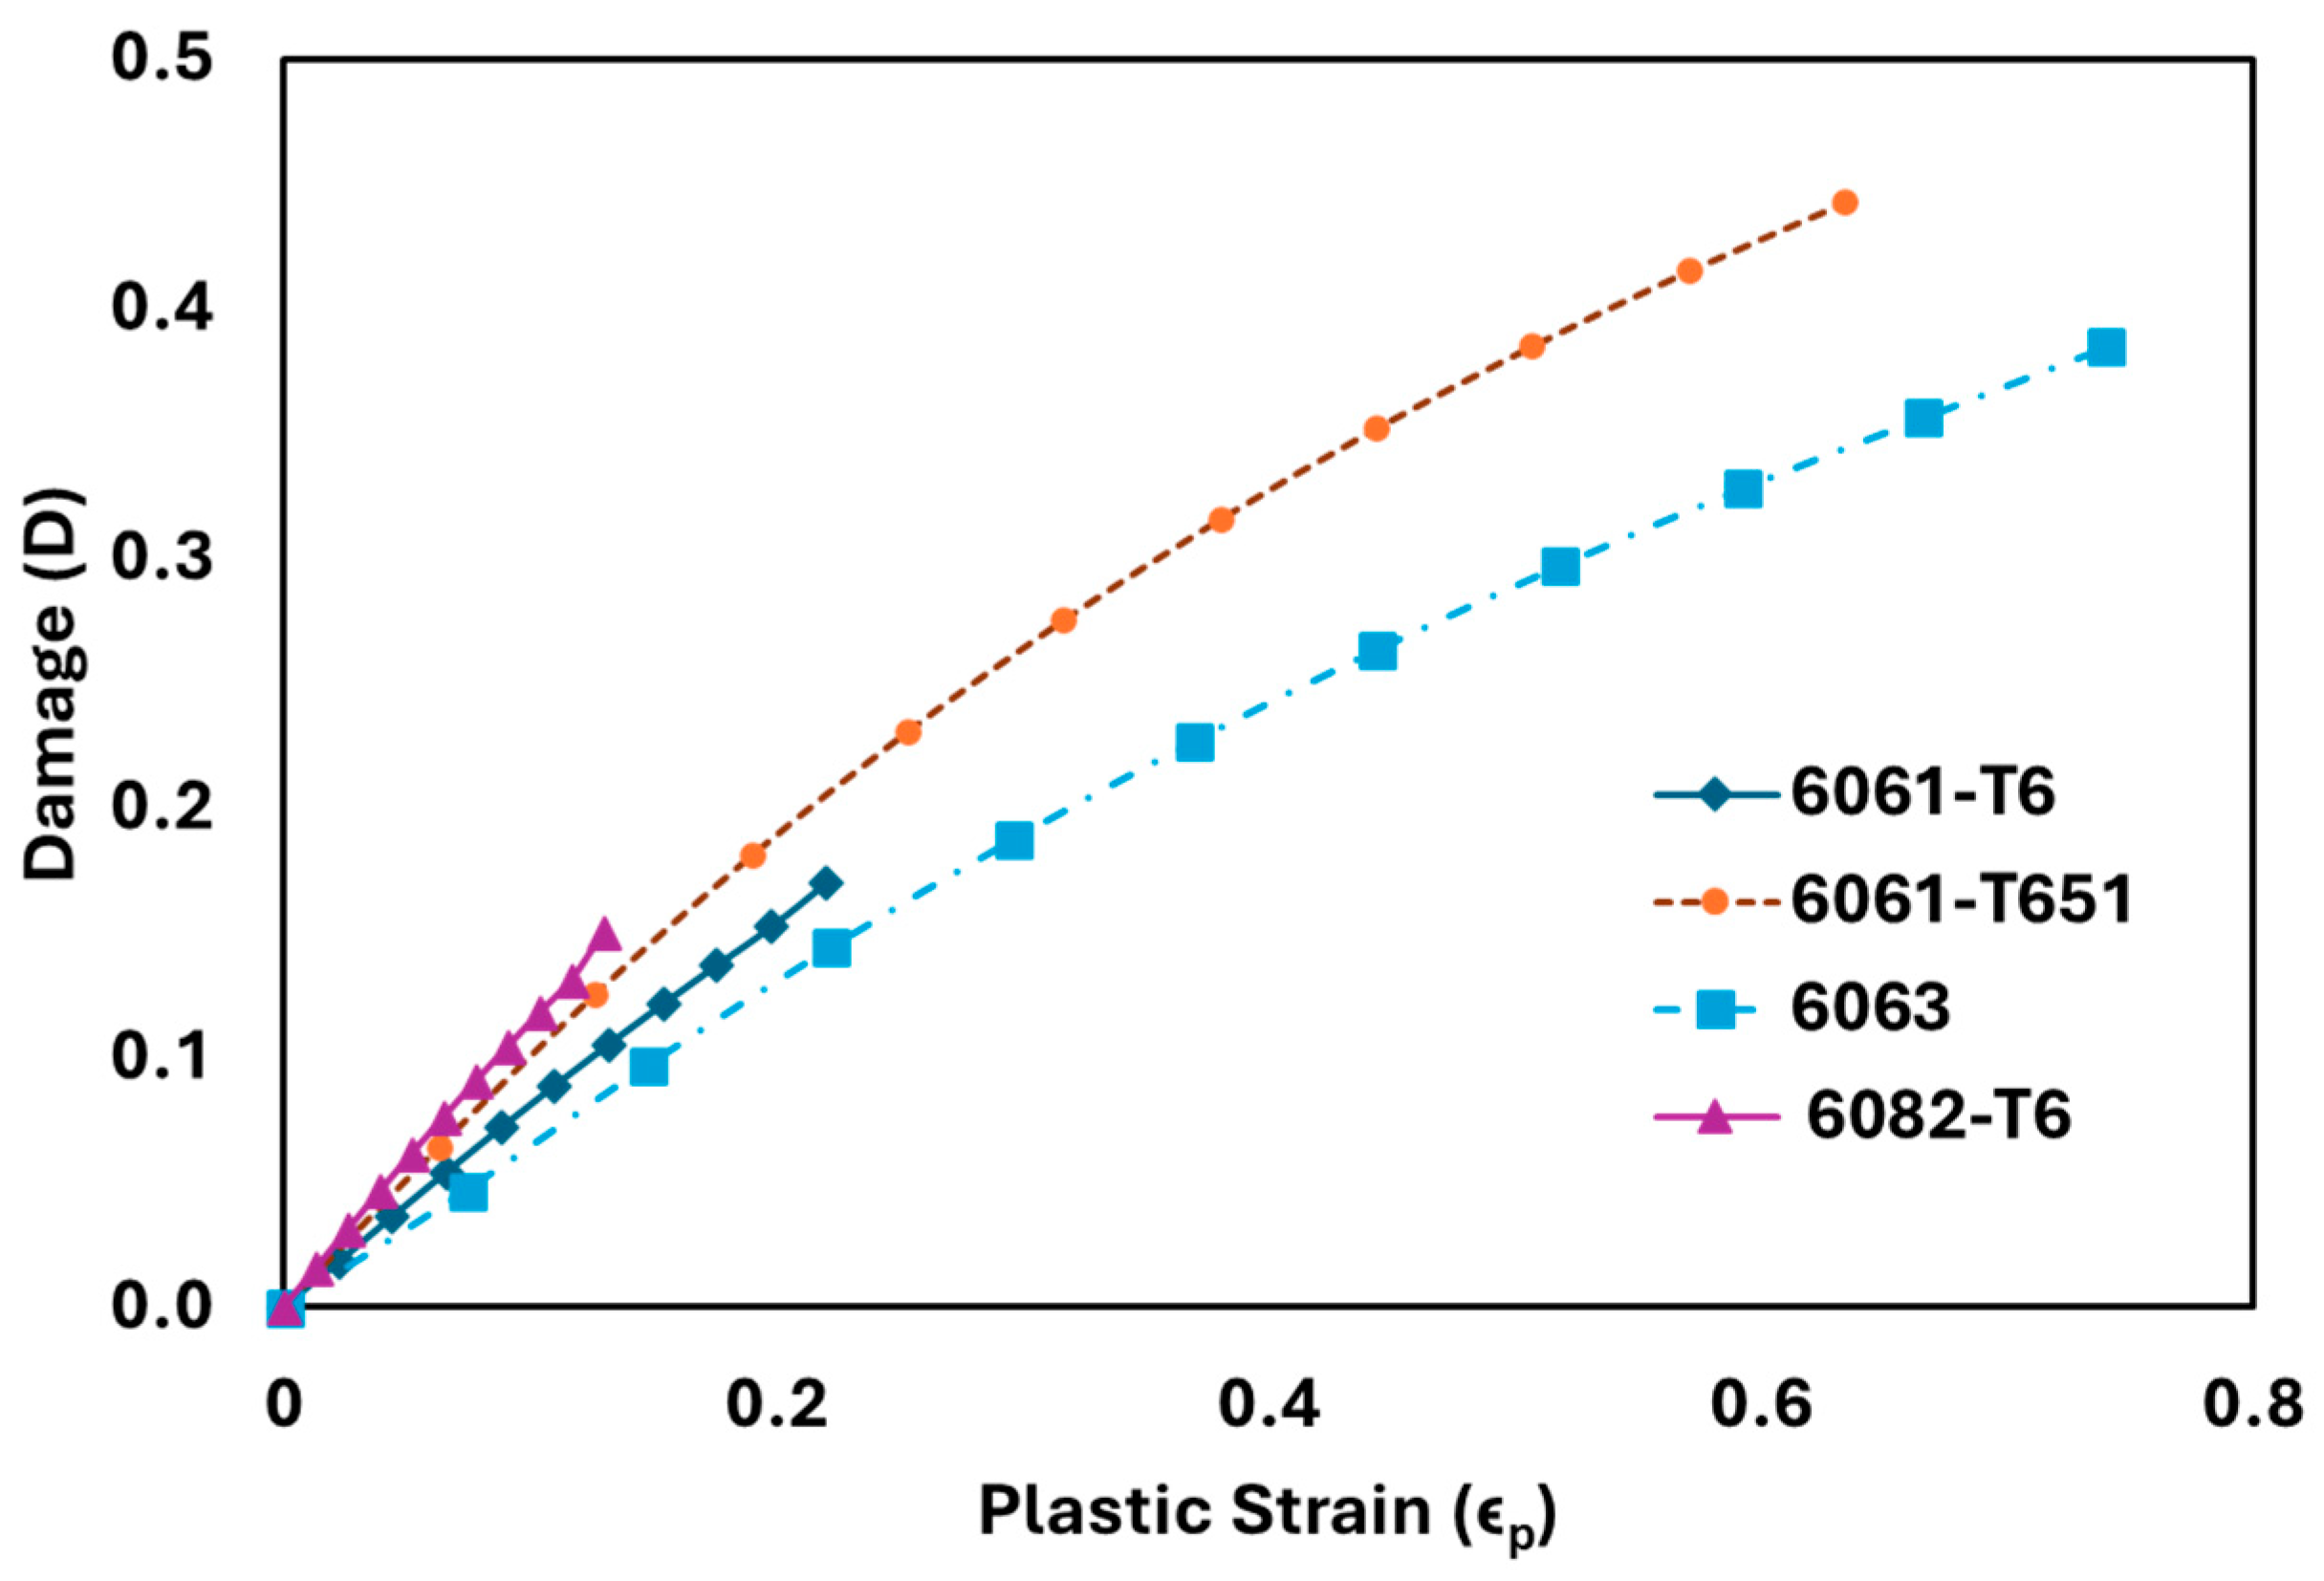
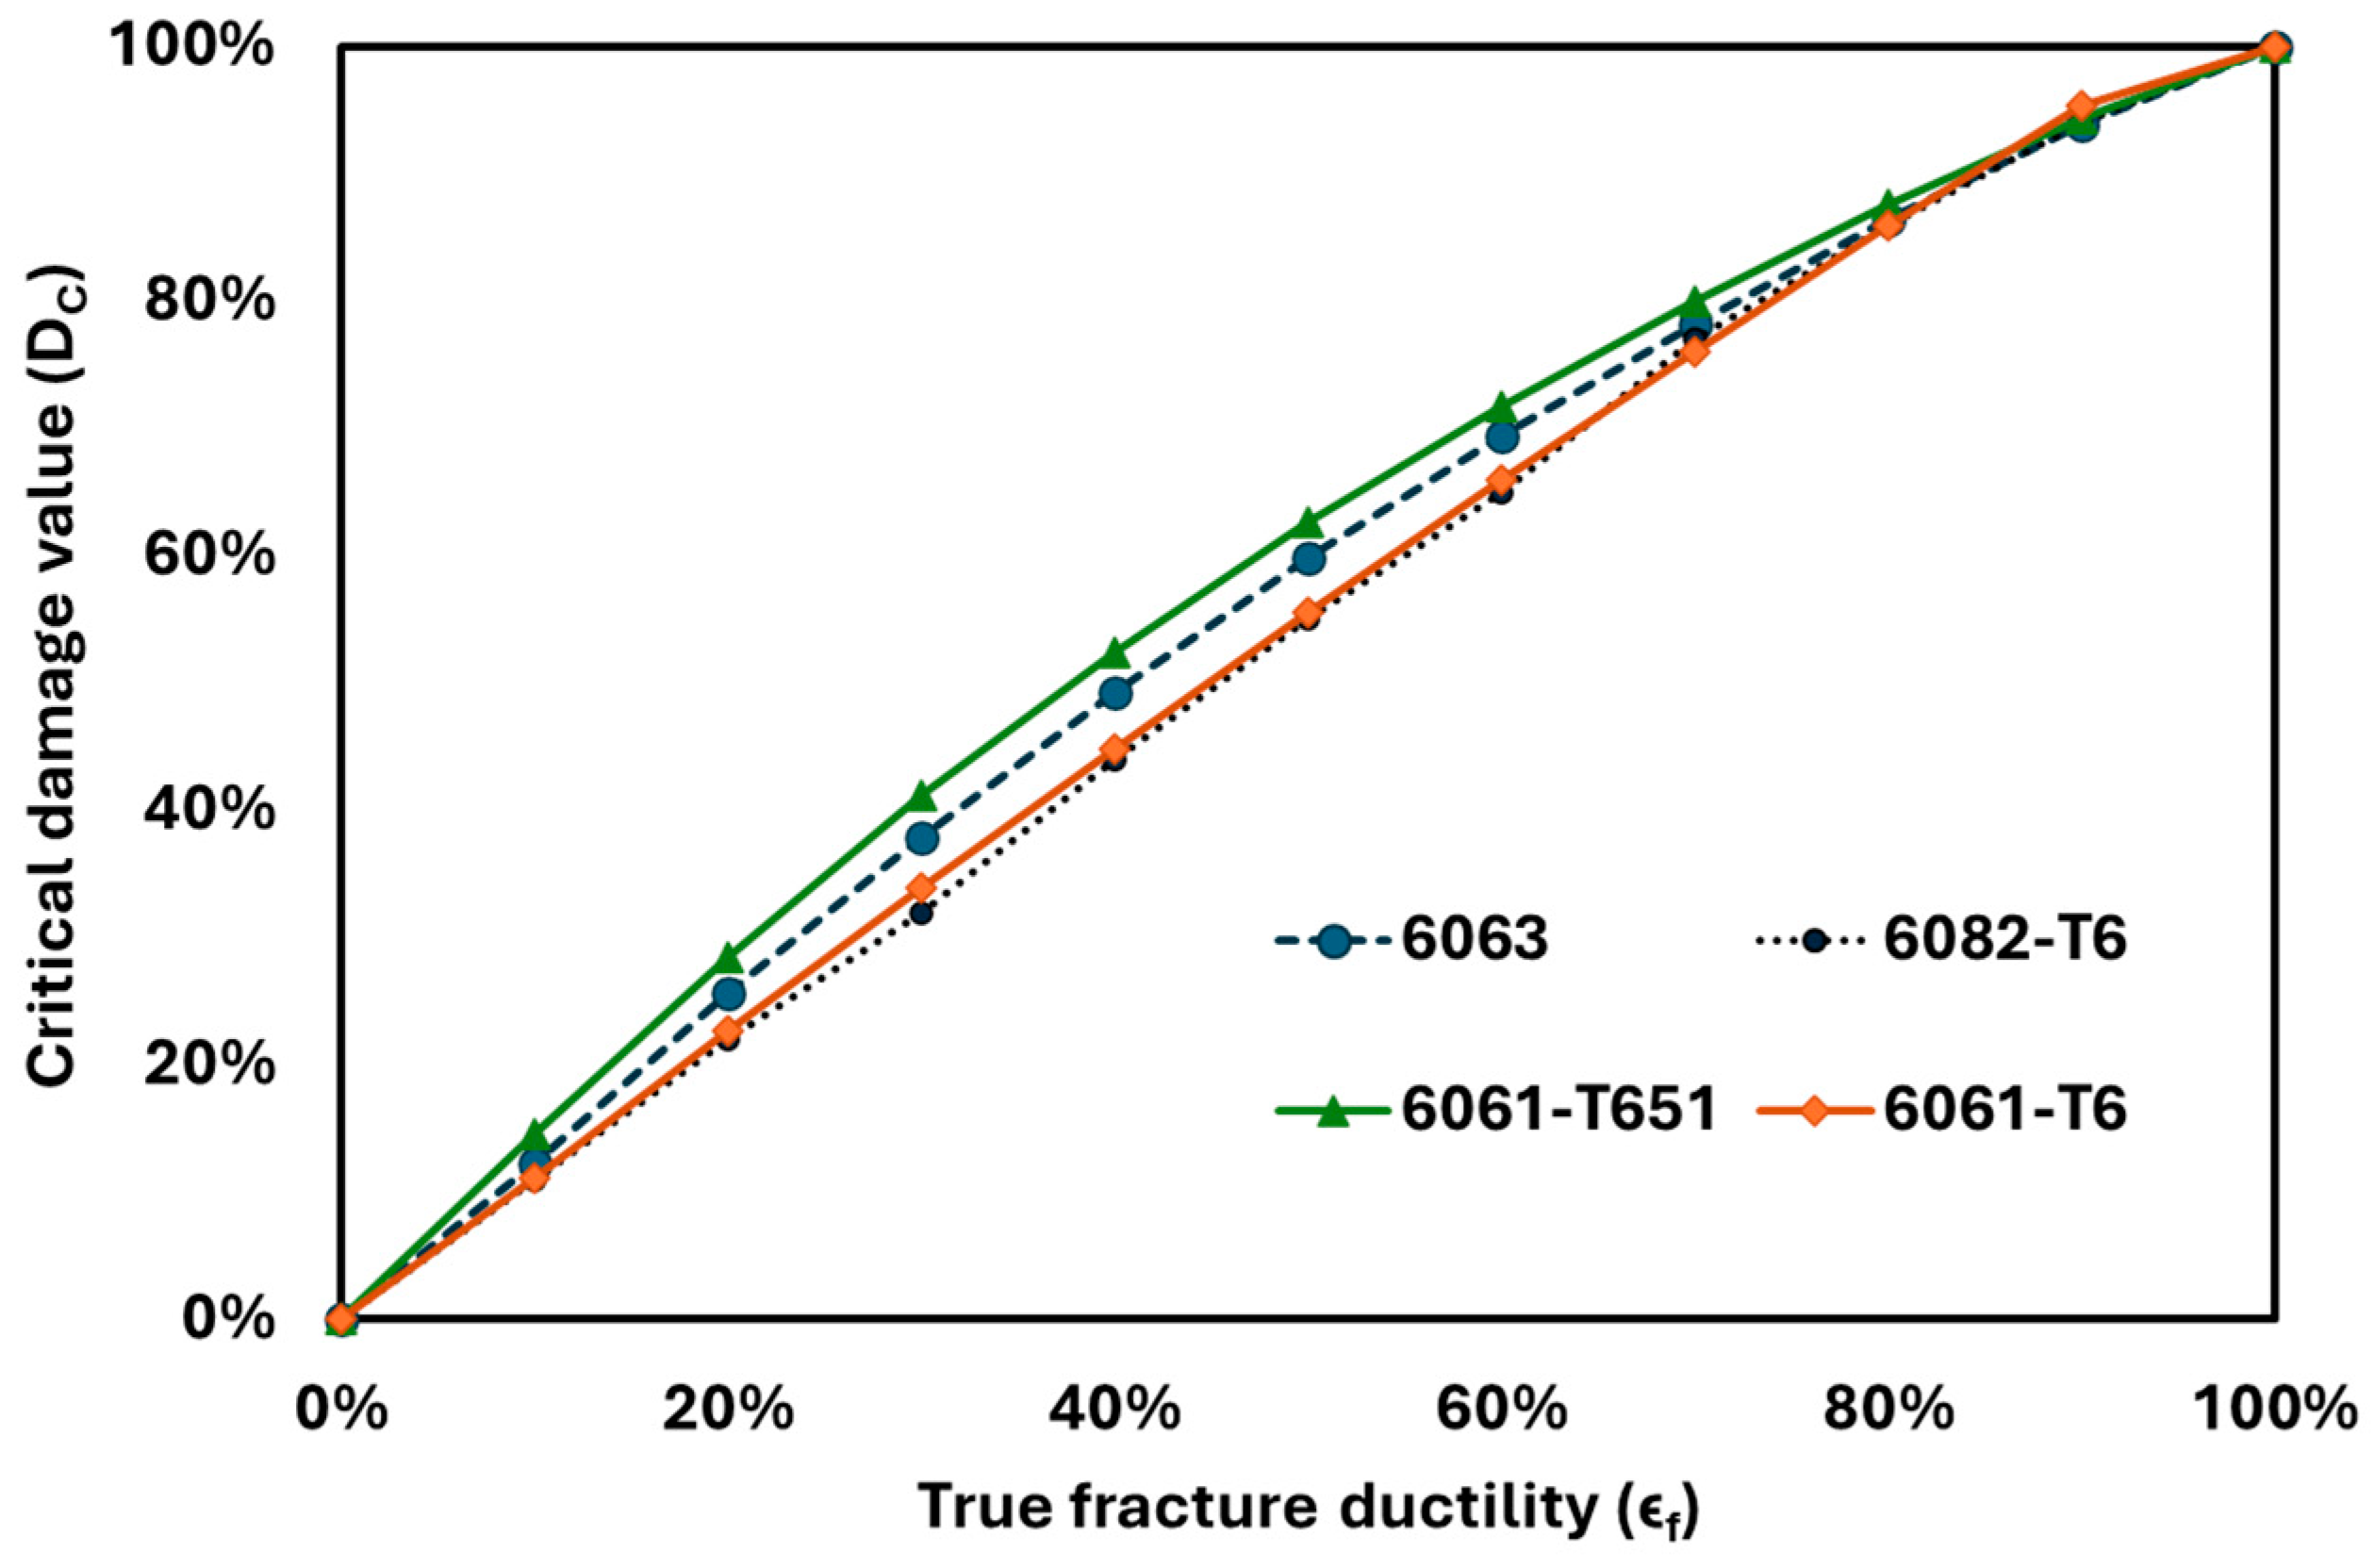
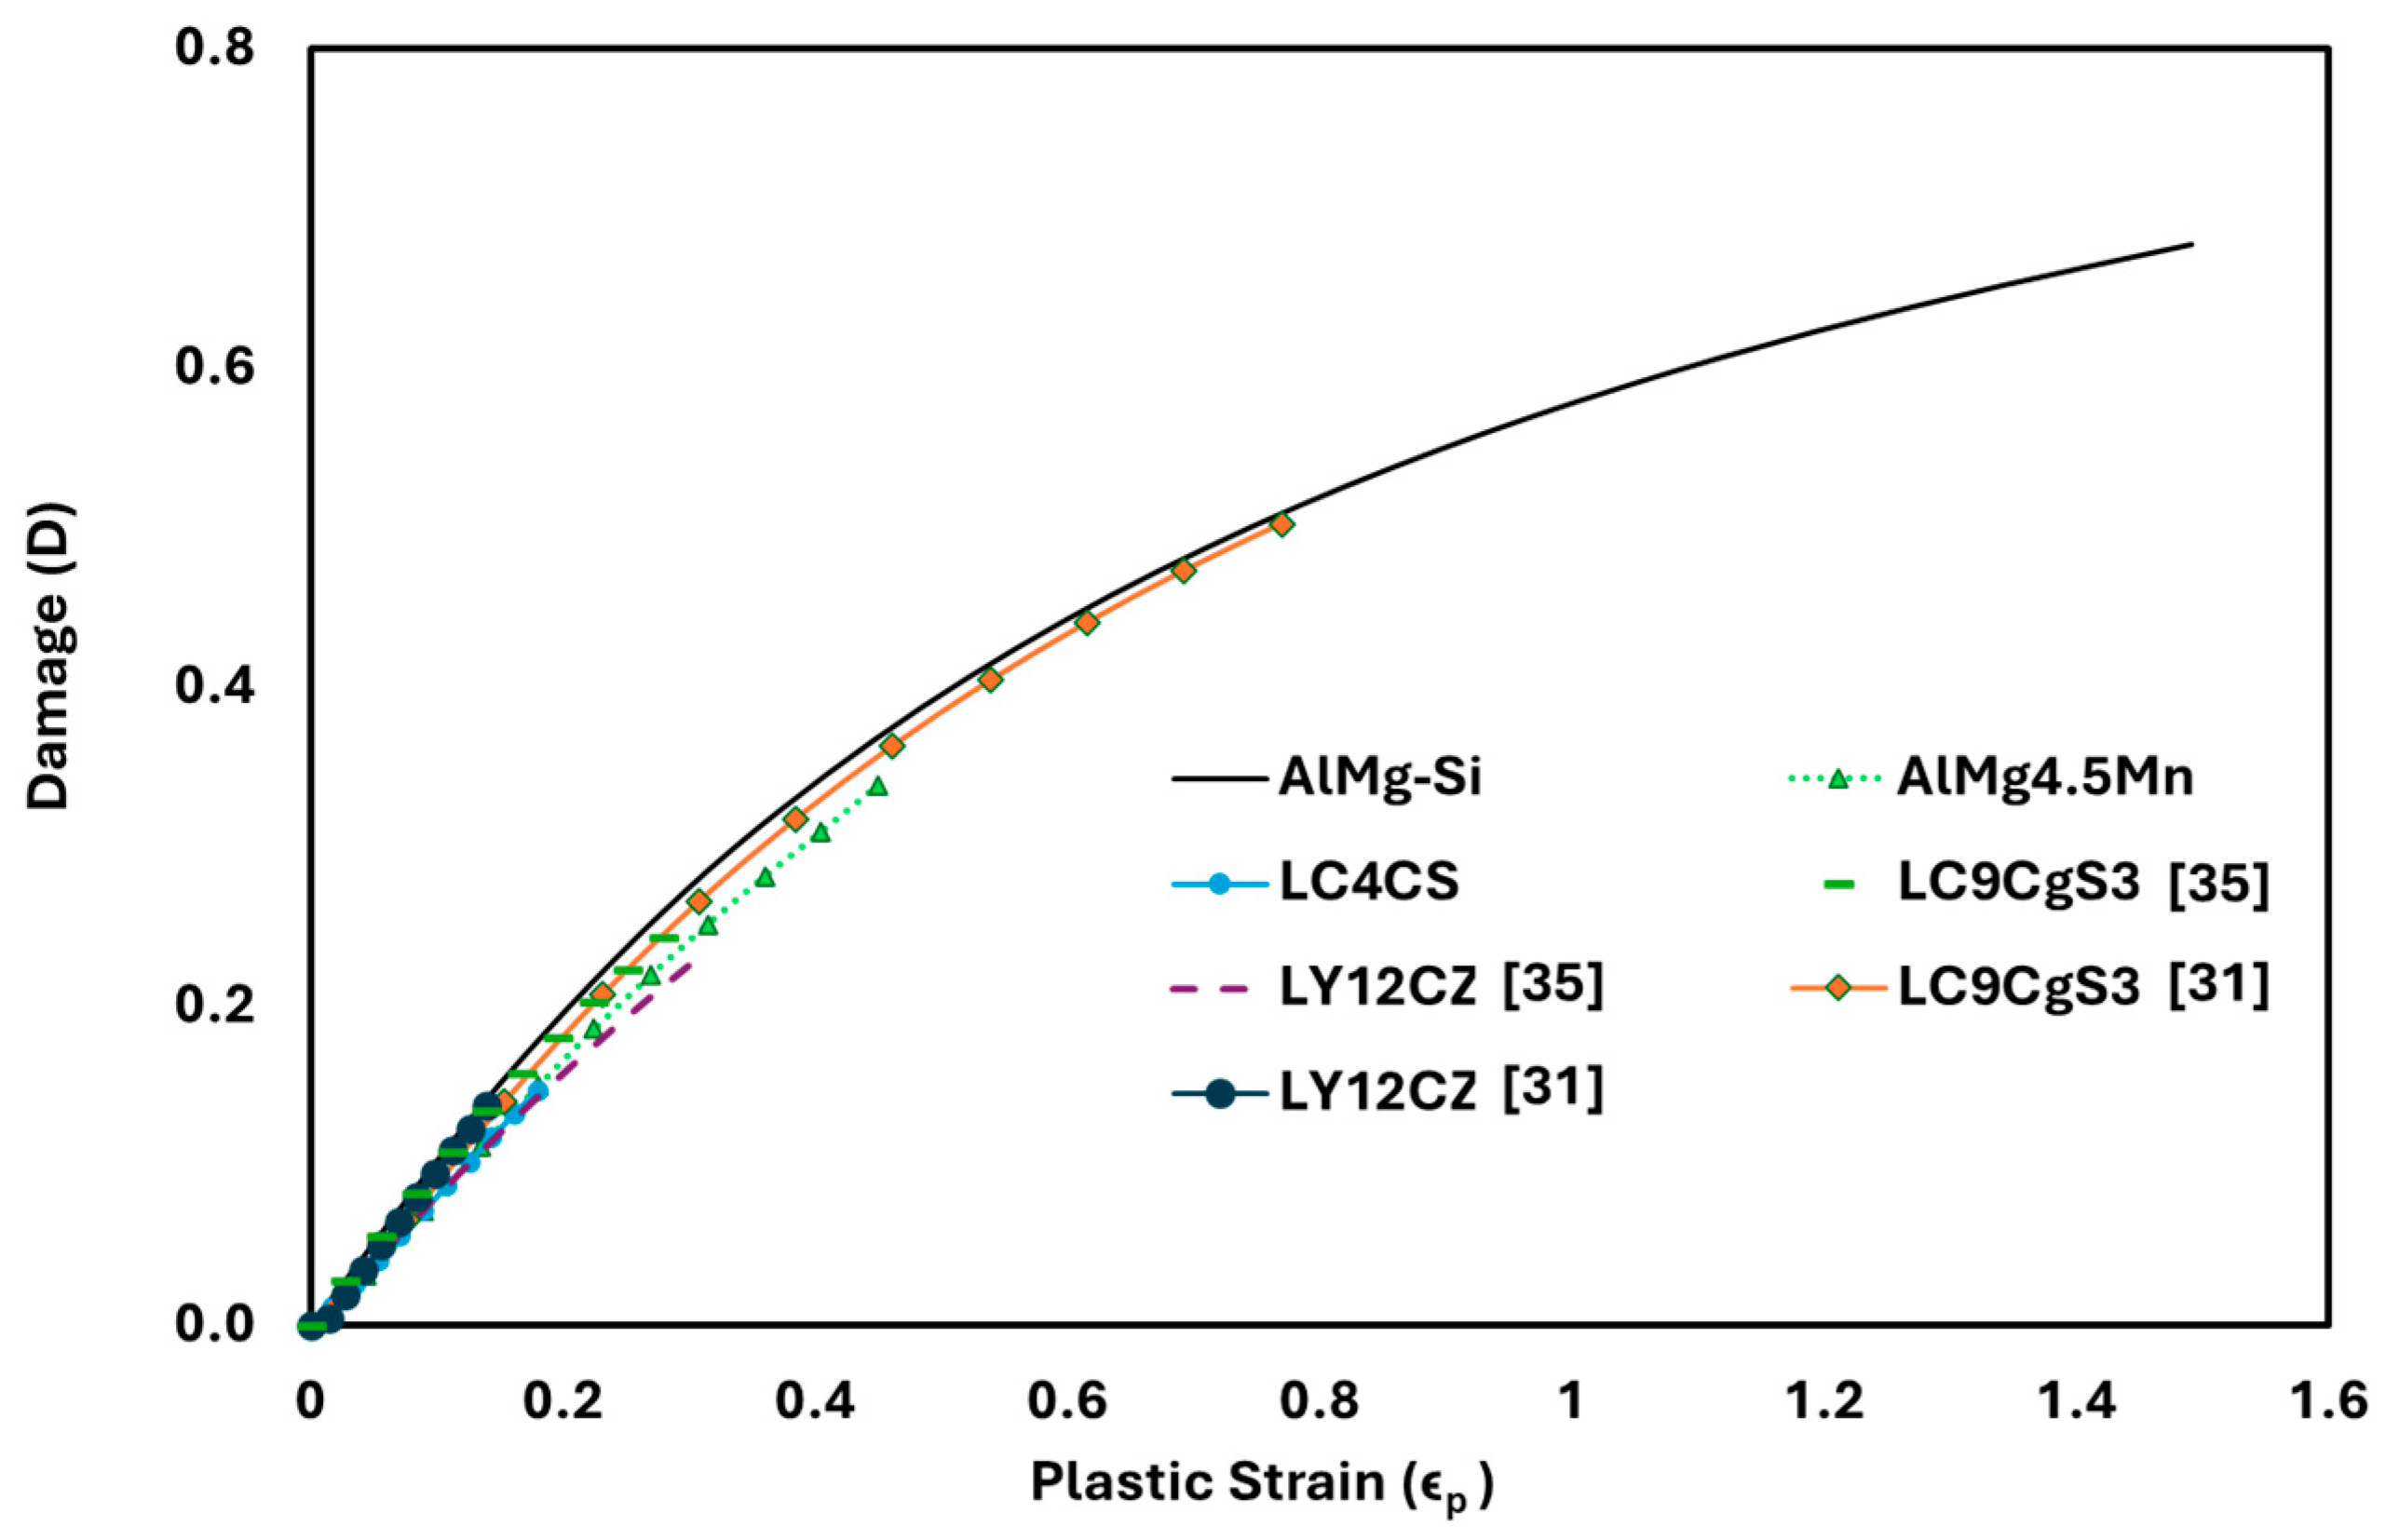
4.2. Result Analysis of Various Material Series

Further analysis of the damage value of materials is carried out considering all materials under each series.
2xxx series: Seven materials in this series have critical damage values in the range of 0.12 to 0.89 while their true fracture ductility varies in the range of 0.22 to 8.55, as shown in Table 3. A plot of variation in damage value with respect to plastic strain is shown in Figure 6 for all materials. In order to understand the specific strength of any material under applied plastic strain, a plot of % critical damage value against % true fracture ductility is shown in Figure 7. This result shows that 2017A-T4 offers the highest resistance against damage at any value of plastic strain.
5xxx series: Seven materials in this series have critical damage values in the range of 0.16 to 0.89 while their true fracture ductility varies in the range of 0.2 to 9.19, as shown in Table 4. A plot of variation in damage value with respect to plastic strain is shown in Figure 8 for all materials. The plot of % critical damage value against % true fracture ductility is shown in Figure 9. This result shows that 5754-NG offers the highest resistance against damage at any value of plastic strain.
6xxx series: Four materials in this series have critical damage values in the range of 0.15 to 0.44, while their true fracture ductility varies in the range of 0.13 to 0.7, as shown in Table 5. Interestingly, it can be observed that 6063 has the highest value of true fracture ductility, but its critical damage value is not the maximum in the series. This indicates the effect of other parameters, like true fracture strength, strength coefficient, and strain hardening exponent, on the damage values. A plot of variation in damage values with respect to plastic strain is shown in Figure 10 for all materials. The plot of critical damage % values against the true fracture ductility % is shown in Figure 11. This result shows that 6061-T651 offers the highest resistance against damage at any value of plastic strain until about 80% of the true fracture ductility condition.
7xxx series: Six materials in this series have critical damage values in the range of 0.34 to 0.86, while their true fracture ductility varies in the range of 0.47 to 6.81, as shown in Table 6. A plot of variation in damage value with respect to plastic strain is shown in Figure 12 for all materials. The plot of critical damage % values against true fracture ductility % is shown in Figure 13. This result shows that 7075-T7351 offers the highest resistance against damage at any value of plastic strain.
Other Aluminum alloys: Seven materials in this series have critical damage values in the range of 0.14 to 0.68, while their true fracture ductility varies in the range of 0.14 to 1.49, as shown in Table 7. A plot of variation in damage value with respect to plastic strain is shown in Figure 14 for all materials. The plot of critical damage % values against true fracture ductility % is shown in Figure 15. This result shows that AlMg-Si offers the highest resistance against damage at any value of plastic strain.

4.3. Summary

Though more than 50 aluminum alloys are available, 32 aluminum alloys that have applications where a damage study is relevant are considered in the present study. The result shows that Bhattacharya and Ellingwood’s CDM-based approach has helped to analyze both critical damage value and damage value at any strain. Critical damage values vary in the range of 0.1 to 0.9 for these materials whose true fracture ductility varies in the range of 0.13 to 9.19. Few materials have the same critical damage value, though their monotonic properties are different as critical damage is influenced by true fracture strength, strength coefficient, and the strain hardening exponent in addition to plastic strain. Variation in damage with plastic strain is linear until a plastic strain of about 0.5, and, beyond this, the relationship is non-linear. %DC vs. % ϵf shows that few materials of the 2xxx, 5xxx, 7xxx, and others series exhibit the non-linear trend indicating the influence of true fracture strength, strength coefficient, and true fracture ductility as distinct from plastic strain on the damage value of aluminum alloys.

5. Conclusions

The CDM-based Bhattacharya and Ellingwood model helps to determine both critical damage value and damage value at any strain by using the material’s readily available monotonic properties. The following conclusions are drawn by analyzing the damage value of 32 aluminum alloys:
  • As this study provides results for critical damage values from 0.1 to 0.9, the damage behavior of almost any material is covered because the range for critical damage is 0 to 1. Therefore, this study acts as a ready reckoner of data for a wide range of materials.
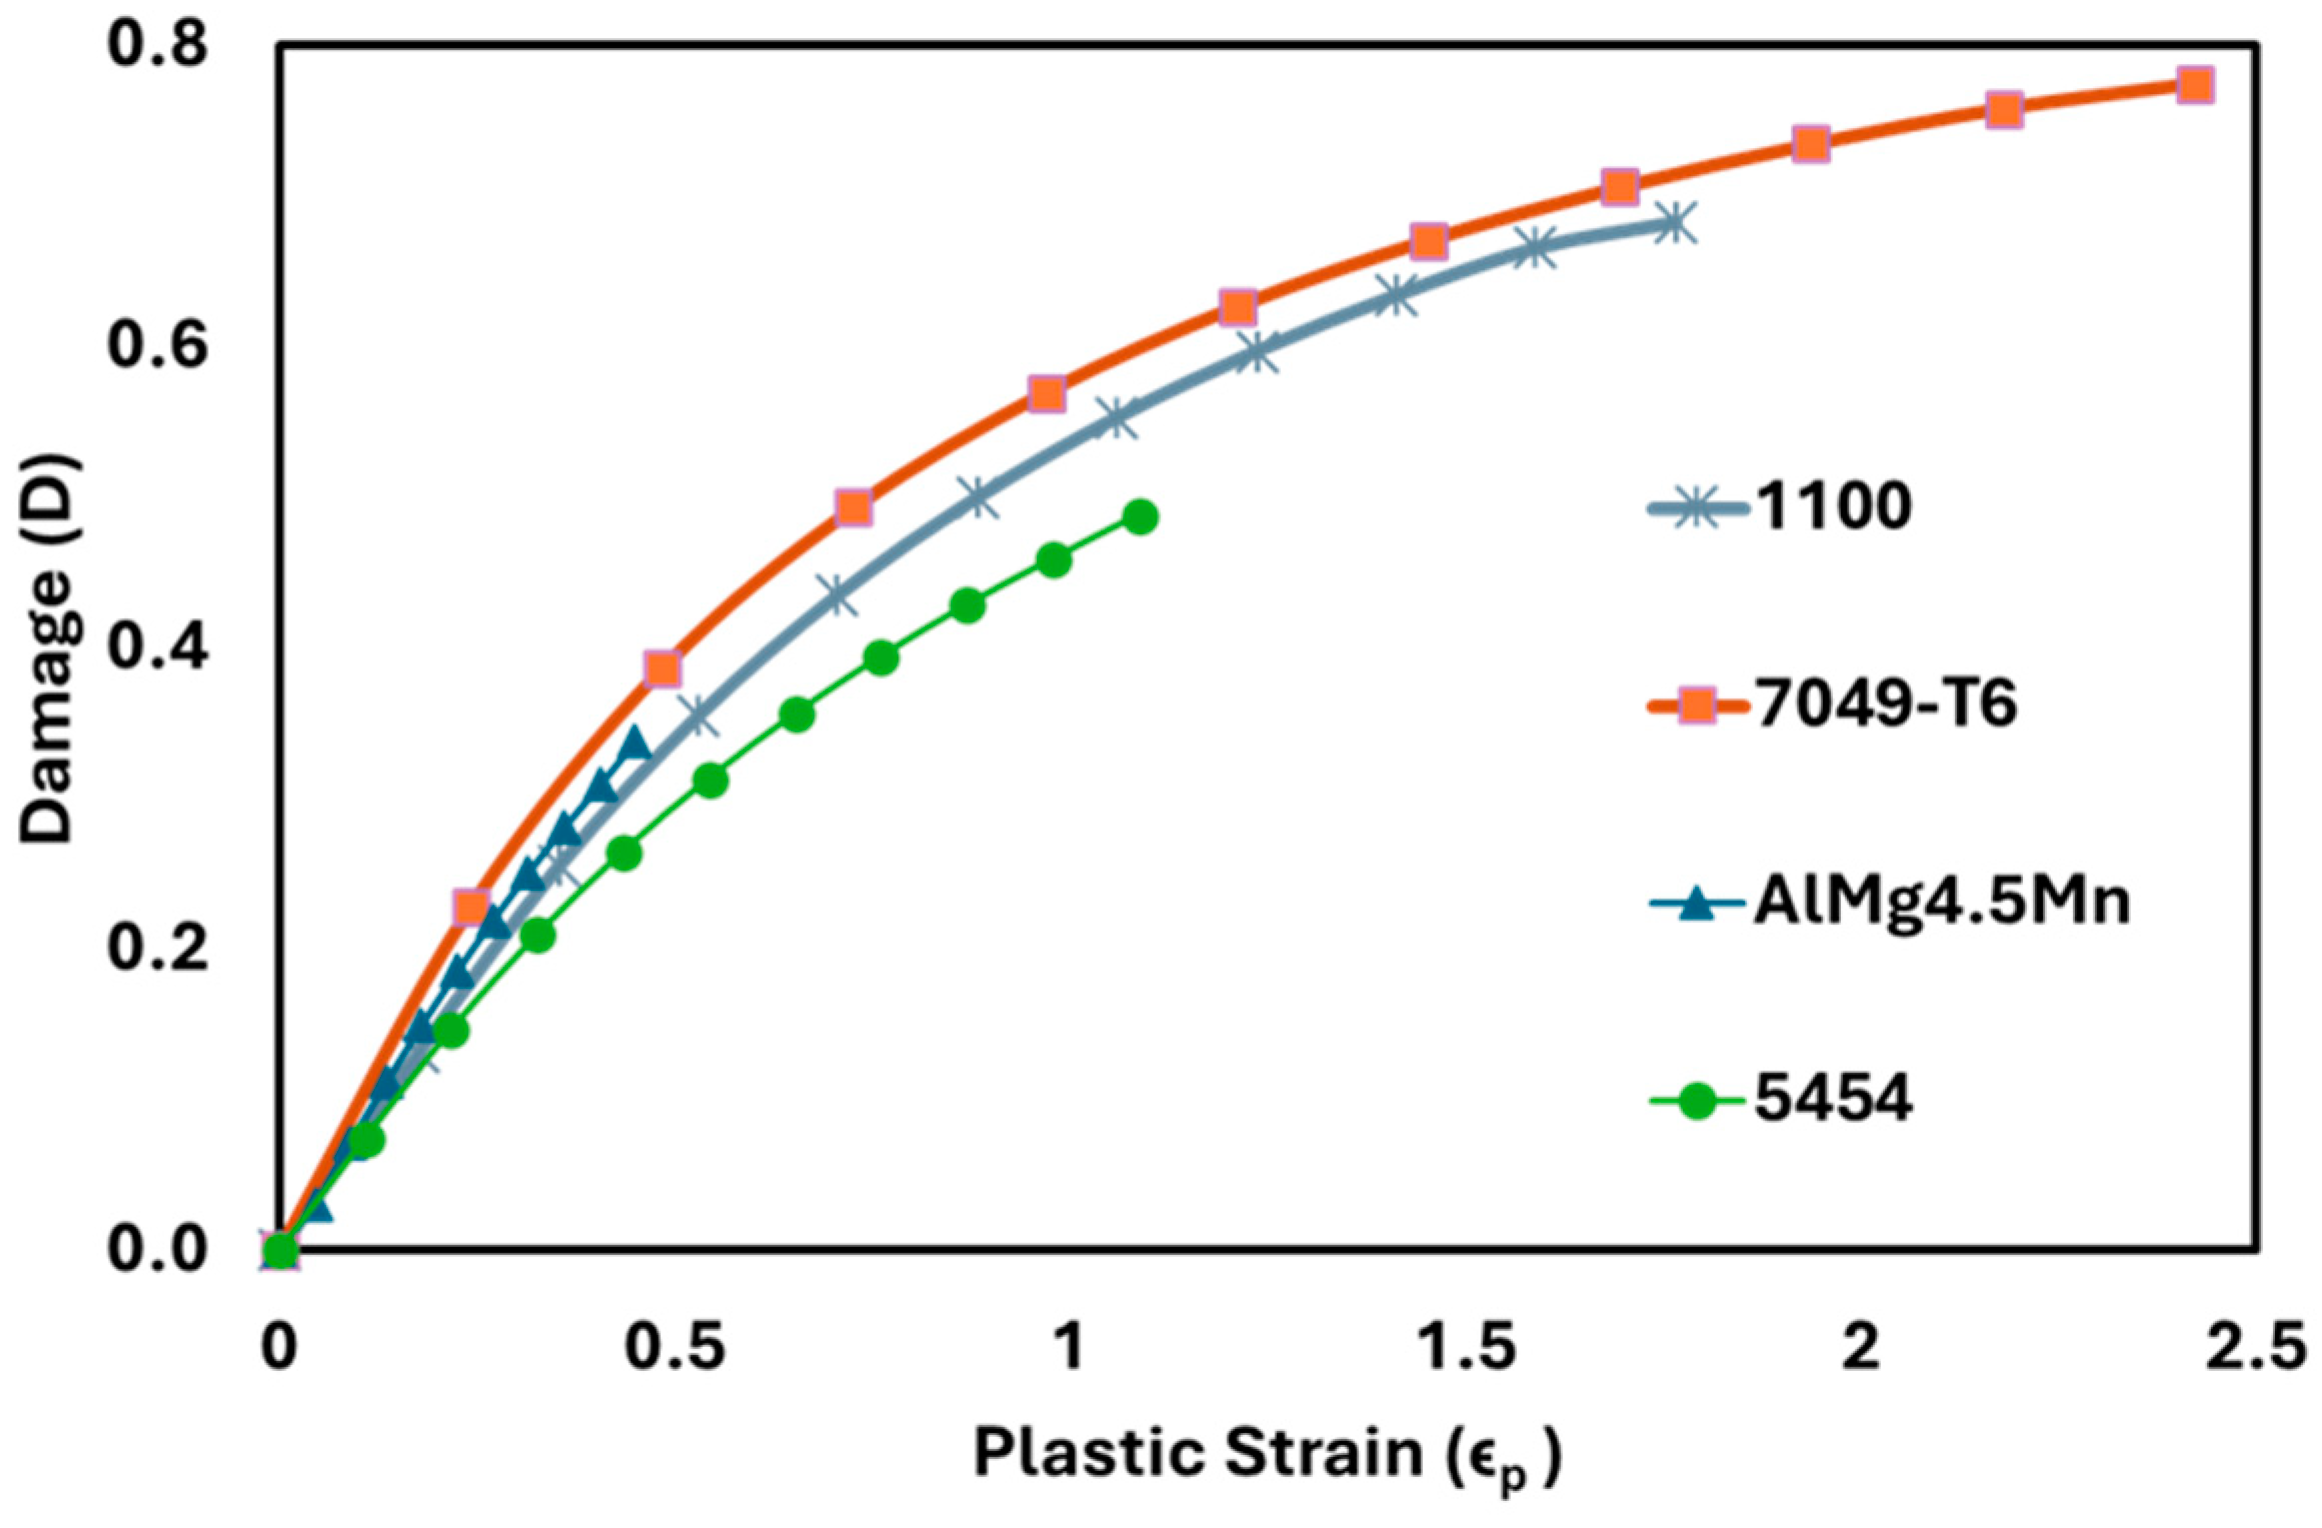
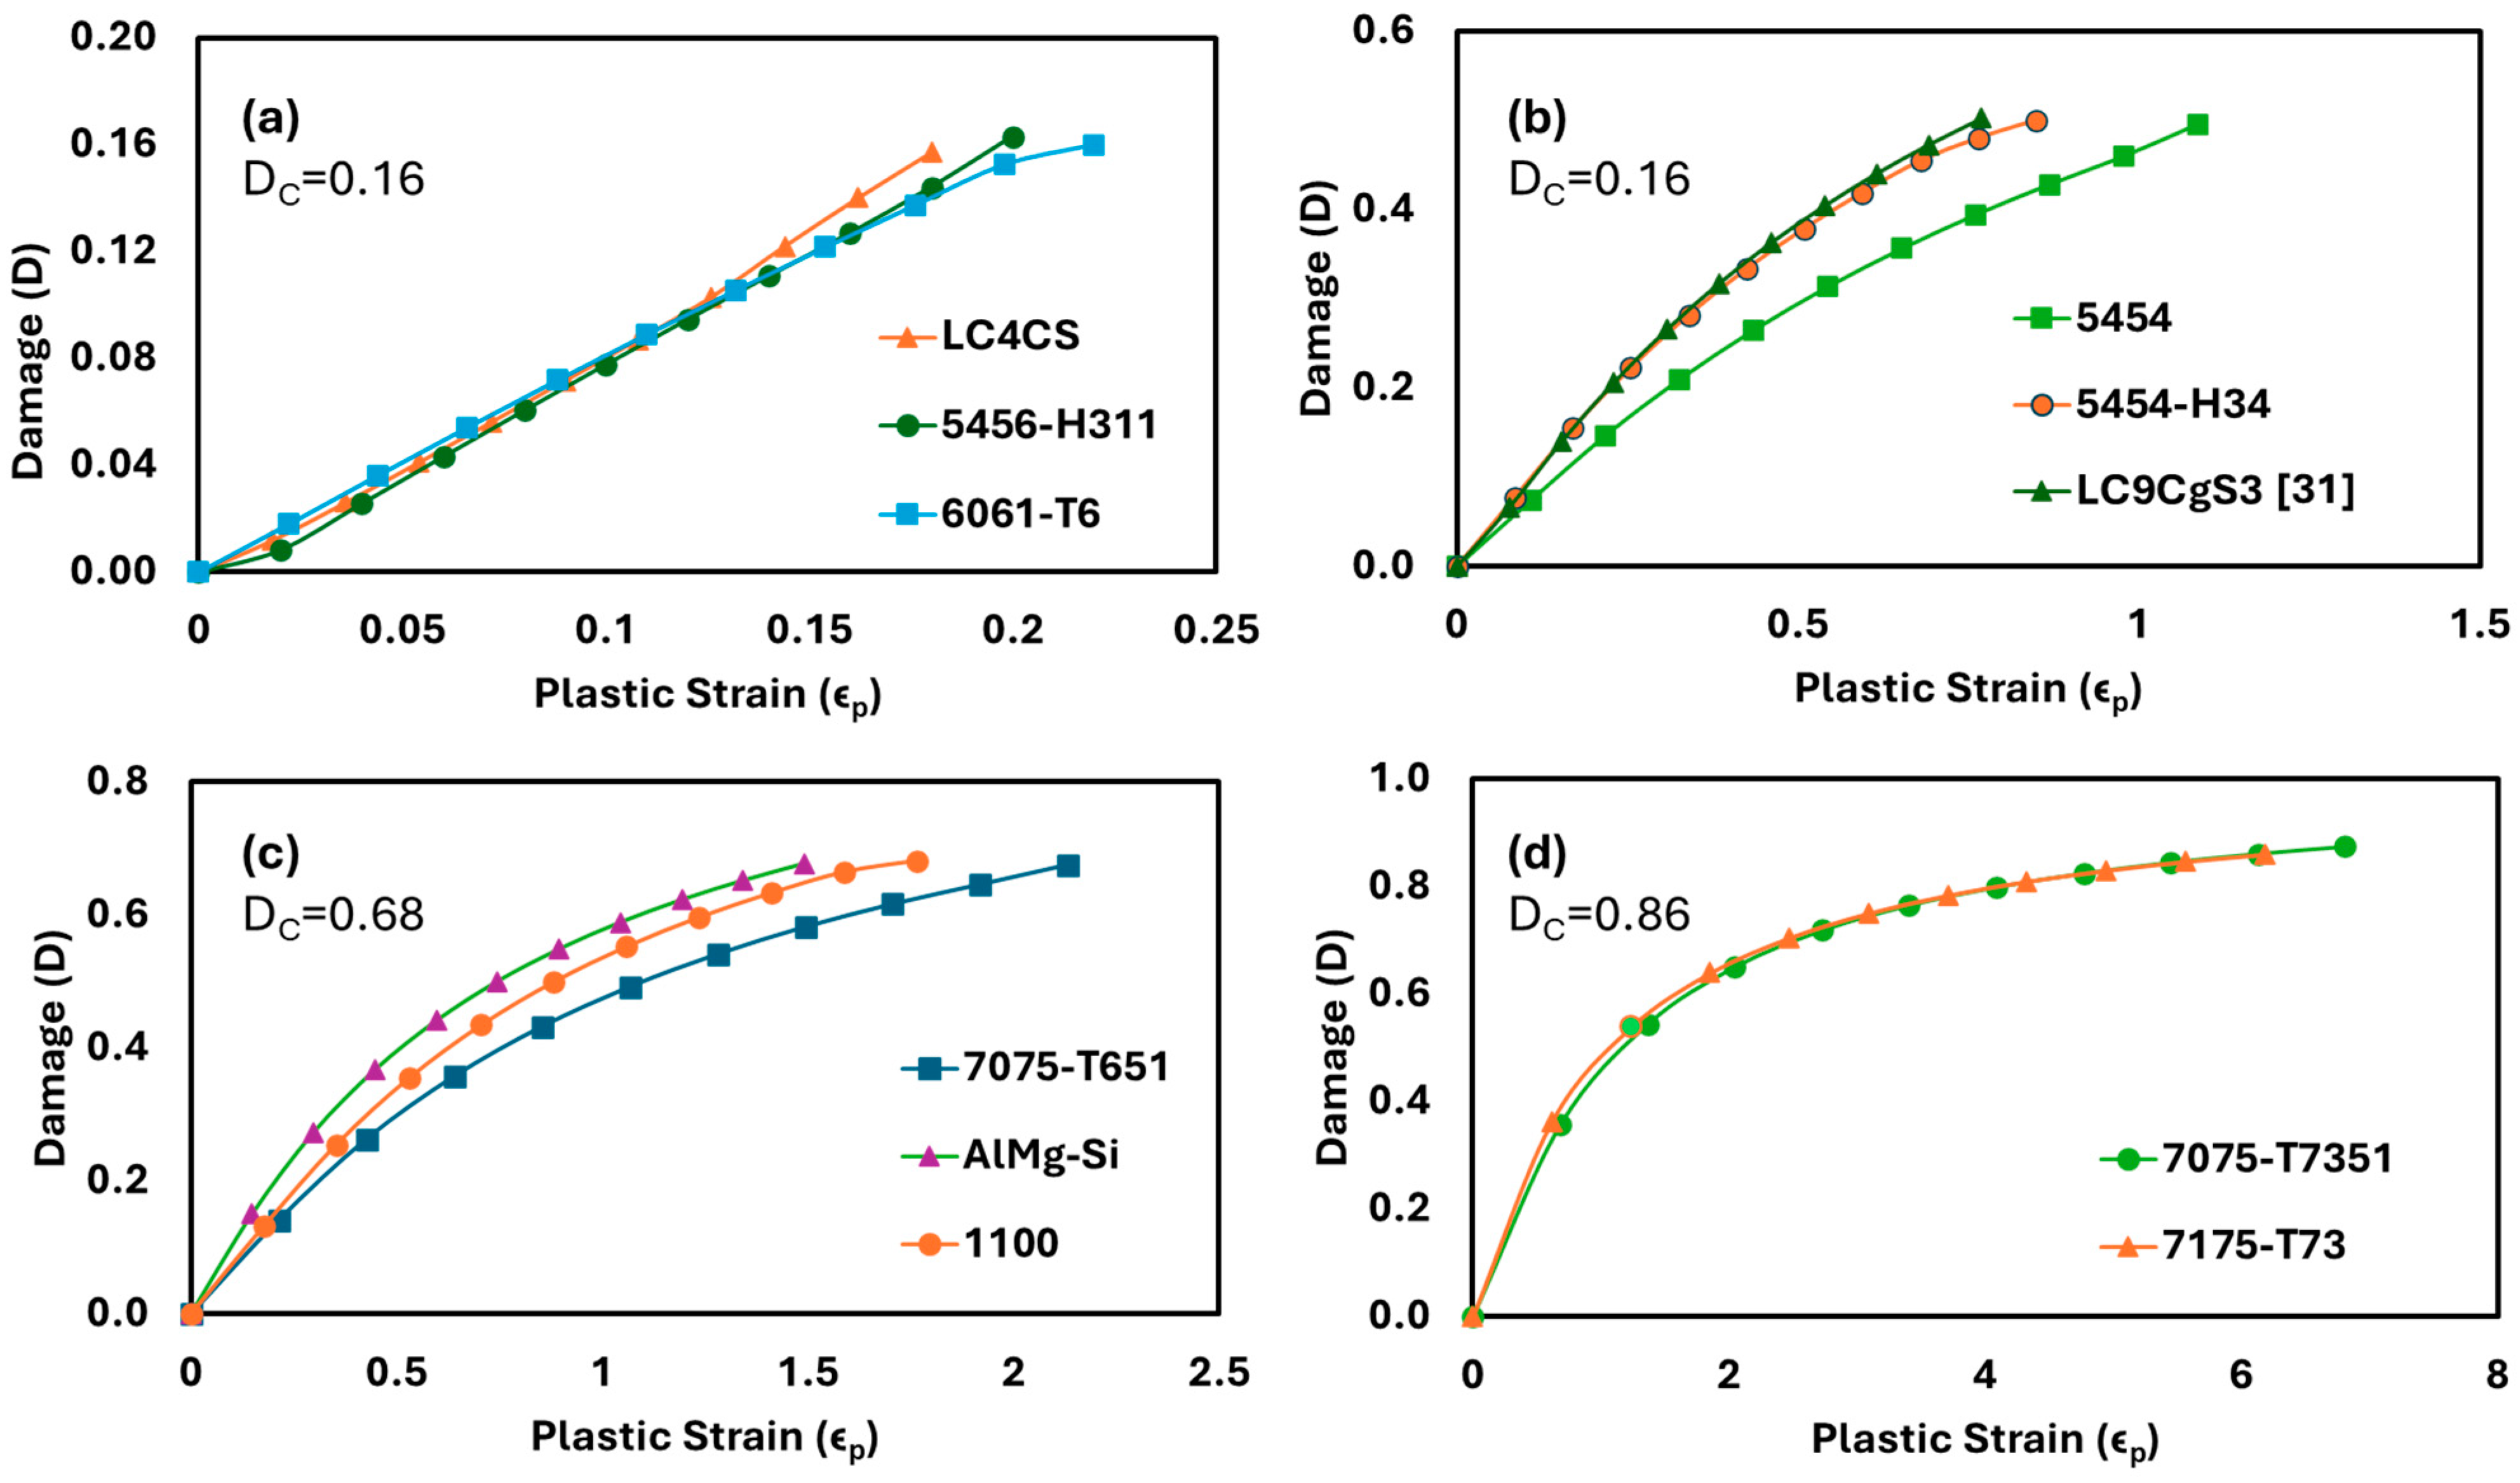
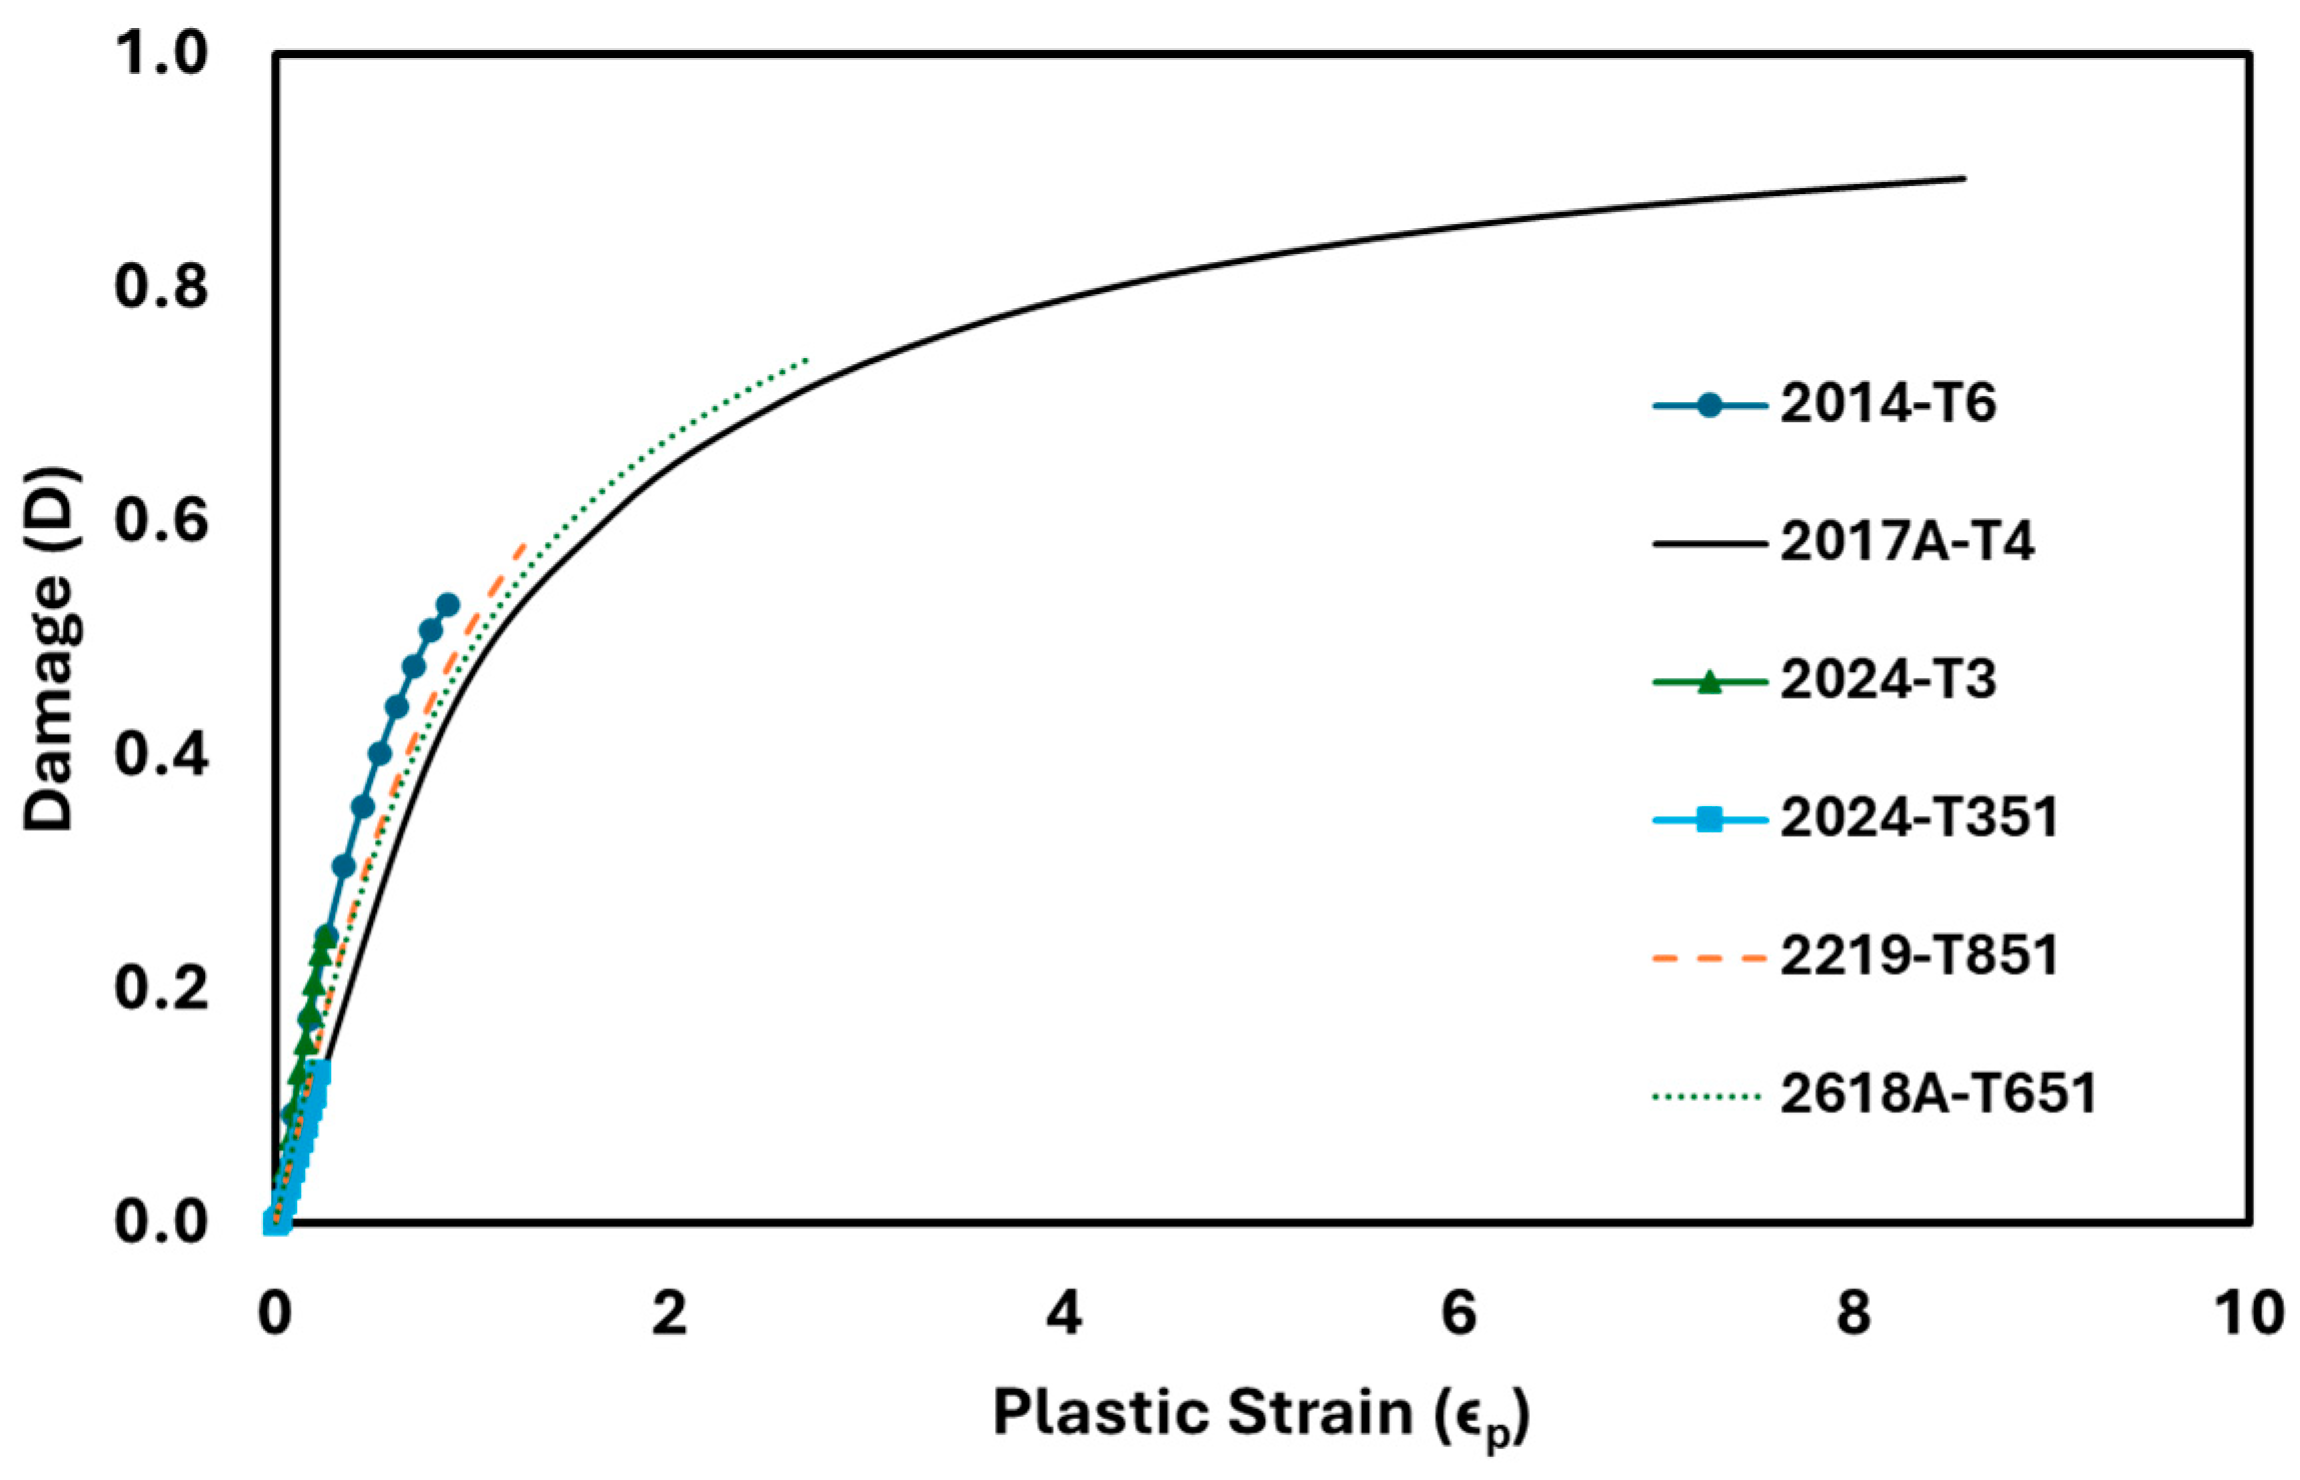
  • Variation in damage against strain could be either linear or non-linear, depending upon the influence of monotonic properties like true fracture strength, strength coefficient, the strain hardening exponent, and plastic strain. All materials of the 2xxx, 5xxx, and other series shown both linear and non-linear variation in damage with strain. But the 6xxx series materials exhibited linear variation, and the 7xxx series materials exhibited non-linear variation.
  • By analyzing the variation in damage against strain, it was found that 2017A-T4, 5754-NG, 6061-T651, 7075-T7351, and AlMg-Si offer the highest resistance to crack initiation under the respective series. Among the 32 Al alloys considered in this study, the 7075-T7351 alloy offers the maximum resistance to crack initiation at any value of strain loading.
  • Determining the critical damage value of a wide range of aluminum alloys helps select a specific material when the focus is on damage criteria like crack initiation.

Author Contributions

Conceptualization, Y.S.U. and V.M.; methodology, Y.S.U.; formal analysis, Y.S.U. and V.K.; resources, V.M.; data curation, Y.S.U. and V.K.; writing—original draft preparation, V.K. and Y.S.U.; writing—review and editing, Y.S.U. and V.M.; visualization, Y.S.U. and V.M.; supervision, Y.S.U.; project administration, Y.S.U. All authors have read and agreed to the published version of the manuscript.

Funding

This research received no external funding.

Institutional Review Board Statement

Not applicable.

Informed Consent Statement

Not applicable.

Data Availability Statement

The data supporting this study’s findings are in the tables provided in the manuscript. In addition, more information can be provided based on a reasonable request to the corresponding author.

Conflicts of Interest

The authors declare that they have no competing financial interests that could have influenced the work reported in this paper.

References

  1. Lemaitre, J.; Desmorat, R. Engineering Damage Mechanics: Ductile, Creep, Fatigue and Brittle Failures; Springer Science & Business Media: Berlin/Heidelberg, Germany, 2006. [Google Scholar]
  2. Bai, P.; Shang, C.; Zhu, D.; Zhao, H.; Liu, Y.; Kuang, J.; Li, F.; Ji, J.; Wang, S.; Wu, G.; et al. The interpretable descriptors for fatigue performance of wrought aluminum alloys. J. Mater. Res. Technol. 2024, 32, 3423–3431. [Google Scholar] [CrossRef]
  3. Bhattacharya, B.; Ellingwood, B. A new CDM-based approach to structural deterioration. Int. J. Solids Struct. 1999, 36, 1757–1779. [Google Scholar] [CrossRef]
  4. Anderson, T.L. Fracture Mechanics: Fundamentals and Applications; CRC Press: Boca Raton, FL, USA, 2017. [Google Scholar]
  5. Kraisnik, M.; Vilotic, D.; Siðanin, L.; Stefanovic, M. Various approaches to defining the criteria of ductile crack in cold bulk forming processes. Ann. Fac. Eng. Hunedoara-Int. J. Eng. 2015, 13, 213–218. [Google Scholar]
  6. Rice, J.R.; Tracey, D.M. On the ductile enlargement of voids in triaxial stress fields∗. J. Mech. Phys. Solids 1969, 17, 201–217. [Google Scholar] [CrossRef]
  7. Oyane, M. Criteria of ductile fracture strain. Bull. JSME 1972, 15, 1507–1513. [Google Scholar] [CrossRef]
  8. Ma, H.; Xu, W.; Jin, B.C.; Shan, D.; Nutt, S.R. Damage evaluation in tube spinnability test with ductile fracture criteria. Int. J. Mech. Sci. 2015, 100, 99–111. [Google Scholar] [CrossRef]
  9. Niemsakul, S.; Sae-Eawa, N.; Aue-U-Lan, Y. Determination and analysis of critical damage criteria for predicting fracture in forming process by uniaxial tensile test. Mater. Today Proc. 2018, 5, 9642–9650. [Google Scholar] [CrossRef]
  10. Freudenthal, A.M. The Inelastic Behavior in Solids, 1st ed.; Wiley: New York, NY, USA, 1950. [Google Scholar]
  11. Cockcroft, M.G. Ductility and workability of metals. J. Met. 1968, 96, 2444. [Google Scholar]
  12. Mashayekhi, M.; Taghipour, A.; Askari, A.; Farzin, M. Continuum damage mechanics application in low-cycle thermal fatigue. Int. J. Damage Mech. 2013, 22, 285–300. [Google Scholar] [CrossRef]
  13. Fan, Z.C.; Chen, X.D.; Chen, L.; Jiang, J.L. A CDM-based study of fatigue–creep interaction behavior. Int. J. Press. Vessel. Pip. 2009, 86, 628–632. [Google Scholar] [CrossRef]
  14. Bhattacharya, B.; Ellingwood, B. Continuum damage mechanics analysis of fatigue crack initiation. Int. J. Fatigue 1998, 20, 631–639. [Google Scholar] [CrossRef]
  15. Gautam, A.; Yadav, R.K.; Ajit, K.P.; Rajak, V.K. A review on CDM-based ductile models and its application. Trans. Indian Inst. Met. 2023, 76, 1141–1154. [Google Scholar] [CrossRef]
  16. Aluminum or Aluminium Alloys-List. [Online]. Available online: https://www.thoughtco.com/aluminum-or-aluminium-alloys-603707 (accessed on 4 December 2023).
  17. Bintoro, S.R.; Putri, E.D.; Suhartono, A.; Muhayat, N.; Badaruddin, M.; Fauzun, F.; Triyono, T. Effect of welding environment on fatigue crack growth rate of aluminium alloy 1100. J. Achiev. Mater. Manuf. Eng. 2024, 122, 49–60. [Google Scholar] [CrossRef]
  18. Gates, N.R.; Fatemi, A. On the consideration of normal and shear stress interaction in multiaxial fatigue damage analysis. Int. J. Fatigue 2017, 100, 322–336. [Google Scholar] [CrossRef]
  19. Gautam, A.; Ajit, K.P.; Sarkar, P.K. A nonlinear CDM based damage growth law for ductile materials. Mater. Res. Express 2018, 5, 026518. [Google Scholar] [CrossRef]
  20. Xue, F.; Li, F. Characterization of damage and toughness of 5052 aluminum alloy based on continuum damage mechanics. IOP Conf. Ser. Mater. Sci. Eng. 2018, 452, 022046. [Google Scholar] [CrossRef]
  21. Amer, M.; Shazly, M.; Mohamed, M.; Hegazy, A.A. Ductile damage prediction of AA 5754 sheet during cold forming condition. J. Mech. Sci. Technol. 2020, 34, 4219–4228. [Google Scholar] [CrossRef]
  22. Sun, Y. The use of aluminum alloys in structures: Review and outlook. Structures 2023, 57, 105290. [Google Scholar] [CrossRef]
  23. Kamath, T.R.; Upadhyaya, Y.S.; Kaushik, D. Fatigue life prediction of aluminum alloy 6061-T6 using continuum damage mechanics. Adv. Sci. Lett. 2017, 23, 1914–1916. [Google Scholar] [CrossRef]
  24. Won, J.Y.; Kim, C.; Hong, S.; Yoon, H.S.; Park, J.K.; Lee, M.G. Evaluation of crush performance of extruded aluminum alloy tubes based on finite element analysis with ductile fracture modeling. Thin-Walled Struct. 2024, 200, 111937. [Google Scholar] [CrossRef]
  25. Li, J.; Qiu, Y. A path-dependent multiaxial fatigue life estimation criterion for metals under various loading conditions. Int. J. Fatigue 2021, 149, 106300. [Google Scholar] [CrossRef]
  26. Jones, R.; Krishnapillai, K.; Pitt, S. Crack patching: Predicting fatigue crack growth. Theor. Appl. Fract. Mech. 2006, 45, 79–91. [Google Scholar] [CrossRef]
  27. Zhao, T.; Jiang, Y. Fatigue of 7075-T651 aluminum alloy. Int. J. Fatigue 2008, 30, 834–849. [Google Scholar] [CrossRef]
  28. François, H.; Gilbert, H.; Damien, H.; Gueguen, M.; Thomas, B. CDM approach applied to fatigue crack propagation on airframe structural alloys. Procedia Eng. 2010, 2, 1403–1412. [Google Scholar] [CrossRef]
  29. Metal Fatigue Laboratory, University of Waterloo. Tested Data for Steels [Internet]. Available online: http://fde.uwaterloo.ca (accessed on 10 December 2023).
  30. Kvackaj, T. (Ed.) Aluminium Alloys, Theory and Applications; Intechopen: Rijeka, Croatia, 2011. [Google Scholar]
  31. Science and Technology Committee of Aeronautic Engineering Department. Handbook of Strain Fatigue Analysis; Science Publishing House: Beijing, China, 1987. [Google Scholar]
  32. Wong, W.A. Monotonic and cyclic fatigue properties of automotive aluminum alloys. SAE Trans. 1984, 93, 720–727. [Google Scholar]
  33. Fatemi, A.; Plaseied, A.; Khosrovaneh, A.K.; Tanner, D. Application of bi-linear log–log S–N model to strain-controlled fatigue data of aluminum alloys and its effect on life predictions. Int. J. Fatigue 2005, 27, 1040–1050. [Google Scholar] [CrossRef]
  34. Georgantzia, E.; Kashani, M.M. Monotonic and cyclic behaviour of 6082-T6 aluminium alloy. ce/papers 2023, 6, 2220–2225. [Google Scholar] [CrossRef]
  35. Zhang, Z.; Sun, Q.; Li, C.; Zhao, W. Theoretical calculation of the strain-hardening exponent and the strength coefficient of metallic materials. J. Mater. Eng. Perform. 2006, 15, 19–22. [Google Scholar] [CrossRef]
  36. Chow, C.L.; Wei, Y. A damage mechanics model of fatigue crack initiation in notched plates. Theor. Appl. Fract. Mech. 1991, 16, 123–133. [Google Scholar] [CrossRef]
  37. Bannantine, J.A.; Comer, J.J.; Handrock, J.L. Fundamentals of Metal Fatigue Analysis, 1st ed.; Prentice Hall: Upper Saddle River, NJ, USA, 1990. [Google Scholar]
Figure 1. Engineering stress–strain curve in tension.
Applmech 05 00050 g001
Figure 2. Variation in critical damage value for all aluminum alloys.
Applmech 05 00050 g002
Figure 3. Variation in damage with plastic strain for aluminum alloys with critical damage value of 0.1 to 0.3.
Applmech 05 00050 g003
Figure 4. Variation in damage with plastic strain for aluminum alloys with critical damage values from 0.31 to 0.8.
Applmech 05 00050 g004
Figure 5. Variation in damage with a plastic strain for materials with critical damage values of (a) 0.16, (b) 0.50, (c) 0.68, and (d) 0.86.
Applmech 05 00050 g005
Figure 6. Variation in damage with plastic strain for 2xxx series.
Applmech 05 00050 g006
Figure 7. % Critical damage value vs. % true fracture ductility for 2xxx series.
Applmech 05 00050 g007
Figure 8. Variation in damage with respect to the plastic strain for the 5xxx series.
Applmech 05 00050 g008
Figure 9. Critical damage % value vs. true fracture ductility % for 5xxx series.
Applmech 05 00050 g009
Figure 10. Variation in damage with plastic strain for 6xxx series.
Applmech 05 00050 g010
Figure 11. Critical damage % value vs. true fracture ductility % for 6xxx series.
Applmech 05 00050 g011
Figure 12. Variation in damage with plastic strain for 7xxx series.
Applmech 05 00050 g012
Figure 13. Critical damage % value vs. true fracture ductility % for 7xxx series.
Applmech 05 00050 g013
Figure 14. Variation in damage with plastic strain for other aluminum alloys.
Applmech 05 00050 g014
Figure 15. Critical damage % value vs. true fracture ductility % for other aluminum alloys.
Applmech 05 00050 g015
Table 1. Monotonic properties of aluminum alloys.
Sl. No. Material σ y (MPa) σ u (MPa)E (GPa) σ f (MPa)Kn ϵ f Ref.
1xxx series
111009711772.01661690.1681.77[29]
2xxx series
22014-T645148370.85856050.0490.88[30]
32017A-T430544172.48766110.0538.55[29]
42024-T327541574.54356800.1800.21[30]
52024-T35137946973.111036550.0650.22[31]
62024-T430347670.010147560.0800.21[32]
72219-T85136147074.58327520.1311.25[29]
82618A-T65143748770.48116400.0702.70[29]
5xxx series
95052-H3216723169.63612860.0440.42[29]
10508330541473.26165920.0772.00[30]
11545429433469.85303630.0461.09[29]
125454-H3425730172.74364470.0750.85[29]
135454-O11624869.64624200.0821.26[29]
145456-H31123540069.17026360.0840.20[33]
155754-NG10725373.44552940.0329.19[33]
6xxx series
166061-T632434072.75474160.0420.22[30]
176061-T651--68.93944040.0620.63[32]
18606323926373.45563840.0670.74[33]
196082-T626429666.63143350.0310.13[34]
7xxx series
207049-T661664971.38209000.0582.42[29]
217050-T735145151869.67127050.0702.38[29]
227075-T646957971.08808970.0830.47[31]
237075-T65150156171.011038070.0682.13[29]
247075-T735138246265.79896950.0946.81[33]
257175-T7343452471.07285290.0336.18[30]
Other aluminum alloys
26LY12CZ 40054573.27248700.0970.14[31]
27LC4CS571614-7117750.1580.18[31]
28LC9CgS3518560-7487250.0530.28[35]
29LY12CZ332476-6185450.0890.30[35]
30AlMg4.5Mn29836371.56546930.1250.45[33]
31LC9CgS351856072.28089060.1010.77[31]
32AlMg-Si21930569.03944310.0601.49[29]
Where σ y —yield strength, σ u —ultimate strength, σ f —true fracture strength, ϵ f —true fracture ductility.
Table 2. Critical damage value (DC) of aluminum alloys.
Sl. No. Material ϵ f DC
12024-T3510.2200.12
2LY12CZ [31]0.1400.14
32024-T30.2100.14
46082-T60.1320.15
5LC4CS0.1800.16
65456-H3110.2000.16
76061-T60.2200.16
82024-T30.2500.24
9LC9CgS3 [35]0.2800.24
10LY12CZ [35]0.3000.24
115052-H320.4240.29
12AlMg4.5Mn0.4500.34
137075-T60.4660.34
1460630.7400.38
156061-T6510.6340.44
16LC9CgS3 [31]0.7700.50
175454-H340.8500.50
1854541.0870.50
192014-T60.8800.53
202219-T8511.2540.58
215454-O1.2580.58
22AlMg-Si1.4920.68
2311001.7650.68
247075-T6512.1330.68
2550832.0000.72
262618A-T6512.7030.74
277050-T73512.3760.77
287049-T62.4210.77
297175-T736.1800.86
307075-T73516.8100.86
312017A-T48.5490.89
325754-NG9.1900.89
Table 3. Critical damage value (DC) for 2xxx series.
Sl. No.Materials ϵ f DC
12024-T3510.220.12
22024-T40.210.14
32024-T30.250.24
42014-T60.880.53
52219-T8511.250.58
62618A-T6512.700.74
72017A-T48.550.89
Table 4. Critical damage value (DC) for 5xxx series.
Sl. No.Material ϵ f DC
15456-H3110.200.16
25052-H320.420.29
354541.090.50
45454-H340.850.50
55454-O1.260.58
65083 2.000.72
75754-NG9.190.89
Table 5. Critical damage value (DC) for 6xxx series.
Sl. No.Material ϵ f DC
16082-T60.130.15
26061-T60.220.16
360630.740.38
46061-T6510.630.44
46082-T60.700.44
Table 6. Critical damage value (DC) of 7xxx series.
Sl. No.Material ϵ f DC
17075-T60.470.34
27075-T6512.130.68
37050-T73512.380.77
47049-T62.420.77
57175-T736.180.86
67075-T73516.810.86
Table 7. Critical damage value (DC) for other aluminum alloys.
Sl. No.Material ϵ f DC
1LY12CZ [31]0.140.14
2LC4CS0.180.16
3LY12CZ [35]0.300.24
4LC9CgS3 [35]0.280.24
5AlMg4.5Mn0.450.34
6LC9CgS3 [31]0.770.50
7AlMg-Si1.490.68
Disclaimer/Publisher’s Note: The statements, opinions and data contained in all publications are solely those of the individual author(s) and contributor(s) and not of MDPI and/or the editor(s). MDPI and/or the editor(s) disclaim responsibility for any injury to people or property resulting from any ideas, methods, instructions or products referred to in the content.

