Communication

An Analytical Approximation of the Stress Function for Conical Flywheels

by
Miguel Garcia
1,*,
Onofre Orozco-López
1,
Jesús Uribe-Chavira
2 and
Andrés Blanco-Ortega
3
1
Centro Universitario de Los Lagos, Universidad de Guadalajara, Lagos de Moreno 47460, Mexico
2
Centro de Investigación en Materiales Avanzados, Tecnológico Nacional de México, Chihuahua 31136, Mexico
3
Centro Nacional de Investigación y Desarrollo Tecnológico, Tecnológico Nacional de México, Cuernavaca 62490, Mexico
*
Author to whom correspondence should be addressed.
Appl. Mech. 2025, 6(2), 30; https://doi.org/10.3390/applmech6020030
Submission received: 21 February 2025 / Revised: 5 April 2025 / Accepted: 13 April 2025 / Published: 22 April 2025

Abstract

:
The current paper addresses the lack of explicit analytical solutions for stress evaluations in variable-thickness flywheels by proposing an approximate formulation for conical profiles, where thickness varies linearly along the radius. The main objective was to develop a compact and practical expression to estimate radial and tangential stresses without relying on finite element analysis. Starting from a stress function, the model was simplified under the assumption of a small-thickness gradient, allowing the derivation of a closed-form solution. The resulting expression explicitly relates stresses to geometric and material parameters. To validate the approximation, stress distributions were computed for various outer-to-inner thickness ratios and compared with results obtained through FEA. The comparison, evaluated using the coefficient of determination, mean absolute percentage error, root mean squared error, normalized root mean squared error, and stress ratios, demonstrated strong agreement, especially for moderate-thickness ratios ( 1 t o / t i 4.5 ). The method was more accurate for radial stress than tangential stress, particularly at higher gradients. The results confirmed that the proposed analytical approach provides a reliable and efficient alternative to numerical methods in the design and optimization of conical flywheels, offering practical value for early-stage engineering analysis and reducing reliance on time-intensive simulations.

1. Introduction

Determining the stress of variable-thickness flywheels with an equation is of absolute importance in mechanical engineering. Most flywheel cross-sections are designed and optimized using FEA software as a consequence of the lack of an equation to determine the stresses [1].
Flywheels have multiple applications, such as in space technology, light-duty vehicles, renewable energy and transportation systems, and power networks, among others [2,3,4,5,6]. Flywheels are the main component of flywheel energy storage systems (FESSs), which are electromechanical devices that convert kinetic rotational energy into electrical energy [3]. FESSs are widely used for their flexibility to store energy and later convert and manipulate it [3]. They offer high efficiency, large amounts of instantaneous power, fast responses, low maintenance costs, long-lasting services, and multiple environmental benefits [2,4,5].

Background

In analyzing and designing an FESS, there are multiple constraints that are worth optimizing. Some of these constraints are the size, shape, and topology of the flywheel, which are of great value since these parameters are not only closely related to the mass of the system but also directly related to the energy storage capacity of an FESS [3]. There are researchers who investigate the analysis and optimization of flywheel size, shape, and topology [7,8,9]. On the one hand, most of them use numerical methods, such as the finite element method (FEM), or finite element analysis (FEA). For example, Zenkour and Mashat, in [1], investigated the stress, strain, and displacement fields in rotating annular disks of radially varying thickness, using both exact analytical and numerical methods. Two disk profiles governed by exponential thickness variations were considered. For the first disk, an exact analytical solution was obtained through the introduction of a stress function and the application of Whittaker functions. For the second disk, where no closed-form solution exists due to its geometric complexity, a fourth-order Runge–Kutta method was employed. Comparative results for the first disk confirmed the high accuracy of the numerical scheme. Parametric studies illustrated the influence of thickness profile parameters on the stress distribution and deformation behavior. The findings demonstrate that the proposed numerical approach provided a reliable and efficient tool for analyzing rotating variable-thickness structures, extending the applicability to cases beyond the reach of analytical methods.
Sondhi et al. [10] presented a finite element-based formulation to analyze the stress and deformation behavior of rotating disks composed of functionally graded polar orthotropic materials with variable-thickness profiles and a rigid central shaft. The material properties, including Young’s modulus, density, and thermal expansion coefficient, were assumed to vary radially according to a power law distribution, while Poisson’s ratio remained constant. The governing equilibrium equations were derived under plane stress conditions and solved using FEM. The formulation was validated against existing analytical solutions for specific cases, demonstrating strong agreement. Parametric studies investigated the effects of material gradation, thickness variation, and rotational speed on the resulting stress and displacement fields. The results indicated that appropriate selection of material gradation and disk geometry significantly reduced stress concentrations and deformations, thereby improving structural performance.
Jiang et al. [8] applied FEA to optimize the geometry of flywheel rotors in order to maximize energy storage density while maintaining structural integrity under stress constraints. Two flywheel configurations were considered: integrated rotors and interference-fit rotors. A two-dimensional axisymmetric model was developed using ANSYS, with rotor shapes being parameterized by spline curves controlled through a series of design points. The optimization process used the Downhill Simplex method to maximize energy density subject to size and stress constraints, using FEA to evaluate mass, inertia, and stress distributions at each iteration. The results demonstrated that optimized rotor geometries significantly increased energy density—up to 24.8%—compared to constant-thickness designs, while also reducing peak stresses and improving safety margins. For interference-fit flywheels, FEA captured the interaction between centrifugal forces and assembly induced contact stresses, enabling targeted shape modifications that alleviated stress concentrations near the inner radius. The authors concluded that FEA-driven shape optimization is a powerful tool that can be used to enhance the performance and fatigue life of flywheel energy storage systems, particularly under practical design constraints related to mass, space, and mechanical reliability.
Jiang and Wu [9] used FEA to optimize the flywheel topology with the objective of maximizing energy storage density while meeting practical design constraints. A two-dimensional model based on the variable density method was developed to simulate the flywheel under centrifugal loading, and material distributions were optimized using SIMP penalization in conjunction with manufacturing and structural constraints. FEA simulations demonstrated that topology-optimized layouts—featuring strategically placed voids—achieved a 14.3% increase in energy density by removing low-inertia regions near the inner radius. Additional comparisons with solid rotors of equal mass showed energy density improvements of up to 56.7%. The authors further investigated the influence of stress limits, cyclical symmetry, minimum member size, and volume fraction constraints on topology outcomes. The results indicated that optimal flywheel layouts required a careful balance between structural stress and manufacturability.
Kale et al. [7] used a stress-constrained topology optimization framework, grounded in the FEM, to enhance the specific energy of an FESS. The optimization was performed using both the kinetic energy and the specific energy as objective functions. The newly proposed specific energy formulation eliminated the need for a fixed volume fraction constraint and allowed the algorithm to explore a broader design space. FEM simulations demonstrated that optimized rotor topologies improved the specific energy by up to 15.8% over the baseline annular disk design while satisfying stress and manufacturability constraints.
Hassan et al. [11] investigated the structural design and material optimization of high-speed flywheels for small-scale energy storage systems. Two hub geometries—elliptical and hexa-arm—were analyzed at high rotational speeds using FEM. The study compared stress distributions and energy storage capabilities for various composite materials, focusing on carbon fiber (IM10) and S2 glass fiber. The results showed that both material combinations could withstand stresses up to 1.124 GPa at 6000 rad/s, and carbon fiber rotors offered superior performance due to their high tensile strength and stiffness. Interference fits between flywheel components were also evaluated to ensure structural integrity under centrifugal forces, identifying optimal tolerances for press-fit joints. Additionally, the use of multi-rim rotors significantly increased energy capacity—from 1.5 MJ for a single rim to nearly 10 MJ with three rims—while maintaining structural safety. The study concluded that lightweight, fiber-based flywheel designs with optimized geometry and contact conditions can effectively enhance the energy density and mechanical resilience of compact energy storage systems.
Bankston and Mo [12] investigated the influence of geometric profiles on the energy storage performance of flywheel systems through combined analytical analysis and FEA. Two flywheel profiles, a conventional thick-rimmed disk (Profile 1) and its reversed counterpart (Profile 2), were evaluated under identical material and rotational speed conditions. Finite element simulations were performed to compute radial and hoop stresses across variable-thickness ratios, validating and extending analytical predictions derived from plane stress formulations. The results demonstrated that FEM consistently produced more conservative hoop stress values for cases with a high thickness ratio, thereby preventing the overestimation of the maximum operating speed and shape factor. The study found that although Profile 2 exhibited higher shape factors, Profile 1 provided greater energy storage capacity due to its increased mass and moment of inertia.
Kale et al. [13] used FEM to support the shape optimization of metal flywheel rotors aimed at maximizing kinetic energy storage. The rotor was modeled as a two-dimensional axisymmetric structure, and FEM was used to accurately compute stress distributions under centrifugal loading. The analysis incorporated material failure constraints by evaluating equivalent von Mises stresses to ensure safe operation. The FEM-based stress evaluations enabled the integration of mechanical limits into a sequential hybrid optimization framework, which combined global and local optimization algorithms. The simulation results revealed that FEM played a critical role in identifying shape configurations that satisfied structural integrity while significantly improving energy storage performance. The authors demonstrated that optimal shapes achieved up to 46% higher energy storage compared to conventional designs.
However, there are researchers who have proposed analytical solutions for variable-thickness flywheels. However, this is not an easy task. Wen [14], for example, analyzed the stresses in an anisotropic flywheel based on plane stress. After the radial and tangential stresses were obtained, the location of the maximum radial stress was derived using the extreme point method and calculated using the Newton method. The results show a fine approximation which could be used in the design of composite flywheels. To the best of our knowledge, at the time of developing this work, the equilibrium equation for a flywheel with a linearly variable thickness was not solved. Although Semsri [3] uses the solution provided by Ugural and Fenster [15] to analyze a conical flywheel, Ugural and Fenster’s solution is clearly and explicitly provided for a hyperbolic profile.
In the next section, the equilibrium equation is solved, assuming that the flywheel’s thickness varies linearly. A compact and easy-to-handle equation is given and further analyzed. The equation obtained was used to compute the stresses developed in the flywheel, and these results were compared with the FEA results. In Section 3, the results of Section 2 are discussed.

2. Methodology

The design of a constant-thickness flywheel is based mainly on two stresses: a radial stress, σ r , and a tangential one, σ t . σ r is given by [3]
σ r = r 0 2 + r i 2 r 0 2 r i 2 r 2 r 2 3 + ν 8 ρ ω 2
and σ t by [3]
σ t = r 0 2 + r i 2 + r 0 2 r i 2 r 2 1 + 3 ν 3 + ν r 2 3 + ν 8 ρ ω 2 ,
where
  • r o is the outer radius of the flywheel;
  • r i is the inner radius of the flywheel;
  • r is the radial distance at which the stress is to be computed;
  • ν is the Poisson ratio of the flywheel material;
  • ρ is the density of the flywheel material;
  • ω is the angular velocity of the flywheel.
In Figure 1, the results of an FEM analysis performed in ABAQUS are shown. It can be seen that the results of the simulation converge with those computed analytically with Equations (1) and (2). Figure 1a shows σ r , in kPa; Figure 1b shows σ t , in kPa; and Figure 1c shows the comparison between the simulation results and Equations (1) and (2). Thus, it is clear that (1) and (2) are reliable for stress analysis in constant-thickness flywheels. Figure 1c shows the behavior of σ r and σ t , using data from Table 1. The parameters in Table 1 were selected from a first attempt at a low-speed flywheel design. It can be seen that the total stress, σ T = σ r 2 + σ t 2 , is much more influenced by σ t . The maximum stress is about 14 kPa.
Although the stresses for a constant-thickness flywheel are relatively easy to find, the stresses in a variable-thickness flywheel are not. In this study, the main goal was to find an expression that would help determine the stresses in a variable-thickness flywheel. This is not an easy task, since there is no equation that can be used to compute the stresses in most variable-thickness shapes. To find such an equation, the analysis started from the stress function [15] given by
r 2 d 2 F d r 2 + r d F d r F + 3 + ν ρ ω 2 t r 3 r t d t d r r d F d r ν F = 0
Equation (3) is clearly not linear when t is described by a polynomial, as in the case for a conical flywheel. Therefore, it is necessary to solve Equation (3) by other means. In Equation (3), the fourth term derives from the rotational body force. That is, when such a term is considered, Equation (3) is not homogeneous. On the other hand, if such a term is not considered, then Equation (3) is homogeneous.
The most simple case, geometrically, for a variable-thickness flywheel is a conical flywheel, i.e., when the thickness varies linearly along the radius. That being said, let us consider t given by
t = A + B r .
Now, if the variation of t is small, i.e., if d t / d r is small, then the last term in Equation (3) can be neglected and becomes
r 2 d 2 F d r 2 + r d F d r F + 3 + ν ρ ω 2 t r 3 = 0 .
Since the last term in Equation (5) yields to a fourth-degree polynomial, considering Equation (4), the particular solution to Equation (5), F p , should have the form
F p = C + D r + E r 2 + G r 3 + H r 4 .
Upon substitution of Equations (6) and (4) in Equation (5), C = D = E = 0 , G = A 3 + ν ρ ω 2 / 8 , and H = B 3 + ν ρ ω 2 / 15 . Therefore, F p is
F p = 3 + ν A 8 + B r 15 ρ ω 2 r 3 .
As for the homogeneous solution, F h , it is noted that the homogeneous form of Equation (5) is the same as the homogeneous one for a constant-thickness flywheel [16]. Therefore, F h is
F h = c 0 r + c 1 / r ,
where c 0 and c 1 are determined from the boundary conditions. In this case, σ r = 0 at r = r i and r = r o .
Once F p and F h are determined, the general solution is given by
F = F h + F p = c 0 r + c 1 / r 3 + ν A 8 + B r 15 ρ ω 2 r 3 ,
and σ r and σ t can be obtained as [15]
t r σ r = F
and
t σ t = d F d r + t ρ ω 2 r 2 .
Upon applying boundary conditions, c 0 and c 1 are given by
c 0 = r i + r o r i 3 + r o 3 + r i 2 r o 2 8 B + r i + r o r i 2 + r o 2 15 A 120 r i + r o Z
and
c 1 = 8 B r i r o 1 + r i r o + r o r i + 15 A r i + r o 120 r i + r o r i 2 r o 2 Z ,
with Z = 3 + ν ρ ω 2 .
If the flywheel’s thickness is considered to vary linearly along the radius, as defined by Equation (4), then A and B can be defined as functions of r i , r o , internal thickness, t i , and outer thickness, t o , as
B = t o t i 2 r o r i
and
A = t i B r i .
With Equations (7)–(11), the relation between the stresses in the flywheel and its geometry is explicit.
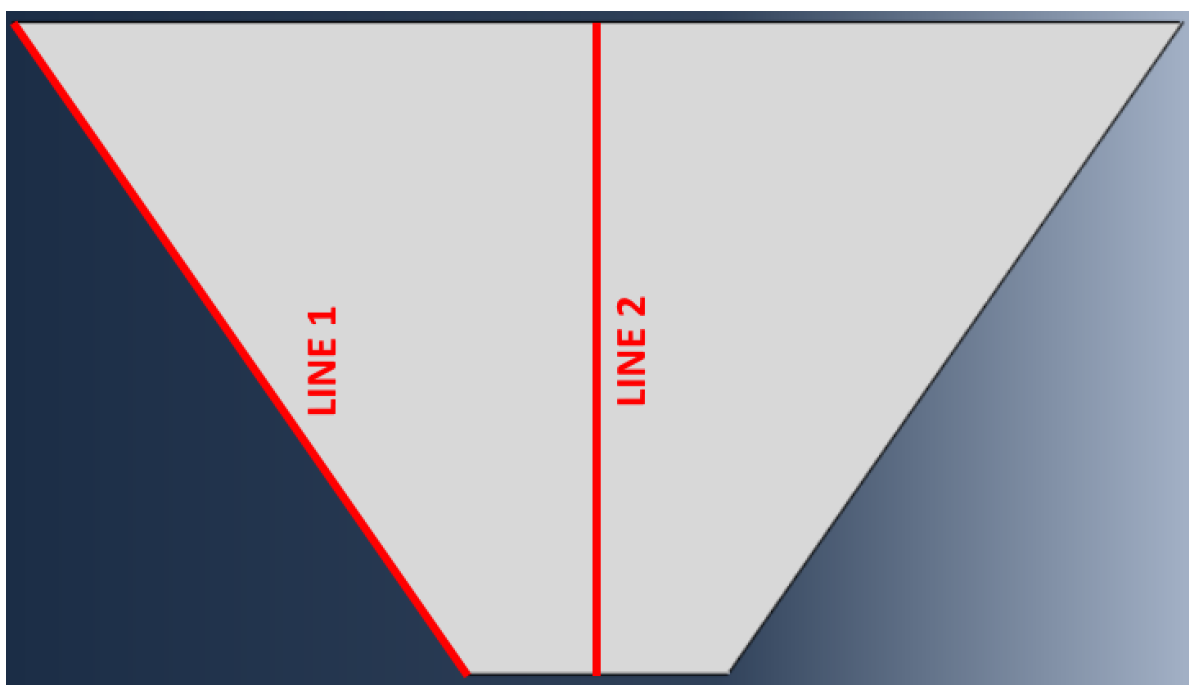
To validate Equation (7), both σ r and σ t were obtained with FEA along two lines, Line 1 and Line 2, as depicted in Figure 2, for 1 t o , i 4.5 . FEA was performed in ABAQUS. The results were compared with those obtained with Equation (7) and are presented in Figure 3, Figure 4, Figure 5, Figure 6, Figure 7, Figure 8 and Figure 9. The results of Figure 3, Figure 4, Figure 5, Figure 6, Figure 7, Figure 8 and Figure 9 were obtained using the parameters given in Table 2. From Table 2, it is evident that the flywheel’s thickness variation is too small. Therefore, an analysis was performed to determine the interval of values for the thickness relation t o , i = t o / t i , for which Equation (7) is valid. In other words, it was determined for what values of t o , i Equation (7) gives an acceptable approximation of σ r and σ t in a variable-thickness flywheel, with t being given by Equation (4).
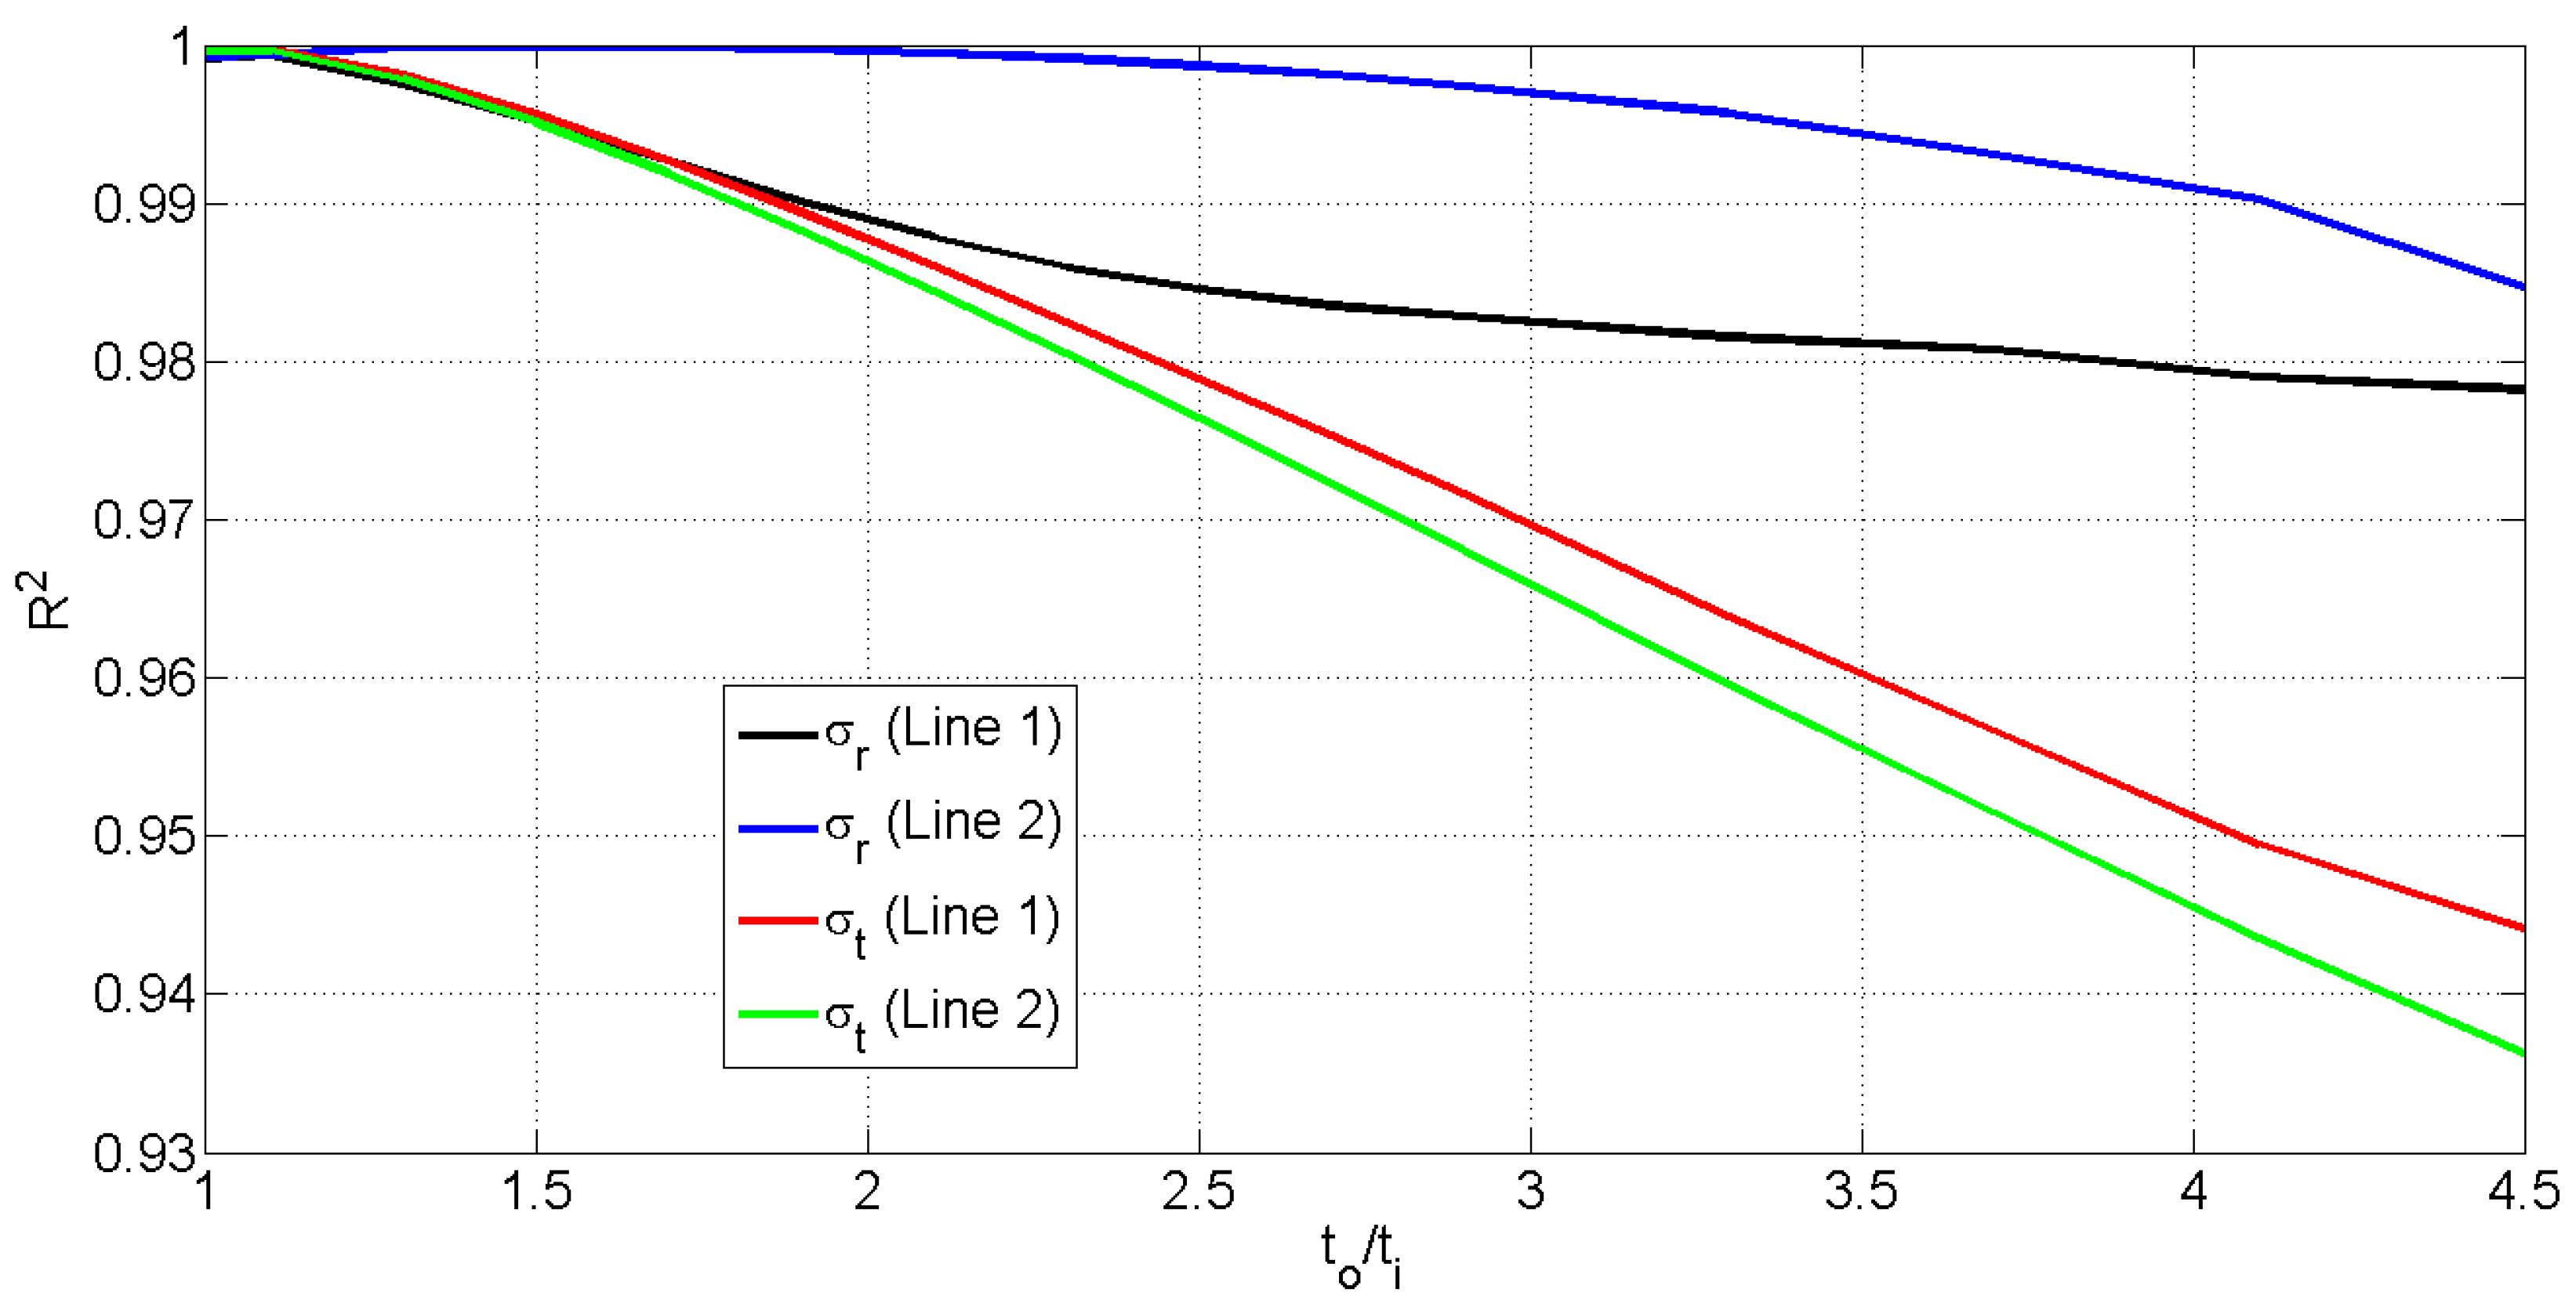
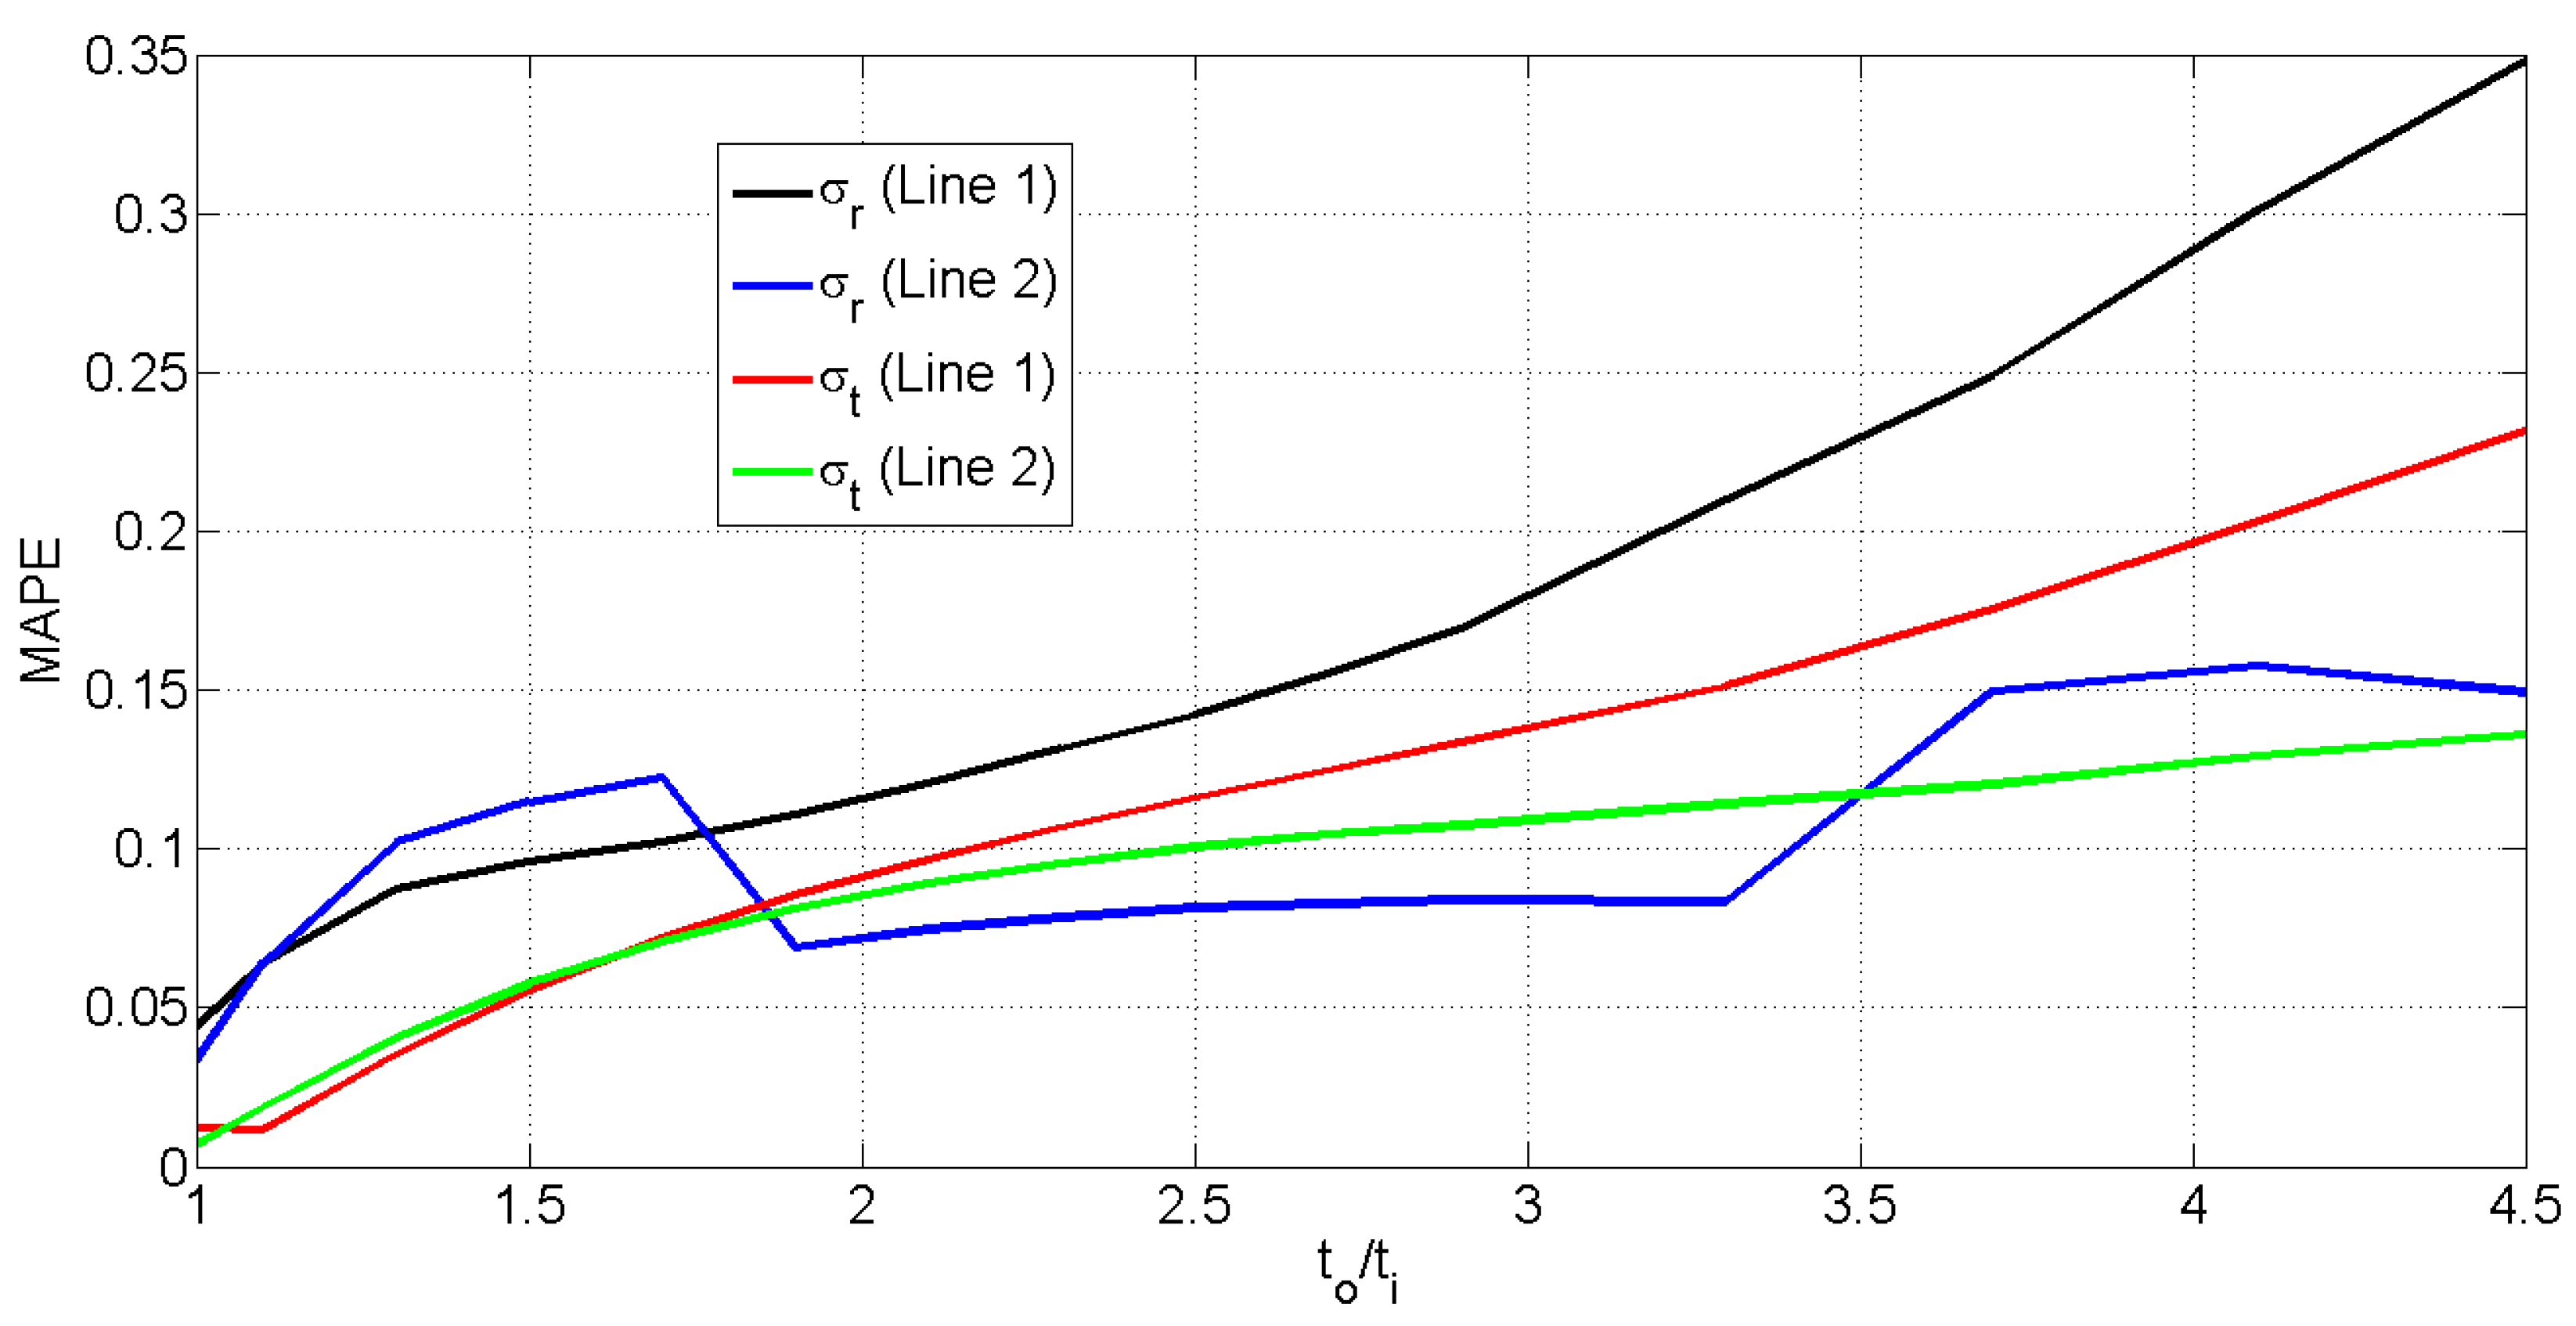
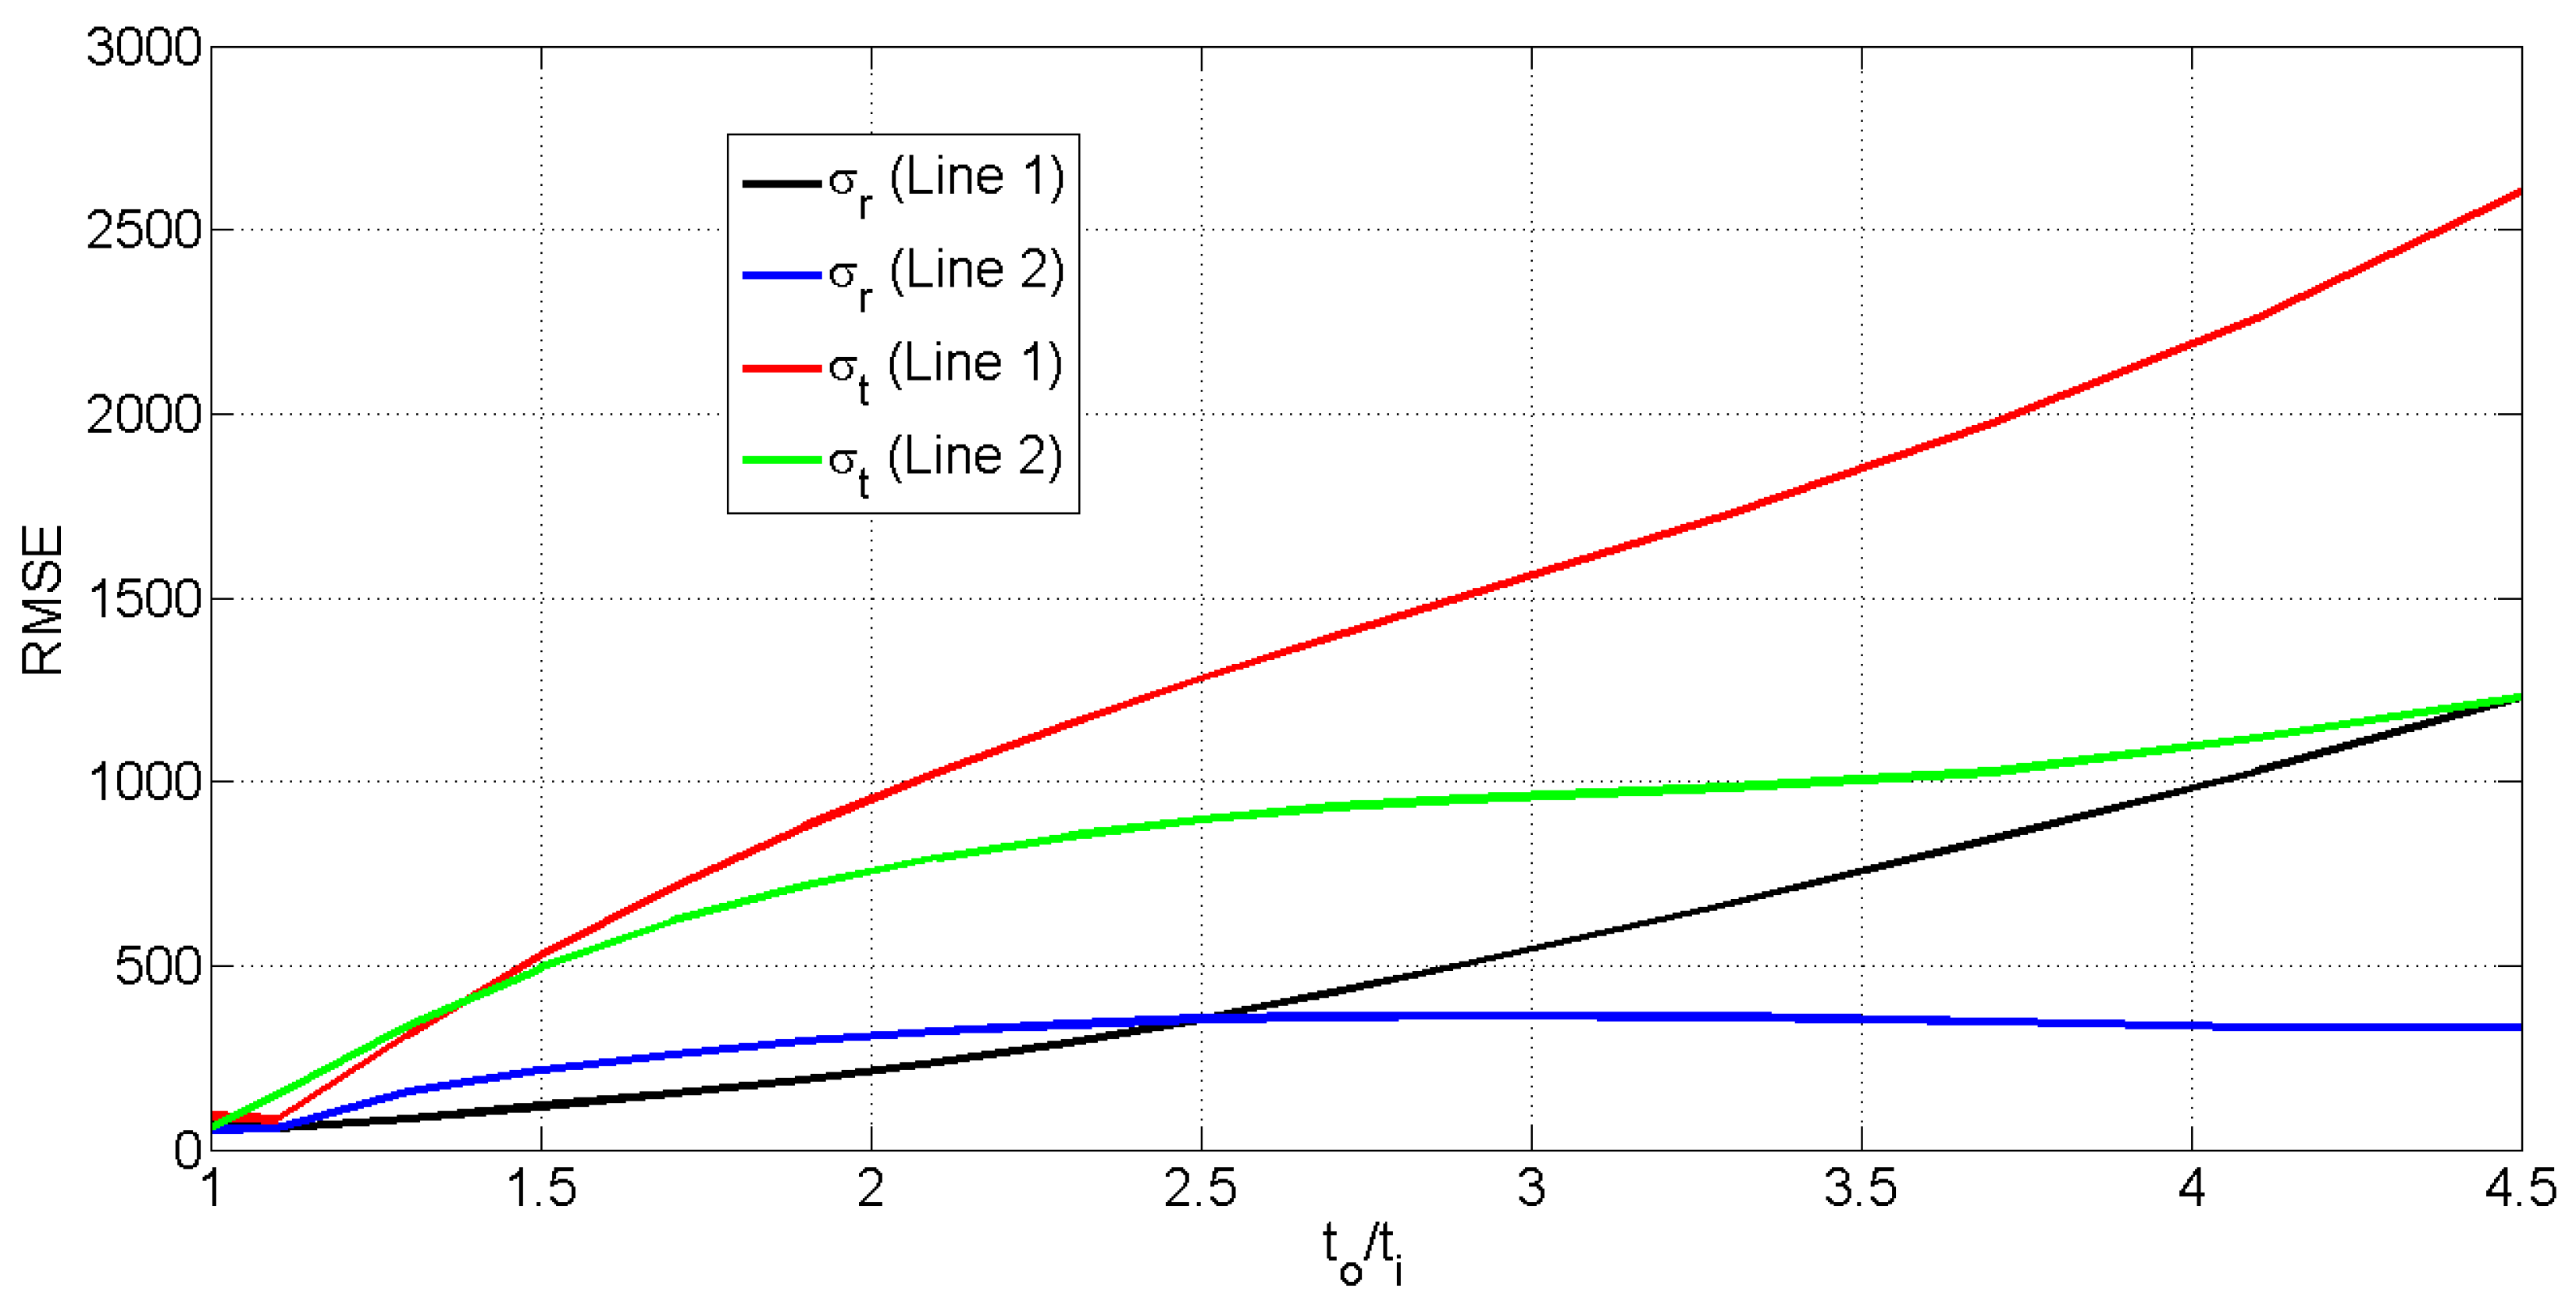
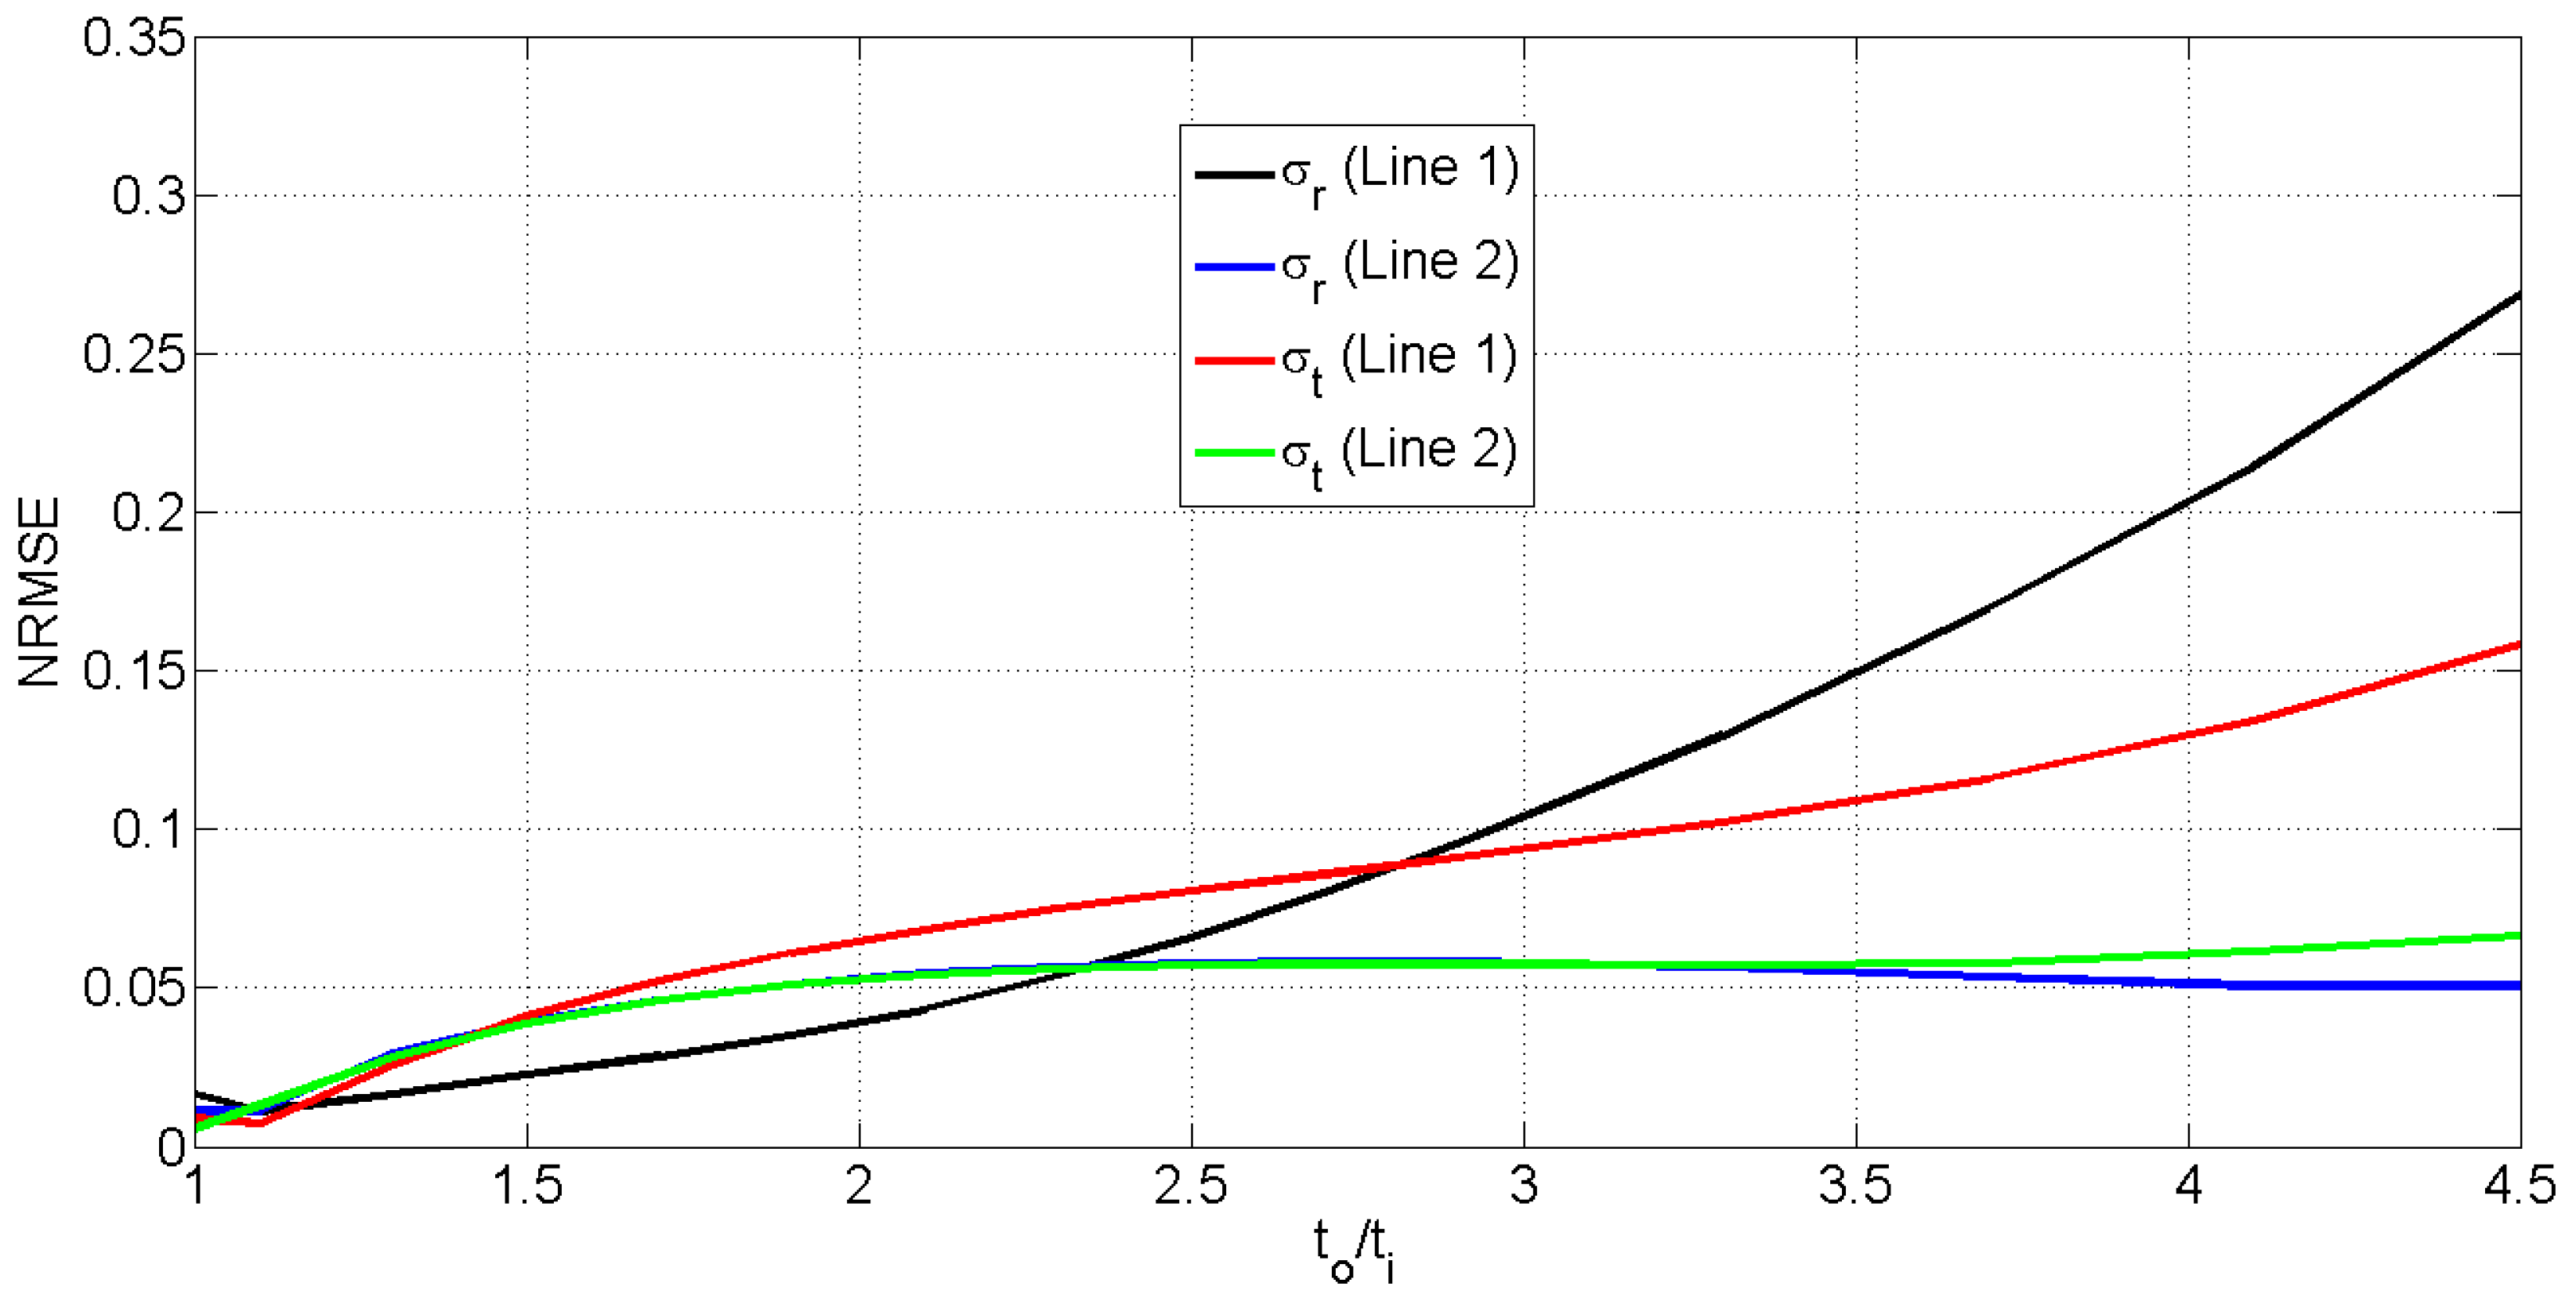
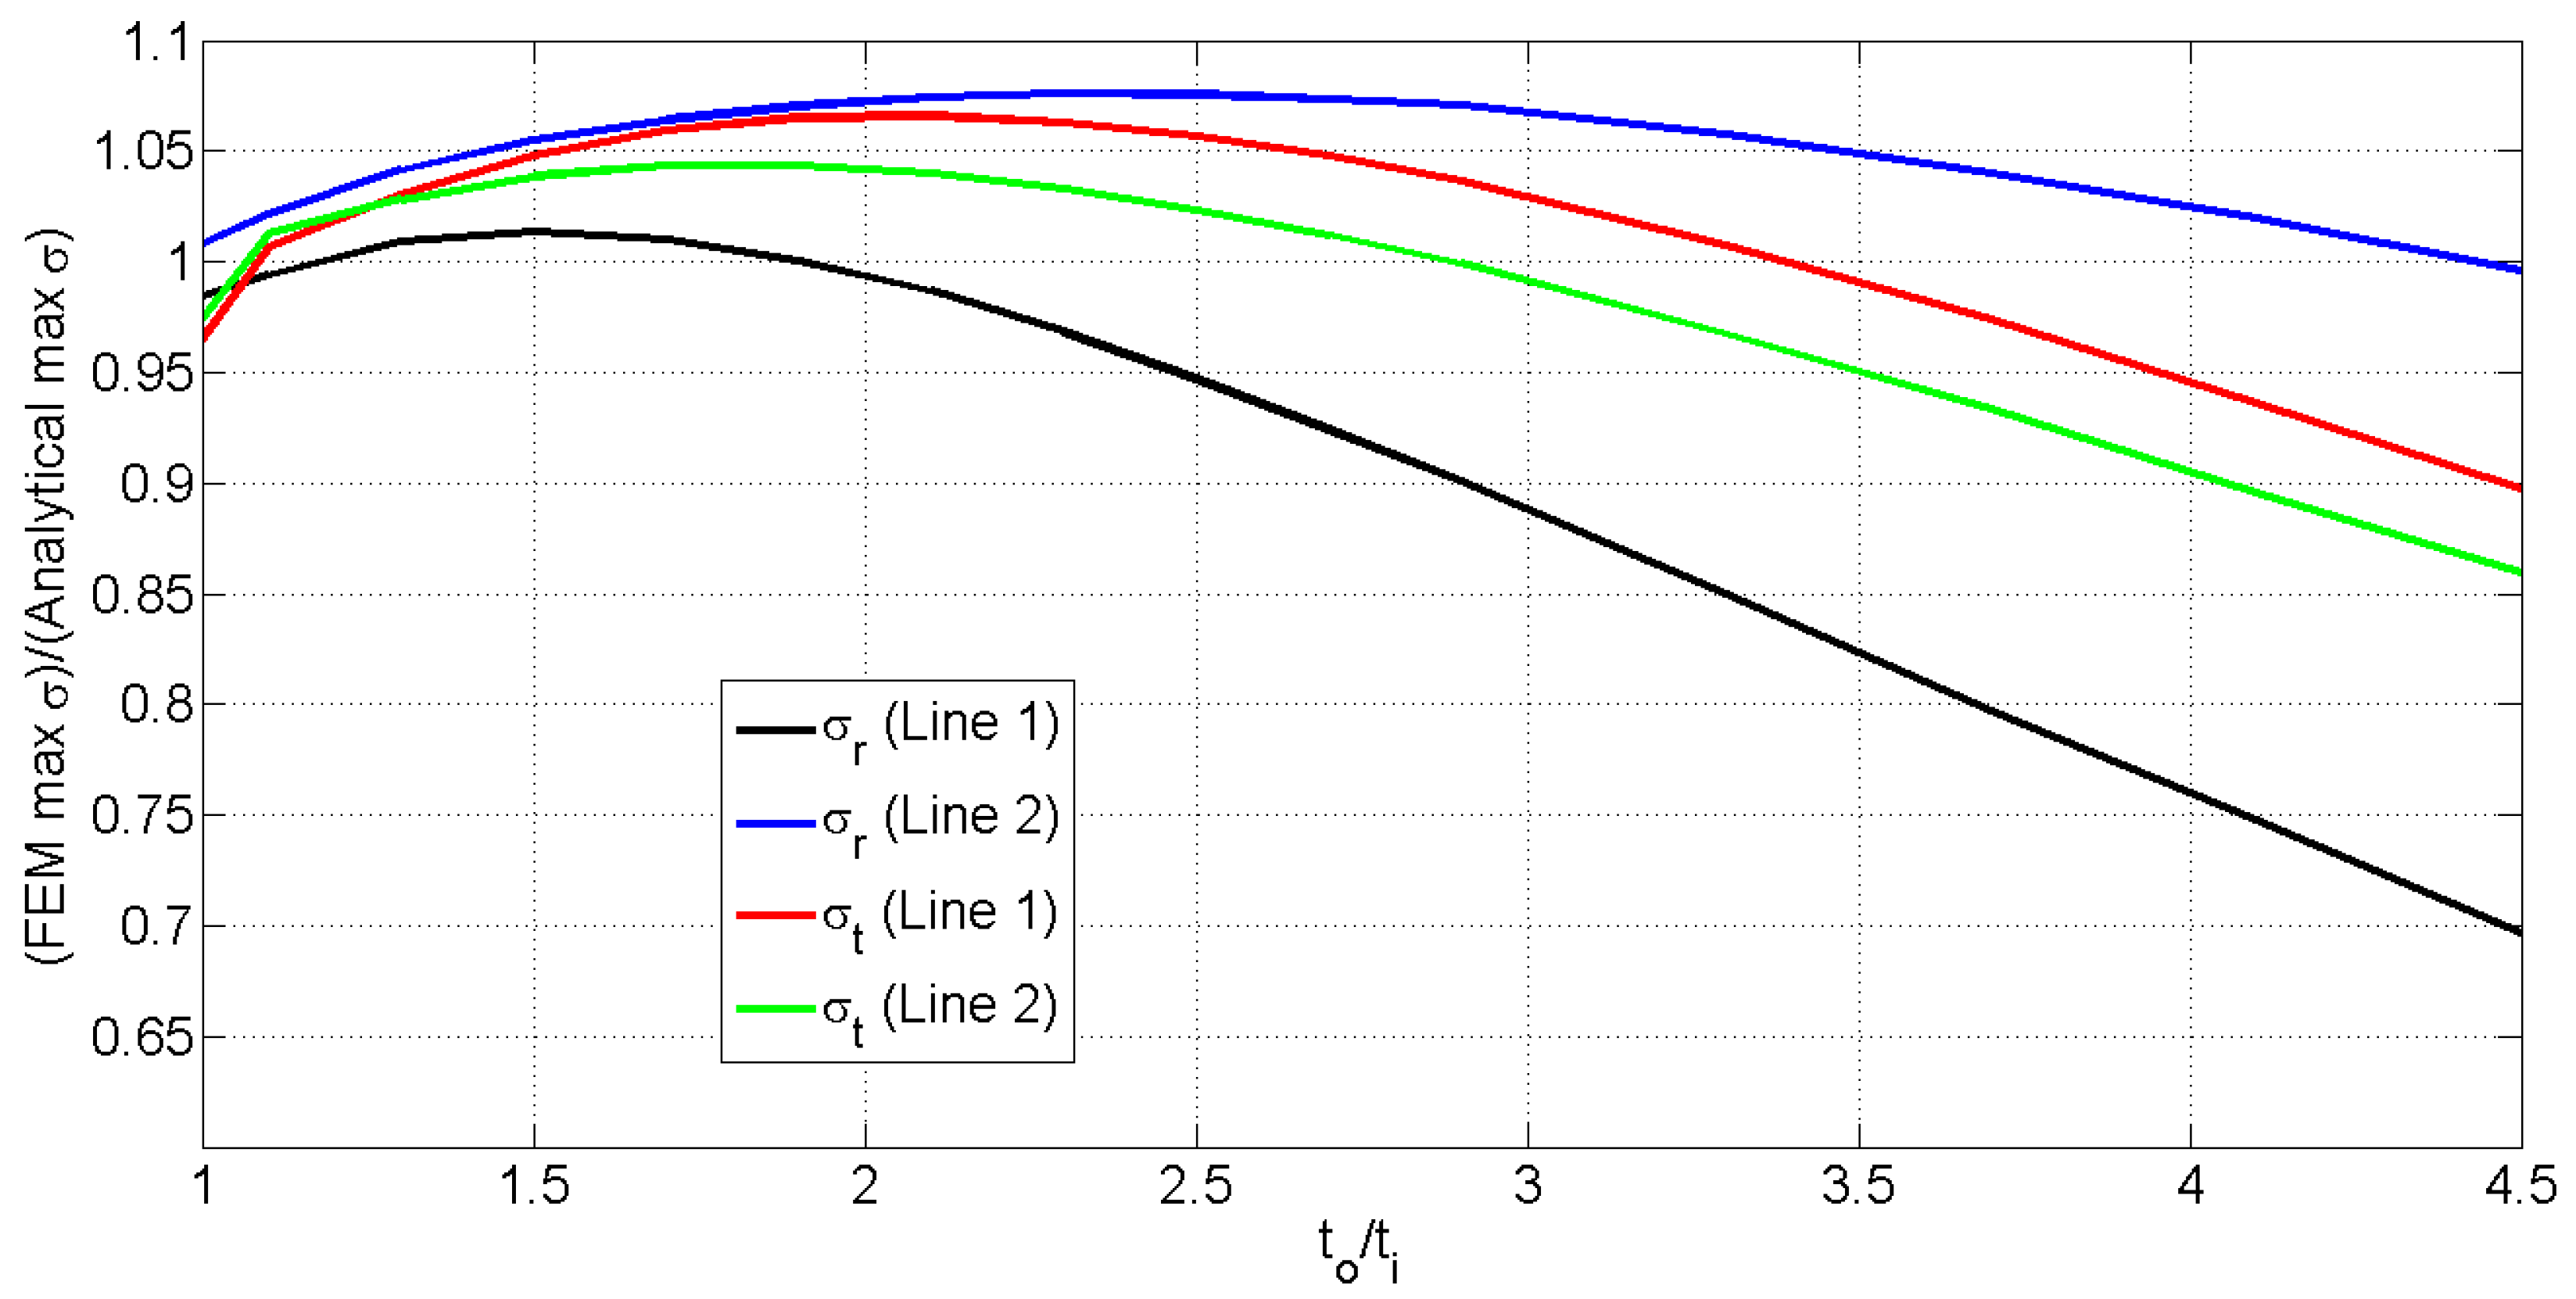
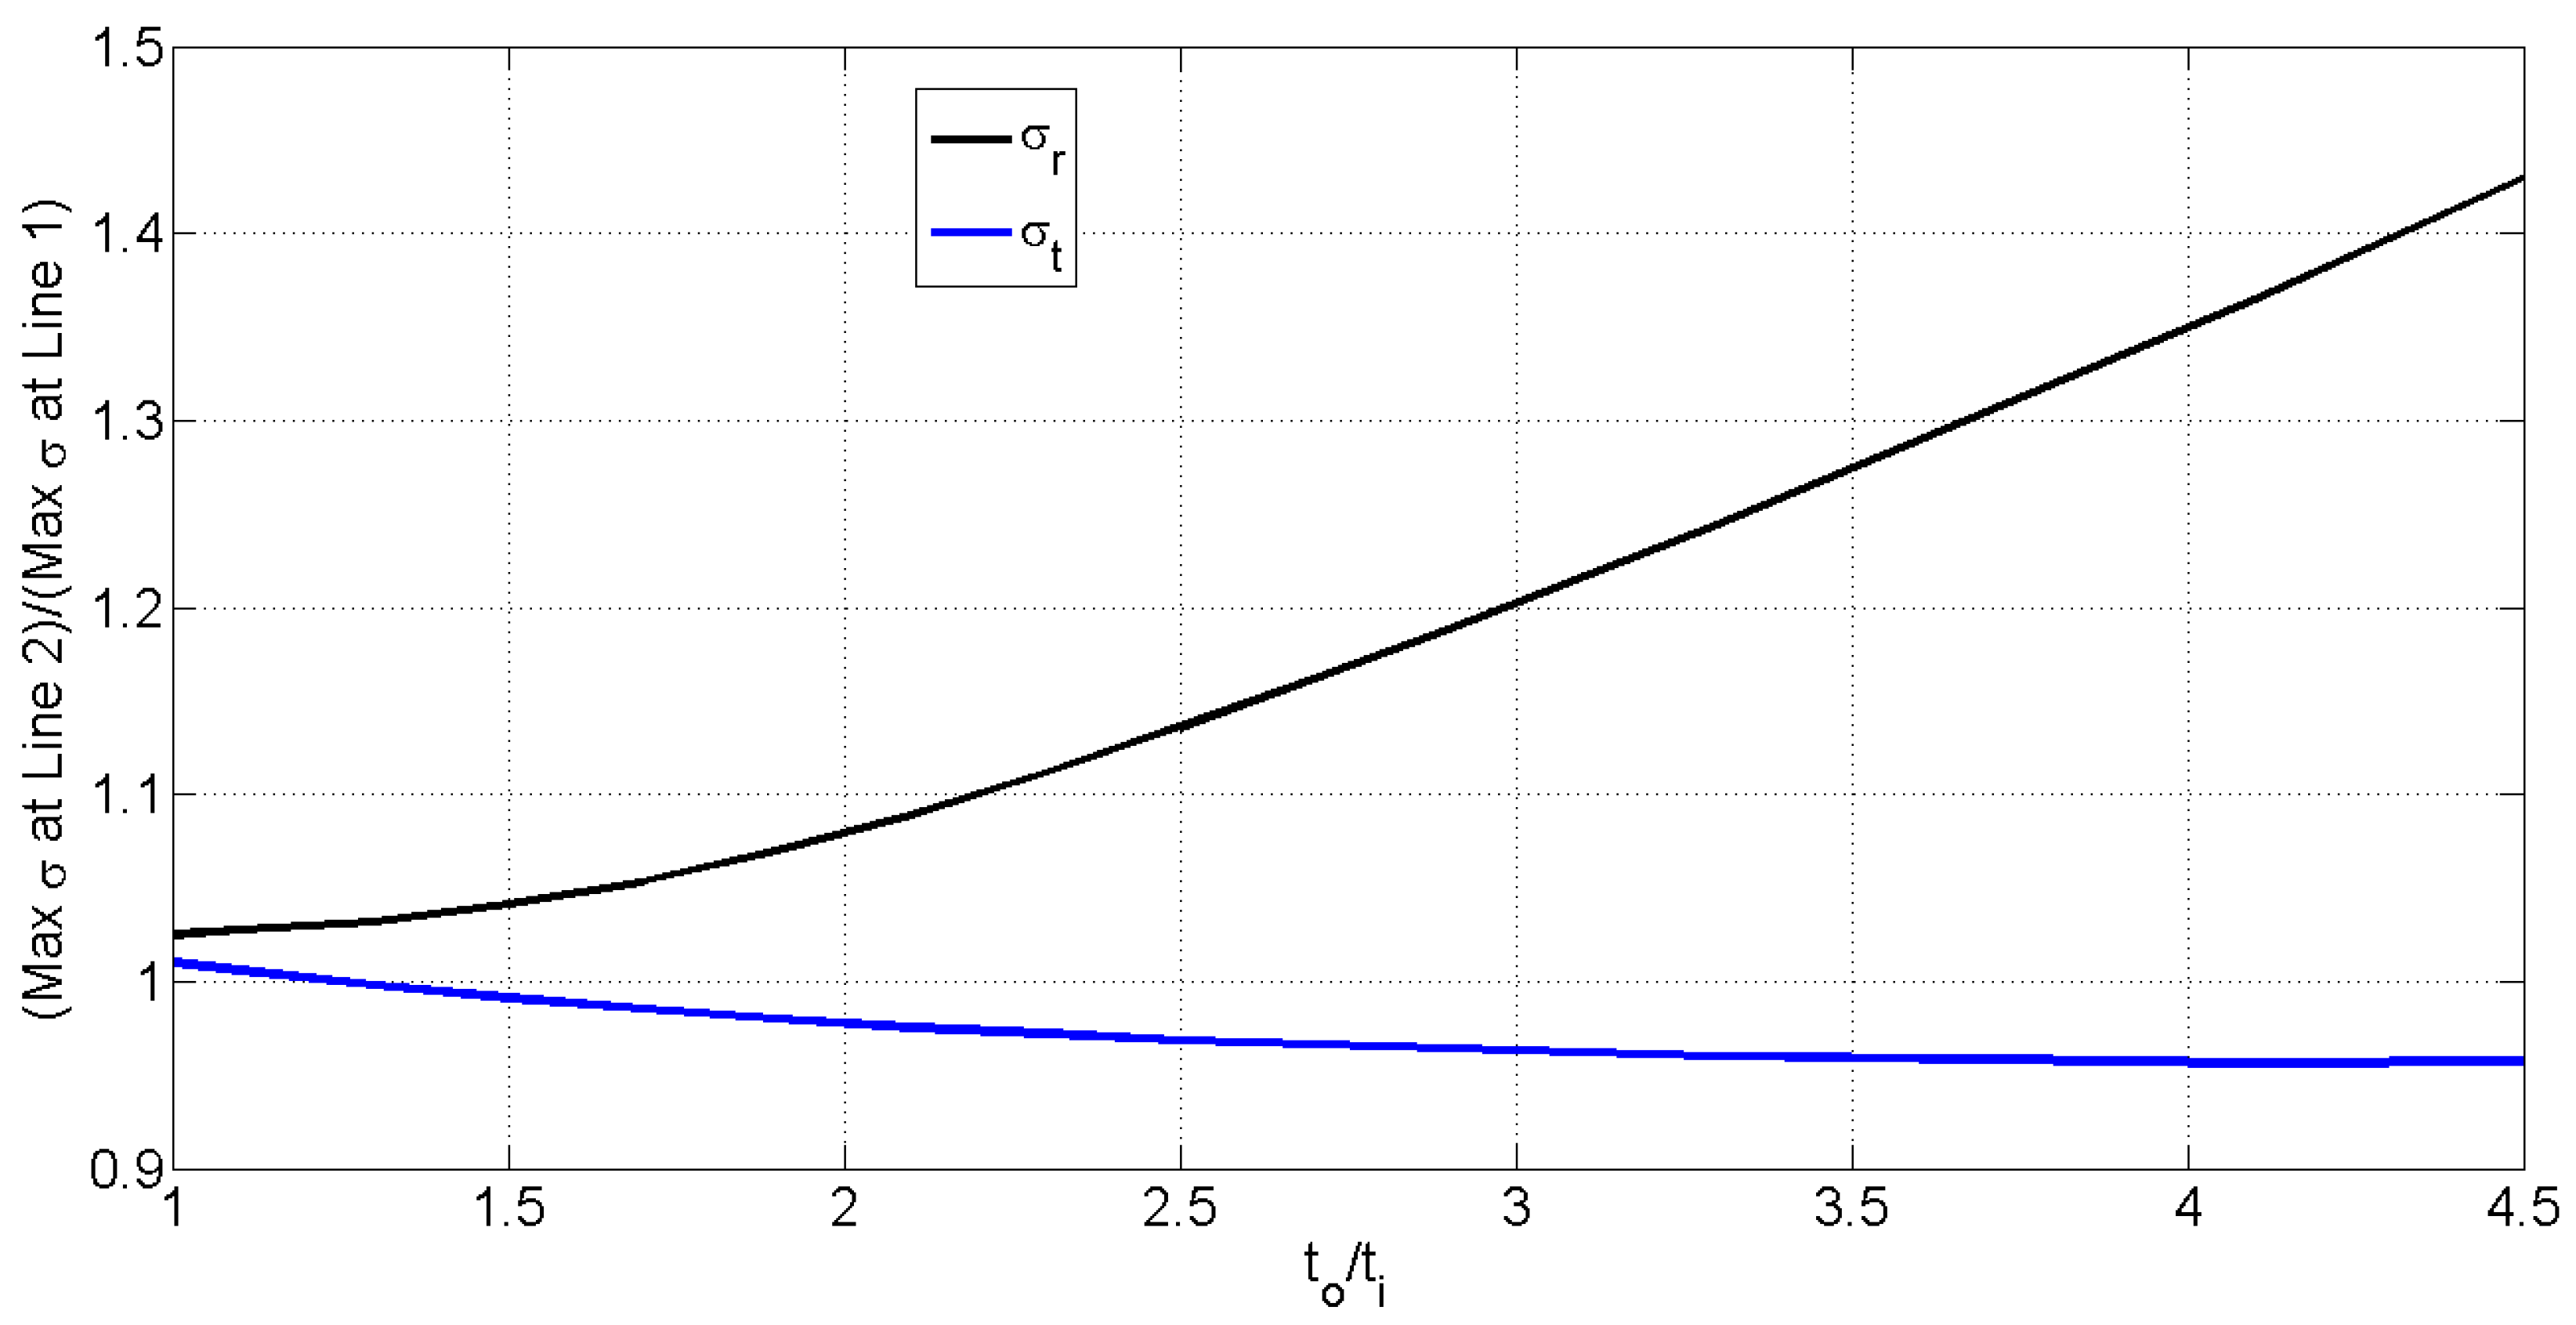
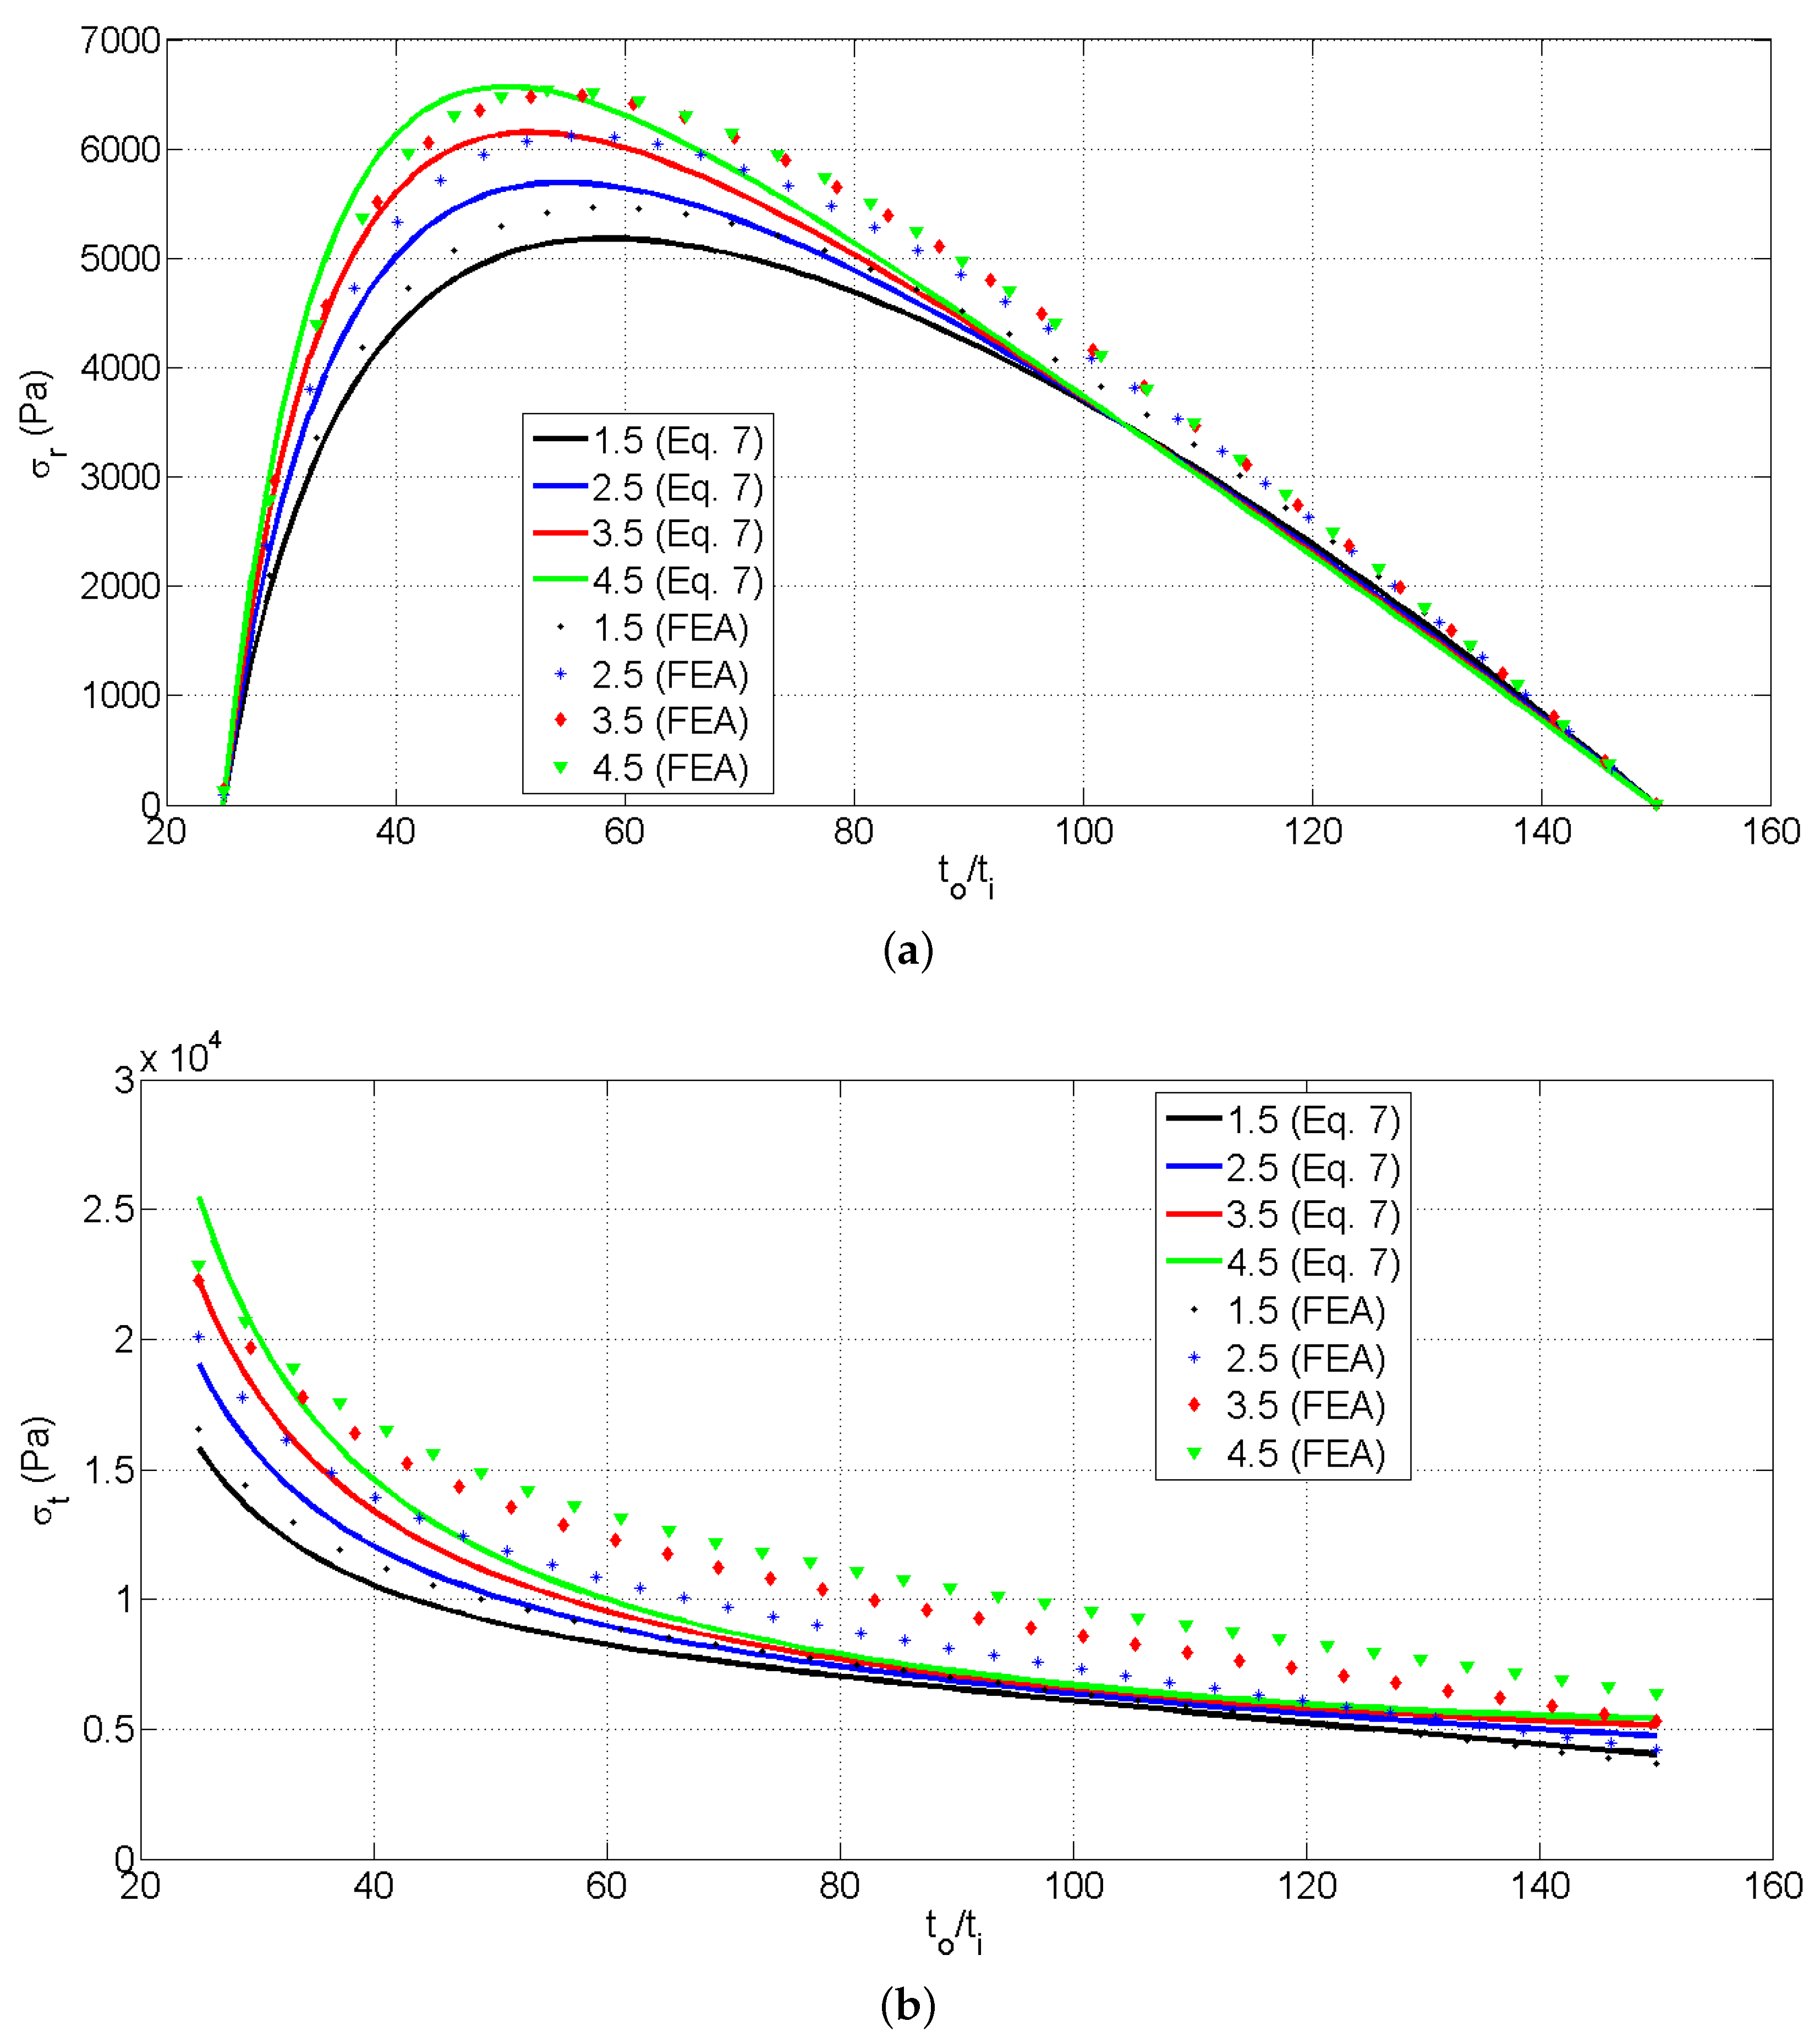
Figure 3 shows the correlation coefficient, R 2 , calculated with Equation (12) [17], between σ r and σ t , and obtained with FEA and Equation (7). Figure 3 shows strong agreement with the FEA results, yielding R 2 values exceeding 0.93 in all cases. However, a decreasing trend is observed as t o / t i increases, indicating a gradual loss in the precision of the analytical approximation for geometries with larger-thickness gradients; Figure 4 shows the mean absolute percentage error (MAPE), calculated with Equation (13) [18]. Figure 4 corroborates the findings from the R 2 analysis, reinforcing that the analytical model is more accurate in predicting stress fields in the mid-region of the flywheel, and less so near the outer boundary. The MAPE that increases with the thickness ratio highlights the growing influence of geometric non-linearity and stress gradients, which are not fully captured by the analytical simplifications; Figure 5 shows the root mean squared error (RMSE), obtained with Equation (14). These results reinforce that the analytical model provides more reliable predictions in the mid-thickness region, especially for σ r , and they highlight the growing discrepancies—particularly in σ t predictions—toward the outer regions as the thickness gradient becomes more pronounced; additionally, Figure 6 shows the normalized RMSE (NRMSE), calculated with Equation (15). By normalizing the RMSE, the analysis reveals that even when absolute errors are large, their impact relative to the magnitude of the stress field may remain moderate or acceptable—particularly in the mid-thickness region. The NRMSE metric thus reinforces the conclusion that the analytical model offers a high predictive value for preliminary design and analysis, provided that geometric limitations are taken into account; Figure 7 shows the ratios between the maximum stresses obtained with FEA in Lines 1 and 2 and those obtained with Equation (7). In Figure 7, it is noticeable that Equation (7) offers a better approximation for σ t , between 0.8973 and 1.0658, at Line 1 than for σ r , between 0.6965 and 1.0133, with respect to the values determined with FEA. For the stresses in Line 2, Equation (7) offers a better approximation for σ r , with values between 0.9958 and 1.0761, than for σ t , with values between 0.8589 and 1.0436, with respect to the values determined with FEA. Additionally, Figure 8 shows the ratios of the maximum stresses at Line 2 and the maximum stresses at Line 1. It is noted that the relation between the maximum σ r at Line 2 and at Line 1 increases from 1.0248 at t o , i = 1 to 1.4297 at t o , i = 4.5 , respectively. Unlike the relation for σ t , which decreases from 1.0083 at t o , i = 1 to 0.9958 at t o , i = 4.5 . Furthermore, Figure 9a,b show the results for σ r , at Line 2, and σ t , at Line 1, from the FEA compared with the ones obtained with Equation (7), respectively. Figure 9 highlights that, although the maximum stresses are fine approximations, the error is considerably high, especially in σ t for t o , i 2.5 . All results from Figure 2, Figure 3, Figure 4, Figure 5, Figure 6, Figure 7, Figure 8 and Figure 9 are presented as a function of t o , i .
R = A i A ¯ F i F ¯ A i A ¯ 2 F i F ¯ 2 ,
where A i and F i represent individual sample points of the stresses computed with FEA and Equation (7), respectively; A ¯ and F ¯ represent the sample mean of the stress values computed with FEA and Equation (7), respectively.
M A P E = 1 N A i F i A i ,
where N is the number of data points.
R M S E = 1 N A i F i 2
N R M S E = R M S E A m a x A m i n

3. Discussion

In this study, the solution of the equilibrium equation for a variable-thickness flywheel, Equation (3), is based on the assumption that the flywheel thickness varies smoothly, so that d t / d r 0 , and it is given by Equation (4). This assumption simplifies Equation (3) and yields Equation (5). With the assumption that d t / d r 0 , obtaining the solution to Equation (5) is an easy task. The solution to Equation (5) is basically the solution for a flywheel of constant thickness plus the term B Z r / 15 , which accounts for the thickness variation. In fact, when the thickness is constant, B = 0 and A = t i , leading to Equations (1) and (2).
The R 2 analysis revealed high levels of agreement between the analytical and numerical results, with values generally exceeding 0.93 across all cases. The best performance was observed for σ r at Line 2, where R 2 remained closest to unity, indicating a nearly perfect correlation. Conversely, σ t at Line 2 exhibited the lowest R 2 values, particularly at higher-thickness ratios, suggesting increased sensitivity of the analytical model to geometric variations in the tangential direction.
The MAPE results provided further insights by quantifying the relative error as a percentage. These values confirmed that the analytical model remained reasonably accurate for moderate-thickness ratios, but the error increased with t o / t i , particularly for σ t at the outer surface. Notably, the lowest MAPE values were again associated with Line 2, reinforcing the robustness of the approximation in the central region of the flywheel.
The RMSE results, which capture the absolute magnitude of the prediction error, highlighted a more significant discrepancy for σ t , especially at Line 1. These values grew markedly when increasing the thickness ratio, reflecting the compounding effects of geometric non-linearity and stress gradients that are less effectively captured by the analytical formulation. In contrast, σ r at Line 2 consistently exhibited the lowest RMSE values, indicating minimal deviation from the numerical benchmark.
Finally, the NRMSE analysis normalized the RMSE values relative to peak stress magnitudes, offering a scale-independent view of model performance. This metric further emphasized that while absolute errors may be substantial in some cases, particularly for σ t at the outer boundary, their impact relative to the stress magnitude remains moderate. The consistently low NRMSE values for both stress components at Line 2 underscore the suitability of the analytical model for estimating mid-thickness stress behavior with high reliability.
Taken together, these four metrics paint a coherent picture of the analytical model’s performance. The model is particularly effective in the mid-thickness region of the flywheel, where it yields high correlation, low relative and absolute errors, and strong consistency across metrics. However, its accuracy diminishes progressively toward the outer boundary and with increasing thickness gradients—most notably in predicting tangential stresses. This behavior can be attributed in part to the analytical formulation itself: as indicated by the governing equations, σ t is not independent but is rather a function of the derivative of σ r . Consequently, any deviation in the estimation of σ r is amplified in the σ t calculation, particularly in regions where stress gradients are steep. These findings suggest that while the analytical solution provides a valuable tool for preliminary design and stress estimation, caution should be exercised when applying it to geometries with substantial tapering or where a precise σ t prediction is critical.
Furthermore, although the variation of B in these analyses was considered and analyzed—since the results are a function of t o / t i , and B is a function of t o and t i —the influence of the ratio between A and B was not directly analyzed. However, it was implicitly considered through Equation (11).
Furthermore, Figure 3 shows that the MAPE between the results, although exhibiting very high values of P, begins to increase as the thickness relation increases. Additionally, in Figure 7, it is noted that Equation (7) is excellent for approximating both maximum values of σ r and σ t within 1 t o , i 4.5 . Although the maximum σ r varies significantly from Line 2 to Line 1, i.e., along the thickness of the flywheel, Equation (7) is excellent at approximating the maximum σ r on Line 2, the line at which the designer is more interested in determining σ r , since that is where the maximum σ r is. Alternatively, Equation (7) is better at approximating the maximum σ t at Line 1 than at Line 2. Unlike σ r , the variation in σ t along the thickness of the flywheel is too small and could be neglected. Nonetheless, it is important to keep in mind that it does varies and is higher at Line 1 than at Line 2. However, it can be concluded that Equation (7) is very good at approximating the maximum σ r and σ t within 1 t o , i 4.5 .
Although this solution was developed for t, given by Equation (4), the solution method could be applied to higher-order polynomials of t, as a consequence of Lagrange’s mean value theorem. That is, the solution for maximum stresses would be valid within a 10% variation from FEM as long as d t / d r 4.5 .
Equation (7) was observed to approximate σ r better than σ t . That is attributed to the fact that σ t is obtained with the derivative of F, unlike σ r , which is obtained directly from F. Since F is an approximation, its derivative will lose accuracy and so will σ t .
Furthermore, although the maximum σ r and σ t are well approximated, σ t exhibits a quantitatively considerable MAPE, higher than 10% for t o , i 2.1 , and higher than 15% for t o , i 3.25 . This is a very important information to bear in mind when using Equation (7) to design a variable-thickness flywheel. Maximum stresses will be within a fine approximation for high values of t o , i . However, the higher the thickness relation, the higher the design factor. Moreover, maximum stresses should be proportional to the MAPE and should be included in the calculation of σ t to avoid under-sizing the flywheel. Finally, it is important to highlight the fact that a high value of t o , i is unusual and that the flywheel could be divided into a convenient number of elements and treat every element independently, as recommended by Timoshenko and Goodier [16].

4. Conclusions

This work presented an analytical approximation for evaluating radial and tangential stresses in flywheels with linearly variable thicknesses—specifically those exhibiting a conical profile. By simplifying the equilibrium equation under the assumption of a small-thickness gradient ( d t / d r 0 ), a closed-form expression was derived that explicitly relates the stress distribution to the flywheel’s geometry and material properties. This formulation offers a practical and time-efficient alternative to FEA, which is typically required for such variable-thickness configurations.
The accuracy of the analytical approximation for stress prediction in a conical flywheel was assessed through a comprehensive comparison with FEA results using four complementary metrics: the R 2 , MAPE, RMSE, and NRMSE. These metrics were evaluated for both σ r and σ t at two key locations within the structure—the outer surface (Line 1) and the mid-thickness region (Line 2)—as a function of t o / t i .
Validation against FEA simulations confirmed the precision of the proposed method, with particularly strong agreement observed for outer-to-inner thickness ratios ranging from 1.0 to 4.5. The approximation showed higher precision in estimating radial stresses than tangential ones, likely due to the increased sensitivity of σ t to the derivative of F. Despite this, the results demonstrated that the derived equation can reliably estimate maximum stress values along critical regions of the flywheel, such as the inner and outer surfaces.
The proposed method facilitates rapid stress analysis and can be especially useful in the early stages of flywheel design, where quick iterations and parameter studies are necessary. Additionally, by providing an explicit mathematical relationship between stresses and geometry, this approach enables designers to better understand the influence of thickness variations and pursue more targeted optimization strategies. The methodology may also be extended to more complex geometries or higher-order thickness functions, provided the gradient remains within the validity range identified in this study (i.e., d t / d r 4.5 ). In doing so, it presents new opportunities for the analytically guided design of high-speed rotating systems, complementing and potentially reducing reliance on resource-intensive computational simulations.

Author Contributions

M.G.: conceptualization, methodology, investigation, data curation, writing—original draft preparation, writing—review and editing, visualization, supervision, and project administration. O.O.-L.: writing—original draft preparation, visualization, project administration, and supervision. J.U.-C.: writing—review and editing. A.B.-O.: visualization and supervision. All authors have read and agreed to the published version of the manuscript.

Funding

This research was funded by the National Council for Humanities, Sciences and Technologies (CONAHCYT, Consejo Nacional de Humanidades, Ciencias y Tecnologías) for the postdoctoral grant key BP-PA-20230511211217474-4861409.

Data Availability Statement

The data generated during the current study can be made available from the corresponding author upon reasonable request.

Conflicts of Interest

The authors declare no affiliations with or participation in any organization or entity with any financial interest (such as honoraria; educational grants; participation in speakers’ bureaus; membership, employment, consultancies, stock ownership or other equity interest; and expert testimony or patent-licensing arrangements) or non-financial interest (such as personal or professional relationships, affiliations, knowledge or beliefs) in the subject matter or materials discussed in this work.

Abbreviations

The following abbreviations are used in this manuscript:
FESSFlywheel energy storage system
FEMFinite element method
FEAFinite element analysis
MAPEMean absolute percentage error
RMSERoot mean squared error
NRMSENormalized RMSE

References

  1. Zenkour, A.; Mashat, D. Stress Function of a Rotating Variable-Thickness Annular Disk Using Exact and Numerical Methods. Engineering 2011, 3, 422–430. [Google Scholar] [CrossRef]
  2. Xu, K.; Guo, Y.; Lei, G.; Zhu, J. A Review of Flywheel Energy Storage System Technologies. Energies 2023, 16, 6462. [Google Scholar] [CrossRef]
  3. Semsri, A. Experimental Design of Flywheel Rotor with a Flywheel Energy Storage System for Residential uses. Int. Energy J. 2023, 23, 105. [Google Scholar]
  4. Acarnley, P.P.; Mecrow, B.C.; Burdess, J.S.; Fawcett, J.N.; Kelly, J.G.; Dickinson, P.G. Design Principles for a Flywheel Energy Storage for Road Vehicles. IEEE Trans. Ind. Appl. 1996, 32, 1402–1408. [Google Scholar] [CrossRef]
  5. Kailasan, A.; Dimond, T.; Allaire, P.; Sheffler, D. Design and Analysis of a Unique Energy Storage Flywheel System—An Integrated Flywheel, Motor/Generator, and Magnetic Bearing Configuration. J. Eng. Gas Turbines Power 2015, 137, 042505. [Google Scholar] [CrossRef]
  6. Motaman, S.; Eltaweel, M.; Herfatmanesh, M.R.; Knichel, T.; Deakin, A. Numerical analysis of a flywheel energy storage system for low carbon powertrain applications. J. Energy Storage 2023, 61, 106808. [Google Scholar] [CrossRef]
  7. Kale, V.; Aage, N.; Secanell, M. Stress Constrained Topology Optimization of Energy Storage Flywheels Using a Specific Energy Formulation. J. Energy Storage 2023, 61, 106733. [Google Scholar] [CrossRef]
  8. Jiang, L.; Zhang, W.; Ma, G.J.; Wu, C.W. Shape Optimization of Energy Storage Flywheel Rotor. Struct. Multidiscip. Optim. 2016, 55, 739–750. [Google Scholar] [CrossRef]
  9. Jiang, L.; Wu, C.W. Topology Optimization of Energy Storage Flywheel. Struct. Multidiscip. Optim. 2016, 55, 1917–1925. [Google Scholar] [CrossRef]
  10. Sondhi, L.; Kumar Thawait, A.; Sanyal, S.; Bhowmick, S. Stress and deformation analysis of functionally graded varying thickness profile orthotropic rotating disk. Mater. Today Proc. 2020, 33, 5455–5460. [Google Scholar] [CrossRef]
  11. Hassan, S.U.; He, B.; Khayyam, U. Design and Analysis of Flywheel for Small Scale Energy Storage System Using Different Structures and their Comparison. In Proceedings of the 2019 4th International Conference on Power and Renewable Energy (ICPRE), Chengdu, China, 21–23 September 2019; pp. 295–299. [Google Scholar] [CrossRef]
  12. Bankston, S.; Mo, C. Geometry Modification of Flywheels and its Effect on Energy Storage. Energy Res. J. 2015, 6, 54–63. [Google Scholar] [CrossRef]
  13. Kale, V.; Thomas, M.; Secanell, M. On determining the optimal shape, speed, and size of metal flywheel rotors with maximum kinetic energy. Struct. Multidiscip. Optim. 2021, 64, 1481–1499. [Google Scholar] [CrossRef]
  14. Wen, S. Analysis of Maximum Radial Stress Location of Composite Energy Storage Flywheel Rotor. Arch. Appl. Mech. 2014, 84, 1007–1013. [Google Scholar] [CrossRef]
  15. Ugural, A.C.; Fenster, S.K. Advanced Mechanics of Materials and Applied Elasticity; Pearson: London, UK, 2020. [Google Scholar]
  16. Timoshenko, S.; Goodier, J. Theory of Elasticity; McGraw-Hill: New York City, NY, USA, 1951. [Google Scholar]
  17. Berman, J.J. Data Simplification. Taming Information with Open Source Tools; Morgan Kaufmann: Burlington, MA, USA, 1951. [Google Scholar]
  18. Kim, S.; Kim, H. A new metric of absolute percentage error for intermittent demand forecasts. Int. J. Forecast. 2016, 32, 669–679. [Google Scholar] [CrossRef]
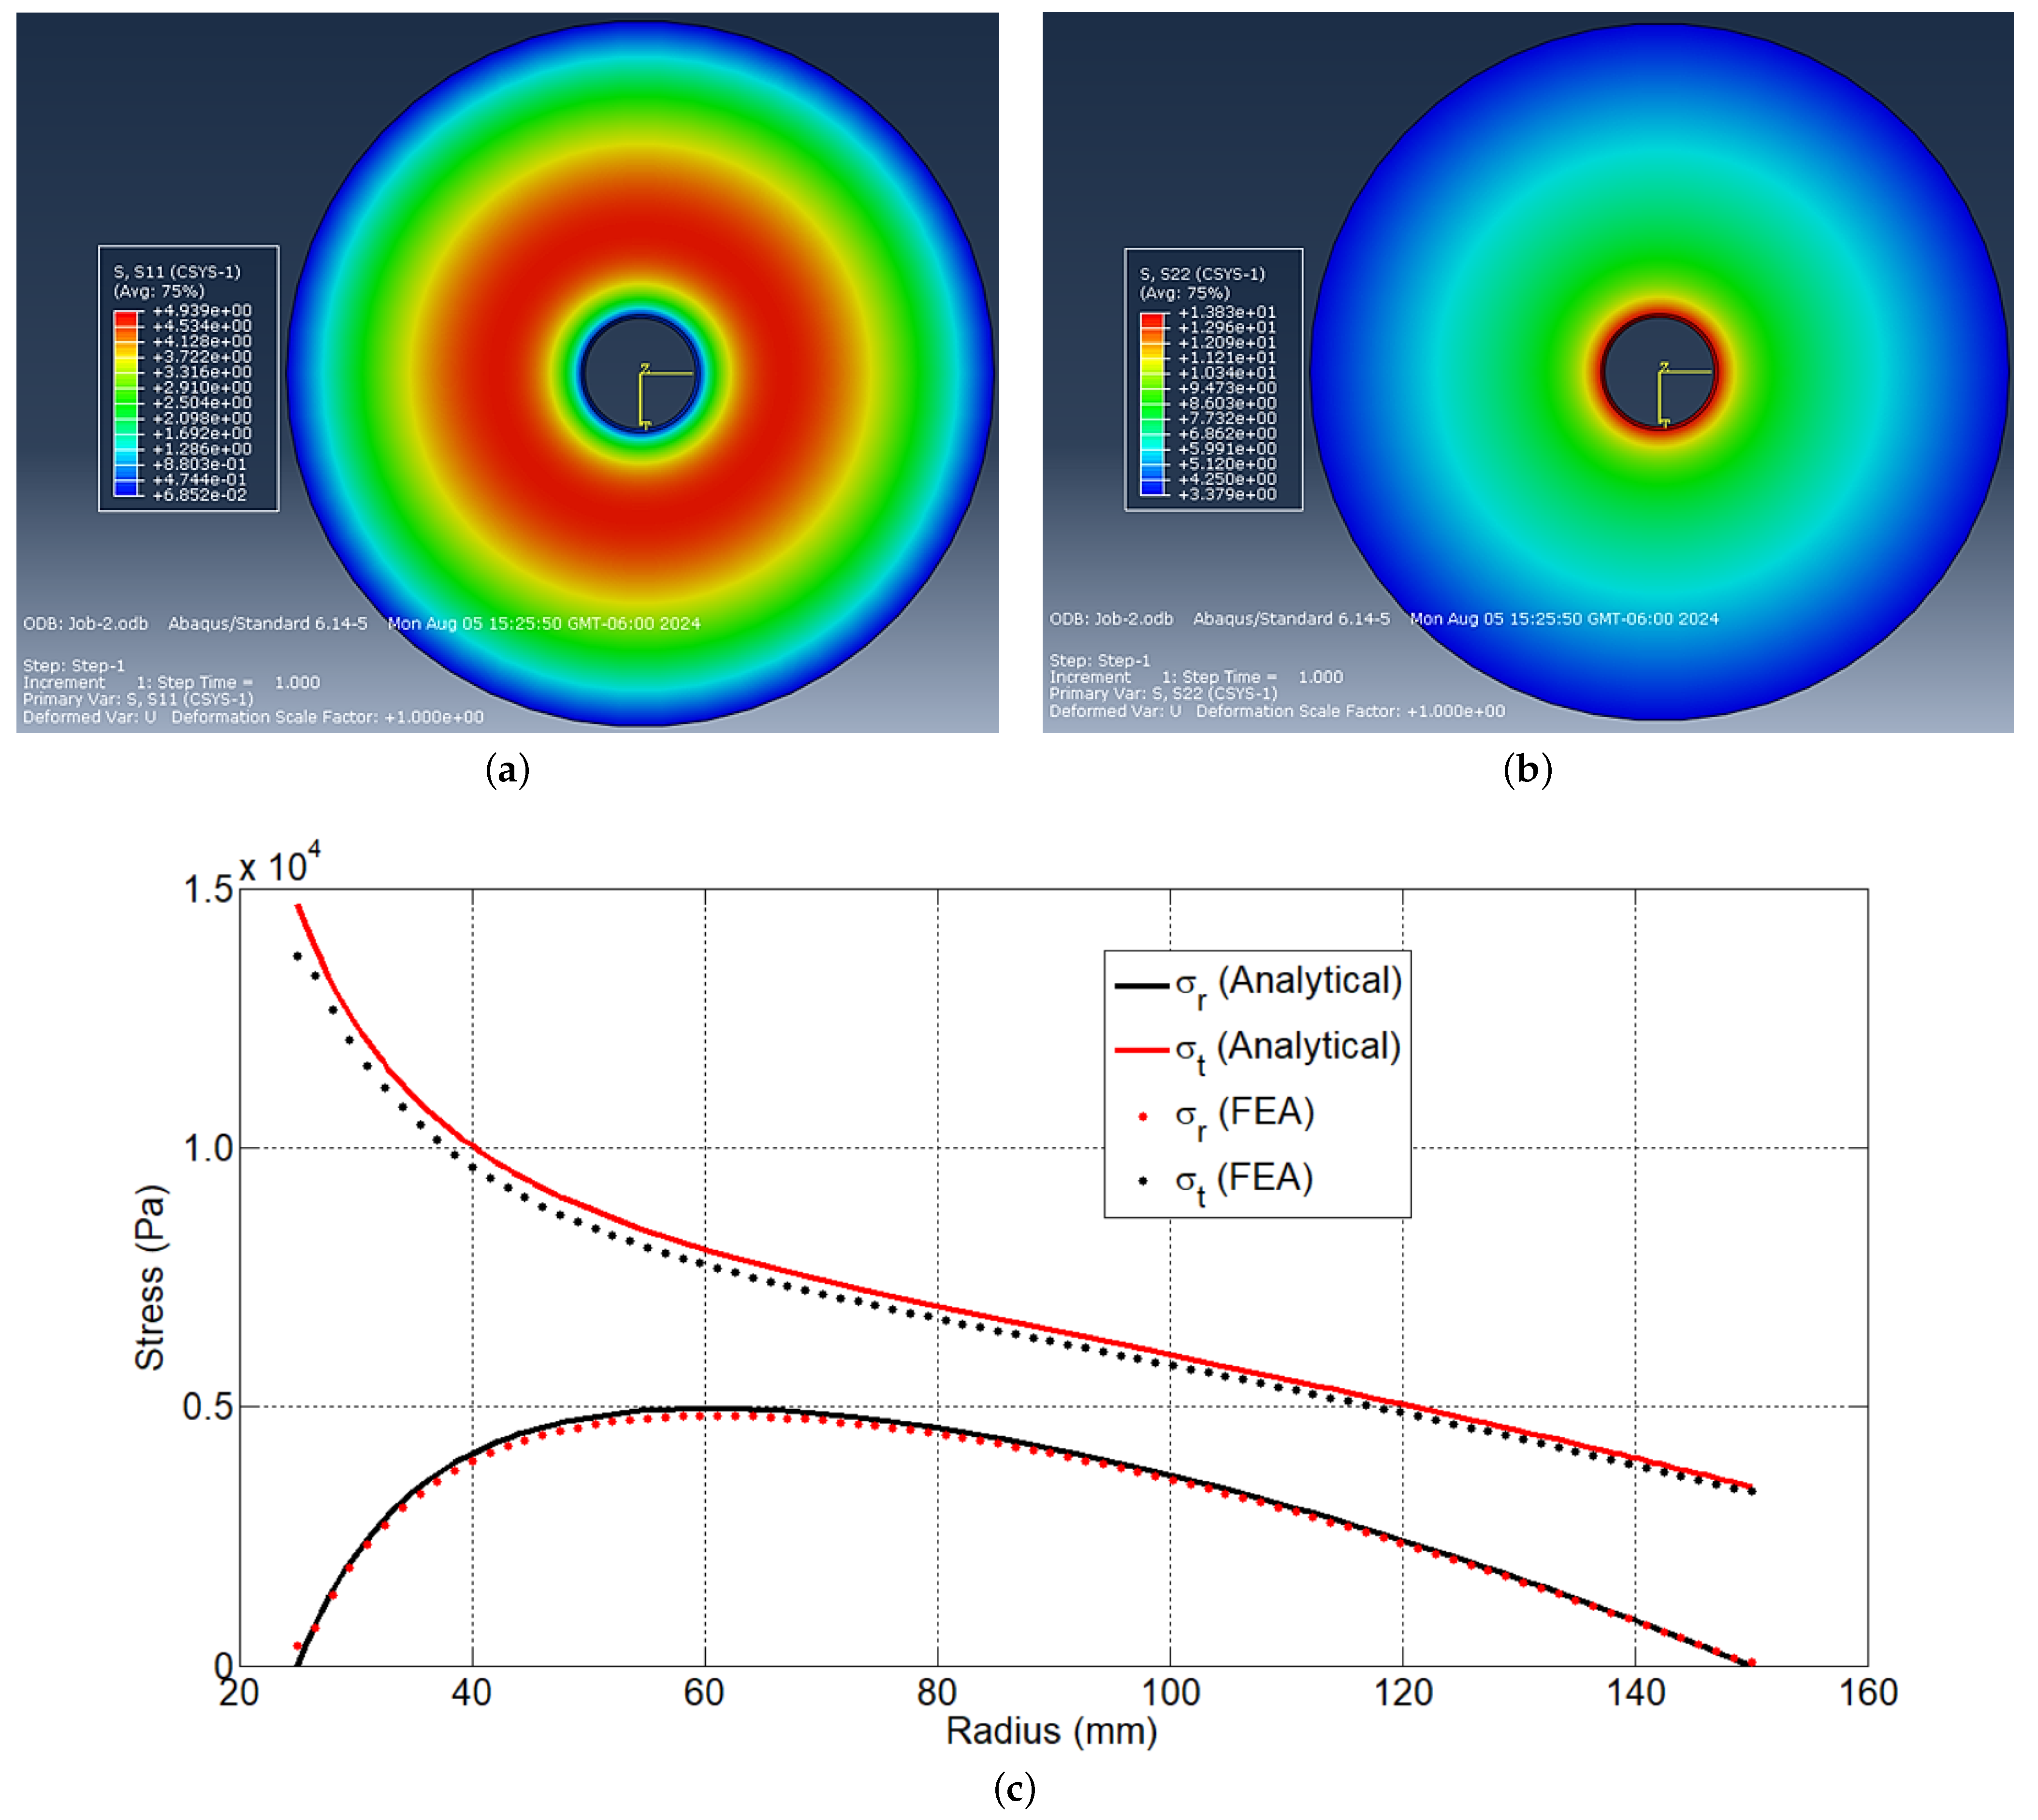
Figure 1. Results of a stress analysis in ABAQUS. The figure shows radial stress, in kPa, (a); tangential stress, in kPa, (b); and the comparison between the results from the FEA and Equation (1) and (2) (c).
Applmech 06 00030 g001
Figure 2. Cross-section of a conical flywheel showing Lines 1 and 2, where σ r and σ t were computed.
Applmech 06 00030 g002
Figure 3. Coefficient of determination between FEA and Equation (7).
Applmech 06 00030 g003
Figure 4. Mean absolute percentage error between FEA and Equation (7).
Applmech 06 00030 g004
Figure 5. Root mean squared error between FEA and Equation (7).
Applmech 06 00030 g005
Figure 6. Normalized RMSE between FEA and Equation (7).
Applmech 06 00030 g006
Figure 7. Ratio between maximum σ r . and σ t obtained with FEA and Equation (7).
Applmech 06 00030 g007
Figure 8. Relation of maximum stress at Line 2 and Line 1.
Applmech 06 00030 g008
Figure 9. (a) σ r computed with FEA and Equation (7). (b) σ t computed with FEA and Equation (7).
Applmech 06 00030 g009
Table 1. Parameters used for computing stresses (Figure 1).
ParameterNumerical Value
r i 25 mm
r o 150 mm
ν 0.3
ρ 7850 kg/m3
ω 9.84 rad/s
Table 2. Parameters used for computing stresses (Figure 2).
ParameterNumerical Value
r i 25 mm
r o 150 mm
ν 0.3
t i 50 mm
t o 55 mm
ρ 7850 kg/m3
ω 9.84 rad/s
Disclaimer/Publisher’s Note: The statements, opinions and data contained in all publications are solely those of the individual author(s) and contributor(s) and not of MDPI and/or the editor(s). MDPI and/or the editor(s) disclaim responsibility for any injury to people or property resulting from any ideas, methods, instructions or products referred to in the content.