Article

Electrolyte Additives in Lithium Ion EV Batteries and the Relationship of the SEI Composition to Cell Resistance and Lifetime

Warwick Manufacturing Group, University of Warwick, Coventry CV4 7AL, UK
*
Author to whom correspondence should be addressed.
Electrochem 2020, 1(2), 200-216; https://doi.org/10.3390/electrochem1020014
Submission received: 23 April 2020 / Revised: 13 May 2020 / Accepted: 21 May 2020 / Published: 5 June 2020

Abstract

:
Sulphur, boron and phosphorous containing electrolyte additives were evaluated in cells containing pristine electrodes from a commercial EV lithium ion cell against a standard baseline electrolyte. Following formation and a full cell ageing step, cycling performance and impedance spectroscopy were used to elucidate the most effective additives. The additive tris trimethyl silyl phosphite (TTSPi) showed the most promise; with improved cell capacities and reduced impedances observed after formation. X-ray photoelectron spectroscopy (XPS) measurements on anode elemental surface profiles were correlated with the electrochemical performance. It was observed that increased lithium fluoride content on the surface of the anodes typically produced cells with lower impedance. Sulphur containing additives also showed improved cell behaviours; and the decomposition and chemical reactions of these compounds at the anode surface is discussed in detail. The main influence of TTSPi was to reduce the amount of oxygen (C=O) and sulphur in the electrolyte interphase (SEI) layer; to be replaced with hydrocarbons.

1. Introduction

Improved battery performance is still required for the large scale uptake of electric vehicles (EV), and in the emerging energy storage market. Lithium ion batteries have the most to offer in terms of power, energy and lifetime, and costs have reduced dramatically over the last five years [1]. One of the key components of lithium ion batteries is the electrolyte, which is traditionally comprised of a lithium salt dissolved in a mixture of organic solvents [2,3,4]. The composition of the electrolyte is an optimisation amongst several competing parameters; viscosity, conductivity and cost. Increasing the lithium salt concentration increases the conductivity to a maximum value, until the increasing viscosity causes a decrease. The cost of the electrolyte also increases with the salt concentration. Typically, concentrations of 1.0–1.2 mol dm−3 are used for LiPF6, the most common lithium ion electrolyte salt. The solvent is composed of two (or more) organic carbonates, often one cyclic and one linear. This gives an electrolyte with relatively high conductivity, and a wide operating temperature range. During the initial (formation) charge, the solvent and salt components of the electrolyte are reduced on the anode to produce a layer called the solid electrolyte interphase (SEI). Ethylene carbonate (EC) is a cyclic carbonate that decomposes to form a stable SEI layer on graphite, whereas propylene carbonate (PC) does not. The linear carbonate is normally selected from dimethyl carbonate (DMC), diethyl carbonate (DEC), and ethyl methyl carbonate (EMC) [2,5,6]. The SEI layer is an essential part of lithium ion cells, for both operation and safety. By optimising the SEI during formation, the cell capacity and cycle life can be improved. Additionally, the SEI protects the lithiated graphite from reacting with the electrolytes, and by stabilising the SEI, reduces the risk of thermal runaway [7,8,9].
In the first instance, the composition of the SEI layer depends on the electrolyte. The SEI is usually considered a mosaic of different phases [10], some inorganic (LiF, Li2CO3), some organo-metallic (ROLi), and some fully organic, e.g., polymers, giving flexibility. The initial SEI forms very quickly during the first charge, or first lithiation of the graphite. The formation reactions are complicated, because they involve both the lithium salt and the electrolyte solvents [11]. The interface layer changes through the conditioning or cell ageing step, with dissolution and re-precipitation reactions occurring on the surface of the anode [12]. The most stable SEI layers are thin and dense, rather than porous. The formation temperature, cell ageing temperature, and cell ageing state of charge all influence the ultimate SEI formation [13,14]. A summary of formation and cell ageing process steps is shown in Figure 1. The formation charge usually occurs at a relatively low rate (C/5 or less). The cell ageing step can take several weeks, and often uses warmer temperatures to accelerate the chemical reactions. The interaction of multiple factors like the electrolyte composition, formation protocol, ageing temperature and ageing duration ultimately lead to a stable SEI layer.
On graphite anodes, the SEI layer is formed by voltage dependent electrochemical reductions. Thus, if two compounds react at different potentials, the one that reduces at higher relative voltage will dominate the SEI layer. This has led to research into electrolyte additives that change the composition and morphology of the SEI layer, during a preferential decomposition on the graphite surface. The most widely used to date in lithium ion batteries is vinylene carbonate (VC) [15] which is beneficial for both the anode and cathode electrolyte interfaces [16]. Electrolytes additives can also be used to improve other aspects of the lithium ion batteries properties, for example as a wetting agent for the electrolyte, or as a water scavenger [6,17,18,19,20]. This study focuses on additives that can modify the SEI layer to improve the long term performance. We investigate the effect of additional electrolyte additives upon the cycle life and capacity of a commercial EV lithium ion cell, after the formation and cell ageing process. The cells were made and shipped to us dry and sealed from our automotive cell manufacturing project partners. The study was performed on the first generation 24 kW h pack cell chemistry, which utilised a mixed cathode material; LiMn2O4 spinel and a nickel based layered oxide such as LiNi0.8Co0.15Al0.05O2 (NCA) [21], with a graphite containing anode. The main cell ageing protocol utilised in this work has a two-week duration which is similar to the protocol used in the industrial cell making process [22,23]. XPS (X-ray photoelectron spectroscopy) measurements were performed on anodes from cycled cells, to study the surface layers or SEI after formation and ageing. XPS is an ideal technique for studying the surface layers of samples, with a typical penetration depth of around 5 nm [24]. As well as elemental composition, the spectra can be analysed to show the different chemical environments for each element. The ultimate aim is to correlate differences in SEI composition with cell performance, with a view to a more systematic selection of additives in future studies.
An internal review of current electrolyte additives was performed, and a list of over thirty possible additives was reduced to the twelve additives shown in Table 1. In this table, and in the rest of this document, the additives are classified into three types; sulphur containing, boron containing, and other. The table also contains the concentration at which the additives were used in the reference document. These additives were added to the baseline electrolyte, which is known to contain at least one proprietary additive [25,26]. Additives such as DTD, PES and TTSPi have been shown to perform well in multi-additive electrolytes. PTS, TEB, TFMB and TMSBi have been shown to be beneficial for higher voltage LNMO cathodes (LiNi0.5Mn1.5O4), and TMB has shown promise with high energy nickel cobalt manganese (HE-NCM) materials (Li1.2Mn0.54Ni0.13Co0.13O2). FEC, VC and OHD were chosen due to their similarity to EC, and their proven effect upon SEI stabilisation.

2. Materials and Methods

Electrolyte additives were procured from Fluorochem or Sigma Aldrich. They were the highest purity and lowest water content available, but they were not specific “battery” grades. The materials were used as received; no attempts were made to purify or dry them further. Electrolyte samples were prepared in the argon filled glove box, shortly before they were required. Small quantities of additive (0.05–2 g) were added to 10–20 g of the proprietary base electrolyte, LiPF6 in ethylene carbonate, propylene carbonate and diethyl carbonate. Anode, cathode and separator sheets were extracted from a dry, assembled pouch cell. The double sided anode and cathode coatings were converted to single sided by the dissolution of the binder in a minimum quantity of NMP (N-methyl pyrrolidone), with gentle scraping. The coatings were then vacuum dried at 80 °C, before being cut into disks. These were used, with the separator, to make 2032 coin cells. The cells were constructed in a dry room, with a dew point of less than −40 °C.
Different cell ageing protocols were applied for the cells involved in the electrochemical and XPS measurements, as experimental methods were refined. Both were put onto a formation cycle at C/10, and held at 4.2 V until the current dropped to C/100, followed by an impedance measurement. The electrochemical cells were aged at 45 °C for twelve days, followed by two days at 25 °C. After a further impedance measurement, the cells were charged (C/10), discharged (C/10), and cycled fifty times at ±C/2 (3.0–4.2 V), all at 25 °C. The XPS cells were aged at 40 °C for one week, followed by a C/10 discharge and then a ± C/2 cycle, using an earlier version of the test protocol. All the cycling tests used a Maccor 4000 series unit. The impedance measurements used a Bio Logic VMP3, with a frequency range of 200 kHz to 100 mHz, and a cell temperature of 25 °C. The spectra were fitted to an equivalent circuit containing a series resistance, a resistor//CPE parallel combination and another constant phase element for the low frequency tail. Most of the spectra contained only one semi-circle, which was attributed to the “electrochemical” resistance. This encompassed the charge transfer and film resistances at both the anode and the cathode.
For the XPS measurements, cells were disassembled in an argon filled glove box, using the cell assembly tool in de-crimping mode. The anode and cathode were both recovered, though only the anodes were tested in these experiments. A transfer vessel was used to move the samples from the glove box to the spectrometer, avoiding contact with water and oxygen. Anode pieces from four cells were mounted on a copper disk, using adhesive carbon tape. It has been reported that washing electrode samples in DMC (dimethyl carbonate) to remove residual electrolyte can also dissolve compounds of interest from the SEI layer [40]. Therefore, the electrode samples were allowed to dry in the argon filled glove box. Argon sputtering in the XPS was used to remove electrolyte residues from the electrodes, and all the results presented here are for sputtered samples.
The Kratos AXIS Ultra DLC spectrometer was used in a standard operating manner. The samples were moved from the entry chamber to the measurement chamber, and pumped down to very low vacuum. A broad sweep spectrum was used to identify the elements of interest, present in the samples. High resolution sweeps were then recorded over the relevant binding energy ranges. The samples were then subjected to ten minutes of argon bombardment, before repeat measurements were made. The data was exported for analysis using the Casa XPS software package. For each element, the boundary energy range was used to define the background intensity. Then, one or more peaks were introduced, until the error between the experimental and fitted intensities was sufficiently low. Each peak had a standard Gaussian shape. The data was calibrated using the carbon 1s graphite peak at 284.4 eV. When analysing the 2p elements P and S, the 3/2 and 1/2 spin states produced two peaks. According to theory, these have a defined energy gap for each element; 0.84 and 1.2 eV respectively. The 3/2 peak has twice the area of the 1/2 peak. These rules were imposed during the fitting process. Another peak parameter is FWHM (full width at half maximum); the fitting also imposed the requirement for this to be the same for both peaks in a doublet.

3. Results

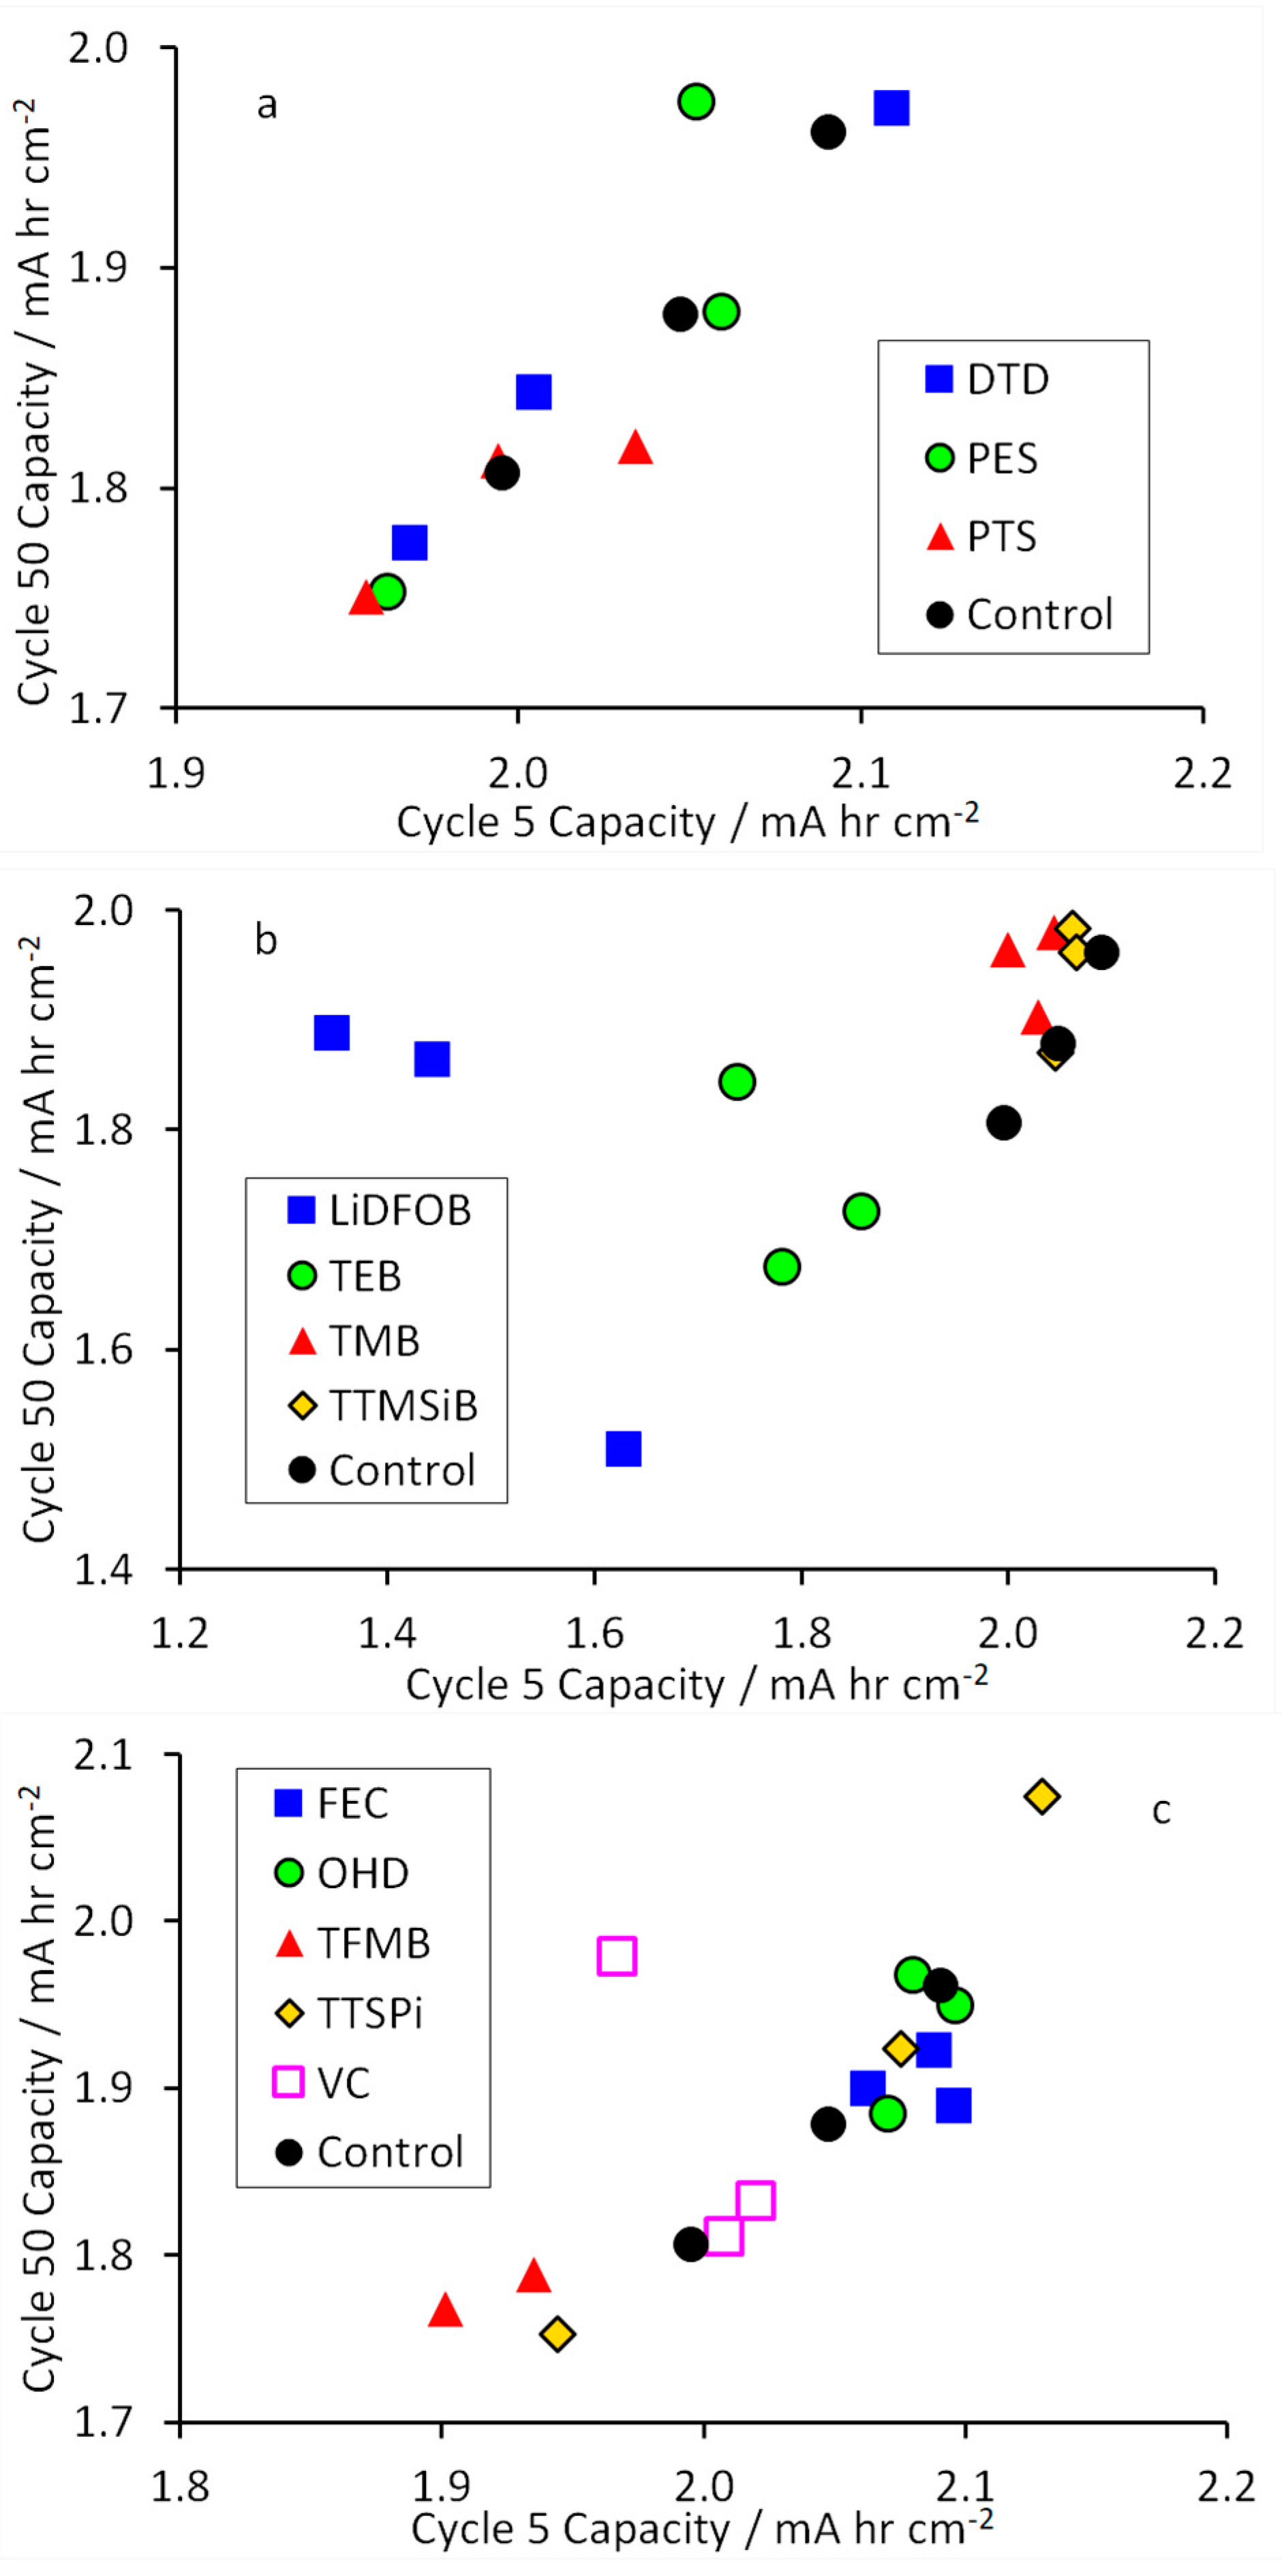
3.1. Electrochemical Testing Results

The decomposition voltages of the electrolyte additives were investigated in half cells, with lithium metal counter electrodes. Figure 2 shows dQ/dV plots, obtained during the first part of the formation cycle at ±C/10. Most of the additives produced variations from the control electrolyte. There were prominent peaks with LiDFOB (1.6 V vs. Li/Li+), TFMB (1.4 V vs. Li/Li+), PES (1.2 V vs. Li/Li+), and several others at 1.1 V vs. Li/Li+. All these voltages were in the SEI formation range, and at a higher voltage than the control electrolyte (0.7 V vs. Li/Li+). This implies that compositional changes in the SEI layer on the graphite surface are likely, for the different additives. Reaction mechanisms for some of these additives have been proposed in previous work, though usually for oxidation reactions at the cathode. A two electron reduction mechanism was proposed for PES [29], leading to Li2PES (Li+.LiO.SO.O.CH.CH.CH2). The calculated standard potential for the reaction was 0.9 V vs. Li/Li+, with an experimental reduction voltage of 1.1 V vs. Li/Li+, estimated from full cell tests.
Full cells containing the various electrolytes were subjected to a sequence of tests; formation, impedance, cell ageing, impedance, and then fifty characterisation cycles at ±C/2. Figure 3 shows some typical cycling results, with four different electrolytes (best of three equivalent cells). These were the three electrolyte additives that were selected as giving the greatest overall improvement over the baseline electrolyte.
To compare the data from all the cells, the discharge capacity on cycle fifty was plotted against the discharge capacity on cycle five. Figure 4 shows the results for cells containing each additive. For convenience, the additives were classified as sulphur containing, boron containing, and other. The best additives were those that gave the highest capacities at both five and fifty cycles. In some cases, there was an increase in capacity over the first few cycles, as shown in Figure 3. In extreme cases, the capacity after fifty cycles was higher than the capacity at five cycles. This clearly indicated a sub-optimal SEI layer. Coin cells are very useful in lithium ion cell development, but they contain a relatively small area of electrode. This, in combination with being handmade, introduced some variability into the cell capacities, which is reflected in the spread of values shown in Figure 4. For the three additives containing sulphur, there was no clear benefit. Thus, the only conclusion is that any differences arising from DTD and PES as additives were less than the intrinsic variability in cell performance.
Four of the additives were borates. From Figure 4b, it was clear that the LiDFOB and TEB additives were detrimental to this cell chemistry. However, the TMB and TTMSiB additives both offered marginal improvements over the control electrolyte. The five other additives had various structures and functional groups, though FEC, OHD and VC are all variants on ethylene carbonate. The results summarised in Figure 4c showed more scatter than would be liked for the three, nominally equivalent cells. However, TFMB was clearly detrimental to cycling performance, and the electrolyte rapidly changed colour after preparation, suggesting electrolyte degradation. FEC and OHD showed marginal improvements over the control electrolyte. The TTSPi cells had variable capacities, but the best cell was very good.
Impedance measurements were made at the end of formation, and at the end of cell ageing. Figure 5 shows some representative results, for three coin cells containing the additive PTS. The results showed a marginal increase in the series resistance after ageing, and a larger increase in the electrochemical resistance. Impedance data was fitted to a simple equivalent circuit, as described in the Experimental section. The two main parameters analysed were the series resistance and the “electrochemical” resistance. Both are the sum of several resistance components. Experiments in three electrode cells, with a lithium metal reference electrode, showed that the high frequency semi-circle on the anode was small compared to the medium frequency semi-circle. The time constants of the main anode and cathode semi-circles were similar, leading to only one semi-circle in the full cell spectra. Figure S3 in the Supplementary Material shows the equivalent circuit used to fit the experimental data, and two examples of the fitting process.
The fitted resistance values obtained after formation and after cell ageing were plotted against each other. The results are shown in Figures S1 and S2, in the supplemental results. Typically, the series resistances were pretty much independent of additive type. OHD, VC and most of the borates were slightly higher than the control electrolyte, and TTSPi was marginally lower. The impact on the electrochemical resistances was more apparent. For PES, the values after formation were much higher than the control electrolyte, but converted to more normal values after ageing. LiDFOB produced the highest values after ageing, but the other borates were all lower than the control. The OHD and TFMB values were higher after formation, and the VC values were highest after ageing. As with the series resistances, the TTSPi cells clearly showed superior performances.
Three additives were selected as the most promising; TMB, TTMSiB and TTSPi. They were used for further studies at different additive concentrations, and the results are summarised in Figure 6. For the TMB additive electrolytes, none of the new additive concentrations improved on the original 1 wt %. For TTMSiB, the lowest concentration of 0.2 wt % was clearly insufficient. The results with the higher concentrations of 1 wt % and 2 wt % suggested good capacity retention. However, these cells exhibited an increase in discharge capacity during the initial stages of cycling, due to poor formation. With TTSPi, the initial capacities and capacity retentions were consistently high, over the range of additive concentrations tested.
As with the initial screening studies, impedance measurements were made after formation and after ageing. The key results are summarised in Figures S4 and S5, for the series and electrochemical resistances respectively. With TMB and TTMSiB, the series resistance values were higher than the control electrolyte, but the electrochemical resistance values were lower than the control. Another observation was that electrolytes containing TMB as an additive changed colour much more rapidly than other electrolytes with additives. With TTSPi, the electrochemical resistances were generally lower than the values obtained with the control electrolyte.
TTSPi was clearly the best additive of the twelve initial candidates. It gave consistently higher capacities over the concentration range 0.5–3.0 wt %, with the benefit evident at 0.5 wt %. A recent study showed changes to the cathode morphology after cycling in an electrolyte containing TTSPi, compared to the baseline electrolyte, when cycled up to 4.8 V [39]. Spinel cathode materials are notoriously susceptible to fluoride attack. TTSPi is also reported to scavenge HF from the electrolyte [41], which would therefore be beneficial in a cathode containing spinel like LiMn2O4. Other publications also focus on the role of TTSPi at the cathode. It is beneficial to the cycling of NMC-532 cathodes, where it suppresses transition metal dissolution [42]. The proposed mechanism involves both scavenging for HF, and forming phosphorus and oxygen rich compounds on the cathode surface. Unfortunately, the TTSPi is consumed in these reactions, and the benefit eventually disappears [43].
However, it is also likely that TTSPi changes the composition and/or structure of the SEI layer on the graphite anode. A recent publication [44] suggests that TTSPi reacts with other components of the anode SEI layer, rather than being reduced directly. Gibbs free energies of reaction were calculated for TTSPi and EC reacting with an indicative ion, in this case CH3.O. The reaction shown had the most negative free energy:
P.(OSi(CH3)3)3 + Li+ ↔ Li+.P(OSi(CH3)3)3
Li+.P(OSi(CH3)3)3 + CH3.O → LiO.P(OSi(CH3)3)2 + CH3OSi(CH3)3

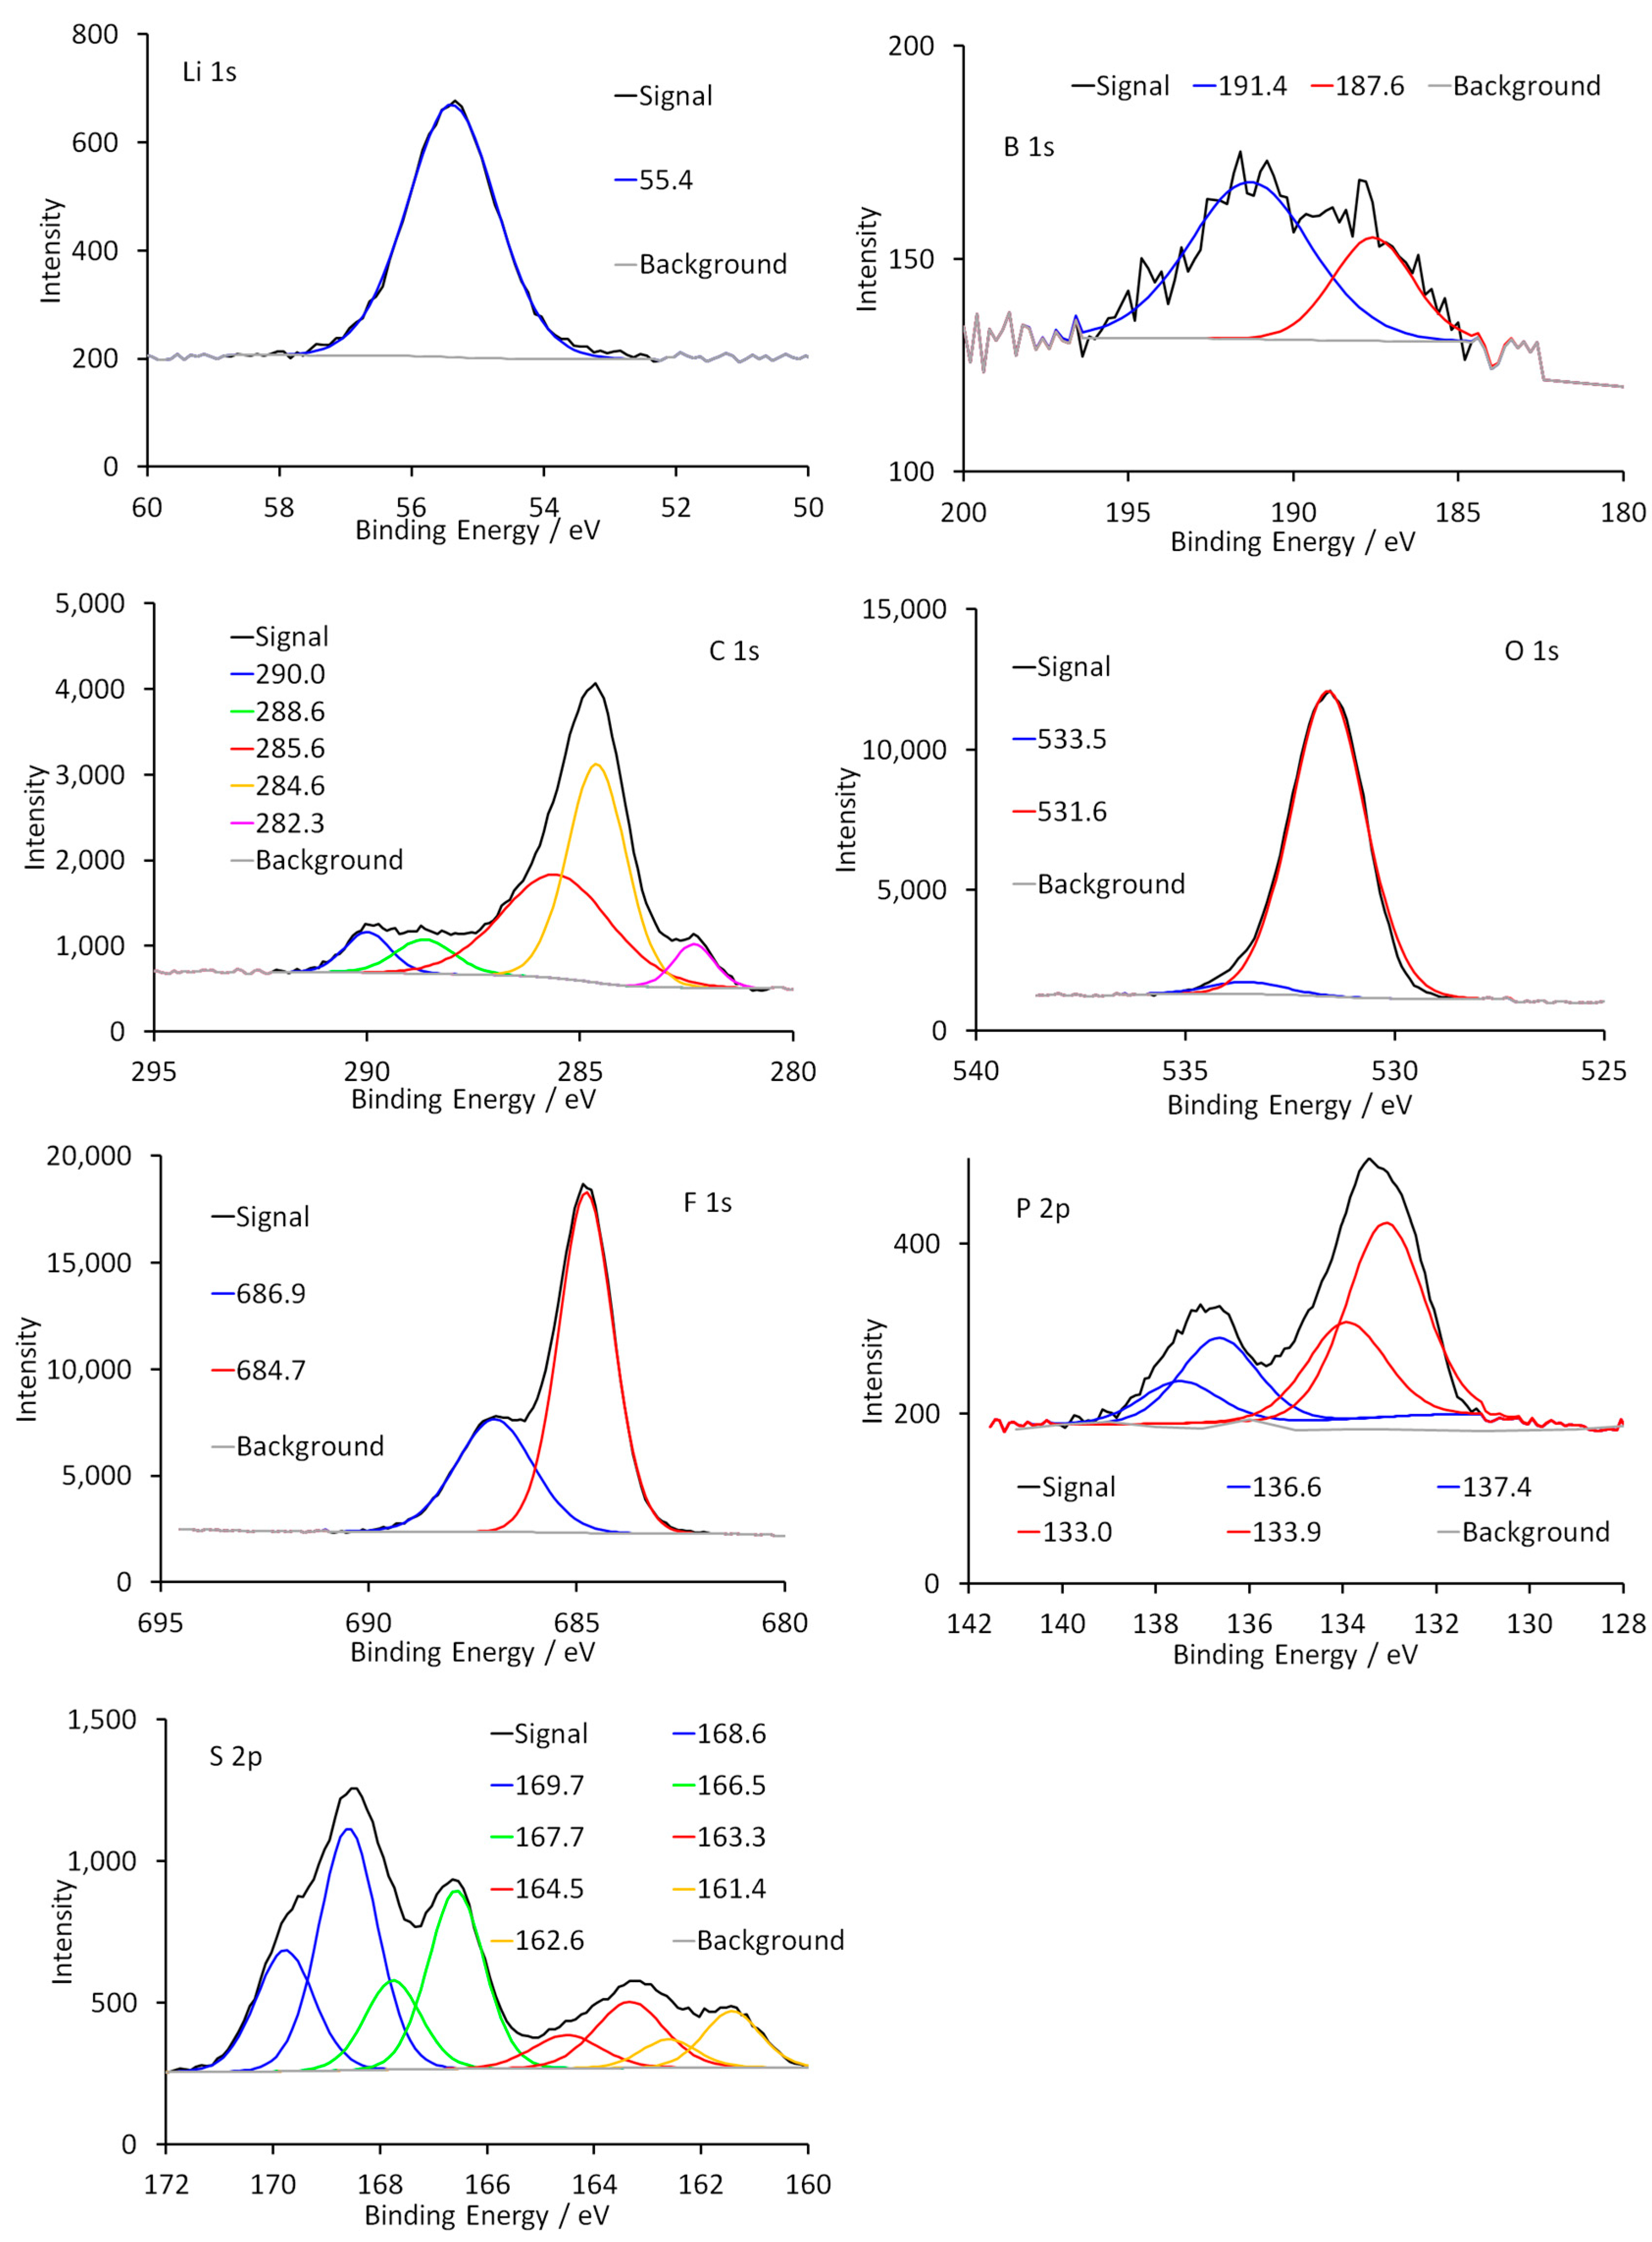
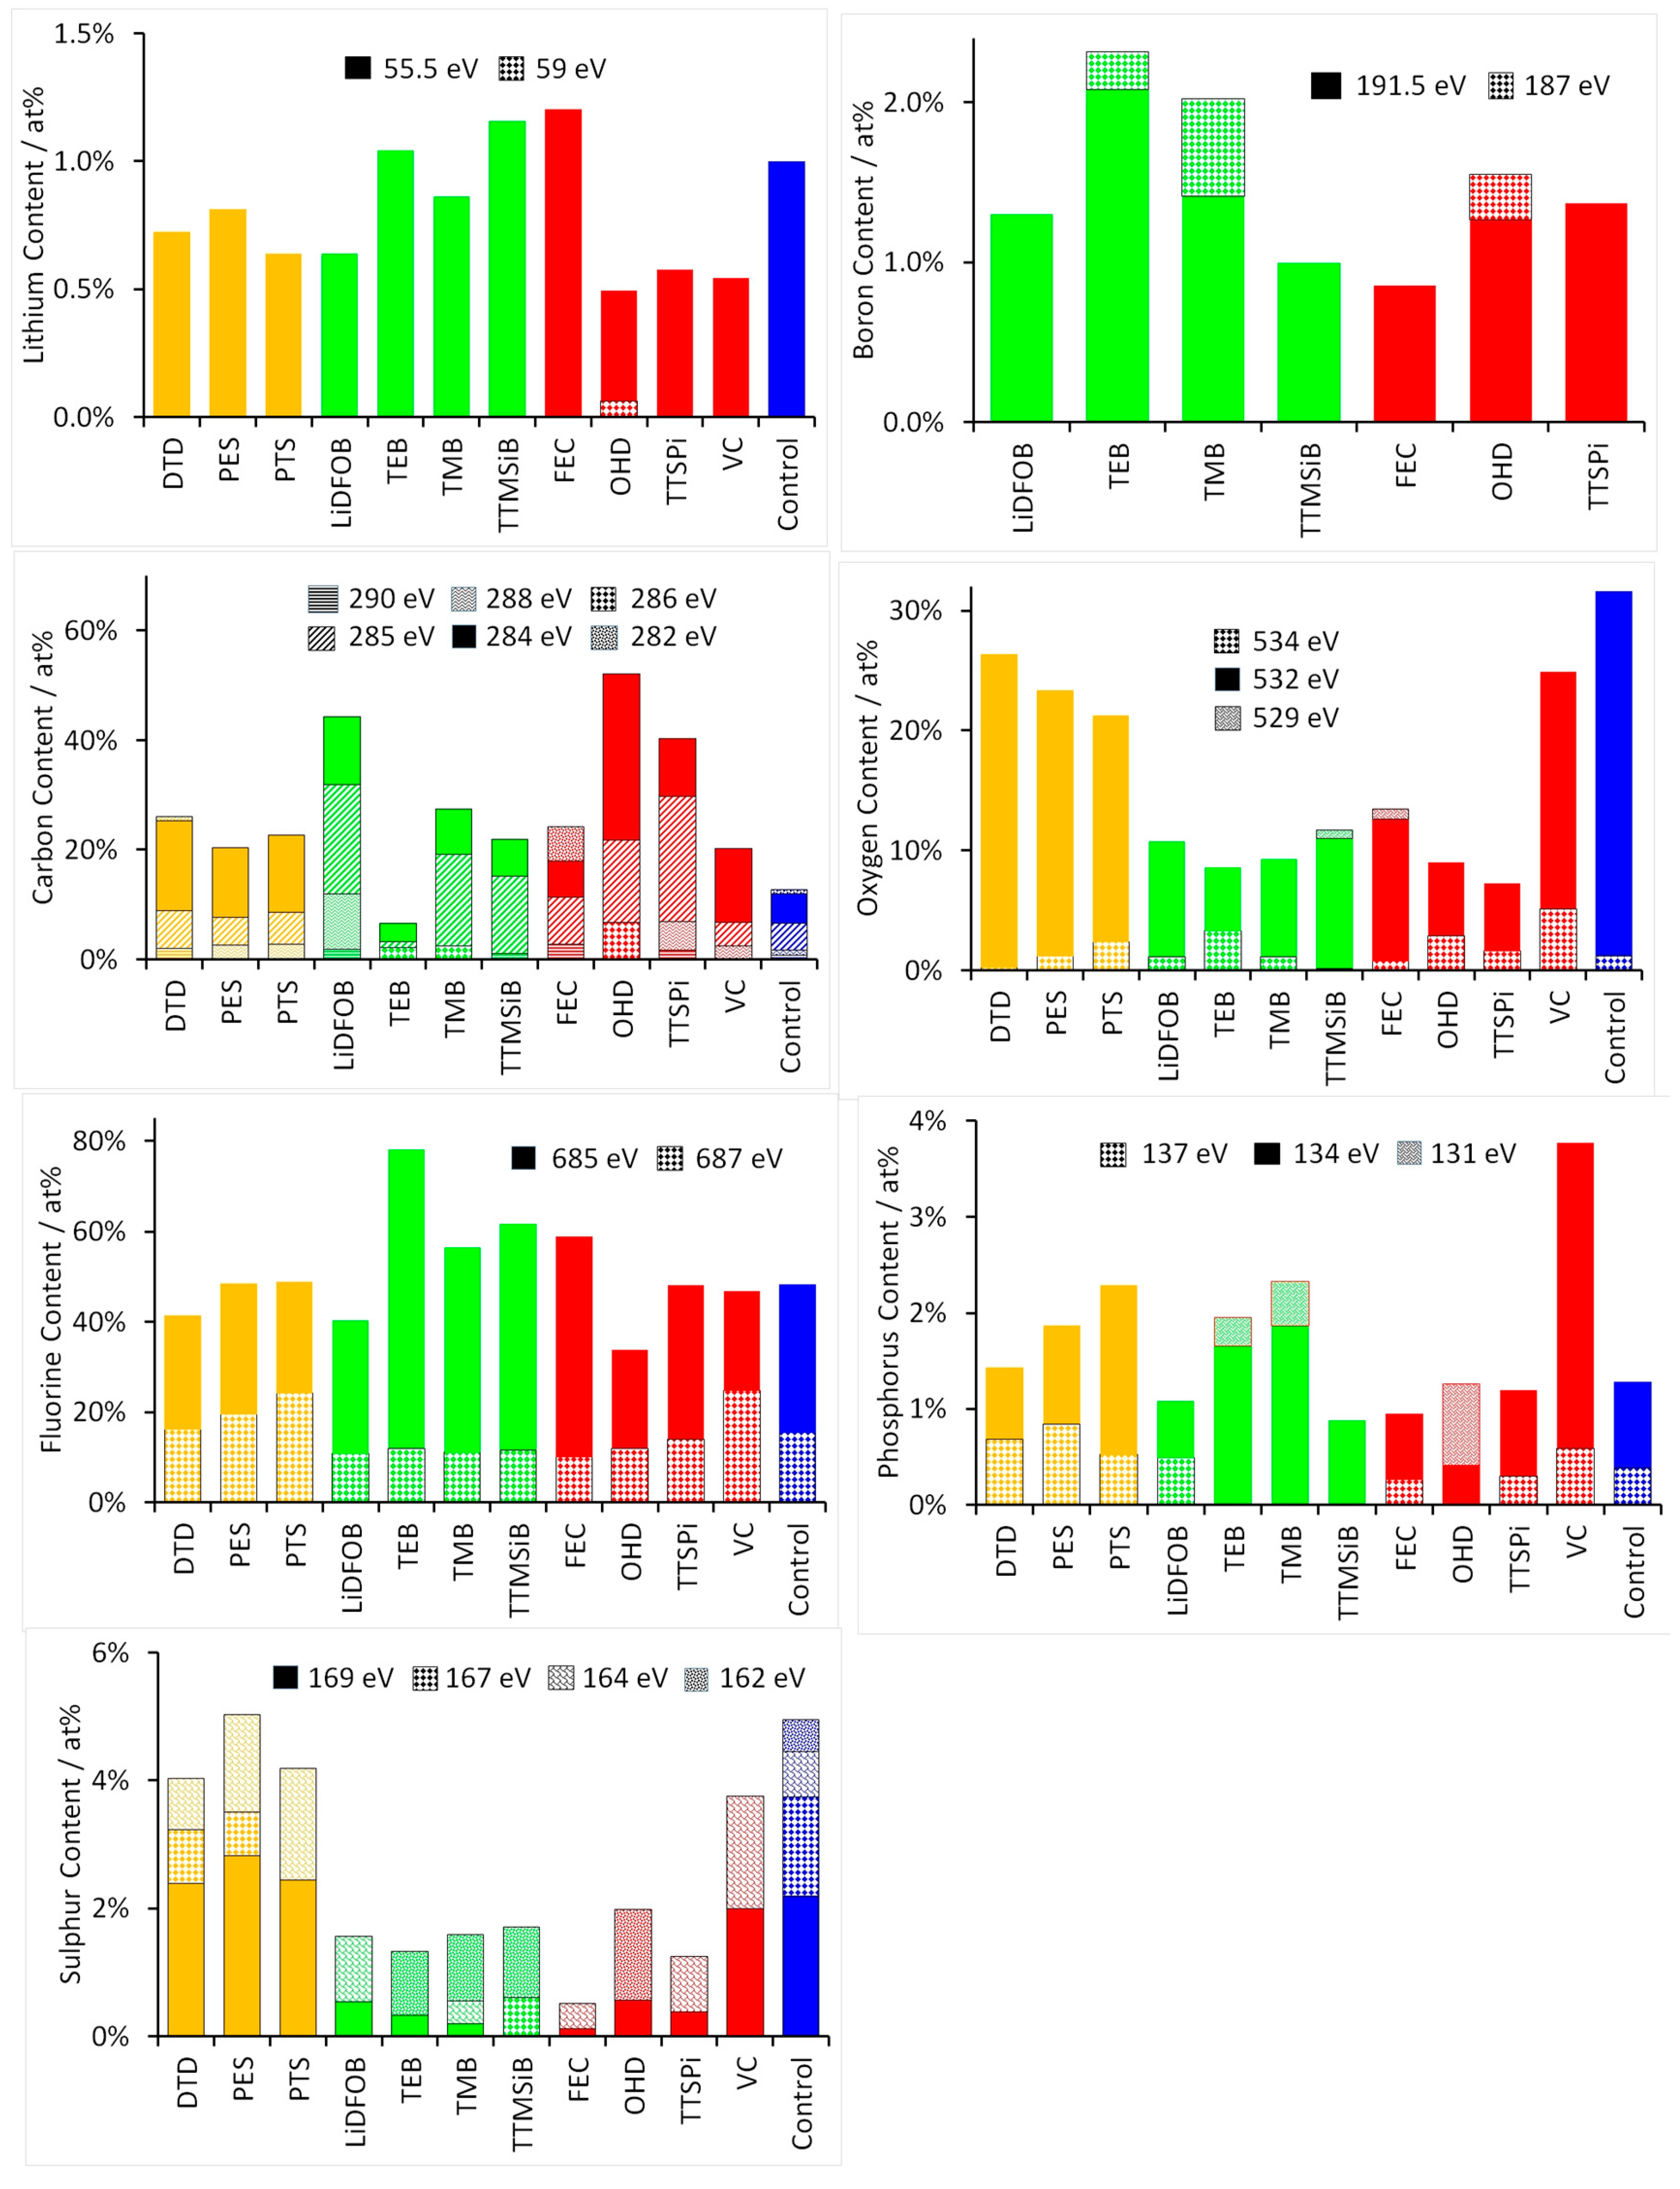
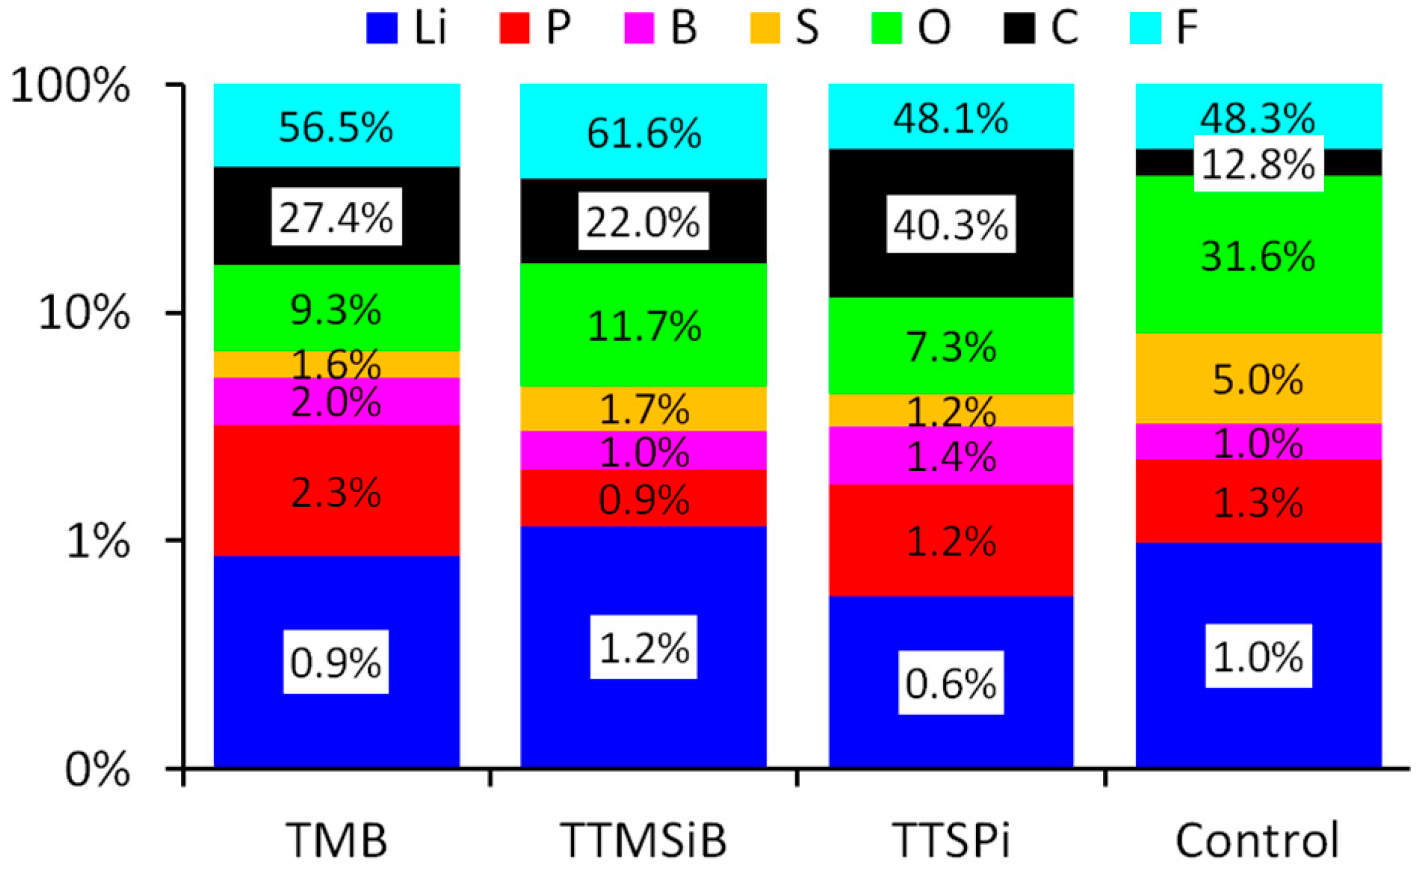
3.2. Chemical Analysis of the SEI Surface

Anodes from cells containing electrolytes with the various additives were extracted from coin cells, and used for X-ray photo spectroscopy (XPS) measurements. Some of the results are collected in Figure 7 and Figure 8. Figure 7 shows representative spectra for the seven elements detected in the spectra, mostly for the control electrolyte. The total fitting curves are plotted in Figure S6, in the supplementary information. Figure 8 shows the different atomic % and peak distributions for each element, as a function of additive type.
Most lithium compounds produce peaks at around 55.5 eV [24]. The lithium fluoride peak is at ~55.6 eV, and lithium carbonate at ~55.2 eV. Both of these lithium compounds are expected to be present in the SEI layer [10]. In this case, all the samples contained a lithium 1 s peak in the 55–57 eV range, indicative of these compounds. The cell with additive OHD also had a peak at 59 eV, indicating another lithium species. This peak was too high for Li2O2, which is reported at 57 eV [45]. Interestingly, several of the additives produced an SEI layer with a lower lithium content than the control electrolyte, from around 1 at% to around 0.5 at%.
Boron was observed for the electrolyte additives containing boron, as expected, but also in the control electrolyte. The highest boron at% values were for the TEB and TMB additives. There are many boron compounds with B 1s binding energies in the 192–193 eV range, for example B2O3, H3BO3, Na2B4O7 [24]. The boron containing additive was more likely to be LiBOB than LiBF4. LiBOB has an XPS peak at 194 eV [46], and reduction products like LiO.CO.CO.O.CH2.CH2.O.CO.O.B(C2O4)Li and [O.B(C2O4)Li]n have been proposed [46]. Therefore, the main peak at 192 eV is likely to be an oxygen –boron compound of this type. The lower energy peak at ~187 eV, seen in three samples, is in the energy range for a boride or borohydride [24].
The carbon 1 s spectra showed the greatest number of peaks. There are some variations in the reported peak energies for different carbon compounds. A representative set comprised graphite (284.4 eV), hydrocarbons (285.0 eV), alcohols and ethers (286.2 eV), carbonyls (287.6 eV), carboxylic acids and esters (288.8 eV) and carbonates (290.6 eV) [47]. Poly (vinylene carbonate) gives a higher energy peak, at about 291.5 eV [48]. The lower energy peak at around 282 eV would normally be interpreted as a carbide, and in this case, therefore, lithiated carbon. A calculated energy of 283.6 eV has been proposed for LiC6 [49], but other measurements show a peak at 282.5 eV [50]. Although the cells were disassembled in a discharged state, there is always the possibility of some residual intercalated lithium.
Three different oxygen peak positions were identified, but most spectra only contained two. The dominant peak at 531–532 eV was due to C=O double bonds, whereas the higher energy peak at 533–534 eV was single bond C-O [48]. The lower energy peak is in the expected range for metal oxides, and this is therefore most likely to be Li2O. However, Li2O can be produced by the argon sputtering of Li2CO3 [51], as an artefact of measurement, rather than a genuine component. There was a clear separation in oxygen content between low (~10 at%) and high (~25 at%), for different additives. The fluorine spectra were the most consistent in this data set. The main peak at around 685 eV was LiF [40]. The higher energy peak at around 688 eV could be several compounds, including LiPF6, PVDF, LixPFy and LixPOyFz [40,45,47]. Many of the additives gave similar results to the control electrolyte. However, the three organo-borates had noticeably higher at% values, and OHD was lower.
Phosphorus 2p produces two peaks, with 3/2 or 1/2 spins. The experimental data was fitted in pairs, with a Δ = 0.84 eV. Published results do not always specify whether they are referring to the 2p3/2 peak energy alone, or some average of 2p3/2 and 2p1/2. Most samples had two doublets. The main peak at 133–134 eV was attributed to LixPOyFz, while the higher energy peak at 136–137 eV was likely to be LiPF6 or LixPFy [52]. A peak at ~131 eV, seen in three samples, was a surprise. This energy is typical of elemental phosphorus and organic compounds like (C6H5)3P [24]. Several additives produced higher phosphorus at% values than the control electrolyte, most noticeably VC.
There is a limited amount of prior work on the sulphur content of SEI layers. The representative spectrum shown in Figure 7 had eight peaks, in four doublets. As with phosphorus, the 3/2 and 1/2 spin peaks were fitted separately, in this case with a Δ = 1.2 eV. Peaks at 168–169 eV are sulphates or sulfones, peaks at 166–167 eV are sulphites, while peaks at 161 eV are sulphides [24]. Reaction mechanisms leading to sulphides from lithium ion liquid electrolytes are discussed below. Many of the additives significantly suppressed the formation of sulphur containing compounds, most obviously the boron containing compounds. The sulphur containing additives did not increase the sulphur content compared to the control electrolyte, indicating preferential decomposition of other electrolyte components.
Most sulphur 2p XPS studies on anodes from lithium ion cells focus on Li2SO3 and RO.SO2Li, rather than sulphides [53]. However, equivalent work on lithium/sulphur cells does identify sulphides and disulphides [54]. Table 2 lists some peak energies from those two papers. The former refers to “alkyl sulphides”, but to be present in the SEI layer, they would need to be solid at room temperature. Dimethyl sulphide (CH3.S.CH3) has a melting point of −98 °C. In contrast, lithium thiomethoxide (CH3.S.Li) is solid at room temperature, and lithium sulphide has a melting point of 938 °C. Thus, the compounds present in the SEI layer are more likely to be Li2S and CH3.S.Li.
There are many possible reduction reaction mechanisms for the reduction of compounds like propane-1,3-sultone to Li2S or CH3SLi. Previously published reaction mechanisms for propene-1,3-sultone [55], ethylene sulphite [56], and sulphur dioxide [57] proposed:
C 3 H 4 SO 3 + 2   Li + + 2   e     Li 2 SO 3   ( s ) + CH 3 . C CH   ( g )
C2H4SO3 + 2 Li+ + 2 e → Li2SO3 (s) + C2H4 (g)
SO2 + 6 Li+ + 6 e → Li2S (s) + 2 Li2O (s)
The sulphur dioxide mechanism was derived for Li/SO2 primary cells, and also applies when SO2 is used as a film forming additive in lithium ion cells [57]. Li2O can react further with SO2, CO2, H2O and HF. It is easier to envisage a chemical reaction mechanism for SO2 as molecules adsorbing on a lithium metal surface. A series of electrochemical process steps can be hypothesised:
SO2 + Li+ + e → LiO.S:O
LiO.S:O + Li+ + e → LiO.S.OLi
LiO.S.OLi + 2 Li+ + 2 e → Li2O (s) + LiS.OLi
LiS.OLi + 2 Li+ + 2 e → Li2S (s) + Li2O (s)
Electrochem 01 00014 i001
Electrochem 01 00014 i002
Electrochem 01 00014 i003
Electrochem 01 00014 i004
Electrochem 01 00014 i005
LiO.CH2.CH2.CH2.S.(OLi)2 + Li+ + e → LiO.S.OLi + Li2O + CH2:CH.CH3
Combining reactions (6)–(9) gives the overall reaction (5). Applying a similar approach to propane-1,3-sultone, the reaction pathway set out in below can be proposed. Reactions (10) and (11) are equivalent to reactions (6) and (7). The next stage is ring cleavage in the intermediate compound, leading to either CH3.S.Li or LiO.S.OLi. The latter would react further, as per (8) and (9), to give Li2S. The by-product from reaction (12), CH2:CH.OLi is likely to react further.

4. Discussion

In electrochemical tests, three of the twelve additives gave significantly better performance than the baseline or control electrolyte; TMB, TTMSiB and TTSPi. The XPS results for the SEI layers with these three additives are summarised in Figure 9, along with the control electrolyte. The boron content for the control electrolyte was a representative value, based on measurements with similar samples. The SEI layers with additives contained more carbon, and much less oxygen and sulphur. However, there was no apparent trend or correlation with any of the carbon components.
In previous XPS experiments on graphite anodes, there were significant differences in the XPS spectra recorded with and without TTSPi in the electrolyte [44]. There was much more LixPOyFz detected at 134.5 eV, and a new P2p peak at 131 eV interpreted as -P-O-Si-. However, the graphite anodes were rinsed with DMC after testing, which can dissolve some SEI components. In these experiments, the biggest effect of TTSPi was reducing the oxygen double bond content, and increasing the amount of carbon (as hydrocarbons).
The effect of total fluoride content is not clear cut in Figure 9. Figure 10A shows the fluorine content associated with lithium fluoride, for all the samples. The resistance values were calculated from impedance measurements performed on cells aged for two weeks. The “electrochemical” resistances were for the dominant semi-circle, and therefore included film and charge transfer resistances for both electrodes. The three additives that produced the best performing in cycling tests also had the three lowest resistances. A slightly increased fluoride content appeared to be beneficial. However, TEB was one of the worst performing additives with this cell chemistry, and the fluorine content in the SEI layer was clearly far too high.
The composition, morphology and lithium conduction mechanisms of the SEI remain the subject of on-going debate [7]. An example of this complexity is shown in Figure 10B, which plots the oxygen double bond content against the same electrochemical resistance values. The more effective additives produced a lower oxygen content, even though lithium hopping between oxygen groups is often proposed as a SEI conduction mechanism. The ineffective additive LiDFOB also gave a lower oxygen content, and remarkably similar results overall to TTSPi, the best additive here.

5. Conclusions

This work shows the relationship between the solid electrolyte interface layer (SEI) on graphite anodes and the resistances of a commercial electric vehicle cells. Coin cells were made using commercial graphite and mixed cathode electrodes, with a baseline electrolyte and twelve additives. Even with the coin cell variation (<5%), a clear trend between the different electrolyte additives could be clearly discerned.
In electrochemical tests, three of the twelve additives gave significantly better performance than the baseline or control electrolyte; TMB, TTMSiB and TTSPi were chosen for further investigation. TTSPi gave consistently higher capacities over the concentration range 0.5–3.0 wt % and even at 0.5 wt %, a benefit was observed. The three additives that produced the best performance in cycling tests also had the three lowest resistances. Overall, the most promising additive was TTSPi, tris trimethyl silyl phosphite. It exhibited increased initial and retained capacities, and lower resistances, compared to the control electrolyte.
The role of electrolyte additives is to provide additional decomposition products, which aid the formation of a thin, dense and ionically conducting interface layer. The complicated formation of decomposition products, and the subsequent rearrangement of the SEI during cycling, means that it is difficult to understand the exact role of the additives. However, we show that the TTSPi clearly has a benefit as an additive. It may have a dual benefit in scavenging of HF and suppressing transition metal dissolution from the cathode, as well as protecting the anode.
XPS measurements on lithium ion anode samples, tested in electrolytes with various additives, showed clear differences in elemental composition, and the chemical environment for each element. The peaks in the spectra can be attributed to compounds of the type that are expected to be found in the SEI layer. It was observed that there was a general trend for lower resistance with higher lithium fluoride content, though not at the extreme concentrations found with TEB as an additive. For oxygen double bond compounds, there was an interesting “volcano” plot, with a lower carbonyl content at both low and high resistances.
The baseline electrolyte includes a proprietary additive (or additives) that contains boron and sulphur. It was observed that the sulphur content in the SEI layer was suppressed by several of the other additives. The sulphur compounds identified were sulphides; Li2S and CH3SLi rather than oxygen containing sulphur compounds. Possible mechanisms for the formation of these compounds have been proposed.
We suggest that the best additives are involved in the formation of a thin but ionically conductive layer. Greater carbon content and lower oxygen content from the XPS indicate a reduction of the EC type ring opening decomposition, and preferential lithiated organic species on the surface. Therefore, we suggest that the better additives contain strongly bonded organic or inorganic species which do not dissociate completely upon decomposition, and enable further lithiation of the compound upon cycling.

Supplementary Materials

The following are available online at https://www.mdpi.com/2673-3293/1/2/14/s1, Figures S1–S6.

Author Contributions

Conceptualization, M.J.L.; methodology, M.J.L. and I.R.L.; investigation, M.J.L. and I.R.L.; data curation, M.J.L. and I.R.L.; writing—original draft preparation, M.J.L.; writing—review and editing, E.K.; supervision, E.K. All authors have read and agreed to the published version of the manuscript.

Funding

WMG would like to acknowledge funding from the Advanced Propulsion Centre (APC), as part of the High Energy Density Battery project, and contributions from the other project partners, especially Nissan Motor Manufacturing (UK) Ltd.

Acknowledgments

The authors would like to thank D.G. as WMG principal investigator, for his guidance and support, and to M.W., Department of Physics, for his help with the XPS measurements.

Conflicts of Interest

The authors declare no conflict of interest.

References

  1. Blomgren, G.E. The development and future of lithium ion batteries. J. Electrochem. Soc. 2017, 164, A5019–A5025. [Google Scholar] [CrossRef] [Green Version]
  2. Aurbach, D.; Talyosef, Y.; Markovsky, B.; Markevich, E.; Zinigrad, E.; Asraf, L.; Gnanaraj, J.S.; Kim, H.-J. Design of electrolyte solutions for lithium and lithium ion batteries: A review. Electrochim. Acta 2004, 50, 247–254. [Google Scholar] [CrossRef]
  3. Balbuena, P.B. Electrolyte materials—Issues and challenges. AIP Conf. Proc. 2014, 1597, 82–97. [Google Scholar] [CrossRef]
  4. Li, Q.; Chen, J.; Fan, L.; Kong, X.; Lu, Y. Progress in electrolytes for rechargeable lithium based batteries and beyond. Green Energy Environ. 2016, 1, 18–42. [Google Scholar] [CrossRef] [Green Version]
  5. Verma, P.; Maire, P.; Novák, P. A review of the features and analyses of the SEI in lithium ion batteries. Electrochim. Acta 2010, 55, 6332–6341. [Google Scholar] [CrossRef]
  6. Zhang, S.S. A review of electrolyte additives for lithium ion batteries. J. Power Sources 2016, 162, 1379–1394. [Google Scholar] [CrossRef]
  7. Maleki, H.; Deng, G.; Anani, A.; Howard, J. Thermal stability studies of lithium ion cells and components. J. Electrochem. Soc. 1999, 146, 3224–3229. [Google Scholar] [CrossRef]
  8. Wang, Q.; Ping, P.; Zhao, X.; Chu, G.; Sun, J.; Chen, C. Thermal runaway caused fire and explosion of lithium ion battery. J. Power Sources 2012, 208, 210–224. [Google Scholar] [CrossRef]
  9. Belov, D.; Yang, M.-H. Investigation of the kinetic mechanism in over-charge process for lithium ion battery. Solid State Ionics 2008, 179, 1816–1821. [Google Scholar] [CrossRef]
  10. Aurbach, D. Review of selected electrode—Solution interactions which determine the performance of lithium and lithium ion batteries. J. Power Sources 2000, 89, 206–218. [Google Scholar] [CrossRef]
  11. Parimalam, B.S.; Lucht, B.L. Reduction reactions of electrolyte salts for lithium ion batteries: LiPF6, LiBF4, LiDFOB, LiBOB and LiTFSI. J. Electrochem. Soc. 2018, 165, A251–A255. [Google Scholar] [CrossRef] [Green Version]
  12. Peled, E.; Menkin, S. Review. SEI: Past, present and future. J. Electrochem. Soc. 2017, 164, A1703–A1719. [Google Scholar] [CrossRef]
  13. Agubra, V.A.; Fergus, J.W. The formation and stability of the SEI on the graphite anodes. J. Power Sources 2014, 268, 153–162. [Google Scholar] [CrossRef]
  14. An, S.J.; Li, J.; Daniel, C.; Mohanty, D.; Nagpure, S.; Wood, D.L. The state of understanding of the lithium ion battery graphite SEI and its relationship to formation cycling. Carbon 2016, 105, 52–76. [Google Scholar] [CrossRef] [Green Version]
  15. El Ouatani, L.; Dedryvère, R.; Siret, C.; Biensan, P.; Reynaud, S.; Iratçabal, P.; Gonbeau, D. The effect of vinylene carbonate additive on surface film formation on both electrodes in lithium ion batteries. J. Electrochem. Soc. 2009, 156, A103–A113. [Google Scholar] [CrossRef]
  16. Xiong, D.; Burns, J.C.; Smith, A.J.; Sinha, N.; Dahn, J.R. A high precision study of the effect of VC additive in lithium/graphite cells. J. Electrochem. Soc. 2011, 158, A1431–A1435. [Google Scholar] [CrossRef]
  17. Xu, K. Non-aqueous liquid electrolytes for lithium based rechargeable batteries. Chem. Rev. 2004, 104, 4303–4417. [Google Scholar] [CrossRef]
  18. Wang, I.Y.; Zhang, M.; von Sacken, U.; Way, B.M. Additives for Improving Cycle Life of Non-Aqueous Rechargeable Lithium Batteries. U.S. Patent 6,045,948, 4 April 2000. [Google Scholar]
  19. Ue, M. Role-assigned Electrolyte Additives. In Lithium Ion Batteries; Yoshio, M., Brodd, R.J., Kozawa, A., Eds.; Springer: New York, NY, USA, 2009. [Google Scholar]
  20. Xu, K. Electrolytes and interphases in lithium ion batteries and beyond. Chem. Rev. 2014, 114, 11504–11618. [Google Scholar] [CrossRef]
  21. Retrieved 2016. Available online: http://www.eco-aesc-lb.com/en/product/liion_ev/ (accessed on 20 April 2020).
  22. Barker, J.; Cochran, S. Methods of Fabricating Electrochemical Cells. U.S. Patent 5,871,865, 16 February 1999. [Google Scholar]
  23. Yasunami, S. Non-Aqueous Secondary Battery and Method for Preparing Same. U.S. Patent 6,371,995, 16 April 2002. [Google Scholar]
  24. Moulder, J.F.; Stickle, W.F.; Sobol, P.E.; Bomben, K.D. Handbook of X-ray Photoelectron Spectroscopy; Perkin Elmer: Norwalk, CT, USA, 1992. [Google Scholar]
  25. Utsugi, K.; Kusachi, Y.; Katou, T. Electrolyte Solution for a Secondary Battery. U.S. Patent 9,012,071, 21 April 2015. [Google Scholar]
  26. Hagiyama, K.; Matsuo, A.; Yasuda, H.; Miyakubo, H. Non-Aqueous Electrolyte Composition and Non-Aqueous Electrolyte Secondary Battery. U.S. Patent 9,160,033, 13 October 2015. [Google Scholar]
  27. Ma, L.; Wang, D.Y.; Downie, L.E.; Xia, J.; Nelson, K.J.; Sinha, N.N.; Dahn, J.R. Ternary and quaternary electrolyte additive mixtures for lithium ion cells that promote long lifetime, high discharge rate and better safety. J. Electrochem. Soc. 2014, 161, A1261–A1265. [Google Scholar] [CrossRef]
  28. Kang, K.S.; Choi, S.; Song, J.; Woo, S.-G.; Jo, Y.N.; Choi, J.; Yim, T.; Yi, J.-S.; Kim, Y.-J. Effect of additives on electrochemical performance of NMC at high temperature. J. Power Sources 2014, 253, 48–54. [Google Scholar] [CrossRef]
  29. Self, J.; Hall, D.S.; Madec, L.; Dahn, J.R. The role of PES as an additive in lithium ion cells. J. Power Sources 2015, 298, 369–378. [Google Scholar] [CrossRef]
  30. Huang, W.; Xing, L.; Zhang, R.; Wang, X.; Li, W. A novel electrolyte additive for improving the interfacial stability of high voltage LNMO cathode. J. Power Sources 2015, 293, 71–77. [Google Scholar] [CrossRef]
  31. Zhu, Y.; Li, Y.; Bettge, M.; Abraham, D.P. Positive electrode passivation by LiDFOB electrolyte additive in high capacity lithium ion cells. J. Electrochem. Soc. 2012, 159, A2109–A2117. [Google Scholar] [CrossRef]
  32. Wang, Z.; Xing, L.; Li, J.; Xu, M.; Li, W. Triethylborate as an electrolyte additive for high voltage layered NMC cathode of lithium ion battery. J. Power Sources 2016, 307, 587–592. [Google Scholar] [CrossRef]
  33. Li, J.; Xing, L.; Zhang, L.; Yu, L.; Fan, W.; Xu, M.; Li, W. Insight into self-discharge of layered lithium rich cathode in carbonate based electrolytes with and without additive. J. Power Sources 2016, 324, 17–25. [Google Scholar] [CrossRef]
  34. Rong, H.; Xu, M.; Xie, B.; Liao, X.; Huang, W.; Xing, L.; Li, W. Tris trimethylsilyl borate (TMSB) as a cathode surface film forming additive for 5 V LNMO lithium ion cells. Electrochim. Acta 2014, 147, 31–39. [Google Scholar] [CrossRef]
  35. Li, J.; Xing, L.; Zhang, R.; Chen, M.; Wang, Z.; Xu, M.; Li, W. Tris trimethylsilyl borate as an electrolyte additive for improving interfacial stability of high voltage layered lithium rich oxide cathode/carbonate based electrolyte. J. Power Sources 2015, 285, 360–366. [Google Scholar] [CrossRef]
  36. Xia, J.; Nie, M.; Burns, J.C.; Xiao, A.; Lamanna, W.M.; Dahn, J.R. Fluorinated electrolyte for 4.5 V NCM-424/graphite lithium ion cells. J. Power Sources 2016, 307, 340–350. [Google Scholar] [CrossRef]
  37. Zhang, L.; Huang, J.; Youssef, K.; Redfern, P.C.; Curtiss, L.A.; Amine, K.; Zhang, Z. Molecular engineering toward stabilised interface: An electrolyte additive for high performance lithium ion battery. J. Electrochem. Soc. 2014, 161, A2262–A2267. [Google Scholar] [CrossRef] [Green Version]
  38. Huang, W.; Xing, L.; Wang, W.; Xu, M.; Li, W.; Xie, F.; Xia, S. 4-trifluoromethyl benzonitrile: A novel electrolyte additive for LNMO cathode of high voltage lithium ion battery. J. Power Sources 2014, 267, 560–565. [Google Scholar] [CrossRef]
  39. Zhu, Y.; Luo, X.; Xu, M.; Zhang, L.; Yu, L.; Fan, W.; Li, W. Failure mechanism of layered lithium rich oxide/graphite cell and its solution by using electrolyte additives. J. Power Sources 2016, 317, 65–73. [Google Scholar] [CrossRef]
  40. Somerville, L.; Bareno, J.; Jennings, P.; McGordon, A.; Lyness, C.; Bloom, I. The effect of pre-analysis washing on the surface film of graphite electrodes. Electrochim. Acta 2016, 206, 70–76. [Google Scholar] [CrossRef] [Green Version]
  41. Han, Y.-K.; Yoo, J.; Yim, T. Why is tris trimethylsilyl phosphite effective as an additive for high voltage lithium ion batteries? J. Mater. Chem. A 2015, 3, 10900–10909. [Google Scholar] [CrossRef]
  42. Peebles, C.; Sahore, R.; Gilbert, J.A.; Garcia, J.C.; Tornheim, A.; Bareño, J.; Iddir, H.; Liao, C.; Abraham, D.P. TMSPi and TEPi as electrolyte additives for lithium ion batteries: Mechanistic insights into differences during NMC-532/graphite full cell cycling. J. Electrochem. Soc. 2017, 164, A1579–A1586. [Google Scholar] [CrossRef]
  43. Qi, X.; Tao, L.; Hahn, H.; Schultz, C.; Gallus, D.R.; Cao, X.; Nowak, S.; Röser, S.; Li, J.; Cekic-Laskovic, I.; et al. Lifetime limit of tris (trimethylsilyl) phosphite as electrolyte additive for high voltage lithium ion batteries. RSC Adv. 2016, 6, 38342–38349. [Google Scholar] [CrossRef] [Green Version]
  44. Yim, T.; Han, Y.-K. Tris (trimethylsilyl) phosphite as an efficient electrolyte additive to improve the surface stability of graphite anodes. ACS Appl. Mater. Interfaces 2017, 9, 32851–32858. [Google Scholar] [CrossRef]
  45. Bothe-Almquist, C.L.; Ettireddy, R.P.; Bobst, A.; Smirniotis, P.G. An XRD, XPS and EPR study of Li/MgO catalysts: Case of oxidative methylation of acetonitrile to acrylonitrile with methane. J. Catal. 2000, 192, 174–184. [Google Scholar] [CrossRef]
  46. Xiao, A.; Yang, L.; Lucht, B.L.; Kang, S.-H.; Abraham, D.P. Examining the SEI on binder free graphite electrodes. J. Electrochem. Soc. 2009, 156, A318–A327. [Google Scholar] [CrossRef]
  47. Blyth, R.I.R.; Buqa, H.; Netzer, F.P.; Ramsey, M.G.; Besenhard, J.O.; Golb, P.; Winter, M. XPS studies of graphite electrode materials for lithium ion batteries. Appl. Surf. Sci. 2000, 167, 99–106. [Google Scholar] [CrossRef]
  48. Nie, M.; Demeaux, J.; Young, B.T.; Heskett, D.R.; Chen, Y.; Bose, A.; Woicik, J.C.; Lucht, B.L. Effect of VC and FEC on SEI formation on graphitic anodes in lithium ion batteries. J. Electrochem. Soc. 2015, 162, A7008–A7014. [Google Scholar] [CrossRef] [Green Version]
  49. Kanamura, K.; Shiraishi, S.; Takezawa, H.; Takehara, Z. XPS analysis of the surface of a carbon electrode intercalated by lithium ions. Chem. Mater. 1997, 9, 1797–1804. [Google Scholar] [CrossRef]
  50. Yazami, R. Surface chemistry and lithium storage capability of the graphite lithium electrode. Electrochim. Acta 1999, 45, 87–97. [Google Scholar] [CrossRef]
  51. Edström, K.; Herstedt, M.; Abraham, D.P. A new look at the solid electrolyte interphase on graphite anodes in lithium ion batteries. J. Power Sources 2006, 153, 380–384. [Google Scholar] [CrossRef]
  52. Andersson, A.M.; Abraham, D.P.; Haasch, R.; MacLaren, S.; Liu, J.; Amine, K. Surface characterisation of electrodes from high power lithium ion batteries. J. Electrochem. Soc. 2002, 149, A1358–A1369. [Google Scholar] [CrossRef]
  53. Ota, H.; Akai, T.; Namita, H.; Yamaguchi, S.; Nomura, M. XAFS and TOF-SIMS analysis of SEI layers on electrodes. J. Power Sources 2003, 119–121, 567–571. [Google Scholar] [CrossRef]
  54. Chen, S.; Dai, F.; Gordin, M.L.; Yu, Z.; Gao, Y.; Song, J.; Wang, D. Functional organo-sulphide electrolyte promotes and alternative reaction pathway to achieve high performance in lithium sulphur batteries. Angew. Chem. Int. Ed. 2016, 55, 4231–4235. [Google Scholar] [CrossRef]
  55. Li, B.; Xu, M.; Li, B.; Liu, Y.; Yang, L.; Li, W.; Hu, S. Properties of SEI formed by PES on graphite anode of lithium ion batteries. Electrochim. Acta 2013, 105, 1–6. [Google Scholar] [CrossRef]
  56. Leggesse, E.G.; Jiang, J.-C. Theoretical study of the reductive decomposition of ethylene sulphite: A film forming electrolyte additive in lithium ion batteries. J. Phys. Chem. A 2012, 116, 11025–11033. [Google Scholar] [CrossRef]
  57. Ein-Eli, Y.; Thomas, S.R.; Koch, V.R. The role of SO2 as an additive to organic lithium ion battery electrolytes. J. Electrochem. Soc. 1997, 144, 1159–1165. [Google Scholar] [CrossRef]
Figure 1. Formation and cell ageing process steps.
Electrochem 01 00014 g001
Figure 2. Differential capacity plots during anode half-cell first cycles for (a) sulphur containing additives, (b) boron containing additives and (c) other additives.
Electrochem 01 00014 g002
Figure 3. Discharge capacities of cells containing different electrolyte additives.
Electrochem 01 00014 g003
Figure 4. Effect of additives on capacity retention over fifty cycles for (a) sulphur containing additives, (b) boron containing additives and (c) other additives.
Electrochem 01 00014 g004
Figure 5. Impedance spectra after formation and after cell ageing (PTS electrolyte).
Electrochem 01 00014 g005
Figure 6. Effect of additive concentration on capacity retention over fifty cycles for (a) TMB, (b) TTMSiB and (c) TTSPi.
Electrochem 01 00014 g006
Figure 7. Typical XPS spectra for different elements.
Electrochem 01 00014 g007
Figure 8. XPS comparisons for different electrolyte additives.
Electrochem 01 00014 g008
Figure 9. Comparison between the control electrolyte and the three best performing additives.
Electrochem 01 00014 g009
Figure 10. Relationship between cell impedance and XPS measurements for (A) lithium fluoride and (B) oxygen double bond.
Electrochem 01 00014 g010
Table 1. Candidate electrolyte additives.
TypeAcronymNameConcn./wt %Ref
Sulphur ContainingDTDDioxathilane-2,2-dioxide1.0[27]
PESPropene sulfone1.0[28,29]
PTSPhenyl trifluoromethyl sulphide0.5[30]
Boron ContainingLiDFOBLithium difluoro oxalato borate2.0[31]
TEBTriethyl borate2.5[32]
TMBTrimethyl borate1.0[33]
TTMSiBTris trimethylsilyl borate0.6[34,35]
OtherFECFluoroethylene carbonate1.0[36]
OHD3-oxabicyclo [3.1.0]hexane-2,4-dione0.2[37]
TFMB4-Trifluoromethyl benzonitrile1.0[38]
TTSPiTris trimethyl silyl phosphite1.0[27,39]
VCVinylene carbonate1.0[32]
Table 2. Peak energies for sulphur compounds.
Functional GroupPeak/eV [53]CompoundPeak/eV [54]
RO.SO2Li168.5--
Li2SO3167.5--
-SS-164.5Li2S2162.0/163.2
S164.0S8164.0/165.2
-S-163.5CH3SLi162.1/163.3
Li2S161.5Li2S160.5/161.7

