Article

Transition Metal Oxides (WO3-ZrO2) as Promoters and Hydrogen Adsorption Modulators in Pt/WO3-ZrO2-C Electrocatalyst for the Reduction of NOx

by
Claudia R. Santiago-Ramírez
1,*,
Martha L. Hernández-Pichardo
2,
Arturo Manzo-Robledo
3,
Daniel A. Acuña-Leal
1 and
Miguel A. Gracia-Pinilla
1,*
1
Facultad de Ciencias Físico Matemáticas, Universidad Autónoma de Nuevo León, San Nicolás de los Garza 66455, Mexico
2
Laboratorio de Investigación de Fisicoquímica y Materiales, Instituto Politécnico Nacional-ESIQIE, Unidad Profesional Adolfo López Matteos (UPALM), Mexico City 07738, Mexico
3
Laboratorio de Electroquímica y Corrosión, Instituto Politécnico Nacional-ESIQIE, Unidad Profesional Adolfo López Matteos (UPALM), Mexico City 07738, Mexico
*
Authors to whom correspondence should be addressed.
Electrochem 2025, 6(1), 7; https://doi.org/10.3390/electrochem6010007
Submission received: 3 December 2024 / Revised: 23 February 2025 / Accepted: 28 February 2025 / Published: 5 March 2025

Abstract

:
The electrocatalytic reduction of nitric oxide and nitrogen dioxide (NOx) remains a significant challenge due to the need for stable, efficient, and cost-effective materials. This study presents a novel support system for NOx reduction in alkaline media, composed of ZrO2-WO3-C (ZWC), synthesized via coprecipitation. Platinum nanoparticles (10 wt.%) were loaded onto ZWC and Vulcan carbon support, using similar methods for comparison. Comprehensive physicochemical and electrochemical analyses (N2 physisorption, XRD, XPS, SEM, TEM, and cyclic and linear voltammetry) revealed that PtZWC outperformed PtC and commercial PtEtek in NOx electrocatalysis. Notably, PtZWC exhibited the highest total electric charge for NOx reduction. At the same time, the hydrogen evolution reaction (HER) was shifted to more negative cathodic potentials, indicating reduced hydrogen coverage and a modified dissociative Tafel mechanism on platinum. Additionally, the combination of WO3 and ZrO2 in ZWC enhanced electron transfer and suppressed HER by reducing NO and hydrogen atom adsorption competition. While the incorporation of WO3 and ZrO2 lowered the surface area to 96 m2/g, it significantly improved pore properties, facilitating better Pt nanoparticle dispersion (3.06 ± 0.85 nm, as confirmed by SEM and TEM). XRD analysis identified graphite and Pt phases, with monoclinic WO3 broadening PtZWC peaks (20–25°). At the same time, XPS confirmed oxidation states of Pt, W, and Zr and tungsten-related oxygen vacancies, ensuring chemical stability and enhanced catalytic activity.

1. Introduction

According to data from EDGAR (Emissions Database for Global Atmospheric Research), the global emission of NOx reached approximately 113 million tons in 2020; these emissions have increased alarmingly since 1970 by around 50%, where transport is the principal source of NOx emissions (37%) [1]. In 2023, only one in four new cars sold was electric, bringing the total electric vehicles in circulation to just 4% globally [2]. As a result, NOx emissions remain a significant public health concern. While NOx gases are not direct greenhouse gases, they react with volatile organic compounds (VOCs) to form tropospheric ozone (O3), a potent greenhouse gas that indirectly contributes to climate change [3]. NOx compounds have a direct and harmful impact on human health. For instance, the primary species formed, NO2 and NO, are known to trigger asthma, cause cardiovascular issues, and impair lung development in children [4]. Selective catalytic reduction (SCR) is the most common method for NOx abatement. However, research indicates that it requires high operational temperatures and is often insufficient to meet diesel vehicles’ latest NOx emission standards [5]. Electrochemical reduction offers a more energy-efficient alternative due to its energy efficiency, operation under milder conditions, and ability to enable direct control of reaction pathways. In this approach, the diffusion of NO and NO2 gas into an alkaline electrolyte, such as sodium hydroxide (NaOH), is crucial in facilitating its reduction at the electrode surface. Alkaline media, particularly NaOH, are favorable for this process because they provide an environment in which hydrogen adsorption (Hads) is scarce, reducing NOx more selectively towards nitrogen-containing products [6]. The electrolyte aids in stabilizing intermediates and enhancing the transfer of electrons necessary for the reaction.
However, efficient NO and NO2 reduction requires a highly active and efficient electrocatalyst.
Carbon-based materials, mainly Vulcan carbon, have been extensively utilized as support for electrocatalysts owing to their exceptional conductivity, large surface area, and structural stability [7]. While platinum nanoparticles display excellent catalytic properties, their strong selectivity toward the hydrogen evolution reaction (HER) makes them less suitable for NOx reduction, as HER competes directly with the desired reduction pathways [8]. The NO reduction mechanism on Pt follows two fundamental pathways: the dissociative (direct) and associative (indirect) mechanisms [6,9]. In the dissociative route, NO molecules undergo bond cleavage before hydrogenation, while in the associative route, NO remains intact and is hydrogenated step by step. The hydrogenation mechanism plays a crucial role in product formation, with Pt favoring both the dissociative-Tafel (D-T) and associative-Tafel (A-T) mechanisms. The efficiency of these mechanisms is largely dictated by hydrogen coverage on the Pt surface. However, excessive hydrogen coverage can suppress NO reduction, necessitating the incorporation of materials that can modulate hydrogen adsorption and reactivity. A composite of zirconium oxide (ZrO2) and tungsten trioxide (WO3) with Vulcan carbon was proposed to overcome this limitation. The ZrO2 and WO3 exhibit distinct electrochemical properties that, when combined, generate a synergistic effect. ZrO2 is renowned for its exceptional thermal and chemical stability and its ability to reduce nitrogen and store oxygen in electrochemical applications [10,11].
Tungsten trioxide (WO3) is an exceptional modulator of hydrogen atom adsorption and significantly contributes to catalytic processes through the spillover effect, facilitating electron transfer via oxygen vacancies [12]. When WO3 is solely present, it enables the conversion of water molecules to adsorb hydrogen atoms and promotes the hydrogen evolution reaction (HER) [13,14,15,16]. However, the incorporation of zirconium dioxide (ZrO2) mitigates this effect and aids in modulating hydrogen adsorption. This study employed a detailed nanostructure of WO3 to reduce the concentrations of NO and NO2 species in the gas phase to dissolve in the NaOH electrolyte by optimizing the surface coordination of ZrO2-WO3 mixed oxide nanostructures. The modification enhances the adsorption and activation of NO and NO2 and suppresses the HER by the low coverage, while Vulcan carbon serves as an electrically conductive medium for electron transfer, improving the overall reaction efficiency.

2. Materials and Methods

2.1. Synthesis of the ZWC Support

The ZWC support was synthesized using a coprecipitation method with a composition of 5 wt.% ZrO2, 25 wt.% WO3, and 70 wt.% Vulcan carbon XC-72R. To prepare the precursor solutions, 0.3 M zirconium chloride (ZrOCl2·xH2O) and 0.05 M ammonium metatungstate ((NH4)6W12O39·xH2O) were used. Additionally, 0.2 M hexadecyltrimethylammonium bromide (CTAB) served as the surfactant, and 2 M ammonium hydroxide (NH4OH) was used as the precipitant. All chemicals were obtained from Merck (formely Sigma-Aldrich), Darmstadt, Germany. The synthesis began by mixing the zirconium chloride solution with Vulcan carbon and stirring for 10 min. Afterward, the ammonium metatungstate solution was added to the mixture and stirred thoroughly. Subsequently, CTAB was introduced, and the mixture was agitated for 10 min to ensure uniform dispersion of precursors. The mixture was then left undisturbed for 16 h, allowing the formation of a precipitate.
The precipitate was washed with distilled water using a Büchner funnel and Kitasato system until the pH of the wash water stabilized at 7 to remove residual surfactants and precipitant agents from the sample.
Subsequently, the ZWC was subjected to thermal treatment at 350 °C in a tubular furnace under a nitrogen flow of 1 L·min−1 to achieve the crystalline phase required for the mixed oxide. Nitrogen flow prevented carbon oxidation and preserved the structural integrity of the Vulcan carbon while facilitating the crystallization of ZrO2 and WO3 phases. This controlled environment was critical for maintaining the textural and structural properties of the ZWC composite material.
The methodology was designed to ensure the uniform deposition of ZrO2 and WO3 on the Vulcan carbon, while the nitrogen flow treatment minimized thermal degradation or oxidation of the carbon support.

2.2. Synthesis of the PtC and PtZWC Materials

Platinum nanoparticles were added to standard support (Vulcan carbon) and the support proposed by the impregnation method. Sodium hexachloroplatinate hexahydrate (Na2PtCl6·H2O) was used as the precursor of platinum nanoparticles, while sodium borohydride (NaBH4) was utilized as a reducing agent. Initially, the Vulcan carbon XC-72R carbon is mixed with 20 mL of CH3OH methanol (Fermont 99%) and kept under an argon atmosphere at 70 °C with continuous stirring for 1 h. Then, sodium hexachloroplatinate was dissolved with 10 mL of methanol and stirred for 1 h, following the added carbon solution. Afterward, the reducing agent was added and stirred for 2 h. Finally, the material was rinsed and dried at 80 °C for 12 h.
The synthesis of the PtZWC, PtZC, and PtWC electrocatalyst was prepared following the same process described for the PtC material, with the difference that the synthesized support is added instead of the Vulcan carbon.

2.3. Materials Characterization

The textural properties of ZWC and Vulcan carbon were obtained with Micromeritics ASAP 2000 (Micromeritics, Norcross, GA, USA) equipment. Both materials were pretreated in a vacuum at 120 °C for 12 h. The specific area was calculated using the Brunauer–Emmett–Teller (BET) equation, and pore size distribution was calculated by the Barrett, Joyner, and Halenda (BJH) method. For the X-ray diffraction analysis, Bruker Advance X-ray Diffractometer (Bruker, Billerica, MA, USA) with Cu Kα radiation (λcu = 1.54 Å) was used only for the electrocatalysts. The diffractograms were obtained from 10° to 80° at a scanning speed of 0.4°/min and an angular resolution of 0.02°. The XPS spectra was performed on aThermo Fischer Scientific spectrometer with a Kα Al monochromator (eV voltage) (Thermo Fischer Scientific, Waltham, MA, USA). Before the analysis, the samples remained in a vacuum chamber connected directly to the equipment for 10 h; later, they were transferred to the equipment with a constant pressure of 1 × 10⁻⁹ Torr.
The Energy Dispersive X-ray Spectroscopy (EDS) analysis was performed using an EDAX system (Energy Dispersive Analysis of X-rays, EDAX Inc., Mahwah, NJ, USA), coupled to a Scanning Electron Microscope (SEM), JEOL 7800 FEG-SEM (JEOL Ltd., Tokyo, Japan), operating at 20 kV. The study was done in ten zones of each sample. For the sample preparation, carbon tape fixed the material onto a holder.
A JEOL JEM-ARM 200CF transmission electron microscope (JEOL Ltd., Tokyo, Japan), operating at 200 kV was employed for high-resolution transmission electron microscopy (HR-TEM) analysis. The point resolution was 0.085 nm. PtC and PtZWC powders were dispersed in isopropanol, and a drop of the solution was placed onto a copper grid with a holey carbon film for observation. HR-TEM images were captured using a CCD camera (HR-TEM, JEOL JEM-ARM 200CF sourced from JEOL Ltd., Tokyo, Japan) and analyzed with Digital Micrograph software(Gatan Ametek, Version 3.60.4441.0, Gatan Inc., Pleasanton, CA, USA). Approximately 300 nanoparticles were measured from 32 micrographs to estimate the average particle size for each sample.

2.4. Electrochemical Evaluation

The experiments were carried out in a three-standard electrochemical cell, and the electrochemical measurements were performed using a potentiostat-galvanostat (VersaStat3, Princeton Applied Research, AMETEK Scientific Instruments, Oak Ridge, TN, USA). All the electrochemical experiments were maintained at room temperature. A graphite bar and a reversible hydrogen electrode (RHE) were employed as the counter and reference electrodes, respectively. The working electrode was prepared by depositing a catalyst ink onto a polished glassy carbon (GC) electrode (geometric area of 0.196 cm2). The GC electrode was polished to a mirror finish using 0.05 μm of Al2O3 suspension and rinsed thoroughly with deionized water (18.2 MΩ). The catalyst ink was prepared by dispersing of 5 mg of the electrocatalyst in a mixture of 70 μL of Nafion solution (5 wt.%, Sigma Aldrich), 750 μL of ethanol (99.8% Sigma Aldrich), and 250 μL of deionized water (18.2 MΩ). The electrochemical ink was sonicated for one hour to ensure homogeneity. An aliquot of 8 μL of electrochemical ink was deposited on the transverse surface of the GC using a micropipette to obtain the working electrode. Afterward, the working electrode dried under a gentle argon flow for 10 min. The Pt mass loading for each sample was calculated using Equation (1).
P t m g = A l i q u o t   m L × M a s s   o f   c a t a l y s t   i n   t h e   i n k   m g T o t a l   v o l u m e   o f   t h e   i n k   m L × P e r c e n t a g e   o f   p l a t i n u m   r e a l 100
The current was normalized to the platinum mass loading for each sample to evaluate the role of the ZWC support in the nitric oxide reduction (NOR) and the mixture of nitrogen oxides (NOxR) by the electrochemical analysis.
The dlectrochemically active surface area (ECSAH and ECSACO) of the electrocatalysts was determined using cyclic voltammetry technique in an electrolytic solution of 0.5 M H2SO4 at a scanning speed of 0.2 Vs−1. The electrolyte was prepared by adding 27.2 mL of concentrated sulfuric acid (98%, Sigma-Aldrich) to deionized water, bringing the final volume to 1 L. Before each experiment, the electrolyte was purged with argon for 10 min to remove dissolved oxygen. The working electrode was maintained at 0.2 V/RHE potential, while the electrolytic solution was saturated with CO for 5 min to ensure CO adsorption onto the active sites of the electrocatalyst. Subsequently, the electrolytic solution was bubbled with argon to desorb excess CO. Employing two cycles of the cyclic voltammetry technique at 0.2 mVs−1, the results were obtained; in the first cycle, a characteristic peak of CO oxidation was observed, and the ECSA was determined.
For cyclic voltammetry (CV) and the application of electrochemical reduction of NOx, 0.5 M NaOH was used. The electrolyte was prepared by dissolving 20 g of NaOH (Sigma Aldrich, ≥98%) in deionized water to a final volume of 1 L. Before the experiment, 50 mL of electrolyte was purged with argon for 30 min to remove the dissolved oxygen.
For the electrochemical reduction of nitric oxide (NO), a gas mixture containing 10% NO and 90% argon (provided by INFRA) was employed. The solubility of NO in water at room temperature is 1.92 mmol L−1 atm−1 [17]. The gas was introduced into the washing system’s solution until saturation under open-circuit potential (OCP) conditions.
For the reduction of nitrogen dioxide (NO2) gas, NOx generation was based on the dissolution of metallic copper in concentrated nitric acid as described in previous studies [18,19,20]. Specifically, 0.75 g of metallic copper (Condumex, Mexico City, Mexico, 99.9%) was reacted with 6 mL of concentrated nitric acid (Sigma Aldrich 70%) in a closed flask. The gas mixture produced by this reaction was directly injected into the electrolyte contained in the electrochemical cell under OCP constant to ensure saturation. The reaction primarily produces nitrogen dioxide (NO2) gas (Equation (2)), but studies indicate that nitric oxide (NO) and nitrous oxide (N2O) are also generated [20].
Cu(S) + 4HNO3(aq) → Cu(NO3) + 2NO2(g) + 2H2O(aq)
For this study, the NOx generation system was allowed to react for 5 min, after which 10 mL of the gas mixture (containing NO2, NO, and trace amounts of N2O) was collected and injected directly into the 50 mL electrolyte solution of the electrochemical cell. According to the literature, the proportions of gases generated by 14 M of HNO2 during this reaction were as follows: NO2: 152.35 ppm, NO: 206.55 ppm, and N2O: 9.192 ppm [20].
Considering Henry’s law constant for each gas (kHNO2 = 1.2 × 10⁻² [21], kHNO = 1.92 × 10⁻³ [17], and kHN2O = 2.5 × 10⁻² [21] mmol L−1 atm−1) and the volume of the electrolyte (50 mL), the dissolved moles were obtained 9.14 × 10⁻⁸ of NO2, 5.40 × 10⁻⁵ of NO, and 3.13 × 10⁻⁵ of N2O. These results indicate that NO was the principal gas dissolved in the electrolyte.

3. Results and Discussion

3.1. Textural Properties; Nitrogen Adsorption

The textural properties of Vulcan carbon and ZWC supports were analyzed using nitrogen adsorption. The ZWC was treated thermally at 350 °C under a nitrogen atmosphere. For comparison, Vulcan carbon was also subjected to the same thermal treatment (350 °C) and atmosphere to ensure that the heat did not degrade its textural properties and to analyze the effect of thermal treatment on the ZrO2-WO3-Vulcan carbon composite.
The data obtained are summarized in Table 1, and the adsorption/desorption isotherms can be observed in Figure 1. The untreated Vulcan carbon exhibits a specific surface area of 240 m2/g, as determined using the Brunauer–Emmett–Teller (BET) method [22]. After thermal treatment at 350 °C, an increment in pore size is observed, accompanied by a rise in the specific surface area to 352 m2/g, as depicted in the inset of Figure 1b. This enhancement in surface area is attributed to the cleaning effect of nitrogen flow during thermal treatment, which removes impurities and exposes additional surface area for adsorption [23].
Thermal treatment does not degrade the textural properties of Vulcan carbon but instead enhances its surface characteristics, making it more suitable for applications requiring a high specific surface area.
Furthermore, Figure 1a shows the adsorption/desorption isotherm of the ZWC sample, which presents a broader pore size distribution characteristic of a Type IV isotherm [24]. The inset shows a lower pore volume adsorbed in the ZWC composite (~0.032 cm3 g−1 Å−1) compared to thermally treated Vulcan carbon (~0.21 cm3 g−1 Å−1), suggesting that the deposition of ZrO2 and WO3 on Vulcan carbon blocks the micropores, thereby reducing the specific surface area (SBET). This reduction aligns with the inherently low specific surface area of these oxide materials [25].
The redistribution of pore size in ZWC can be advantageous for electrocatalytic activity due to facilitating the diffusion of reactant molecules and enhancing their interaction with active sites from the electrocatalyst.

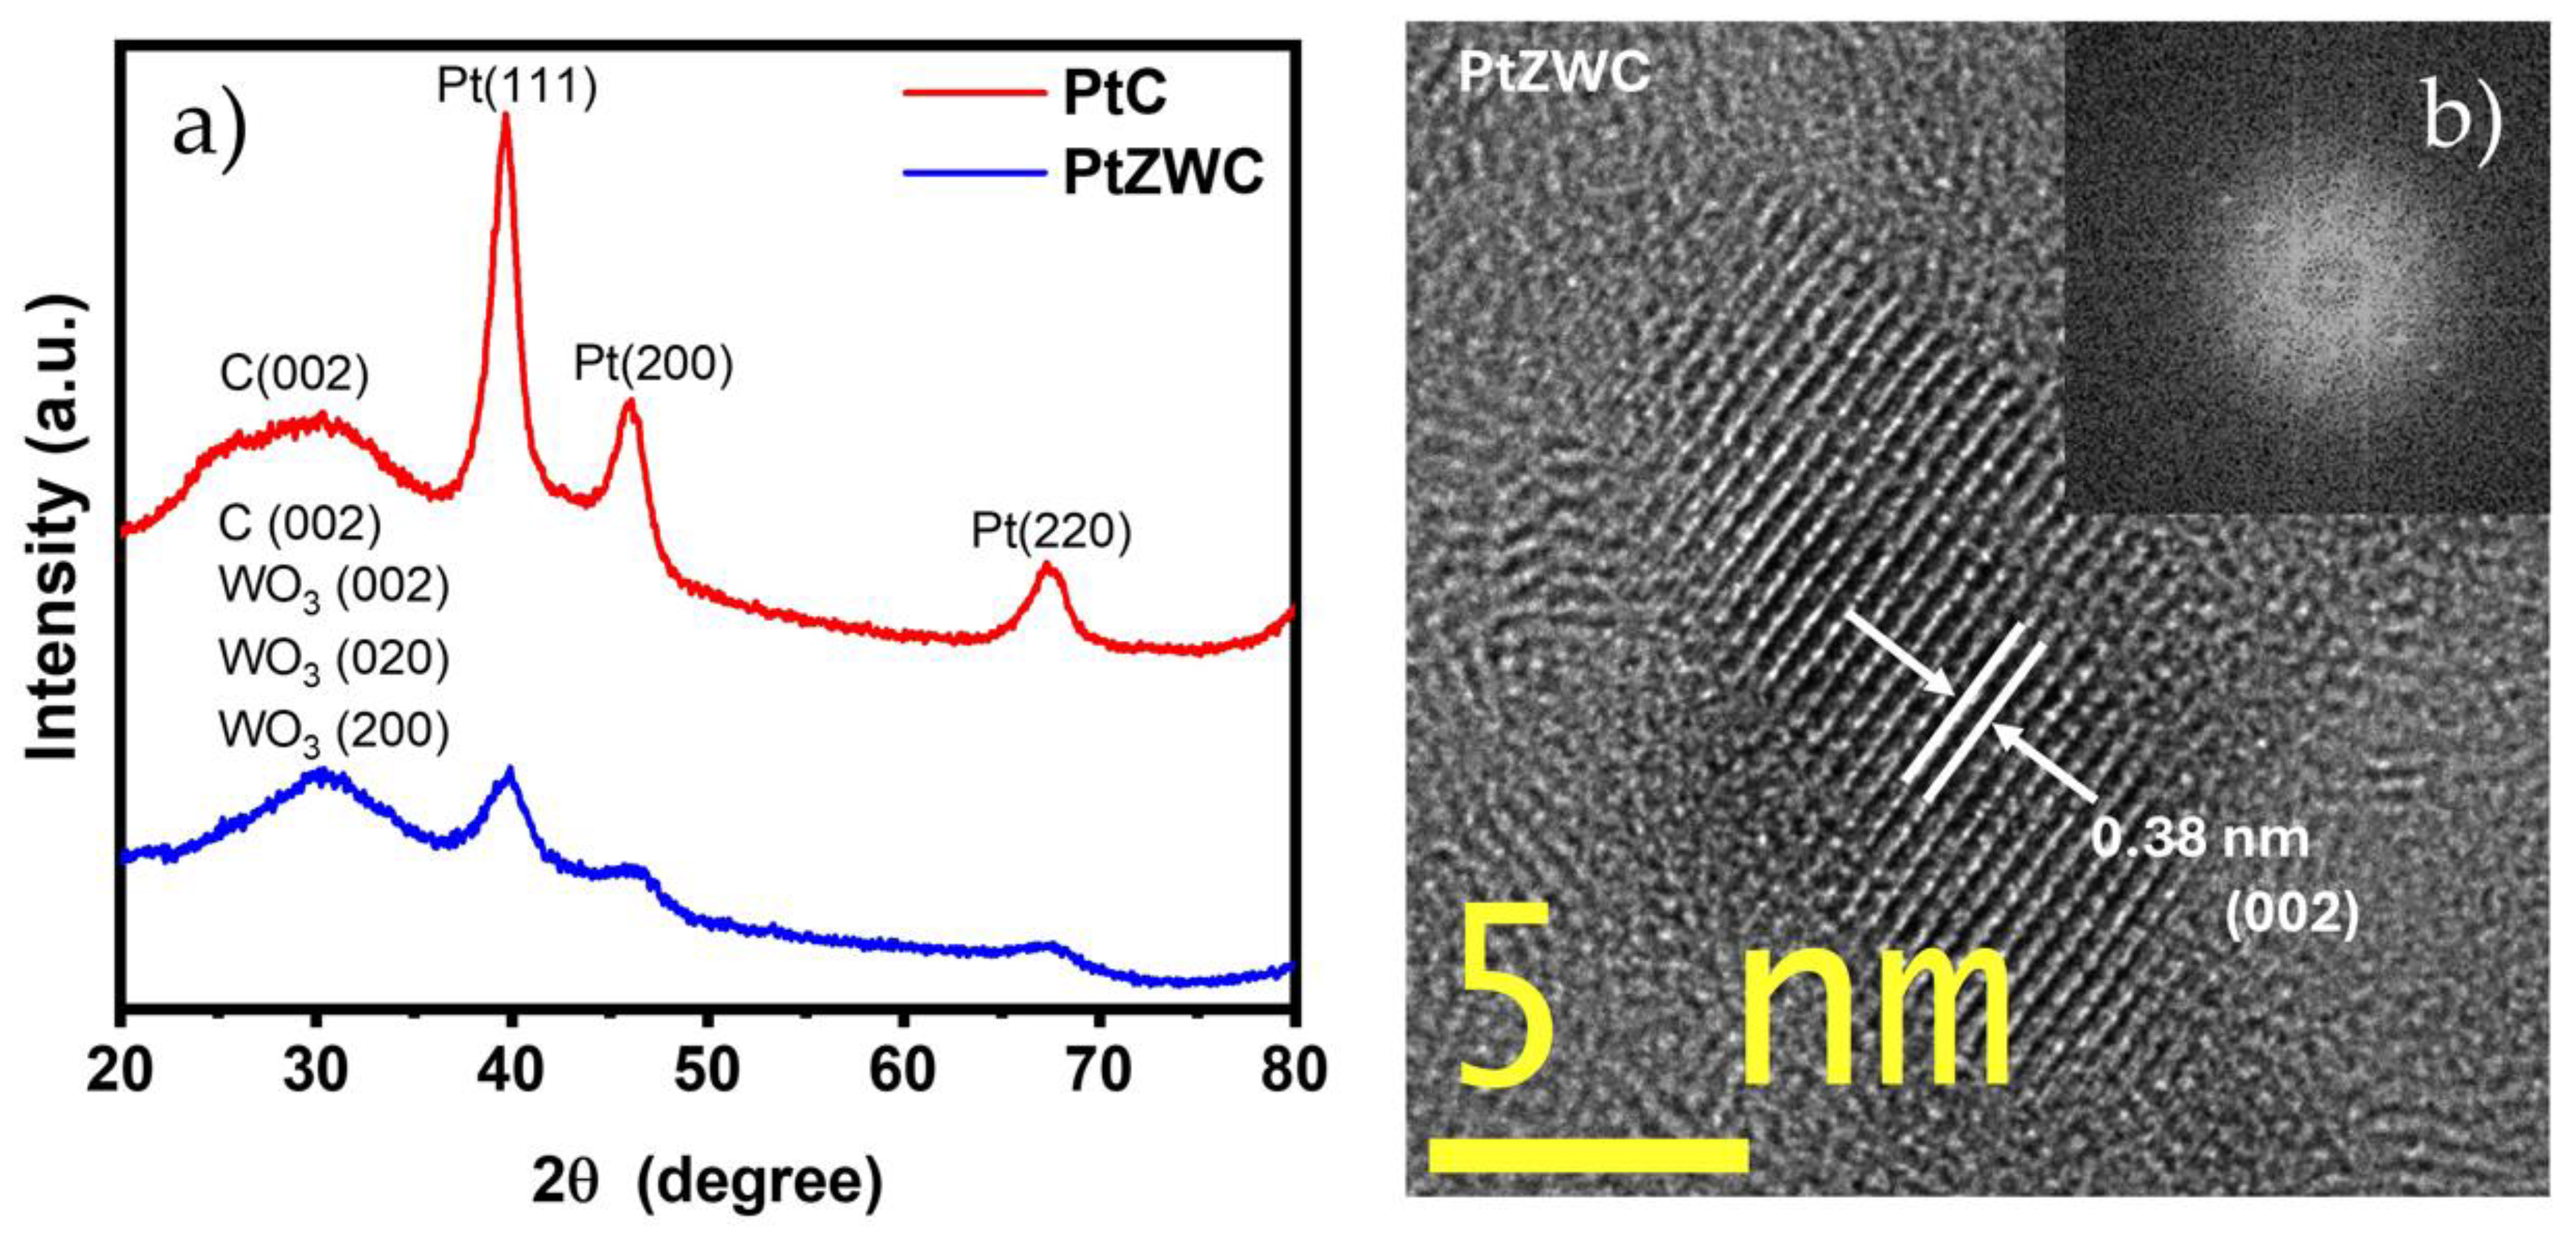
3.2. Crystal Phases; XRD and HRTEM Analysis

X-ray diffraction and [26] high-resolution transmission electron microscopy were performed to analyze the phases obtained. Figure 1a shows the diffraction patterns of the PtC and PtZWC materials. All the samples indicate diffraction peaks at 2Ө = 25.5° corresponding to reflection (002) of the graphite structure (JCPDS card No. 411487) referring to the Vulcan carbon [27,28]. The diffraction pattern of PtZWC exhibits a slightly more crystalline peak within the 2Ө range of 23–25°, which can be attributed to the overlapping of the monoclinic phase of tungsten oxide (JCPDS card No. 43-1035) and the graphite phase calcinated. To further characterize the crystalline structure of WO3, high-resolution transmission electron microscopy (HRTEM) was performed. Figure 2b confirms the monoclinic phase of WO3, as evidenced by the interplanar distance corresponding to the (002) plane of the monoclinic WO3 structure.
This crystallization suggests a high degree of interaction between the components, which may contribute to the enhanced electrocatalytic properties of the material. Regarding zirconium oxides, no diffraction peaks are observed, as their nominal amount is below the detection limits of the equipment. Additionally, diffraction signals are observed in 2Ө = 39.67°, 46.19° y 67.40° corresponding to reflections (111), (200), and (220), respectively, which are characteristic of metallic platinum [29]. The Scherrer Equation (3) was used to estimate the average crystallite [26].
D = K λ β c o s θ
where D represents the average crystallite size, K is an approximation of the shape (typically 0.9 for spherical particles), λ is the wavelength of Cu kα radiation ( λ = 0.15406 nm), β is the full width at half maximum (FWHM) of the diffraction signal in radians, and θ is the Bragg angle in radians. In this case, the analysis was performed for the (111) reflection of platinum.
The values obtained were 3.97 nm for PtC and 3.28 nm for PtZWC. Since a nanoparticle can be composed of multiple crystallites, the reduction in crystallite size suggests that the presence of ZWC promotes the formation of smaller crystallites.

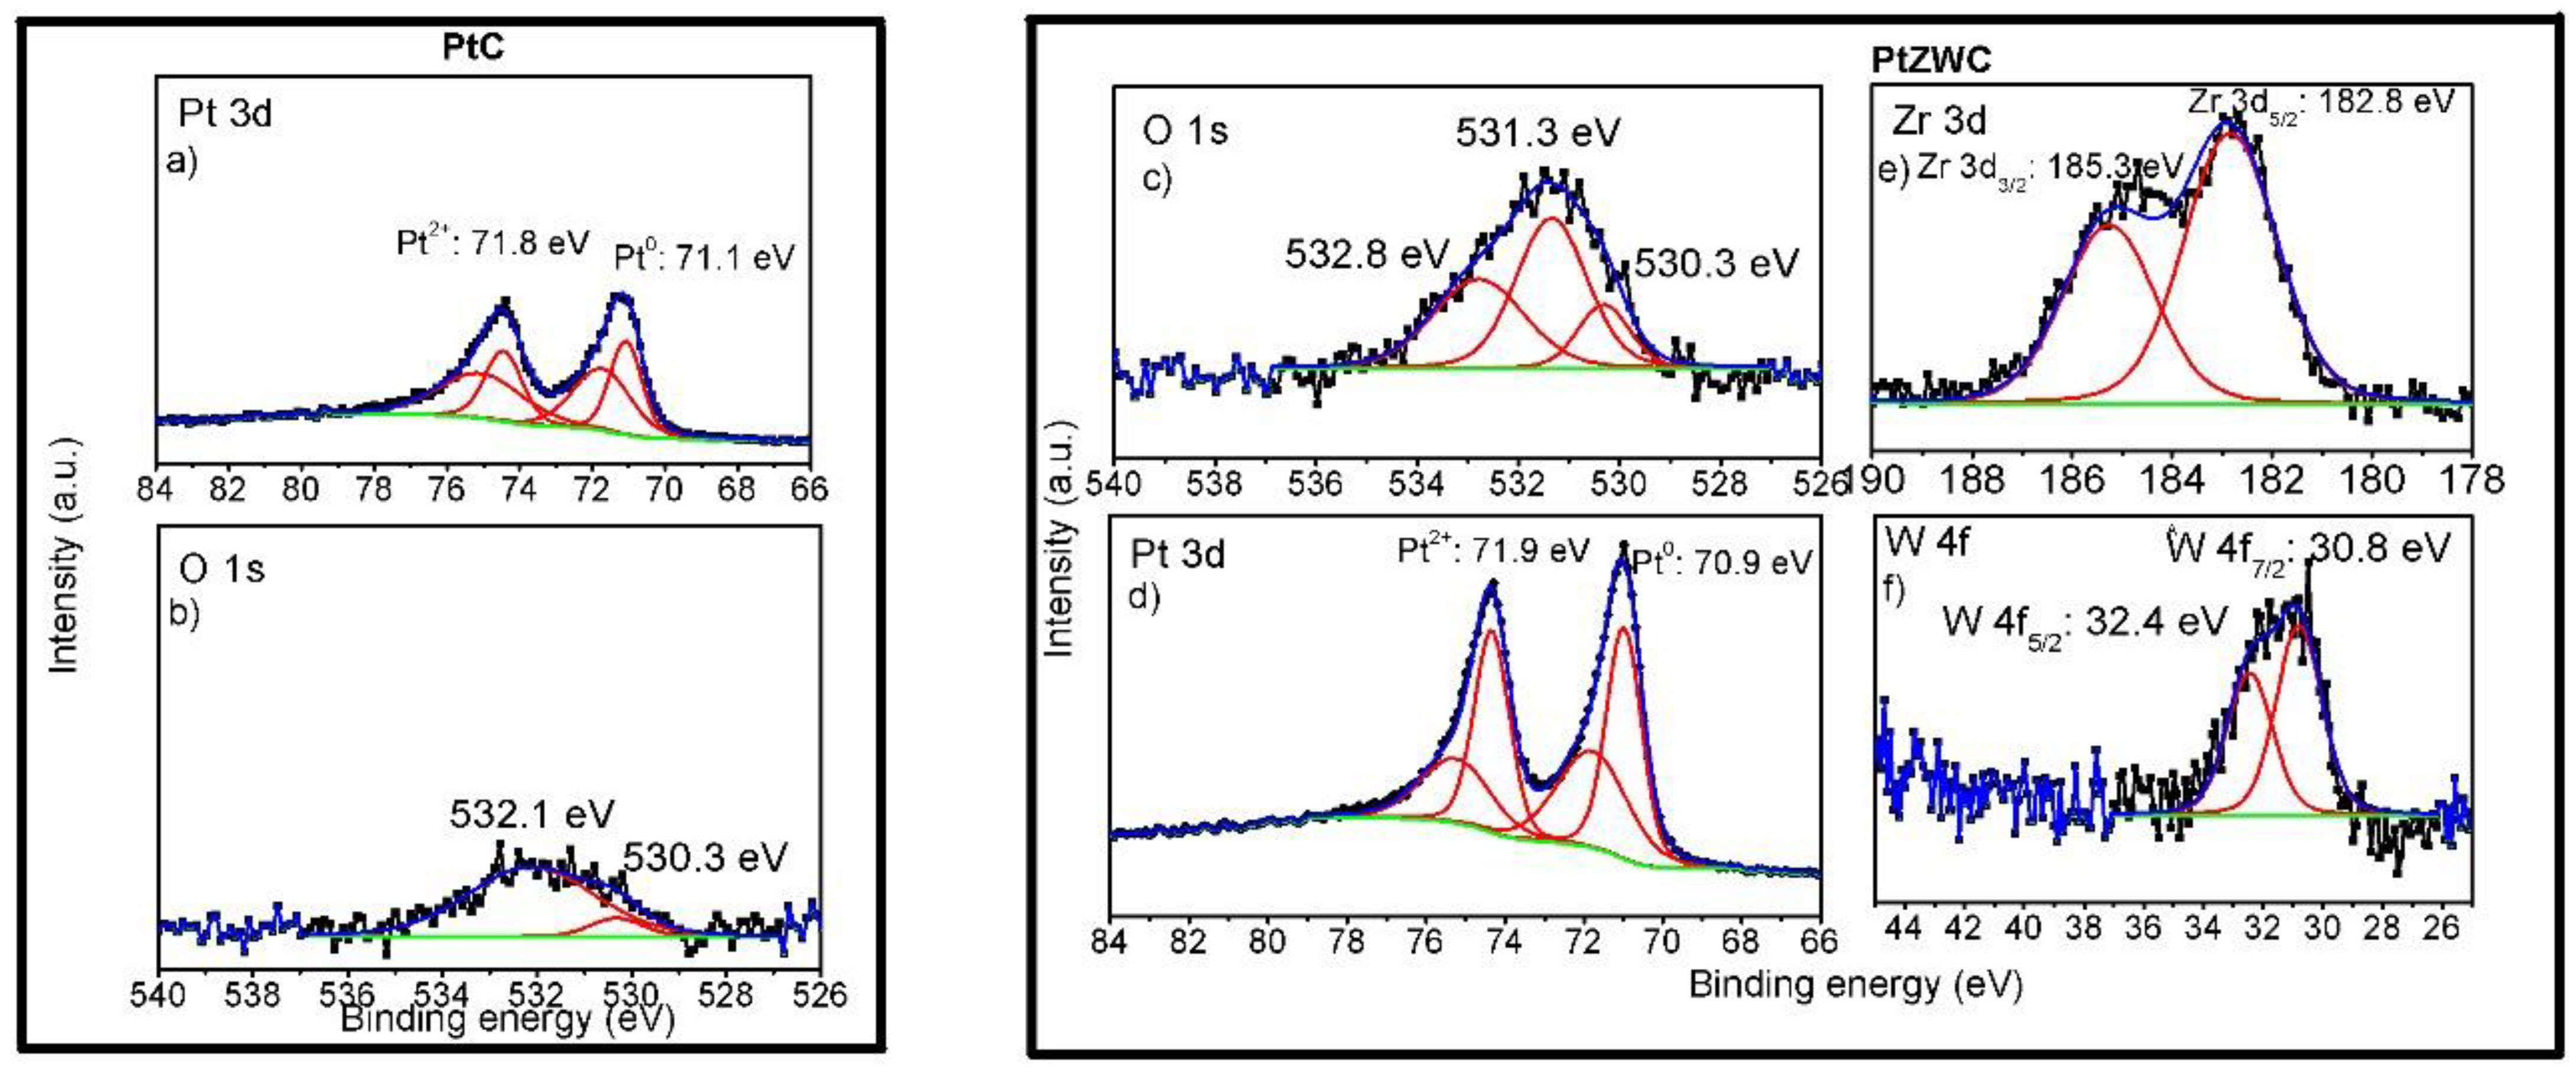
3.3. Surface Properties; X-Ray Photoelectron Spectroscopy

Figure 3 shows the XPS high-resolution spectra of the PtC and PtZW samples. All the peaks were charge-shifted concerning the C 1s core level, in which the adventitious carbon component with a binding energy of 284.6 eV was taken for reference. The corresponding photoelectron peaks and their respective deconvolutions are shown in the Figure SI.2. (Supplementary Information). From the PtC sample, the Pt 3d and O 1s core levels were measured. It can be observed that Pt has two photoelectron doublets: the Pt0 with a 3d5/2 component of 71.1 eV and a Pt2+ 3d5/2 component of 71.8 eV, which corresponds to the metallic Pt and Pt in oxidation state 2+. The area ratio for both doublets was kept as a 2:3 ratio, and the spin–orbit coupling component was maintained at 3.3 eV [28]. From the O 1s peak, a two-photoelectron peak can be observed, with a binding energy of 530.3 eV, which can be due to adsorbed oxygen on the surface of the sample and 532.1 eV from the Pt-O bond. For sample PtZW, the Pt 3d and O 1s core levels were measured, and the Zr 3d and W 4f core levels were measured. The feature of the Pt 3d shows two doublet photoelectron peaks with a 3d5/2 components of 71.1 eV and 71.8 eV, corresponding to the metallic platinum and Pt2+. The Zr 3d core level shows a photoelectron doublet with a 3d5/2 component of 182.8 eV and a 3d3/2 component of 185.36 eV, corresponding to the Zr-O bond in ZrO2 [29]. This indicates that the oxidation state of Zr is Zr4+, and the oxygen oxidation state is O2. This is confirmed by the O 1s core level, in which three photoelectron peaks are present with binding energies at 531.3 eV, due to the Zr-O bond, and at 532.8 eV corresponds to the sample’s O vacancies [29]. The peak at 530.3 eV might be due to adsor bed oxygen on the sample’s surface. The W 4f core level spectrum exhibits a doublet with a 4f7/2 component at 30.8 eV and a 4f5/2 component at 32.4 eV, consistent with the chemical environment of tungsten in WO3 [30]. The area ratio of the doublet was kept to a 3:4 relationship.

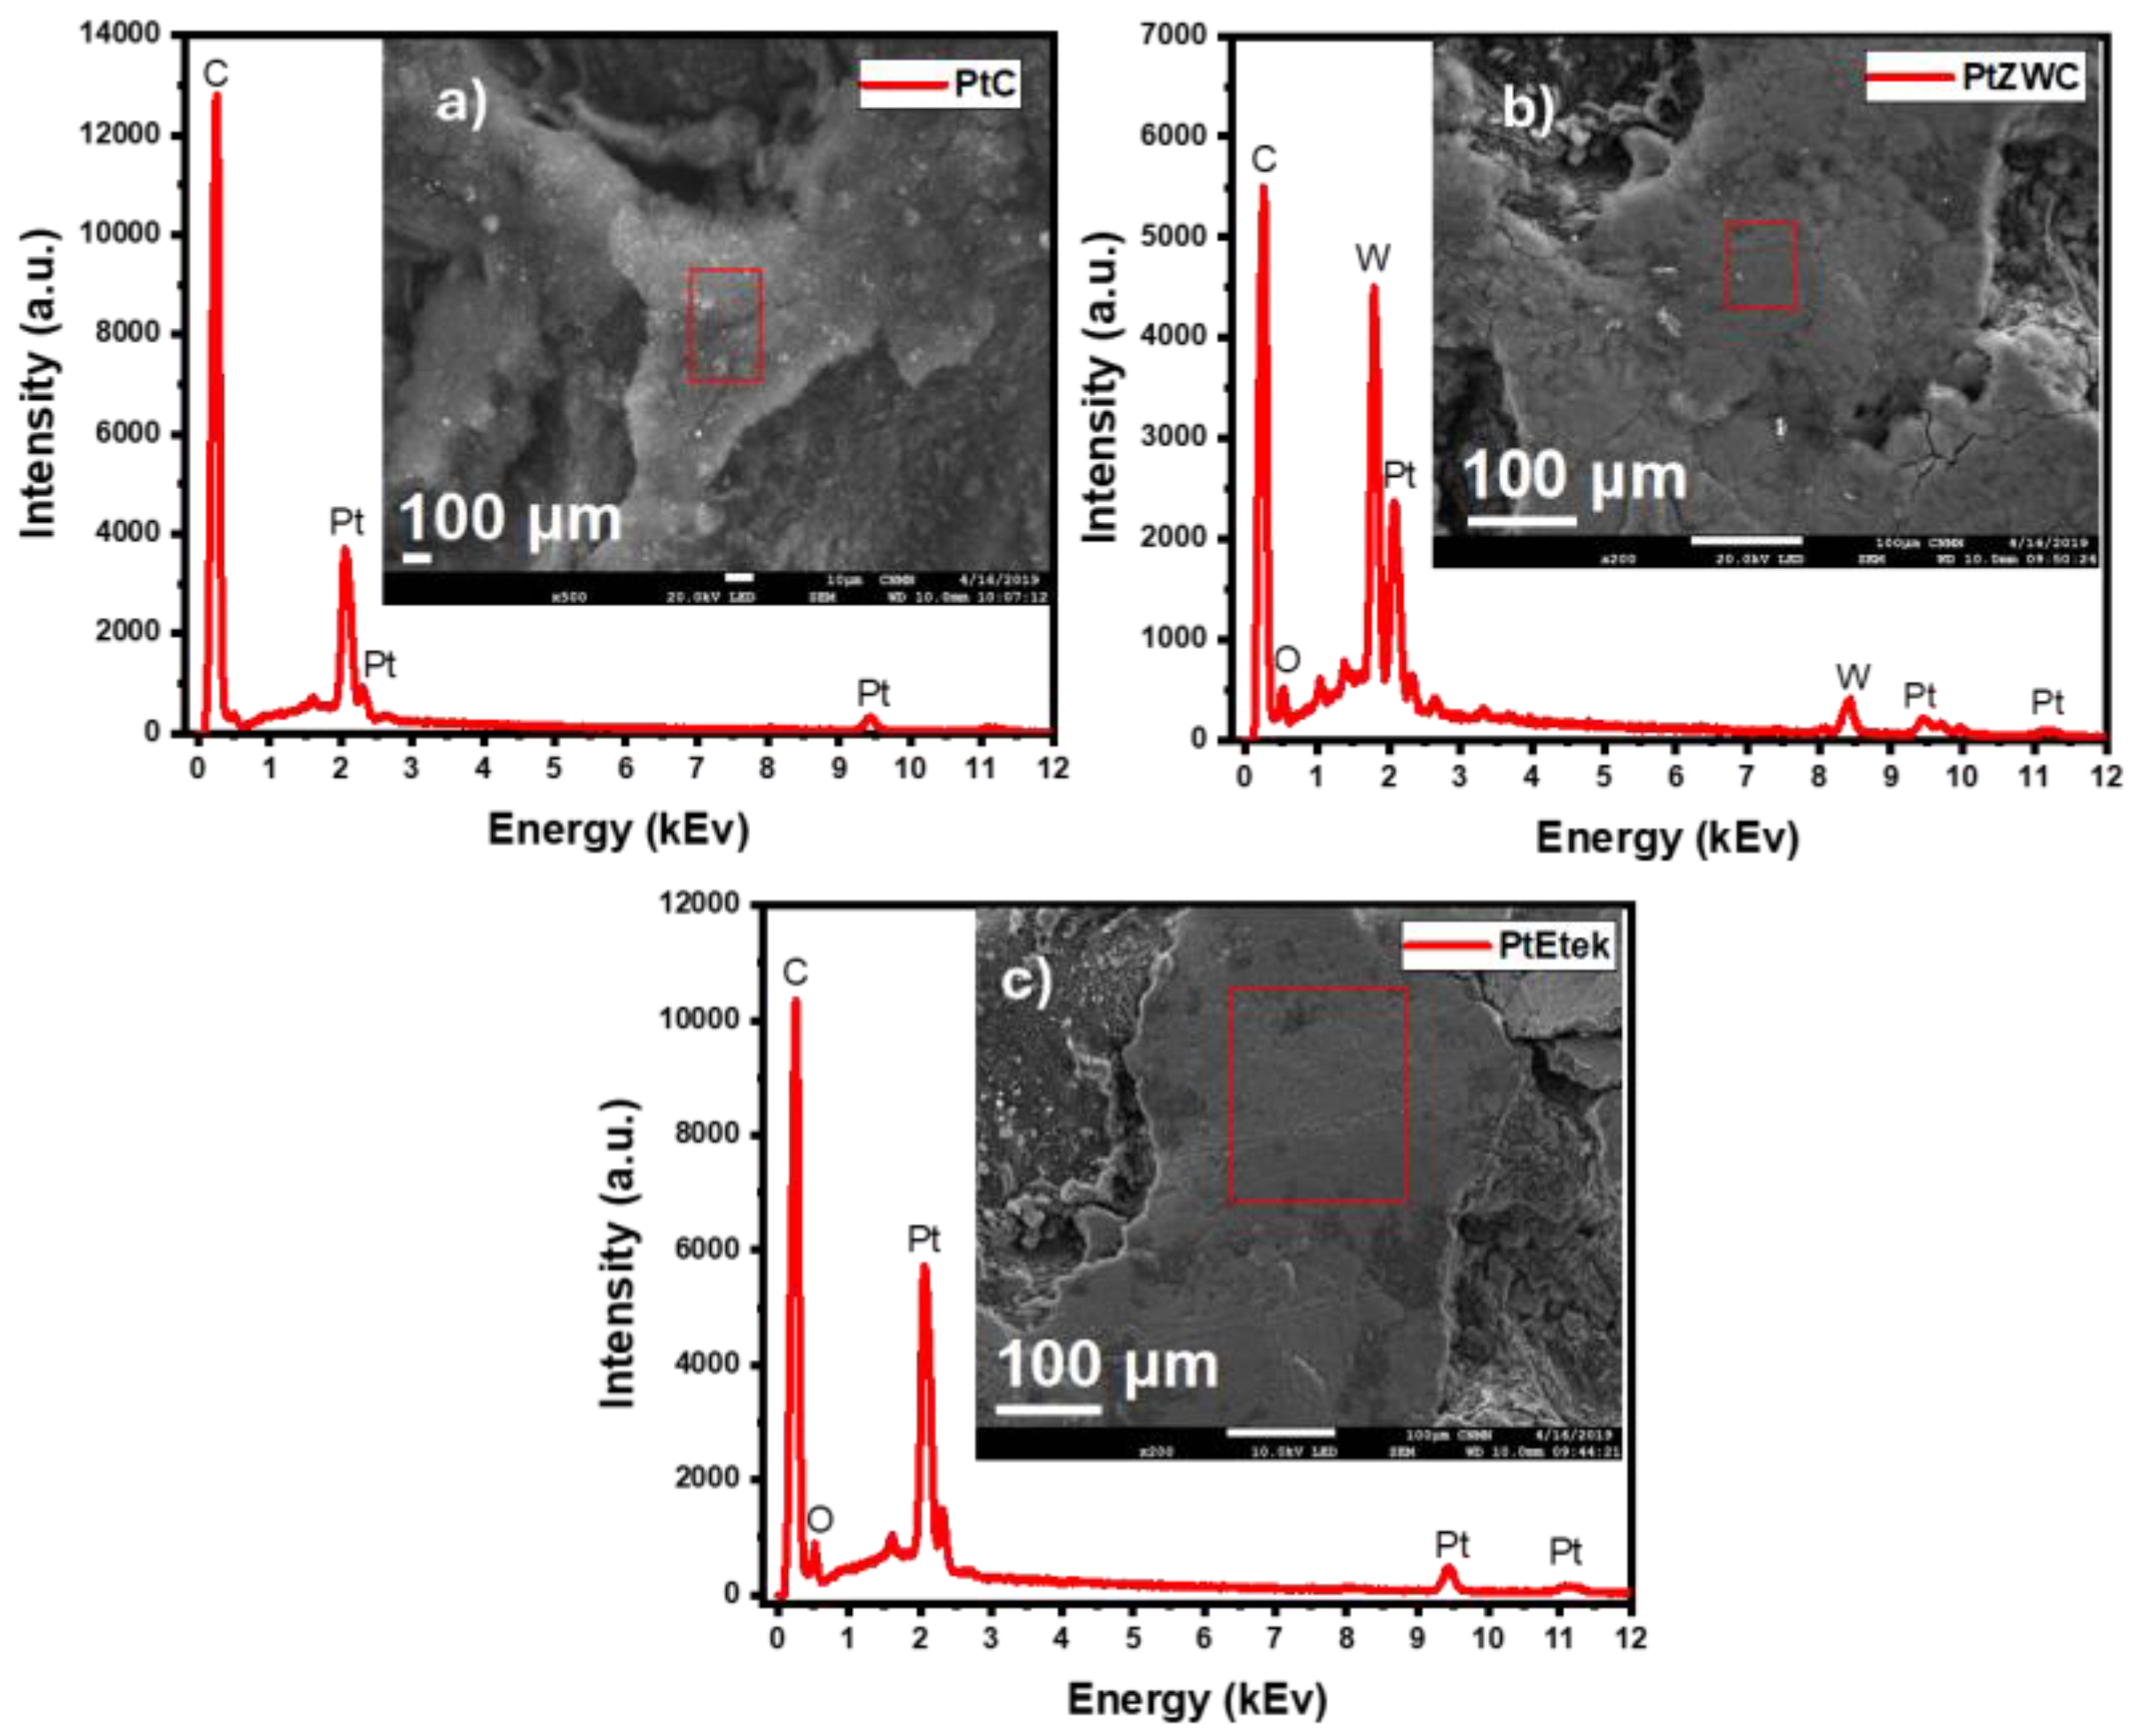
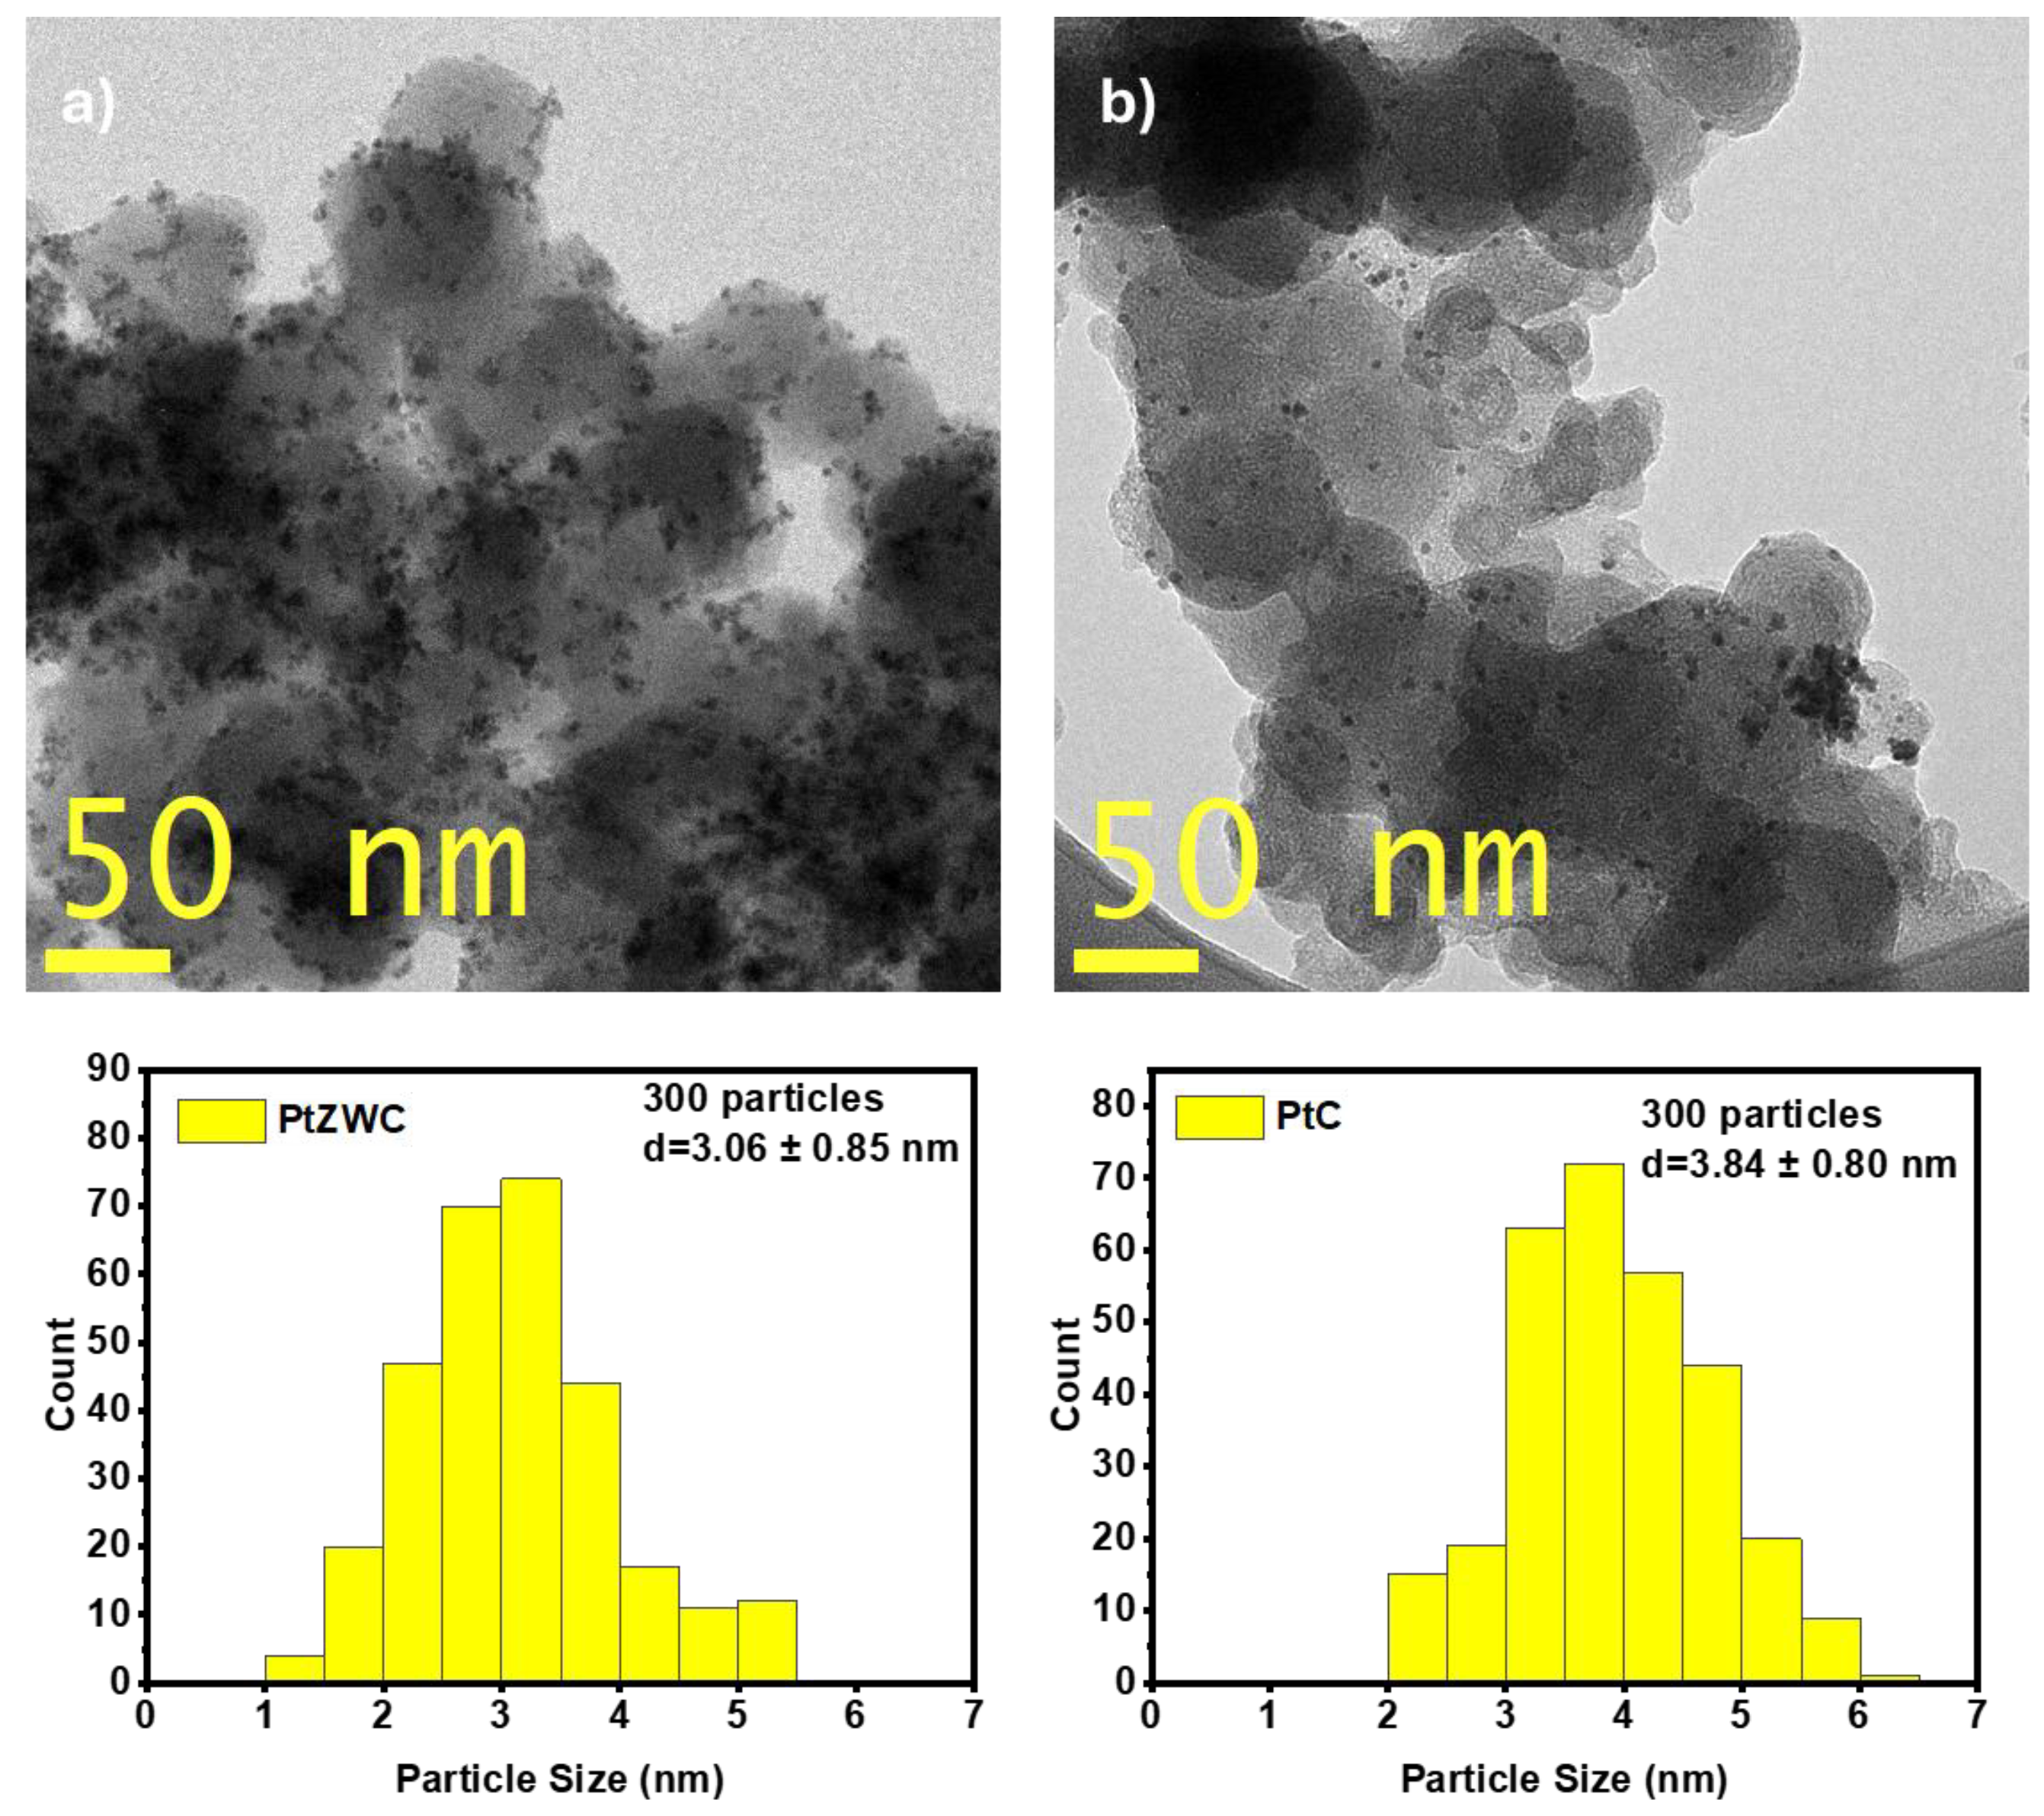
3.4. Morphology and Dispersion; SEM and TEM

The SEM-EDS technique was used to determine the chemical composition and morphology of the PtEtek, PtC, and PtZWC samples. The results are shown in Figure 4 and summarized in Table 2. Figure 4b shows the higher dispersion of platinum nanoparticles over ZrO2, WO3, and Vulcan carbon in comparison to PtC and PtEtek.
To examine the particle size distribution on the support material, transmission electron microscopy (TEM) was employed. Figure 5a,b presents the micrographs with the corresponding histogram. The platinum nanoparticles exhibit a spherical morphology for both samples, with a particle size distribution of 3.84 ± 0.80 nm, and 3.06 ± 0.85 nm related to Vulcan carbon and ZWC support, respectively.
The increase in pore size, achieved through the thermal treatment of Vulcan carbon and the addition of the ZWC promoter, plays a crucial role in improving electrocatalytic performance. These modifications lead to a more uniform dispersion of nanoparticles, as evidenced by a reduction in standard deviation and particle size, along with a slight increase in pore size. This optimized structure enhances the accessibility of active sites and facilitates efficient charge and mass transfer, which are vital for boosting reactivity during electrocatalytic reactions. The presence of well-anchored Pt nanoparticles in the porous channels not only improves the overall catalytic activity but also supports higher conversion rates and performance in electrocatalytic processes.
Therefore, while these structural changes enhance performance, the selectivity in reactions like NOx reduction can be further improved by introducing hydrogen adsorption modulators. By influencing the surface chemistry and reaction environment, these modulators can increase the selectivity toward desired reaction pathways, offering a pathway to optimize both reactivity and specificity. According to the characterization data, ZWC is a promising material for use as an electrocatalyst. However, careful modulation of hydrogen adsorption activity could further refine its selective performance, particularly in targeted reactions like NOx reduction. In this case, electrochemical characterization and electrochemical evaluation were achieved to show that the ZW increases the NOx reduction.

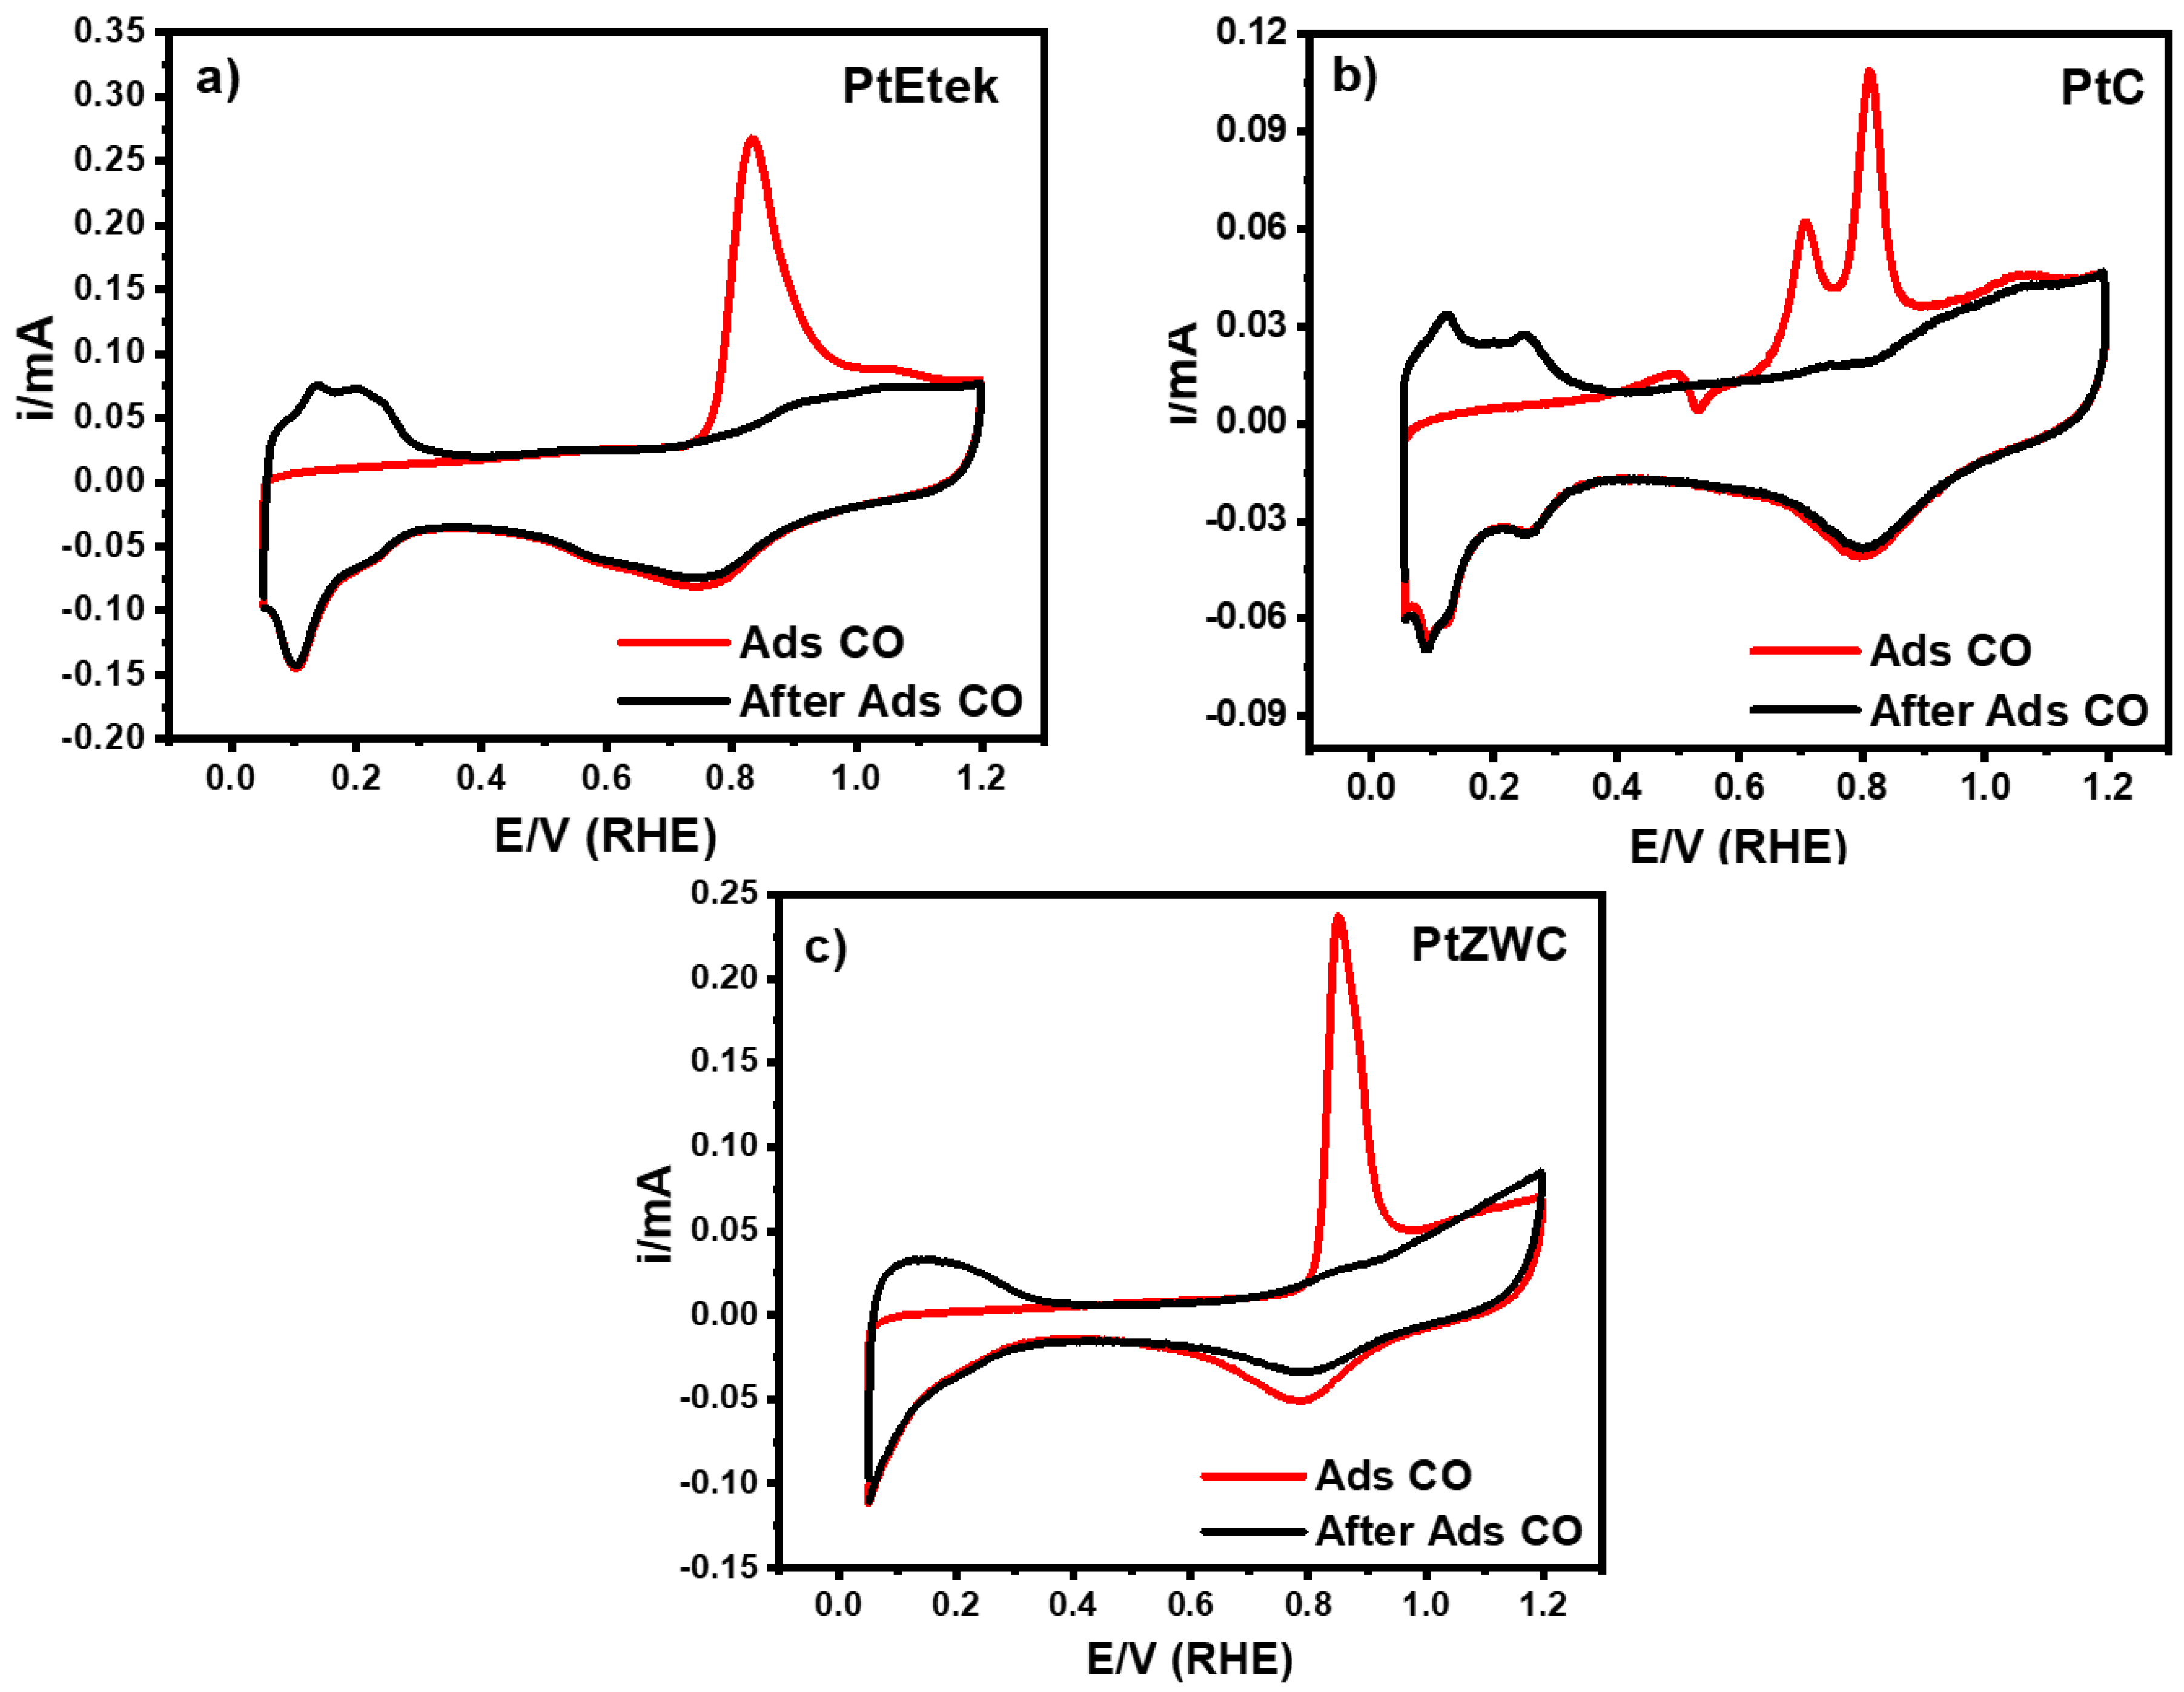
3.5. Electrochemical Properties

The electrochemically active surface area (ECSA) of the electrocatalysts was determined using cyclic voltammetry Figure 6. First, the charge (QH-desorption) was calculated by integrating the region of hydrogen desorption potential after the correction of the double layer. Subsequently, Equation (4) was used [10]. The results of the electrocatalysts are summarized in Table 2.
E C S A H m 2 g P t 1 = Q H d e s o r p t i o n   ( C ) 210   μ F   c m P t 2   L P t m g P t c m 2   A g c m 2 10 5
To check the ECSAH, the CO-stripping technique is performed. Similarly, the charge (QCO) was calculated by integrating the region of adsorption potential after the correction of the double layer. Finally, the ECSACO was obtained by Equation (5) [11].
E C S A C O m 2 g P t 1 = Q C O   ( C ) 420   μ F   c m P t 2   L P t m g P t c m 2   A g c m 2 10 5
The ECSA results for the tested materials are summarized in Table 2. The PtEtek sample exhibits the highest ECSA values, with an ECSAH of 39.56 m2/g and an ECSACO of 81.55 m2/g, which directly correlates with its high platinum loading (15.02 wt.%). This suggests that the increased availability of active Pt sites enhances its electrochemical performance. In contrast, PtC, which has a lower Pt content with 27.14 m2/g for ECSAH and 57.43 m2/g for ECSACO, shows reduced electrochemical activity due to a smaller number of active sites. Interestingly, PtZWC demonstrates improved performance compared to PtC, despite its lower Pt loading with an ECSAH of 37.51 m2/g and an ECSACO of 73.54 m2/g. This enhancement can be attributed to the presence of ZWC, which acts as a co-catalyst, promoting better Pt dispersion and modifying the electronic properties of the catalyst, ultimately improving its catalytic efficiency.

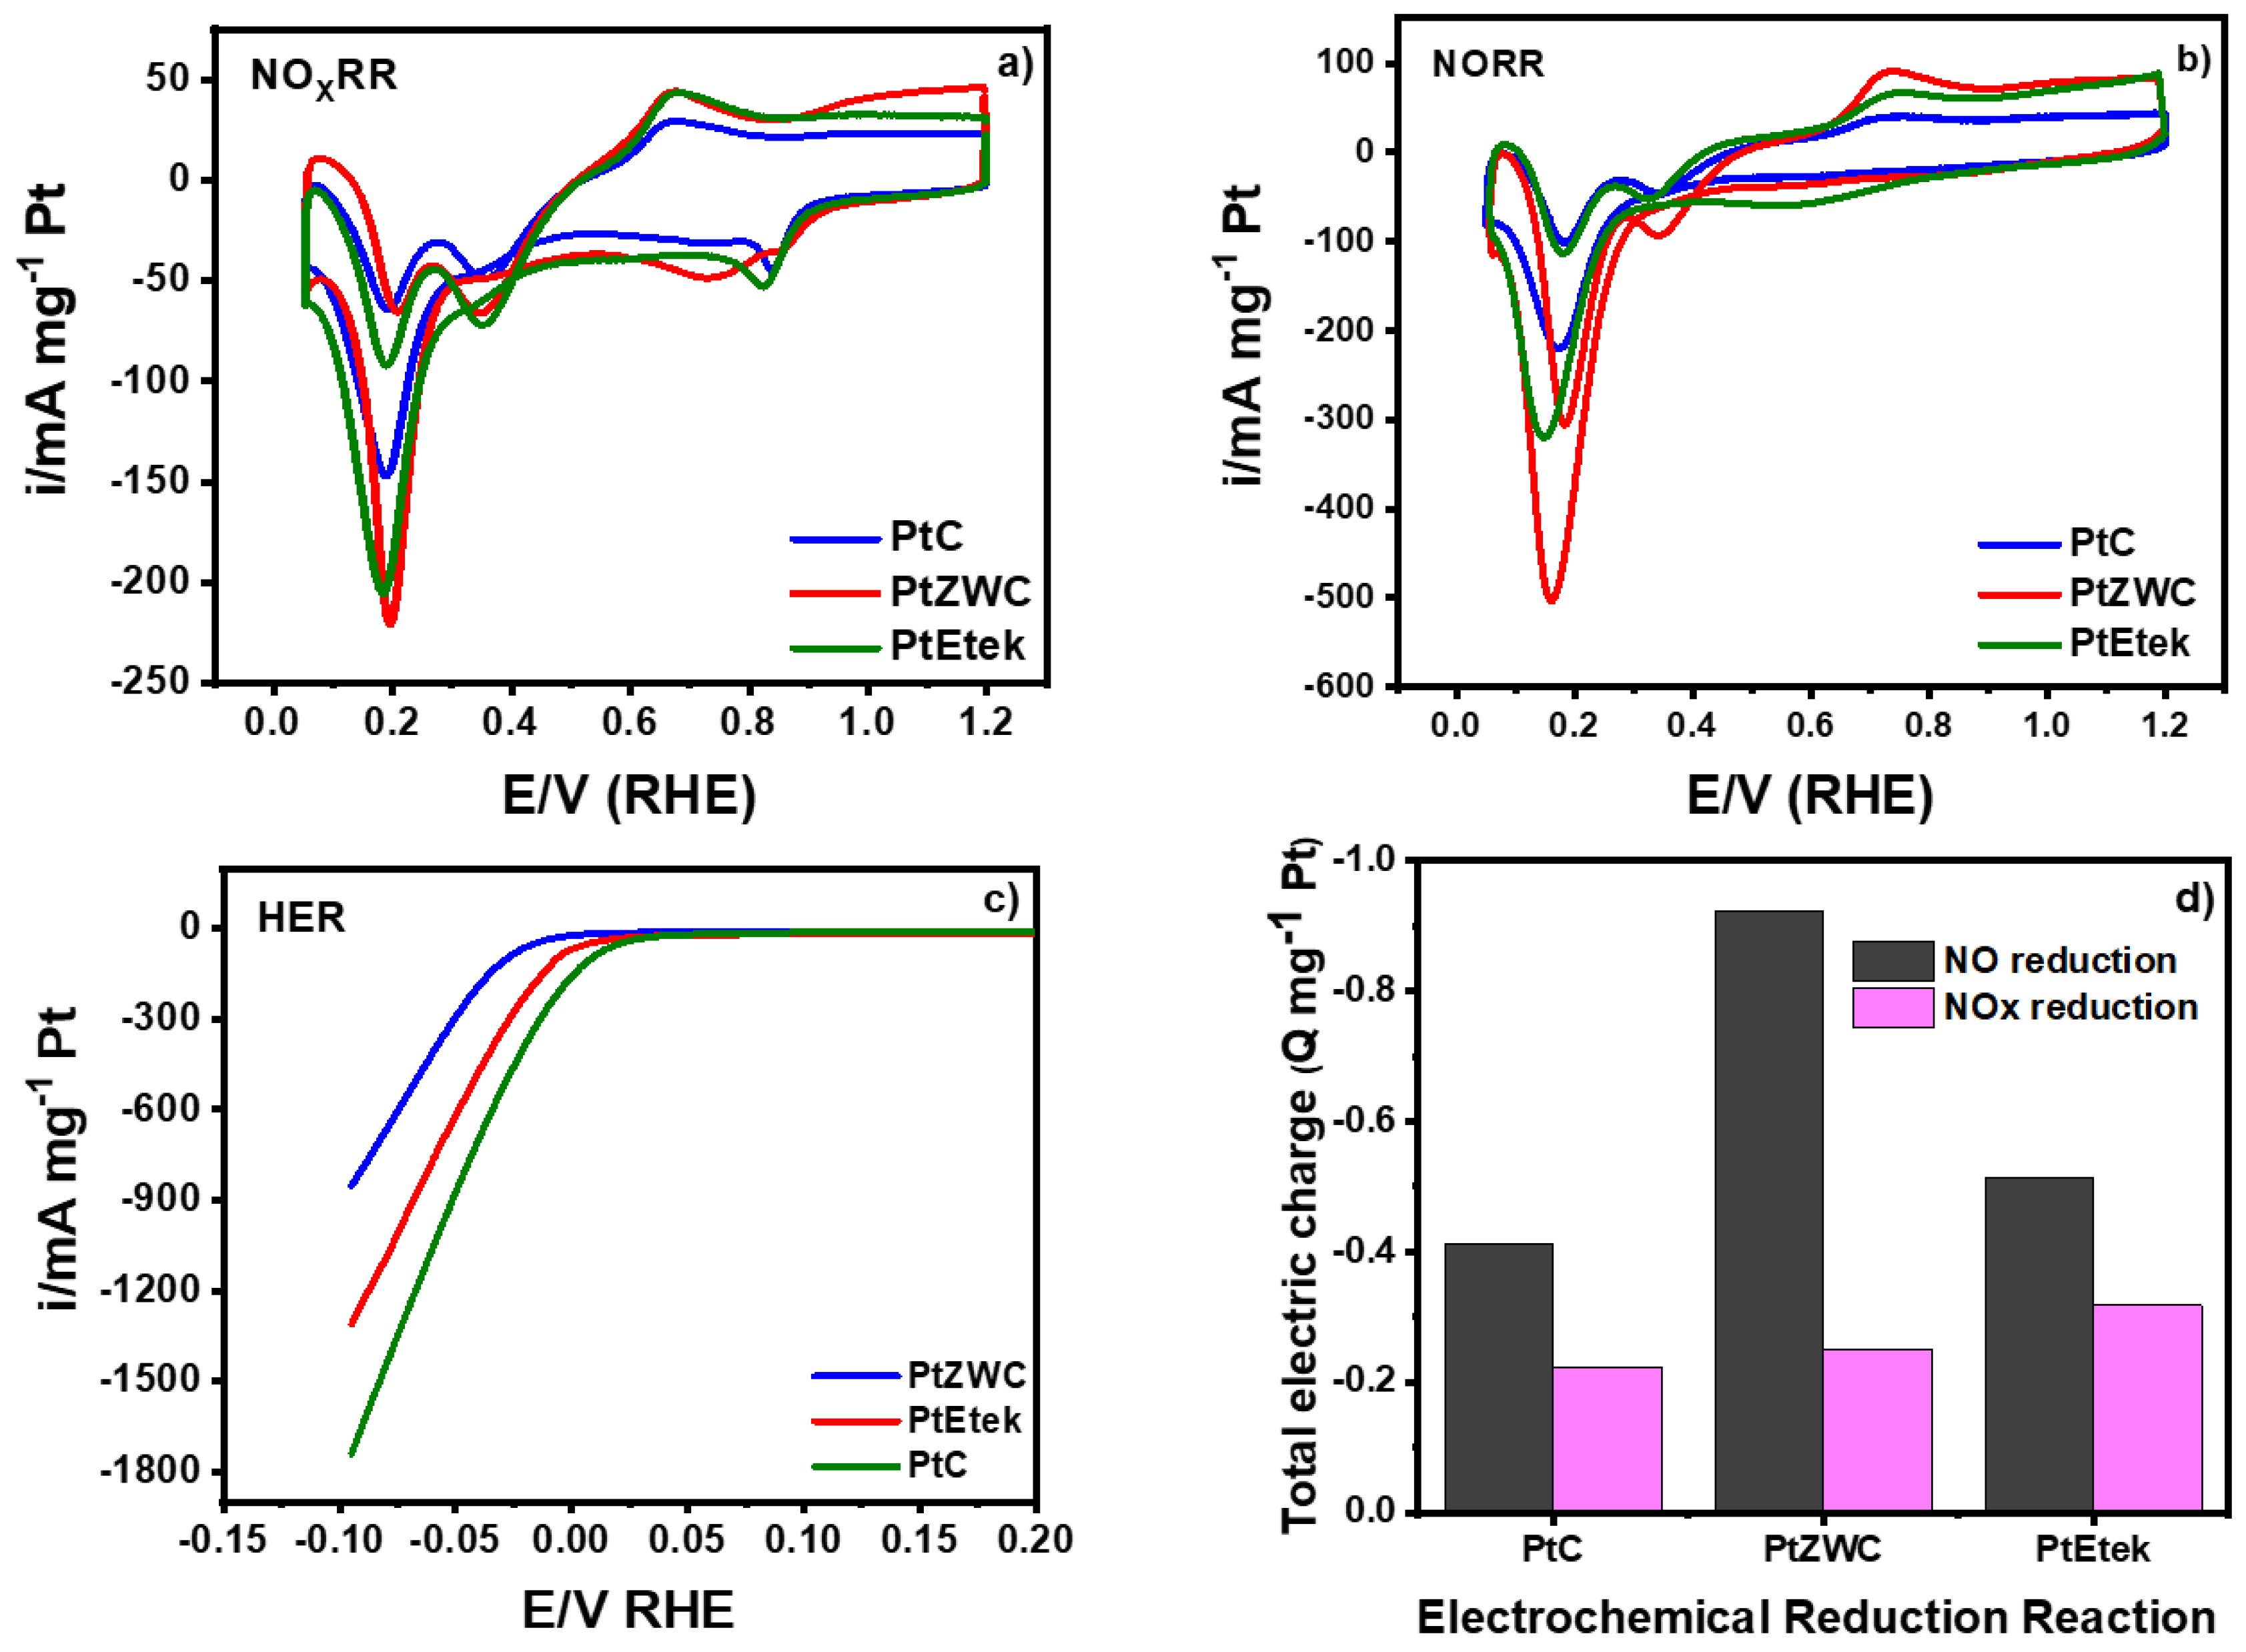
3.6. Reaction Reduction of Nitric Oxide and Nitrogen Oxides

Nitric oxide (NO) reacts with atmospheric oxygen to form nitrogen dioxide (NO2). In this study, the electrochemical reduction of nitric oxide and nitrogen oxide (NOx) were investigated using three electrocatalysts PtC, PtEtek, and PtZWC.
For practical applications, the solubility of NO in the electrolyte is low (1.92 × 10⁻³ mol/L [17]), which is similar to sources like flue gases [31]. Figure 7a and b show the electrochemical reduction to NOx and NO, respectively. On the y-axis, the current for each material is normalized by the platinum mass loading, calculated as described in Section 2.4 (electrochemical evaluation). The values were 0.00561 mg for PtEtek, 0.00392 mg for PtC, and 0.00307 mg for PtZWC. The normalization allows for the proper comparison of the current obtained on the ZWC support.
Figure 7b shows similar behaviors to NO reduction in the potential interval of 0.5 to 0 V/RHE for PtC, PtEtek, and PtZWC samples. The maximum faradic current occurs around of 0.2 V/RHE. Among the three materials, PtZWC (red line) presents the highest faradic current, suggesting superior NO reduction performance. PtEtek (green line) follows, while PtC (blue line) shows the lowest activity.
In contrast, Figure 7a shows that PtEtek and PtZWC exhibit similar performances, while PtC appears to be slightly less active.
Understanding the NO reduction mechanism in Pt nanoparticles is important for explaining the role of ZWC support.
According to the literature, the reduction is not sensitive to the Pt crystalline structure but instead governed by the hydrogenation process, which controls the kinetics [32,33]. Consequently, the adsorption and activation of NO on the surface depend on the hydrogen coverage.
The first step of the NOx reduction process consists of two pathway routes: the direct (dissociative) and the indirect (associative). In the direct route, NO molecules are dissociated before hydrogenation. While in the indirect route, NO is not dissociated immediately, following the hydrogenation process [5,34]. In this context, hydrogenation plays a crucial role as it influences product selectivity by controlling the competition between the primary NO reduction reaction and the hydrogen evolution reaction (HER) [8]. On the other hand, ammonia (NH3) formation is one of the most produced chemicals globally [35]. NOx reduction offers an interesting reaction from an economic and environmental perspective. However, HER competes strongly with ammonia formation over Pt [36], suggesting that Pt is the most active metal for the dissociative- (D-T) and associative-Tafel (A-T) mechanisms [34]. The hydrogenation mechanism is divided into two important pathways: Tafel and Heyrovsky. For Pt, the Tafel mechanism governs, whereas the Heyrovsky mechanism takes precedence for other active materials such as copper. The D-T mechanism involves the direct breaking of the N-O bond, forming nitrogen (*N) and oxygen (*O) atoms on the catalyst surface (The '*' before a molecule represents an adsorbed species on a surface or a molecule with an unpaired/broken bond). These intermediates are then hydrogenated to produce ammonia (NH3). A-T mechanism depends on the NO molecules extreme and involves sequential hydrogenation without initial bond cleavage, forming intermediates that eventually lead to NH3. The Tafel mechanism in platinum is influenced by hydrogen coverage, applied potential, and the pH of the electrolyte [37]. High hydrogen coverage favors N-N coupling, while low hydrogen coverage favors NH3 formation.
In this context, Figure 7c presents the HER for the samples. The PtC and PtEtek catalysts show onset potential for HER at 0.025 V and 0 V/RHE, respectively. However, PtZWC exhibits a significant negative shift, with an onset potential of −0.011 V/RHE.
For PtC and PtEtek, HER is favored (Figure 7c), resulting in a high hydrogen coverage on the platinum surfacewhich produces the A-T route. In the A-T route, NO is adsorbed on platinum without dissociation (Equation (6)). Hydrogenation then progresses on the catalytic surface, producing NH2OH due to the high hydrogen adsorption availability on the surface (Equation (7)). Finally, NH3 is desorbed from the platinum surface (Equation (8)).
*NO → *NOH
*NOH → *NH2OH
*NH2OH → NH3
In contrast, the smaller nanoparticle size of platinum on the ZWC support leads to higher hydrogen coverage and a superior onset potential in HER. However, as shown in Figure 7c, there is a shift to a more negative onset potential, as previously discussed, which provokes the suppression of HER at active platinum sites. As a result, HER becomes less competitive for NO reduction. Furthermore, reports suggest that the adsorption of NOx intermediate species can be facilitated by active sites containing oxygen atoms, which enhance the beneficial reduction of NOx [38]. Therefore, a D-T mechanism is proposed for the PtZWC material. First, NO is adsorbed onto the Pt surfaces, and the N-O bond is cleaved (Equation (9)) Then, the nitrogen (*N) is sequentially hydrogenated (Equations (10) and (11)).
NOads + * → N* + O*
N* + Hads + e → NH2 *
NH2* + Hads + e → NH3
O* 2Hads + e → H2O
The enhanced performance for NO reduction in PtZWC can be attributed to the modulation of hydrogen coverage via the oxygen vacancies (XPS results) in WO3 through the hydrogen spillover effect.
To demonstrate the role of ZWC support, PtZC and PtWC, ZrO2-C (ZC), and WO3-C (WC) materials were synthesized using the same method described in Section 2.2. The cyclic voltammetry (CV) profiles of PtZ and PtWC show similar peaks corresponding to Pt, indicating a stable Pt-based catalyst with mixed oxide supports. Figures SI.1a and SI.1b (Supplementary Information) illustrate the stabilization and NO reduction evaluation, respectively.
Additionally, the profiles for the individual supports (ZWC, ZC, WC, and Vulcan carbon) were also evaluated under the same electrochemical conditions described in Section 3.4. The CV profile of Vulcan carbon displays similar characteristic behavior to another report [39]. Figure SI.1b highlights the distinct hydrogen adsorption (Hads) peaks for WC. When WO3 becomes hydrated (Equation (13)) under cathodic potentials, reversible species of tungsten with Hads is formed on anodic direction, enabling the hydrogen spillover effect as observed in the potentials of 0.05 V and 0.26 V vs. RHE (Equation (14)) [40]. The spillover effect, observed in Figure SI.1b, involves hydrogen diffusion across the WC surface [41]. In the presence of Pt nanoparticles, this effect facilitates further hydrogen diffusion. Moreover, Figure SI.1b shows that incorporating ZrO2 in ZC modifies Hads and shifts the hydrogen evolution reaction (HER) onset to more cathodic potentials. This shift indicates that the support materials are crucial in altering the hydrogen adsorption dynamics and stabilizing intermediates during the electrochemical process.
W(OH)6 + H2O + e ↔ H4WO3 + 4OH
2 HxWO3 + H2O + e ↔ 2WO3 + 2H2 + 2OH
Hence, PtZWC contributes to a more efficient reduction of NOx by promoting the necessary conditions for hydrogenation. This observation aligns with studies that report how oxide supports, such as WO3, can enhance catalytic activity by providing a more favorable environment for Hads [41,42,43].
The total electric charge normalized per milligram of platinum for NO reduction was obtained by integrating the cyclic voltammetry (CV) profile within the corresponding potential range for NO reduction (−0.4 V to −0.05 V vs. RHE). The calculated values are as follows: −0.4128 C mg−1 Pt for PtC, −0.9235 mg−1 Pt to PtZWC, and −0.5148 mg−1 Pt for PtEtek Figure 7d. The PtZWC material shows a 55.3% higher total electric charge compared to PtC and 44.2% higher than PtEtek. The increment of total electric charge on PtZWC suggests that the oxide support alters the reaction pathway and stabilizes intermediates. Based on these observations, the higher in total electric charge in the NOR on PtZWC can be attributed to the following conditions: (I) the uniform distribution of small platinum nanoparticles; (II) the presence of oxygen vacancies in WO3; (III) the hydrogen spillover effect, which increases the availability of platinum sites for the reaction; and (IV) the shift in onset potential for HER due to the WO3 and ZrO2 nanostructures.
On the other hand, the performance of PtEtek is inferior to that of PtC in the hydrogen evolution reaction (HER), despite PtEtek’s higher Pt content. This could be explained by the smaller size of Pt nanoparticles in PtEtek, which may result in lower HER activity due to the increased surface area but reduced availability of active hydrogen adsorption sites. However, the primary objective of this article is to propose metal oxide-supported materials for efficient NOx reduction, rather than studying commercial PtEtek or PtC for HER performance. The focus is on the potential of these novel materials to enhance NOx reduction reactions, specifically through their unique interactions and catalytic properties.
According to the experimental section, the NOx dissolution contains 9.14 × 10⁻⁸ mol of NO2, 5.40 × 10⁻⁵ mol of NO, and 3.13 × 10⁻⁵ mol of N2O. In this case, Figure 7d shows the electroreduction of NOx, where PtEtek and PtZWC exhibit similar total electric charge values, which could be attributed to the presence of N2O species, producing a deactivation of sites of platinum in all material.

4. Conclusions

The platinum catalyst supported on ZWC demonstrates superior performance due to the synergistic effects between platinum and the ZWC support, which alters hydrogen coverage, according to HER analysis. This change in coverage facilitates the reduction of NOx by enabling hydrogen interaction, enhancing platinum nanoparticle dispersion and stability. Although zirconium oxide diffraction peaks were not detected, diffraction signals suggest that ZWC supports the platinum phase, promoting nanoparticle size reduction and improving dispersion. Morphological characteristics reveal better platinum nanoparticle dispersion in PtZWC, and the increased pore size further contributes to enhanced electrocatalytic performance. Electrochemical evaluation, using cyclic voltammetry and CO-stripping techniques, shows a higher electrochemical surface area and improved performance compared to PtC. These results position PtZWC as an efficient catalyst for NOx reduction, suggesting its potential for industrial applications, especially in environmental technologies. This suggests that the D-T process on PtZWC may be hindered by the presence of N2O and NO2, as these species require the cleavage of the N-O bond before further electrochemical transformations can occur. To better assess the reaction selectivity, Faradaic efficiency (FE) has been determined based on experimental products using differential electrochemical mass spectrometry (DEMS).
As a future perspective, additional density functional theory (DFT) calculations will be conducted to evaluate further electrocatalytic activity, including faradaic efficiency and turnover frequency (TOF), and to understand the reaction mechanisms better.

Supplementary Materials

The following supporting information can be downloaded at: https://www.mdpi.com/article/10.3390/electrochem6010007/s1, Figure SI.1: i–E profile for (a) PtC, PtZWC and PtWC, and PtC materials. Scan rate of 20 mVs−1. NaOH electrolyte. and (b) ZWC, WC, ZC and Vulcan Carbon treated materials supports. Scan rate of 20 mVs−1. NaOH electrolyte; Figure SI.2: C 1s core level spectra that were used for the charge-shift correction of the samples. Calibration was done using the 284.6 eV peak.

Author Contributions

Conceptualization, D.A.A.-L., M.L.H.-P. and M.A.G.-P.; methodology C.R.S.-R. and M.A.G.-P.; software, C.R.S.-R.; validation, D.A.A.-L., M.L.H.-P. and M.A.G.-P.; formal analysis, C.R.S.-R. and D.A.A.-L.; investigation, C.R.S.-R., D.A.A.-L., M.L.H.-P. and M.A.G.-P.; resources, M.L.H.-P. and A.M.-R.; data curation, C.R.S.-R.; writing—original draft preparation, C.R.S.-R.; writing—review and editing, M.A.G.-P.; visualization, C.R.S.-R.; supervision, M.A.G.-P.; project administration, M.L.H.-P.; funding acquisition, C.R.S.-R. All authors have read and agreed to the published version of the manuscript.

Funding

This research was funded by the Programa de Apoyo a la Ciencia, Tecnología e Innovación (PROACTI) from Universidad Autónoma de Nuevo León, with project numbers 97-FMYCT-2023 and 135-FMYCT-2024.

Data Availability Statement

The original contributions presented in this study are included in the article/Supplementary Material. Further inquiries can be directed to the corresponding author(s).

Acknowledgments

Claudia Rosa Santiago Ramirez (CRSR) and Daniel Acuña-Leal are thankful to CONACYT (Mexico) for their postdoctoral fellowships. CRSR would like to extend our gratitude to student Salvador Ochoa Angeles for designing the graphical abstract.

Conflicts of Interest

The authors declare no conflicts of interest.

References

  1. EDGAR Emission Database for Global Atmospheric Research. EDGAR Emission Database for Global Atmospheric Research (2024). Available online: https://edgar.jrc.ec.europa.eu/ (accessed on 18 November 2024).
  2. International Energy Agency (IEA). Trends in Electric Cars—Global EV Outlook 2024—Analysis. Available online: https://www.iea.org/reports/global-ev-outlook-2024/trends-in-electric-cars (accessed on 22 February 2025).
  3. U. Epa, C. Change Division. Inventory of U.S. Greenhouse Gas Emissions and Sinks: 1990–2018—Main Text. Available online: https://www.epa.gov/ghgemissions/inventory-us-greenhouse-gas-emissions-and-sinks (accessed on 22 February 2025).
  4. World Health Organization. Air Quality, Energy and Health. 2024. Available online: https://www.who.int/teams/environment-climate-change-and-health/air-quality-energy-and-health/about (accessed on 22 February 2025).
  5. Wang, X.; Westermann, A.; Shi, Y.X.; Cai, N.S.; Rieu, M.; Viricelle, J.-P.; Vernoux, P. Electrochemical Removal of NOx on Ceria-Based Catalyst-Electrodes. Catalysts 2017, 7, 61. [Google Scholar] [CrossRef]
  6. Santiago-Ramírez, C.; Vera-Iturriaga, J.; del Angel, P.; Manzo-Robledo, A.; Hernández-Pichardo, M.; Soto-Hernández, J. DEMS and RAMAN study of the monatomic hydrogen adsorption during electro-reduction of NO3 and NO2 at Pt nanoparticles supported at W18O49-ZrO2-C nanocomposite. Appl. Catal. B Environ. 2020, 282, 119545. [Google Scholar] [CrossRef]
  7. Bayan, Y.; Paperzh, K.; Pankov, I.; Alekseenko, A. Influence of a carbon support on the catalytic activity and durability of the Pt-based electrocatalysts. Mater. Lett. 2024, 368. [Google Scholar] [CrossRef]
  8. Carro, P.; Choi, J.; Macfarlane, D.R.; Simonov, A.N.; Doña-Rodríguez, J.M.; Azofra, L.M. Competition between metal-catalysed electroreduction of dinitrogen, protons, and nitrogen oxides: A DFT perspective. Catal. Sci. Technol. 2022, 9, 2856–2864. [Google Scholar] [CrossRef]
  9. Choi, C.; Gu, G.H.; Noh, J.; Park, H.S.; Jung, Y. Understanding potential-dependent competition between electrocatalytic dinitrogen and proton reduction reactions. Nat. Commun. 2021, 12, 1–11. [Google Scholar] [CrossRef]
  10. Matias, M.L.; Carlos, E.; Branquinho, R.; Valle, H.D.; Marcelino, J.; Morais, M.; Pimentel, A.; Rodrigues, J.; Monteiro, T.; Fortunato, E.; et al. A Comparison between Solution-Based Synthesis Methods of ZrO2 Nanomaterials for Energy Storage Applications. Energies 2022, 15, 6452. [Google Scholar] [CrossRef]
  11. Wei, J.; Jing, Y.; Zhao, Z.; Fan, Z.; Liang, Z.; Huang, J.; Wu, H.; Xie, Z.; Liu, D.; Qu, D.; et al. Catalyst-Support interactions enhanced electrochemical nitrogen reduction on Au/ZrO2. Electrochim. Acta 2021, 381, 138222. [Google Scholar] [CrossRef]
  12. Chen, J.; Chen, C.; Qin, M.; Li, B.; Lin, B.; Mao, Q.; Yang, H.; Liu, B.; Wang, Y. Reversible hydrogen spillover in Ru-WO3-x enhances hydrogen evolution activity in neutral pH water splitting. Nat. Commun. 2022, 13, 1–10. [Google Scholar] [CrossRef]
  13. Mineo, G.; Bruno, L.; Bruno, E.; Mirabella, S. WO3 Nanorods Decorated with Very Small Amount of Pt for Effective Hydrogen Evolution Reaction. Nanomaterials 2023, 13, 1071. [Google Scholar] [CrossRef]
  14. Jaiswal, M.K.; Deka, S.; Kalita, T.; Kalita, D.J.; Choudhury, B. The Role of W ↔ N Electron Transport Channel in Potassium-Doped WO3/g-C3N4 Nanocomposites for Light-Assisted Electrocatalytic Oxygen and Hydrogen Evolution Reactions: Decoding the S-Scheme Mechanism. ACS Sustain. Chem. Eng. 2024, 12, 14670–14683. [Google Scholar] [CrossRef]
  15. Gong, Z.; Chen, Z.; Li, H.; Yang, G.; Yuan, M.; Li, Z.; Wan, X.; Cui, Y. Palladium single atoms from melting nanoparticles on WO3 for boosted hydrogen evolution reaction. J. Energy Chem. 2023, 91, 637–644. [Google Scholar] [CrossRef]
  16. Jacquline, L.S.; Elamurugu, E. Tungsten based nanostructured hybrid electrocatalysts in neutral medium for hydrogen evolution reaction. Int. J. Hydrogen Energy 2024, 89, 1049–1059. [Google Scholar] [CrossRef]
  17. Jeon, S.; Im, M.; Kim, K.; Kim, D.; Han, J.-I. Electrochemically-mediated reactive separation of nitric oxide into nitrate using iron chelate. Chemosphere 2023, 341, 140026. [Google Scholar] [CrossRef]
  18. Soto-Hernández, J.; Santiago-Ramirez, C.; Ramirez-Meneses, E.; Luna-Trujillo, M.; Wang, J.-A.; Lartundo-Rojas, L.; Manzo-Robledo, A. Electrochemical reduction of NOx species at the interface of nanostructured Pd and PdCu catalysts in alkaline conditions. Appl. Catal. B Environ. 2019, 259. [Google Scholar] [CrossRef]
  19. Vázquez-Bautista, S.; Ramírez-Meneses, E.; Manzo-Robledo, A.; Zacahua-Tlacuatl, G.; Lartundo-Rojas, L.; Acosta-Jara, J.; Pedraza-Segura, L.; Luna-Trujillo, M. Electro-reduction of NOx-species in alkaline medium at modified carbon-supported palladium nanoparticles with variable concentration of C-sp2: An in-situ mass-spectrometry approach. Appl. Catal. B Environ. 2022, 320. [Google Scholar] [CrossRef]
  20. Dorhout, J.M.; Anderson, A.S.; Batista, E.; Carlson, R.K.; Currier, R.P.; Martinez, R.K.; Clegg, S.M.; Wilkerson, M.P.; Nowak-Lovato, K. NOx speciation from copper dissolution in nitric acid/water solutions using FTIR spectroscopy. J. Mol. Spectrosc. 2020, 372, 111334. [Google Scholar] [CrossRef]
  21. Sander, R. Compilation of Henry’s law constants (version 5.0.0) for water as solvent. Atmos. Chem. Phys. 2023, 23, 10901–12440. [Google Scholar] [CrossRef]
  22. Sakthivel, M.; Drillet, J.-F. An extensive study about influence of the carbon support morphology on Pt activity and stability for oxygen reduction reaction. Appl. Catal. B Environ. 2018, 231, 62–72. [Google Scholar] [CrossRef]
  23. Holade, Y.; Morais, C.; Servat, K.; Napporn, T.W.; Kokoh, K.B. Enhancing the available specific surface area of carbon supports to boost the electroactivity of nanostructured Pt catalysts. Phys. Chem. Chem. Phys. 2014, 16, 25609–25620. [Google Scholar] [CrossRef]
  24. Storck, S.; Bretinger, H.; Maier, W.F. Characterization of micro- and mesoporous solids by physisorption methods and pore-size analysis. Appl. Catal. A Gen. 1998, 174, 137–146. [Google Scholar] [CrossRef]
  25. Liu, S.-C.; Yue, Z.-F.; Liu, Y. Mesoporous carbon–ZrO2 composites prepared using thermolysis of zirconium based metal–organic frameworks and their adsorption properties. J. Porous Mater. 2015, 22, 465–471. [Google Scholar] [CrossRef]
  26. Scherrer, P. Bestimmung der Grosse und Inneren Struktur von Kolloidteilchen Mittels Rontgenstrahlen, Nach Ges Wiss Gottingen 2 (1918) 8–100. Available online: https://cir.nii.ac.jp/crid/1573105975714168704 (accessed on 16 February 2025).
  27. Ferrero, G.A.; Preuss, K.; Marinovic, A.; Jorge, A.B.; Mansor, N.; Brett, D.J.L.; Fuertes, A.B.; Sevilla, M.; Titirici, M.-M. Fe–N-Doped Carbon Capsules with Outstanding Electrochemical Performance and Stability for the Oxygen Reduction Reaction in Both Acid and Alkaline Conditions. ACS Nano 2016, 10, 5922–5932. [Google Scholar] [CrossRef] [PubMed]
  28. Gu, L.; Dong, Y.; Zhang, Y.; Wang, B.; Yuan, Q.; Du, H.; Zhao, J. Insights into the role of an Fe–N active site in the oxygen reduction reaction on carbon-supported supramolecular catalysts. RSC Adv. 2020, 10, 8709–8716. [Google Scholar] [CrossRef] [PubMed]
  29. Saeed, A.M.; Cao, G.-P.; Al-Fatesh, A.S.; Alreshaidan, S.B.; Ali, N.; Shehu, M.S.; Yan, J.-Y. Highly efficient platinum nano-particles decorated multi-walled carbon nanotubes (Pt/MWCNTs) catalyst for catalytic hydrogenation of styrene–butadiene–styrene (SBS) copolymer. Arab. J. Chem. 2024, 17. [Google Scholar] [CrossRef]
  30. Abdulaziz, M.; Petruk, A.; George, T.; Shaw, N.; Sciaini, G.; Trevani, L. Exploring Platinum Thin Films as Electrodes for High-Temperature and -Pressure Electrochemical Studies in Aqueous Systems. Electrochem. Sci. Adv. 2024. [Google Scholar] [CrossRef]
  31. Bumajdad, A.; Nazeer, A.A.; Al Sagheer, F.; Nahar, S.; Zaki, M.I. Controlled Synthesis of ZrO2 Nanoparticles with Tailored Size, Morphology and Crystal Phases via Organic/Inorganic Hybrid Films. Sci. Rep. 2018, 8, 1–9. [Google Scholar] [CrossRef]
  32. Xu, T.; Adamsen, K.C.; Li, Z.; Lammich, L.; Lauritsen, J.V.; Wendt, S. WO3 Monomers Supported on Anatase TiO2(101), −(001), and Rutile TiO2(110): A Comparative STM and XPS Study. J. Phys. Chem. C 2022, 126, 2493–2502. [Google Scholar] [CrossRef]
  33. Kim, H.-W.; Jin, J.; Kim, M.; Kim, K.; Han, J.-I. Direct recovery of electro-synthesized ammonia from low-concentration nitric oxide using pulse electrodeposited Cu/C catalyst in a catholyte-free system. Chem. Eng. J. 2024, 485. [Google Scholar] [CrossRef]
  34. de Vooys, A.; Beltramo, G.; van Riet, B.; van Veen, J.; Koper, M. Mechanisms of electrochemical reduction and oxidation of nitric oxide. Electrochim. Acta 2004, 49, 1307–1314. [Google Scholar] [CrossRef]
  35. Beltramo, G.L.; Koper, M.T.M. Nitric Oxide Reduction and Oxidation on Stepped Pt[n(111)×(111)] Electrodes. Langmuir 2003, 19, 8907–8915. [Google Scholar] [CrossRef]
  36. Liu, H.; Bai, L.; Bergmann, A.; Cuenya, B.R.; Luo, J. Electrocatalytic reduction of nitrogen oxide species to ammonia. Chem 2024, 10, 2963–2986. [Google Scholar] [CrossRef]
  37. Saadatjou, N.; Jafari, A.; Sahebdelfar, S. Ruthenium Nanocatalysts for Ammonia Synthesis: A Review. Chem. Eng. Commun. 2014, 202, 420–448. [Google Scholar] [CrossRef]
  38. Delagrange, S.; Schuurman, Y. HCN synthesis from methane and ammonia over platinum. Catal. Today 2007, 121, 204–209. [Google Scholar] [CrossRef]
  39. Huang, Z.; Yang, B.; Zhou, Y.; Luo, W.; Chen, G.; Liu, M.; Liu, X.; Ma, R.; Zhang, N. Tungsten Nitride/Tungsten Oxide Nanosheets for Enhanced Oxynitride Intermediate Adsorption and Hydrogenation in Nitrate Electroreduction to Ammonia. ACS Nano 2023, 17, 25091–25100. [Google Scholar] [CrossRef]
  40. Sahu, V.; Shekhar, S.; Ahuja, P.; Gupta, G.; Singh, S.K.; Sharma, R.K.; Singh, G. Synthesis of hydrophilic carbon black; role of hydrophilicity in maintaining the hydration level and protonic conduction. RSC Adv. 2013, 3, 3917–3924. [Google Scholar] [CrossRef]
  41. Li, H.; Abdelgaid, M.; Paudel, J.R.; Holzapfel, N.P.; Augustyn, V.; McKone, J.R.; Mpourmpakis, G.; Crumlin, E.J. Operando Unveiling of Hydrogen Spillover Mechanisms on Tungsten Oxide Surfaces. J. Am. Chem. Soc. 2025. [Google Scholar] [CrossRef]
  42. Papakonstantinou, G.D.; Jaksic, J.M.; Labou, D.; Siokou, A.; Jaksic, M.M. Spillover Phenomena and Its Striking Impacts in Electrocatalysis for Hydrogen and Oxygen Electrode Reactions. Adv. Phys. Chem. 2011, 2011. [Google Scholar] [CrossRef]
  43. Rajalakshmi, R.; Srividhya, G.; Viswanathan, C.; Ponpandian, N. Hydrogen spillover effect–harnessing hydrogen evolution reaction from diverse carbon-based supports with a tungsten oxide catalyst. J. Mater. Chem. A 2023, 11, 15889–15905. [Google Scholar] [CrossRef]
Figure 1. N2 physisorption isotherms (BET) and the inset correspond to pore size distribution (BJH) of (a) ZWC and (b) Vulcan carbon at 350 °C.
Electrochem 06 00007 g001
Figure 2. (a) X-ray diffraction data for PtC and PtZWC. (b) Micrograph of HRTEM for PtZWC.
Electrochem 06 00007 g002
Figure 3. XPS high resolution spectra of PtC and PtZWC samples. For the PtC sample: the core levels of (a) C 1s and (b) O 1s were recorder. For the PtZWC sample: the core levels of (c) O 1s, (d) Pt 3d, (e) Zr 3d and (f) W 4f were recorded. In all of the figures, the experimental data is plotted with a black line, the green line is the Shirley-type background and the red lines represent the deconvolutions of the photoelectron peaks.
Electrochem 06 00007 g003
Figure 4. EDS Element spectrum with SEM image inset of (a) PtC, (b) PtZWC, and (c) PtEtek. The red square marks one of the locations of the EDS analysis.
Electrochem 06 00007 g004
Figure 5. TEM micrographs of (a) PtZWC and (b) PtC, and the respective histogram of particle-size distribution.
Electrochem 06 00007 g005
Figure 6. CO stripping voltammograms of the (a) PtEtek, (b) PtC, and (c) PtZWC materials and 0.5 M H2SO4 as supporting electrolyte. Scan rate of 50 mVs−1.
Electrochem 06 00007 g006
Figure 7. i–E profile for (a) NO2 and (b) NO gas for PtC, PtEtek, and PtEtek materials. Scan rate of 20 mVs−1. NaOH electrolyte. (c) i-E profile for HER in 0.5 M NaOH solution recorded at 5 mVs−1. (d) total electric charge for NOx and NO reduction.
Electrochem 06 00007 g007
Table 1. Textural properties of Vulcan carbon, Vulcan carbon treated at 350 °C, and ZWC support obtained from physisorption of N2 at 77 K.
Material BET Specific Area (m2g−1)BJH Pore Diameter (nm)
Vulcan carbon 240 [22]2 [22]
Vulcan carbon 350 °C 3522.5
ZWC 963
Table 2. Summary of platinum weight concentration (wt.%) by EDS-SEM, and electrochemical surface area (ECSA, m2 g−1) hydrogen and CO stripping.
MaterialPtEtekPtCPtZWC
Pt wt.% (EDS)15.0210.48.218
ECSAH (m2g−1pt)39.5627.1437.51
ECSACO (m2g−1pt)81.5557.4373.54
Disclaimer/Publisher’s Note: The statements, opinions and data contained in all publications are solely those of the individual author(s) and contributor(s) and not of MDPI and/or the editor(s). MDPI and/or the editor(s) disclaim responsibility for any injury to people or property resulting from any ideas, methods, instructions or products referred to in the content.

