
Tribo-Electrochemical Considerations for Assessing Galvanic Corrosion Characteristics of Metals in Chemical Mechanical Planarization


Abstract
1. Introduction
2. Phenomenological Background, Theoretical Considerations and Experimental Strategies
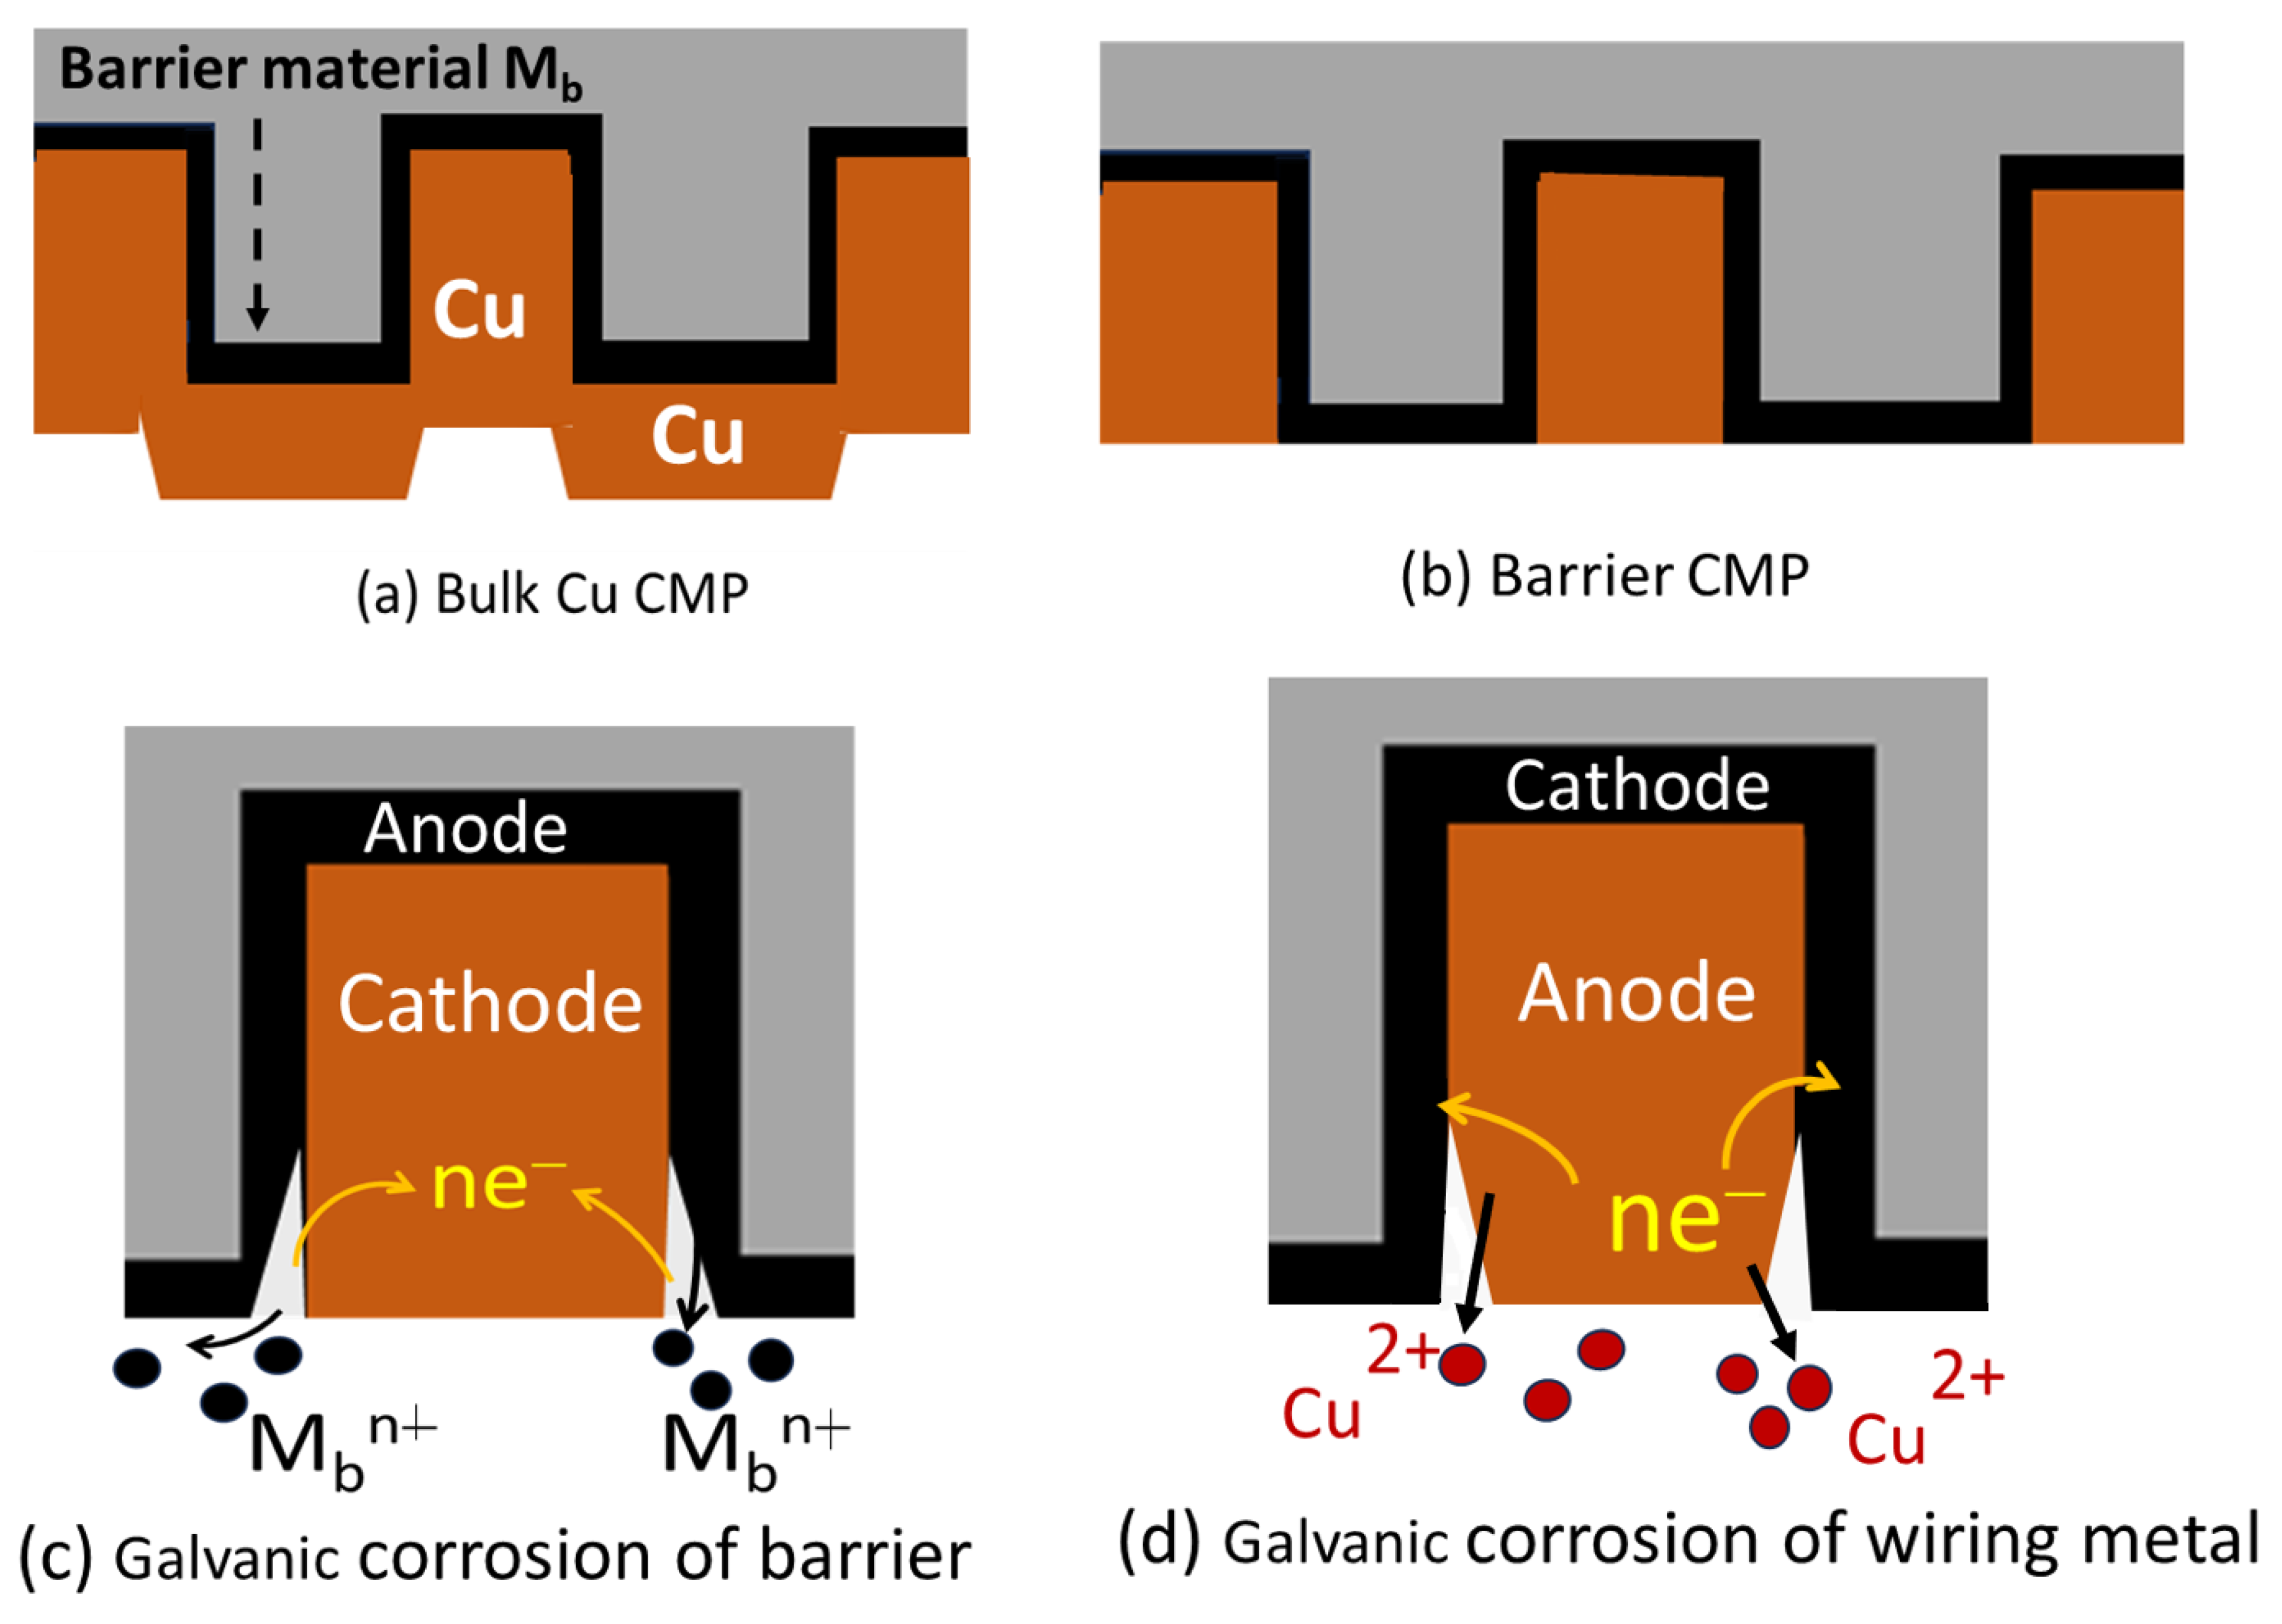
2.1. Activation and Effects of CMP-Induced Galvanic Corrosion
2.2. Theoretical Formulation of Galvanic Corrosion Parameters
2.3. Electrochemical Assessment of CMP-Induced Galvanic Corrosion
3. Materials and Methods
3.1. Sources and Treatments of Metal Samples and Polishing Slurries for CMP
3.2. Tribo-Electrochemical Instruments and Measurements
3.3. Data Analysis Protocols
4. Results and Discussion
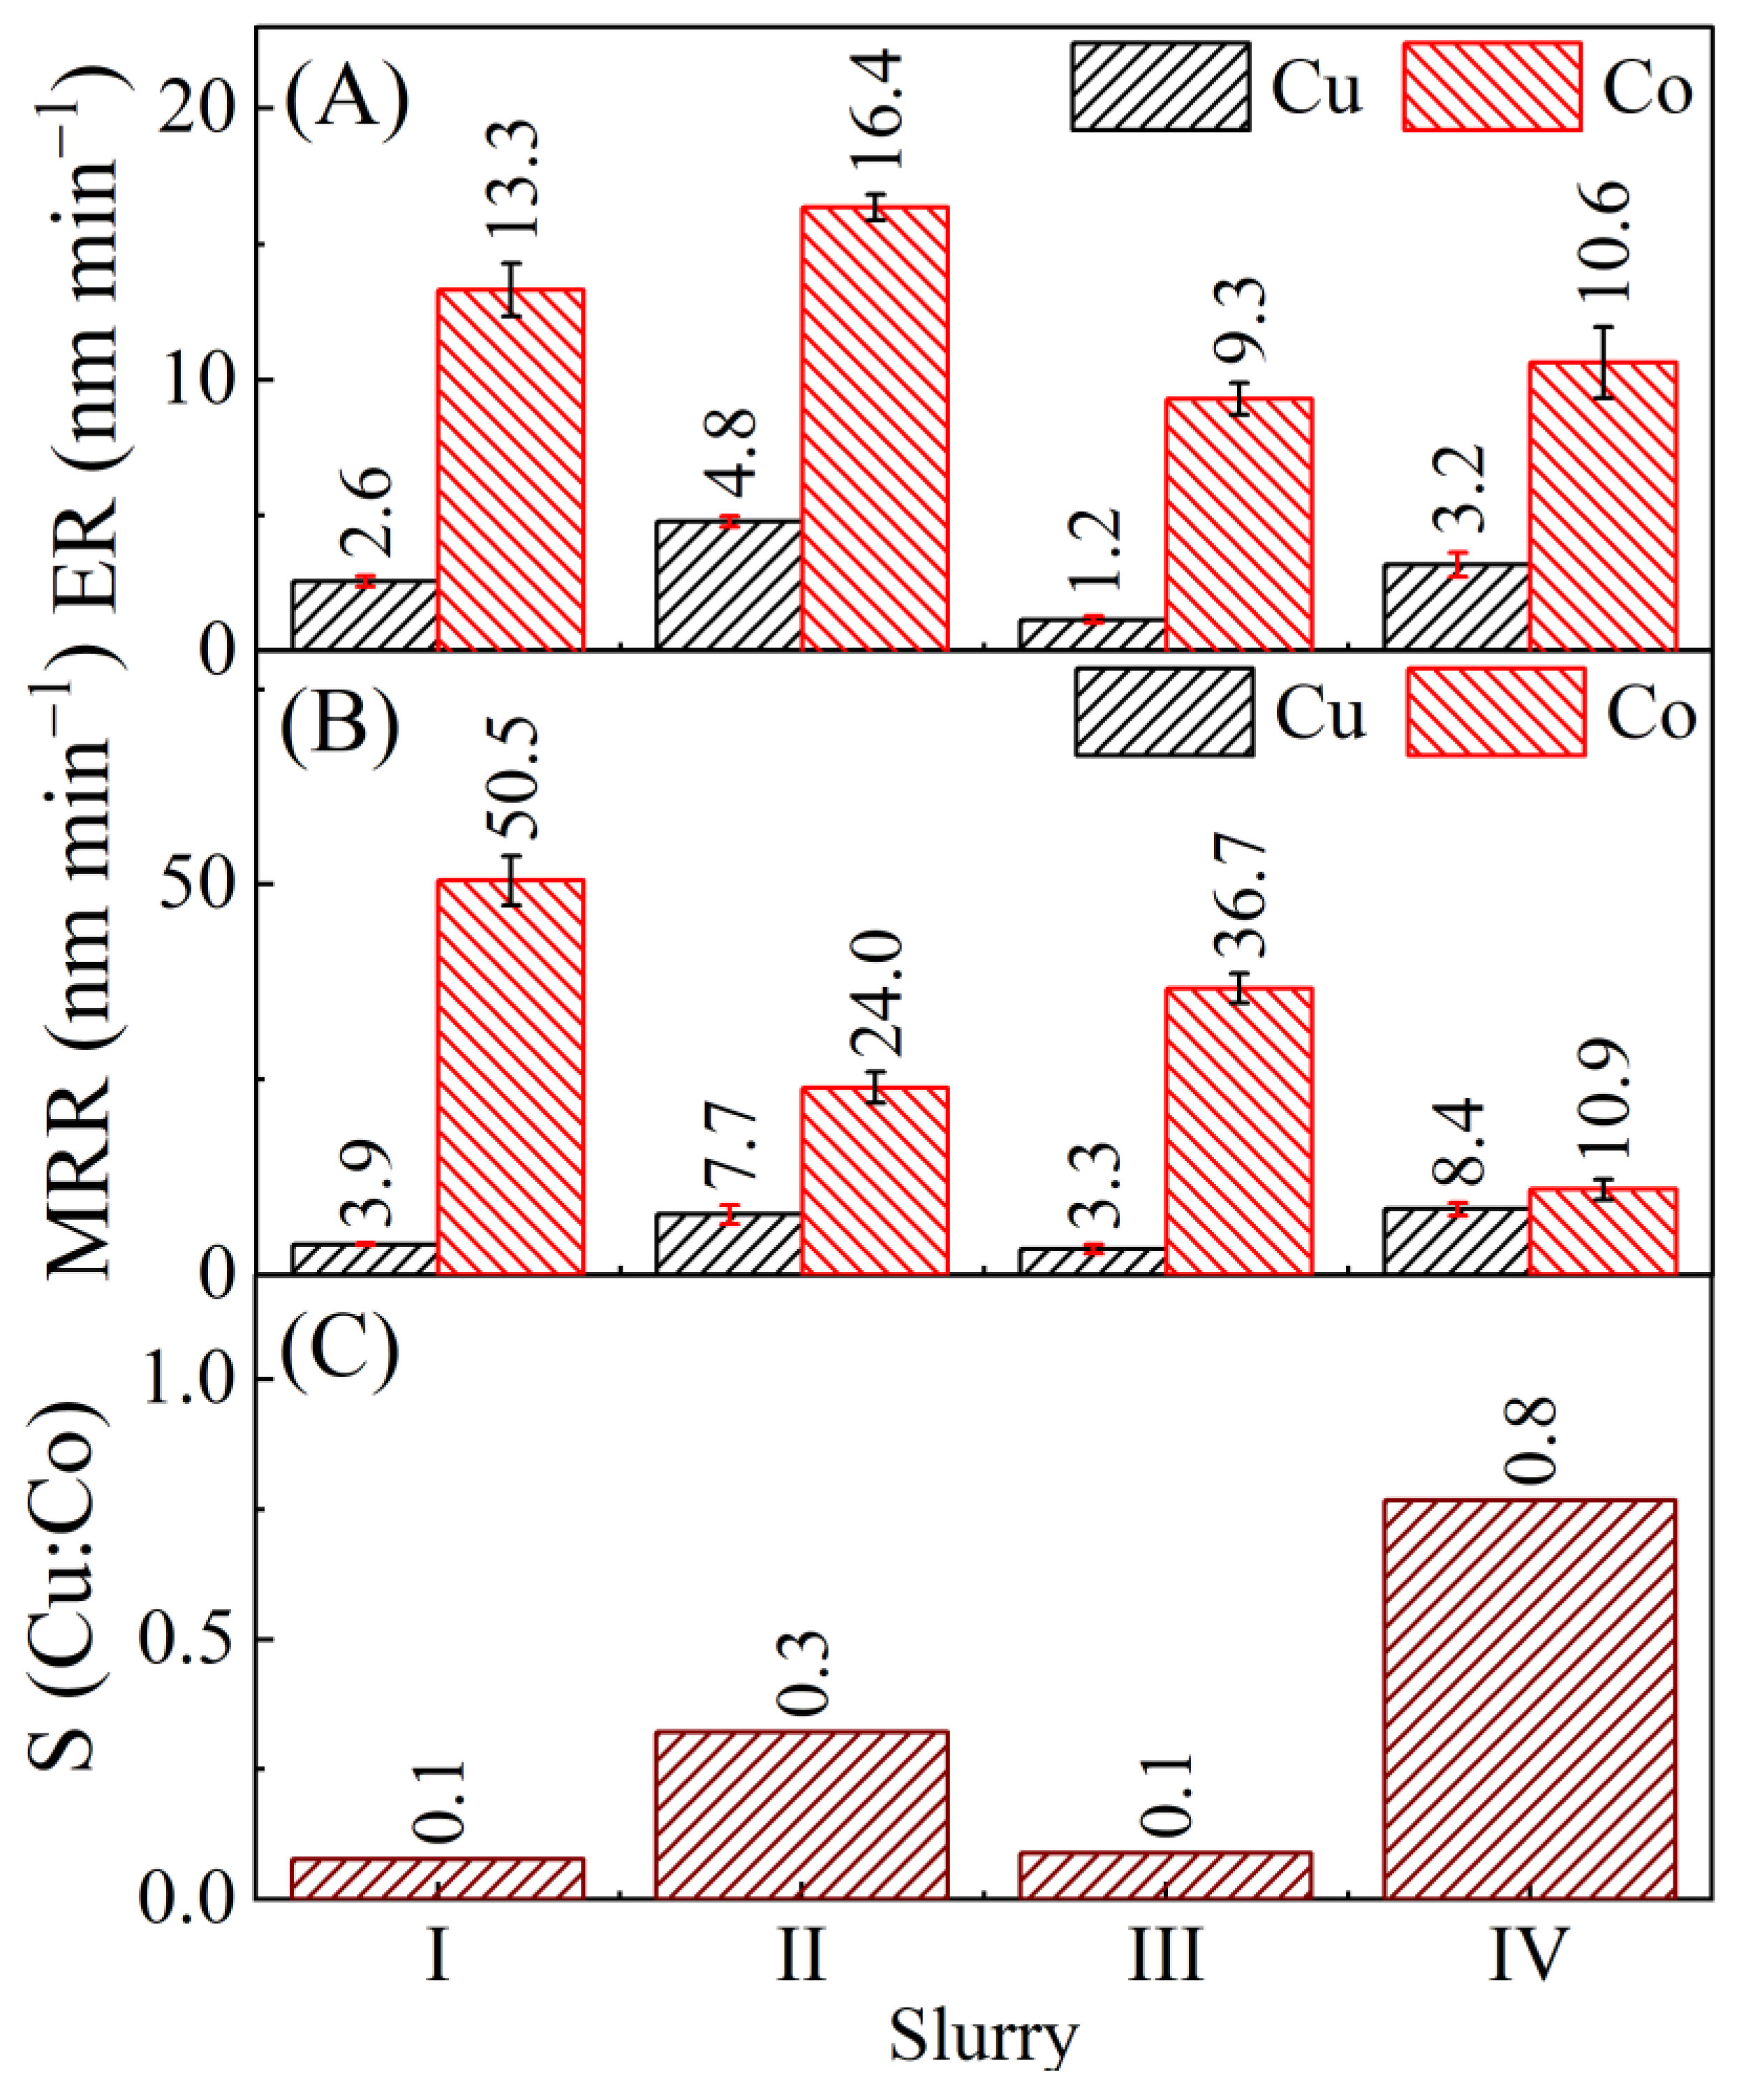
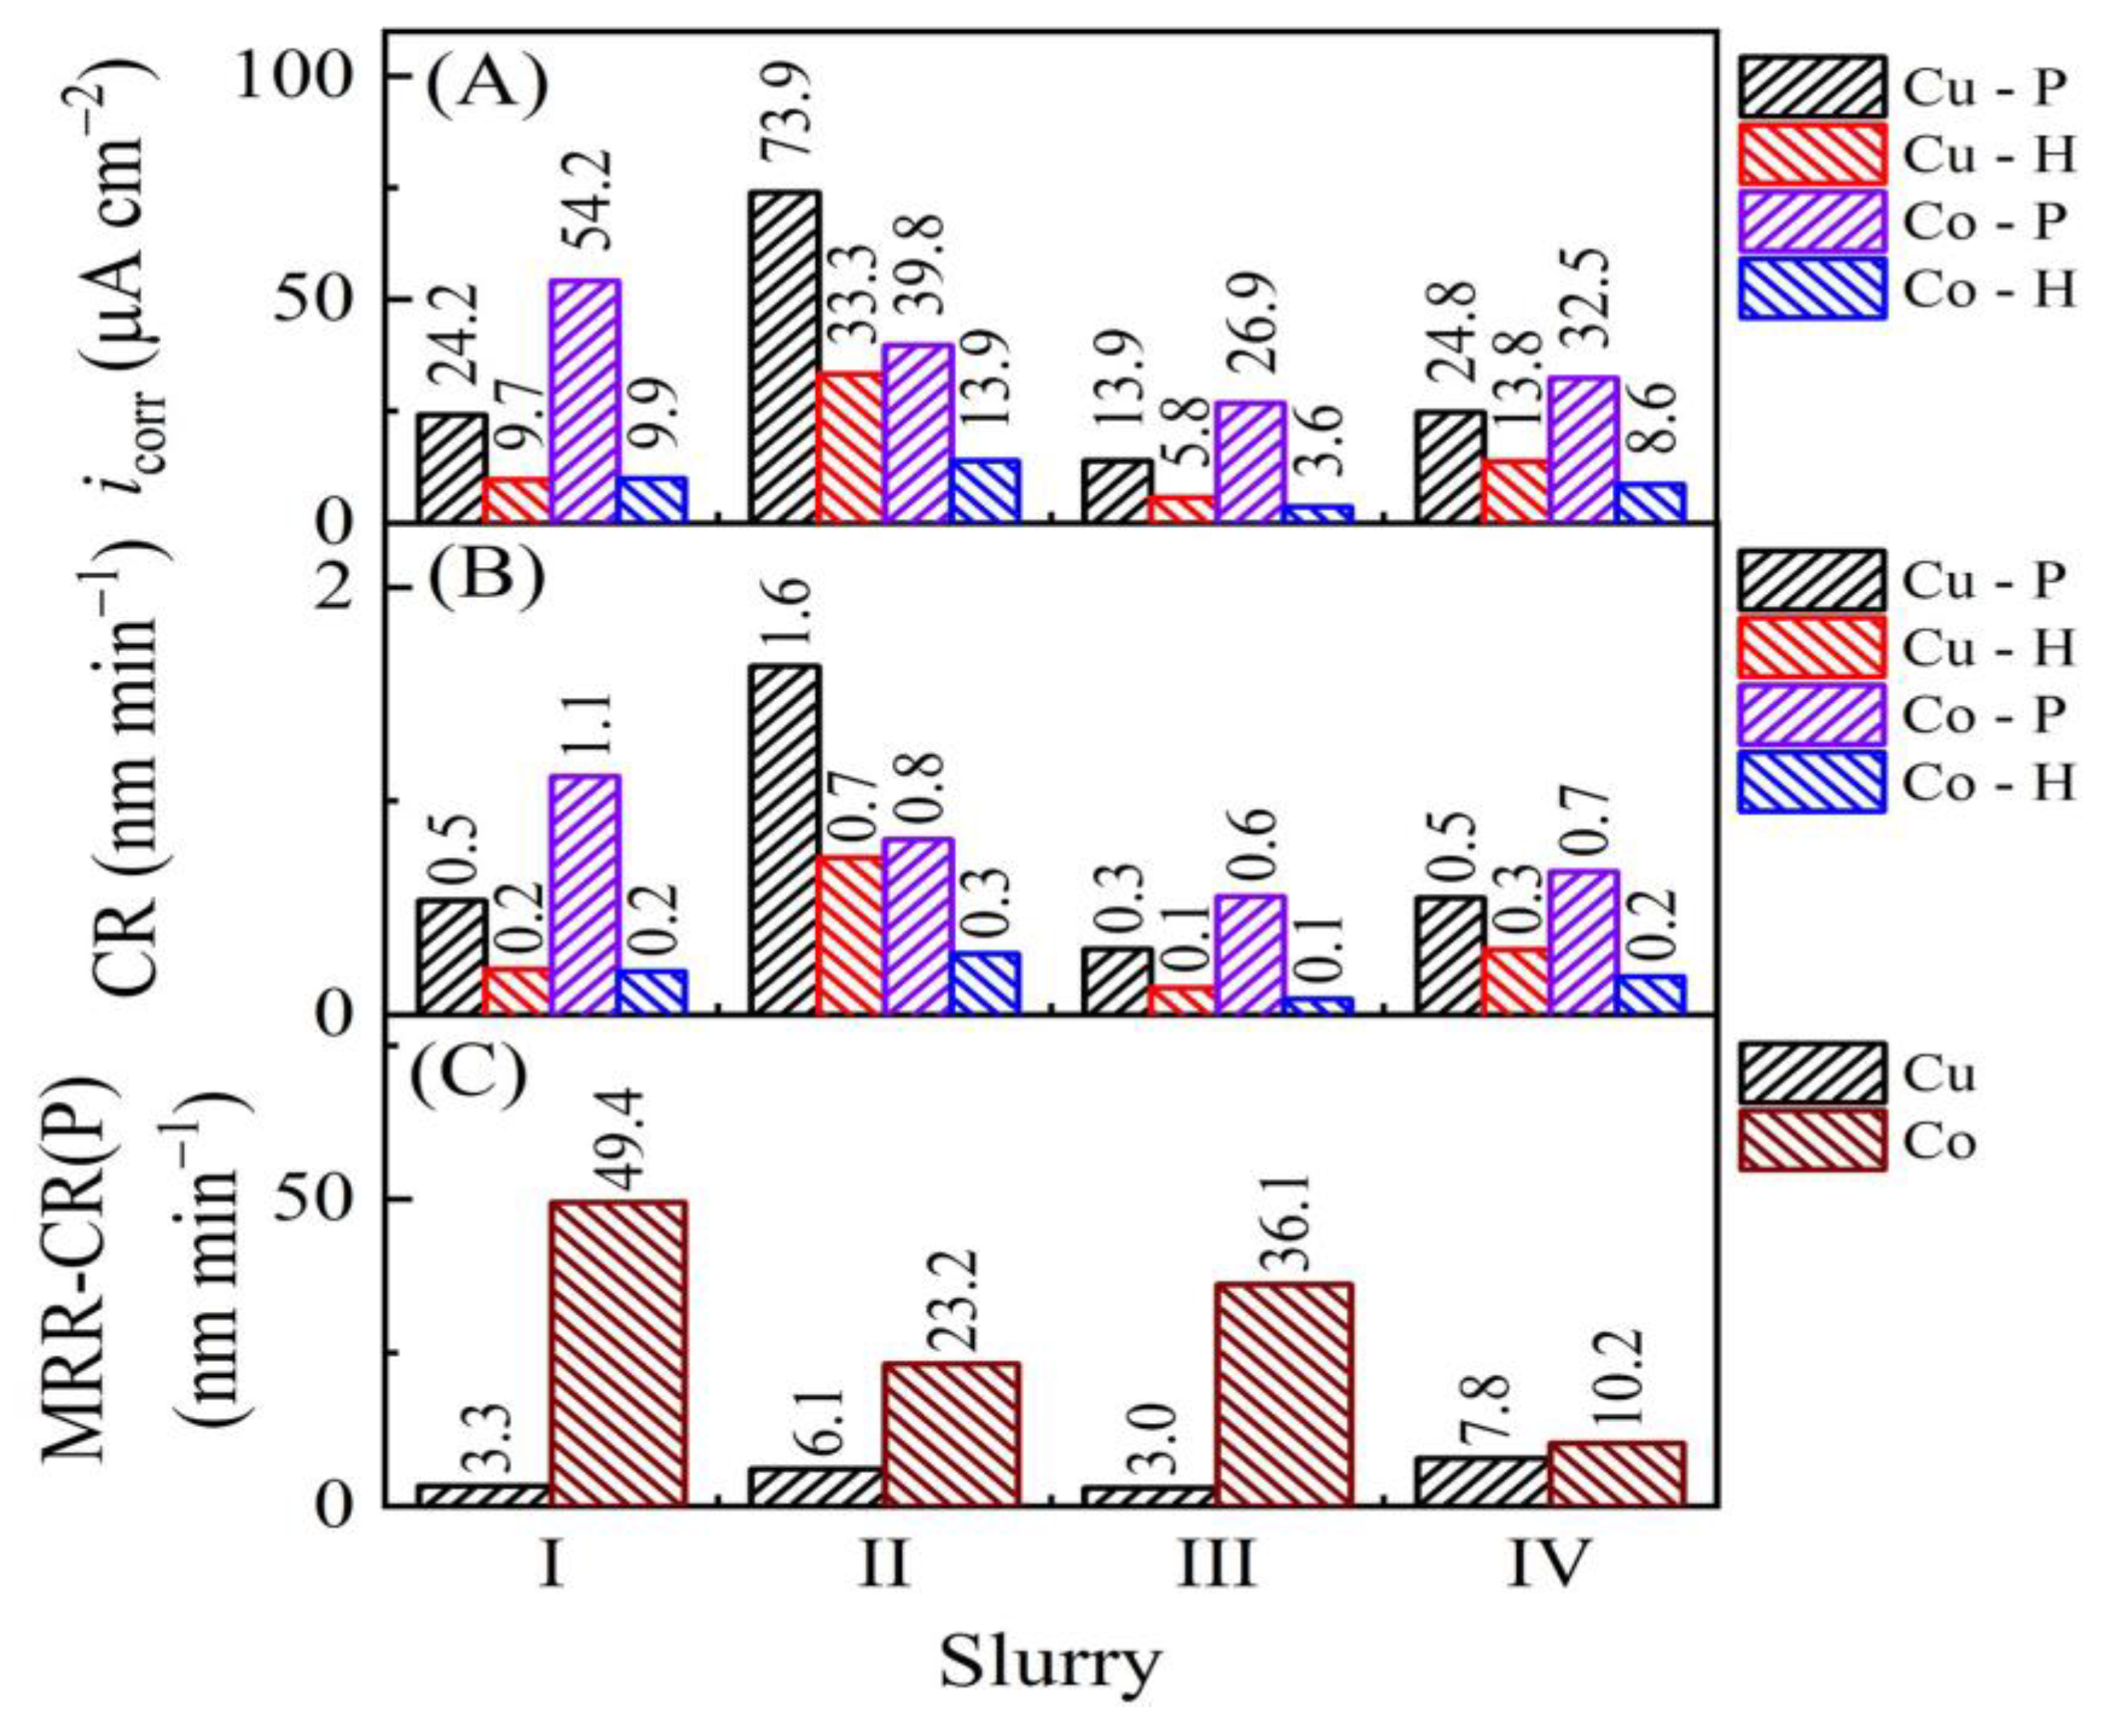
4.1. Results of Material Removal Measurements
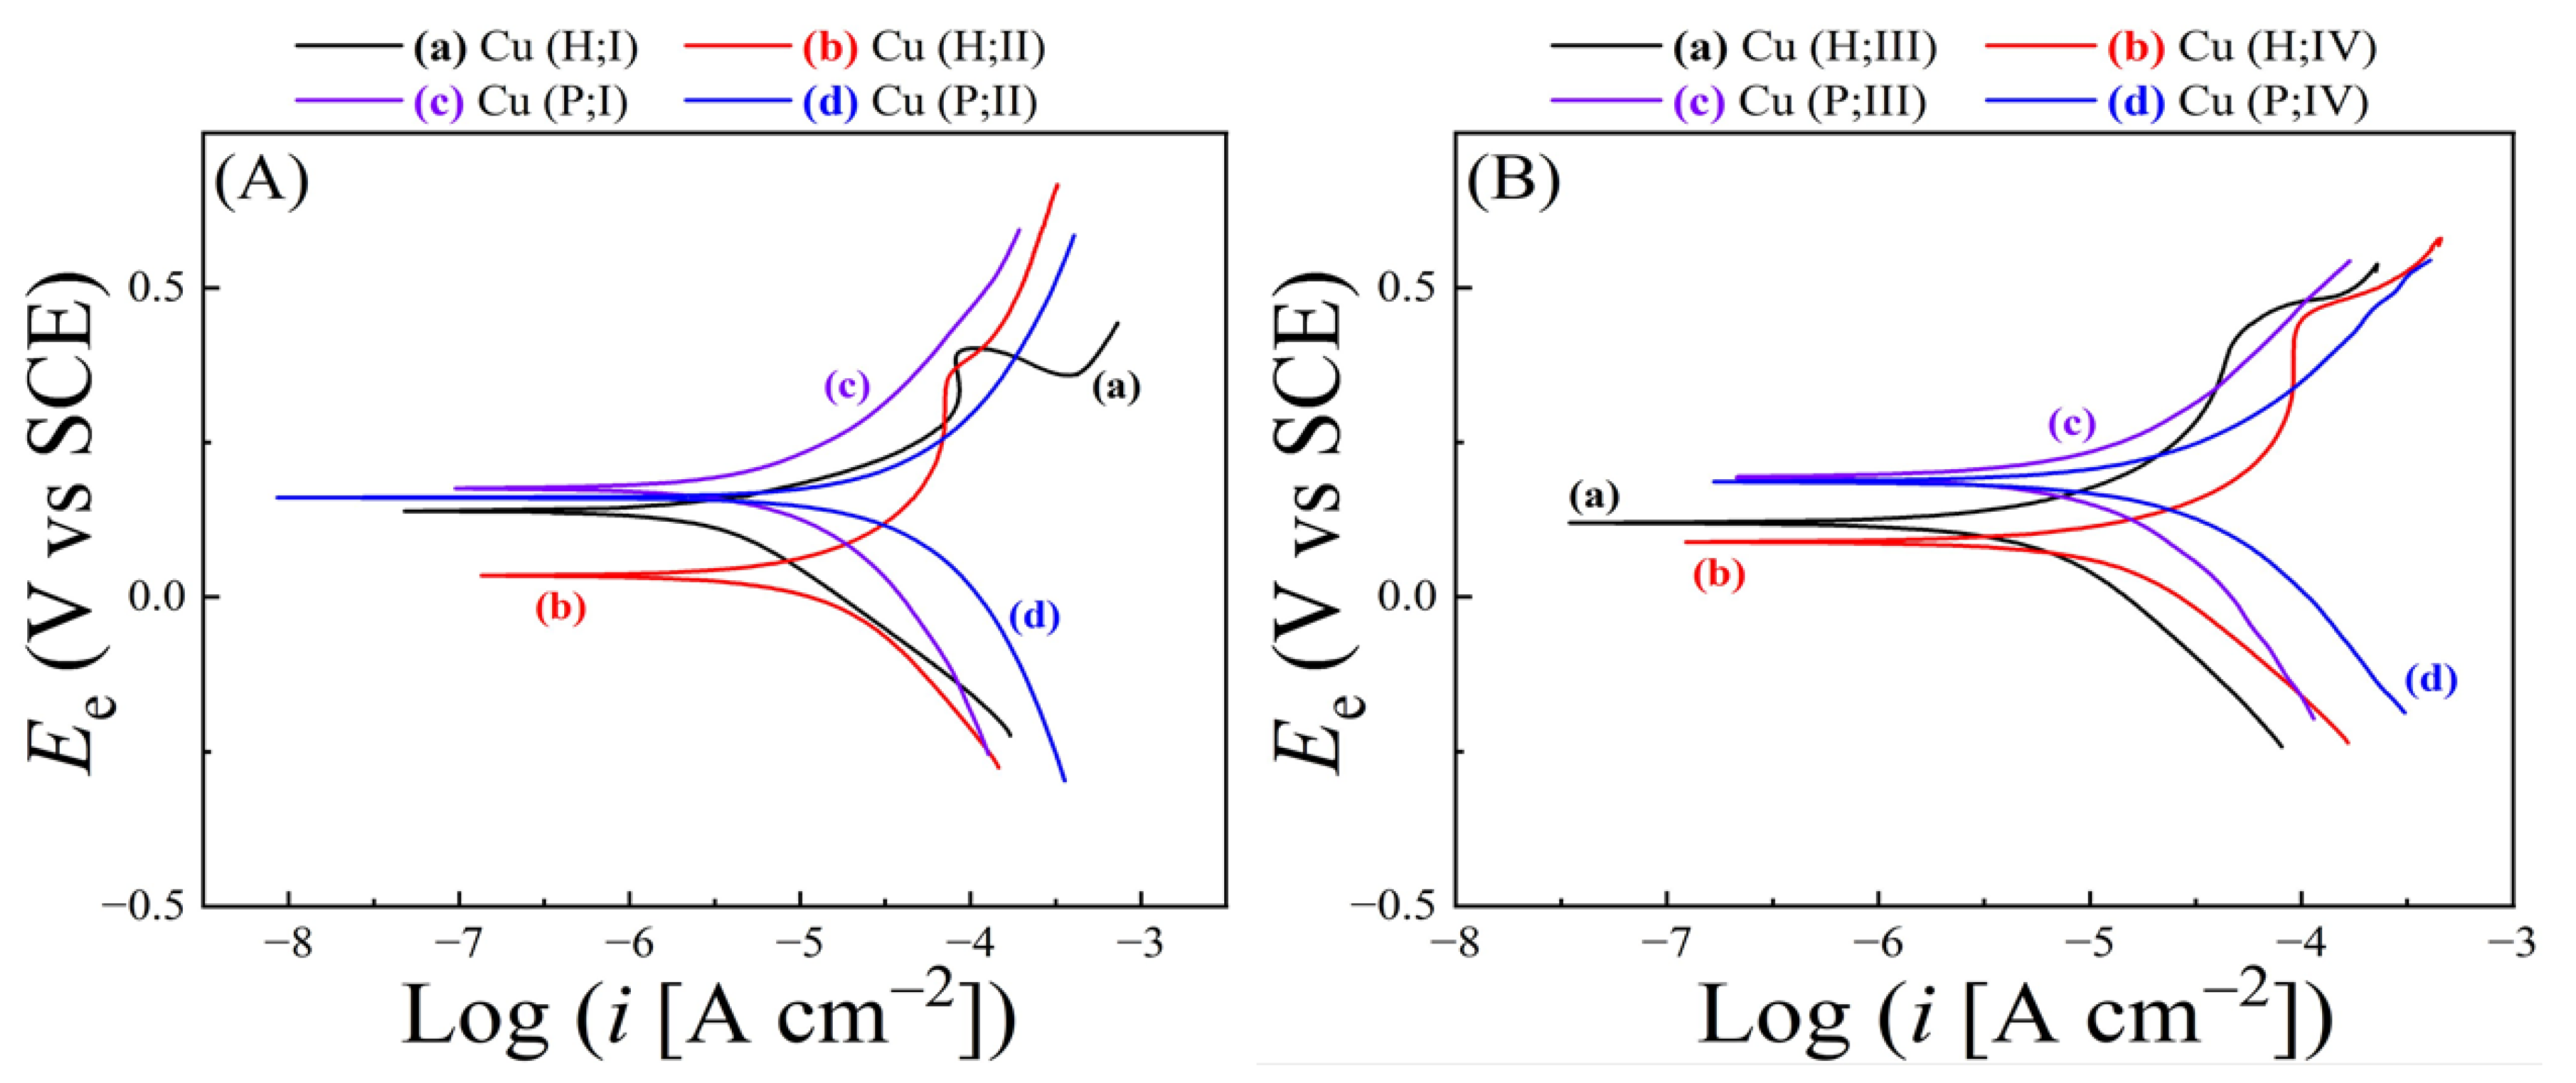
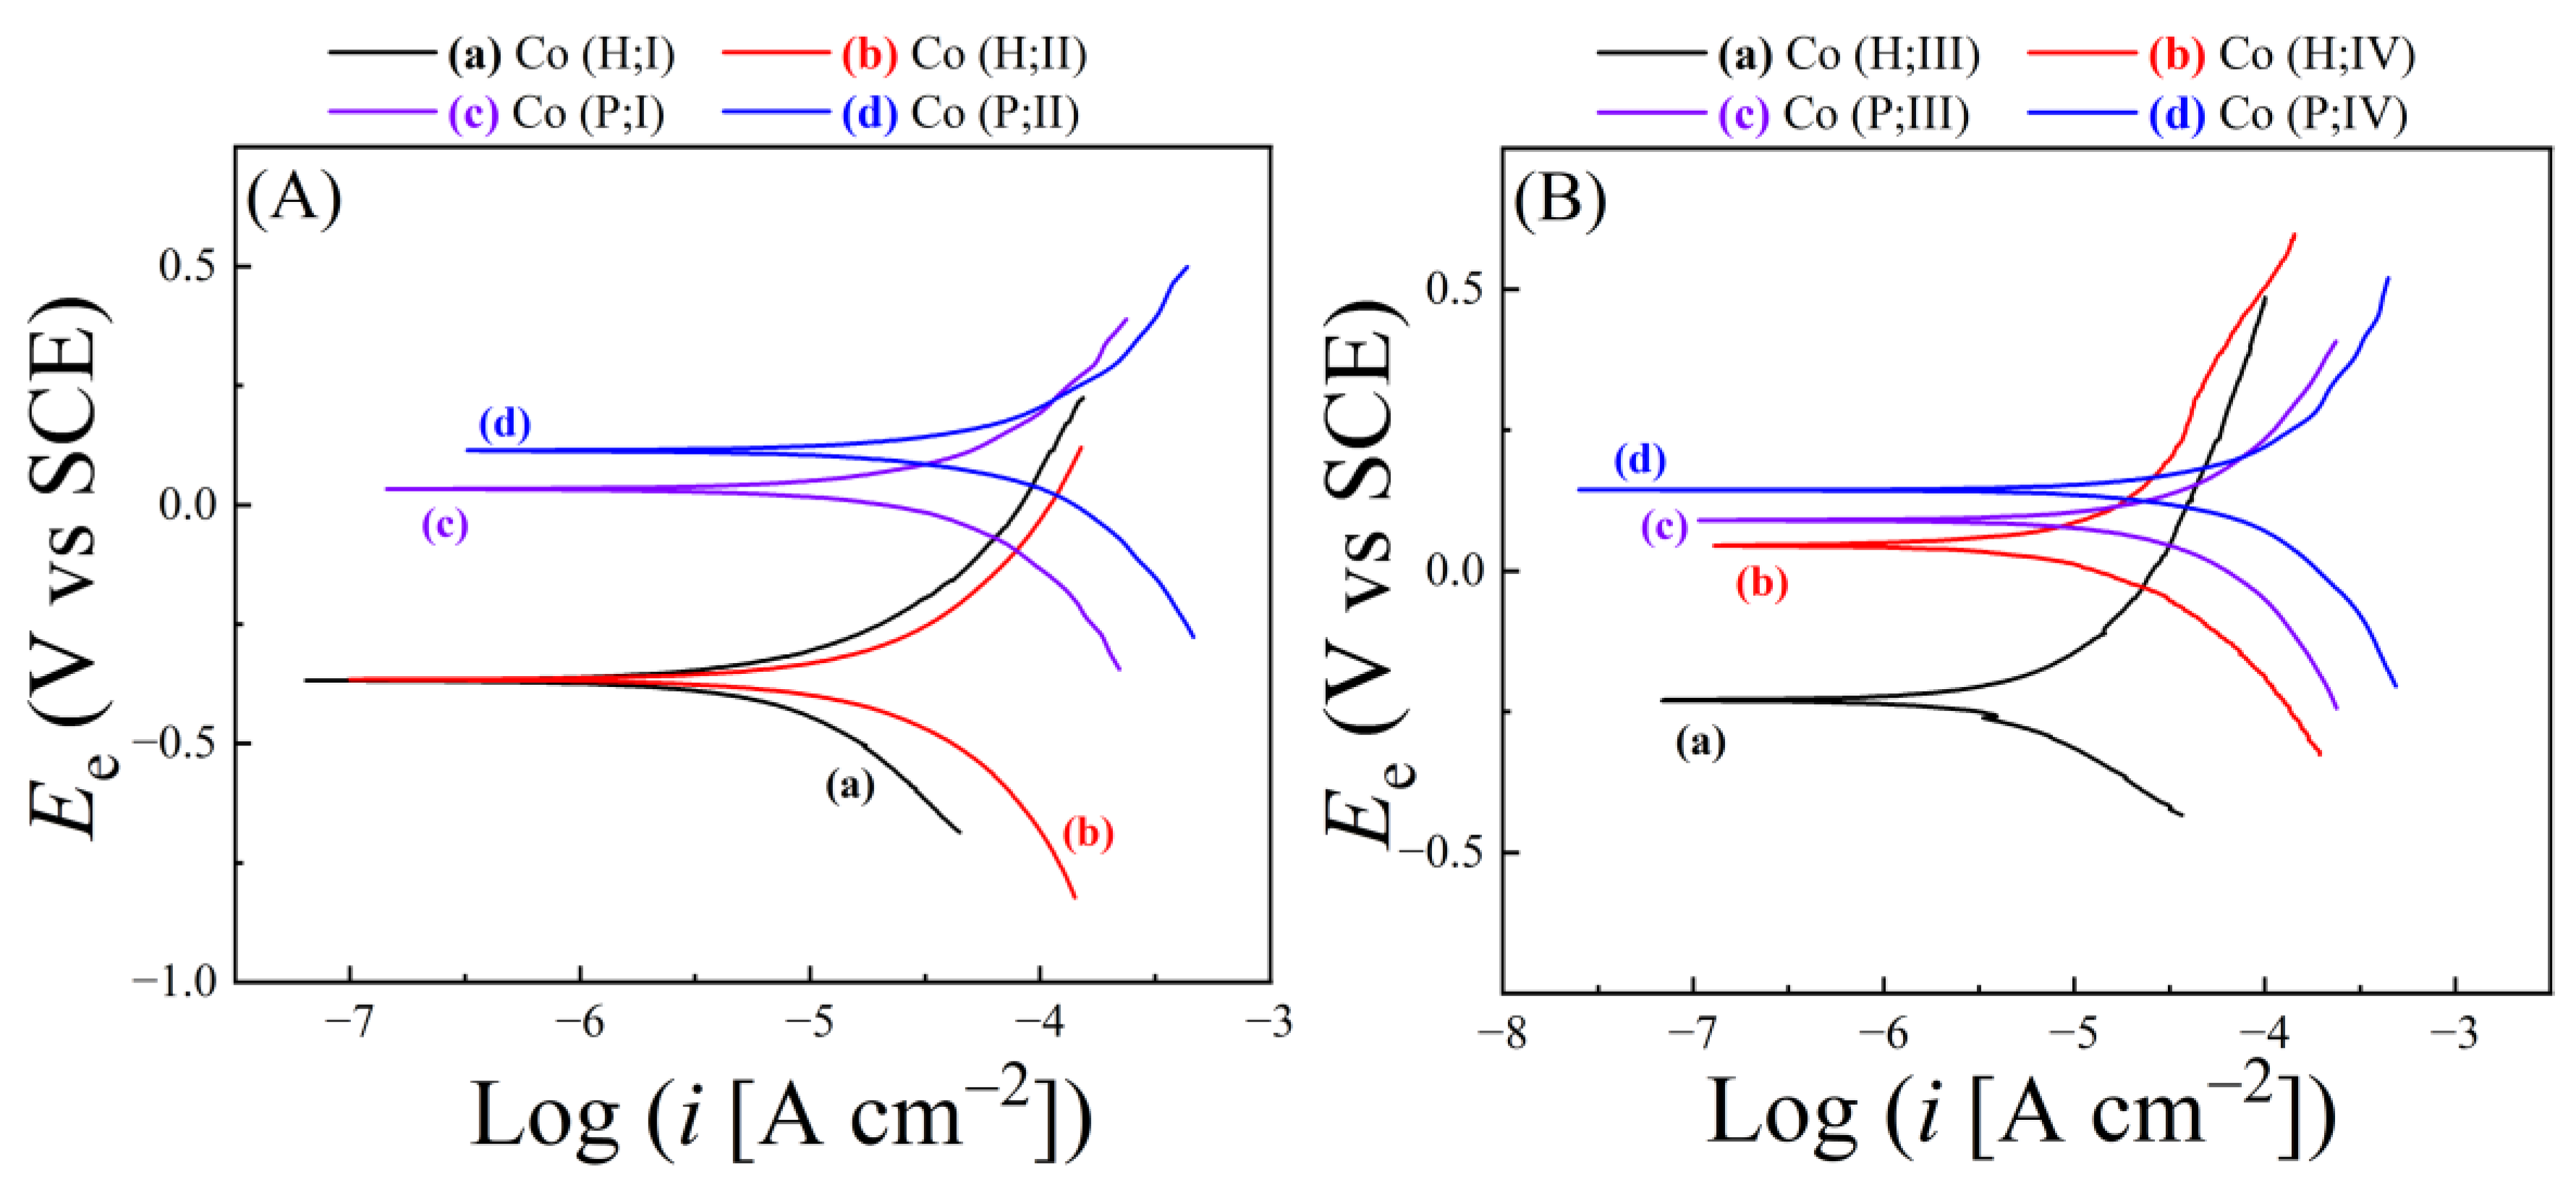
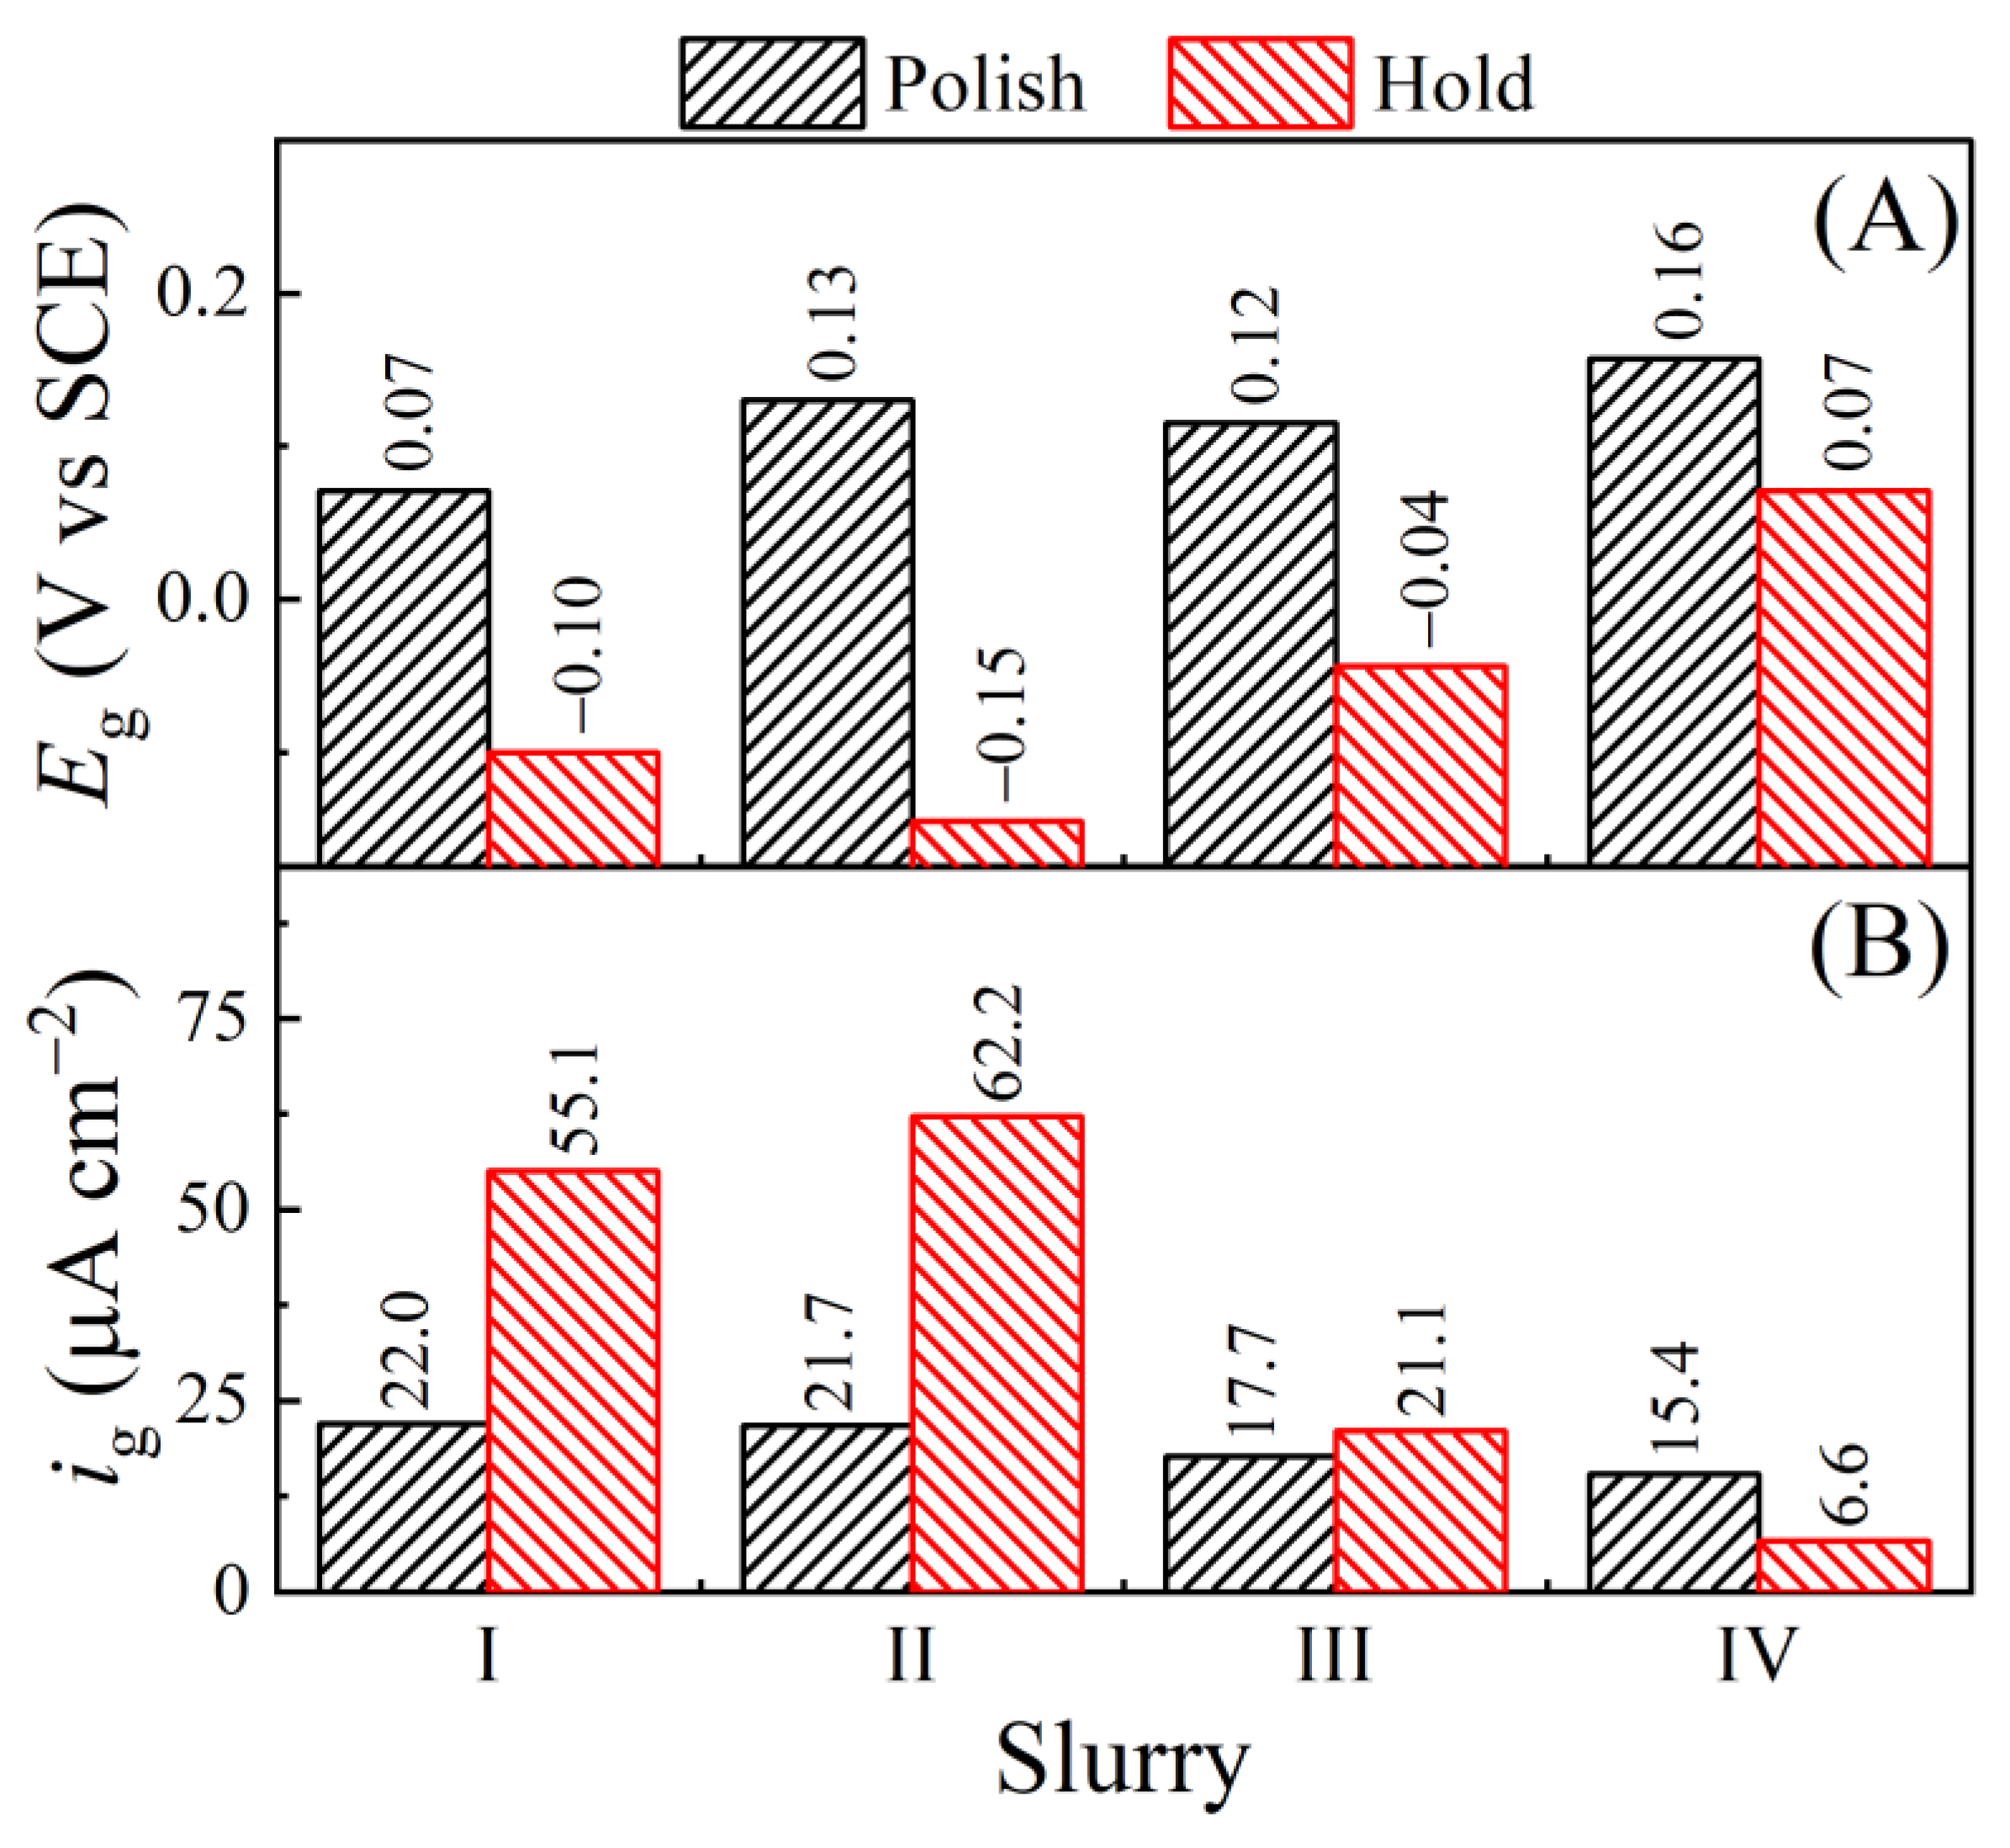
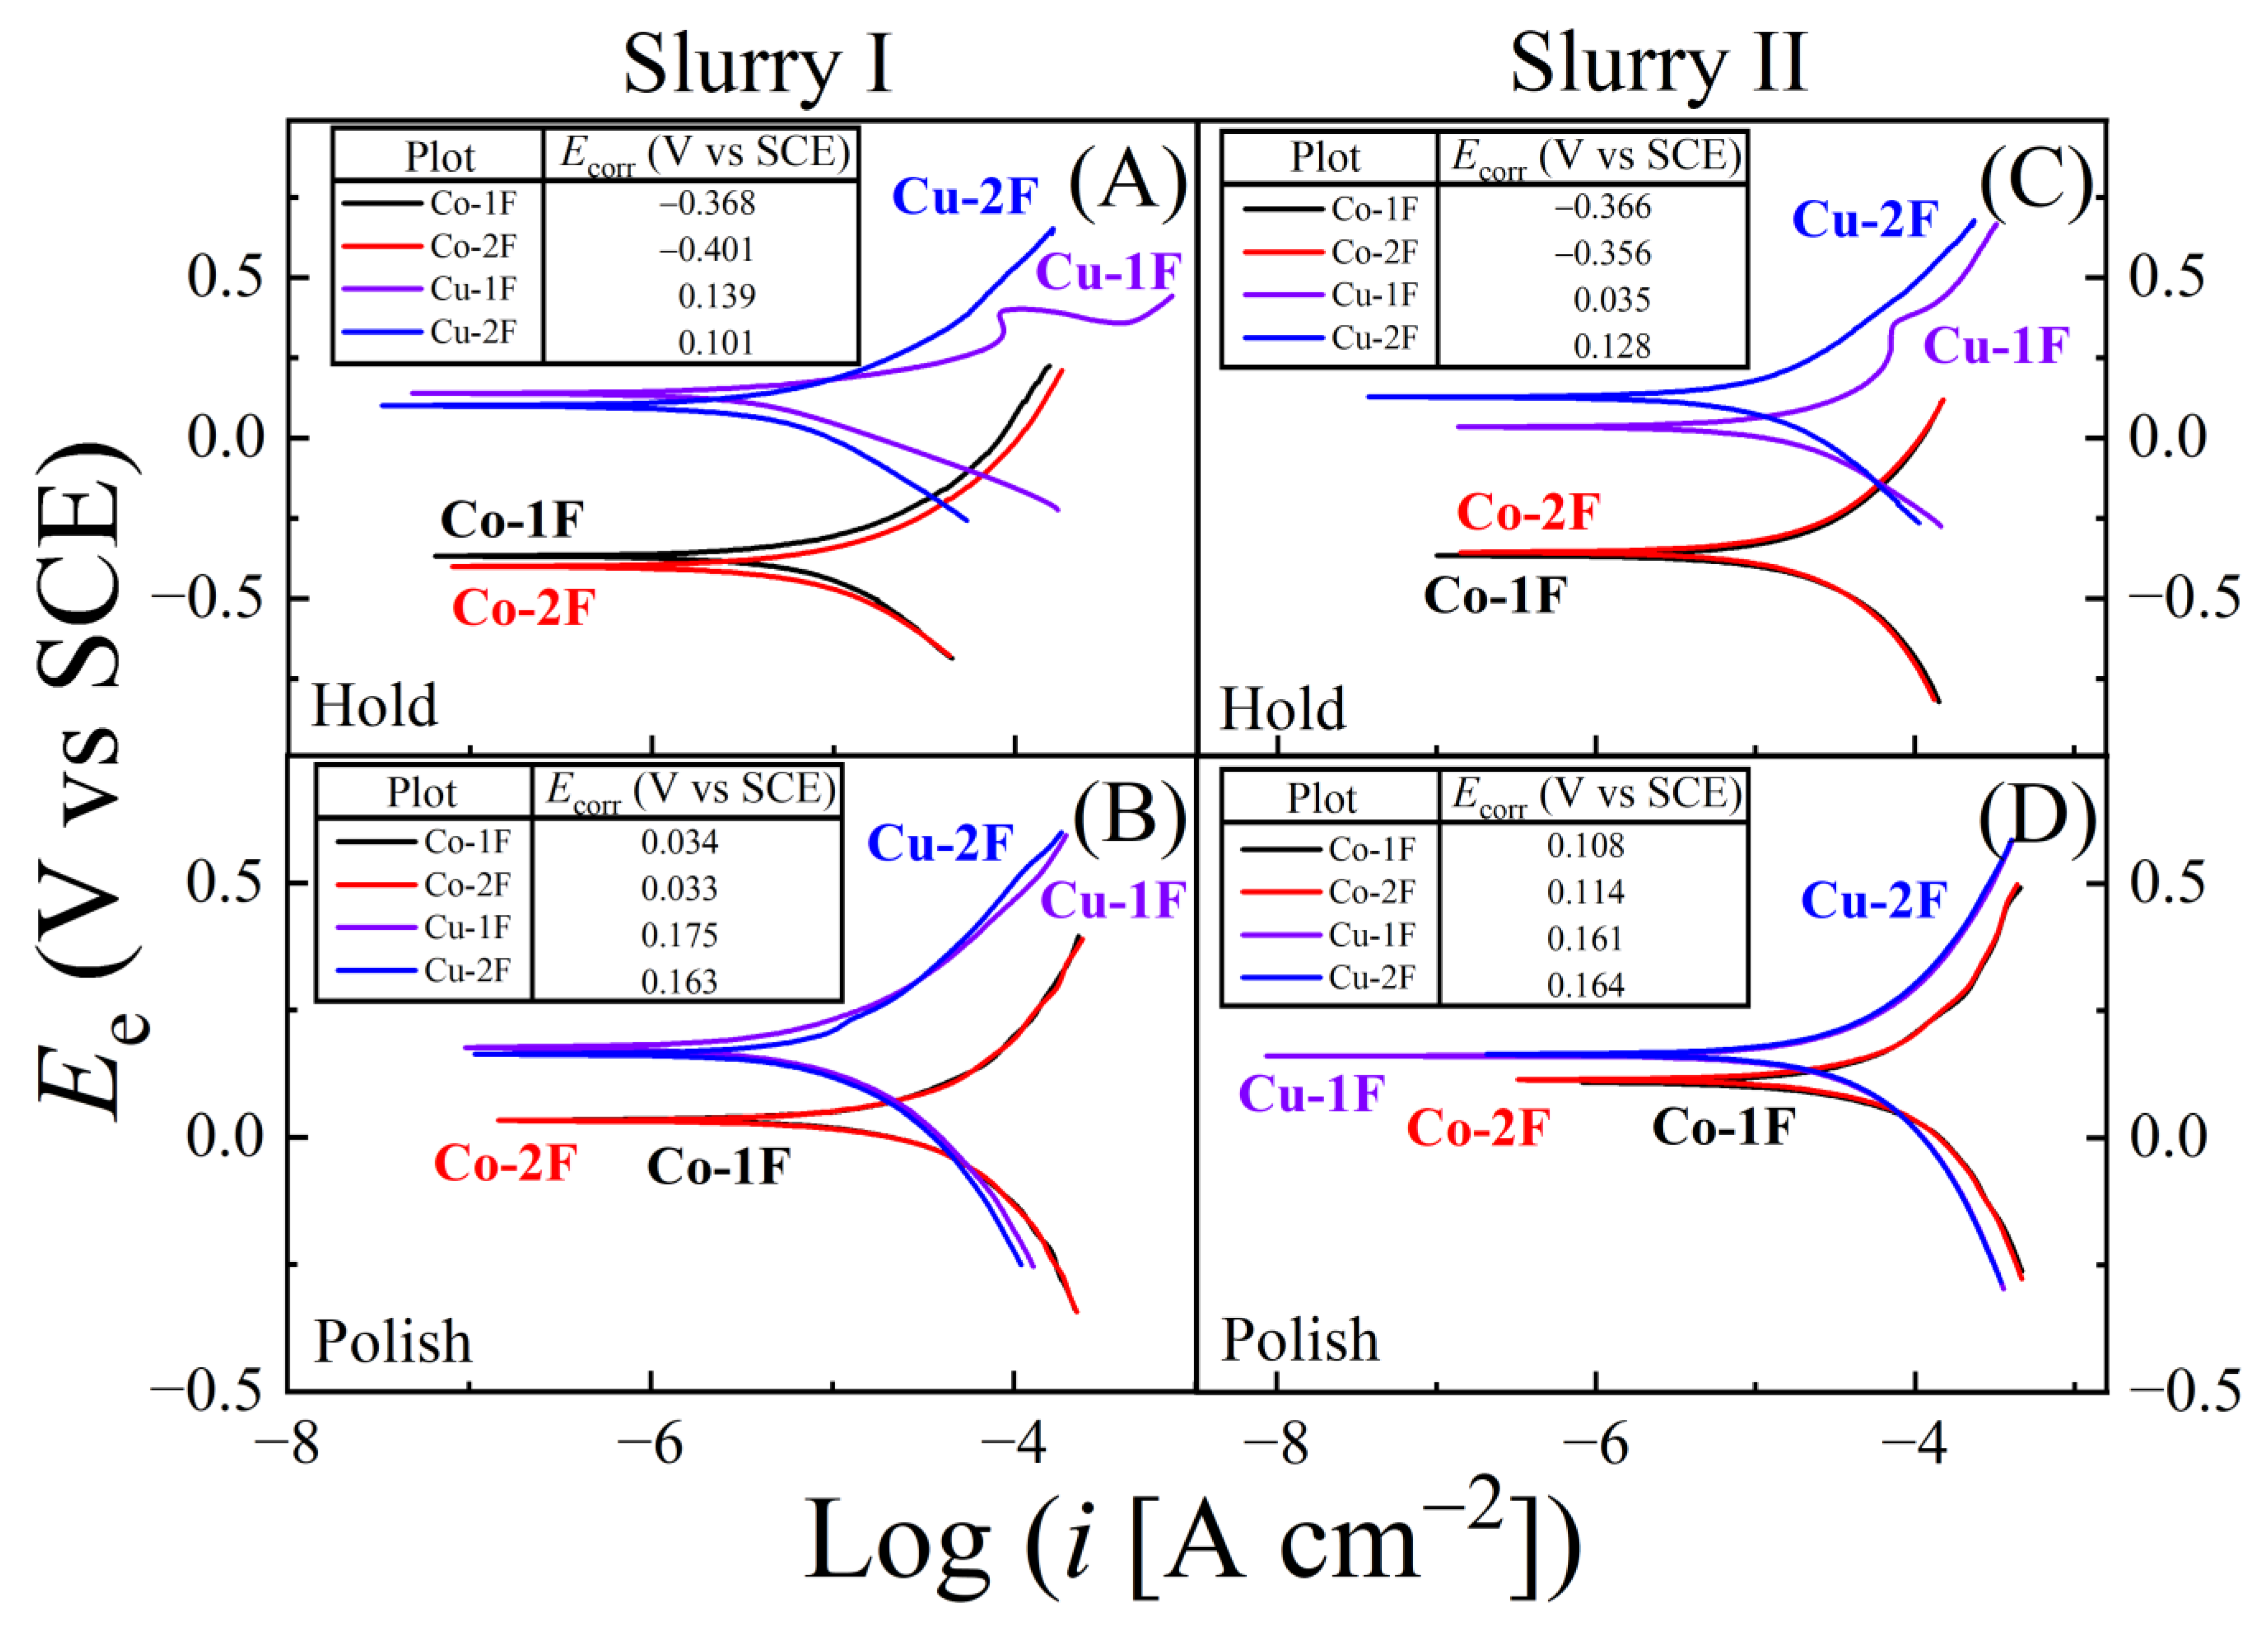
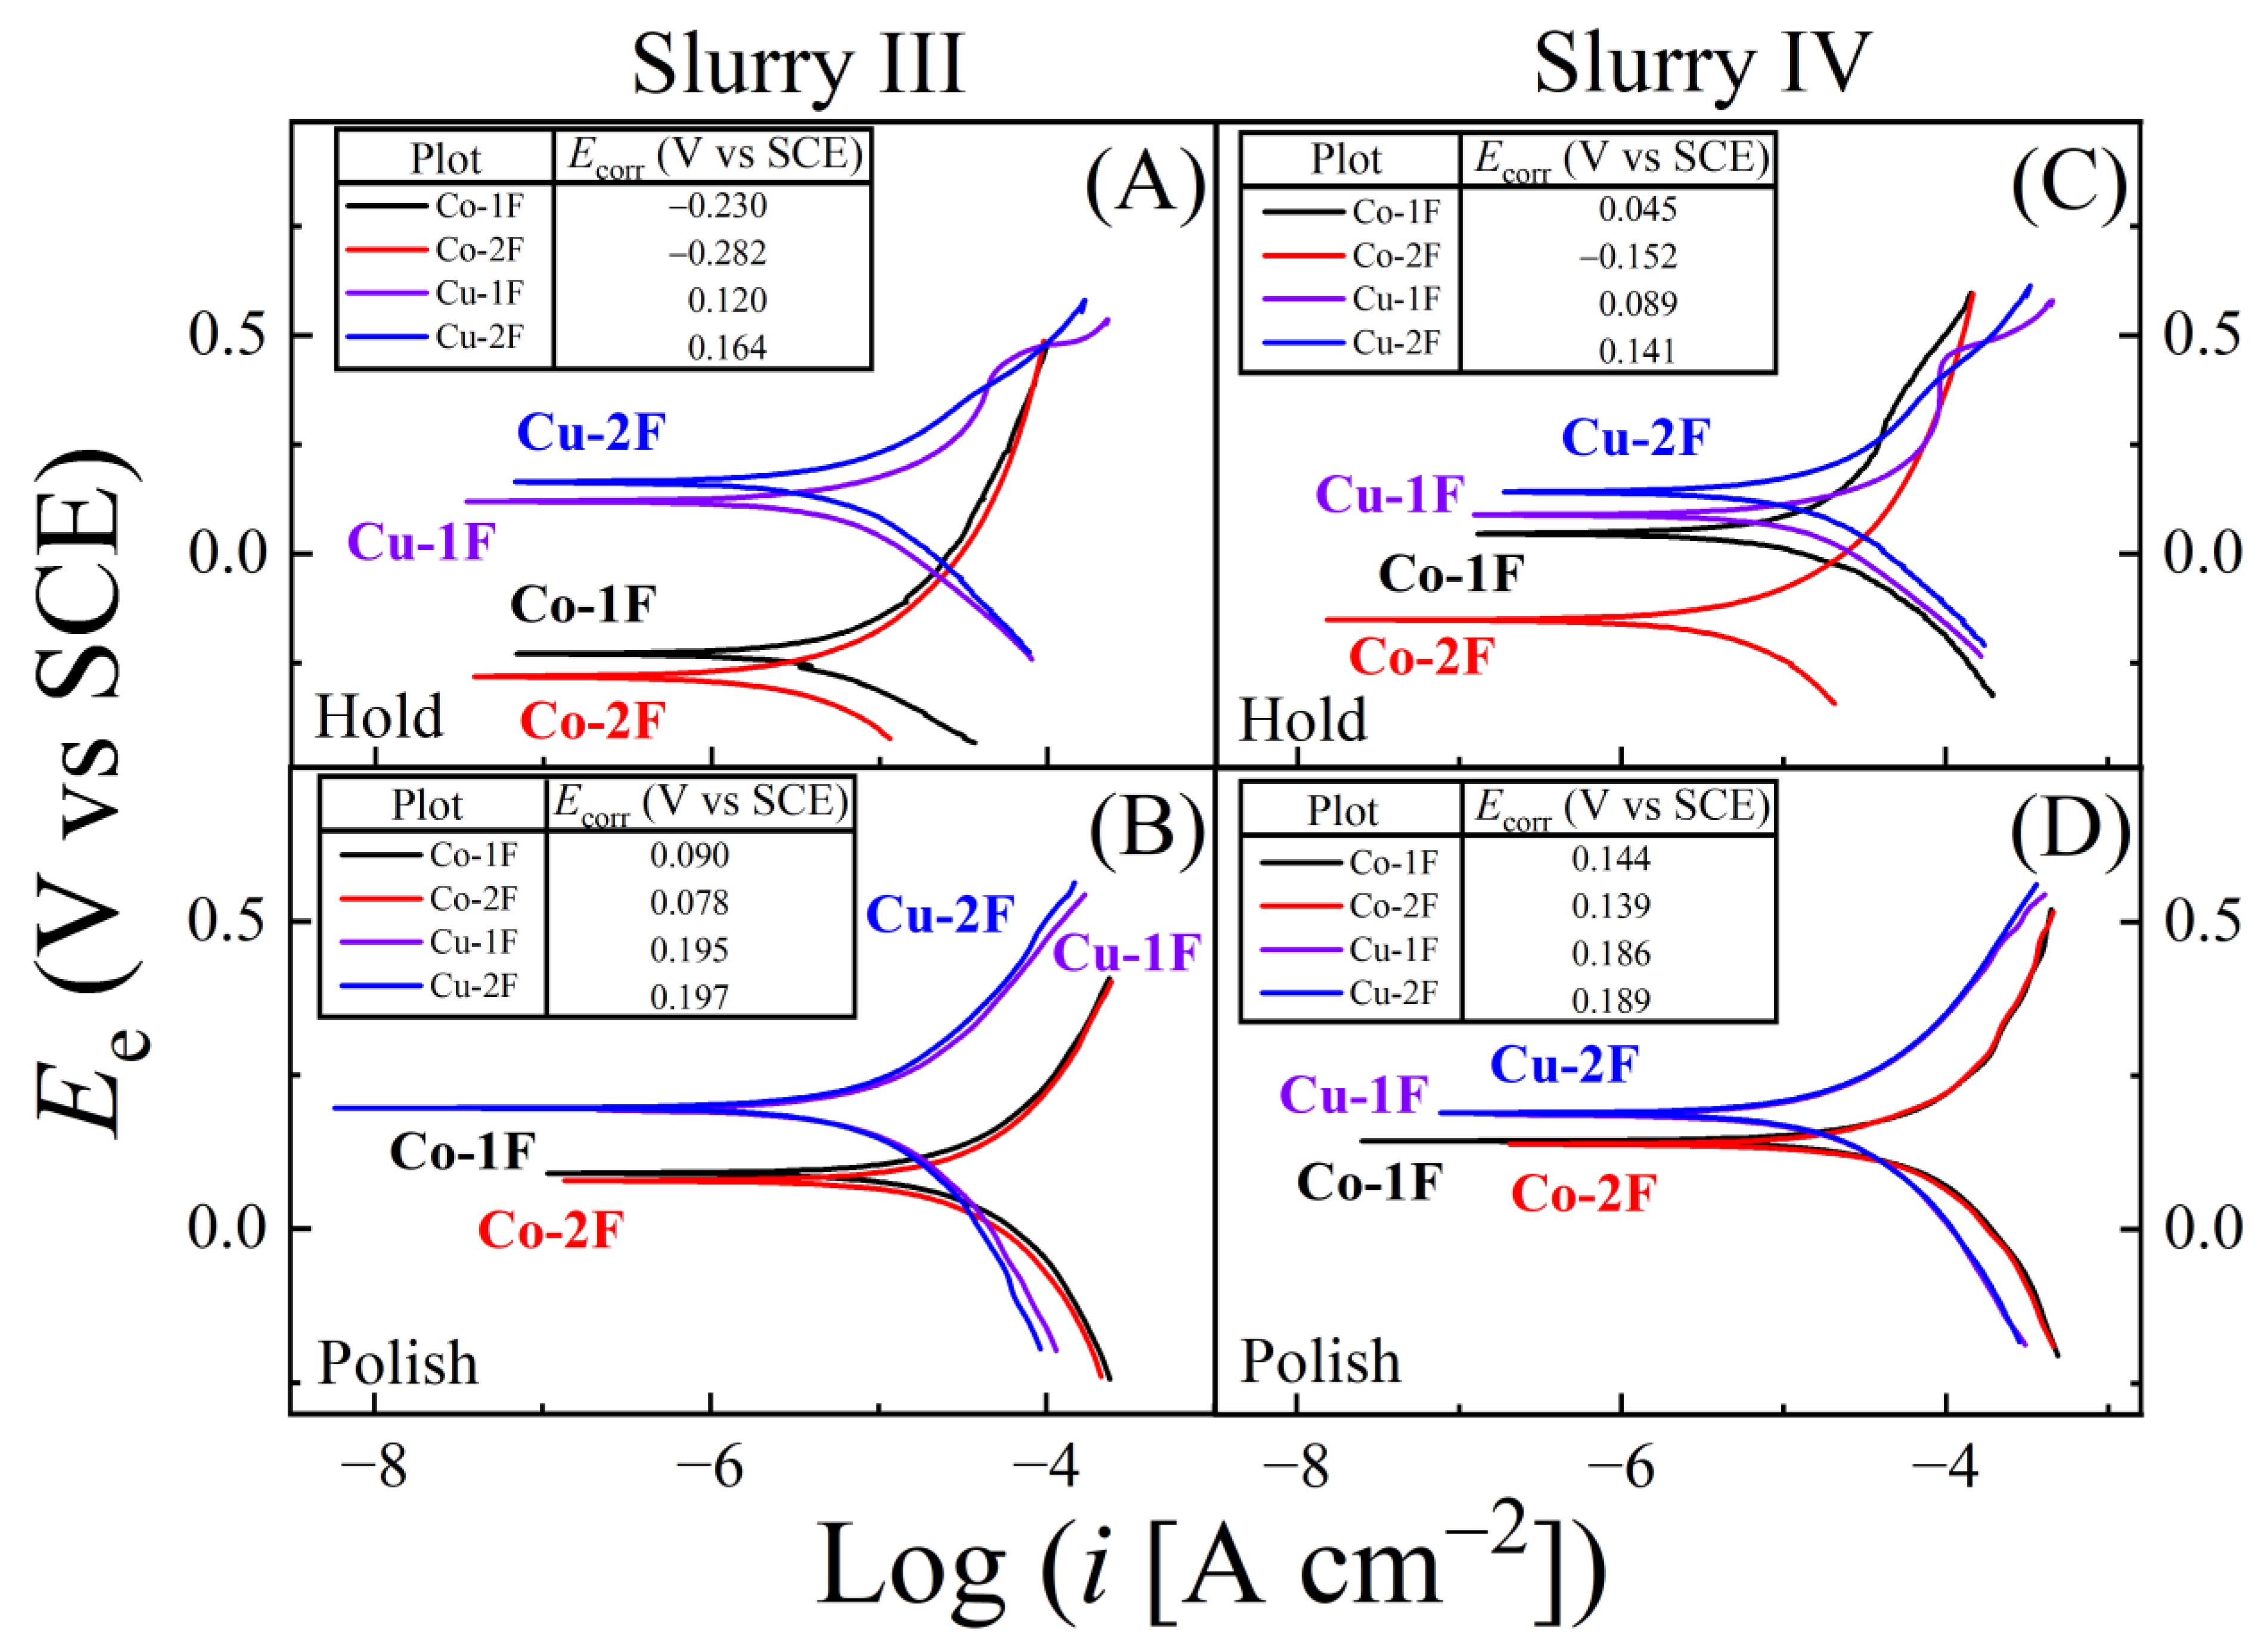
4.2. Surface Reactions for Material Removal Examined Using Tribo-PDP Data
4.3. Mechanistic Aspects of the Chemical Mechanisms of CMP
4.4. Modes of Material Removal
4.5. Experimental Constraints and Considerations for Assessing CMP-Related Galvanic Corrosion
4.5.1. Effects of Mechanical Abrasion on PDP Results
4.5.2. Effects of Area Factors
4.5.3. Effects of PDP Control Variables
4.5.4. Effects of Open Circuit Potential Drifts
4.5.5. Cathodic Coupling of Anode Metal in a Galvanic System
4.5.6. Effects of Microstructure, Morphology and Sample Composition
4.6. Estimating Cutoff Values for CMP-Related Galvanic Corrosion Variables
5. Conclusions
Supplementary Materials
Author Contributions
Funding
Institutional Review Board Statement
Informed Consent Statement
Data Availability Statement
Conflicts of Interest
Nomenclature
| BTA | Benzotriazole |
| CMP | Chemical mechanical planarization |
| CNLS | Complex non-linear least square |
| CR | Corrosion rate |
| EIS | Electrochemical impedance spectroscopy |
| EOE | Edge-over-erosion |
| ER | Etch rate |
| IC | Integrated circuit |
| LSV | Linear sweep voltammetry |
| MA | Malonic acid |
| MRR | Material removal rate |
| OCP | Open circuit potential |
| PDP | Potentiodynamic polarization |
| PZC | Potential of zero charge |
| RPM | Revolutions per minute |
| S | Selectivity |
| SCE | Saturated calomel electrode |
| SPC | Sodium percarbonate |
| TCR | Tribo-corrosion rate |
| A0 | Geometric surface area |
| E/g | Galvanic potential without ohmic correction |
| Ecorr | Corrosion potential |
| Eg | Galvanic potential |
| EOC | Open circuit potential value |
| Era | Equilibrium Nernst potential of an anodic step in mixed potential reaction |
| Erc | Equilibrium Nernst potential of a cathodic step in mixed potential reaction |
| Eth | Thermal voltage |
| F | Faraday constant |
| I | Current at CMP sample surface |
| i | Current density at CMP sample surface |
| i/g | Galvanic current density without ohmic correction |
| i0a | Exchange anodic current density of an anodic step in mixed potential reaction |
| I0a | Exchange current of anodic step in mixed potential reaction |
| i0c | Exchange anodic current density of cathodic step in mixed potential reaction |
| I0c | Exchange current of cathodic step in mixed potential reaction |
| Ia | Anodic current at CMP sample surface |
| ia | Anodic current density at CMP sample surface |
| Ic | Cathodic current at CMP sample surface |
| ic | Cathodic current density at CMP sample surface |
| Icorr | Corrosion current |
| icorr | Corrosion current density |
| id | Dissolution current density |
| ig | Galvanic current density |
| Ig | Galvanic current |
| M | Molecular weight of the metal used for CMP |
| MA | Anode metal in a galvanic couple |
| Mb | Barrier metal (to block Cu diffusion) in a copper interconnect |
| MC | Cathode metal in a galvanic couple |
| n | Number of electrons transferred in a faradaic reaction |
| Rc | Removal rate of CMP material due to chemical wear |
| Rcw | Removal rate of CMP material due to corrosion-induced wear |
| rf(P) | Rate of insoluble surface film formation |
| Rs | Solution resistance |
| Rw | Removal rate of CMP material due to mechanical wear |
| Rwc | Removal rate due to wear-induced corrosion |
| Sa | Effective surface area of anode in a galvanic couple |
| Sc | Effective surface area of cathode in a galvanic couple |
| v | Potential scan rate |
| η | Overpotential |
| θa | Fractional surface coverage of anodic sites |
| θc | Fractional surface coverage of cathodic sites |
| ρ | Mass density of metal used for CMP |
References
- Peethala, C.B.; Kelly, J.J.; Canaperi, D.F.; Krishnan, M.; Nogami, T. Wet Chemical Processes for BEOL Technology. In Springer Handbook of Semiconductor Devices; Springer: Berlin/Heidelberg, Germany, 2022; pp. 219–257. [Google Scholar]
- Tseng, W.-T. Approaches to defect characterization, mitigation and reduction. In Advances in Chemical Mechanical Planarization (CMP), 2nd ed.; Babu, S.V., Ed.; Woodhead Publishing: Cambridge, UK, 2022; pp. 467–503. [Google Scholar]
- Hazarika, J.; Gupta, A.; Rajaraman, P.V. Controlling Galvanic Corrosion with Oxalic Acid and Imidazole for Chemical Mechanical Planarization of Cobalt-Copper Interface. ECS J. Solid State Sci. Techn. 2022, 11, 054007. [Google Scholar] [CrossRef]
- Kondo, S.; Ichige, Y.; Otsuka, Y. Electrochemical study on metal corrosion in chemical mechanical planarization process. Jpn. J. Appl. Phys. 2017, 56, 07KA01. [Google Scholar] [CrossRef]
- Ernur, D.; Terzieva, V.; Schuhmacher, J.; Sutcliffe, V.; Whelan, C.; Maex, K. Corrosion and Inhibition of WN XCY Barrier during Chemical Mechanical Planarization. J. Electrochem. Soc. 2005, 152, B512. [Google Scholar] [CrossRef]
- Wang, L.; Chen, G.; Liu, L.; Lu, X. Galvanic corrosion caused by device structure in chemical mechanical planarization. In Proceedings of the 2022 China Semiconductor Technology International Conference (CSTIC), Shanghai, China, 20–21 June 2022; pp. 1–2. [Google Scholar]
- Wu, L.; Hahn, S.; Yan, C. Investigation of Factor Inducing Edge Over Erosion During Chemical Mechanical Polishing. In Proceedings of the 2021 China Semiconductor Technology International Conference (CSTIC), Shanghai, China, 14–15 March 2021; pp. 1–3. [Google Scholar]
- Kondo, S.; Sakuma, N.; Homma, Y.; Ohashi, N. Slurry chemical corrosion and galvanic corrosion during copper chemical mechanical polishing. Jpn. J. Appl. Phys. 2000, 39, 6216. [Google Scholar] [CrossRef]
- Lee, K.; Sun, S.; Lee, G.; Yoon, G.; Kim, D.; Hwang, J.; Jeong, H.; Song, T.; Paik, U. Galvanic corrosion inhibition from aspect of bonding orbital theory in Cu/Ru barrier CMP. Sci. Rep. 2021, 11, 21214. [Google Scholar] [CrossRef] [PubMed]
- Wan, C.; Liu, J.; Duan, X.; Sun, T. Synergistic Control on Co/Cu Galvanic Corrosion and Its Application for Co Barrier Chemical Mechanical Planarization in Alkaline Slurry. J. Electrochem. Soc. 2024, 171, 011501. [Google Scholar] [CrossRef]
- Tamilmani, S.; Huang, W.; Raghavan, S. Galvanic Corrosion Between Copper and Tantalum under CMP Conditions. J. Electrochem. Soc. 2006, 153, F53–F59. [Google Scholar] [CrossRef]
- Shi, X.; Rock, S.; Turk, M.; Roy, D. Minimizing the effects of galvanic corrosion during chemical mechanical planarization of aluminum in moderately acidic slurry solutions. Mater. Chem. Phys. 2012, 136, 1027–1037. [Google Scholar] [CrossRef]
- Assiongbon, K.A.; Emery, S.B.; Gorantla, V.R.K.; Babu, S.V.; Roy, D. Electrochemical impedance characteristics of Ta/Cu contact regions in polishing slurries used for chemical mechanical planarization of Ta and Cu: Considerations of galvanic corrosion. Corros. Sci. 2006, 48, 372–388. [Google Scholar] [CrossRef]
- Johnson, C.; Wei, S.; Roy, D. An Alkaline Slurry Design for Co-Cu CMP Systems Evaluated in the Tribo-Electrochemical Approach. ECS J. Solid State Sci. Technol. 2018, 7, P38–P49. [Google Scholar] [CrossRef]
- Turk, M.; Walters, M.; Roy, D. Tribo-electrochemical investigation of a slurry composition to reduce dissolution and galvanic corrosion during chemical mechanical planarization of Cu-Ru interconnects. Mater. Chem. Phys. 2017, 201, 271–288. [Google Scholar] [CrossRef]
- Turk, M.; Rock, S.; Amanapu, H.; Teugels, L.; Roy, D. Investigation of percarbonate based slurry chemistry for controlling galvanic corrosion during CMP of ruthenium. ECS J. Solid State Sci. Technol. 2013, 2, P205. [Google Scholar] [CrossRef]
- Noh, K.; Saka, N.; Chun, J.-H. A mechanical model for erosion in copper chemical-mechanical polishing. DSpace@MIT 2003. Available online: https://dspace.mit.edu/handle/1721.1/3746?show=full (accessed on 15 February 2025).
- Seo, J. A review on chemical and mechanical phenomena at the wafer interface during chemical mechanical planarization. J. Mater. Res. 2021, 36, 235–257. [Google Scholar] [CrossRef]
- Wang, C.; Zhou, R.; Zhou, W.; He, H.; Li, X. Barrier CMP slurry for low topography and wide process window. In Proceedings of the 2015 China Semiconductor Technology International Conference, Shanghai, China, 15–16 March 2015; pp. 1–3. [Google Scholar]
- Weste, N.H.; Harris, D. CMOS VLSI Design: A Circuits and Systems Perspective; Pearson Education: Boston, MA, USA, 2015. [Google Scholar]
- An, B.-S.; Kwon, Y.; Oh, J.-S.; Lee, M.; Pae, S.; Yang, C.-W. Amorphous Ta x Mn y O z layer as a diffusion barrier for advanced copper interconnects. Sci. Rep. 2019, 9, 20132. [Google Scholar] [CrossRef] [PubMed]
- Lanzillo, N.A.; Yang, C.-C.; Motoyama, K.; Huang, H.; Cheng, K.; Maniscalco, J.; Van Der Straten, O.; Penny, C.; Standaert, T.; Choi, K. Exploring the limits of cobalt liner thickness in advanced copper interconnects. IEEE Electron. Device Lett. 2019, 40, 1804–1807. [Google Scholar] [CrossRef]
- Gall, D. The search for the most conductive metal for narrow interconnect lines. J. Appl. Phys. 2020, 127. [Google Scholar] [CrossRef]
- Li, Z.; Tian, Y.; Teng, C.; Cao, H. Recent advances in barrier layer of Cu interconnects. Materials 2020, 13, 5049. [Google Scholar] [CrossRef] [PubMed]
- Tanwar, K.; Canaperi, D.; Lofaro, M.; Tseng, W.-t.; Patlolla, R.; Penny, C.; Waskiewicz, C. BEOL Cu CMP process evaluation for advanced technology nodes. J. Electrochem. Soc. 2013, 160, D3247. [Google Scholar] [CrossRef]
- Lee, D.; Lee, H.; Jeong, H. Slurry components in metal chemical mechanical planarization (CMP) process: A review. Int. J. Precis. Eng. Manuf. 2016, 17, 1751–1762. [Google Scholar] [CrossRef]
- Parsons, R. General equations for the kinetics of electrode processes. Trans. Faraday Soc. 1951, 47, 1332–1344. [Google Scholar] [CrossRef]
- Stansbury, E.; Buchanan, R. (Eds.) Introduction and overview of electrochemical corrosion. In Fundamentals of Electrochemical Corrosion; ASM International: Materials Park, OH, USA, 2000; pp. 1–21. [Google Scholar]
- Gamagedara, K.; Roy, D. Experimental Strategies for Studying Tribo-Electrochemical Aspects of Chemical–Mechanical Planarization. Lubricants 2024, 12, 63. [Google Scholar] [CrossRef]
- Mansfeld, F. Area relationship in galvanic corrosion. Corrosion 1971, 27, 436–442. [Google Scholar] [CrossRef]
- Mansfeld, F.; Kenkel, J. Galvanic corrosion of A1 alloys—II. Effect of solution composition. Corros. Sci. 1975, 15, 183–198. [Google Scholar] [CrossRef]
- Dariva, C.G.; Galio, A.F. Corrosion inhibitors–principles, mechanisms and applications. Dev. Corros. Prot. 2014, 16, 365–378. [Google Scholar]
- Ma, I.W.; Ammar, S.; Kumar, S.S.; Ramesh, K.; Ramesh, S. A concise review on corrosion inhibitors: Types, mechanisms and electrochemical evaluation studies. J. Coat. Technol. Res. 2022, 29, 241–268. [Google Scholar] [CrossRef]
- Chyżewski, E.; Evans, U. The classification of anodic and cathodic inhibitors. Trans. Electrochem. Soc. 1939, 76, 215. [Google Scholar] [CrossRef]
- Kim, Y.-G.; Baricuatro, J.H.; Javier, A.; Gregoire, J.M.; Soriaga, M.P. The evolution of the polycrystalline copper surface, first to Cu (111) and then to Cu (100), at a fixed CO2RR potential: A study by operando EC-STM. Langmuir 2014, 30, 15053–15056. [Google Scholar] [CrossRef] [PubMed]
- Simon, G.H.; Kley, C.S.; Roldan Cuenya, B. Potential-dependent morphology of copper catalysts during CO2 electroreduction revealed by in situ atomic force microscopy. Angew. Chem. Int. Ed. 2021, 60, 2561–2568. [Google Scholar] [CrossRef]
- Chockalingam, A.M.; Lagudu, U.R.K.; Babu, S. Potassium periodate-based solutions for minimizing galvanic corrosion at the Cu-Mn interface and for polishing the associated Cu interconnect structures. ECS J. Solid State Sci. Technol. 2013, 2, P160. [Google Scholar] [CrossRef]
- Xu, Y.; Ma, T.; Liu, Y.; Tan, B.; Zhang, S.; Wang, Y.; Song, G. Effect of ethylenediamine on CMP performance of ruthenium in H2O2-based slurries. RSC Adv. 2022, 12, 228–240. [Google Scholar] [CrossRef]
- Wei, S.; Roy, D. Galvanodynamic probing of tribologically assisted material removal under chemical control: A cobalt/copper case study for application in chemical mechanical planarization. Tribol. Int. 2023, 179, 108185. [Google Scholar] [CrossRef]
- Gamagedara, K.; Roy, D. Mechanisms of Chemically Promoted Material Removal Examined for Molybdenum and Copper CMP in Weakly Alkaline Citrate-Based Slurries. Materials 2024, 17, 4905. [Google Scholar] [CrossRef] [PubMed]
- Luan, X.; Liu, Y.; Wang, C.; Liu, G. Stability of weakly alkaline barrier slurry with the high selectivity. Microelectron. Eng. 2014, 130, 28–34. [Google Scholar] [CrossRef]
- Fan, S.; Liu, Y.; Sun, M.; Tang, J.; Yan, C.; Li, H.; Wang, S. Next generation barrier CMP slurry with novel weakly alkaline chelating agent. J. Semicond. 2015, 36, 016002. [Google Scholar] [CrossRef]
- Zhang, B.; Liu, Y.; Wang, C. BTA free alkaline slurries developed for copper and barrier CMP. ECS J. Solid State Sci. Technol. 2015, 4, P5112. [Google Scholar] [CrossRef]
- Gottfried, K.; Schubert, I.; Schulz, S.; Gessner, T. Cu/barrier CMP on porous low-k based interconnect schemes. Microelectron. Eng. 2006, 83, 2218–2224. [Google Scholar] [CrossRef]
- Akbar, W.; Ertunç, Ö. Model-based optimization of CMP process parameters for uniform material removal selectivity in Cu/barrier planarization. ECS J. Solid State Sci. Technol. 2022, 11, 024003. [Google Scholar] [CrossRef]
- Di, Y.; Pan, G.; Lv, S.; She, L.; Zhai, L.; Qi, Y. Chemical mechanical polishing on cobalt-based barrier through dual functionality of salicylhydroxamic acid between the removal of copper and corrosion inhibition. Electrochim. Acta 2025, 514, 145689. [Google Scholar] [CrossRef]
- Rock, S.; Crain, D.; Pettit, C.; Roy, D. Surface-complex films of guanidine on tantalum nitride electrochemically characterized for applications in chemical mechanical planarization. Thin Solid Film. 2012, 520, 2892–2900. [Google Scholar] [CrossRef]
- Rock, S.E.; Crain, D.J.; Zheng, J.P.; Pettit, C.M.; Roy, D. Electrochemical investigation of the surface-modifying roles of guanidine carbonate in chemical mechanical planarization of tantalum. Mater. Chem. Phys. 2011, 129, 1159–1170. [Google Scholar] [CrossRef]
- Beverskog, B.; Puigdomenech, I. Revised Pourbaix diagrams for copper at 25 to 300 C. J. Electrochem. Soc. 1997, 144, 3476. [Google Scholar] [CrossRef]
- Protopopoff, E.; Marcus, P. Potential–pH diagrams for hydroxyl and hydrogen adsorbed on a copper surface. Electrochim. Acta 2005, 51, 408–417. [Google Scholar] [CrossRef]
- Morimoto, J.; DeGraff, B. Photochemistry of copper complexes. Copper (II) malonate system. J. Phys. Chem. 1975, 79, 326–331. [Google Scholar] [CrossRef]
- Rizvi, M.; Gerengi, H.; Kaya, S.; Uygur, I.; Yıldız, M.; Sarıoglu, I.; Cingiz, Z.; Mielniczek, M.; El Ibrahimi, B. Sodium nitrite as a corrosion inhibitor of copper in simulated cooling water. Sci. Rep. 2021, 11, 8353. [Google Scholar] [CrossRef]
- Banerjee, P.; Sengupta, S.; Murmu, M.; Murmu, N.C. Copper oxide as a corrosion inhibitor. In Inorganic Anticorrosive Materials; Verma, C., Chaudhery, M.H., Aslam, J., Eds.; Elsevier: Amsterdam, The Netherlands, 2022; pp. 211–229. [Google Scholar]
- Wei, S.; Johnson, C.; Roy, D. Probing the Mechanisms of Metal CMP Using Tribo-Electroanalytical Measurements: Results for a Copper/Malonate System. ECS J. Solid State Sci. Technol. 2021, 10, 034001. [Google Scholar] [CrossRef]
- Finšgar, M.; Milošev, I. Inhibition of copper corrosion by 1,2,3-benzotriazole: A review. Corros. Sci. 2010, 52, 2737–2749. [Google Scholar] [CrossRef]
- Tamilmani, S.; Huang, W.; Raghavan, S.; Small, R. Potential-pH Diagrams of Interest to Chemical Mechanical Planarization of Copper. J. Electrochem. Soc. 2002, 149, G638–G642. [Google Scholar] [CrossRef]
- Chivot, J.; Mendoza, L.; Mansour, C.; Pauporté, T.; Cassir, M. New insight in the behaviour of Co–H2O system at 25–150 °C, based on revised Pourbaix diagrams. Corros. Sci. 2008, 50, 62–69. [Google Scholar] [CrossRef]
- Xu, A.; Xu, F.; Wang, W.; Liu, W.; Song, Z. Effect of diethanolamine as corrosion inhibitor for the chemical mechanical polishing of cobalt in H2O2 based slurry. ECS J. Solid State Sci. Technol. 2021, 10, 043006. [Google Scholar] [CrossRef]
- Jiang, L.; He, Y.; Li, Y.; Li, Y.; Luo, J. Synergetic effect of H2O2 and glycine on cobalt CMP in weakly alkaline slurry. Microelectron. Eng. 2014, 122, 82–86. [Google Scholar] [CrossRef]
- Wang, F.; Zhang, S.; Tan, B.; Shi, Y.; Wang, X.; Du, H.; Liu, R.; Han, X. Three anionic surfactants for corrosion inhibition in cobalt CMP: Research on validity and mechanism. Surf. Interfaces 2024, 47, 104202. [Google Scholar] [CrossRef]
- Kosmulski, M. Surface Charging and Points of Zero Charge; CRC Press: Boca Raton, FL, USA, 2009; p. 1092. [Google Scholar]
- Sagi, K.; Teugels, L.; van der Veen, M.; Struyf, H.; Alety, S.; Babu, S. Chemical Mechanical Polishing of Chemical Vapor Deposited Co Films with Minimal Corrosion in the Cu/Co/Mn/SiCOH Patterned Structures. ECS J. Solid State Sci. Technol. 2017, 6, P276–P283. [Google Scholar] [CrossRef]
- Graziano, F.D.; Harris, G.M. Substitution Reactions of Oxalato-Complex Ions. I. Oxalate Exchange Reactions of the Tris-oxalate-cobalt (III) and Chromium(III) Complex Anions. J. Phys. Chem. 1959, 63, 330–335. [Google Scholar] [CrossRef]
- Adamson, A.; Ogata, H.; Grossman, J.; Newbury, R. Oxalato complexes of Co (II) and Co (III). J. Inorg. Nucl. Chem. 1958, 6, 319–327. [Google Scholar] [CrossRef]
- Barney, J.E.; Argersinger Jr, W.J.; Reynolds, C.A. A Study of Some Complex Chlorides and Oxalates by Solubility Measurements. J. American Chem. Soc. 1951, 73, 3785–3788. [Google Scholar] [CrossRef]
- Micskei, K.; Nagypál, I. Kinetic studies in aqueous solutions of cobalt (II)–ethylenediamine,–malonate, and–glycinate complexes. J. Chem. Soc. Dalton Trans. 1990, 2581–2586. [Google Scholar] [CrossRef]
- Hirpaye, B.Y.; Zekarias, M.T.; Rao, G.N. Chemical speciation studies of malonic acid complexes of Co (II), Cu (II), Ni (II) and Zn (II) in dioxan-water mixtures. Der Pharma Chem. 2012, 4, 655–663. [Google Scholar]
- Gallant, D.; Pézolet, M.; Simard, S. Inhibition of cobalt active dissolution by benzotriazole in slightly alkaline bicarbonate aqueous media. Electrochim. Acta 2007, 52, 4927–4941. [Google Scholar] [CrossRef]
- Yin, D.; Yang, L.; Niu, X.; Ma, Y.; Liu, M.; Sun, X.; Gao, B.; Tan, B. Theoretical and electrochemical analysis on inhibition effect of benzotriazole and 1, 2, 4-triazole on cobalt surface. Colloids Surf. A Physicochem. Eng. Asp. 2020, 591, 124516. [Google Scholar] [CrossRef]
- Patri, U.B.; Aksu, S.; Babu, S.V. Role of the Functional Groups of Complexing Agents in Copper Slurries. J. Electrochem. Soc. 2006, 153, G650–G659. [Google Scholar] [CrossRef]
- Xu, Q.; Chen, L.; Yang, F.; Cao, H. Influence of slurry components on copper CMP performance in alkaline slurry. Microelectron. Eng. 2017, 183, 1–11. [Google Scholar] [CrossRef]
- Luan, X.; Liu, Y.; Wang, C.; Niu, X.; Wang, J.; Zhang, W. A study on exploring the alkaline copper CMP slurry without inhibitors to achieve high planarization efficiency. Microelectron. Eng. 2016, 160, 5–11. [Google Scholar] [CrossRef]
- Andersen, T.N.; Bockris, J.O.M. Forces involved in the “specific” adsorption of ions on metals from aqueous solution. Electrochim. Acta 1964, 9, 347–371. [Google Scholar] [CrossRef]
- Li, J.; Liu, Y.; Lu, X.; Luo, J.; Dai, Y. Material Removal Mechanism of Copper CMP from a Chemical–Mechanical Synergy Perspective. Tribol. Lett. 2013, 49, 11–19. [Google Scholar] [CrossRef]
- Nolan, L.M.; Cadien, K.C. Chemically enhanced synergistic wear: A copper chemical mechanical polishing case study. Wear 2013, 307, 155–163. [Google Scholar] [CrossRef]
- Jiang, L.; He, Y.; Li, J.; Luo, J. Passivation Kinetics of 1, 2, 4-Triazole in Copper Chemical Mechanical Polishing. ECS J. Solid State Sci. Technol. 2016, 5, P272–P279. [Google Scholar] [CrossRef]
- Wang, A.; Wang, S.; Liu, Y.; Li, Y. Electrochemical investigation of copper chemical mechanical planarization in alkaline slurry without an inhibitor. J. Semicond. 2014, 35, 026003. [Google Scholar] [CrossRef]
- Yagan, R.; Basim, G.B. A fundamental approach to electrochemical analyses on chemically modified thin films for barrier CMP optimization. ECS J. Solid State Sci. Technol. 2019, 8, P3118. [Google Scholar] [CrossRef]
- Stein, D.J.; Hetherington, D.; Guilinger, T.; Cecchi, J.L. In Situ Electrochemical Investigation of Tungsten Electrochemical Behavior during Chemical Mechanical Polishing. J. Electrochem. Soc. 1998, 145, 3190–3196. [Google Scholar] [CrossRef]
- Santefort, D.; Gamagedara, K.; Roy, D. Tribo-Electroanalytical Evaluation oF CMP Slurries and Post-CMP Cleaning Solutions. In Proceedings of the ICPT Conference, Portland, OR, USA, 27–29 September 2022; pp. 1–8. [Google Scholar]
- Jie, Z.; Zhang, Z.; Susmel, L.; Zhang, L.; Lu, W. Corrosion fatigue mechanisms and evaluation methods of high-strength steel wires: A state of the art review. Fatigue Fract. Eng. Mater. Struct. 2024, 47, 2287–2318. [Google Scholar] [CrossRef]
- Ernst, F. Metal-oxide interfaces. Mater. Sci. Eng. R Rep. 1995, 14, 97–156. [Google Scholar] [CrossRef]
- Esposito, V.; Castelli, I.E. Metastability at Defective Metal Oxide Interfaces and Nanoconfined Structures. Adv. Mater. Interfaces 2020, 7, 1902090. [Google Scholar] [CrossRef]
- Choi, S.; Doyle, F.M.; Dornfeld, D.A. Material Removal Mechanism during Copper Chemical Mechanical Planarization Based on Nano-Scale Material Behavior. ECS J. Solid State Sci. Technol. 2017, 6, P235–P242. [Google Scholar] [CrossRef]
- He, P.; Wu, B.; Shao, S.; Teng, T.; Wang, P.; Qu, X.-P. Characterization of 1, 2, 4-triazole as corrosion inhibitor for chemical mechanical polishing of cobalt in H2O2 based acid slurry. ECS J. Solid State Sci. Technol. 2019, 8, P3075. [Google Scholar] [CrossRef]
- Lu, H.-S.; Wang, J.-X.; Zeng, X.; Chen, F.; Zhang, X.-M.; Zhang, W.-J.; Qu, X.-P. The Effect of H2O2 and 2-MT on the Chemical Mechanical Polishing of Cobalt Adhesion Layer in Acid Slurry. Electrochem. Solid-State Lett. 2012, 15, H97–H100. [Google Scholar] [CrossRef]
- Hideaki, N.; Haruki, N.; Akira, I. Fundamental Study of Chemical–Mechanical Polishing Slurry of Cobalt Barrier Metal for the Next-Generation Interconnect Process. Jpn. J. Appl. Phys. 2010, 49, 05FC03. [Google Scholar]
- Zhong, M.; Venkataraman, S.S.; Lan, Y.; Li, Y.; Shipp, D.A. Role of 1,2,4-Triazole as a Passivating Agent for Cobalt during Post-Chemical Mechanical Planarization Cleaning. J. Electrochem. Soc. 2014, 161, C138–C144. [Google Scholar] [CrossRef]
- Meethal, R.; Jalalzai, P.; Kumar, S.; Kim, T.-G.K.; Cho, W.; Klipp, A.; Park, J.-G. Electrochemical investigations on the corrosion and inhibition during W post-CMP cleaning. In Proceedings of the 2022 International Conference on Planarization/CMP Technology, Portland, OR, USA, 27–29 September 2022. [Google Scholar]
- Thuy, H.T.T.; Gichovi, J.; Morrow, I.; Podlaha, E.J.; Seo, J. Environmentally benign Chemical Mechanical Planarization slurries aided by amino acids. In Proceedings of the ICPT 2022, Portland, OR, USA, 27–29 September, 2022. [Google Scholar]
- Cheng, J.; Wang, T.; Mei, H.; Zhou, W.; Lu, X. Synergetic effect of potassium molybdate and benzotriazole on the CMP of ruthenium and copper in KIO4-based slurry. Appl. Surf. Sci. 2014, 320, 531–537. [Google Scholar] [CrossRef]
- Turk, M.C.; Simpson, D.E.; Roy, D. Examination of Salicylaldehyde as a Surface Modifier of Manganese for Application in Chemical Mechanical Planarization. ECS J. Solid State Sci. Technol. 2013, 2, P498–P505. [Google Scholar] [CrossRef]
- Xue, C.; Zhang, P.; Wei, D.; Hu, H.; Li, F.; Yang, K. Corrosion and Tribocorrosion behaviors for TA3 in Ringer’s Solution after Implantation of Nb Ions. Appl. Sci. 2020, 10, 8329. [Google Scholar] [CrossRef]
- Jun, C.; Zhang, Q.; Li, Q.-a.; Fu, S.-l.; Wang, J.-z. Corrosion and tribocorrosion behaviors of AISI 316 stainless steel and Ti6Al4V alloys in artificial seawater. Trans. Nonferrous Met. Soc. China 2014, 24, 1022–1031. [Google Scholar]
- López-Ortega, A.; Arana, J.; Bayón, R. Tribocorrosion of passive materials: A review on test procedures and standards. Int. J. Corros. 2018, 2018, 7345346. [Google Scholar] [CrossRef]
- Hu, L.; Pan, G.; Li, C.; Zhang, X.; Liu, J.; He, P.; Wang, C. Potassium tartrate as a complexing agent for chemical mechanical polishing of Cu/Co/TaN barrier liner stack in H2O2 based alkaline slurries. Mater. Sci. Semicond. Process. 2020, 108, 104883. [Google Scholar] [CrossRef]
- Yan, C.; Zeng, Q.; Xu, Y.; He, W. Microstructure, phase and tribocorrosion behavior of 60NiTi alloy. Appl. Surf. Sci. 2019, 498, 143838. [Google Scholar] [CrossRef]
- Papageorgiou, N.; Mischler, S. Electrochemical Simulation of the Current and Potential Response in Sliding Tribocorrosion. Tribol. Lett. 2012, 48, 271–283. [Google Scholar] [CrossRef]
- Shima, S.; Fukunaga, A.; Tsujimura, M. Effects of liner metal and CMP slurry oxidizer on copper galvanic corrosion. ECS Trans. 2007, 11, 285. [Google Scholar] [CrossRef]
- Lee, W.-J.; Park, H.-S. Development of novel process for Ru CMP using ceric ammonium nitrate (CAN)-containing nitric acid. Appl. Surf. Sci. 2004, 228, 410–417. [Google Scholar] [CrossRef]
- Li, J.; Chai, Z.; Liu, Y.; Lu, X. Tribo-chemical Behavior of Copper in Chemical Mechanical Planarization. Tribol. Lett. 2013, 50, 177–184. [Google Scholar] [CrossRef]
- Wu, P.-Q.; Celis, J.-P. Electrochemical noise measurements on stainless steel during corrosion–wear in sliding contacts. Wear 2004, 256, 480–490. [Google Scholar] [CrossRef]
- Kuiry, S.; Seal, S.; Fei, W.; Ramsdell, J.; Desai, V.; Li, Y.; Babu, S.; Wood, B. Effect of pH and H2O2 on Ta chemical mechanical planarization: Electrochemistry and X-ray photoelectron spectroscopy studies. J. Electrochem. Soc. 2002, 150, C36. [Google Scholar] [CrossRef]
- Patrick, W.J.; Guthrie, W.L.; Standley, C.L.; Schiable, P.M. Application of Chemical Mechanical Polishing to the Fabrication of VLSI Circuit Interconnections. J. Electrochem. Soc. 1991, 138, 1778–1784. [Google Scholar] [CrossRef]
- Turk, M.C.; Shi, X.; Gonyer, D.A.J.; Roy, D. Chemical and Mechanical Aspects of a Co-Cu Planarization Scheme Based on an Alkaline Slurry Formulation. ECS J. Solid State Sci. Technol. 2016, 5, P88–P99. [Google Scholar] [CrossRef]
- Shi, X.; Simpson, D.; Roy, D. Tribo-electrochemical characterization of Ru, Ta and Cu CMP systems using percarbonate based solutions. ECS J. Solid State Sci. Technol. 2015, 4, P5058. [Google Scholar] [CrossRef]
- Liu, P.; Bae, S.; Hong, S.; Bae, C.; Seo, H.; Lee, J.; Tang, C.; Kim, T. Investigation of thermal effects in copper chemical mechanical polishing. Precis. Eng. 2022, 73, 195–202. [Google Scholar] [CrossRef]
- Lee, H.; Jeong, H. A wafer-scale material removal rate profile model for copper chemical mechanical planarization. Int. J. Mach. Tools Manuf. 2011, 51, 395–403. [Google Scholar] [CrossRef]
- Wortman-Otto, K.M.; Graverson, C.F.; Linhart, A.N.; McDonough, R.K.; Mlynarski, A.L.; Keleher, J.J. Synergistic Effect of Pad “Macroporous-Reactors” on Passivation Mechanisms to Modulate Cu Chemical Mechanical Planarization (CMP) Performance. ECS J. Solid State Sci. Technol. 2020, 9, 054005. [Google Scholar] [CrossRef]
- Apóstolo, R.F.; Tsagkaropoulou, G.; Camp, P.J. Molecular adsorption, self-assembly, and friction in lubricants. J. Mol. Liq. 2019, 277, 606–612. [Google Scholar] [CrossRef]
- Lortz, W.; Menzel, F.; Brandes, R.; Klaessig, F.; Knothe, T.; Shibasaki, T. News from the M in CMP-Viscosity of CMP Slurries, a Constant? MRS Online Proc. Libr. 2003, 767, 17. [Google Scholar] [CrossRef]
- Crawford, N.C.; Williams, S.K.R.; Boldridge, D.; Liberatore, M.W. Shear thickening and defect formation of fumed silica CMP slurries. Colloids Surf. A Physicochem. Eng. Asp. 2013, 436, 87–96. [Google Scholar] [CrossRef]
- Zhang, J.; Meng, Y. Boundary lubrication by adsorption film. Friction 2015, 3, 115–147. [Google Scholar] [CrossRef]
- Mansfeld, F.; Kenkel, J. Galvanic corrosion of Al alloys—III. The effect of area ratio. Corros. Sci. 1975, 15, 239–250. [Google Scholar] [CrossRef]
- Zhang, X.; Jiang, Z.H.; Yao, Z.P.; Song, Y.; Wu, Z.D. Effects of scan rate on the potentiodynamic polarization curve obtained to determine the Tafel slopes and corrosion current density. Corros. Sci. 2009, 51, 581–587. [Google Scholar] [CrossRef]
- Rocchini, G. The influence of the potential sweep rate on the computation of the polarization resistance. Corros. Sci. 1996, 38, 2095–2109. [Google Scholar] [CrossRef]
- Ohtsuka, T.; Nishikata, A.; Sakairi, M.; Fushimi, K. Electrochemical Measurement of Wet Corrosion. In Electrochemistry for Corrosion Fundamentals; Springer: Berlin/Heidelberg, Germany, 2018; pp. 17–39. [Google Scholar]
- Cheng, J.; Wang, T.; Pan, J.; Lu, X. Corrosion investigations of ruthenium in potassium periodate solutions relevant for chemical mechanical polishing. J. Electron. Mater. 2016, 45, 4067–4075. [Google Scholar] [CrossRef]
- Cheng, J.; Wang, T.; Wang, J.; Liu, Y.; Lu, X. Effects of KIO4 concentration and pH values of the solution relevant for chemical mechanical polishing of ruthenium. Microelectron. Eng. 2016, 151, 30–37. [Google Scholar] [CrossRef]
- Yadav, K.; Manivannan, R.; Victoria, S.N. Chemical Mechanical Planarization of Ruthenium Using Sodium Hypochlorite Based Titania Slurry. ECS J. Solid State Sci. Technol. 2017, 6, P879–P885. [Google Scholar] [CrossRef]
- Cui, H.; Park, J.-H.; Park, J.-G. Study of Ruthenium Oxides Species on Ruthenium Chemical Mechanical Planarization Using Periodate-Based Slurry. J. Electrochem. Soc. 2012, 159, H335–H341. [Google Scholar] [CrossRef]
- Kolb, D. An atomistic view of electrochemistry. Surf. Sci. 2002, 500, 722–740. [Google Scholar] [CrossRef]
- Wilms, M.; Broekmann, P.; Stuhlmann, C.; Wandelt, K. In-situ STM investigation of adsorbate structures on Cu (111) in sulfuric acid electrolyte. Surf. Sci. 1998, 416, 121–140. [Google Scholar] [CrossRef]
- Diao, C.; Chang, X.; Ding, X.; Cang, R.; Zhang, M. Surface reconstruction of Co(OH)2 nanosheets through an in-situ PBA etching and sulfuration strategy for enhanced electrocatalytic oxygen evolution reaction. Mol. Catal. 2025, 570, 114709. [Google Scholar] [CrossRef]
- Han, Z.; Han, D.; Chen, Z.; Gao, J.; Jiang, G.; Wang, X.; Lyu, S.; Guo, Y.; Geng, C.; Yin, L. Steering surface reconstruction of copper with electrolyte additives for CO2 electroreduction. Nat. Commun. 2022, 13, 3158. [Google Scholar] [CrossRef]
- Cai, S.-y.; Wen, L.; Jin, Y. A comparative study on corrosion kinetic parameter estimation methods for the early stage corrosion of Q345B steel in 3.5 wt% NaCl solution. Int. J. Miner. Metall. Mater. 2017, 24, 1112–1124. [Google Scholar] [CrossRef]
- Tahmasebi, S.; Hossain, M.A.; Jerkiewicz, G. Corrosion Behavior of Platinum in Aqueous H2SO4 Solution: Part 1—Influence of the potential scan rate and the dissolved gas. Electrocatalysis 2018, 9, 172–181. [Google Scholar] [CrossRef]
- Rocchini, G. The influence of the potential sweep rate on the shape of polarization curves. Corros. Sci. 1998, 40, 1753–1768. [Google Scholar] [CrossRef]
- Scully, J.R. Polarization resistance method for determination of instantaneous corrosion rates. Corrosion 2000, 56, 199–218. [Google Scholar] [CrossRef]
- Ofoegbu, S.U.; Quevedo, M.C.; Bastos, A.; Ferreira, M.; Zheludkevich, M. Electrochemical characterization and degradation of carbon fibre reinforced polymer in quiescent near neutral chloride media. npj Mater. Degrad. 2022, 6, 49. [Google Scholar] [CrossRef]
- Ryu, J.; Surendranath, Y. Polarization-induced local pH swing promotes Pd-catalyzed CO2 hydrogenation. J. Am. Chem. Soc. 2020, 142, 13384–13390. [Google Scholar] [CrossRef]
- Lu, S.; Zhang, Z.; Zhang, B.; Shi, Y. Insight into the change in local pH near the electrode surface using phosphate species as the probe. J. Phys. Chem. Lett. 2023, 14, 10457–10462. [Google Scholar] [CrossRef]
- Monteiro, M.C.; Koper, M.T. Measuring local pH in electrochemistry. Curr. Opin. Electrochem. 2021, 25, 100649. [Google Scholar] [CrossRef]
- Wachta, I.; Balasubramanian, K. Electroanalytical Strategies for Local pH Sensing at Solid–Liquid Interfaces and Biointerfaces. ACS Sens. 2024, 9, 4450–4468. [Google Scholar] [CrossRef]
- Weaver, M.J. Potentials of zero charge for platinum (111)—Aqueous interfaces: A combined assessment from in-situ and ultrahigh-vacuum measurements. Langmuir 1998, 14, 3932–3936. [Google Scholar] [CrossRef]
- Chen, Z. The open-circuit potential of a polarizable and reactive electrode. ECS Trans. 2008, 6, 1. [Google Scholar] [CrossRef]
- Fangteng, S.; Charles, E.A. A theoretical approach to galvanic corrosion, allowing for cathode dissolution. Corros. Sci. 1988, 28, 649–655. [Google Scholar] [CrossRef]
- Blanc, C.; Aubert, I. Mechanics-Microstructure-Corrosion Coupling: Concepts, Experiments, Modeling and Cases; Elsevier: Amsterdam, The Netherlands, 2019. [Google Scholar]
- Rahimi, E.; Rafsanjani-Abbasi, A.; Imani, A.; Hosseinpour, S.; Davoodi, A. Insights into galvanic corrosion behavior of Ti-Cu dissimilar joint: Effect of microstructure and volta potential. Materials 2018, 11, 1820. [Google Scholar] [CrossRef]
- Yeganeh, M.; Saremi, M. A comparison between the corrosion behavior of nanostructured copper thin films deposited on oxidized silicon and copper sheet in alkaline media. Surf. Coat. Technol. 2010, 205, 2218–2224. [Google Scholar] [CrossRef]
- Kim, Y.; Yoo, M.; Moon, M. Effects of surface roughness on the electrochemical properties and galvanic corrosion behavior of CFRP and SPCC alloy. Materials 2020, 13, 4211. [Google Scholar] [CrossRef]
- Toloei, A.; Stoilov, V.; Northwood, D. The relationship between surface roughness and corrosion. In Proceedings of the ASME International Mechanical Engineering Congress and Exposition, San Diego, CA, USA, 13–21 November 2013; p. V02BT02A054. [Google Scholar]
- Sherif, E.-S.M.; Alnaser, I.A.; Abbas, A.T. Effect of surface roughness on corrosion behavior of AISI 4340 high-strength steel in sodium chloride solutions. AIP Adv. 2024, 14, 065017. [Google Scholar] [CrossRef]
- Hu, Y.; Liu, Y.; Liu, X.; Wang, L.; He, Y. Effect of copper slurry on polishing characteristics. J. Semicond. 2011, 32, 116001. [Google Scholar] [CrossRef]
- Liu, D.; Zhang, Z.; Feng, J.; Yu, Z.; Meng, F.; Shi, C.; Xu, G.; Shi, S.; Liu, W. Environment-friendly chemical mechanical polishing for copper with atomic surface confirmed by transmission electron microscopy. Colloids Surf. A Physicochem. Eng. Asp. 2023, 656, 130500. [Google Scholar] [CrossRef]
- Zhang, X. Galvanic corrosion. In Uhlig’s Corrosion Handbook; Winston Revie, R., Ed.; John Wiley & Sons: New York, NY, USA, 2011; Volume 51, pp. 123–142. [Google Scholar]
- Bradford, S.A. Corrosion. In Encyclopedia of Physical Science and Technology, 3rd ed.; Meyers, R.A., Ed.; Academic Press: New York, NY, USA, 2003; pp. 761–778. [Google Scholar]
- Kim, H.J.; Ahn, S.-G.; Qin, L.; Koli, D.; Govindarajulu, V.; Moon, Y. Effects of pad temperature on the chemical mechanical polishing of tungsten. ECS J. Solid State Sci. Technol. 2014, 3, P310. [Google Scholar] [CrossRef]


| Slurry | Composition | Rs (Ω) (Cu, Co) |
|---|---|---|
| I | 0.1 M KNO3 + 1 wt% H2O2 + 3 wt% SiO2 (Ref) | 72.5, 89.6 |
| II | Ref + 0.1 M MA | 23.7, 38.3 |
| III | Ref + 1 mM BTA | 138.1, 111.8 |
| IV | Ref + 0.1 M MA + 1 mM BTA | 57.2, 44.6 |
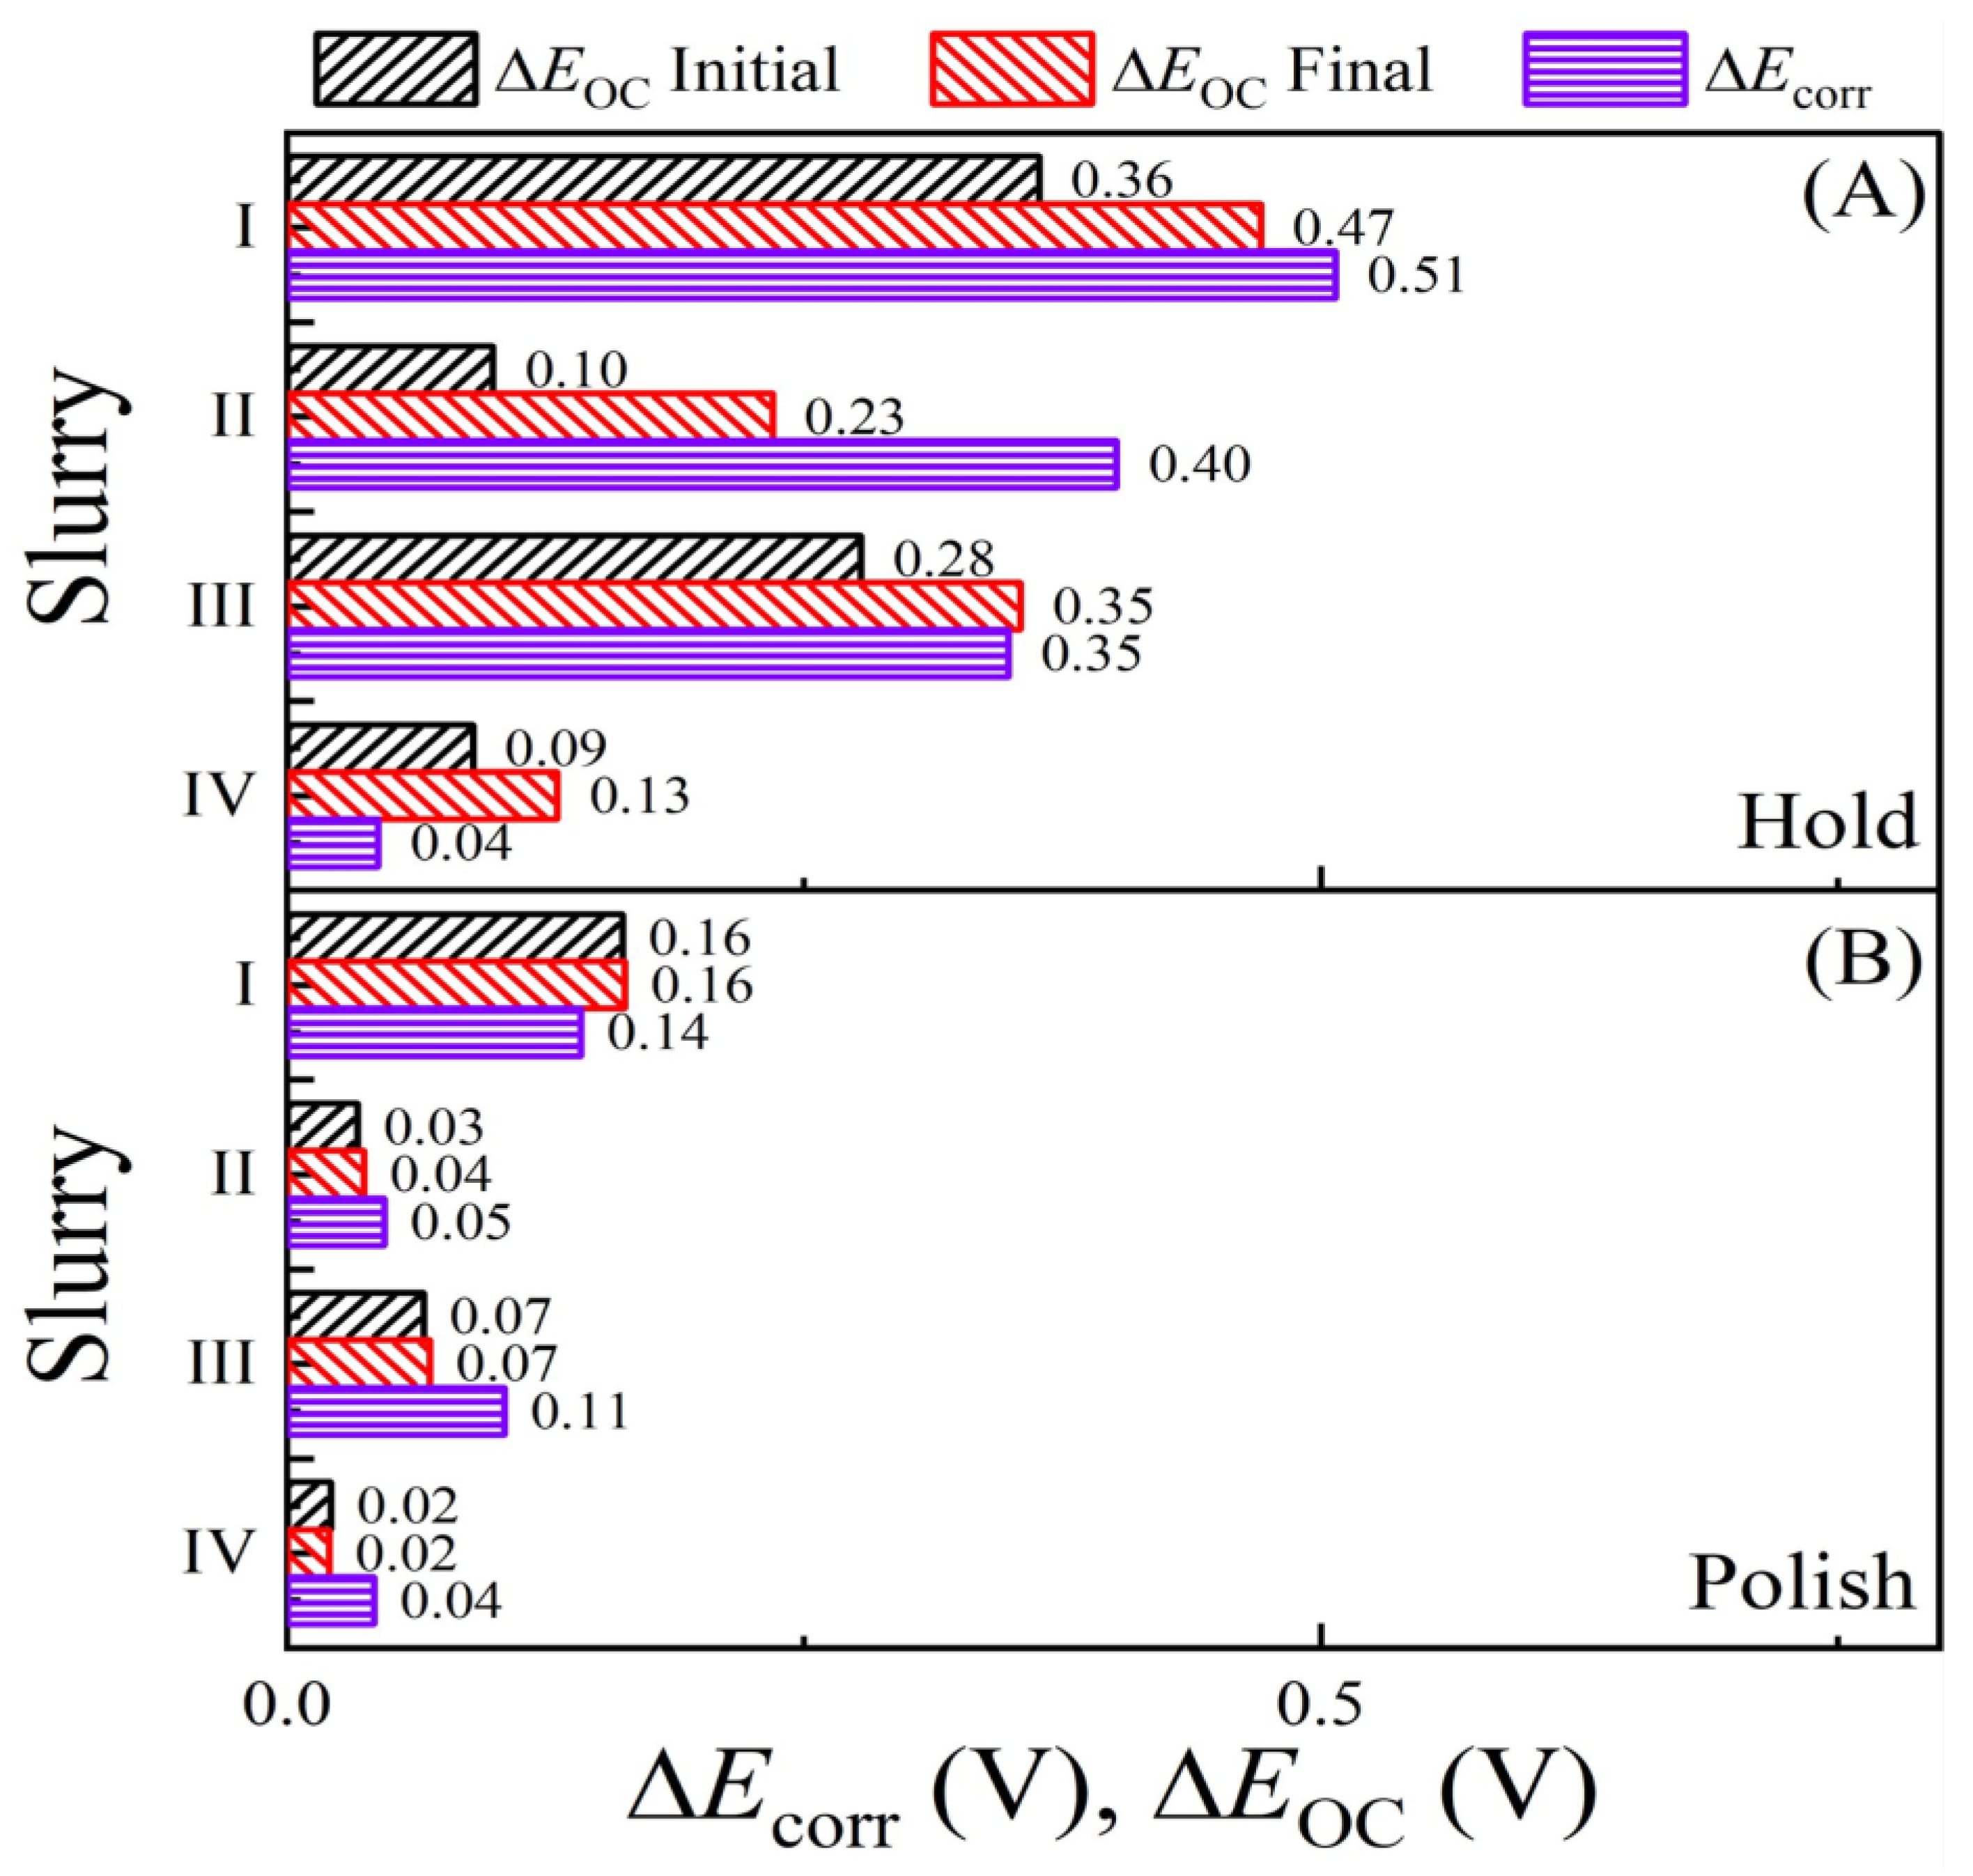
| Slurry | Ecorr(H;Cu) | Ecorr(H;Co) | Ecorr(P;Cu) | Ecorr(P;Co) | ΔEcorr(H) | ΔEcorr(P) |
|---|---|---|---|---|---|---|
| I | 0.139 | −0.368 | 0.175 | 0.033 | 0.507 | 0.142 |
| II | 0.035 | −0.366 | 0.161 | 0.114 | 0.401 | 0.047 |
| III | 0.120 | −0.229 | 0.195 | 0.090 | 0.349 | 0.105 |
| IV | 0.089 | 0.045 | 0.186 | 0.144 | 0.044 | 0.042 |
| Galvanic Variable | Slurry I | Slurry II | Slurry III | Slurry IV |
|---|---|---|---|---|
| Eg(H-F) (V vs. SCE) | −0.100, −0.204 | −0.145, −0.144 | −0.044, −0.034 | 0.071, 0.037 |
| Eg(H-R) (V vs. SCE) | −0.152, −0.190 | −0.069, −0.113 | 0.038, 0.006 | 0.123, 0.073 |
| E/g(H-F) (V vs. SCE) | −0.108, −0.203 | −0.147, −0.143 | −0.045, −0.038 | 0.072, 0.036 |
| E/g(H-R) (V vs. SCE) | −0.140, −0.179 | −0.061, −0.111 | 0.026, −0.002 | 0.119, 0.066 |
| Eg(P-F) (V vs. SCE) | 0.071, 0.068 | 0.130, 0.134 | 0.115, 0.103 | 0.157, 0.155 |
| Eg(P-R) (V vs. SCE) | 0.053, 0.053 | 0.134, 0.136 | 0.095, 0.091 | 0.154, 0.153 |
| E/g(P-F) (V vs. SCE) | 0.076, 0.076 | 0.132, 0.136 | 0.122, 0.108 | 0.159, 0.156 |
| E/g(P-R) (V vs. SCE) | 0.060, 0.058 | 0.136, 0.139 | 0.101, 0.101 | 0.156, 0.155 |
| ig(H-F) (μA cm−2) | 55.1, 39.4 | 62.2, 58.4 | 21.1, 25.9 | 6.60, 31.8 |
| ig(H-R) (μA cm−2) | 44.1, 45.9 | 64.2, 48.4 | 33.8, 32.2 | 39.2, 43.2 |
| i/g(H-F) (μA cm−2) | 49.0, 36.3 | 59.6, 56.2 | 19.2, 23.8 | 5.70, 29.3 |
| i/g(H-R) (μA cm−2) | 41.9, 42.9 | 60.8, 47.3 | 31.1, 30.4 | 37.0, 41.7 |
| ig(P-F) (μA cm−2) | 22.0, 10.9 | 21.7, 20.6 | 17.7, 18.5 | 15.4, 17.1 |
| ig(P-R) (μA cm−2) | 22.6, 22.4 | 27.7, 28.0 | 23.9, 24.3 | 21.0, 21.3 |
| i/g(P-F) (μA cm−2) | 18.9, 16.8 | 18.2, 17.7 | 13.7, 15.0 | 12.0, 14.1 |
| i/g(P-R) (μA cm−2) | 19.7, 19.6 | 23.4, 23.2 | 19.0, 18.4 | 20.0, 17.0 |
Disclaimer/Publisher’s Note: The statements, opinions and data contained in all publications are solely those of the individual author(s) and contributor(s) and not of MDPI and/or the editor(s). MDPI and/or the editor(s) disclaim responsibility for any injury to people or property resulting from any ideas, methods, instructions or products referred to in the content. |
© 2025 by the authors. Licensee MDPI, Basel, Switzerland. This article is an open access article distributed under the terms and conditions of the Creative Commons Attribution (CC BY) license (https://creativecommons.org/licenses/by/4.0/).
Share and Cite
Gamagedara, K.U.; Roy, D. Tribo-Electrochemical Considerations for Assessing Galvanic Corrosion Characteristics of Metals in Chemical Mechanical Planarization. Electrochem 2025, 6, 15. https://doi.org/10.3390/electrochem6020015
Gamagedara KU, Roy D. Tribo-Electrochemical Considerations for Assessing Galvanic Corrosion Characteristics of Metals in Chemical Mechanical Planarization. Electrochem. 2025; 6(2):15. https://doi.org/10.3390/electrochem6020015
Chicago/Turabian StyleGamagedara, Kassapa U., and Dipankar Roy. 2025. "Tribo-Electrochemical Considerations for Assessing Galvanic Corrosion Characteristics of Metals in Chemical Mechanical Planarization" Electrochem 6, no. 2: 15. https://doi.org/10.3390/electrochem6020015
APA StyleGamagedara, K. U., & Roy, D. (2025). Tribo-Electrochemical Considerations for Assessing Galvanic Corrosion Characteristics of Metals in Chemical Mechanical Planarization. Electrochem, 6(2), 15. https://doi.org/10.3390/electrochem6020015