Abstract
This paper presents the continuation of experimental investigations conducted by the present authors to measure and compare the thermal and fluid dynamic performance of a residential hydronic air coil using nanofluids. The prior experiments were limited to testing only one volumetric concentration (1%) of aluminum oxide (Al2O3) nanofluid. They compared it with the base fluid, a 60% ethylene glycol/40% water mixture by mass (60% EG). The original tests revealed some deficiencies in the experimental setup, which was subsequently revised and improved. This paper summarizes the results of experiments from the improved test bed using three concentrations of Al2O3 nanofluids: 1, 2, and 3% volumetric concentrations prepared with an average particle size of 45 nm in a 60% EG dispersion. The test bed in these experiments simulates a small air handling system typical of heating, ventilation, and air conditioning (HVAC) applications in cold regions. Entering conditions for the air and liquid were selected to emulate typical commercial air handling systems operating in cold climates. Contrary to previous findings, our test results revealed that nanofluids did not perform as well as expected. Prior predictions from many analytical and numerical studies had promised significant performance gain. The performance of the 1% nanofluid was generally equal to that of the base fluid under identical inlet conditions. However, the performance of the 2% and 3% nanofluids was considerably lower than that of the base fluid. The higher concentration nanofluids exhibited heat rates up to 14.6% lower than the 60% EG and up to 44.3% lower heat transfer coefficient. The 1% Al2O3/60% EG exhibited a 100% higher pressure drop across the coil than the base fluid, considering equal heat output. This performance degradation was attributed to the inability to maintain nanofluid dispersion stability, agglomeration, and subsequent decline in the thermophysical properties.
1. Introduction
Liquid suspensions that have been supplemented with extremely small particles (less than 100 nm in their characteristic dimension, called “nanoparticles”) in suspension are often referred to as “nanofluids”. The addition of the nanoparticles can alter the thermophysical and rheological properties of the base fluids in ways that can be exploited for benefit in various applications. Heat transfer fluids supplemented with nanoparticles have been shown in studies by multiple authors to exhibit superior thermal conductivity to those of conventional heat transfer fluids. Choi [1] is recognized for publishing some of the early work examining the potential for enhanced thermal conductivity of nanofluids caused by dispersing particles with favorable properties. The enhanced thermal conductivity is based on analyses using correlations developed for fluids with micrometer-sized particles [2,3,4]. Other authors have conducted research that suggests that nanofluids exhibit superior Nusselt numbers to conventional fluids in turbulent internal flows [5,6]. The higher Nusselt numbers exhibited by nanofluids correspond with enhanced convective heat transfer coefficients compared to conventional heat transfer fluids. The viscosity of fluids supplemented with nanoparticles is altered depending on the particles’ mean diameter and concentration. Under certain flow conditions (for constant average liquid velocity, for instance), this can result in higher pumping losses and a reduction in Reynolds number at a given flow rate, which can, in turn, actually decrease the Nusselt number compared to conventional fluids. The impact upon viscosity also varies strongly depending on temperature. These factors must be weighed against each other in evaluating the suitability of nanofluids for use in any heat transfer application.
Liquid-to-air finned heat exchangers (or “coils”) are commonly used to heat or cool air in building HVAC systems. These heating/cooling coils typically employ rows of close-packed metallic (usually aluminum) fins mechanically attached to thin-walled copper tubes (see Figure 1). A heat transfer fluid passes through the copper tubing while air passes over the close-packed fins, transferring heat between the heat transfer liquid and the outside air. Liquid and air travel in a “crossflow” pattern. These heating coils are found in installations of widely varying frontal areas ranging in projected area from 100 cm2 and larger. Large heating coils are used in central air handling units, while smaller versions are employed in unit heaters and duct-mounted coils. The superior thermal conductivity of nanofluids may be exploited in different ways. Increased thermal output for a given surface area under identical inlet conditions may reduce the heat transfer area required for a desired heat rate. Reducing the total required heat transfer area (i.e., lower fin density) may translate into lower air-side pressure drop and fan power consumption. Additionally, this could yield a reduction in the volume of required metals for construction. An increase in the heat transfer coefficient at the inside surface of the tubing for a given flow rate may also result in the reduction of the required liquid flow rate for a given rate of heat transfer, thereby offering the potential for a reduction in liquid pumping power consumed over the life of the heating coil.
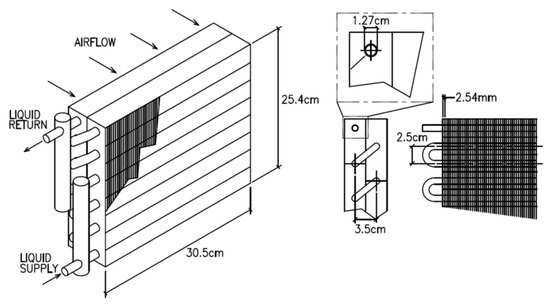
Figure 1.
Hydronic fin-tube heating coil tested [7].
An analytical model was developed by Strandberg and Das [8] to compare the performance of hydronic heating coils with Al2O3, CuO, and SiO2 nanofluids of varying concentrations with conventional fluids. Their work showed that coils filled with Al2O3/60:40 EG/water (by mass referred to as 60% EG) nanofluids exhibit superior thermal performance to coils filled with 60% EG base fluid. An important finding was that the largest potential benefit of nanofluids in terms of pumping power reduction for a given heating output occurs under conditions where the coil operates at less than design capacity. In general, HVAC systems operate under “off-design” conditions for a significant portion of the time. Therefore, nanofluids may generate significant reductions in energy consumption over the life of a typical HVAC system.
Strandberg and Das [8] predicted a significant enhancement in the heat transfer coefficient for the nanofluid as the volumetric concentration increased compared to the base fluid at a constant Reynolds number. The analyses indicated that all nanofluids analyzed should exhibit superior thermal output relative to the base fluid over a wide range of Reynolds numbers. Table 1 and Table 2 below contain the thermal output generated using the aforementioned analytical model for coils with an identical physical configuration and entering conditions circulating 60% EG and Al2O3/60% EG nanofluids with 1, 2, and 3% particle volumetric concentrations.

Table 1.
Analytical model heat rates for various heating fluids over a range of Reynolds numbers [9].
Table 2.
Analytical model heat rates for various heating fluids over various volumetric liquid flows [9].
No existing literature reporting on experimental work concerning the performance of nanofluids in a hydronic heating coil was available. Therefore, to fulfill this need, Strandberg and Das [7] conducted an experimental study of the heat transfer performance of 1% Al2O3/60% EG with a liquid-filled, finned air coil of the type typically found in small residential air handling systems similar to that used in this present paper. One deficiency of the Strandberg and Das [7] study was that the liquid supply temperatures were considerably lower than those typically used in most commercial and industrial HVAC systems in sub-arctic regions (e.g., Alaska). At these lower temperature conditions, the study found that the nanofluid-filled coil’s heat rates were nearly identical to those of the 60% EG-filled coil over a range of Reynolds numbers. It was believed that the potential benefits of nanofluids with a 60% EG base fluid would increase at higher entering liquid temperatures since the viscosity of nanofluids decreases with increasing temperature, while thermal conductivity increases with temperature. Therefore, the improvements in thermophysical properties at relatively higher temperatures would facilitate better heat transfer performance relative to the base fluid.
Vajjha et al. [5] empirically determined the performance of nanofluids comprised of Al2O3, CuO, and SiO2 nanoparticles dispersed in 60% EG. They developed a series of correlations for Nusselt number and friction factor under fully developed, turbulent flow conditions in a straight, cylindrical copper tube. The investigators found that Al2O3 nanofluids exhibited superior performance to the other nanofluids. Pandey and Nema [10] documented the performance of an Al2O3/water nanofluid working fluid in a brazed plate heat exchanger and reported that the 2% nanofluid exhibited superior heat transfer performance of the nanofluids tested. An experimental study by Farajollahi et al. [11] empirically evaluated the heat transfer performance of water-based nanofluids with TiO2 and γ-Al2O3 in a shell and tube heat exchanger under turbulent flow conditions. Both nanofluids exhibited superior heat transfer performance to water (the base fluid). In another experimental study by Peyghambarzadeh et al. [12,13], the heat transfer performance of water- and glycol-based nanofluids with Al2O3 nanoparticles in an automotive-type radiator was measured. They found that the nanofluids exhibited better cooling performance than the base single-phase liquids.
In our experimental investigation, we encountered challenges due to the poor performance of nanofluids due to the degradation of surfactant and dispersant, which made the fluid vulnerable to particle agglomeration and subsequent loss of thermophysical properties, as well as a reduction in the convective heat transfer coefficient and the heat transfer rate. Other researchers who conducted experimental studies have also experienced such challenges. Sommers and Yerkes [14] conducted experiments with 10 nm Al2O3 particles dispersed in propanol in a 0.75 inch ID copper pipe. They found that only the 1% concentration gave a better heat transfer coefficient than the base fluid. With the increase in concentration, the thermal performance degraded. The 3% concentration with high pressure drop gave inferior thermal performance compared to the base fluid. They also observed nanofluid discoloration at high flow rates and temperature after circulating them.
Eneren et al. [15] encountered similar challenges in their experiments on water-based Al2O3, TiO2, and polystyrene nanosuspensions circulated inside silicon microchannels. The thermal performance of the Al2O3 nanofluid was slightly better than the base fluid for a 0.2% nanoparticle concentration. Beyond that, the performance steadily declined from 0.3 to 0.5 to 1% concentrations. They also observed the discoloration of the nanofluids, which they attributed to the erosion of materials caused by larger nanoparticles on the surface of the silicon microchannels. Therefore, significant challenges exist to achieve the success of nanofluids in practical systems.
Objective
The objective of the present experimental investigation is to compare the performance of a heating coil filled with Al2O3/60% EG nanofluid in various particle concentrations to the coil’s performance with 60% EG at higher temperatures. The experiment was designed to improve upon the earlier experiments of Strandberg and Das [7] using a modified setup. The earlier setup had limitations of low liquid supply temperatures of 325 K and a test environment with inlet air temperatures that were not well controlled. The revised experiment was reconfigured with a higher temperature heat source that permitted increasing the liquid supply temperature to 350 K. The test bed was also relocated to a new location with more consistent ambient air temperatures. These improvements allowed experiments to more closely mimic the conditions of use in a conventional commercial air handling system. The Al2O3/60% EG nanofluid was selected based on the findings of Ray et al. [16] in a study of heat transfer performance in a mini-channel plate heat exchanger that indicated it had the potential for substantially better performance than the 60% EG in the temperature ranges that comfort heating systems typically operate. Also, Al2O3 nanoparticles are readily available from commercial sources in colloidal dispersions, easily procured and formulated with ethylene glycol into a nanofluid of the desired composition. It has also been observed that Al2O3 nanofluids performed better in forced convection applications than CuO and SiO2 nanofluids [5].
The main objectives were to test three concentrations of Al2O3 nanofluids and compare their performance based on heat transfer rates, frictional pressure loss, and required pumping power through a hydronic coil under various flow and temperature conditions. Furthermore, the experimental results involve additional analysis to evaluate the thermodynamic performance of the nanofluids considering the entropy generation and exergy consumed in the heat transfer process.
2. Experimental Setup
The testing was performed using a test loop with modifications to that employed by Strandberg and Das [7]. In the present study, the experimental setup comprised of a small air handler with a blower, a hydronic coil, and a Venturi tube, as shown in Figure 2. On the liquid loop, a circulator, a brazed plate heat exchanger, a motorized control valve, and a flow meter were employed, as shown in Figure 3. The test bed was connected to a thermostatically controlled 4.5 kW electric water heater, shown in Figure 4 in the top left corner, which served as the heat source for the testing. This improved the previous test bed used in [7]. A pump circulated hot water through the primary side of the plate heat exchanger, which heated the secondary side of the test loop (also a pressurized loop) through the wall of the heat exchanger. The hydronic coil system was constructed of 1.27 cm (0.5 in) O.D. copper tubing. An inline centrifugal, wet-rotor-type circulator [17] pumped the fluids through the loop. The air handling unit employed a centrifugal fan drawing air through ductwork and other appurtenances, including a hydronic heating coil and a Venturi meter that was connected with intermediate sections of the rectangular duct work. The Venturi meter had been calibrated by the manufacturer [18] to give accurate volume flow measurements.
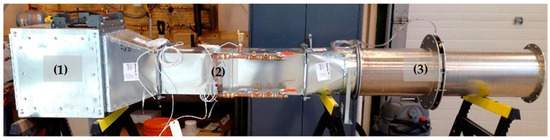
Figure 2.
Air side of testbed photo: (1) induced blower on the left, (2) hydronic coil in the middle, and (3) Venturi on the right.
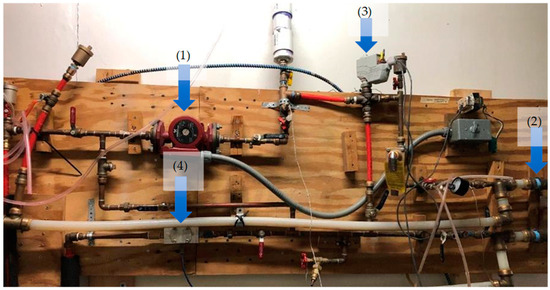
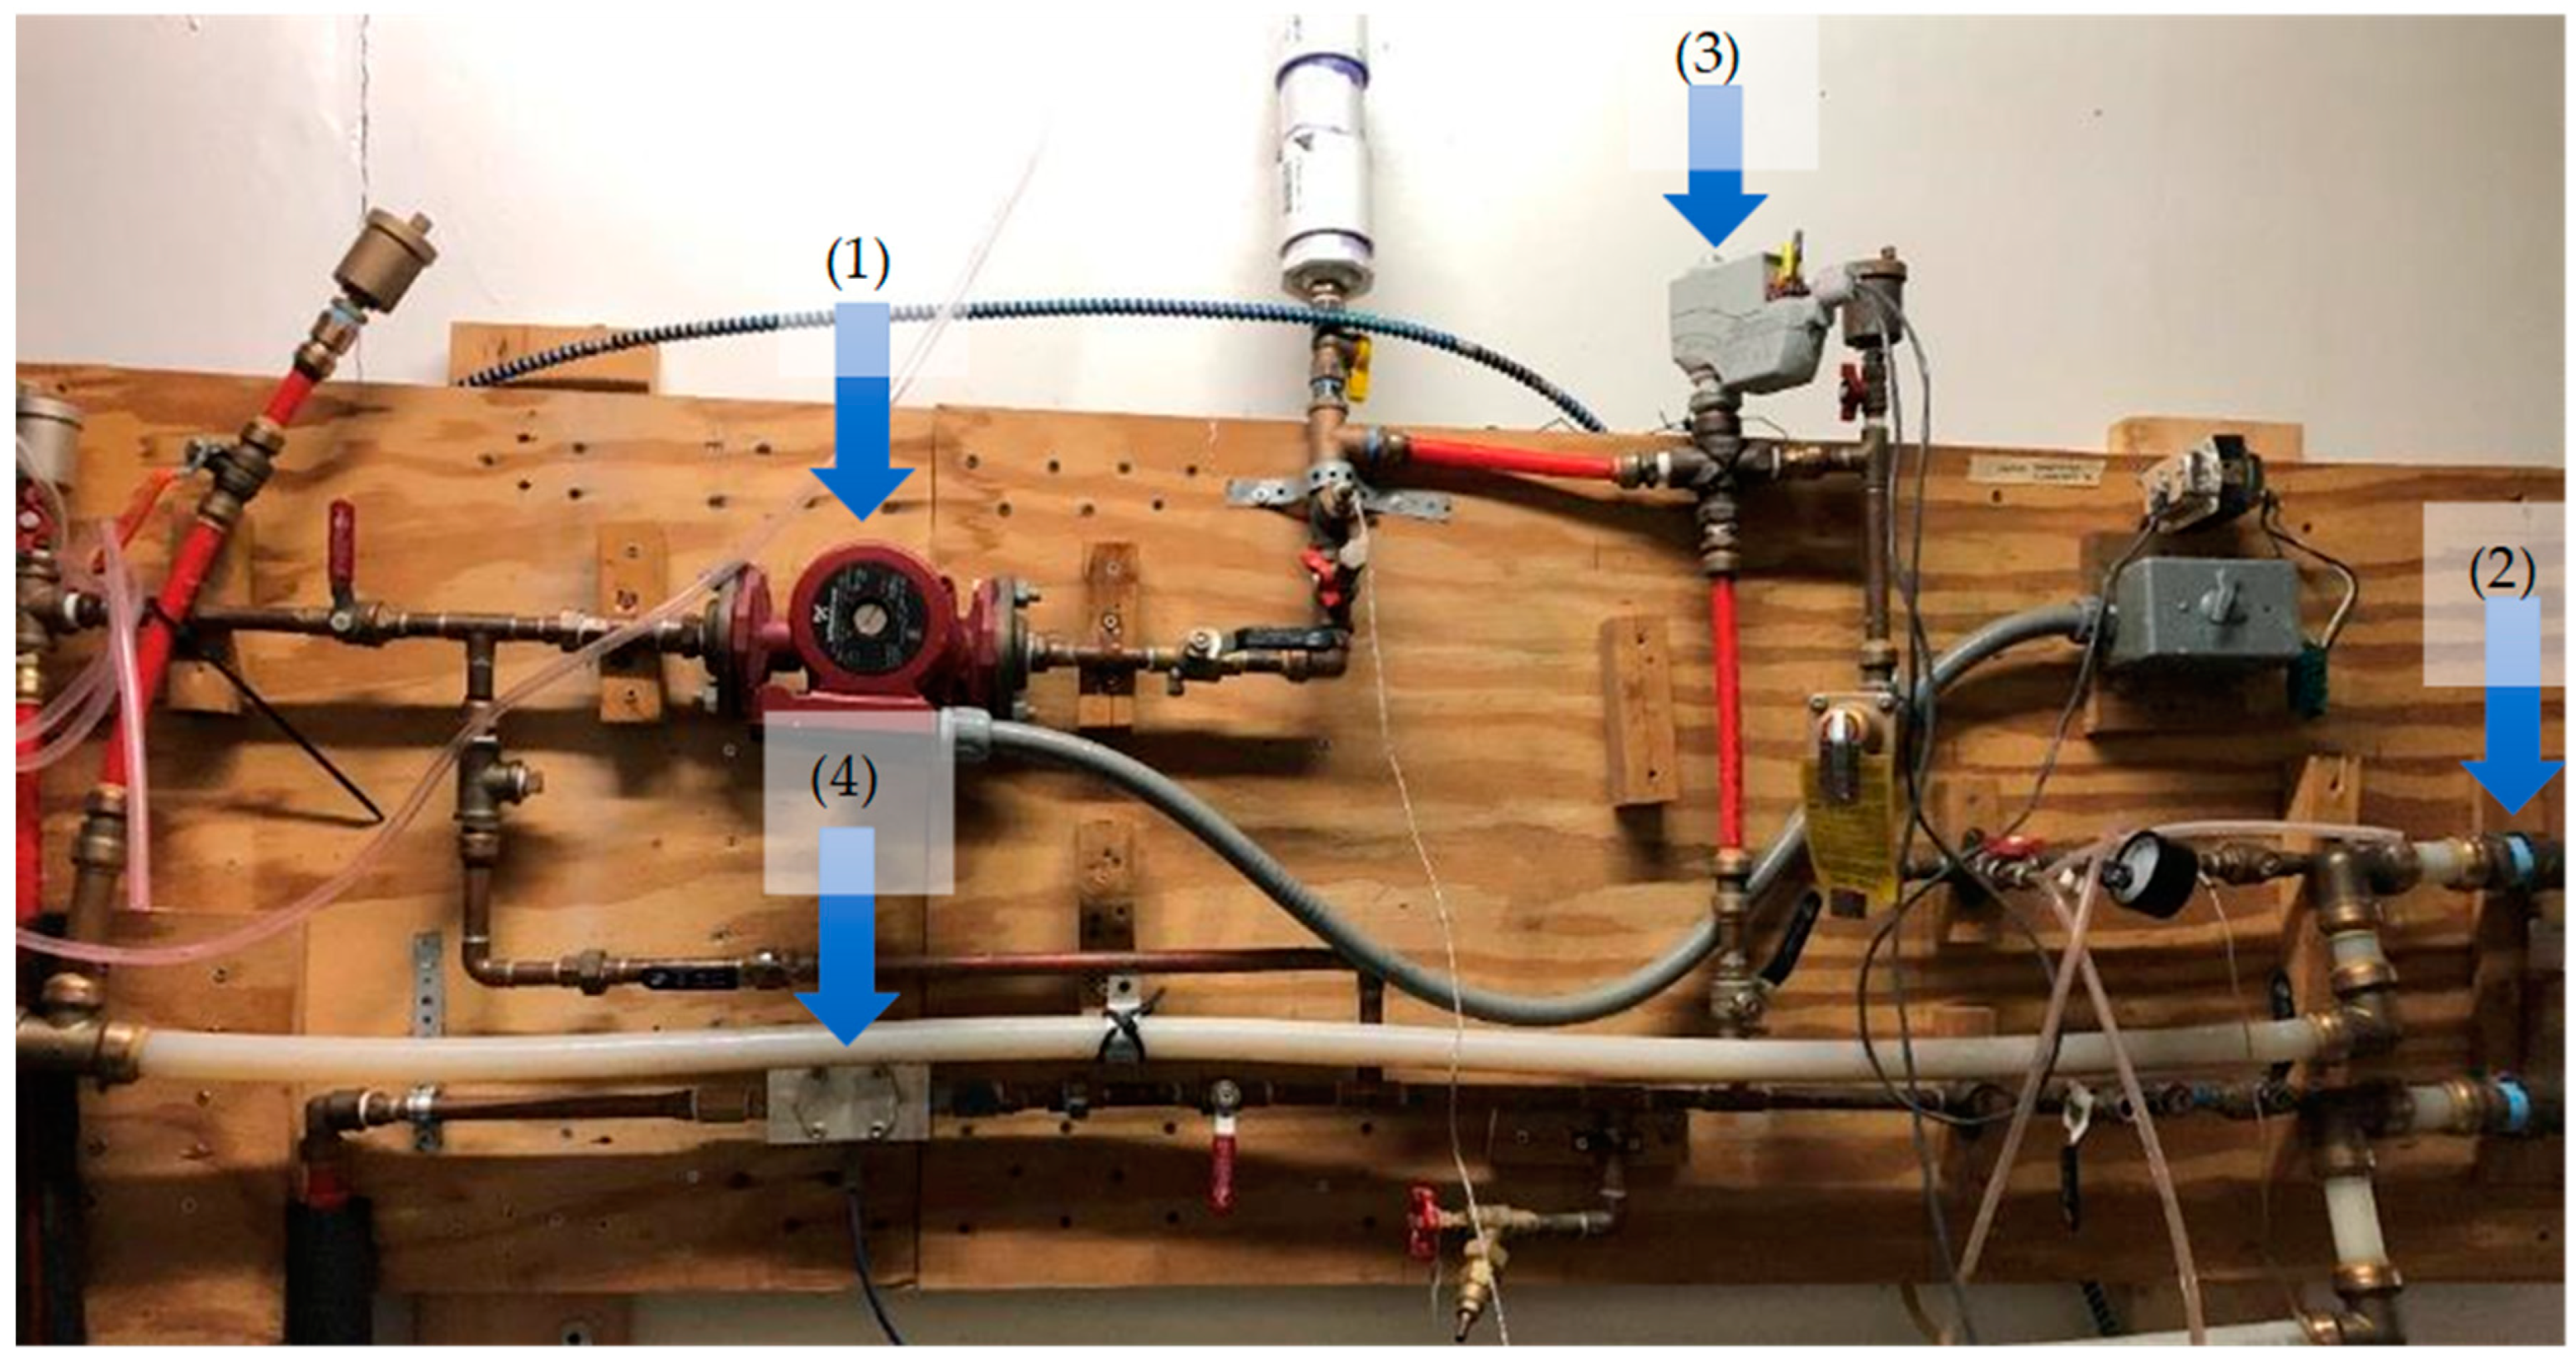
Figure 3.
Liquid-side piping system and heat exchange apparatus: (1) circulator, (2) plate heat exchanger, (3) motorized control valve, and (4) flow meter.
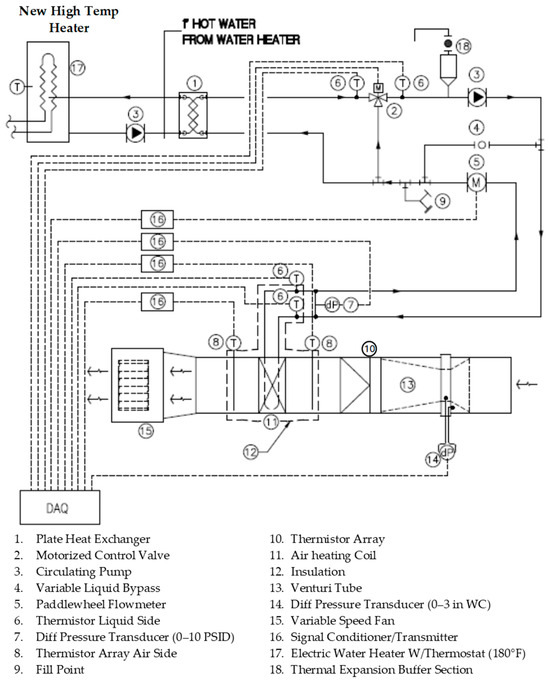
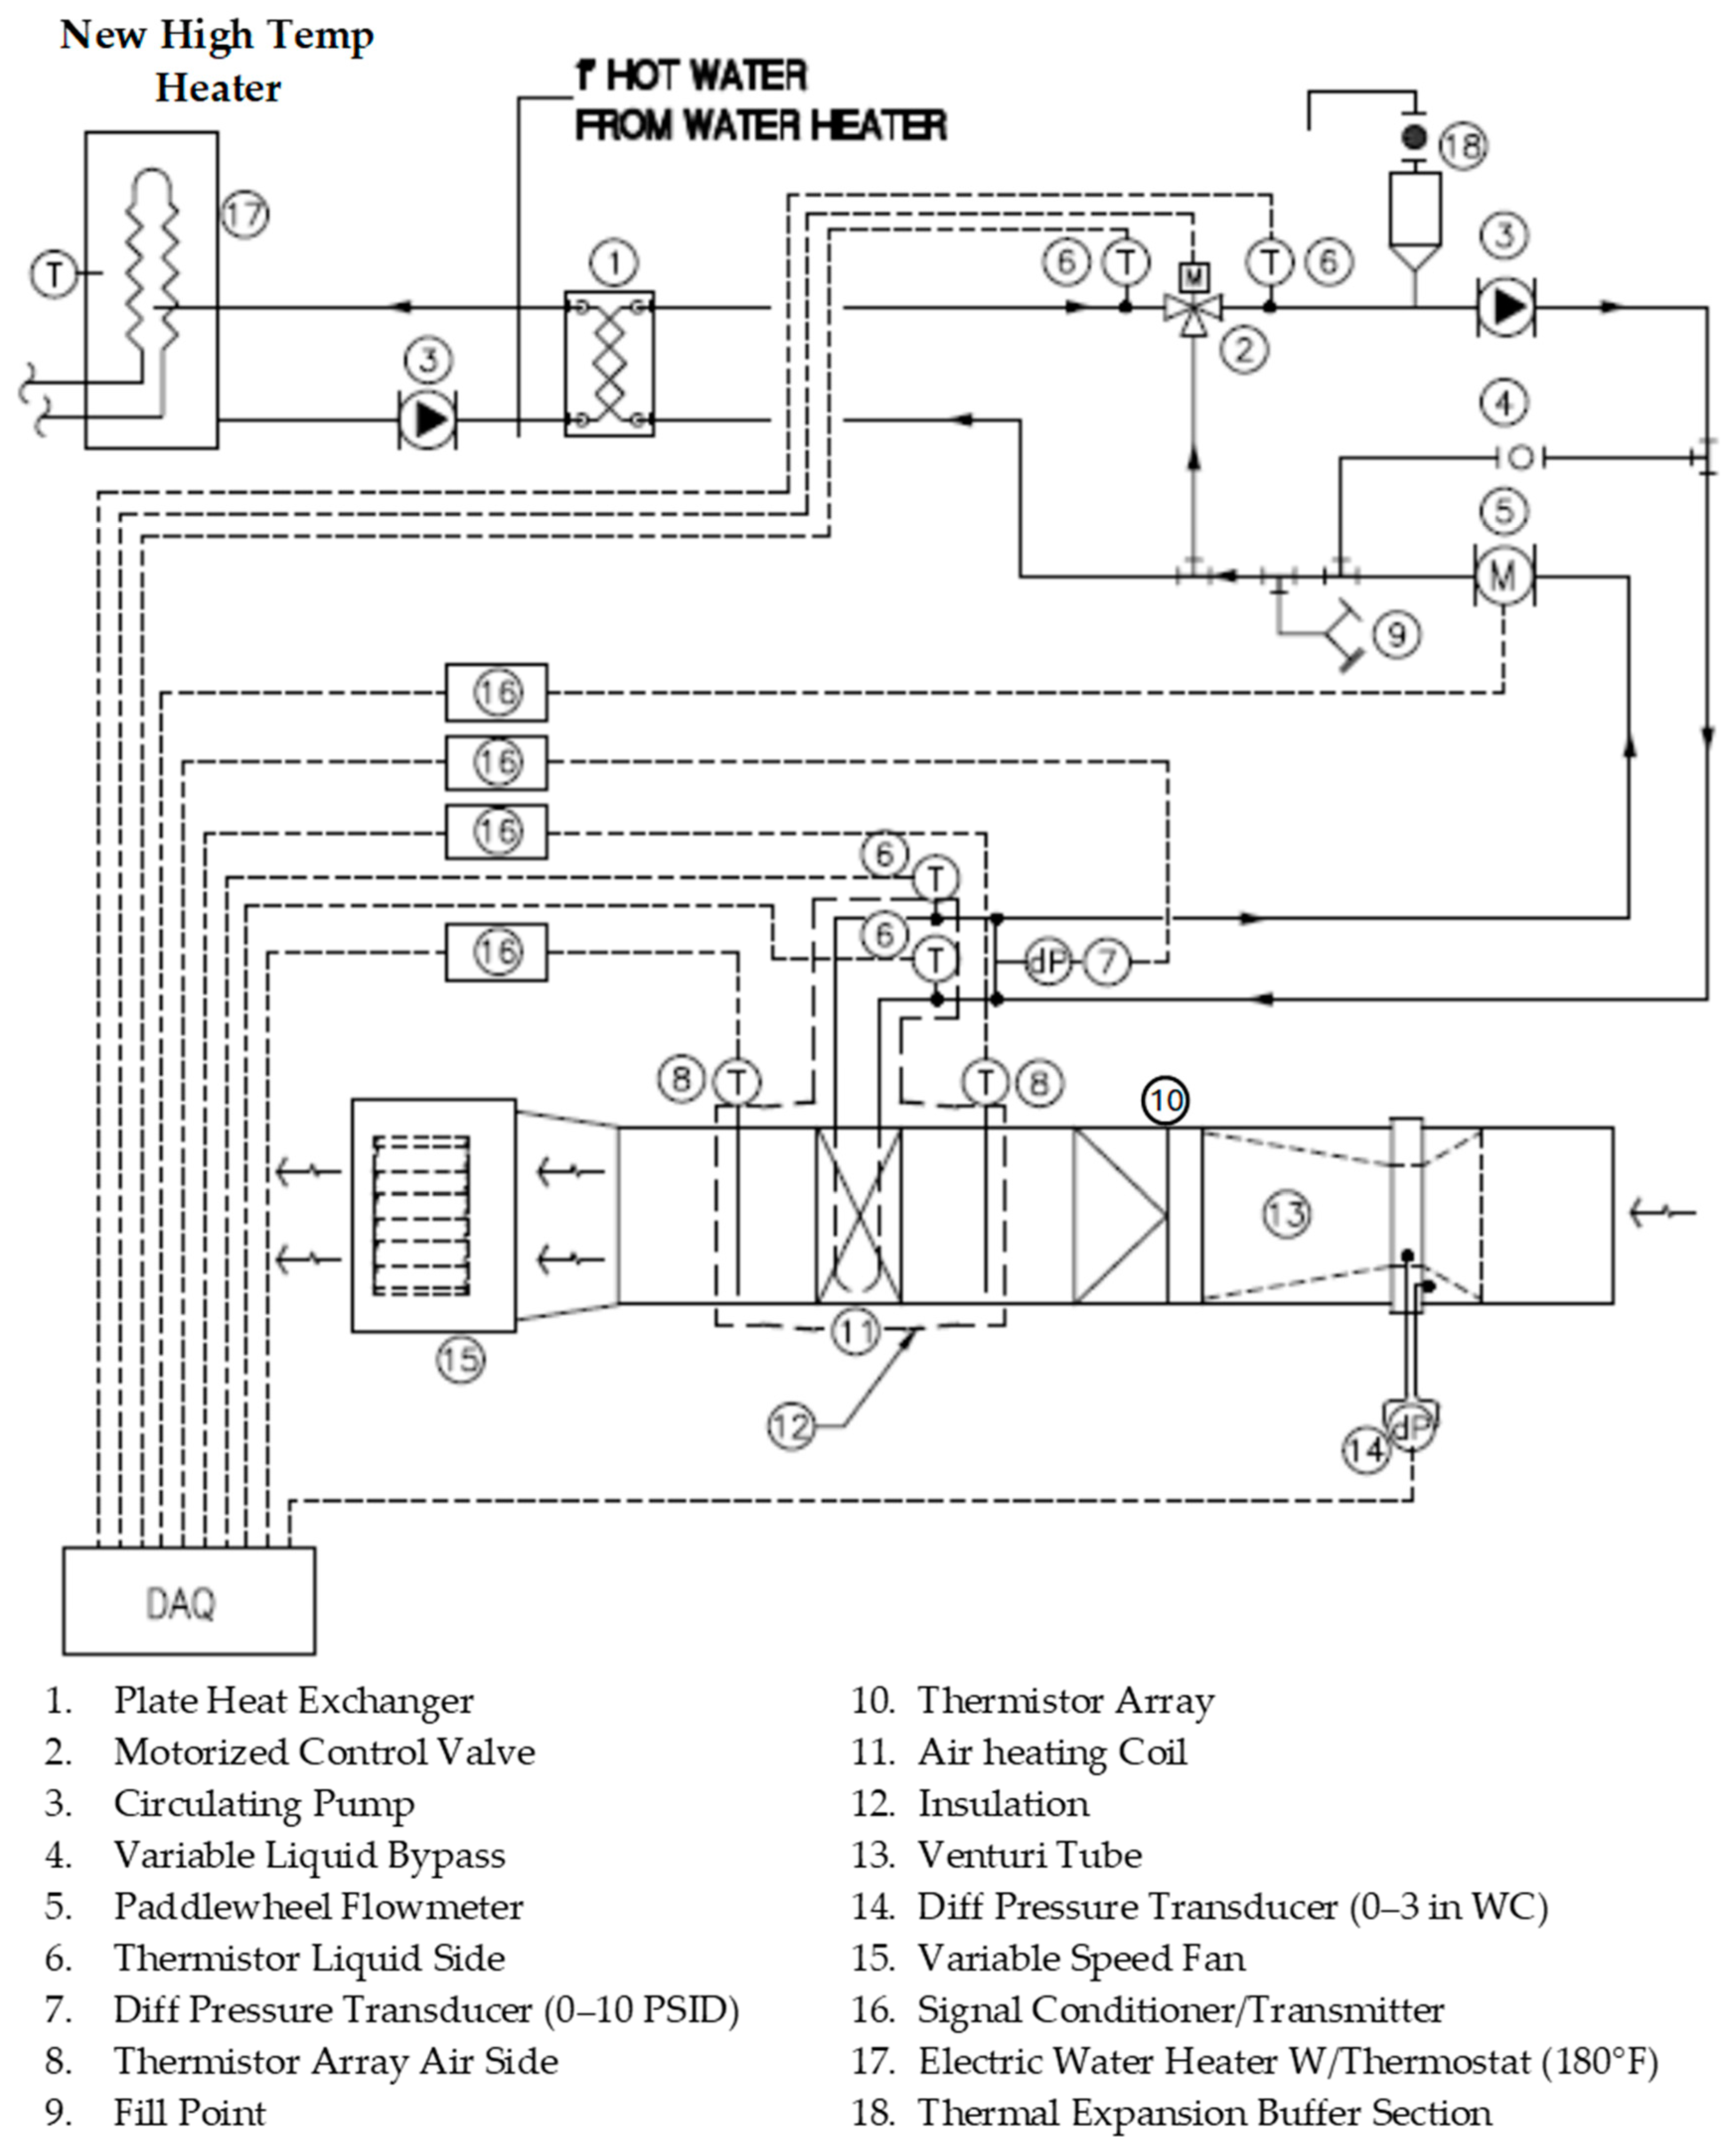
Figure 4.
Testbed components and instrumentation layout [7].
The commercial heating coil [19] used in the test bed is pictured in Figure 1. The heating coil is 30.5 cm wide by 25.4 cm high and is configured with two rows of copper tubes with fins in the air stream. The coil has flat aluminum fins 0.25 mm (0.010 in) thick mechanically attached to copper tubing with a 12.7 mm outside diameter and 0.4 mm wall thickness with a fin density of 3.9 fins/cm (10 fins/in). The transverse pitch of the coil tubing is 2.5 cm and the longitudinal pitch is 3.5 cm.
Foil-faced fiberglass batt insulation 5–7.5 cm in thickness covered the coil enclosure, while exposed tubing bends were insulated with EPDM foam wrap. The insulation was applied to minimize energy loss to the ambient air between all temperature sampling points. An inline paddlewheel flow meter measured liquid volumetric flow. Thermistors were installed in wells on the liquid lines immediately upstream and downstream of the coil inlet and outlet to measure entering and leaving liquid temperatures, respectively. A differential pressure sensor (strain-gage-type transducer) connected across the supply and return connections measures liquid static pressure change through the coil tubing. The air-side apparatus was configured with four thermistors arrayed on the heating coil air inlet and outlet to measure the entering and leaving air temperatures. These devices were manufactured by Ebtron Inc. (Loris, SC, USA) [20]. An in-duct calibrated Venturi tube manufactured by Lambda Square, Inc. (Babylon, NY, USA) [18] measured volumetric airflow. An electrically actuated control valve (item 3 in Figure 3) was used to maintain the liquid supply temperature to the coil. A closed-loop control circuit incorporating a LabView DAQ and control program, with PID (proportional/integral/derivative) control logic, provided highly accurate set point control of the coil hot glycol inlet temperature. The authors carried out the development of the control and data acquisition program. A schematic of the test bed components and the instrumentation is depicted in Figure 4.
The testing apparatus is an improved version of the one used in the study by Strandberg and Das [7], with refinements in the design to reduce the entrained liquid volume, reconfiguring the system to ease air purging, and increasing the entering temperature to the test section. The testing apparatus was relocated to a more stable thermal environment in a different laboratory. This condition assured more consistent test conditions for the air side. The test bed used in the previous testing used a heat source that limited the supply temperatures of the liquid to 325 K. Typically, air heating coils in arctic and sub-arctic regions (e.g., Alaska) circulate liquid with supply temperatures of 350 K, which the revised test bed heat source can generate. Previous empirical tests have shown that certain nanofluids have thermophysical properties that vary significantly with temperature [21,22]. In particular, empirical data indicate that the thermal conductivity of 2% Al2O3/60% EG increases by 9%, while viscosity decreases by 41% as temperature increases from 325 K to 350 K. Similar improvements are exhibited by nanofluids with volumetric nanoparticle concentrations of 1 to 3%. These improvements in properties have the potential to significantly improve the heat transfer performance of the nanofluid relative to the base fluid. The present study was designed to determine if the performance benefits predicted in previous theoretical studies [5,8,16] can be replicated in an experimental investigation.
Nanofluid Suspension Preparation
The dispersions used in the test were prepared in a University of Alaska laboratory. The nanoparticles used were obtained from Alfa Aesar [23]. The nanoparticles were delivered as a concentrated, hydrated dispersion called the “mother fluid.” The mother fluid was subjected to sonication in an ultrasonic bath with a maximum input power of 185 W for at least 8 h to homogenize the particles in dispersion. After the homogenization process, the mother fluid was mixed with a suitable volume of ethylene glycol and 25 µS deionized water to achieve the desired volumetric composition of the nanoparticles in a 60:40 EG/water (w/w%) dispersion. The ethylene glycol used for the test fluid was a commercial-grade heat transfer fluid commonly used in residential and commercial air coils in cold climates with corrosion inhibitors, Dowtherm SR-1 (Dow Inc., Midland, MI, USA) [24]. The components of each dispersion were weighed out using a precision mass balance. In this manner, nanofluids of 1, 2, and 3% v/v concentration nanoparticle dispersions were prepared. A dispersion was transported to the testing location within 48 h for each experiment and introduced into the system. Once the system was charged, the liquid was continuously circulated through the test loop. Earlier TEM work by Vajjha and Das [5] showed that this method yielded a dispersion with uniform particle distribution, minimal particle agglomeration, and avoidance of settling during experimental proceedings.
The nanoparticle concentration of the mother fluid was 50 percent by mass. It was procured from Alfa Aesar [23] as concentrated aqueous suspensions. The average particle size of this test fluid was 53 nm. Knowing the density of all components from the manufacturer’s specifications, we calculated how much of this mother fluid should be added to the base fluid, 60:40 EG/water, to create concentrations of 1, 2, and 3% of Al2O3 nanofluid. The EG and water properties and the sonication process to break up agglomeration have been described in this section. Using a precise electronic mass balance, small volumes of mother fluid drawn in a pipette were added to the base fluid to prepare 1, 2 and 3% nanofluids.
3. Analysis
Empirical correlations for thermophysical properties of base fluids and nanofluids used in relevant calculations to derive final results are described in detail by Strandberg in his doctoral dissertation [9]. Additional information on this research is described in this dissertation.
3.1. Moist Air Properties
For moist atmospheric air, the heat absorbed as flow moves from across a finned-tube liquid to an air heat exchanger is found using the following equation from McQuistion et al. [25]:
where is the rate of heat transfer, is the mass flow rate of air, and are enthalpy of air and vapor, respectively, and is humidity ratio. The subscripts 1 and 2 represent inlet and outlet conditions of the air flow.
The relative humidity of the entering air was variable, which affected the thermophysical properties of the air and potentially impacted the energy balance calculations. Further discussion on the impact of humidity is presented in [7]. The relative humidity (RH) of the air during nanofluid testing ranged between 20–34%. Considering commonly available psychrometric data for the entering air conditions experienced here and using the energy Equation (1) for moist versus dry air, the difference in enthalpy change associated with heating moist air versus dry air under existing test conditions ranged between 0.9–1.5%. Therefore, dry air properties were deemed acceptable and used for this test’s calculations.
3.2. Exergy Considerations
From the experimental data, it was possible to perform a second law of thermodynamics analysis to compare the performance of various nanofluid concentrations with that of the base fluid. This analysis was carried out following the procedure described by Bejan [26,27], calculating the entropy generation and exergy change during the process. Exergy is the available energy of a flow stream and is diminished by entropy generation due to irreversibility inherent to thermodynamic processes. As entropy generation increases in the process, the available energy of the system is reduced. In this experiment, energy is transferred from the hot liquid stream to the cold air stream through the fins and heating coil tubes, with irreversibility generated in the process, resulting in reduced availability. The contributions of viscous losses are disregarded in this case since the liquid stream is incompressible. The air stream may be treated as incompressible since it is flowing at low velocity and pressure. Heat loss (and associated impacts on exergy) to the environment is also disregarded since the heat exchange section is well insulated. The impact of exergy associated with viscous dissipation and frictional heating in either stream is also captured in the calculation presented (since any such heating effects are reflected in the measured temperatures). It was hypothesized that the enhanced heat transfer properties of the nanofluids may reduce the exergy consumed during the heat exchange process, thereby improving its overall thermodynamic efficiency. Equations for computing entropy generation and exergy are described in Bejan [26,27] and are presented below.
For a heat exchange process where no work is done, the entropy generation is calculated using the equation
where is the entropy generation occuring in the hot stream (nanofluid) and the cold stream (air) during the heat exchange process in the air coil. The represents heat capacity rate, which is the product of the mass flow rate and constant pressure-specific heat. The stands for temperature and subscripts and represent hot and cold fluids, respectively.
The change in exergy may be conceptualized as the quantitative difference in availability between the liquid and air streams. Exergy is related to entropy change by the relation
where represents exergy change.
From Bejan [26], entropy generated due to viscous losses occurring from flow through a duct may be computed using
where is the entropy generation due to pressure loss of a fluid of density and a mass flow rate .
4. Results
4.1. Experimental Data Uncertainty Analysis
The total experimental error in the liquid and air streams’ rate of heat transfer calculation is found by aggregating all known error sources in the test bed. The test bed error was analyzed in detail previously in the paper by Strandberg and Das [7]. Since the instrumentation remained unchanged from the previous test (Strandberg and Das [7]), the process of error analysis remained the same (Table 3).
Table 3.
Published instrumentation error from manufacturer’s data [7].
The error (in percent) in the rate of heat transfer calculation is calculated using the equation:
where is the dependent parameter, e.g., heat transfer rate.
In Equation (5), x1, x2, x3, and x4 are variables in the rate of heat transfer calculation, such as specific heat, fluid volumetric flow rate, temperature difference, and density, respectively, following the heat rate equation from Bejan [28]. The represents the error associated with each measured parameter.
The total measurement error of the liquid heat transfer rate using water as the sample on the aggregate produced an error of 1.1%. The total measurement error of the heat transfer rate on the air side was 0.8%.
4.2. Baseline Testing
In the earlier experimental study, Strandberg and Das [7] conducted baseline testing to validate the instrumentation and test methodology. That original baseline testing already demonstrated that the test bed generates performance data that are aligned with expectations. Nonetheless, additional testing was performed on the improved test bed to demonstrate that the heat transfer performance measured by the instrumentation agreed with what was expected as determined by the manufacturer’s data and computations based on methods accepted in the literature. The additional testing was to validate that the relocation and minor revisions to the piping did not adversely impact the quality of data generated by the test rig.
Baseline apparatus testing was conducted using water on the “wet” side of the test loop. The test runs were designed to verify that the measured thermal output of the liquid-to-air heating coil agrees with the manufacturer’s product data. The hot water was circulated through the tubes of the heating coil while heating air was drawn through the fins. The test bed instrumentations measured volumetric flow rates and average temperatures in the air and water streams, and the heat transfer rate between the water and air streams was computed from there.
Another objective of the baseline testing was to characterize the energy balance between the air and water streams over the operating envelope of the test. The difference between the rates of heat transfer measured in the two streams was an essential measure of experimental error in the testing apparatus. Quantifying and minimizing the energy imbalance is crucial as it indicates that the energy loss rate to the environment has been controlled and provides the primary check on the performance of the air Venturi meter. By validating the performance of the air Venturi meter, the analysis of nanofluid heat transfer performance will become more straightforward since the thermophysical properties of air are well understood over the range of test conditions, and air properties are also constant over time (at constant temperature and pressure). In contrast to air, the thermophysical properties of nanofluids may change over time due to degradation caused by suspension instability, particle agglomeration, and subsequent settling.
Vajjha and Das’s earlier work [22] involved property measurements. During those experiments, we used the nanofluids immediately after receiving them from Alfa Aesar [23]. They were fresh, uniformly dispersed. The sample sizes for viscosity, thermal conductivity, specific heat, and density were small. There was no circulation of nanofluids as these were static tests on small sample volumes confined to a contained space. The experiments were of short duration. So, we measured the optimum property values under ideal conditions.
However, in the present experiments, the nanofluids circulated in a coil for very long durations to obtain data over a range of Reynolds, Prandtl, and Nusselt numbers varying flow rate, temperature, pressure to measure, convective heat transfer, heat transfer rate, pressure loss, and pumping power. Maintaining nanofluid purity was a more significant challenge because we started with an older nanofluid that had lost its uniform dispersion ability. This was unknown to us initially, but the unexpectedly poor performance result taught us a lesson.
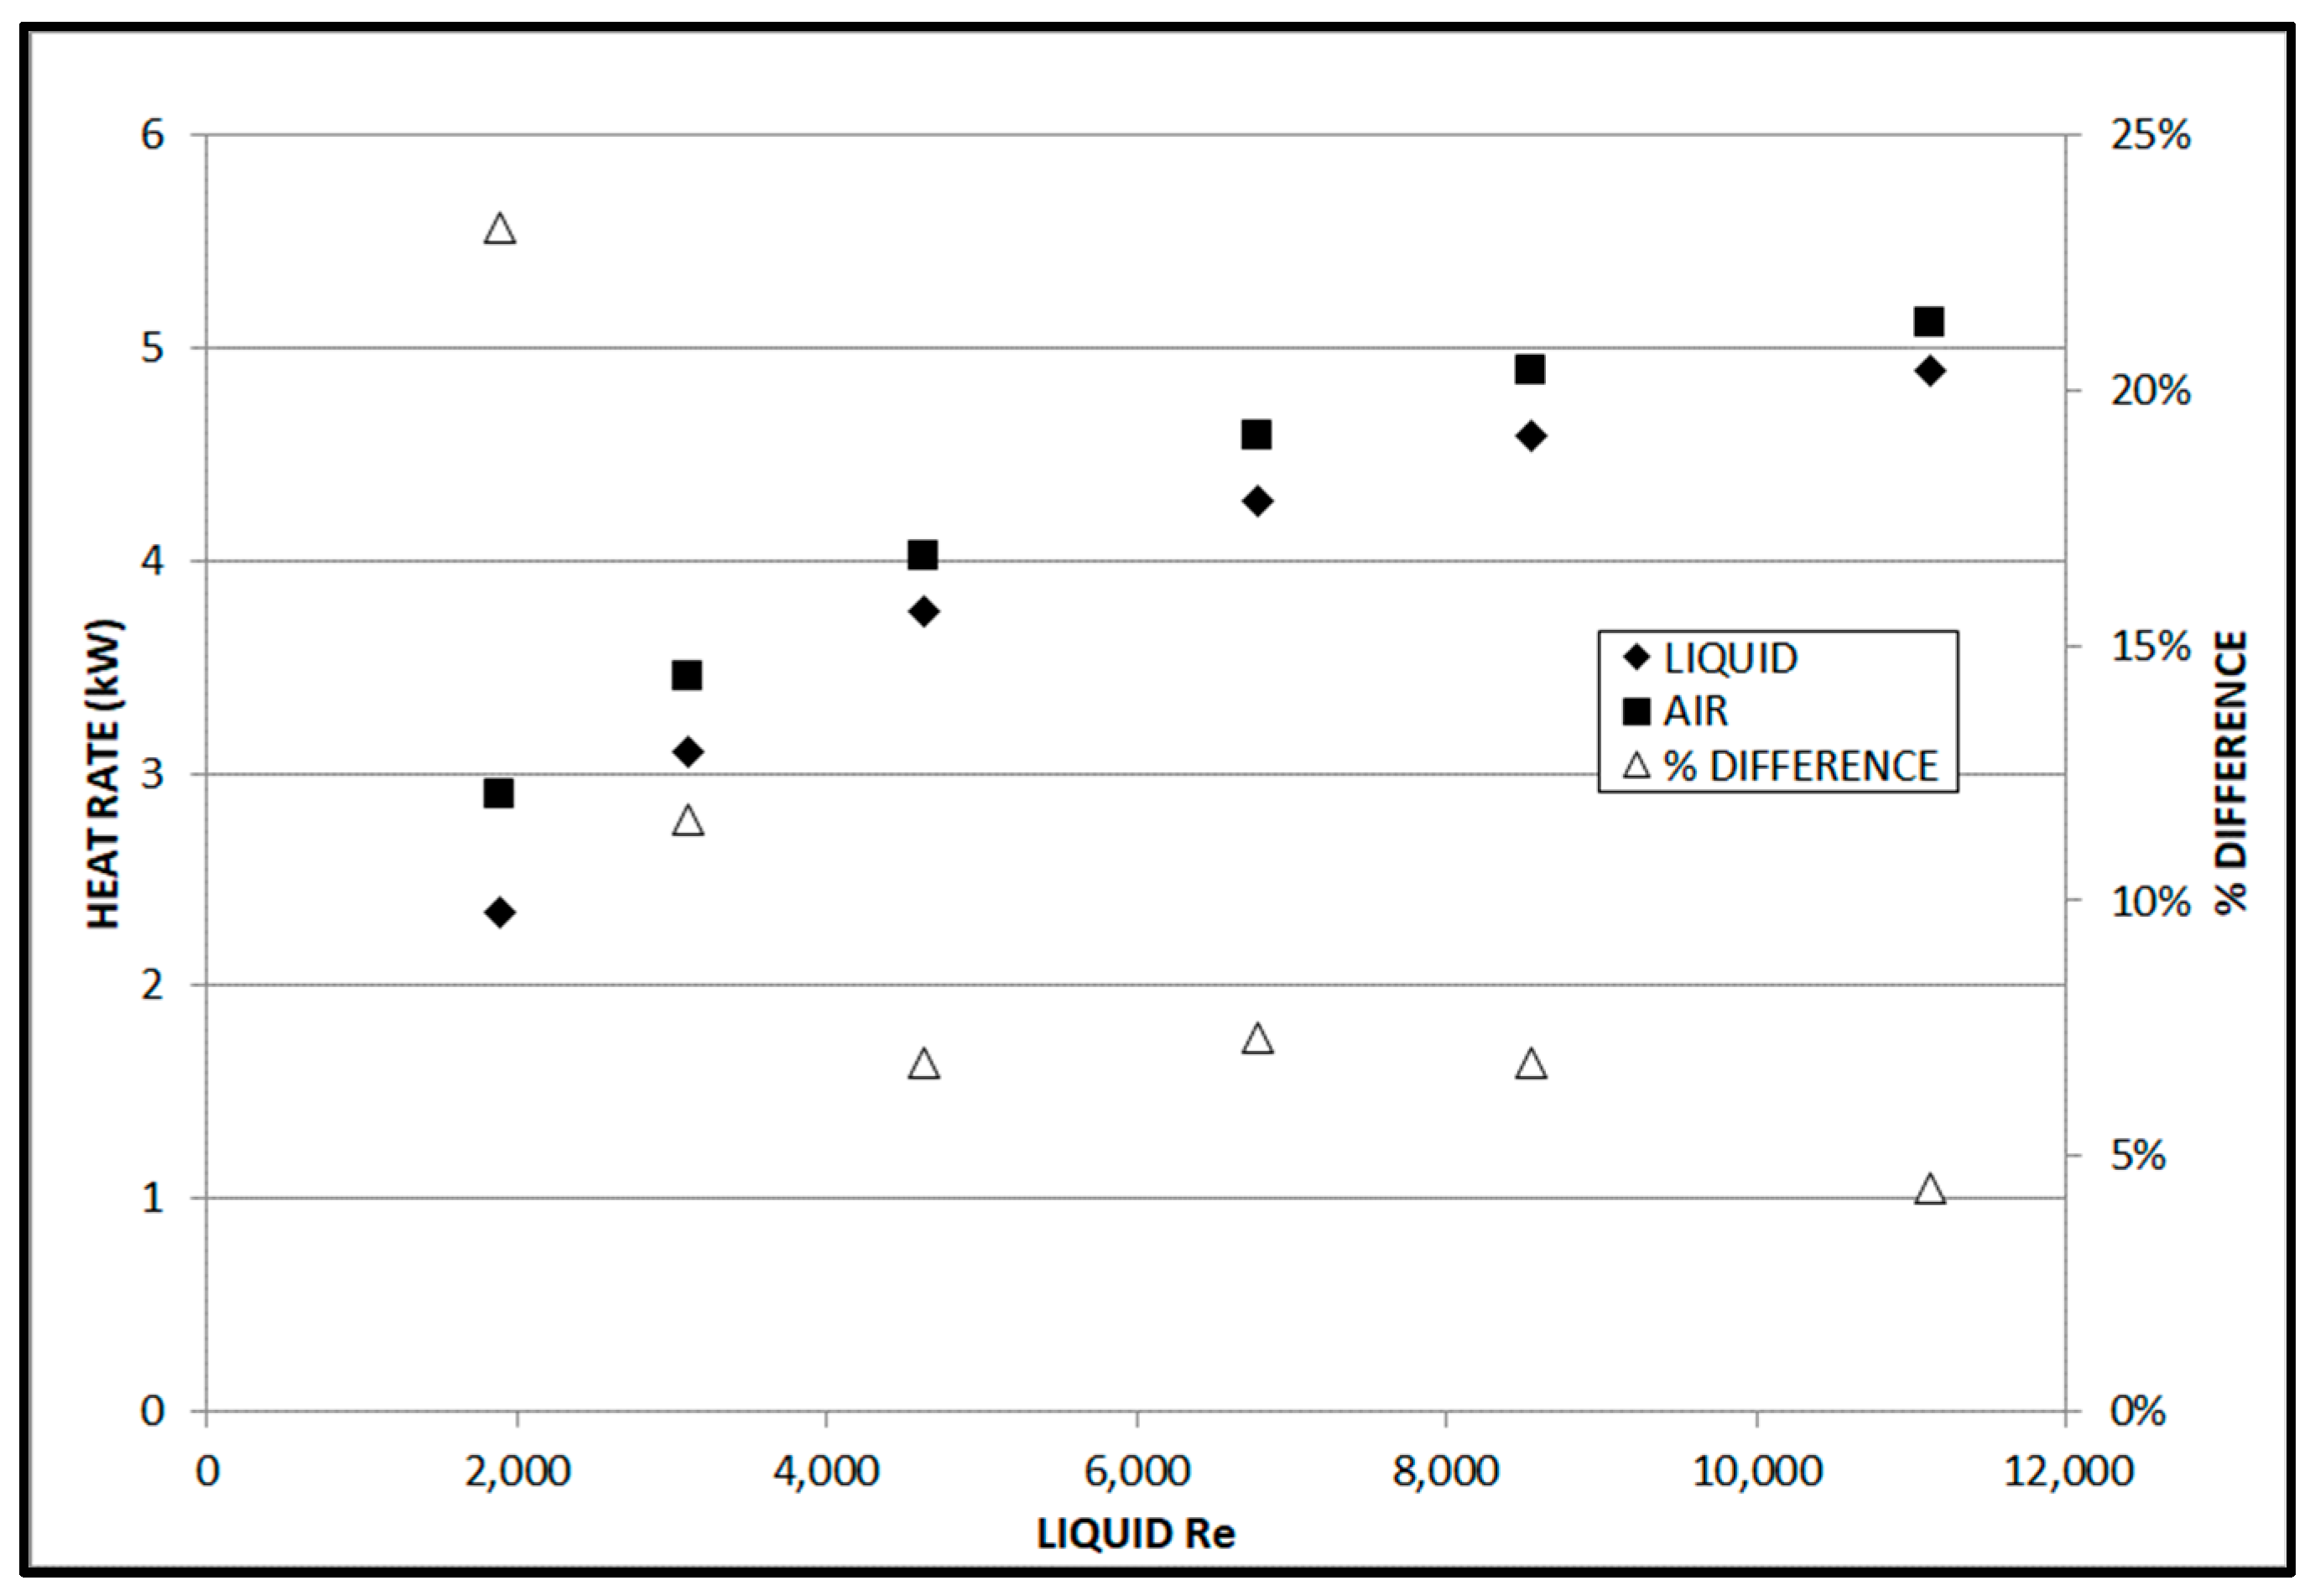
The first baseline test was performed in which the volumetric flow rate of the water was varied, while the inlet liquid and air temperatures, as well as the air volumetric flow rate, were all held constant at practical values of 340 K, 289 K, and 0.23 m3/s, respectively. The result of this testing is illustrated in Figure 5, with the calculated heat transfer rate for the air and liquid streams. In this test, 708 individual measurements were recorded for both fluid streams. Each data point is the average of several measurements. The average difference between the calculated air- and liquid-side heat transfer rates is 10.0%. The first experiment near Re = 2000 is an outlier in the heat rate difference. Disregarding this first point, the average difference is reduced to about 8%. For additional validation of the empirical measurements, the coil was modeled using identical entering conditions and configuration using the approach described by Strandberg and Das [7]. The heat transfer rate of the modeled coil over the same range of liquid flows was within 3% of the empirically obtained air rate of heat transfer over the tested range. The average of the liquid and air rates of heat transfer were used for performance comparisons. The test bed was allowed to reach a steady state for each run before data collection.
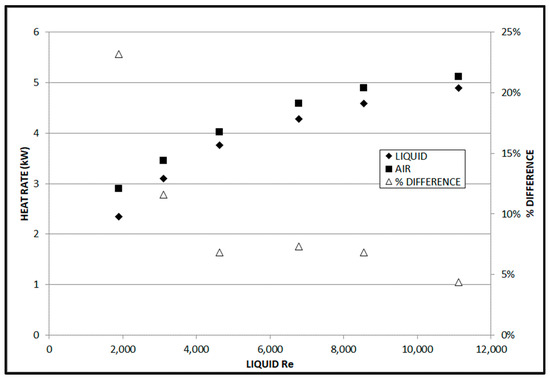
Figure 5.
Heat transfer rate versus liquid Reynolds number at a constant inlet temperature.
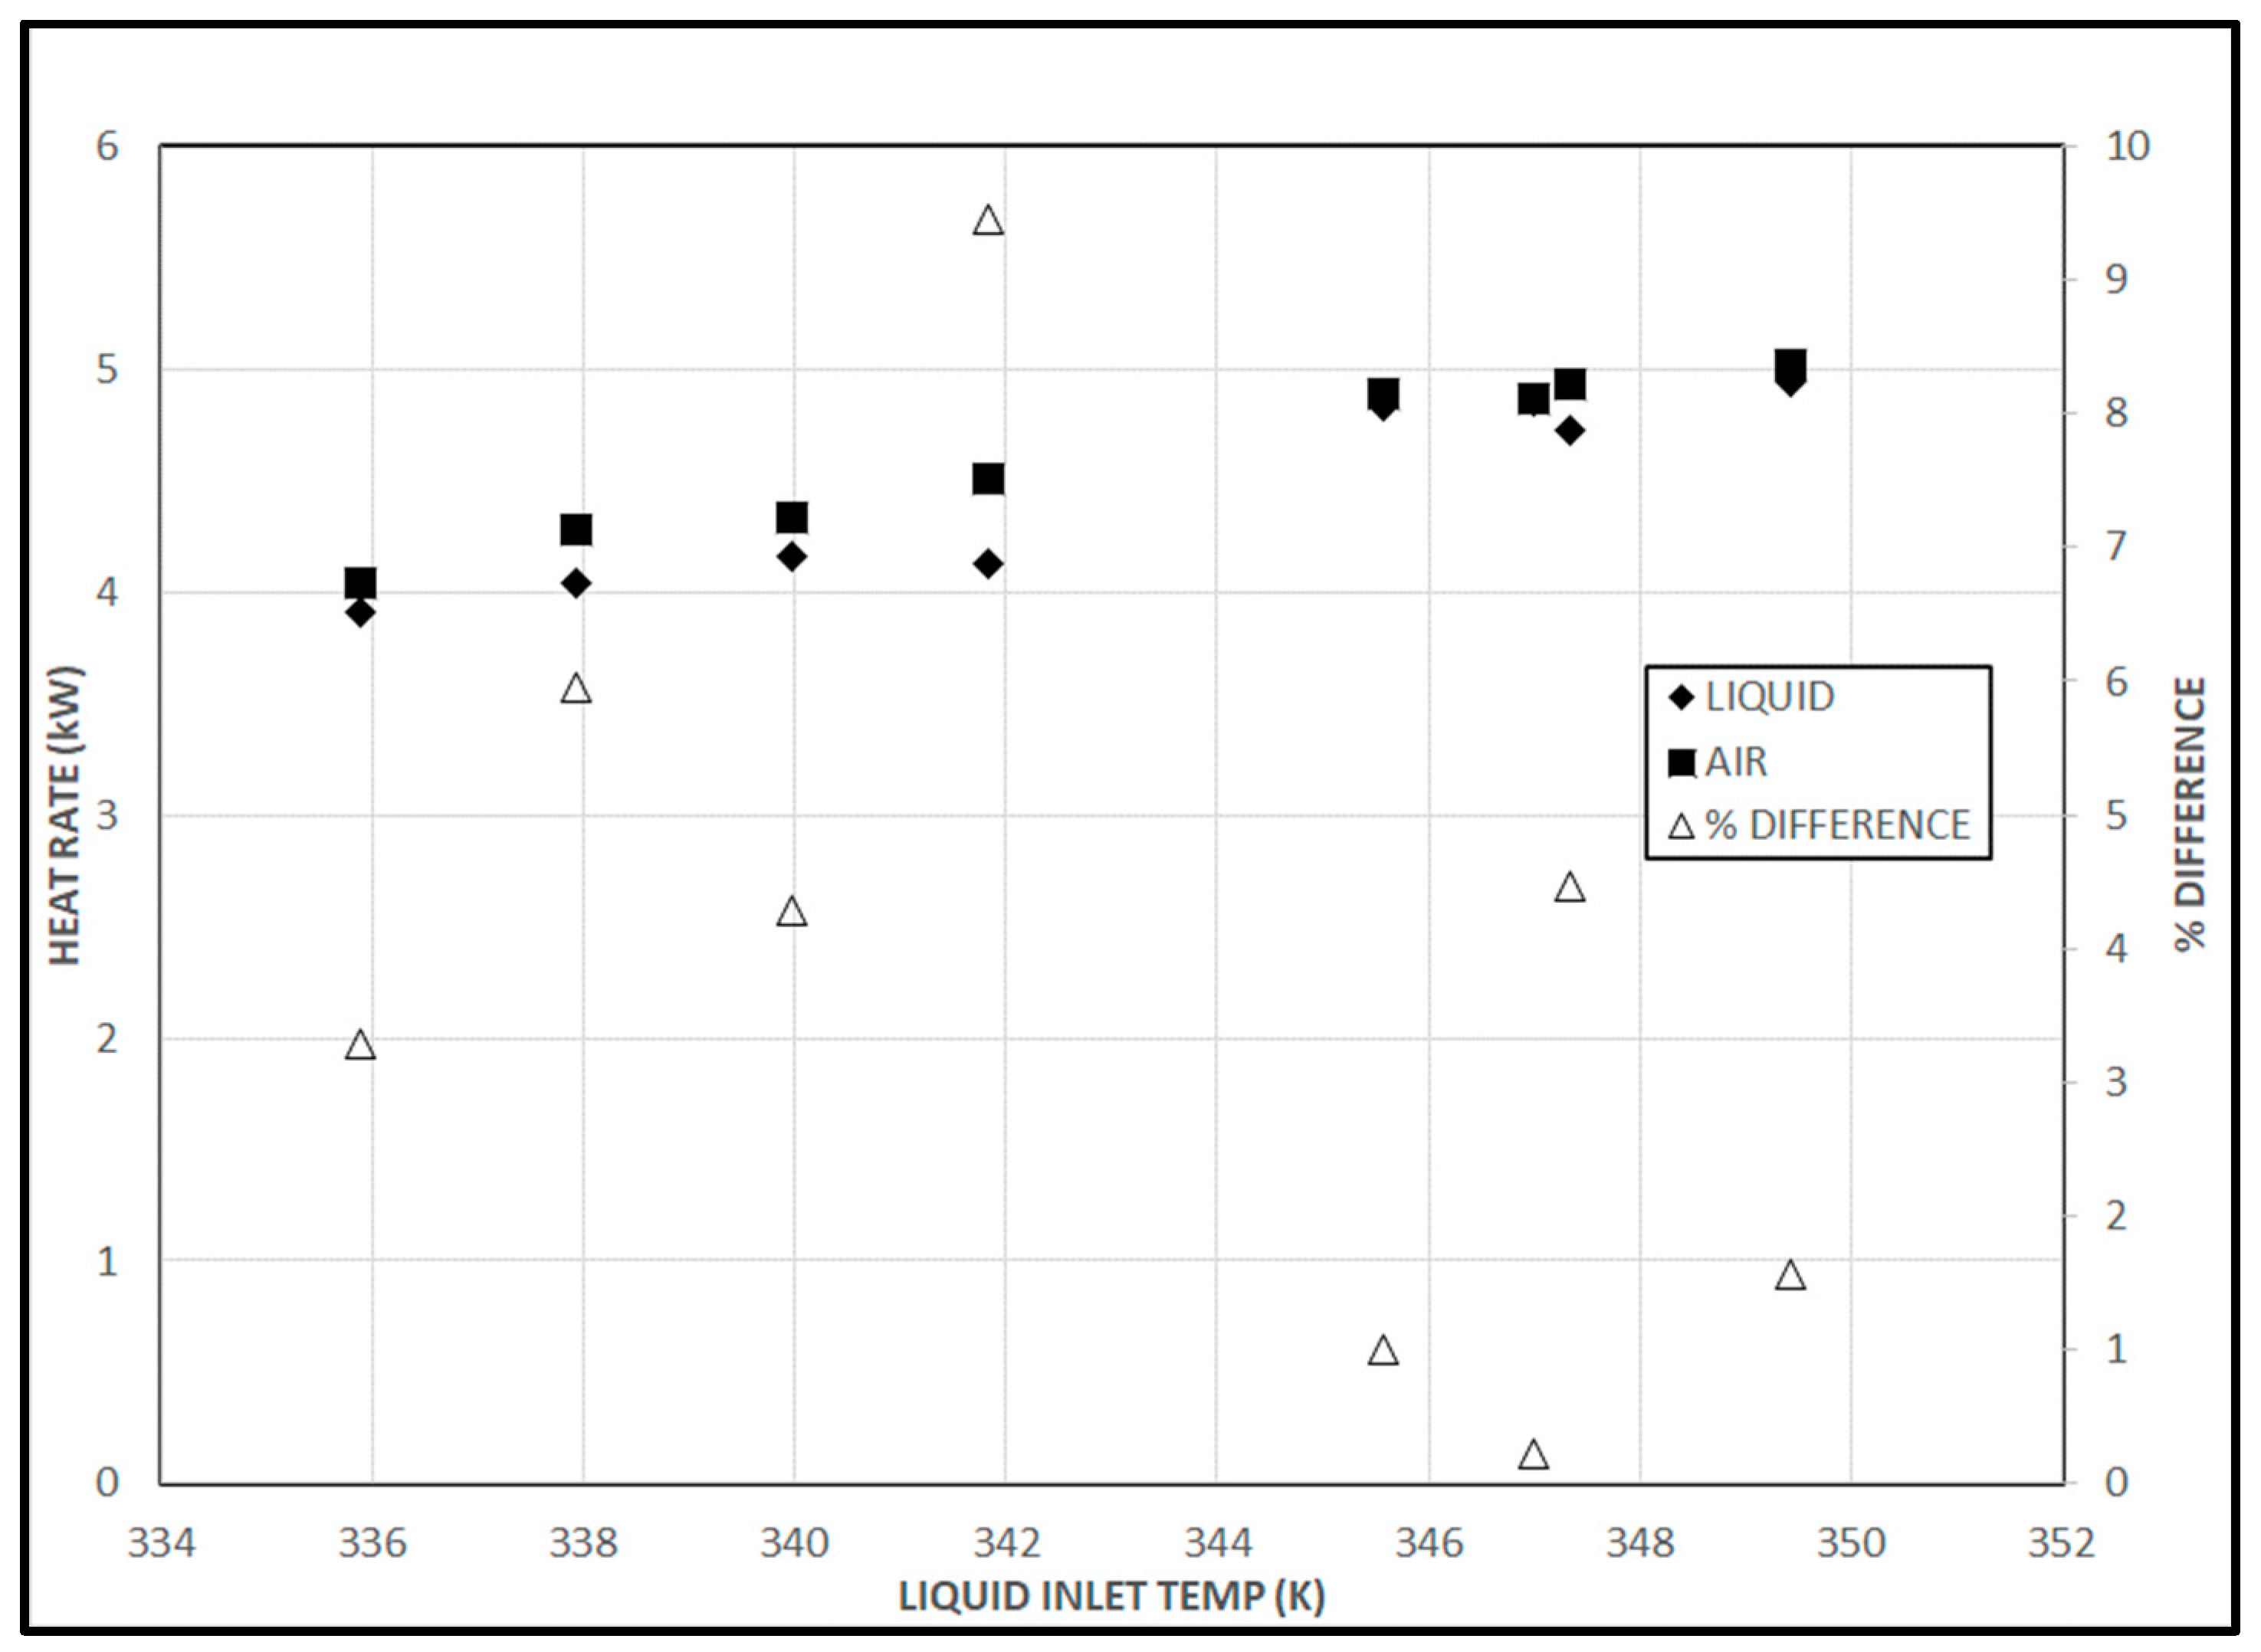
In the second baseline test, the inlet water temperature was varied, and the volumetric flow rate of the water and air was kept constant. The volumetric flow rate of liquid was held constant at 0.063 L/s while the airflow was constant at 0.222 m3/s. The result of this test is illustrated in Figure 6. The difference between the air-side and liquid-side calculated heat transfer rate ranges from 0.23% to 9.4%, with a mean of 3.4%. Here, the fourth data point near 342 K is an outlier. Disregarding this outlier, the average difference between energy balances comes to about 3%, an acceptable value for validating the test bed. For this test, the total number of data points is 902 (with between 64 and 192 observations at each temperature).
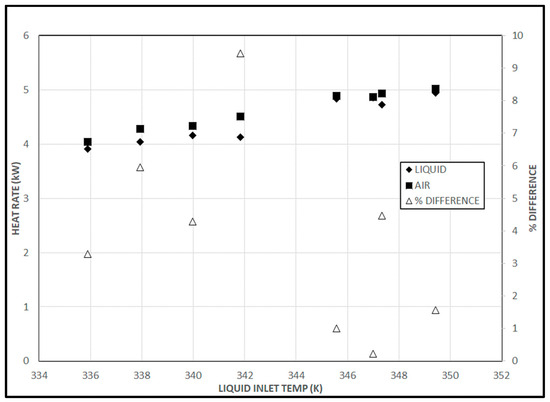
Figure 6.
Heat rate at varying inlet water temperature while maintaining constant volumetric flow.
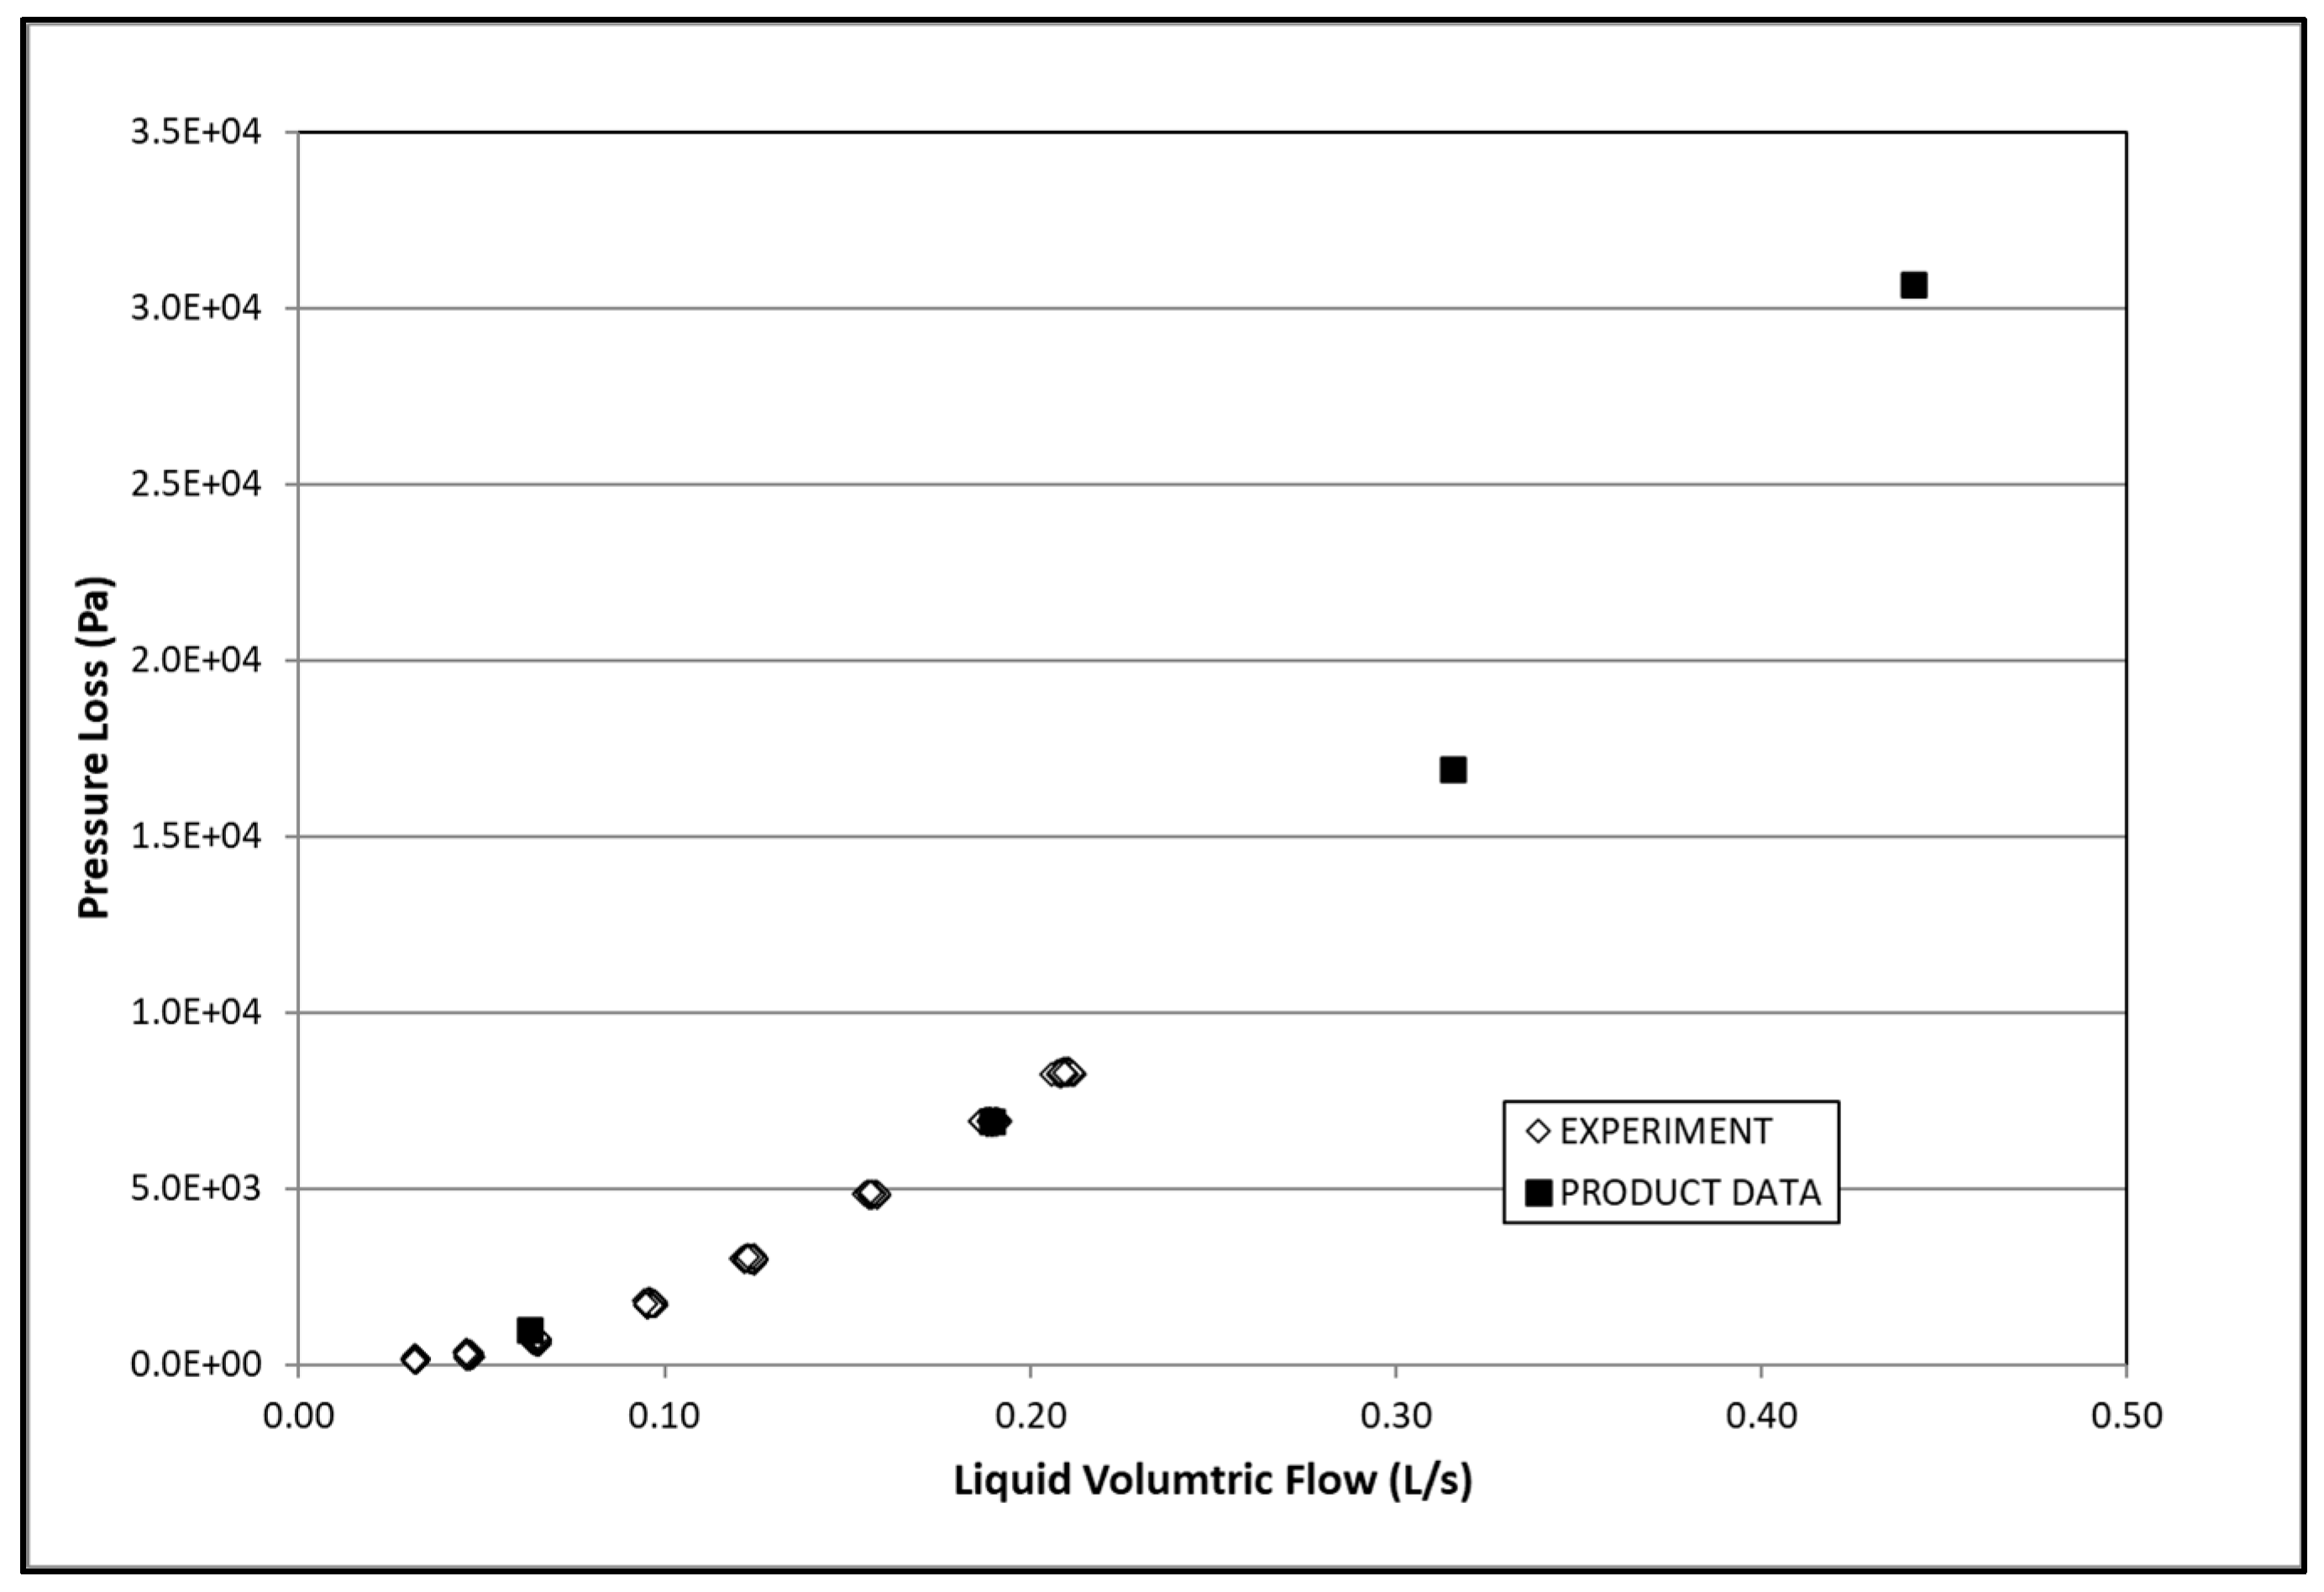
The following baseline test was to measure the viscous losses through the hydronic coil over a range of flows. These data are illustrated in Figure 7. The pressure loss measured through the coil apparatus showed remarkable agreement with the coil manufacturer’s published data [19] over the practical flow range. This validates the accuracy of the experimental setup for measuring the pressure loss for subsequent runs with nanofluids of different concentrations.

Figure 7.
Measured pressure loss through coil versus Titus [19] technical product data.
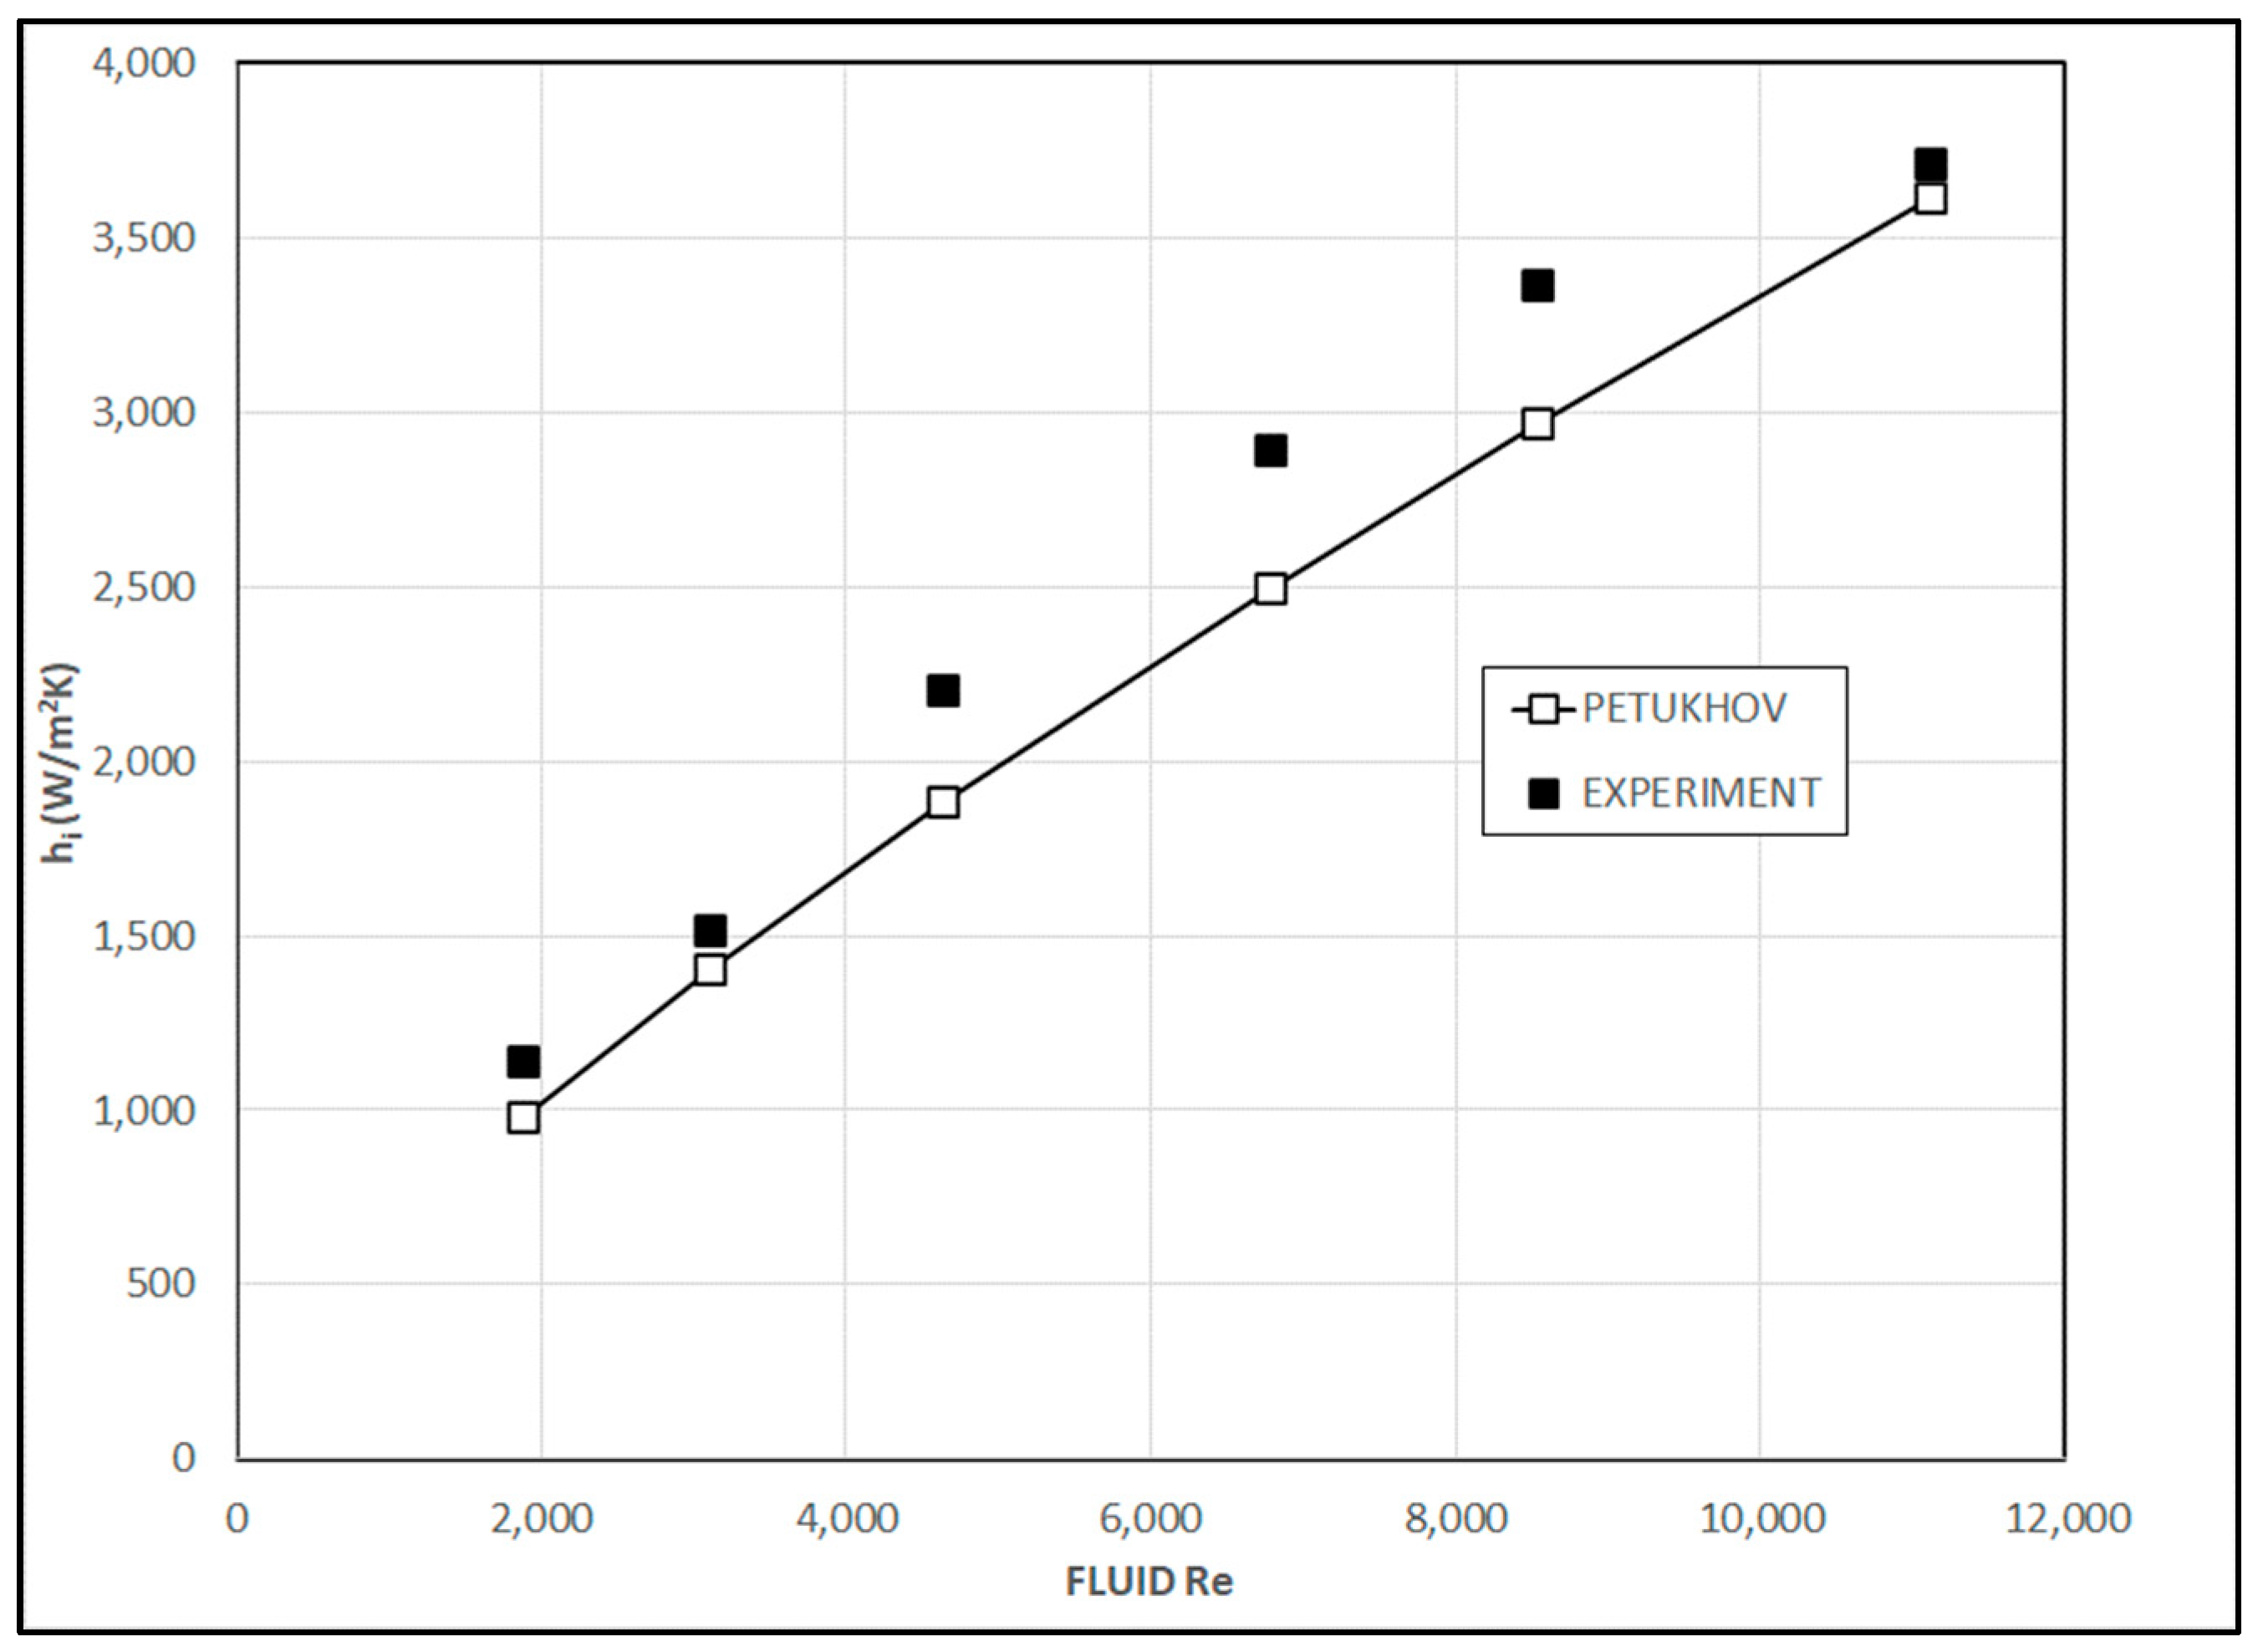
Using the data collected in baseline testing, the “inside” heat transfer coefficient (hi) was computed as an additional check to verify that measured values aligned with those predicted by well-established correlations in the literature for single-phase liquids. In Figure 8, the graph depicts the experimentally determined “inside” heat transfer coefficient compared to values computed using the Petukhov correlation [29] as a function of the Reynolds number. This test was performed with constant air-side velocity and a temperature and pressure range of relatively constant thermophysical properties for air. Therefore, it is a reasonable assumption that the outside heat transfer coefficient over the fins and copper tube will remain relatively constant over the full range of inside liquid volumetric flows. Airflow was constant at 0.230 m3/s (487 CFM); air and liquid inlet temperatures were also held constant. Liquid flows were varied through the coil from 0.019 to 0.10 L/s (0.3 to 1.5 GPM).
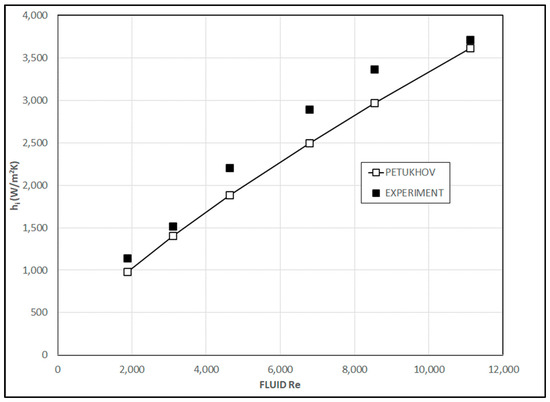
Figure 8.
Comparison of heat transfer coefficients for water determined empirically and calculated using the Petukhov correlation [29].
Heat transfer rates for liquid and air were computed using well-established heat exchanger design equations from McQuistion et al. [25], Bejan [28], and Shah and Sekulic [30] using measured volumetric flow rates and temperatures.
The principal equation is
where is the overall heat transfer coefficient, is the outside surface area of heat transfer coil, is the log mean temperature difference, is the fin efficiency, and subscripts and represent inside and outside, respectively.
The LMTD was calculated from measured inlet and outlet temperatures of fluid streams. The product UA was also calculated based on from energy balance. The inside and outside heat transfer coefficients were determined by finding the values of the inside coefficient using the Petukhov correlation and then calculating the outside heat transfer coefficient by rearranging Equation (7). Based on the physical conditions of the test, in which the airflow velocity remains constant, it is acceptable that the property values of air over the range of test runs would remain nearly identical. Using the Petukhov correlation for hi, rearranging Equation (7), and averaging numerous measurements, the mean value found for ηhoAo was 193 W/K. At the lowest flows observed, the liquid Reynolds numbers drop (<2300) into the range usually considered “transitional” with respect to the presence of turbulence in the liquid stream. However, the Petukhov correlation was designed for fully turbulent flows (Re ≥ 10,000) and fits the experimentally obtained values in Figure 8 with R2 = 0.89. The Petukhov correlation predicts hi values lower than the empirically determined values from Nusselt numbers using the Gnielinski equation from Bejan [28] over the tested range. The average deviation between hi from Petukhov and experimental values via Gnielinski over the tested range is 12.2%. This is acceptable considering that well-known Nusselt number correlations can present uncertainty as high as 25%. Gnielinski’s equation works well in a transition regime, so the agreement in Figure 8 below, Re = 3500, between the experiment and theory is encouraging.
An important point: the tubing bends create secondary flows even at the laminar regime, promoting mixing and enhancing heat transfer at the Reynolds number in the transition regime, making the entire flow turbulent. At a low laminar Reynolds number, this phenomenon causes the experimental data to match the Petukhov and Gnielinski correlation in Figure 8, which is applicable to turbulent flows.
The value for ηhoAo = 193 W/K by averaging process from numerous test runs was only 3.9% lower than what is found using the procedure given in McQuiston et al. [25], showing good agreement between measured data and previously established correlations. Since the outer thermal resistance will remain essentially unaffected by the properties of the liquid flowing inside the tube, this value is used to evaluate the heat transfer performance of the nanofluids in the performance tests that followed.
4.3. Nanofluid Performance Testing
Nanofluid samples were prepared for multiple test runs with different concentrations of nanoparticles. The authors formulated 60% EG/Al2O3 nanofluids of particle volumetric concentrations of 1%, 2%, and 3% and the base fluid (60% EG). These dispersions were separately fed into the testbed and subjected to a series of performance tests. These tests are designed to characterize the differences in heat transfer performance between the Al2O3/60% EG nanofluid and 60% EG measured during testing. For this series of tests, the liquid and air inlet temperatures were held constant and liquid volumetric flow rates were varied.
In order to minimize the contamination of the fluids, between each series of tests, the loop was drained, refilled with water, and cleaned out until the rinse water came out clear. The tubing was partially disassembled and allowed to drain. Finally, all sections were blown out with high-pressure compressed air to clean out residual fluids. Upon completion, the system was refilled with fresh test fluid.
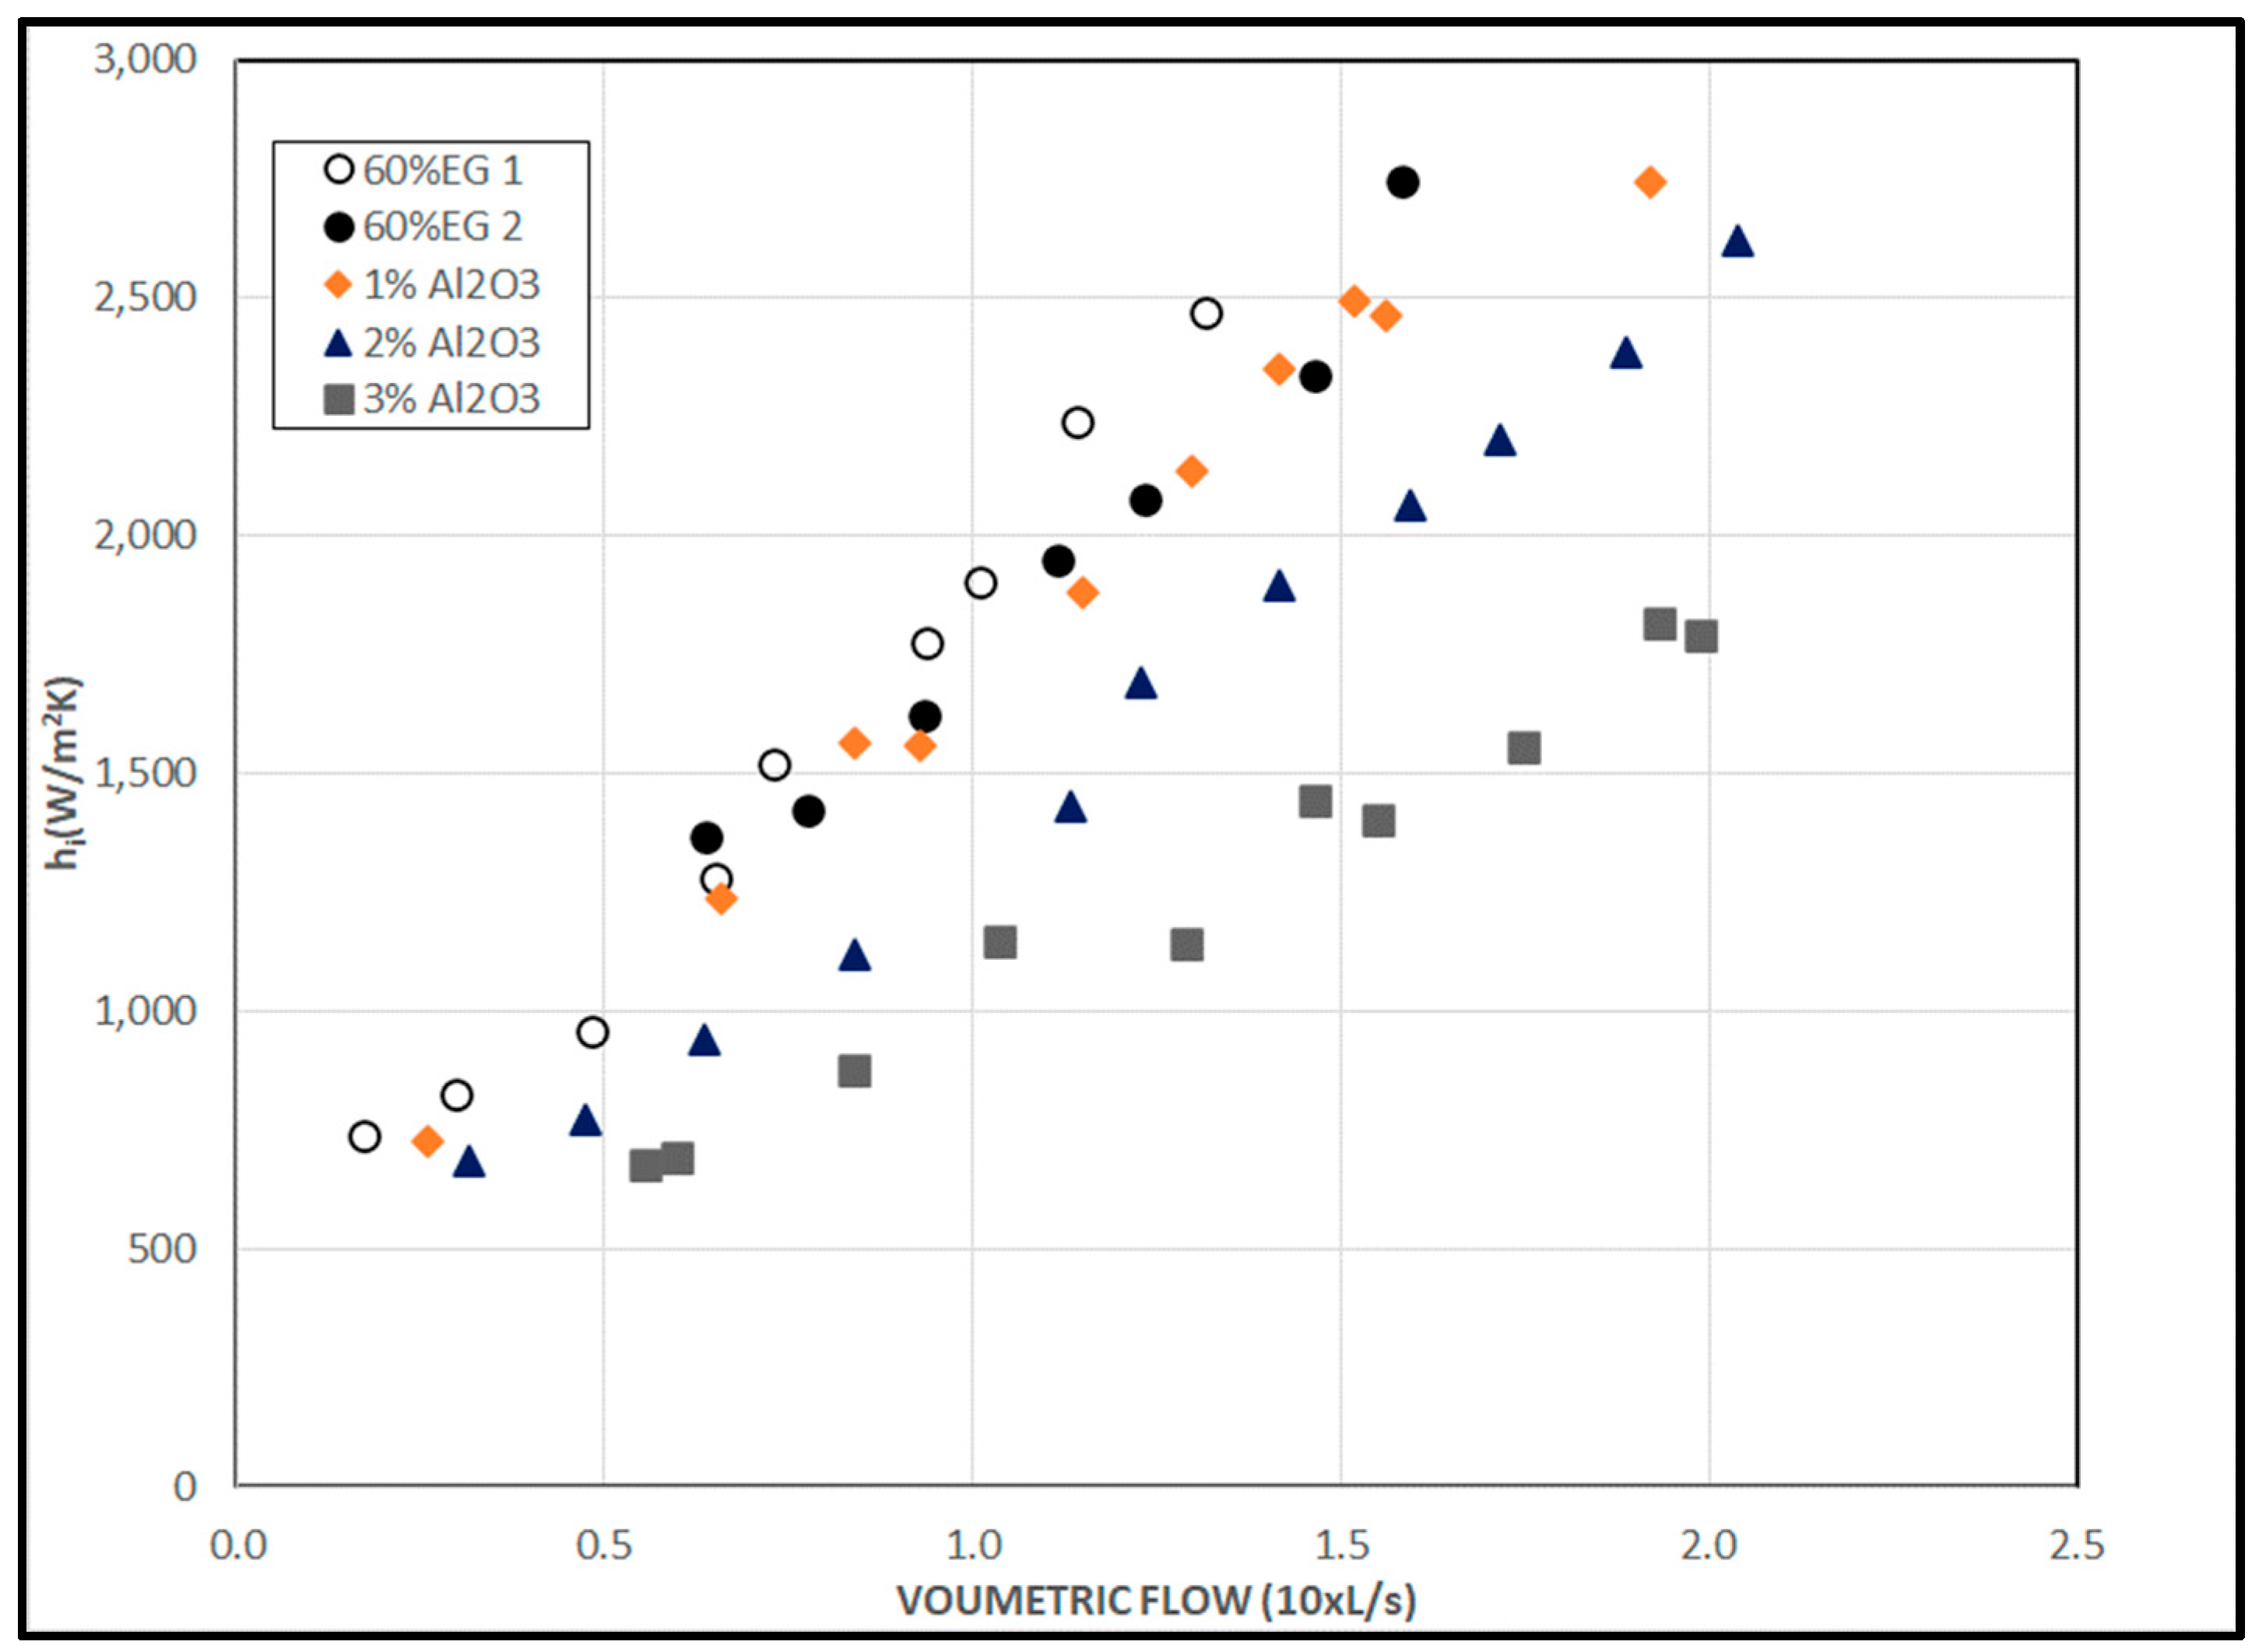
In Figure 9, the inside heat transfer coefficients for the base fluid (60% EG) are compared to those for the Al2O3/60% EG nanofluids for liquid volumetric flows ranging from approximately 0.025 to 0.2 L/s (0.4 to 3.2 GPM). The inside heat transfer coefficient was found by first computing the measured rate of heat transfer and LMTD based on the measured data and then determining the value for UA.
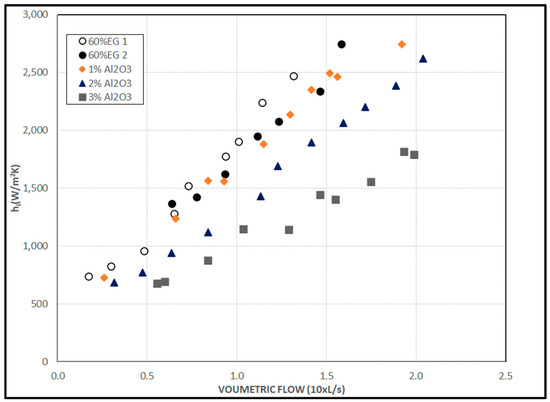
Figure 9.
Inside heat transfer coefficient versus liquid volumetric flow rate.
As explained in Section 4.2, the outside thermal resistance (ηhoAo) is accepted to have a value of 193 W/K, as determined in the baseline test. The inside heat transfer coefficient was then calculated considering the inside surface area of the heat transfer section.
Previous experimental work by Strandberg and Das [7] comparing the heat transfer performance of 60% EG to 1% 60% EG/Al2O3 did not show a significant improvement in the heat transfer performance of the nanofluid relative to the base fluid. This was attributed to the relatively low temperature of the liquid tested, which was limited by the heat source connected to the test equipment. The data in Figure 9 depicting the empirically determined inside heat transfer coefficients for the tested dispersions show that as the nanofluid concentration increases, the inside heat transfer coefficients decrease under equal volumetric flow rate conditions.
In the current experiment, the heat transfer coefficient decreases by 5.7%, 23.0%, and 44.3% for 1%, 2%, and 3% Al2O3/60% EG nanofluids, respectively, compared to the 60% EG base fluid, at a constant flow of 0.15 L/s (2.4 GPM). Due to nanofluids’ relatively higher viscosity, the Reynolds number at a given volumetric flow is generally lower than for the base fluid. According to well-established equations, the Nusselt number and the convective heat transfer coefficient are proportional to the Reynolds number for internal flows. Therefore, it is to be expected that the heat transfer coefficients for nanofluids are lower than for the base fluid when compared on a constant volumetric flow basis. Note in the legend of Figure 9 that two data sets for 60% EG were taken on different days.
Early in the test cycle, after the nanofluids’ relatively low thermal performance was observed, the authors attempted to verify that the thermophysical properties of the dispersion were as expected based on the previously cited correlations. To this end, representative dispersions samples were tested in a Brookfield viscometer at room temperature. These tests produced conflicting results in which the measured viscosities of the nanofluids did not correlate well with predicted values. Generally, the nanofluids’ measured viscosities were higher than the correlation of Vajjha and Das [21] predicted. This makes comparisons between fluids based on the Reynolds number challenging to hold in high confidence since the value is computed using a value for viscosity that cannot easily be directly determined at the time of the experiment. As a result, comparisons are reported based on volumetric flow instead of on Reynolds number.
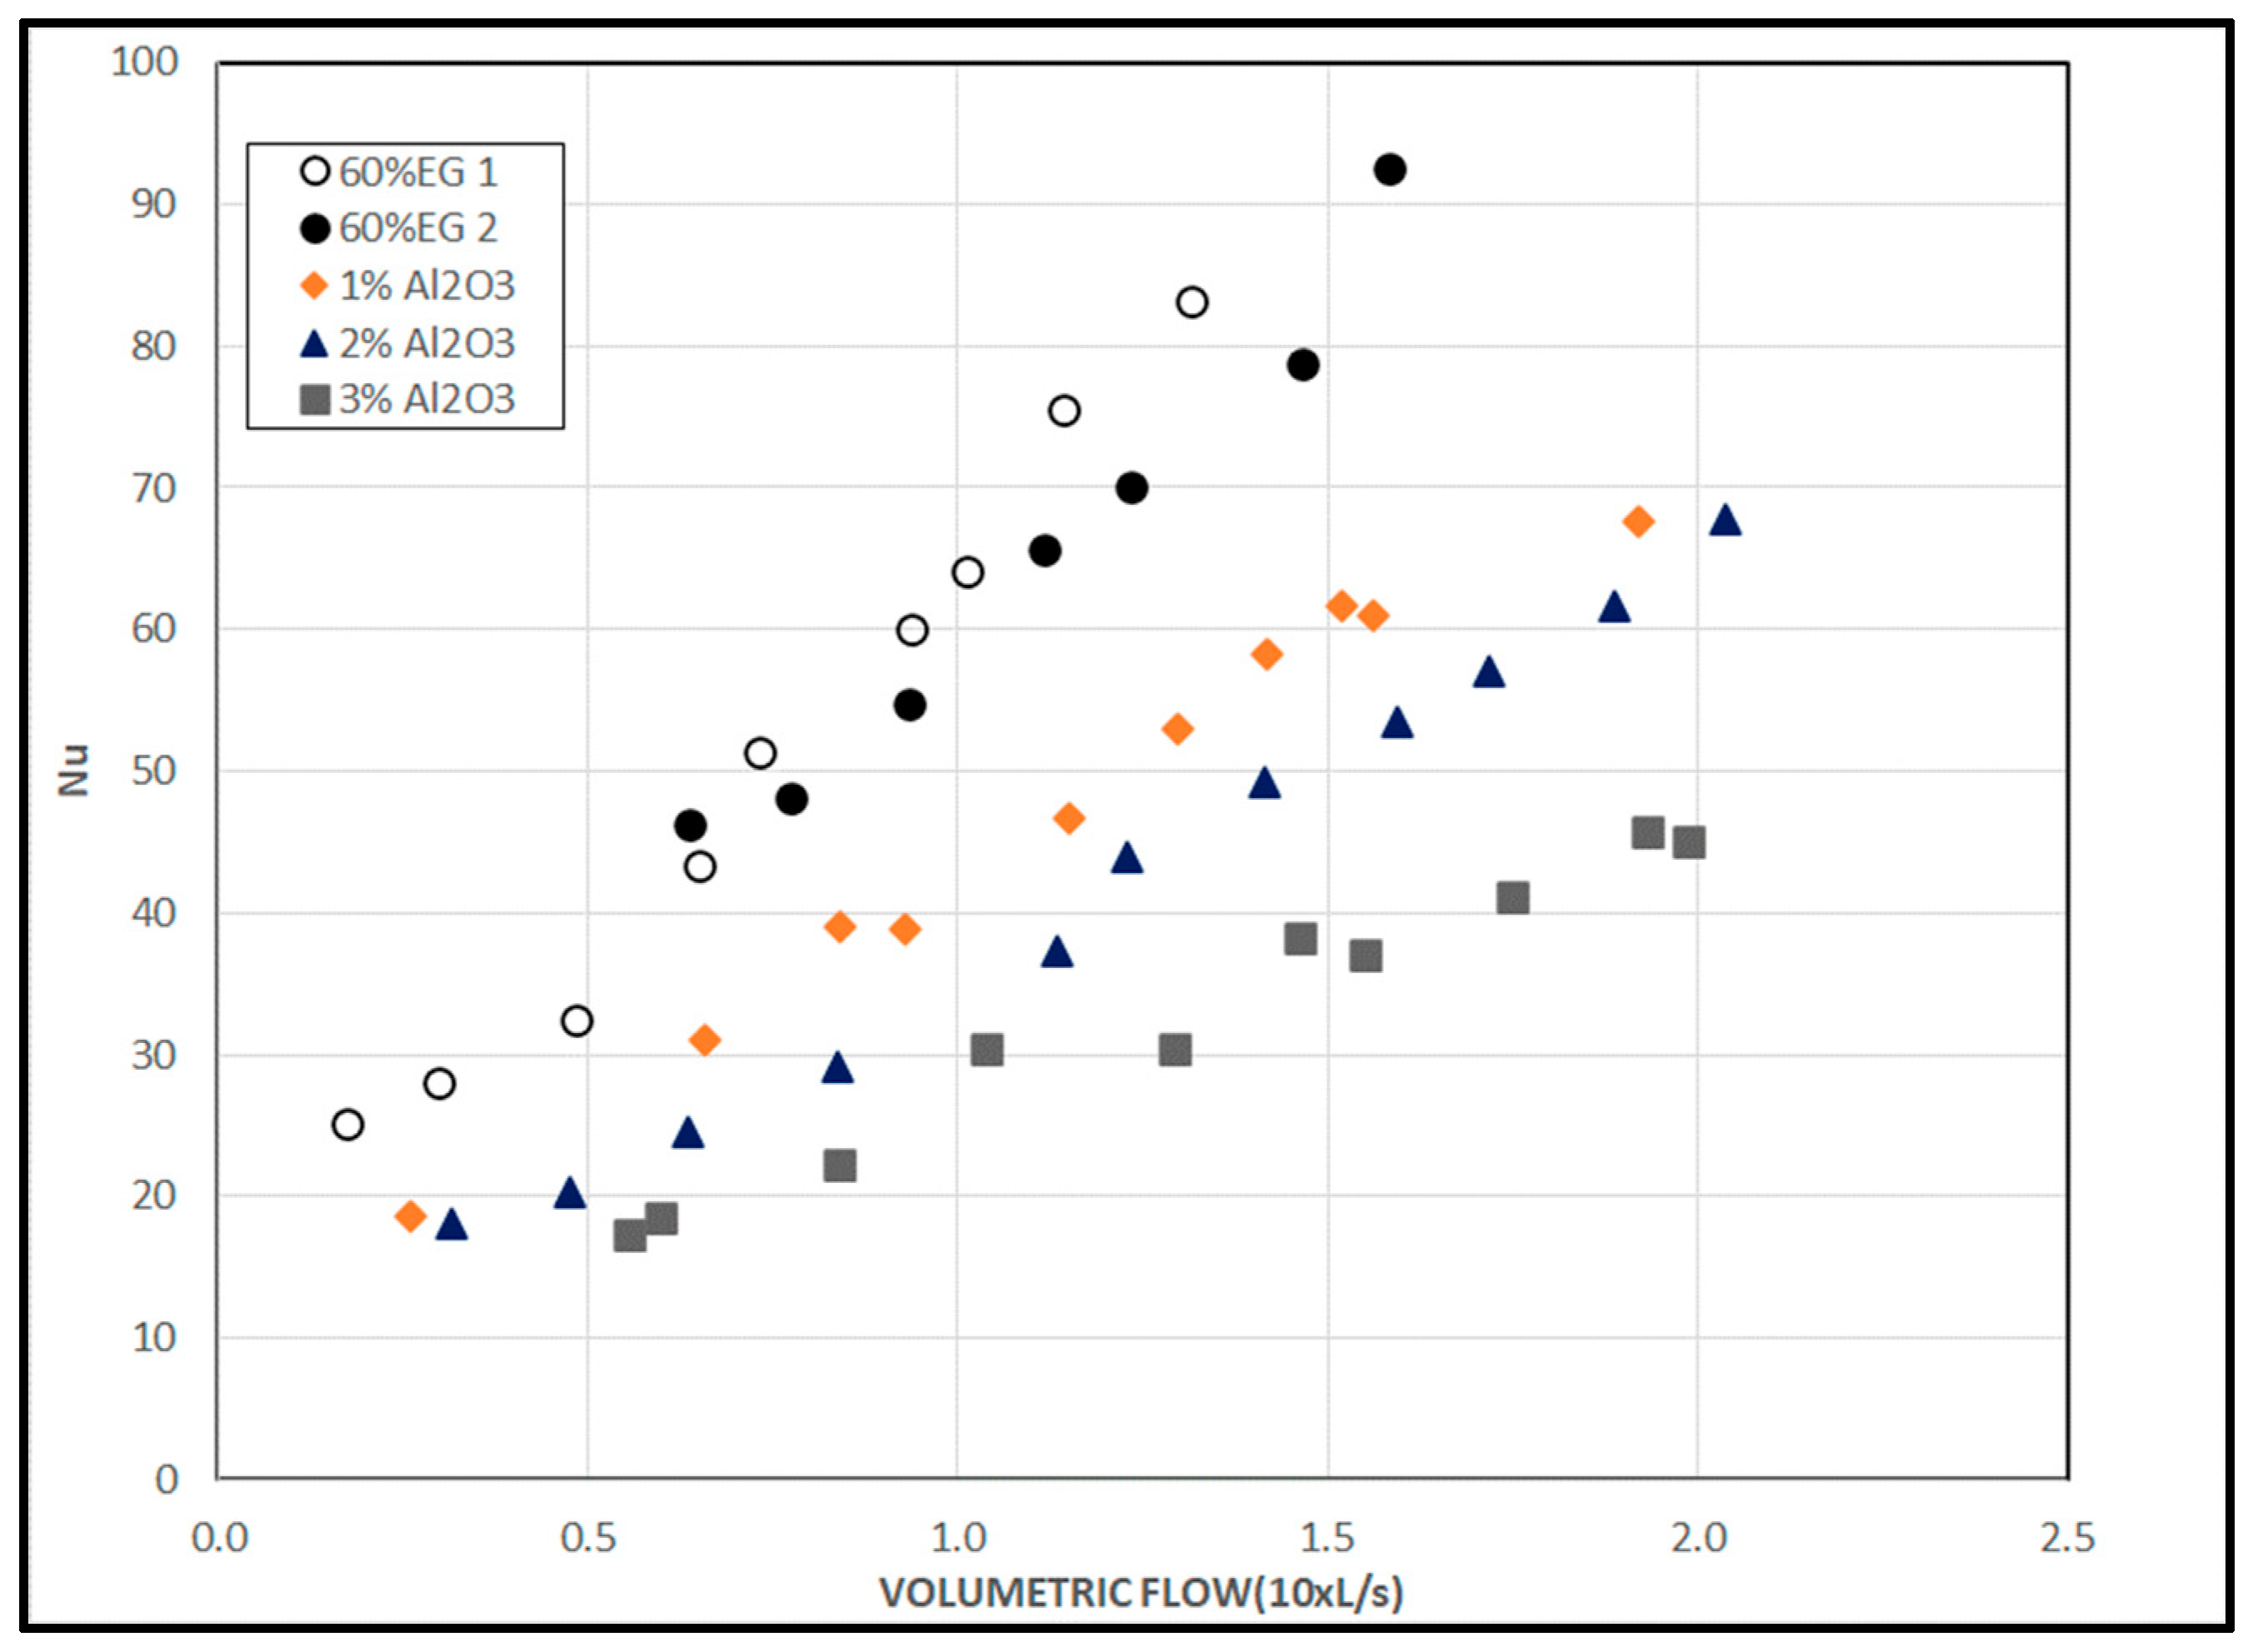
Figure 10 presents graphically the Nusselt numbers for the base fluid and the nanofluids over the range of flows tested. As with the heat transfer coefficient and heat rate data, these data similarly contradict the results predicted by the earlier analytical model. At a volumetric flow rate of 0.125 L/s, the predicted value for the Nusselt number of the 60% EG was 61.3. Based on the testing, the 60% EG circulating at 0.125 L/s exhibited a Nusselt number of 70. The nanofluids, in contrast, exhibited Nu of 51.3, 42.5, and 32.0 at identical entering conditions and with nanoparticle concentrations of 1, 2, and 3%, respectively. These represent decreases of 26.6%, 39.2%, and 54.2% relative to the base fluid. In the analytical model, the Nusselt number for Al2O3/60% EG nanofluids consistently exceeds the base fluid for concentrations between 1 and 3%, considering the entering conditions used in this test.
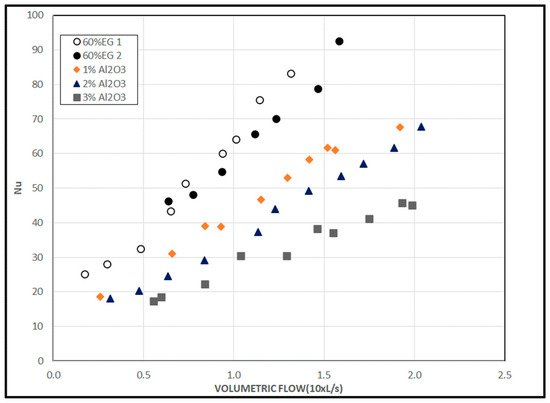
Figure 10.
Inside Nusselt number versus volumetric flow of liquids.
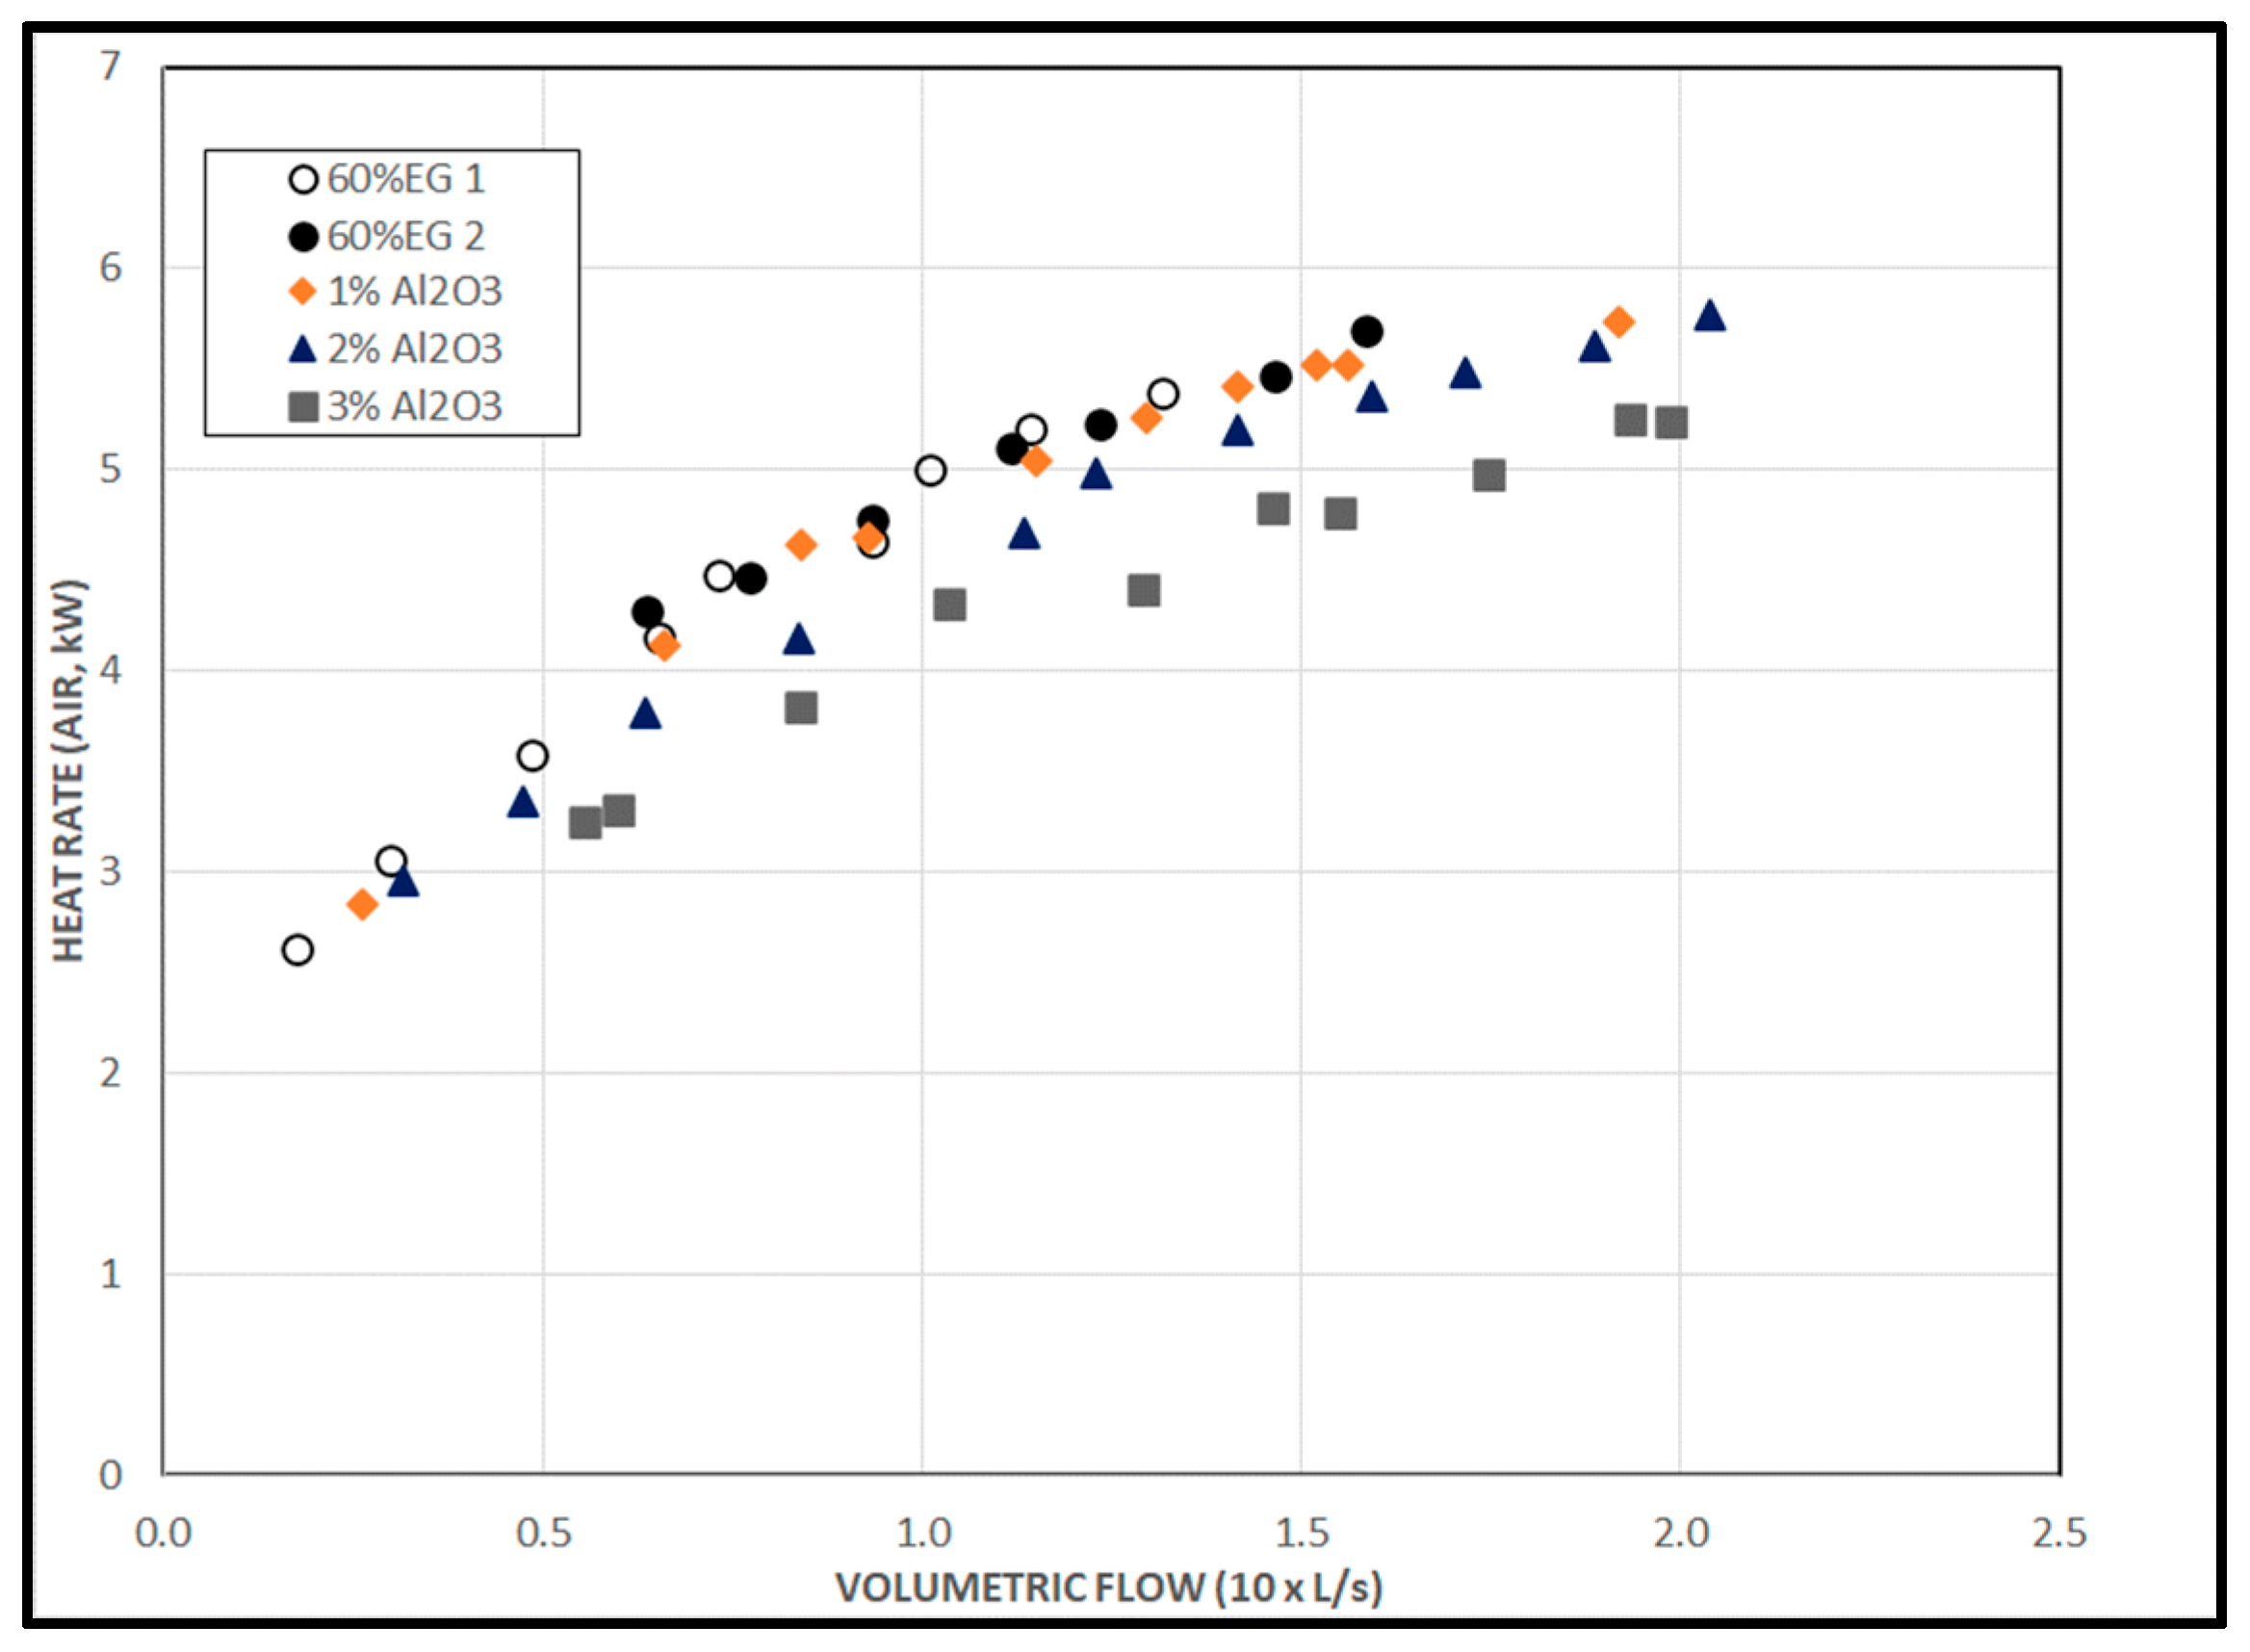
The data in Figure 11 graphically illustrate the relationship between the liquid volumetric flow rate and the air coil heat rate. These data show that the nanofluids (1% Al2O3), at best, generate performance roughly equal to that of the base fluid at an equal flow rate and identical entering conditions. Generally, all the nanofluids tested produced lower heat transfer rates at equal liquid volumetric flow rates than the base fluid over the full range of flows tested. Previously developed analytical models predict that Al2O3/60% EG nanofluids with concentrations of 1% to 3% should generate heat rates 3–13% higher over a range of flows, considering the entering conditions tested here. Furthermore, the analytical model predicted that as the nanoparticle concentration in the heat transfer fluid increased, the heat transfer rate through the coil would increase at a given volumetric flow. Qualitatively, in this series of tests, as the nanoparticle concentration was increased, the heat rate of the coil decreased. At a volumetric flow of 0.125 L/s, the heat transfer rate was equal for the 60% EG and the 1% Al2O3/60% EG nanofluid. In contrast, the thermal outputs measured for the coils with 2% and 3% Al2O3/60% EG nanofluids were 5.7% and 14.6% lower than that for the 60% EG, respectively.
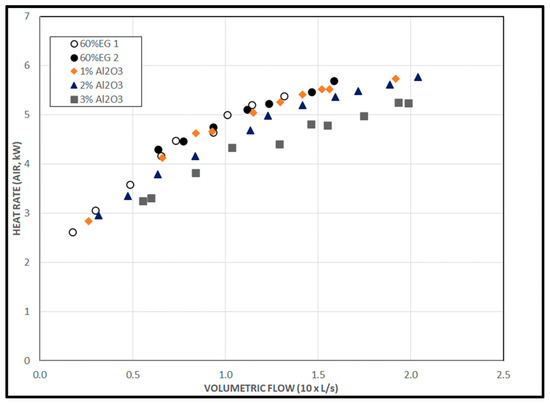
Figure 11.
Rate of heat transfer versus liquid volumetric flow.
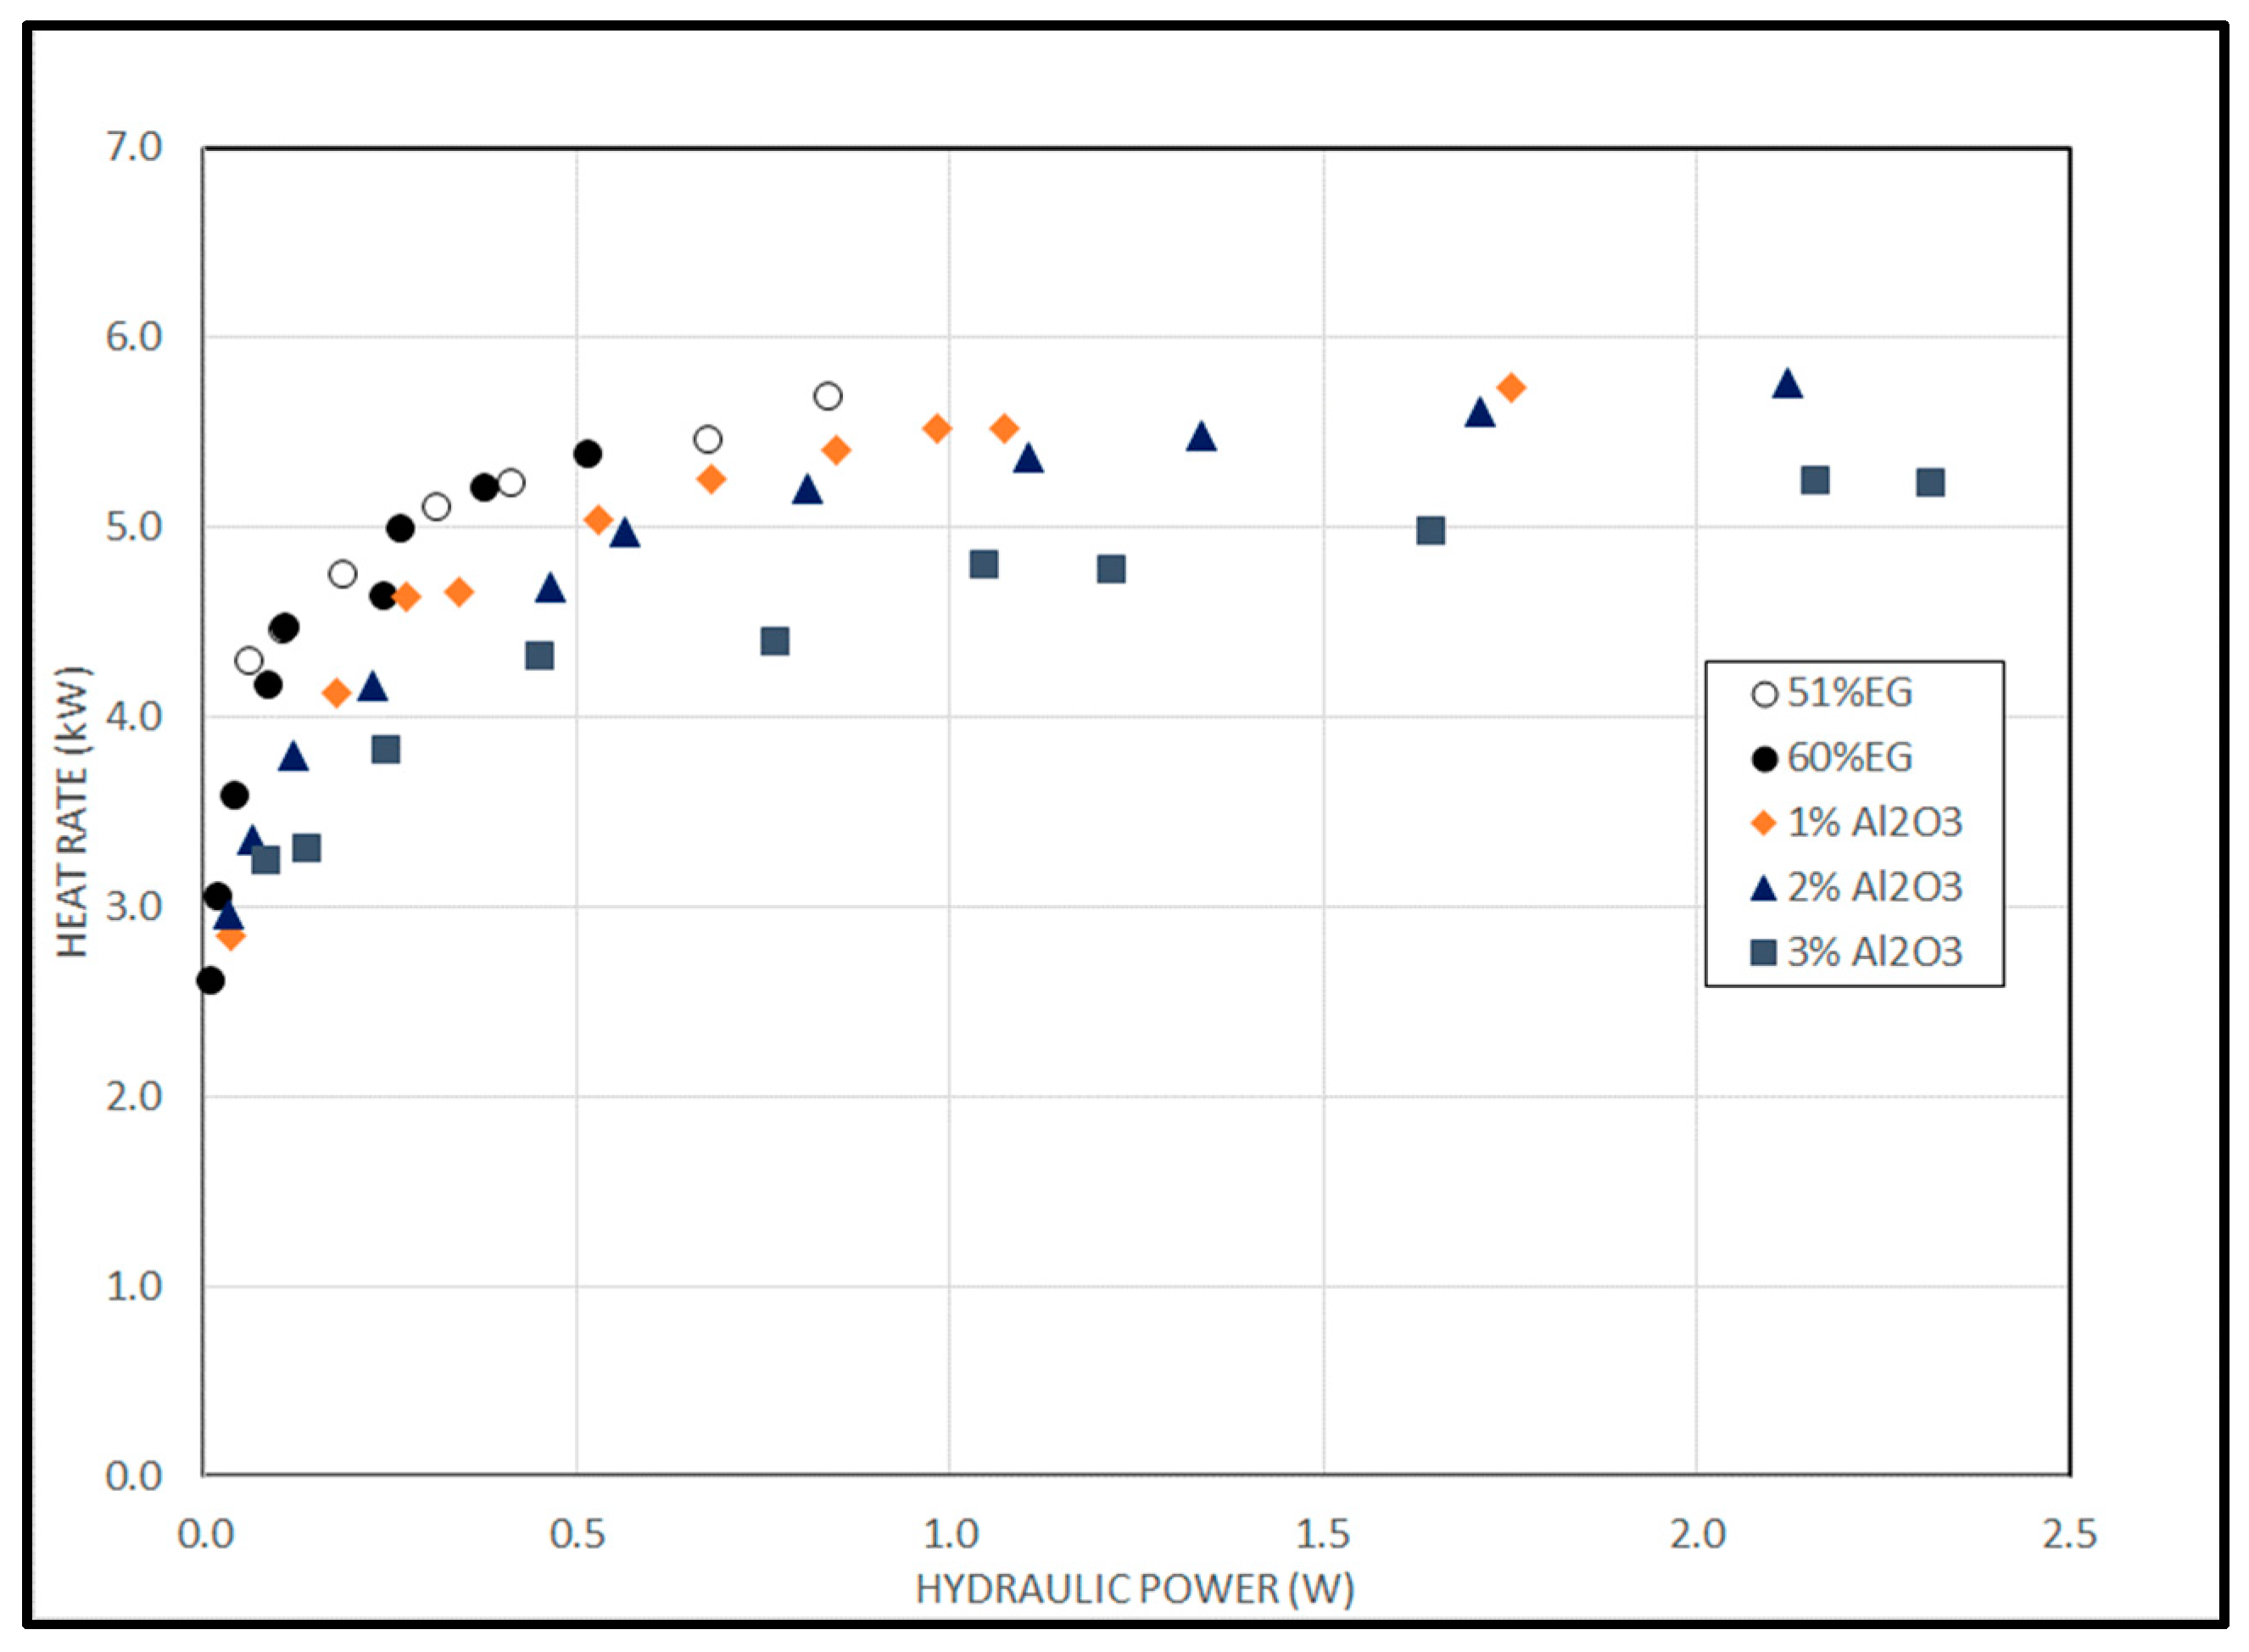
Figure 12 illustrates the relationship between the hydraulic pumping power and the associated rate of air heat transfer while liquid volumetric flow rates were varied for all heat transfer fluids tested. The data show that for a given heat rate, the hydraulic power required to circulate the 1% Al2O3/60% EG nanofluid is 100% higher than that required for the 60% EG. For the 2% and 3% Al2O3/60% EG nanofluids, the hydraulic pumping power required was 129% and 371% higher than the 60% EG, respectively. The extremely high pumping is due to an extreme rise in viscosity caused by a high degree of agglomeration of particles.
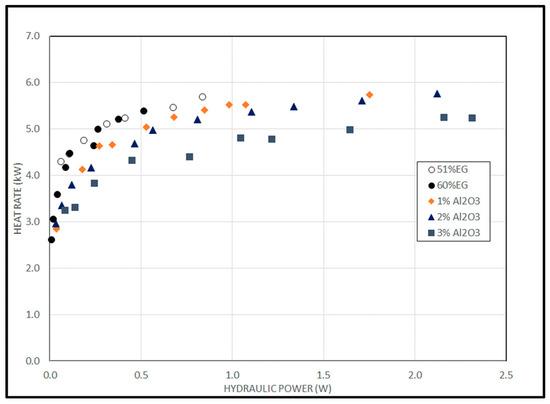
Figure 12.
Liquid hydraulic power versus rate of heat transfer.
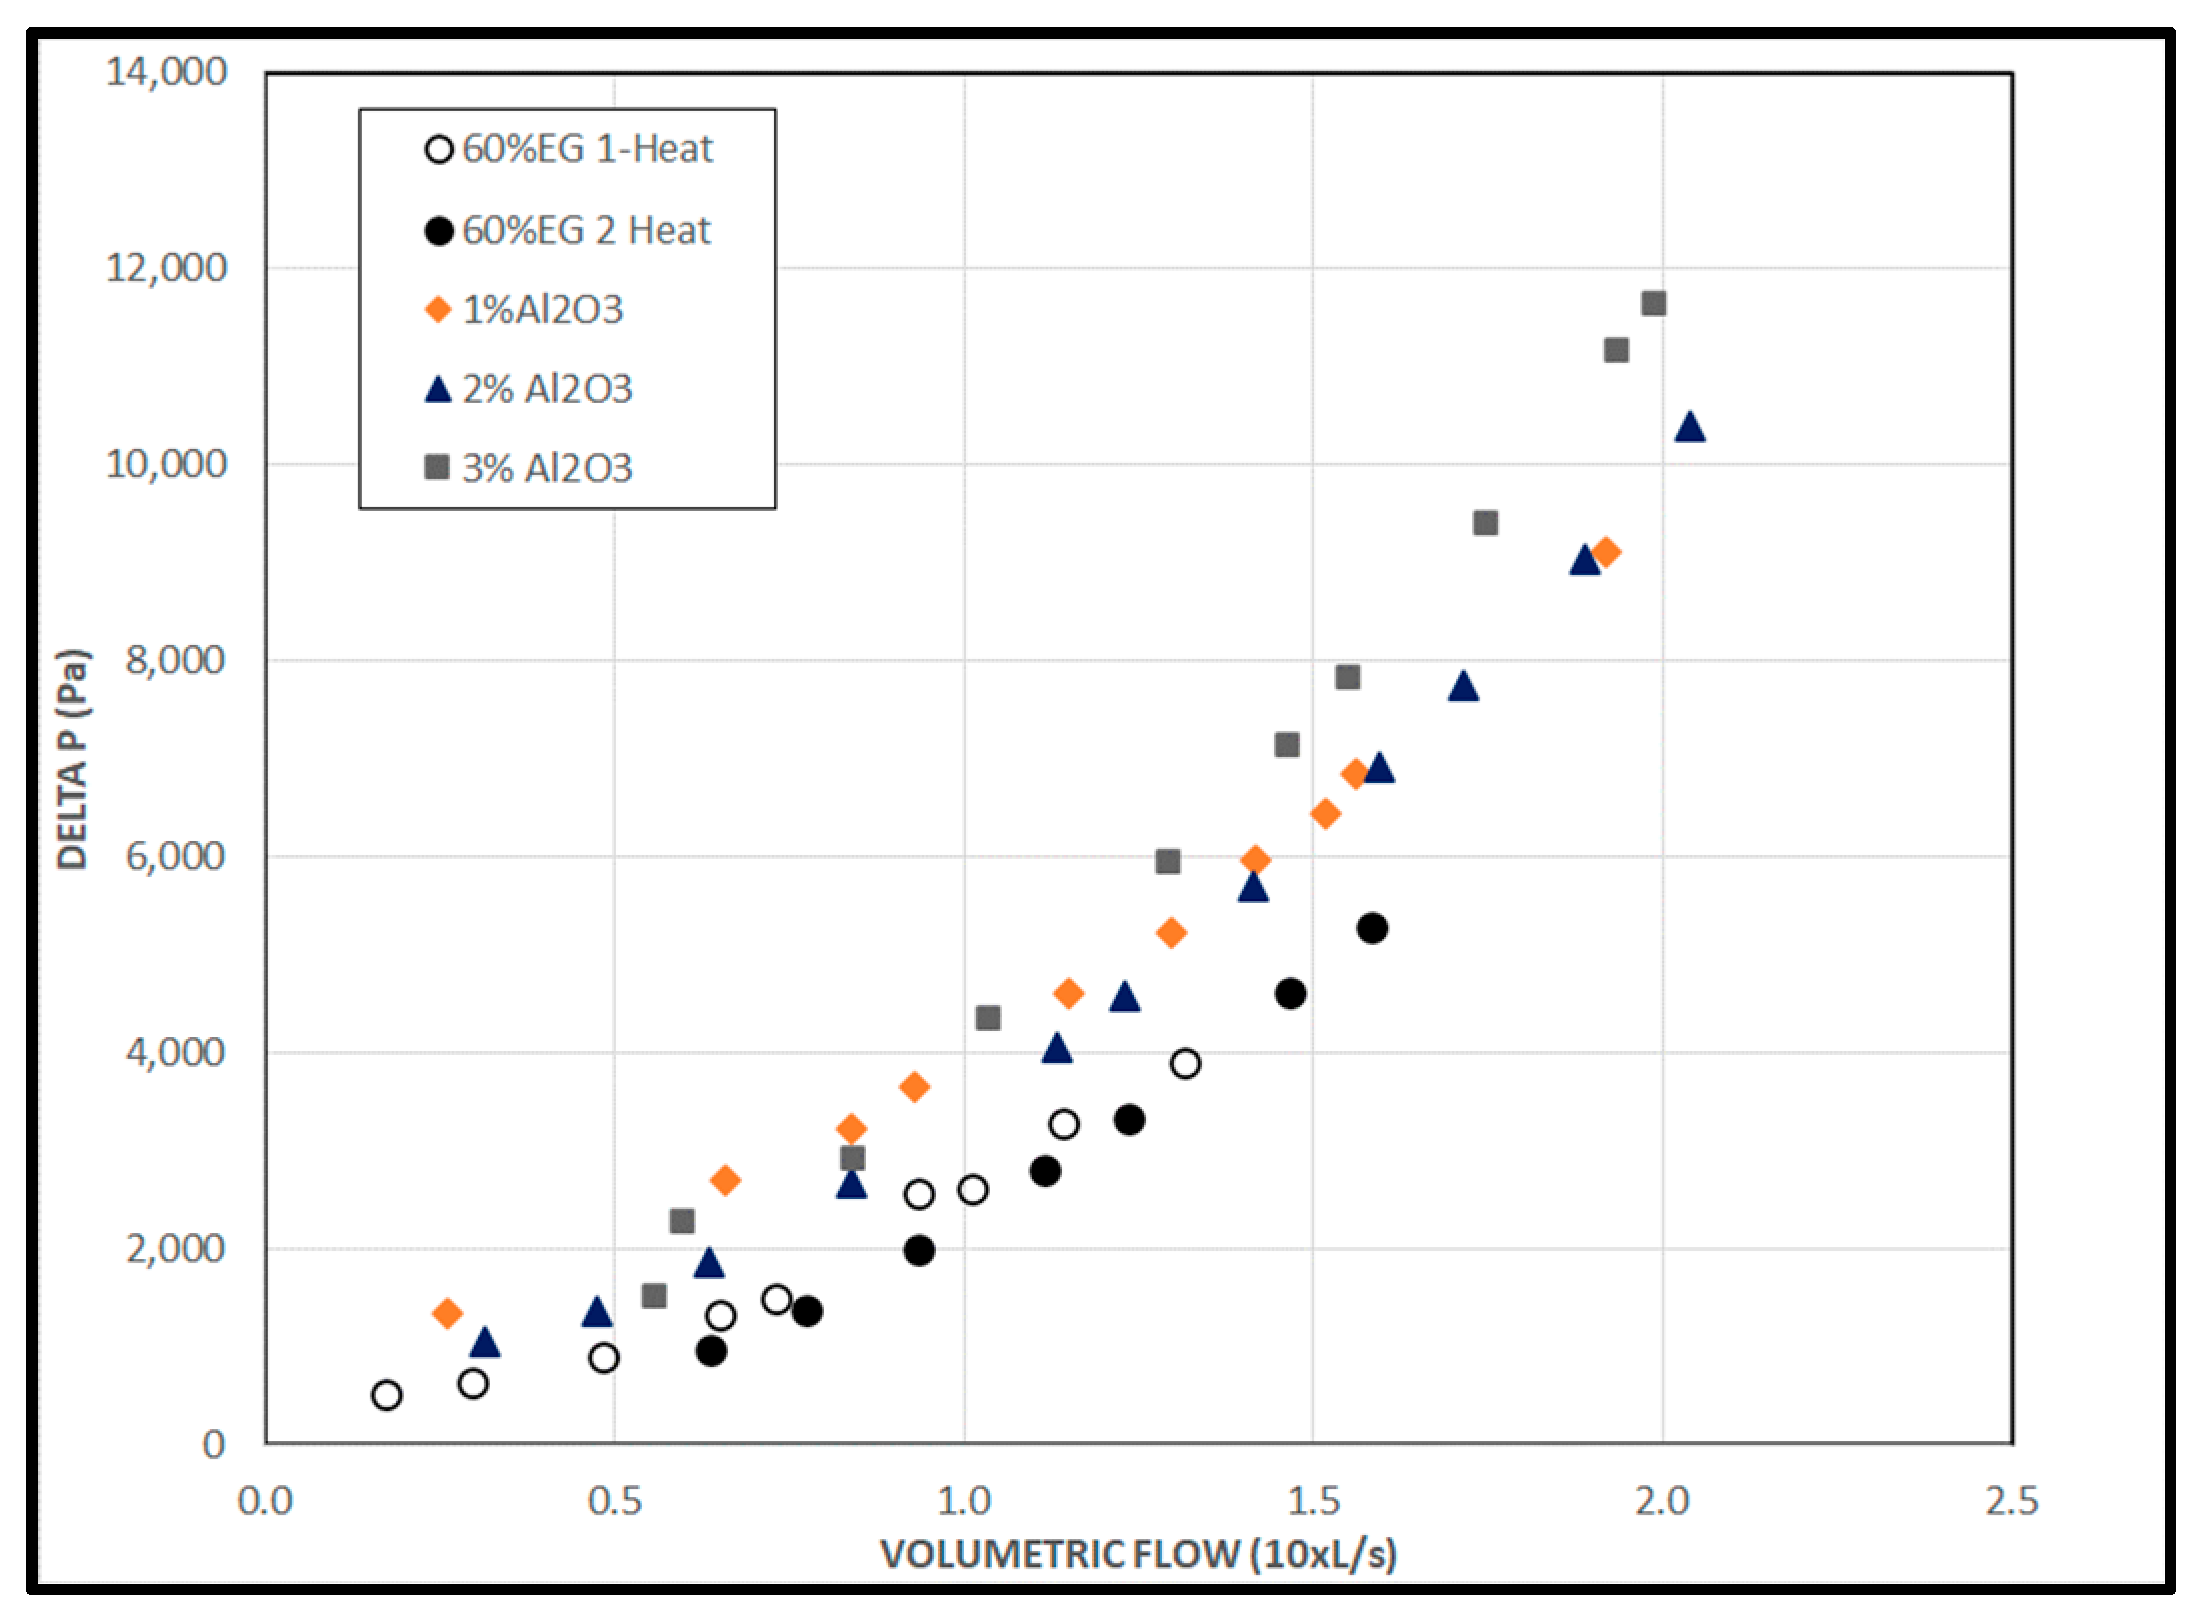
The pressure loss measured through the coil tubing for the nanofluids and the 60% EG base fluid over a range of liquid volumetric flow rates is depicted in Figure 13. As expected, the measured pressure losses for all of the nanofluids were significantly higher than those measured for the 60% EG at equal flows due to the higher viscosity of the nanofluids under these conditions. At a volumetric flow of 0.125 L/s, when circulating 1% Al2O3/60% EG, the observed pressure drop across the coil exceeds that of the 60% EG by 49%. The pressure drops measured while circulating the 2% and 3% Al2O3/60% EG exceeded that of the 60% EG by 48% and 64%, respectively.
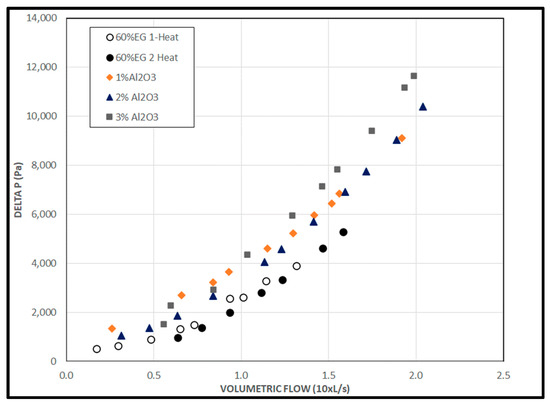
Figure 13.
Frictional liquid pressure loss through coil versus variable liquid volumetric flow.
These performance data were used to calculate, via the equation presented in Section 3.2, the exergy consumed to generate a specific heat transfer rate, which offers a measure of the overall thermodynamic efficiency of the process and another means to compare the performance of nanofluids to the base fluid.
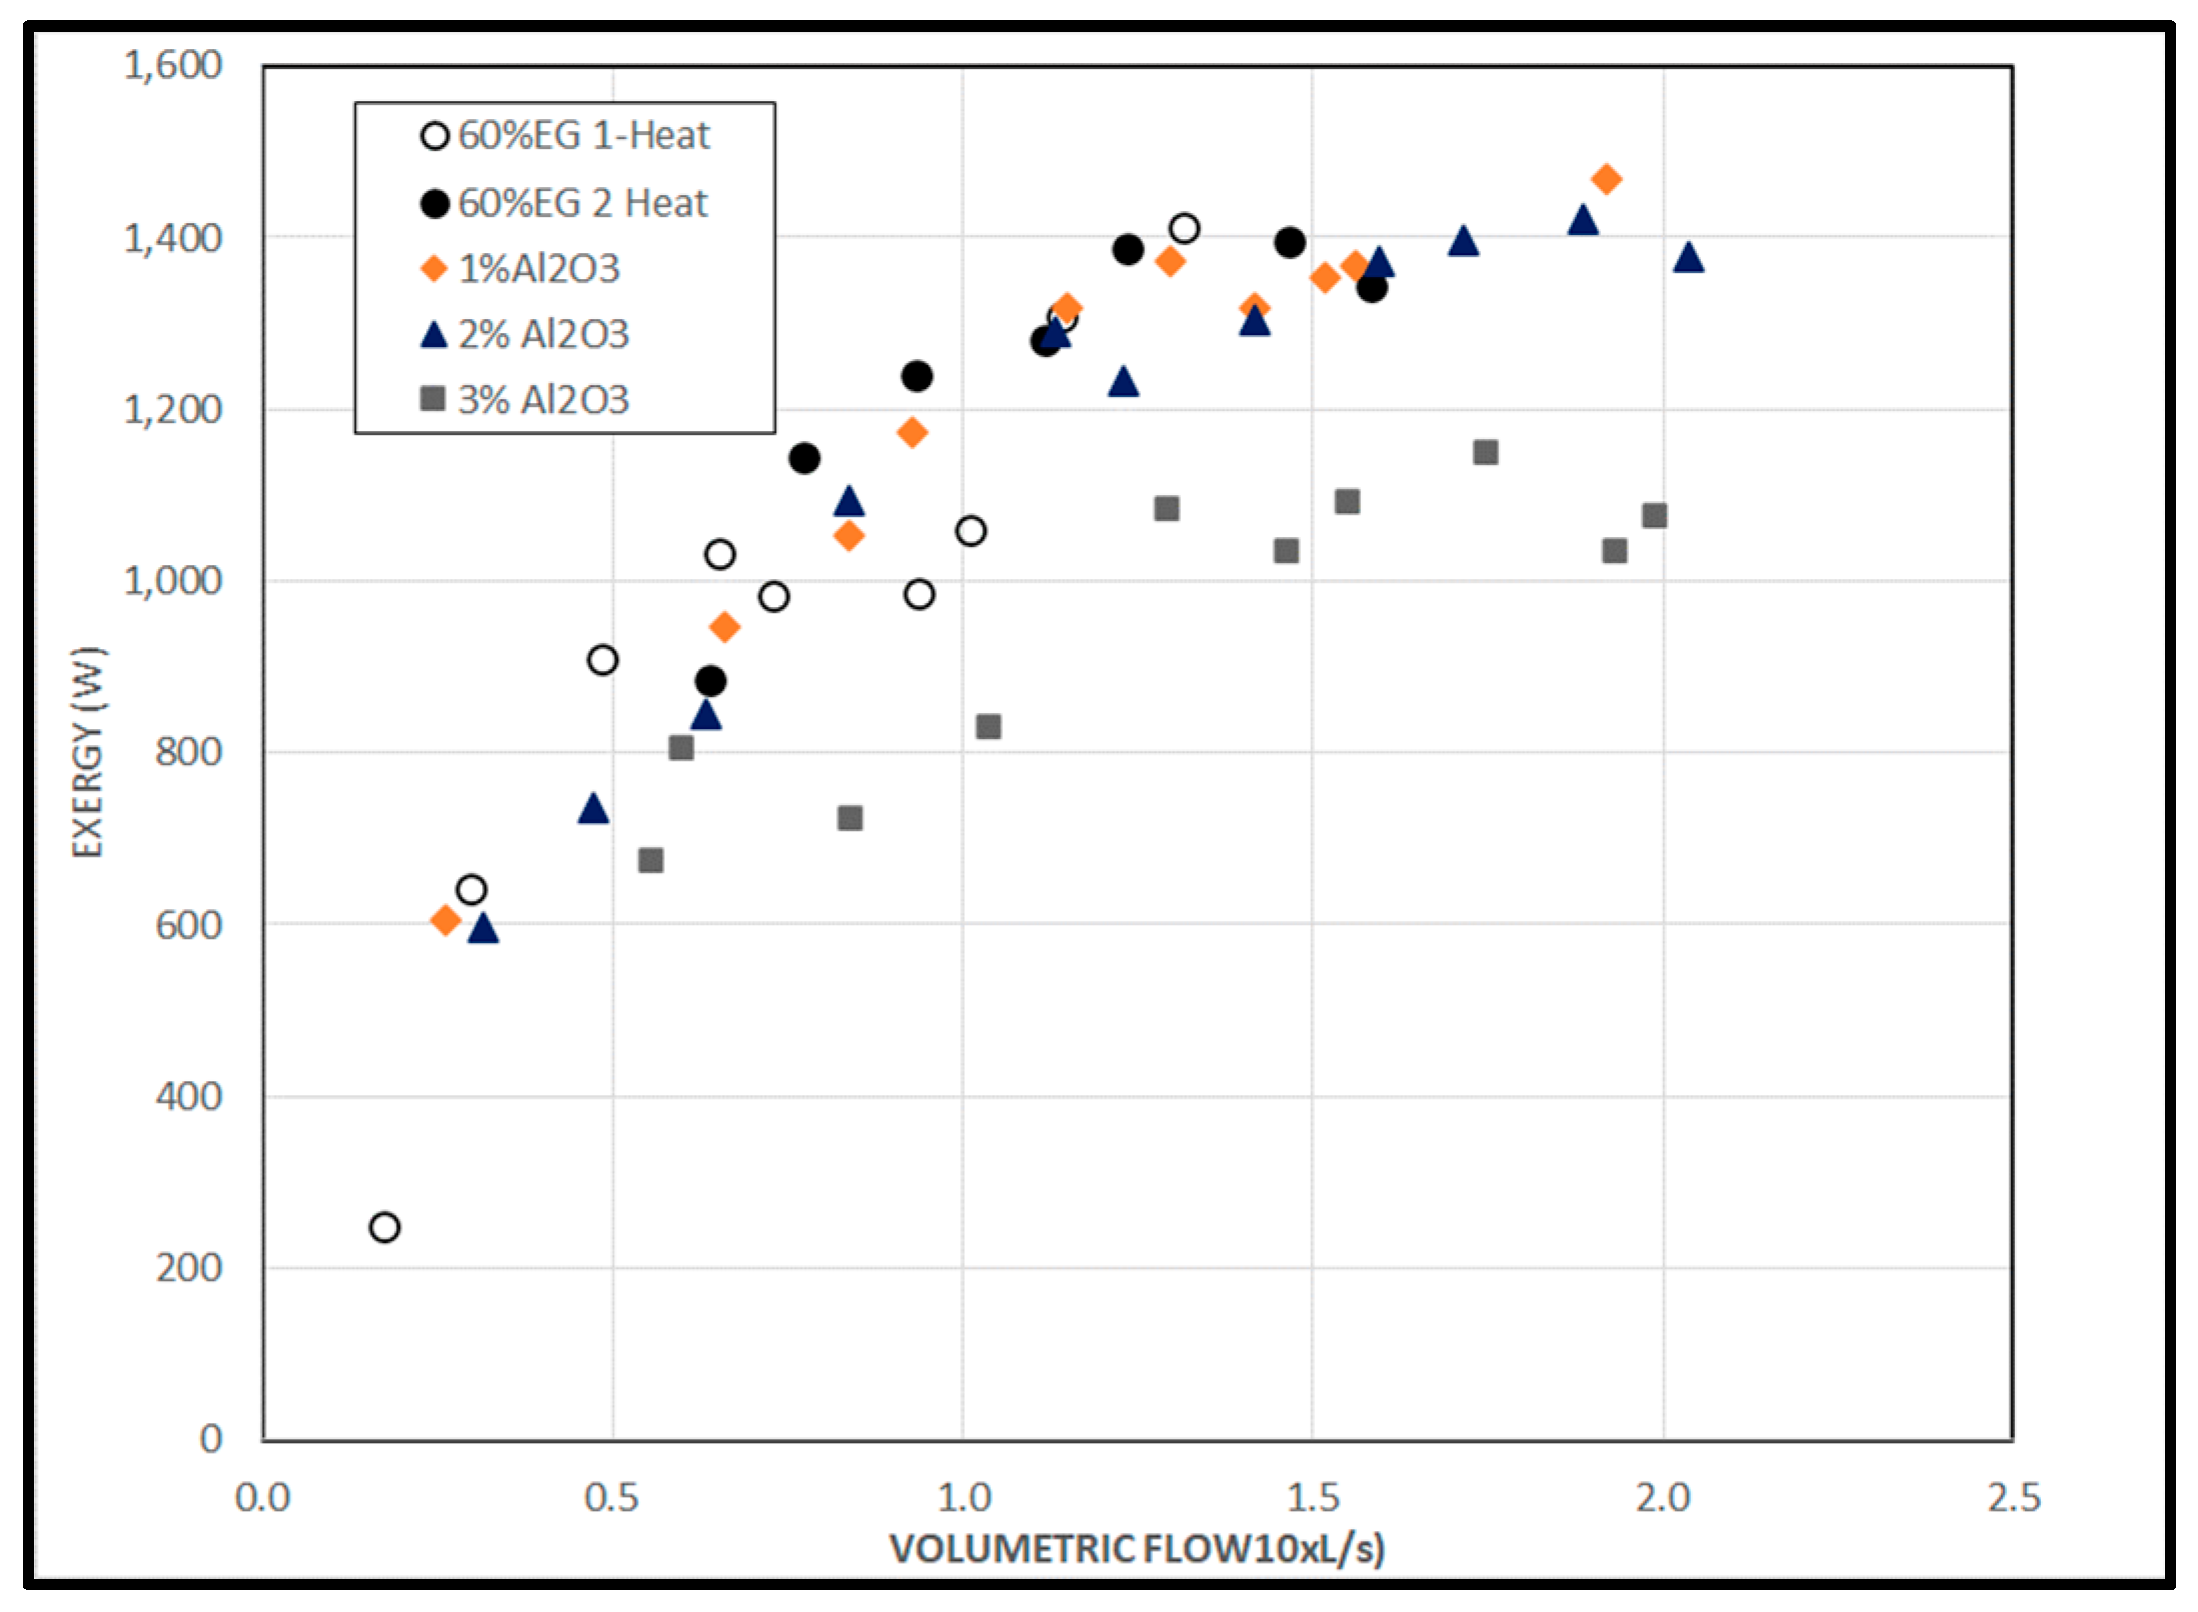
Figure 14 illustrates the relationship between the total exergy change for the liquid-to-air heat exchange process over a range of volumetric flow rates. The figure shows that, based on the measured performance, the total exergy utilization is higher for the 60% EG than for the nanofluids at equal flow. The experimental data qualitatively show the exergy consumed is generally higher for the 60% EG than the nanofluids. Still, since the heat rate associated with the flow rates deviates significantly at equal flow, with the base fluid heat rates generally higher, this comparison is of secondary importance to the comparison on a constant heat rate basis.
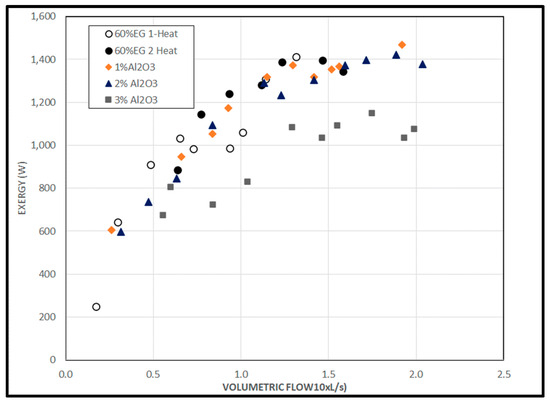
Figure 14.
Total exergy change versus coil volumetric flow.
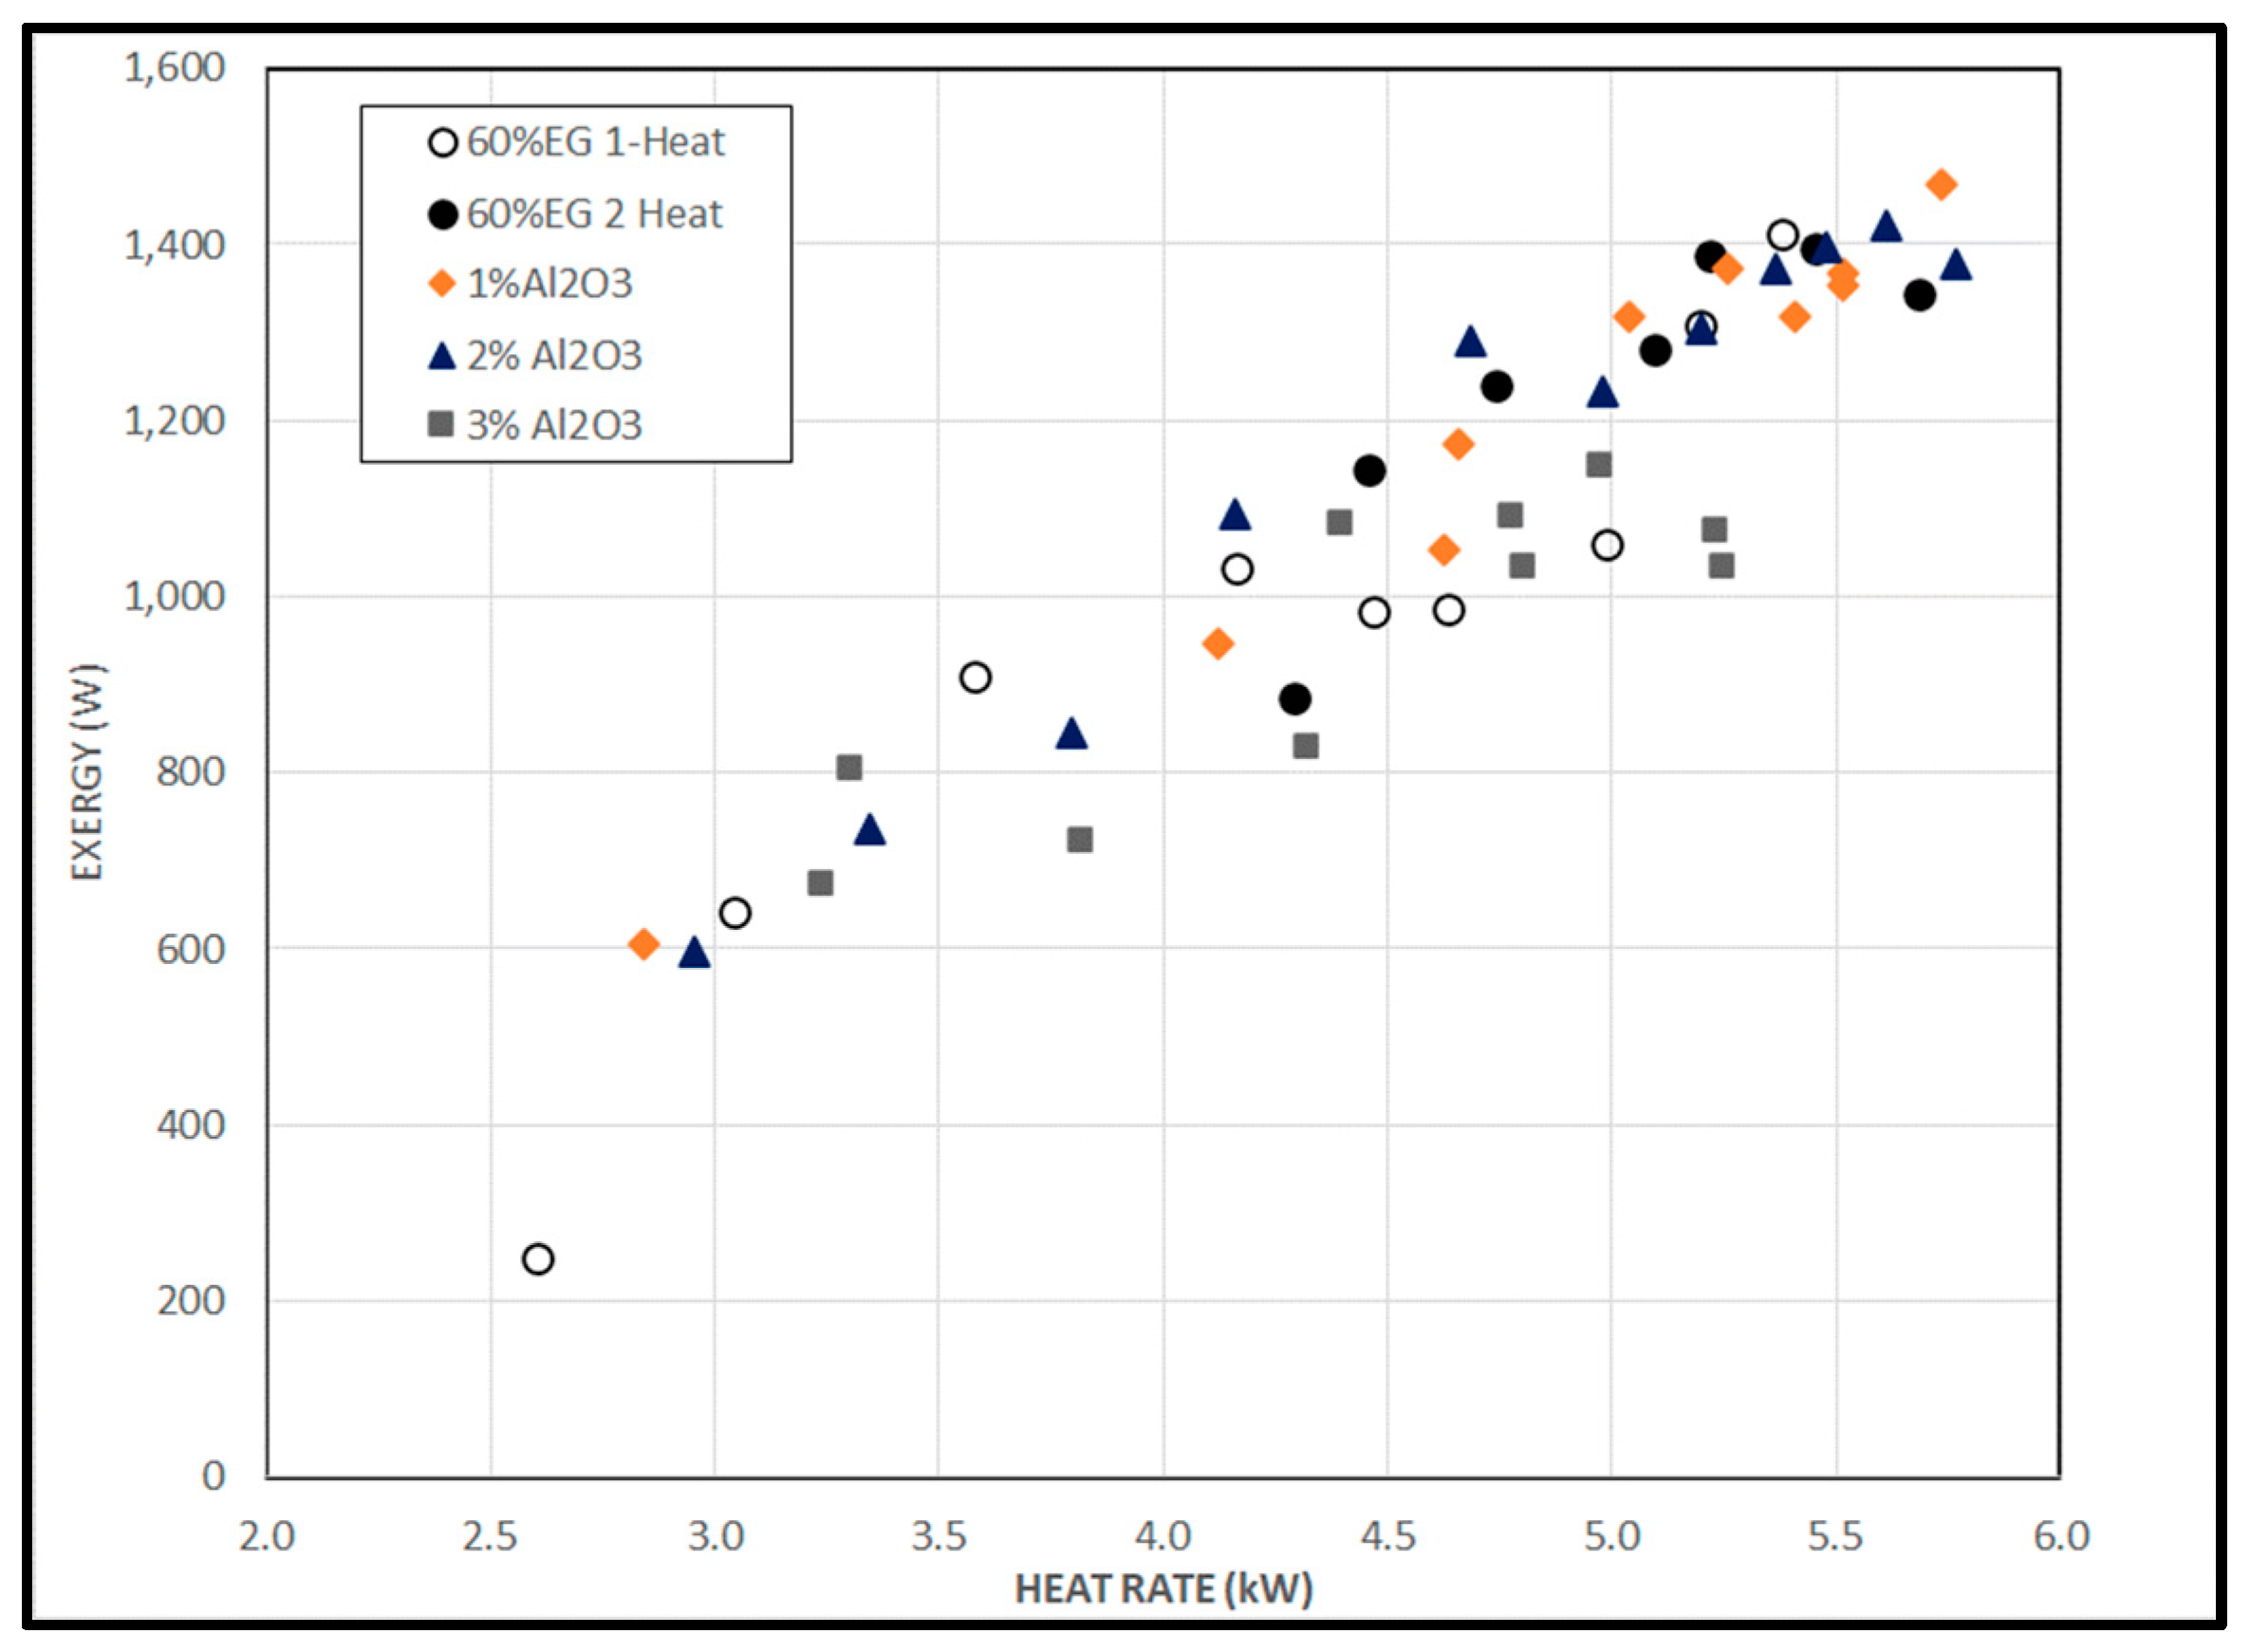
Figure 15 portrays the exergy change for the base fluid and the nanofluids as a function of the measured heat transfer rate. For example, the data reveal that the exergy change at a heat transfer rate of 4 kW (the rating of the tested air coil) is higher for the 60% EG than for the nanofluids. Once again, this comparison is based on the best-fit trendlines superimposed over the data sets. This indicates a higher exergy change required to achieve a given heat transfer rate for the 60% EG than for the nanofluid.
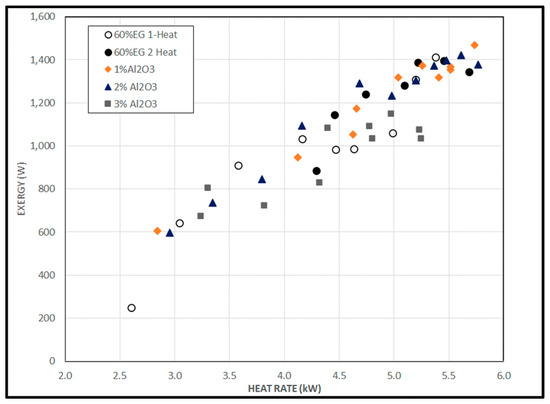
Figure 15.
Total exergy change versus measured heat rate for tested fluids.
4.4. Challenge of Unstable Dispersion and Agglomeration
Based on previous theoretical analyses, the nanofluids tested here did not perform as expected. The thermal output of the heating coil circulating nanofluids was depressed relative to that of the coil circulating the base fluid, and the depression in output increased as the volumetric concentration increased. In contrast, based on system analysis, the peak heat output of the heating coil with 2% Al2O3/60% EG nanofluid was expected to exceed the output of the 60% EG by 7.3%, considering equal entering conditions at 0.125 L/s flow.
As stated earlier, multiple studies have tested nanofluids in heat exchange applications and have demonstrated superior performance to the associated base fluid. Based on a previous analysis, the authors’ hypothesis similarly predicted that the nanofluids would exhibit superior performance to the base fluid in the test apparatus. However, the experimental data do not support the hypothesis in this case. The result was unexpected because the nanofluids were produced using the same methods as in our past studies, resulting in nanofluids with thermal conductivities superior to those of their respective base fluids.
Potential explanations for the shortfall in performance are malfunctioning test instrumentation, damage or degradation of the heating coil, or poor fluid properties. A number of verifications can rule out the failure of equipment or instrumentation. These include physical checks of the equipment and, in the case of the thermistors, comparing the air thermistors’ readouts against the liquid thermistors under static conditions. Unfortunately, the authors had no readily available means of verifying the calibration of the air Venturi metering device (although the manufacturer validated the calibration device). The liquid flow meter was inspected on multiple occasions and was mechanically in good working order. Based on these field checks, the authors have determined that it is highly unlikely that the deviation from expected performance by the nanofluid is due to malfunctioning instrumentation or equipment.
Fouling of the heat transfer surfaces within the heating coil tube bank may also have occurred. However, no evidence of severe fouling was visible when the system was partially disassembled and visually inspected. Determining if the nanofluid properties were similar to those produced for earlier testing using similar methods is challenging; however, during the testing of the 3% Al2O3/60% EG nanofluid, two test runs were performed approximately 24 h apart. In the second test, the thermal performance of the nanofluid was significantly worse than that observed on the previous day. Specifically, the heat rate measured at a given flow rate was measurably lower on the second day versus the first. The observable degradation in the performance of the liquid indicates a degradation in the thermal properties of the liquid over time. None of the nanofluids prepared for the tests visibly changed in appearance, which could have been indicative that nanoparticles had settled out of suspension.
Earlier studies [2,3] have noted that pH can significantly impact nanoparticle suspension stability and have theorized that pH outside of an optimal range can alter nanoparticles’ zeta potential, leading to accelerated particle agglomeration. The nanoparticle dispersions used in this study were a few years old by the time they were used. Though the dispersions were stabilized with surfactants at the factory, these may have broken down, leading to degradation over time. Previous studies have reported that nanofluids containing larger agglomerated nanoparticles perform worse than finer nanoparticles. Settling of nanoparticles had been observed while the mother fluids were stored in the laboratory. It is difficult to ascertain after the fact if the nanoparticles’ surfactants and dispersants had broken down over time, causing agglomeration, thereby leading to the degradation of the thermophysical properties of the liquids. While experimenting on the freeze–thaw characteristics of nanofluids for their application in cold regions like Alaska, Sahoo et al. [31] measured that nanoparticles’ average particle size grew by 51.2% in one case, due to agglomeration. Therefore, similar agglomerations might have occurred in the present sets of experiments on air coils with three concentrations, and the 3% concentration might have agglomerated the most. It should be noted that these experiments show a measurable degradation in the thermal performance of the nanofluids in this application as nanoparticle concentration increases. Furthermore, the 3% Al2O3/60% EG nanofluid exhibited a measurable decline in performance when tested successively within 24 h.
For these experiments with three nanofluids, other sources of thermal property degradation were identified, including contamination of the test loop liquid and degradation of dispersion properties over time. Contamination of the liquid can be caused by liquid trapped in the loop, which was mitigated by blowing out the loop with air to force any residue out. The authors attempted to verify the retention of purity of the nanofluids using a viscometer. This effort met with mixed results, as the viscosity readings did not agree closely with previous correlations derived from stable nanofluids.
Based on previous analysis, the test conditions employed for this study were quite favorable for the nanofluids. The viscosity penalty of the nanofluids relative to the base fluid at the higher entering temperatures was expected to be minimal. Additionally, at higher temperatures, the nanofluids’ higher thermal conductivity was expected to generate superior thermal performance in this test, with the largest advantage in heat rate for a given liquid flow rate and inlet temperatures expected for the 3% Al2O3/60% EG nanofluid. The fact that the nanofluid diminished the thermal performance of the heating coil and the degradation increased with the nanoparticle concentration is a significant finding. Therefore, this fluid type must be carefully considered to maintain ideal chemistry that ensures the suspension’s long-term stability and nanofluids’ enhanced performance.
A recent comprehensive computational investigation by Strandberg et al. [32] proved that Al2O3, SiO2, and CuO nanofluids of 1, 2, and 3% concentration could generate increasingly higher heat transfer coefficients than the base fluid under similar flow conditions. These computations were based on superior thermophysical properties prevailing throughout the life of the nanofluids. In nanofluids technology, that situation has not yet been attained. Therefore, there is a need for research to improve surfactants and dispersants for nanofluid stabilizing agents, which could preserve the superior thermal properties of nanofluids during their usage for years.
Despite the weakness of nanofluids found in our tests on heating coils in this research, it is encouraging that innovative studies continue internationally in this field. For example, Yu et al. [33] demonstrated via molecular dynamics modeling simulations that hybrid nanofluids, e.g., Ag-Cu and Au-Cu, can yield higher thermal conductivity and better thermal performance than mono nanofluids like the Al2O3 used in our experiments, which have been investigated commonly. García-Rincón and Flores-Prieto [34] examined the stability of nanofluids in flat-plate solar collectors and how to improve it. This will help harness green energy through a more efficient heat transfer fluid, which is already an important area of research nowadays. Gao and Li [35] performed an experimental investigation on the effect of surfactants on the stability of nanoemulsions. Their methodology could be used to overcome the stability problem we faced with the Al2O3 nanofluid in our experiments. Through experimental and numerical investigations, Zakeri et al. [36] presented encouraging results on recently adopted graphene oxide nanofluids. They found it can achieve up to 85% improvement in heat transfer coefficient compared to the base fluid. This is an impressive gain and certainly merits further research. Through CFD (computational fluid dynamics) analyses in a conical coil heat exchanger, using three hybrid nanoparticles (MgO-TiO2, MOS2-CuO, Ag-HEG) in water as a base fluid, Azaizi et al. [37] summarized a comparison of the thermal performance of these nanofluids of various nanoparticle concentrations. All these recent studies would help in overcoming the drawbacks of nanofluids.
Nanofluids become unstable when the particle mass becomes large enough that the gravitational pull exceeds the buoyancy force and drag force, making the particle’s settling velocity higher than the upward component of the Brownian motion. The nanofluid is unstably dispersed in this condition, becoming microfluid, and loses all heat transfer benefits. The cause of particles growing larger is mutual attraction, which can be minimized via surface coating and adding liquids to the base fluid that prevent particles from attaching. When maintained within a desired range, the zeta potential, the electrical charge characteristic of these nanoparticles, ensures stable colloidal or nanoparticle dispersion. Another important characteristic of the nanofluid found in the research is that the pH value of a nanofluid is important in maintaining the stable dispersion of nanoparticles. For different nanofluids (e.g., Al2O3, CuO, SiO2, TiO2, etc.), optimum pH and zeta potential ranges can be determined in which the nanofluids behave the most efficiently in heat transfer. The nanofluids in heat exchangers should always be maintained to operate in those ranges of pH and zeta potential to obtain the gain promised by nanofluids.
5. Conclusions
A hydronic air heating coil was tested experimentally to characterize its performance with Al2O3/60% EG nanofluid in concentrations ranging from 1% to 3% and to compare the heat transfer performance of the coil to that with 60% EG. The empirically computed Nusselt number corresponded with the Petukhov correlation with R2 = 0.89. Overall, the baseline testing demonstrated that the test bed exhibited performance characteristics consistent with the predictions of previously established analytical relationships for single-phase heat transfer liquids such as water and ethylene glycol.
The nanofluids generally did not perform as well as expected in the experiments. The performance of the 1% nanofluid was approximately equal to that of the base fluid, considering identical entering conditions. However, the 2% and 3% nanofluids’ performance was considerably worse than the base fluid’s. The higher-concentration nanofluids exhibited lower heat rate, lower heat transfer coefficient, and higher pressure drop across the coil than the base fluid. Several factors are surmised for the fluids’ poor performance, including rapid agglomeration of the particles in the nanofluids leading to property degradation, contamination of the fluids by residue from other tested fluids, and potential fouling of the coil inner surface with nanoparticle residue, creating a barrier to heat transfer. The testing results highlight the importance of tightly controlled fluid production and the need to optimize nanoparticle concentration, as in this experiment, the thermal properties of the higher-concentration nanofluid appeared to deteriorate at a higher rate than nanofluids of lower concentration. The nanofluid-filled coil generated lower inside heat transfer coefficients than the 60% EG-filled coil over the range of test conditions. The difference was up to 44.3% lower for the nanofluid than for the base fluid at 0.15 L/s flow. The heat rates produced by the 1% Al2O3/60% EG were equal to those of the 60% EG base fluid over the full range of volumetric flow tested, while the heat rates produced by the 2% and 3% Al2O3/60% EG nanofluids were up to 14.6% lower than for the base fluid. Pressure loss measured across the heating coil was significantly higher for all nanofluids tested than for the 60% EG. The pressure drop was 49% higher for the 1% Al2O3/60% EG than for the 60% EG. When the pumping power for a given heat rate was compared, it was observed that the 1% Al2O3/60% EG nanofluid required 100% higher pumping power than the 60% EG.
The principal limitation of this study was the use of a nanofluid which was old. It was purchased over a year ago. Although it was sonicated before use, it had possibly lost the strength of the surfactant and the dispersant. As a result, the repulsive forces between the nanoparticles were weak, which caused particle agglomeration, and the characteristic of stable dispersion was lost. This increased viscosity and decreased thermal conductivity made the nanofluids perform poorly in heat transfer and pumping power as the concentration increased.
Suggested improvements to this work would be to repeat these experiments with new, fresh nanofluids which possess more stable surfactants and dispersants; to perform experiments on 1% concentration because that dilute concentration showed us the most promise in our experiments; to minimize the bends, valves, traps, and crevices in the nanofluid loop because those are the spots where nanoparticles tend to separate and collect in crevices, diminishing the homogeneity of well-dispersed nanofluids; and to measure the nanofluids’ viscosity and thermal conductivity before and after the experiments to ensure the properties were preserved.
Future directions advisable to researchers from this study are to focus on developing the best quality surfactants and dispersants that could keep the nanofluids stably dispersed for a reasonably long period. The nanofluids available nowadays generally have an average particle size (APS) range of about 40 to 50 nm. Future work should concentrate on particle size of 10 nm or less. This will be much better for heat transfer, and even unavoidable low-scale agglomeration may keep the aggregated size below 100 nm, which is the threshold of nanoparticles.
Based on the data of this experiment, the exergy consumed to achieve a given heat rate is qualitatively lower for the nanofluids than for the base fluid 60% EG. Therefore, the nanofluids offer slightly better thermodynamic performance compared to the 60% EG from the viewpoint of the second law of thermodynamics. The results of this experiment show that ensuring that nanofluids are produced under tightly controlled conditions that guarantee long-term stability is critical. Failure to do so can lead to significantly worse performance than their respective base fluids.
Author Contributions
Conceptualization, R.S. and D.K.D.; methodology, R.S.; software, R.S.; validation, R.S.; formal analysis, R.S. and D.R.; investigation, R.S.; resources, D.K.D.; data curation, R.S.; writing—original draft preparation, R.S.; writing—review and editing, D.R. and D.K.D.; visualization, R.S. and D.R.; supervision, D.K.D.; project administration, D.K.D. All authors have read and agreed to the published version of the manuscript.
Funding
This research received no external funding.
Data Availability Statement
The data presented in this study are available on request from the corresponding author.
Conflicts of Interest
The authors declare no conflict of interest.
Nomenclature
| A | Total heat transfer area (m2) |
| Specific heat (J/kg·K) | |
| C | Heat Capacity Rate (W/K) |
| CFM | Cubic feet per minute |
| D | Diameter of tubing (m) |
| Exergy Change (J/s) | |
| GPM | Gallons per minute |
| h | Convective heat transfer coefficient (W/m2·K) |
| ha | Enthalpy, air (J/kg) |
| hv | Enthalpy, vapor (J/kg) |
| k | Thermal conductivity (W/m·K) |
| L | Length (m) |
| LMTD | Log mean temperature difference (K) |
| n | Number of observations |
| Mass flow rate (kg/s) | |
| Nu | Nusselt number (hDi/k) |
| ΔP | Pressure drop (Pa) |
| Rate of heat transfer (W) | |
| Re | Reynolds number (ρVDi/μ) |
| Entropy generation rate (W/K) | |
| T | Temperature (K) |
| U | Overall heat transfer coefficient (W/m2·K) |
| Volumetric flow rate (m3/s) | |
| Liquid pumping power (W) | |
| Greek Symbols | |
| μ | Dynamic viscosity (Pa·s) |
| Fin efficiency | |
| ϕ | Nanoparticle volumetric concentration |
| ρ | Density (kg/m3) |
| ω | Humidity ratio |
| Subscripts | |
| a | Air |
| C | cold |
| H | hot |
| i | Inside |
| in | Inlet |
| bf | Base fluid |
| nf | Nanofluid |
| o | Outside |
References
- Choi, S.U.S. Enhancing Thermal Conductivity of Fluids with Nanoparticles. In Developments and Applications of Non-Newtonian Flows; Singer, D.A., Wang, E.H.P., Eds.; FED–231/MD-66; ASME: New York, NY, USA, 1995; pp. 99–105. [Google Scholar]
- Das, S.K.; Choi, S.U.S.; Yu, W.; Pradeep, T. Nanofluids: Science and Technology; Wiley: Hoboken, NJ, USA, 2008. [Google Scholar]
- Minkowycz, W.J.; Sparrow, E.M.; Abraham, J.P. Nanoparticle Heat Transfer and Fluid Flow; CRC Press/Taylor & Francis Group: Boca Raton, FL, USA, 2013. [Google Scholar]
- Pak, B.C.; Cho, Y.I. Hydrodynamic and Heat Transfer Study of Dispersed Fluids with Submicron Metallic Oxide Particles. Exp. Heat Transf. 1998, 11, 151–170. [Google Scholar] [CrossRef]
- Vajjha, R.S.; Das, D.K.; Kulkarni, D.P. Development of New Correlations for Convective Heat Transfer and Friction Factor in Turbulent Regime for Nanofluids. Int. J. Heat Mass Transf. 2010, 53, 4607–4618. [Google Scholar] [CrossRef]
- Xuan, Y.; Li, Q. Investigation on Convective Heat Transfer and Flow Features of Nanofluids. J. Heat Transf. 2003, 125, 151–155. [Google Scholar] [CrossRef]
- Strandberg, R.; Das, D. Experimental Investigation of Hydronic Air Coil Performance with Nanofluids. Int. J. Heat Mass Transf. 2018, 124, 20–35. [Google Scholar] [CrossRef]
- Strandberg, R.; Das, D.K. Hydronic Coil Performance Evaluation With Nanofluids and Conventional Heat Transfer Fluids. ASME J. Therm. Sci. Eng. Appl. 2009, 1, 011001. [Google Scholar] [CrossRef]
- Strandberg, R.T. Computational and Experimental Evaluation of Nanofluids in Heating and Cooling Forced Convection Applications/by Roy Strandberg. Ph.D. Thesis, University of Alaska Fairbanks, Fairbanks, AK, USA, 2021. [Google Scholar]
- Pandey, S.D.; Nema, V.K. Experimental Analysis of Heat Transfer and Friction Factor of Nanofluid as a Coolant in a Corrugated Plate Heat Exchanger. Exp. Therm. Fluid Sci. 2012, 38, 248–256. [Google Scholar] [CrossRef]
- Farajollahi, B.; Etemad, S.G.; Hojjat, M. Heat Transfer of Nanofluids in a Shell and Tube Heat Exchanger. Int. J. Heat Mass Transf. 2010, 53, 12–17. [Google Scholar] [CrossRef]
- Peyghambarzadeh, S.M.; Hashemabadi, S.H.; Hoseini, S.M.; Seifi Jamnani, M. Experimental Study of Heat Transfer Enhancement Using Water/Ethylene Glycol Based Nanofluids as a New Coolant for Car Radiators. Int. Commun. Heat Mass Transf. 2011, 38, 1283–1290. [Google Scholar] [CrossRef]
- Peyghambarzadeh, S.M.; Hashemabadi, S.H.; Jamnani, M.S.; Hoseini, S.M. Improving the Cooling Performance of Automobile Radiator with Al2O3/Water Nanofluid. Appl. Therm. Eng. 2011, 31, 1833–1838. [Google Scholar] [CrossRef]
- Sommers, A.D.; Yerkes, K.L. Experimental Investigation into the Convective Heat Transfer and System-Level Effects of Al2O3-Propanol Nanofluid. J. Nanopart. Res. 2010, 12, 1003–1014. [Google Scholar] [CrossRef]
- Eneren, P.; Aksoy, Y.T.; Vetrano, M.R. Practical Challenges in Nanofluid Convective Heat Transfer Inside Silicon Microchannels. Energies 2023, 16, 7885. [Google Scholar] [CrossRef]
- Ray, D.R.; Das, D.K.; Vajjha, R.S. Experimental and Numerical Investigations of Nanofluids Performance in a Compact Minichannel Plate Heat Exchanger. Int. J. Heat Mass Transf. 2014, 71, 732–746. [Google Scholar] [CrossRef]
- Grundfos Pumps Inc. UPS 26-99 FC Circulating Pump; Grundfos Pumps, Inc.: Brookshire, TX, USA, 2018. [Google Scholar]
- Lambda Square, Inc. Model 2300 Venturi Tube; Lambda Square, Inc.: Babylon, NY, USA, 2018. [Google Scholar]
- Titus HVAC, Inc. ESV Size 7-8, Hot Water Coil, 2-Row; Titus HVAC, Inc.: Plano, TX, USA, 2018. [Google Scholar]
- Ebtron, Inc. SP1 Duct & Plenum Probe; Ebtron, Inc.: Loris, SC, USA, 2018. [Google Scholar]
- Vajjha, R.S.; Das, D.K. A Review and Analysis on Influence of Temperature and Concentration of Nanofluids on Thermophysical Properties, Heat Transfer and Pumping Power. Int. J. Heat Mass Transf. 2012, 55, 4063–4078. [Google Scholar] [CrossRef]
- Vajjha, R.S.; Das, D.K. Experimental Determination of Thermal Conductivity of Three Nanofluids and Development of New Correlations. Int. J. Heat Mass Transf. 2009, 52, 4675–4682. [Google Scholar] [CrossRef]
- Alfa Aesar Inc. Nanoparticle and Dispersions; Alfa Aesar, Inc.: Ward Hill, MA, USA, 2013. [Google Scholar]
- Dow, Inc. Dowtherm SR-1; Dow, Inc.: Midland, MI, USA, 2018. [Google Scholar]
- McQuiston, F.C.; Parker, J.D.; Spitler, J.D. Heating, Ventilating, and Air Conditioning: Analysis and Design; John Wiley & Sons: Hoboken, NJ, USA, 2005. [Google Scholar]
- Bejan, A. Entropy Generation Minimization: The Method of Thermodynamic Optimization of Finite-Size Systems and Finite-Time Processes; CRC Press: Boca Raton, FL, USA, 1996. [Google Scholar]
- Bejan, A. Entropy Generation through Heat and Fluid Flow; John Wiley & Sons: Hoboken, NJ, USA, 1982. [Google Scholar]
- Bejan, A. Heat Transfer; John Wiley & Sons, Inc.: New York, NY, USA, 1993. [Google Scholar]
- Petukhov, B.S. Heat Transfer and Friction in Turbulent Pipe Flow with Variable Physical Properties. In Advances in Heat Transfer; Hartnett, J.P., Irvine, T.F., Eds.; Elsevier: Amsterdam, The Netherlands, 1970; pp. 503–564. [Google Scholar]
- Shah, R.K.; Sekulić, D.P. Fundamentals of Heat Exchanger Design; John Wiley & Sons: Hoboken, NJ, USA, 2003. [Google Scholar]
- Sahoo, B.C.; Ray, D.; Das, D.K. Freeze-Thaw Characteristics of Water-Based Copper Oxide Nanofluid. Adv. Mater. Sci. Eng. 2018, 2, 1–8. [Google Scholar]
- Strandberg, R.; Ray, D.; Das, D.K. Microchannel Cooling Performance Evaluation of Al2O3, SiO2 and CuO Nanofluids Using CFD. Heat Mass Transf. Res. J. 2020, 4, 24. [Google Scholar]
- Yu, Y.; Du, J.; Hou, J.; Jin, X.; Wang, R. Investigation into the Underlying Mechanisms of the Improvement of Thermal Conductivity of the Hybrid Nanofluids. Int. J. Heat Mass Transf. 2024, 226, 125468. [Google Scholar] [CrossRef]
- García-Rincón, M.A.; Flores-Prieto, J.J. Nanofluids Stability in Flat-Plate Solar Collectors: A Review. Sol. Energy Mater. Sol. Cells 2024, 271, 112832. [Google Scholar] [CrossRef]
- Gao, L.; Li, B. The Effects of Surfactant and Metal Ions on the Stability and Rheological Properties of Nanoemulsions Loaded with Gardenia Yellow Pigment. Appl. Nano 2023, 4, 61–74. [Google Scholar] [CrossRef]
- Zakeri, F.; Emami, M.R.S. Experimental and Numerical Investigation of Heat Transfer and Flow of Water-Based Graphene Oxide Nanofluid in a Double Pipe Heat Exchanger Using Different Artificial Neural Network Models. Int. Commun. Heat Mass Transf. 2023, 148, 107002. [Google Scholar] [CrossRef]
- Zolfaghary Azaizi, H.; Shokri, V.; Hashemi Karouei, S.H. Hydrothermal Behaviour of Hybrid Nanofluid Flow in a Shell-and Conical Coil Tube Heat Exchanger; Numerical Approach. Case Stud. Therm. Eng. 2024, 58, 104435. [Google Scholar] [CrossRef]


Disclaimer/Publisher’s Note: The statements, opinions and data contained in all publications are solely those of the individual author(s) and contributor(s) and not of MDPI and/or the editor(s). MDPI and/or the editor(s) disclaim responsibility for any injury to people or property resulting from any ideas, methods, instructions or products referred to in the content. |
© 2024 by the authors. Licensee MDPI, Basel, Switzerland. This article is an open access article distributed under the terms and conditions of the Creative Commons Attribution (CC BY) license (https://creativecommons.org/licenses/by/4.0/).