Article

The Predictive Value of the Triglycerides/HDL-Cholesterol Ratio for Diabetes Incidence

by
Bianca de Almeida-Pititto
1,2,*,
Julia Ines Branda
3,
Julia M. de Oliveira
2,
Patrícia M. Dualib
2,4,
Luisa Bittencourt de Aquino Fernandes Dias
2,
Isabela M. Bensenor
3,5,
Paulo A. Lotufo
3,5 and
Sandra Roberta G. Ferreira
6
1
Departamento de Medicina Preventiva, Escola Paulista de Medicina, Universidade Federal de São Paulo, Rua Botucatu 740, São Paulo 04023900, Brazil
2
Programa de Pós Graduação em Endocrinologia e Metabologia, Departamento de Medicina, Escola Paulista de Medicina, Universidade Federal de São Paulo, Rua Estado de Israel 639, São Paulo 040023900, Brazil
3
Centro de Pesquisa do Hospital Universitário, Universidade de São Paulo, Av. Lineu Prestes 2565, 3rd Floor, São Paulo 05508000, Brazil
4
Disciplina de Endocrinologia, Departamento de Medicina, Escola Paulista de Medicina, Universidade Federal de São Paulo, Rua Estado de Israel 639, São Paulo 040023900, Brazil
5
Departamento de Clínica Médica, Faculdade de Medicina, Universidade de São Paulo, Av. Lineu Prestes 2565-4° Floor, São Paulo 05508000, Brazil
6
Departamento de Epidemiologia, Faculdade de Saúde Pública, Universidade de São Paulo, Av. Dr Arnaldo, 715, São Paulo 01246904, Brazil
*
Author to whom correspondence should be addressed.
Endocrines 2024, 5(3), 418-429; https://doi.org/10.3390/endocrines5030031
Submission received: 2 July 2024 / Revised: 13 August 2024 / Accepted: 6 September 2024 / Published: 10 September 2024
(This article belongs to the Special Issue Advances in Diabetes Care)

Abstract

:
Background: Type 2 diabetes mellitus (DM) is an important disease with an impact on public health globally. Early assessment is necessary with accessible markers, such as the TG/HDL ratio, in predicting DM. Methods: A total of 11,653 subjects from the ELSA-Brazil were included in this analysis and were reevaluated after 3.9 ± 0.6 years of follow-up. Participants were classified according to the quartiles of the TG/HDL index, stratified by sex. ANOVA with Bonferroni correction and p-for-trend analysis were used to compare groups. Cox analysis was performed with adjustments for covariables. Kaplan–Meier curves are presented with the log rank pool and linear analysis. Results: From 11,653 participants (56% female; aged 50.5 ± 8.7 years), 866 (7.8%) were diagnosed with DM (7.2% in women and 7.8% in men). For both sexes, a worsening of the cardiometabolic profile was observed across the increase in TG/HDL quartiles (p < 0.001). Incidence rates of DM increased across TG/HDL quartiles for both men (from Q1 3.3% to Q4 12.8%) and women (from Q1 3.3% to Q4 12.4%). For the entire period, the incidence was highest in participants in the fourth quartile of TG/HDL (log rank analysis < 0.001 for both sexes). In the Cox regression analyses, for men, the HR (95%CI) for risk of DM was 2.4 (1.49–3.26) across the fourth quartile of the TG/HDL ratio, and in women it was 1.57 (1.11–2.22) for the third quartile and 2.08 (1.48–2.93) for the fourth quartile, compared to the first quartile after adjustments. Conclusions: Higher levels of the TG/HDL ratio were independently predictors of DM in both men and women.

1. Introduction

Type 2 diabetes mellitus (T2DM) is one of the most common endocrinopathies worldwide, and exponential increases in its incidence are expected to take place in the following years [1]. Insulin resistance (IR) is one of the key features of T2DM and is known to precede overt hyperglycemia by years [2,3,4]. Strategies for predicting patients at higher risk of developing T2DM that could benefit from early clinical interventions could benefit from the knowledge of the markers or surrogates of IR.
The gold standard for measuring IR is the hyperinsulinic euglycemic clamp technique, a laborious test that is not clinically feasible in daily practice [5]. A commonly used alternative is the Homeostatic Model Assessment of Insulin Resistance (HOMA-IR), which lacks a defined cutoff value and requires the measurement of insulin, an assay of high cost, and poor standardization [6]. More simple and cost-effective biomarkers that are associated with IR are, thus, desirable for screening individuals with an increased risk of developing T2DM. The triglyceride to high-density lipoprotein cholesterol (TG/HDL-C) ratio has been reported to be a reliable surrogate marker of IR. The rationale for using this ratio is that IR is associated with increased triglyceride and reduced HDL-C concentrations. Hypertriglyceridemia occurs because of an increased influx of non-esterified fatty acid concentrations, hepatic overproduction of VLDL, increased intestinal chylomicron synthesis, and reduced catabolism of VLDL and chylomicrons. Low HDL-C levels in this scenario are related to the increased concentration of triglycerides inside these particles, making them prone to catabolism [7].
The TG/HDL ratio has been studied as a surrogate marker of IR and a predictor of incident T2DM and cardiovascular disease in various studies with different populations [8,9,10,11,12]. Liu et al. performed a retrospective cohort study with 2571 Chinese individuals aged over 75 years and observed that higher TG/HDL-C ratios independently indicated a higher risk of incident T2DM even after adjustment for confounders [8]. Yuge H et al. evaluated a database of 120,613 adult Japanese patients (mean age of 44 years) from 2008 to 2017 and found that the TG/HDL-C ratio was a strong predictor of T2DM within the period, even after adjustments for age, sex, body mass index, systolic blood pressure, plasma glucose levels, smoking, and exercise habits [12]. In the Brazilian population, Luz et al. studied 374 patients with coronary artery disease diagnosed through coronary angiography and found a positive association between TG/HDL-C levels and the extent of coronary disease, mainly when the ratio was >4 [13].
The goal of the present work was to evaluate the role of the TG/HDL-C ratio as a predictor for incident diabetes in a Brazilian cohort.

2. Materials and Methods

2.1. Subjects

This study is a longitudinal analysis from the Brazilian Longitudinal Study of Adult Health (ELSA-Brazil), a multicenter cohort study that aims to investigate biological, behavioral, environmental, and social factors related to the incidence and progression of diabetes mellitus (DM) and cardiovascular disease. The methodological design has been reported before [14,15]. Briefly, baseline examinations were conducted from 2008 to 2010. ELSA-Brazil included 15,105 employees aged 35–74 years working in universities and research institutions located in the northeast, southeast, and south regions of Brazil. All 15,105 participants were recruited to participate in this study; then, we applied the following exclusion criteria: 3252 participants with missing data and 200 with very high triglyceride and HDL-cholesterol values (triglyceride > 500 mg/dL and HDL-cholesterol > 100 mg/dL, respectively) were excluded, and the final sample included 11,653 participants. First follow-up (the second wave of ELSA-Brazil) occurred between 2012 and 2014, when all participants were reevaluated. The study was approved by the local Ethics Committee and informed consent was obtained from all participants.

2.2. Clinical and Laboratory

Interview and anthropometric data were collected by trained personnel using standardized questionnaires [16]. Participants had an initial interview at the job site and were scheduled for clinical examination and laboratory tests in the Research Center. Sociodemographic and health factors included the age (years), sex (male or female), race/ethnicity (Black, White, Mixed, Asian, and Indigenous), parental history of diabetes (yes or no), and educational level (considering a high educational level when the participant had a graduation diploma) of the participants. For the present study, skin color was grouped into white and non-white categories.
Anthropometric measurements were measured with participants wearing light clothing without shoes. Body weight and height were measured using calibrated electronic scales and a fixed, rigid stadiometer. Body mass index (BMI) was calculated as weight in kilograms divided by height in meters squared. Waist circumference was measured according to the World Health Organization (WHO) technique using an inextensible tape.
Blood pressure was measured in a sitting position after a 5 min rest (Omron HEM 705CPINT device, Omron Co., Kyoto, Japan). Mean values of blood pressure were calculated after three measurements taken at 1 min intervals. A high education level was defined by at least 11 years of education. Participants were classified as physically active at leisure when they performed moderate- or high-intensity physical activity (≥150 min or ≥75 min per week, respectively).
Fasting glucose and 2 h post-load plasma glucose were collected at baseline and over a mean 4 years of follow-up using the hexokinase method (ADVIA Chemistry; Siemens, Deerfield, IL, USA). Glycated hemoglobin was measured by high-pressure liquid chromatography (HPLC; Bio-Rad Laboratories, Hercules, CA, USA), a certified method according to the National Glycohemoglobin Standardization Program (NGSP). The cholesterol profile was determined using the enzymatic colorimetric method (ADVIA Chemistry; Siemens, Deerfield, IL, USA), and HDL-C by the homogeneous colorimetric method without precipitation. LDL-C concentrations were calculated using the Friedewald equation. Triglycerides was quantified by the glycerophosphate peroxidase method according to the Trinder assay (ADVIA Chemistry; Siemens, Deerfield, IL, USA). Insulin (Monobind, Lake Forest, CA, USA) was determined using enzyme-linked immuno-enzymatic assays.

2.3. Definitions

Diabetes diagnosis was established by self-reported DM, use of antidiabetic medications, or when fasting plasma glucose ≥ 126 mg/dL, 2 h 75 g glucose post-load > 200 mg/dL, or glycated hemoglobin ≥ 6.5%. Pre-diabetes was defined as fasting plasma glucose between 100 and 125 mg/dL, 2 h 75 g glucose post-load between 140 and 199 mg/dL, or glycated hemoglobin 5.7–6.4%, according to the American Diabetes Association [17].
Insulin sensitivity was evaluated by the Homeostasis Model Assessment (HOMA-IR) Index, using the equation: HOMA-IR = (fasting insulin (µUI/mL) × fasting glucose (mmol/L))/22.5, and additionally by the Triglycerides-Glucose Index (TyG index).
Hypertension was diagnosed when systolic or diastolic blood pressure levels were ≥140 or 90 mmHg, respectively, or when an individual was using antihypertensive drugs.

2.4. Statistical Analysis

Continuous variables with a normal distribution were expressed as mean ± standard deviation (SD) and compared using Student’s t-test. Non-normally distributed variables were expressed as median and interquartile range and compared using the Wilcoxon rank test. Categorical variables were expressed as absolute and relative frequencies and compared using the Chi-squared test.
Distributions of HOMA-IR and triglyceride levels were skewed and were log-transformed before analysis to achieve normality. Values in tables were back transformed to the natural scale. Participants were evaluated according to the quartiles of the TG/HDL index, stratified by sex. ANOVA with Bonferroni correction and p-for-trend analysis were used to compare data among quartiles. Frequencies were compared using the Chi-squared test, and linear-by-linear results are also presented in the p-for-trend column. Cox analysis was performed with adjustments for covariables. Kaplan–Meier curves for men and women, regarding the incidence of type 2 DM according to TG/HDL quartiles, are presented with the log rank pool and linear analyses. Sensitivity analysis, excluding participants using medications (antihypertensive and/or lipid-lowering agents), were conducted to assess their influence on variables. As the results did not change, data from the entire sample are shown.
Analyses were performed using the Statistical Package for Social Science, version 17.0 for Windows (SPSS Inc., Chicago, IL, USA), and statistical significance was set at a p-value of 0.05.

3. Results

Participants

The total sample included 11,653 participants (56% female) with a mean age (SD) of 50.5 (8.7) years. From those, 866 individuals were diagnosed with DM during the follow-up period, representing an incidence rate of 7.8% at this point in time (7.2% in women and 7.8% in men), with a mean follow-up duration of 3.9 (0.6) years.
The sample was stratified by sex according to subgroups of TG/HDL quartiles, including 5089 men and 6564 women. Mean (SD) concentrations of total TG/HDL for men and women were 3.0 (1.9) and 1.9 (1.2; p < 0.005), respectively. Table 1 shows the main characteristics of the sample according to TG/HDL quartiles and sex. No differences in age and race/ethnicity were found among quartiles in men, but they were statistically different in women. Mean values of anthropometric measurements, diastolic blood pressure, total and LDL-cholesterol, triglycerides, fasting and 2 h plasma glucose, and HOMA-IR increased across TG/HDL categories in both sexes (p < 0.001). Considering the p-for-trend analysis, we could observe a worsening metabolic profile according to the increase in TG/HDL quartiles.
Incidence rates of DM increased across TG/HDL quartiles for both sexes (Figure 1). We observed that the incidence rate increased 3- to 4-fold from the first to the fourth quartile for men (Q1 3.3%, Q2 4.3%, Q3 8.1%, and Q4 12.8%) and for women (Q1 3.3%, Q2 5.6%, Q3 9.7%, and Q4 12.4%).
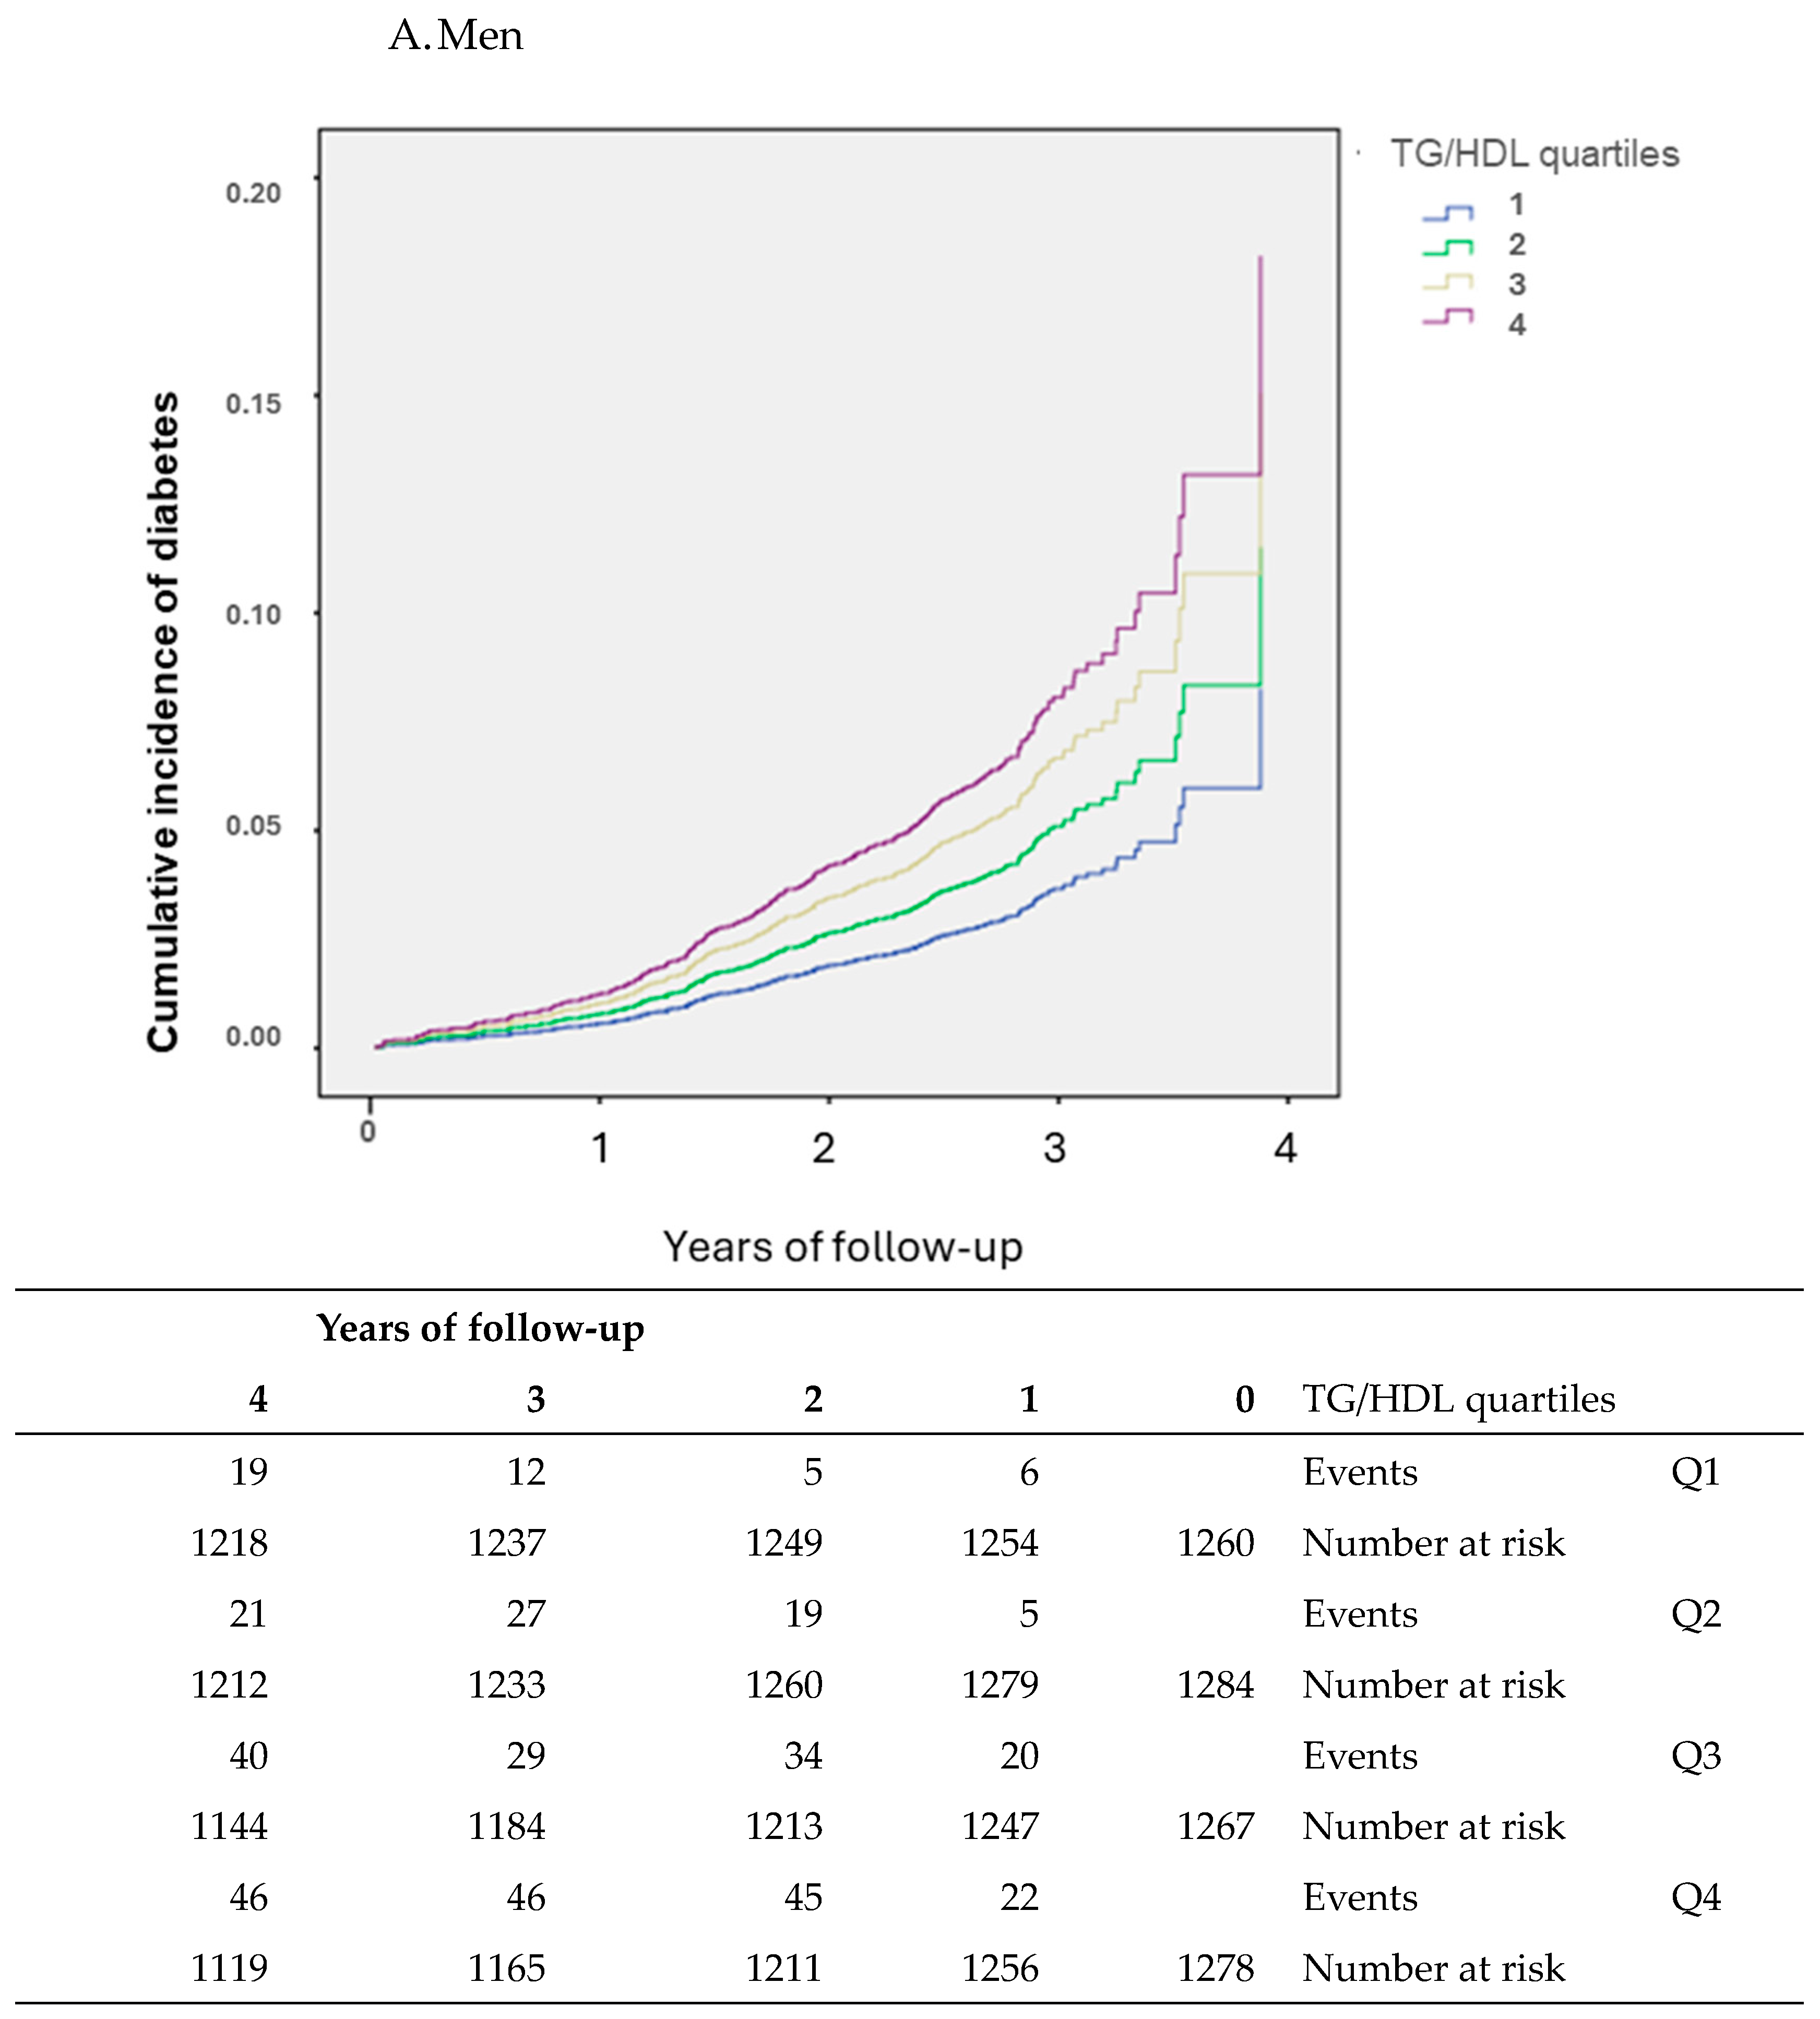
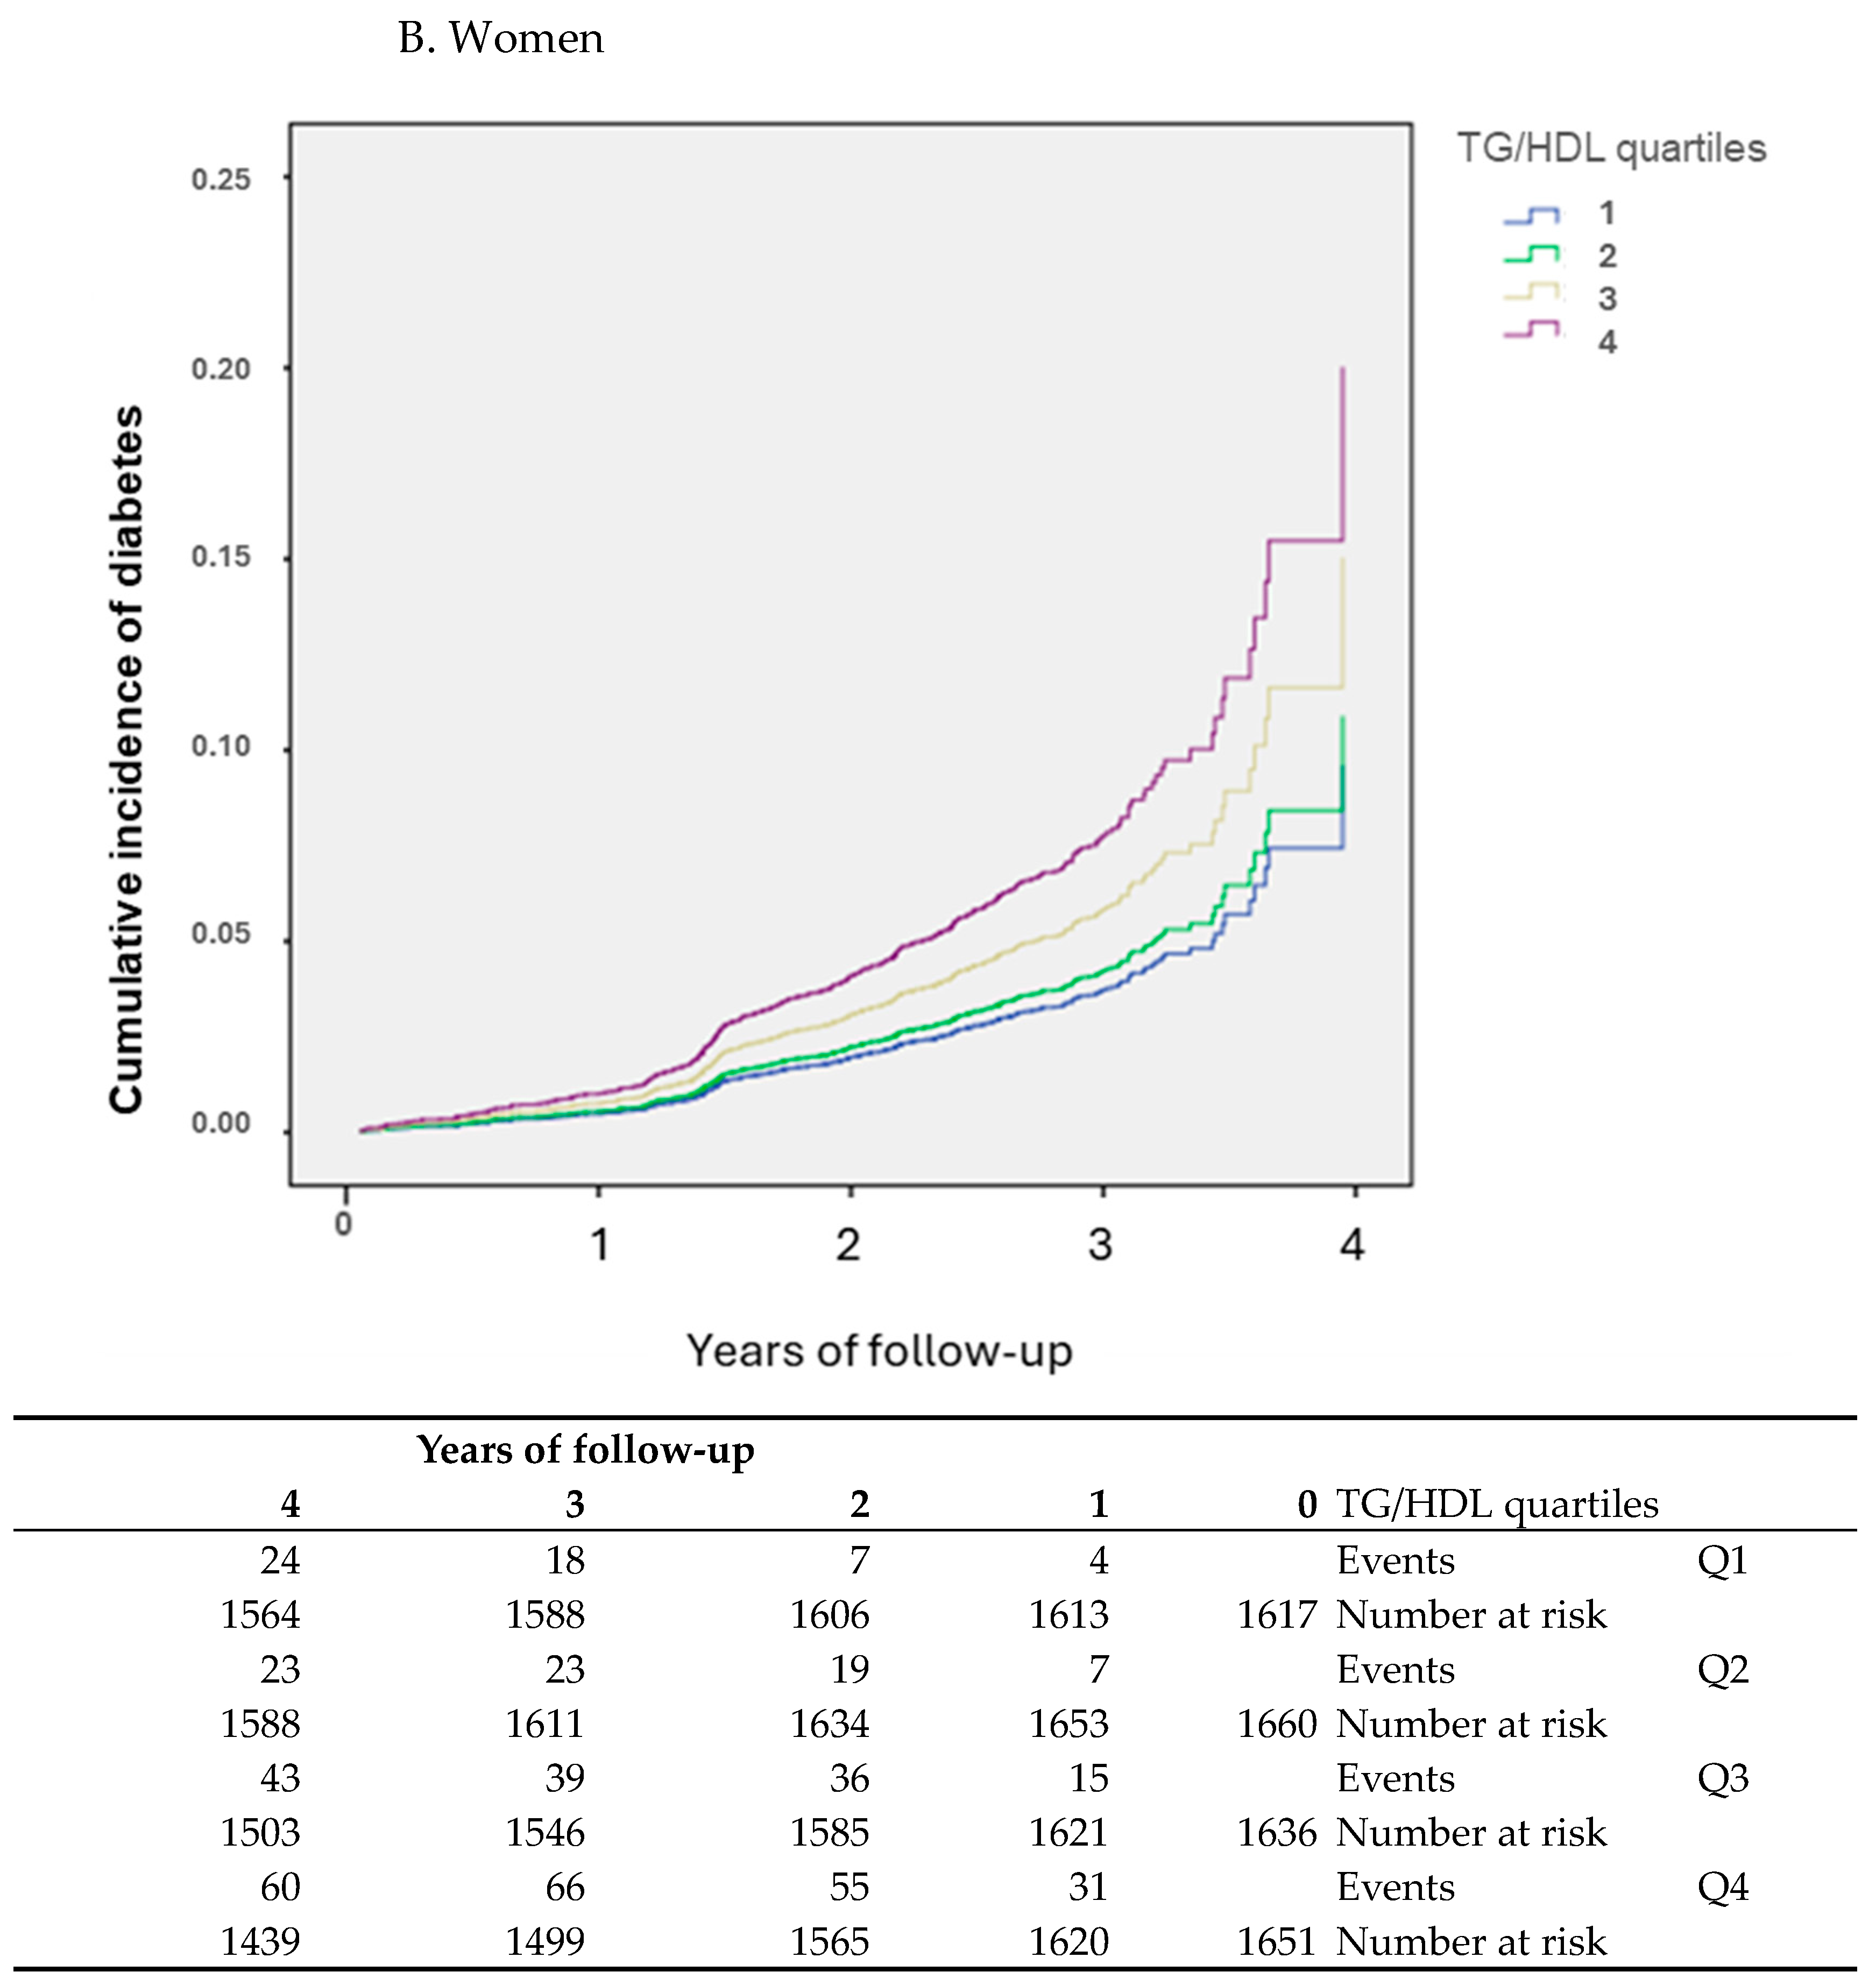
According to the Kaplan–Meier curve analysis, incidence rates of DM for the entire period of the four-year follow-up were higher in participants in the fourth quartile of TG/HDL for both men and women (Figure 2).
For men, after adjustments for age in the Cox regression analyses (Table 2), the risk for DM was significantly higher across the four quartiles of TG/HDL, persisting even after full adjustments in model 2 for age, BMI, blood pressure, pre-diabetes, family history of diabetes mellitus, physical activity at baseline, race, and HOMA-IR. For women, the association of DM incidence for the third and fourth quartiles persisted after all the adjustments (age, BMI, blood pressure, pre-diabetes, family history of diabetes mellitus, physical activity at baseline, race, and HOMA-IR). We observed that these risks, for both sexes, also persisted after adjustments for proxies of insulin resistance at baseline: HOMA-IR, blood pressure, and total cholesterol.
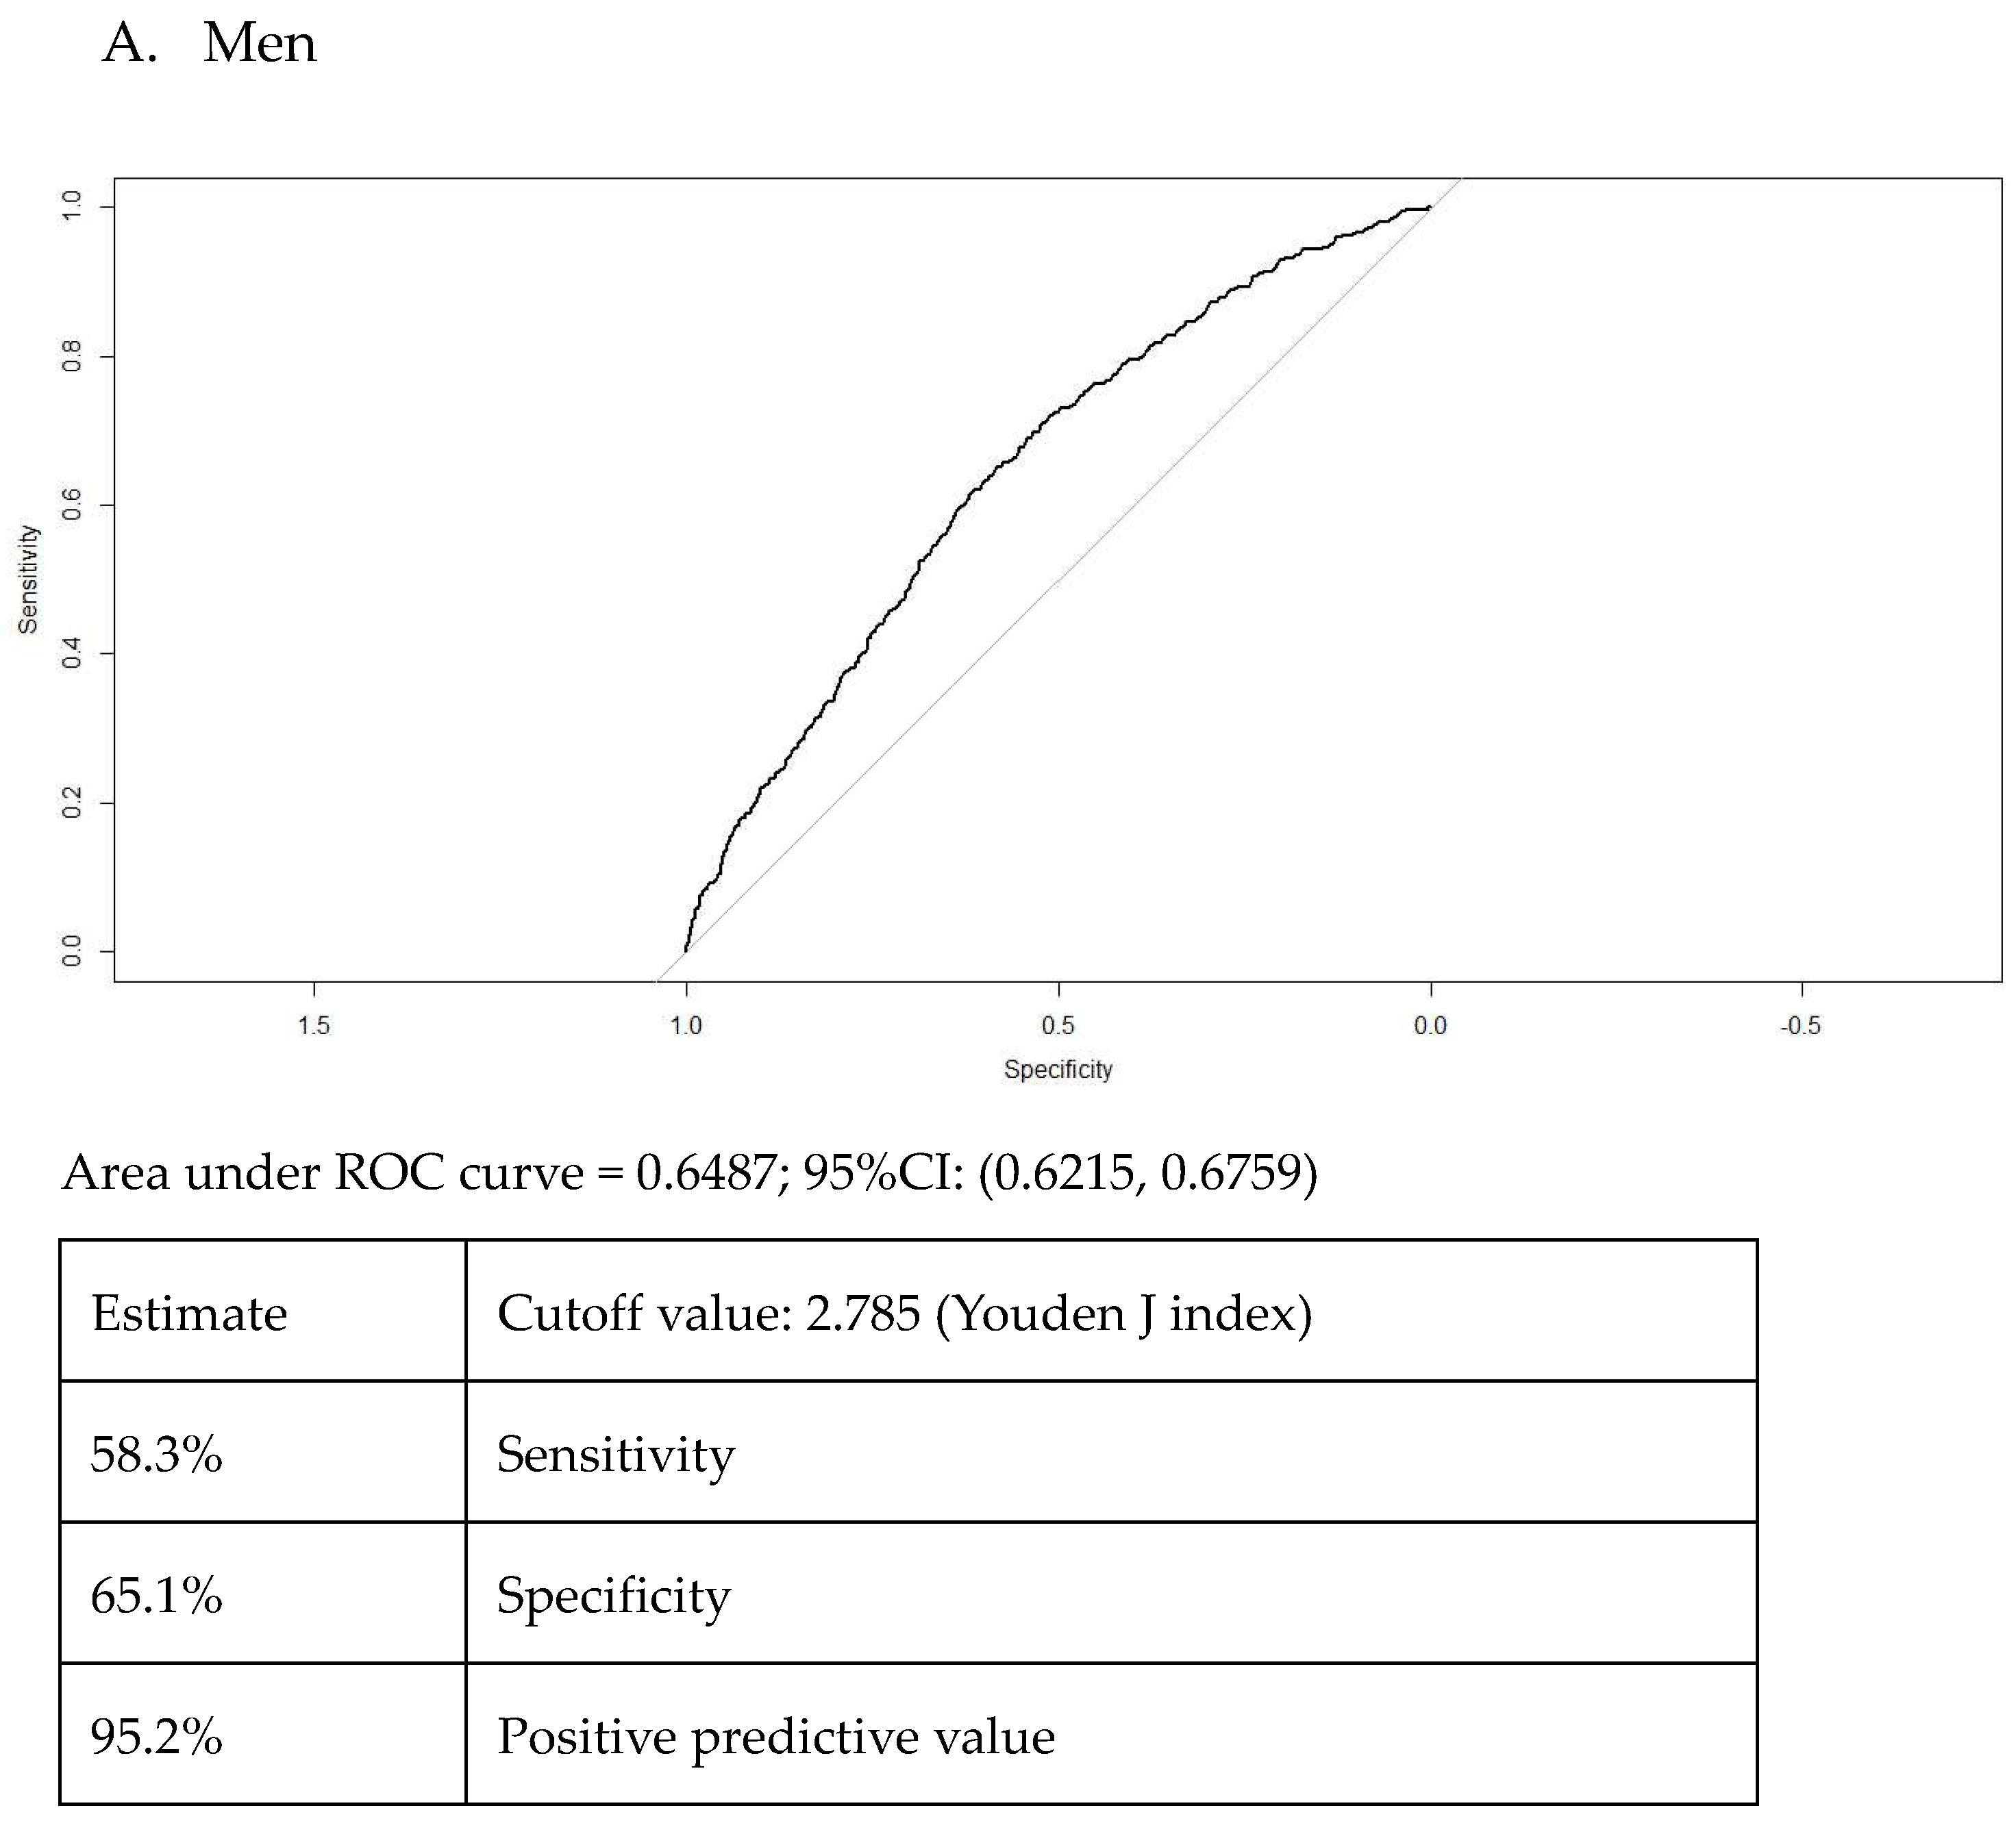
According to Figure 3, the area under the curve was similar in women (0.66) and in men (0.64). The optimal TG/HDL cutoff was 1.72 for women and 2.78 for men.

4. Discussion

Our Brazilian longitudinal cohort followed 11,653 individuals, 56% of whom were women, for 3.9 (0.6) years, and had some interesting findings. The first was that the mean values of anthropometric measurements, diastolic blood pressure, total and LDL-cholesterol, triglycerides and fasting and 2 h plasma glucose, and HOMA-IR (components of Metabolic Syndrome—MetS) increased across TG/HDL categories in both sexes (p < 0.001). During the study, 866 individuals were diagnosed with DM during the follow-up period, representing an incidence rate of 7.8%. Second, we also found that incidence rates of DM increased across TG/HDL quartiles for both sexes: 3- to 4-fold from the first to the fourth quartile for men (Q1 3.3%, Q2 4.3%, Q3 8.1%, and Q4 12.8%) and women (Q1 3.3%, Q2 5.6%, Q3 9.7%, and Q4 12.4%). Third, we analyzed the ROC curve of the TG/HDL ratio at baseline for incidence of diabetes after a four-year follow-up, and the curve was similar in women (0.66) and in men (0.64). The optimal TG/HDL cutoff was 1.72 for women and 2.78 for men.
The increase in the incidence of MetS and DM is a public health problem because it significantly increases cardiovascular atherosclerotic disease [18]. Recent World Health Organization (WHO) data showed that in 2019, 32% of deaths were attributed to cardiovascular disease [19]. There is a lot of clinical evidence showing that LDL-C is related to poor cardiovascular outcomes, but there are several patients who remain in peril for cardiovascular disease (CVD) events, despite optimal LDL-C control [20]. Therefore, it is plausible that other markers exist as etiology in cardiovascular disease, with TG/HDL being a possible parameter.
Several other studies corroborate our data. In our population, the higher the TG/HDL ratio, the greater the chance of developing DM. A recent study evaluated 120,613 participants from the health examination database at Panasonic Corporation from 2008 to 2017 to investigate the association between lipid profiles, particularly the ratio of TG/HDL-C and the development of type 2 DM (T2DM). The authors concluded that the ratio of TG/HDL-C was found to be a stronger predictor of T2DM development within 10 years than LDL-C, HDL-C, or TG, indicating that it may be useful in future medical treatment support [12].
Our results, using the adjusted TG/HDL ratio, showed that for men, after adjustments for age in the Cox regression analyses, the risk for DM was significantly higher across the four quartiles of TG/HDL, persisting even after full adjustments in model 2 for age, BMI, blood pressure, pre-diabetes, family history of diabetes mellitus, physical activity at baseline, race, and HOMA-IR. For women, the association of DM incidence for the third and fourth quartiles persisted after all the adjustments (age, BMI, blood pressure, pre-diabetes, family history of diabetes mellitus, physical activity at baseline, race, and HOMA-IR).
Also, in line with DM prediction and with our data, a Korean study evaluated 8655 participants aged 40 to 69 years without diabetes and divided the TG/HDL-C ratio into quartiles. During the 12-year follow-up period, type 2 diabetes developed in 1437 subjects (16.6%); compared to the reference first quartile, the HRs (95% CIs) of incident type 2 diabetes in the second, third, and fourth quartiles increased in a dose–response manner after adjusting for potentially confounding variables, with results very similar to ours. They concluded that a high TG/HDL-C ratio at baseline may be a useful surrogate indicator of future incident type 2 diabetes [21].
Another Chinese study evaluated lipid parameters in patients with coronary heart disease, looking at the association of the TG/HDL ratio with the risk of pre-diabetes and DM. There was a significant correlation between lipid parameters and the risk of pre-diabetes and DM, especially a strong correlation with the TG/HDL ratio. This study, in line with our results, demonstrated sex-specific elevated TG/HDL values as a risk factor for DM. These results revealed that high TG/HDL levels are a risk factor for pre-diabetes and DM, with a different cutoff point between men and women [22].
We observed that a worsening metabolic profile was associated with the increase in TG/HDL quartiles. Similar to that, another study followed 403,335 participants from the UK Biobank without cardiovascular disease for an average of 8.1 years and showed that elevated baseline TyG index and TG/HDL-C ratio were associated with a higher risk of CVD after adjustment for the well-established CVD risk factors. These associations were largely mediated by greater prevalence of dyslipidemia, type 2 diabetes, and hypertension [23].
The TG/HDL-C ratio can be a predictor of MetS in healthy populations as well. A Mexican study, including 813 subjects with an average age of 38.6 ± 12.1 years, showed an association between high TG/HDL-C index and low insulin sensitivity (odds ratio (OR): 4.09; p < 0.01) and with MetS (OR: 15.29; p < 0.01). They concluded that with these results, the TG/HDL-C ratio could be a reference criterion of risk for low insulin sensitivity and MetS [24]. An interesting study published by Dr. Reaven himself, who introduced the concept of insulin resistance syndrome, later widely known as MetS, concluded that a high TG/HDL ratio can be as effective as the MetS classification in identifying insulin resistance and in predicting the development of CVD [25].
It is interesting to note that the TG/HDL ratio has been shown to be an important predictor of MetS even in the pediatric population. An Italian study followed 1065 children and adolescents (563 female and 502 male), aged 14.6 ± 2.1 years (range 10–17), with severe obesity and assessed metabolic syndrome using the International Diabetes Federation criteria [26]. The presence of MetS was found in 324 patients (30.4%): 167 males (33.3%) and 157 females (27.9%). As in our study, they performed an ROC curve analysis with a specificity of the TG/HDL ratio of 0.85 [27].
The relationship between a higher TG/HDL ratio and MetS was demonstrated in our population, who were aged 50.5 (8.7) years, but this also occurs in older populations. A Chinese study evaluated 1267 elderly people (age > 65 years) and correlated the TG/HDL ratio and metabolic syndrome. They found that the TG/HDL-C ratio showed a significant positive correlation with MetS (r = 0.420; p < 0.001) even after adjusting for blood pressure, blood glucose, age, sex, and body mass index. They found that a TG/HDL-C ratio of 1.49 can be used as the critical value for a higher risk of metabolic syndrome. We did the same, but we evaluated the critical value for a higher risk of DM: the optimal TG/HDL cutoff was 1.72 for women and 2.78 for men [28].
Regarding the cutoff points found in this study, we observed that they are similar to those found in previous literature, but we see that in the Brazilian population, there is a difference even between men and women. We emphasize that there is a difference from the cutoff point found in the literature; however, our sample is representative and included participants from various regions of the country. We reinforce that the values observed here apply to the Brazilian population [29].
This study has some limitations that should be considered. Our study included all ELSA-Brazil participants without considering the use of medications for dyslipidemia; however, extreme values of cholesterol and triglycerides were excluded from the sample. As shown, the sample was composed of overweight individuals with a borderline increased abdominal circumference. There is a high risk of insulin resistance in overweight individuals with T2DM, and were unable to evaluate visceral obesity using direct measurements for visceral fat [30]. However, insulin resistance was considered as an adjustment variable in statistical models. As strengths, we highlight the large sample size, that we took into account sex differences, the longitudinal cohort, and that all information and measures were collected under strict quality control [31]. In addition, we adjusted the analysis by several potential confounders.

5. Conclusions

In conclusion, we found a strong correlation between the TG/HDL ratio and DM in an adult Brazilian population with sex-specific cutoff points. Furthermore, the incidence of DM was higher in individuals with higher levels of the TG/HDL ratio, with the optimal TG/HDL cutoff being 1.72 for women and 2.78 for men.

Author Contributions

B.d.A.-P., conceptualization, formal analysis, writing—original draft, writing—review and editing; J.I.B., writing—original draft, writing—review and editing; J.M.d.O., writing—original draft, writing—review and editing; P.M.D., data curation, formal analysis, writing—original draft; L.B.d.A.F.D., writing—original draft, writing—review and editing; I.M.B., conceptualization, data curation, funding acquisition, project administration, writing—review and editing; P.A.L., conceptualization, funding acquisition, project administration, writing—review and editing; S.R.G.F., supervision, writing—review and editing. All authors have read and agreed to the published version of the manuscript.

Funding

The ELSA-Brasil baseline study was supported by the Brazilian Ministry of Health (Science and Technology Department), Technology and Innovation (FINEP, Financiadora de Estudos e Projetos) and the Brazilian Ministry of Science and Technology and CNPq—National Research Council (grants # 01 06 0010.00 RS, 01 06 0212.00 BA, 01 06 0300.00 ES, 01 06 0278.00 MG, 01 06 0115.00 SP, 01 06 0071.00 RJ).

Institutional Review Board Statement

The study was conducted in accordance with the Declaration of Helsinki. The study protocol complied with Resolution 196/96a and with other complementary ones—Resolution CNS 346/05, Multicenter Projects, and Resolution CNS 347/05, Storage of Biological Materials. It was approved by the research ethics committees of the institutions involved and by the Comissão Nacional de Ética em Pesquisa (CONEP—National Research Ethics Committee) of the National Health Council. This process began in May 2006 and lasted a little less than five months (with an average duration of 36 days at each center) until the final approval.

Informed Consent Statement

Informed consent was obtained from all subjects involved in the study.

Data Availability Statement

The data presented in this study are available on request from the corresponding author due to privacy and ethical restrictions of the ELSA Cohort Study.

Acknowledgments

The authors would also like to acknowledge the participation of the 15,105 individuals recruited for this study, without who this study and those based on the ELSA-Brazil cohort would not have been possible.

Conflicts of Interest

The authors declare no conflicts of interest.

References

  1. Sun, H.; Saeedi, P.; Karuranga, S.; Pinkepank, M.; Ogurtsova, K.; Duncan, B.B.; Stein, C.; Basit, A.; Chan, J.C.N.; Mbanya, J.C.; et al. IDF Diabetes Atlas: Global, Regional and Country-Level Diabetes Prevalence Estimates for 2021 and Projections for 2045. Diabetes Res. Clin. Pract. 2022, 183, 109119. [Google Scholar] [CrossRef] [PubMed]
  2. Li, M.; Chi, X.; Wang, Y.; Setrerrahmane, S.; Xie, W.; Xu, H. Trends in Insulin Resistance: Insights into Mechanisms and Therapeutic Strategy. Signal Transduct. Target. Ther. 2022, 7, 216. [Google Scholar] [CrossRef] [PubMed]
  3. Goldstein, B.J. Insulin Resistance as the Core Defect in Type 2 Diabetes Mellitus. Am. J. Cardiol. 2002, 90, 3–10. [Google Scholar] [CrossRef] [PubMed]
  4. Lee, S.H.; Park, S.Y.; Choi, C.S. Insulin Resistance: From Mechanisms to Therapeutic Strategies. Diabetes Metab. J. 2022, 46, 15–37. [Google Scholar] [CrossRef] [PubMed]
  5. Singh, B. Surrogate Markers of Insulin Resistance: A Review. World J. Diabetes 2010, 1, 36–47. [Google Scholar] [CrossRef]
  6. Biernacka-Bartnik, A.; Kocełak, P.; Owczarek, A.J.; Choręza, P.S.; Markuszewski, L.; Madej, P.; Puzianowska-Kuźnicka, M.; Chudek, J.; Olszanecka-Glinianowicz, M. The Cut-off Value for HOMA-IR Discriminating the Insulin Resistance Based on the SHBG Level in Women with Polycystic Ovary Syndrome. Front. Med. 2023, 10, 1100547. [Google Scholar] [CrossRef]
  7. Vergès, B. Pathophysiology of Diabetic Dyslipidaemia: Where Are We? Diabetologia 2015, 58, 886–899. [Google Scholar] [CrossRef]
  8. Liu, H.; Liu, J.; Liu, J.; Xin, S.; Lyu, Z.; Fu, X. Triglyceride to High-Density Lipoprotein Cholesterol (TG/HDL-C) Ratio, a Simple but Effective Indicator in Predicting Type 2 Diabetes Mellitus in Older Adults. Front. Endocrinol. 2022, 13, 828581. [Google Scholar] [CrossRef]
  9. Bhowmik, B.; Siddiquee, T.; Mujumder, A.; Afsana, F.; Ahmed, T.; Mdala, I.A.; Nayla, N.C.; Khan, A.K.A.; Hussain, A.; Holmboe-Ottesen, G.; et al. Serum Lipid Profile and Its Association with Diabetes and Prediabetes in a Rural Bangladeshi Population. Int. J. Environ. Res. Public Health 2018, 15, 1944. [Google Scholar] [CrossRef]
  10. Vega, G.L.; Barlow, C.E.; Grundy, S.M.; Leonard, D.; DeFina, L.F. Triglyceride-to-High-Density-Lipoprotein-Cholesterol Ratio Is an Index of Heart Disease Mortality and of Incidence of Type 2 Diabetes Mellitus in Men. J. Investig. Med. 2014, 62, 345–349. [Google Scholar] [CrossRef]
  11. Wang, H.; Wang, C.; Xuan, X.; Xie, Z.; Qiu, Y.; Qin, H.; Xiaoning, Z. Association between Triglyceride to High-Density Lipoprotein Cholesterol Ratio and Type 2 Diabetes Risk in Japanese. Sci. Rep. 2023, 13, 3719. [Google Scholar] [CrossRef] [PubMed]
  12. Yuge, H.; Okada, H.; Hamaguchi, M.; Kurogi, K.; Murata, H.; Ito, M.; Fukui, M. Triglycerides/HDL Cholesterol Ratio and Type 2 Diabetes Incidence: Panasonic Cohort Study 10. Cardiovasc. Diabetol. 2023, 22, 308. [Google Scholar] [CrossRef]
  13. Da Luz, P.L.; Favarato, D.; Faria-Neto, J.R.; Lemos, P.; Chagas, A.C.P. High Ratio of Triglycerides to HDL-Cholesterol Predicts Extensive Coronary Disease. Clinics 2008, 63, 427–432. [Google Scholar] [CrossRef] [PubMed]
  14. Schmidt, M.I.; Duncan, B.B.; Mill, J.G.; Lotufo, P.A.; Chor, D.; Barreto, S.M.; Aquino, E.M.L.; Passos, V.M.A.; Matos, S.M.A.; Molina, M.d.C.B.; et al. Cohort Profile: Longitudinal Study of Adult Health (ELSA-Brasil). Int. J. Epidemiol. 2015, 44, 68–75. [Google Scholar] [CrossRef] [PubMed]
  15. Aquino, E.M.L.; Barreto, S.M.; Bensenor, I.M.; Carvalho, M.S.; Chor, D.; Duncan, B.B.; Lotufo, P.A.; Mill, J.G.; Molina, M.D.C.; Mota, E.L.A.; et al. Brazilian Longitudinal Study of Adult Health (ELSA-Brasil): Objectives and Design. Am. J. Epidemiol. 2012, 175, 315–324. [Google Scholar] [CrossRef]
  16. Bensenor, I.M.; Griep, R.H.; Pinto, K.A.; De Faria, C.P.; Felisbino-Mendes, M.; Caetano, E.I.; da Silva Albuquerque, L.; Schmidt, M.I. Routines of Organization of Clinical Tests and Interviews in the ELSA-Brasil Investigation Center. Rev. Saude Publica 2013, 47, 37–47. [Google Scholar] [CrossRef] [PubMed]
  17. American Diabetes Association. 2. Classification and Diagnosis of Diabetes: Standards of Medical Care in Diabetes—2021. Diabetes Care 2021, 44 (Suppl. S1), S15–S33. [Google Scholar] [CrossRef] [PubMed]
  18. Giugliano, D.; Maiorino, M.I.; Bellastella, G.; Chiodini, P.; Esposito, K. Glycemic Control, Preexisting Cardiovascular Disease, and Risk of Major Cardiovascular Events in Patients with Type 2 Diabetes Mellitus: Systematic Review With Meta-Analysis of Cardiovascular Outcome Trials and Intensive Glucose Control Trials. J. Am. Heart Assoc. 2019, 8, e012356. [Google Scholar] [CrossRef]
  19. WHO World Health Organisation. 2021. Available online: https://www.who.int/en/news-room/fact-sheets/detail/cardiovascular-diseases-(cvds) (accessed on 4 September 2024).
  20. Sampson, U.K.; Fazio, S.; Linton, M.F. Residual Cardiovascular Risk despite Optimal LDL Cholesterol Reduction with Statins: The Evidence, Etiology, and Therapeutic Challenges. Curr. Atheroscler. Rep. 2012, 14, 1–10. [Google Scholar] [CrossRef] [PubMed]
  21. Lim, T.K.; Lee, H.S.; Lee, Y.J. Triglyceride to HDL-Cholesterol Ratio and the Incidence Risk of Type 2 Diabetes in Community Dwelling Adults: A Longitudinal 12-Year Analysis of the Korean Genome and Epidemiology Study. Diabetes Res. Clin. Pract. 2020, 163, 108150. [Google Scholar] [CrossRef]
  22. Che, B.; Zhong, C.; Zhang, R.; Pu, L.; Zhao, T.; Zhang, Y.; Han, L. Triglyceride-Glucose Index and Triglyceride to High-Density Lipoprotein Cholesterol Ratio as Potential Cardiovascular Disease Risk Factors: An Analysis of UK Biobank Data. Cardiovasc. Diabetol. 2023, 22, 34. [Google Scholar] [CrossRef] [PubMed]
  23. Yang, T.; Liu, Y.; Li, L.; Zheng, Y.; Wang, Y.; Su, J.; Yang, R.; Luo, M.; Yu, C. Correlation between the triglyceride –to-high-density lipoprotein cholesterol ratio and other unconvencional lipid parameters with the risk of prediabetes and Type 2 diabetes in pactients with coronary heart disease: A RCSCD-TCM study in China. Cardiovasc. Diabetol. 2022, 21, 93. [Google Scholar] [CrossRef] [PubMed]
  24. Baez-Duarte, B.G.; Zamora-Gínez, I.; González-Duarte, R.; Torres-Rasgado, E.; Ruiz-Vivanco, G.; Pérez-Fuentes, R.; Guerrero-Romero, F.; Rodriguez-Moran, M.; De La Pena, J.E.; Wacher, N.; et al. Triglyceride/High-Density Lipoprotein Cholesterol (TG/HDL-C) Index as a Reference Criterion of Risk for Metabolic Syndrome (MetS) and Low Insulin Sensitivity in Apparently Healthy Subjects. Gac. Med. Mex. 2017, 153, 152–158. [Google Scholar]
  25. Salazar, M.R.; Carbajal, H.A.; Espeche, W.G.; Aizpúrua, M.; Sisnieguez, C.E.; March, C.E.; Balbín, E.; Stavile, R.N.; Reaven, G.M. Identifying cardiovascular disease risk and outcome: Use of the plasma triglyceride/high-density lipoprotein cholesterol concentration ratio versus metabolic syndrome criteria. J. Intern. Med. 2013, 273, 595–601. [Google Scholar] [CrossRef]
  26. George MM, A.K.; Zimmet, P.; George Alberti, K.M.; Kaufman, F.; Tajima, N.; Silink, M.; Arslanian, S.; Wong, G.; Bennett, P.; Shaw, J.; et al. The Metabolic Syndrome in Children and Adolescents—An IDF Consensus Report. Pediatr. Diabetes 2007, 8, 299–306. [Google Scholar]
  27. Radetti, G.; Grugni, G.; Lupi, F.; Fanolla, A.; Caroli, D.; Bondesan, A.; Sartorio, A. High Tg/HDL-Cholesterol Ratio Highlights a Higher Risk of Metabolic Syndrome in Children and Adolescents with Severe Obesity. J. Clin. Med. 2022, 11, 4488. [Google Scholar] [CrossRef]
  28. Nie, G.; Hou, S.; Zhang, M.; Peng, W. High TG/HDL Ratio Suggests a Higher Risk of Metabolic Syndrome among an Elderly Chinese Population: A Cross-Sectional Study. BMJ Open 2021, 11, e041519. [Google Scholar] [CrossRef] [PubMed]
  29. Jeppesen, J.; Hein, H.O.; Suadicani, P.; Gyntalberg, F. Relation of high TG-Low HDL cholesterol and LDL cholesterol to the incidence of ischemic heart disease. Arter. Thromb. Vasc. Biol. 1997, 17, 1114–1120. [Google Scholar] [CrossRef]
  30. Du, T.; Yuan, G.; Zhang, M.; Zhou, X.; Sun, X.; Yu, X. Clinical Usefulness of Lipid Ratios, Visceral Adiposity Indicators, and the Triglycerides and Glucose Index as Risk Markers of Insulin Resistance. Cardiovasc. Diabetol. 2014, 13, 146. [Google Scholar] [CrossRef]
  31. Aquino, E.M.L.; Vasconcellos-Silva, P.R.; Coeli, C.M.; Araujo, M.J.; Santos, S.M.; Figueiredo, R.C.d.; Duncan, B.B. Aspectos eticos em estudos longitudinais: O caso do ELSA-Brasil. Rev. Saúde Pública 2013, 47 (Suppl. S2), 19–26. [Google Scholar] [CrossRef]
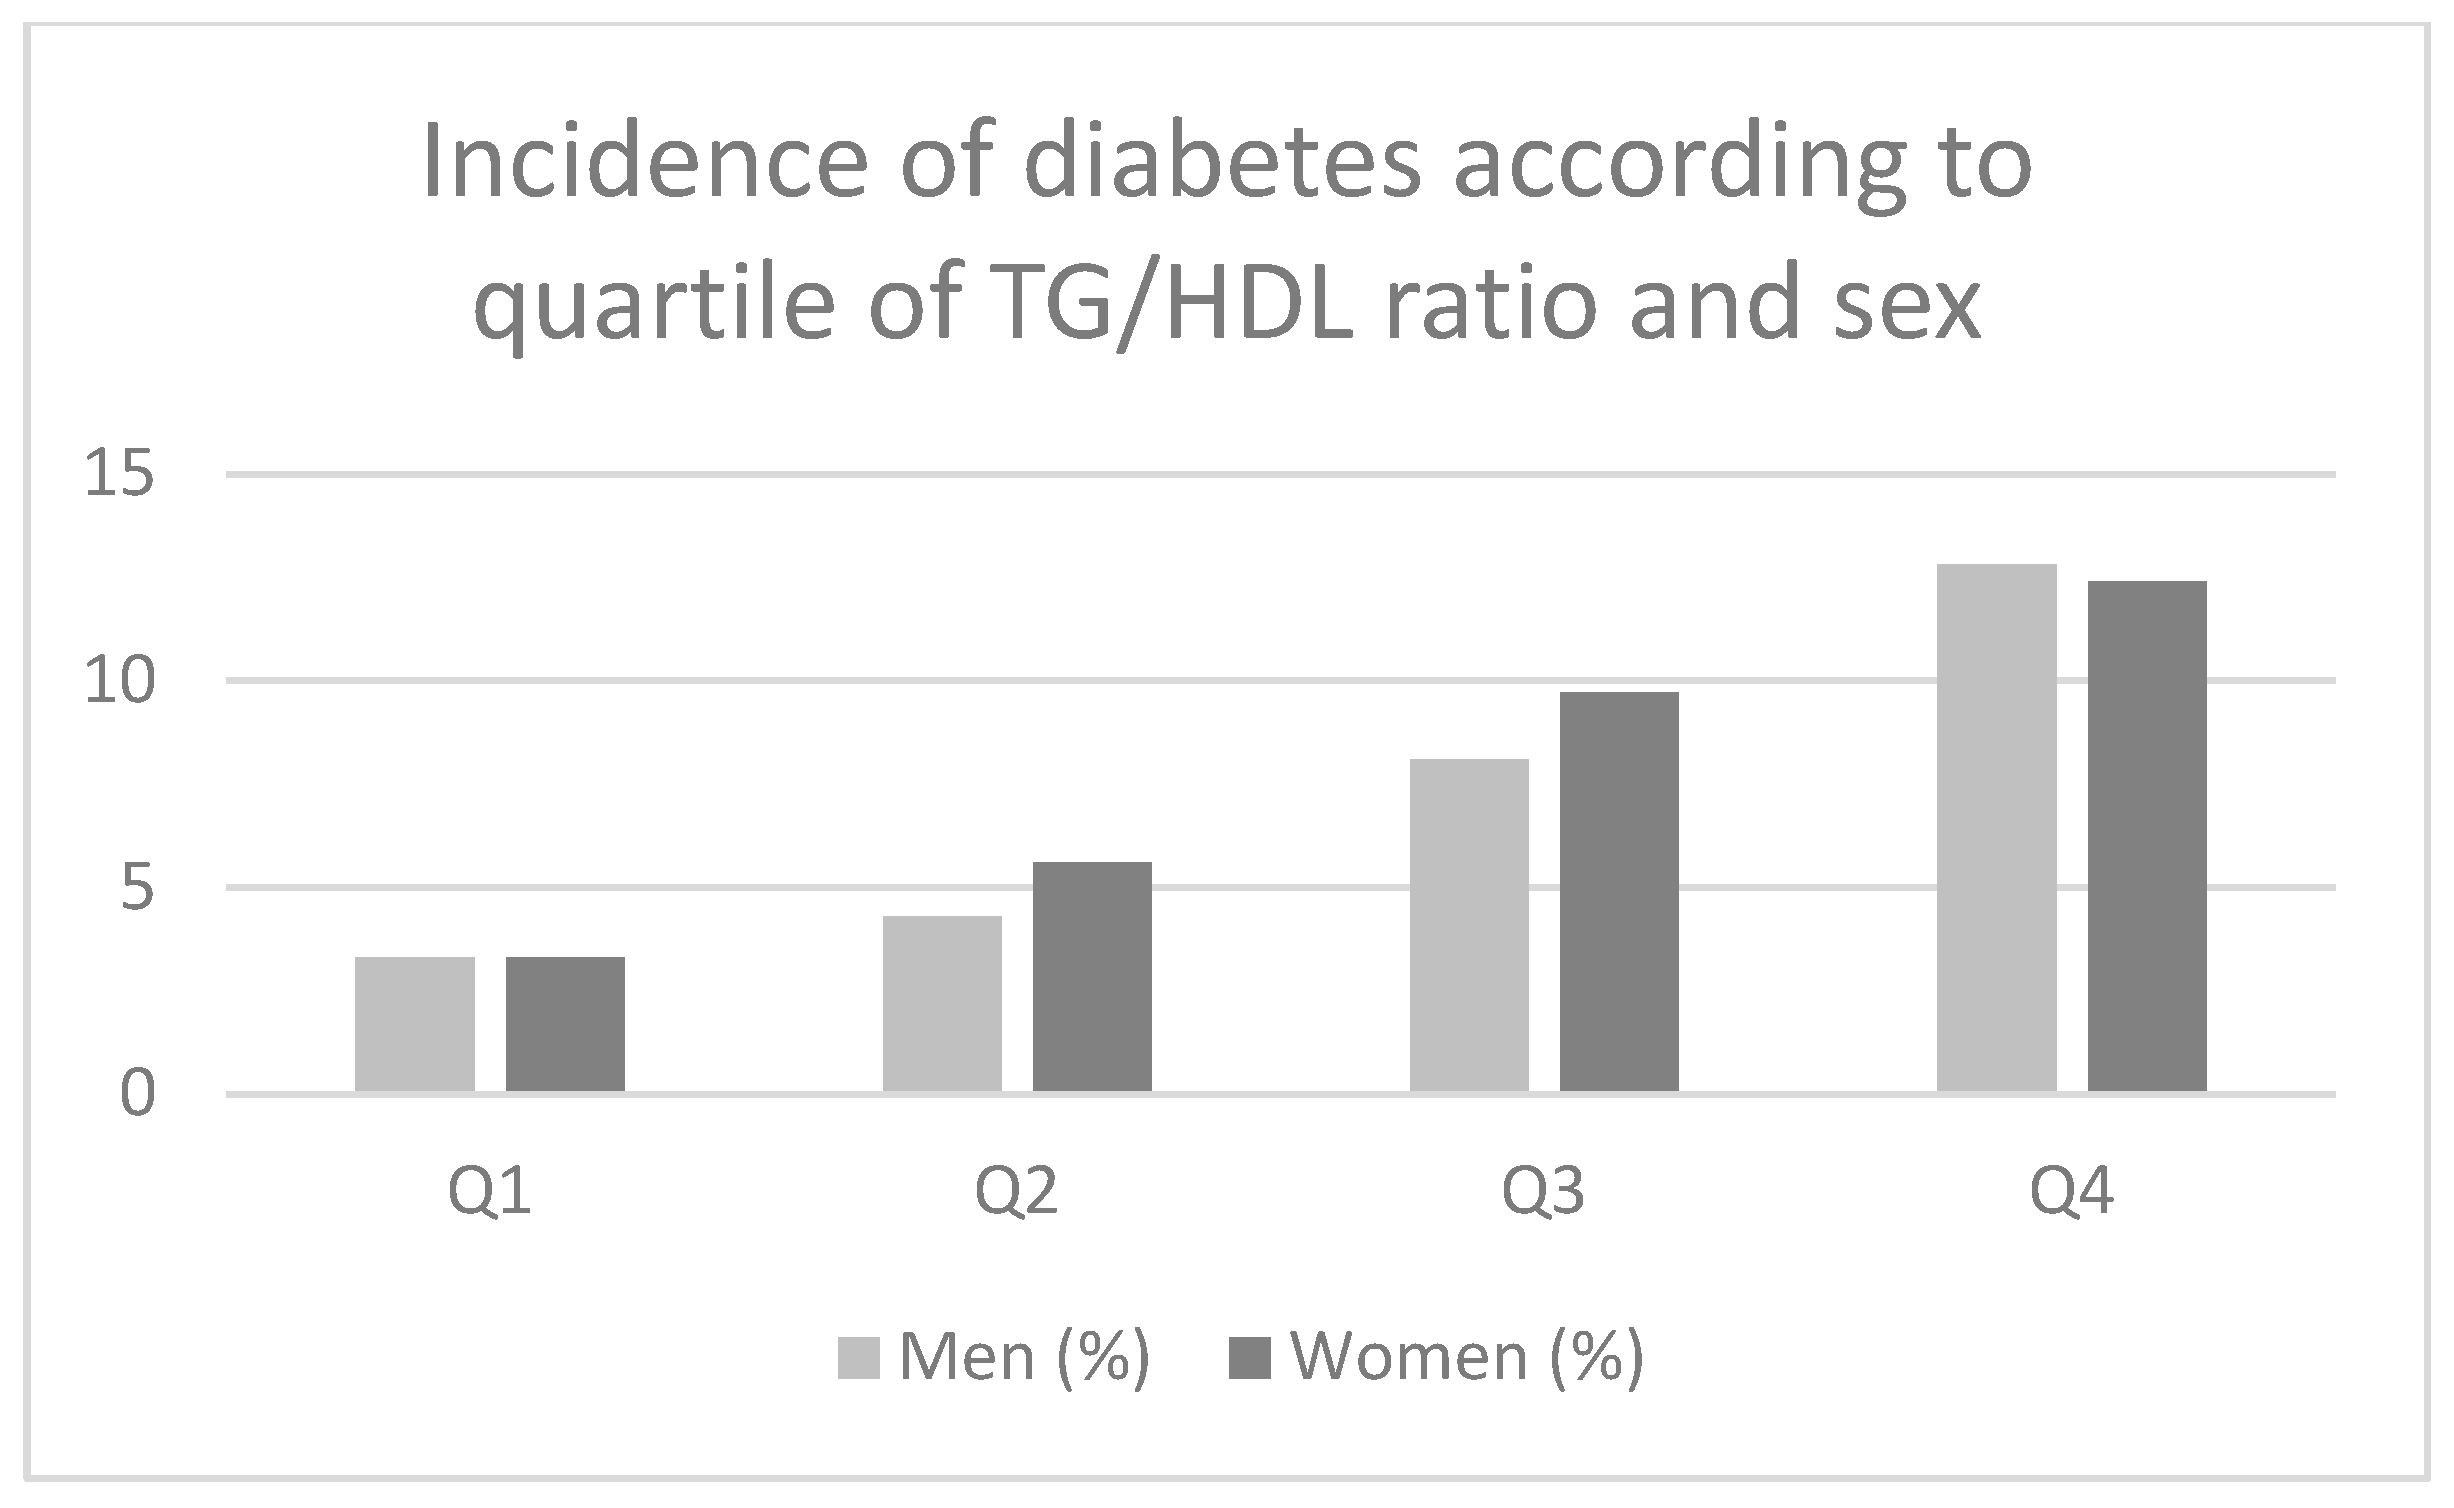
Figure 1. Incidence of diabetes according to quartiles of the TG/HDL ratio at baseline in men and women. Men: first quartile, Q1, <1.69; second quartile, Q2, 1.69 to <2.54; third quartile, Q3, 2.54 to <3.85; forth quartile, Q4, ≥3.85. Women: first quartile, Q1, <1.13; second quartile, Q2, 1.13 to <1.63; third quartile, Q3, 1.63 to <2.39; forth quartile, Q4, ≥2.39.
Endocrines 05 00031 g001
Figure 2. Kaplan–Meier curves regarding the incidence of diabetes after 4-year follow-up according to TG/HDL quartiles at baseline in men and women from the ELSA-Brazil.
Endocrines 05 00031 g002aEndocrines 05 00031 g002b
Figure 3. ROC curve of the TG/HDL ratio at baseline for incidence of diabetes after a 4-year follow-up.
Endocrines 05 00031 g003aEndocrines 05 00031 g003b
Table 1. Baseline characteristics according to quartiles of TG/HDL values at baseline for men (A) and women (B).
A. Men
TG_HDL Quartiles
Q1
<1.69
Q2
1.69–<2.54
Q3
2.54–<3.85
Q4
≥3.85
p-valuep-for-trend
N1260128412671278
Age (years)51 (9.5)51 (9.5)51 (8.7)50 (8.5)0.2860.053
Race/Ethnicity, n (%) 0.1270.021
  • White
667 (53.6)669 (53.1)724 (57.7)695 (55.0)
  • Black
355 (28.5)381 (30.2)353 (28.1)393 (31.1)
  • Mixed
178 (14.3)176 (14.0)144 (11.5)140 (11.1)
  • Asian
27 (2.2)22 (1.7)17 (1.4)18 (1.4)
  • Indigenous
17 (1.4)13 (1.0)16 (1.3)18 (1.4)
Higher educational level, n (%)1071 (85.0)1122 (87.4)1093 (86.3)1106 (86.5)0.0080.280
Pre-diabetes, n (%)558 (44.3)671 (52.3)756 (59.7)825 (64.6)<0.001<0.001
Family history of DM, n (%)378 (30.6)400 (31.7)433 (34.7)447 (35.5)0.0240.003
Physically active, n (%)452 (36.3)372 (29.3)306 (24.6)270 (21.5)<0.001<0.001
Smoking, n (%)114 (23.2)132 (23.2)132 (23.2)181 (26.5)0.1870.078
Body mass index (kg/m2)24.6 (3.6)27.2 (3.8) a27.3 (4.1) a,b28.0 (3.9) a,b,c<0.001<0.001
Waist circumference (cm)87.8 (10.5)93.0 (10.5) a96.3 (10.9) a,b98.2 (10.1) a,b,c<0.001<0.001
Systolic BP (mmHg)122 (16)123 (15)124 (16) a126 (16) a,b<0.001<0.001
Diastolic BP (mmHg)76 (11)77 (10) a79 (10) a,b81 (10) a,b,c<0.001<0.001
Total cholesterol (mg/dL)187.8 (35.8)194.4 (37.7) a202.4 (39.6) a,b209.1 (40.6) a,b,c<0.001<0.001
HDL-cholesterol (mg/dL)58.0 (11.3)49.0 (8.2) a45.3 (7.4) a,b41.7 (6.8) a,b,c<0.001<0.001
LDL-cholesterol (mg/dL)113.0 (31.7)122.8 (33.4) a126.8 (34.8) a,b119.2 (38.1) a,b,c<0.001<0.001
Triglycerides (mg/dL) #69.6 (16.1)101.9 (18.8) a140.4 (26.9) a,b233.8 (70.4) a,b,c<0.001<0.001
Fasting glucose (mg/dL)99.0 (8.3)101.0 (8.0) a102.2 (8.3) a,b103.4 (8.4) a,b,c<0.001<0.001
2 h glucose (mg/dL)111.1 (26.8)115.9 (27.0) a124.5 (27.7) a,b129.5 (27.9)<0.001<0.001
HbA1c (%)5.1 (0.5)5.2 (0.5)5.2 (0.5) a5.2 (0.5) a<0.001<0.001
HOMA-IR #2.0 (1.2)2.6 (1.8) a3.2 (2.0) a,b3.8 (2,2) a,b,c<0.001<0.001
TG/HDL ratio1.2 (0.3)2.1 (0.2) a3.1 (0.4) a,b5.7 (1.7) a,b,c<0.001<0.001
B. Women
TG_HDL Quartiles
Q1
<1.13
Q2
1.13–<1.63
Q3
1.63–<2.39
Q4
≥2.39
p-valuep-for-trend
N1617166016361651
Age (years)50 (8.6)50 (8.5)52 (8.8) a,b52 (8.3) a,b<0.001<0.001
Race/Ethnicity, n (%) <0.0010.434
  • White
852 (53.3)881 (53.8)869 (53.5)878 (53.4)
  • Black
381 (23.8)418 (25.5)441 (28.8)474 (28.8)
  • Mixed
322 (20.1)286 (17.5)249 (15.3)214 (13.0)
  • Asian
37 (2.3)46 (2.8)52 (3.2)56 (3.4)
  • Indigenous
8 (0.5)7 (0.4)12 (0.7)22 (1.3)
Higher educational level, n (%)1534 (94.9)1558 (93.9)1487 (90.9)1498 (90.7)<0.001<0.001
Pre-diabetes, n (%)359 (22.2)498 (30.0)596 (36.4)811 (49.1)<0.001<0.001
Family history of DM, n(%)571 (35.7)610 (37.1)653 (40.3)656 (40.1)0.0150.002
Physically active, n(%)393 (24.7)342 (21.0)330 (20.4)266 (16.4)<0.001<0.001
Smoking, n (%)114 (23.0)181 (31.9)173 (29.2)202 (30.3)0.0090.038
Body mass index (kg/m2)24.7 (4.1)25.8 (4.5) a27.3 (4.9) a,b28.4 (4.9) a,b,c<0.001<0.001
Waist circumference (cm)80.5 (10.2)84.4 (11.3) a88.5 (11.5) a,b91.9 (11.4) a,b,c<0.001<0.001
Systolic BP (mmHg)113 (14.9)114 (15.4) a117 (16.1) a,b119 (15.7) a,b,c<0.001<0.001
Diastolic BP (mmHg)71 (9.6)72 (9.7) a74 (10.0) a,b76 (9.8) a,b,c<0.001<0.001
Total cholesterol (mg/dL)192.3 (33.9)197.2 (36.5) a204.2 (38.6) a,b212.7 (40.8) a,b,c<0.001<0.001
HDL-cholesterol (mg/dL)69.0 (11.7)60.0 (103) a55.3 (9.7) a,b48.8 (8.4) a,b,c<0.001<0.001
LDL-cholesterol (mg/dL)108.0 (29.0)118.0 (29.0) a124.6 (34.5) a,b127.3 (36.3) a,b,c<0.001<0.001
Triglycerides (mg/dL) #59.0 (12.8)81.8 (15.3) a108.4(21.2) a,b170.9 (54.5)<0.001<0.001
Fasting glucose (mg/dL)94.2 (7.6)96.0 (7.9) a97.6 (8.4) a,b99.9 (8.6) a,b,c<0.001<0.001
2 h glucose (mg/dL)105.6 (23.7)113.0 (24.9) a120.6 (26.8) a,b128.8(27.1) a,b,c<0.001<0.001
HbA1c (%)5.1 (0.5)5.1 (0.5)5.2 (0.5) a5.2 (0.5) a,b<0.001<0.001
HOMA-IR #1.8 (1.0)2.3 (1.6) a2.8 (1.7) a,b3.4 (2.1) a,b,c<0.001<0.001
TG/HDL ratio0.9 (0.2)1.4 (0.1) a2.0 (0.2) a,b3.6 (1.3) a,b,c<0.001<0.001
BP, blood pressure; HbA1c, glycated hemoglobin. Values are means (SD) or n (%). # Variables log transformed for the analysis. Chi-squared test or ANOVA with Bonferroni correction. a Versus Q1, b versus Q2, and c versus Q3. p-for-trend or linear-by-linear analysis.
Table 2. Association of quartiles of TG/HDL values at baseline with incidence of diabetes in men and women, by Cox regression analysis.
CrudeModel 1Model 2
MenHR (95%CI)HR (95%CI)HR (95%CI)
Q1111
Q2 1.75 (1.19–2.56)1.78 (1.21–2.60)1.39 (0.92–2.12)
Q3 3.07 (2.16–4.36)3.15 (2.22–4.48)1.82 (1.23–2.71)
Q4 3.95 (2.81–5.55)4.16(2.96–5.85)2.20 (1.49–3.26)
Women
Q1111
Q21.32 (0.93–1.89)1.30 (0,91–1,86)1.13 (0.78–1.65)
Q32.51 (1.83–3.46)2.38 (1.73–3.27)1.57 (1.11–2.22)
Q44.11 (3.04–5.55)3.87 (2.86–5.23)2.08 (1.48–2.93)
HR, hazard ratio. Q, quartile. Men: first quartile, Q1, <1.69; second quartile, Q2, 1.69 to <2.54; third quartile, Q3, 2.54 to <3.85; forth quartile, Q4, ≥3.85. Women: first quartile, Q1, <1.13; second quartile, Q2, 1.13 to <1.63; third quartile, Q3, 1.63 to <2.39; forth quartile, Q4, ≥2.39. Model 1: Adjusted for age. Model 2: Adjusted for age, BMI, blood pressure, pre-diabetes, family history of diabetes mellitus, physical activity at baseline, race, and HOMA-IR.
Disclaimer/Publisher’s Note: The statements, opinions and data contained in all publications are solely those of the individual author(s) and contributor(s) and not of MDPI and/or the editor(s). MDPI and/or the editor(s) disclaim responsibility for any injury to people or property resulting from any ideas, methods, instructions or products referred to in the content.