Article

Raman Spectroscopy and Electrical Transport in 30Li2O• (67−x) B2O3•(x) SiO2•3Al2O3 Glasses

1
Physics Department, The Catholic University of America, Washington, DC 20064, USA
2
Vitreous State Laboratory, The Catholic University of America, Washington, DC 20064, USA
3
Materials Measurement Laboratory, National Institute of Standards and Technology, Gaithersburg, MD 20899, USA
*
Author to whom correspondence should be addressed.
Electron. Mater. 2024, 5(3), 166-188; https://doi.org/10.3390/electronicmat5030012
Submission received: 19 May 2024 / Revised: 30 August 2024 / Accepted: 2 September 2024 / Published: 12 September 2024

Abstract

:
We have investigated the influence of the relative proportions of glass formers in a series of lithium alumino-borosilicate glasses with respect to electrical conductivity (σ) and glass transition temperature (Tg) as functions of glass structure, as determined using Raman spectroscopy. The ternary lithium alumino-borate glass exhibits the highest σ and lowest Tg among all the compositions of the glass series, 30Li2O•3Al2O3• (67−x) B2O3xSiO2. However, as B2O3 is replaced by SiO2, a shallow minimum in σ, as well as a shallow maximum in Tg, are observed near x = 27, where the Raman spectra indicate that isolated diborate/tetraborate/orthoborate groups are being progressively replaced by danburite/reedmergnerite-like borosilicate network units. Overall, as the glasses become silica-rich, σ is minimized, while Tg is maximized. In general, these findings show correlations among Tg (sensitive to network polymerization), σ (proportional to ionic mobility), and the different borate and silicate glass structural units as determined using Raman spectroscopy.

1. Introduction

Recent advancements in glass science have prompted extensive research efforts aimed at comprehending both the fundamental and applied aspects of non-crystalline electrolytes in all-solid-state batteries (ASSBs) [1,2]. Ionic glasses containing sulfide and oxide anions, with alkaline cations, are investigated to be used in ASSBs. The optimization of electrical conductivity in these ionic glasses has been attempted through the incorporation of halides or other salts into the glass structure [3]. However, this strategy often comes at the cost of decreased chemical durability and thermal stability [4].
To address these challenges, researchers have explored [5,6,7,8,9,10,11] the incorporation of multiple glass formers, such as P2O5, B2O3, and/or SiO2, into binary glass systems. This has proven to be an effective approach to optimize electrical conductivity while mitigating the adverse effects of added halide salts. Recent studies have been directed toward glasses containing at least two network formers [5]. A phenomenon known as the mixed glass former effect (MGFE) in binary glasses can vary electrical conductivity in non-linear ways by holding alkali content constant while changing the proportions of different glass formers [6].
The lithium boro-phosphate (LBP) system [7] exemplifies the MGFE, where the conductivity of these ternary glasses can be two orders of magnitude greater than that for lithium borate or lithium phosphate binary glasses. Comparable changes in electrical conductivity between ternary and binary glasses demonstrating the MGFE can also be found for other systems, including silver boro-phosphate, lithium boro-tellurite [8], and lithium seleno-borate glasses [9]. This intriguing behavior extends to glasses in the Li2O•B2O3•SiO2 system, known for their ability to incorporate significant amounts of Li2O while maintaining stability [10]. Maia et al. [11] found no signs of MGFE in a series of lithium boro-silicate glasses with 40 mol.% of Li2O. However, Otto [12] reported MGFE in the lithium boro-silicate glasses, with 20 to 30 mol.% Li2O. These compositional effects in glasses arise from structural modifications, resulting in the formation of different glass former species [13]. To better comprehend these effects, it is crucial to characterize the various network structural units in these ternary glasses. Raman spectroscopy has proven to be an effective technique to detect structural units [14] present in the glasses. This information aids in explaining the compositional dependence of activation energies that impede ion transport in glasses.
The ionic transport in glasses is governed by the Arrhenius equation [15] for ionic conductivity, as expressed in Equation (1).
σ = σ0 exp (−Ea/kT)
where:
σ0 = N0 α(Ze)2λ2 v/T
and N0 represents the total number of mobile ions, T is the absolute temperature, α is the degrees of freedom, Ze is electric charge of ions, λ is the distance covered by the ion in a single jump, v is the frequency of jump attempts the ion makes, Ea is the activation energy—the energy barrier an ion carrier has to overcome to move from one site to another to contribute to conduction—and k is the Boltzmann constant [16]. According to the Anderson–Stuart model [17], the activation energy for ionic conduction in glass is given by the following:
Ea = Eb + Es
where Eb is the electrostatic bond energy and Es is the network strain energy.
This study centers on a series of lithium borosilicate glasses with 30 mol% lithium oxide, denoted as 30Li2O•(67−x)B2O3•(x)SiO2•3Al2O3 (LABS glass), where x varies from 0 to 67. Aluminum oxide is incorporated to enhance the chemical stability of the glass. By varying the B2O3 and SiO2 ratios, we measure how electrical conductivity (σ), glass transition temperature (Tg), and Raman spectral features change across the glass series. One of the objectives was to investigate if the incorporation of a second network former could lower the net bond energy and/or the strain energy, possibly increasing alkali ion mobility.
Another aspect of this research was to explore the possibility of inducing phase separation in the glass. It is commonly observed that alkali ions tend to segregate in one of the two phases of a glass containing two glass-forming oxides (as in Vycor glass). If such a glass composition decomposes spinodally, then the high concentration of one of two phases may lead to high alkali ion mobility, which is desirable in the solid electrolyte of a battery.
For each glass, van der Pauw’s four-probe method [18] was implemented to measure σ over a temperature range of 50 to 170 °C, which was then used to calculate the glass activation energy. The Tg value was determined for each glass based on differential thermal analysis (DTA). Tg denotes a temperature range during which a super-cooled liquid transforms into a glassy state. Analyzing Tg provides valuable insights into both the structure and electrical conductivity of the glass. Polarized Raman spectra were gathered using a single grating spectrograph-edge filter system, where various spectral features were assigned to pertinent vibrational modes for borate, borosilicate, and silicate glasses and some crystalline phases presented in the literature.

2. Literature Review

2.1. Electrical Conductivity Literature

Research on lithium-conducting glasses has been ongoing for many decades, focusing on both fundamental understanding and practical applications as solid electrolytes in Li-ion batteries. To make such applications work, it is important to know how well these glasses conduct electricity. In earlier studies [19,20,21], electrical conductivity has been measured using two methods: direct current (DC) and alternating current (AC), often with two or four probes. In the DC method, we simply pass current through the sample and measure the voltage and current. For AC methods, like impedance spectroscopy, we use various alternating current frequencies and observe how the sample responds. The electrical resistance of a sample is determined based on impedance spectroscopy [22]. The electrical conductivity is calculated by using the relationship σ = t/RA, where R is the electrical resistance, A is the cross-sectional area, and t is the thickness of the sample [22].
The electrical conductivity of a glass depends upon the total concentration of various charge carriers, which is affected by the composition. Bude et al. [19] showed that σ increases from 10–11 to 10−4 S/cm in a series of yLi2O•(1−y) B2O3 glasses, and from 10−11 S/cm to 10−5 S/cm in a series of yLi2O•(1−y) SiO2 glasses, where y = 0.1 to 0.6. Montouillout et al. [20] investigated the xLi2O•(100−x)B2O3 glass system over a wide range of compositions, where x = 0 to 50 mol.%, by characterizing local structure and electrical conductivity using solid-state nuclear magnetic resonance (NMR) and impedance spectroscopy, respectively. They reported that σ increases linearly as x increases up to 32 mol.%, where in the glass structure, NMR indicates that BO4 populations increase at the expense of BO3. Kluvanek et al. [21] reported the absence of MGFE while studying (Li2O)0.4•(B2O3) (0.6x)•(Si2O4)0.6(1−x) glasses with x = 0 to 0.8 and found an increase in DC conductivity from silicate-rich to borate-rich glasses. Neyret et al. [23] studied the role of alkali in the borosilicate glass structure and showed that ionic conductivity decreases as silica polymerization increases.

2.2. Glass Transition Temperature Literature

Techniques such as differential thermal analysis (DTA) or differential scanning calorimetry (DSC) are commonly used to measure Tg [13]. In general, borate glasses tend to have lower Tg values, in contrast to higher-Tg silicate glasses [24]. The introduction of alkali oxide, such as Li2O, into the glass composition can induce variations in Tg for borate, borosilicate, and silicate glasses. For instance, Kodama et al. [25] conducted a study on the xLi2O• (1−x) B2O3 glass series and measured changes in Tg from 245 to 490 °C while varying x from 0 to 0.28. Avramov et al. [26] investigated binary xLi2O•(1−x)B2O3 and xLi2O•(1−x)SiO2 glasses, where x was varied from 0.01 to 0.6, and reported that Tg increases for borate compositions, reaching a maximum at x = 0.3, while for silicate compositions, Tg decreases linearly with increasing Li contents.
Boekenhauer et al. [27] explored the relationship between glass transition temperature and structure in a series of lithium borosilicate glasses, taking into account the composition-related structural parameters R and K, where R and K as proposed by Yun and Bray [28], Yun et al. [29], and Dell et al. [30] in Na-borosilicate glass, given as follows:
K = [SiO2] (mol.%)/[B2O3](mol.%)
and R = [M2O] (mol.%)/[B2O3](mol.%)
where M = alkali atom.
Boekenhauer et al. considered a wide range of Li2O-to-B2O3 ratios, or R, where 2 ≤ R ≤ 10 for several fixed SiO2-to-B2O3 ratios or K, where K = 0.5, 1, 2, or 3. The study discovered two maxima in Tg for each SiO2-to-B2O3 ratio in the borosilicate glass series. The first maximum is associated with the largest tetrahedral BO4 population, while the second maximum is linked to the glass, separating into lithium borate and lithium silicate domains. Neyret et al. [23] reported that Tg increases with increases in silicate polymerization in lithium, sodium, and potassium borosilicate glasses.

2.3. Raman Spectroscopy Literature

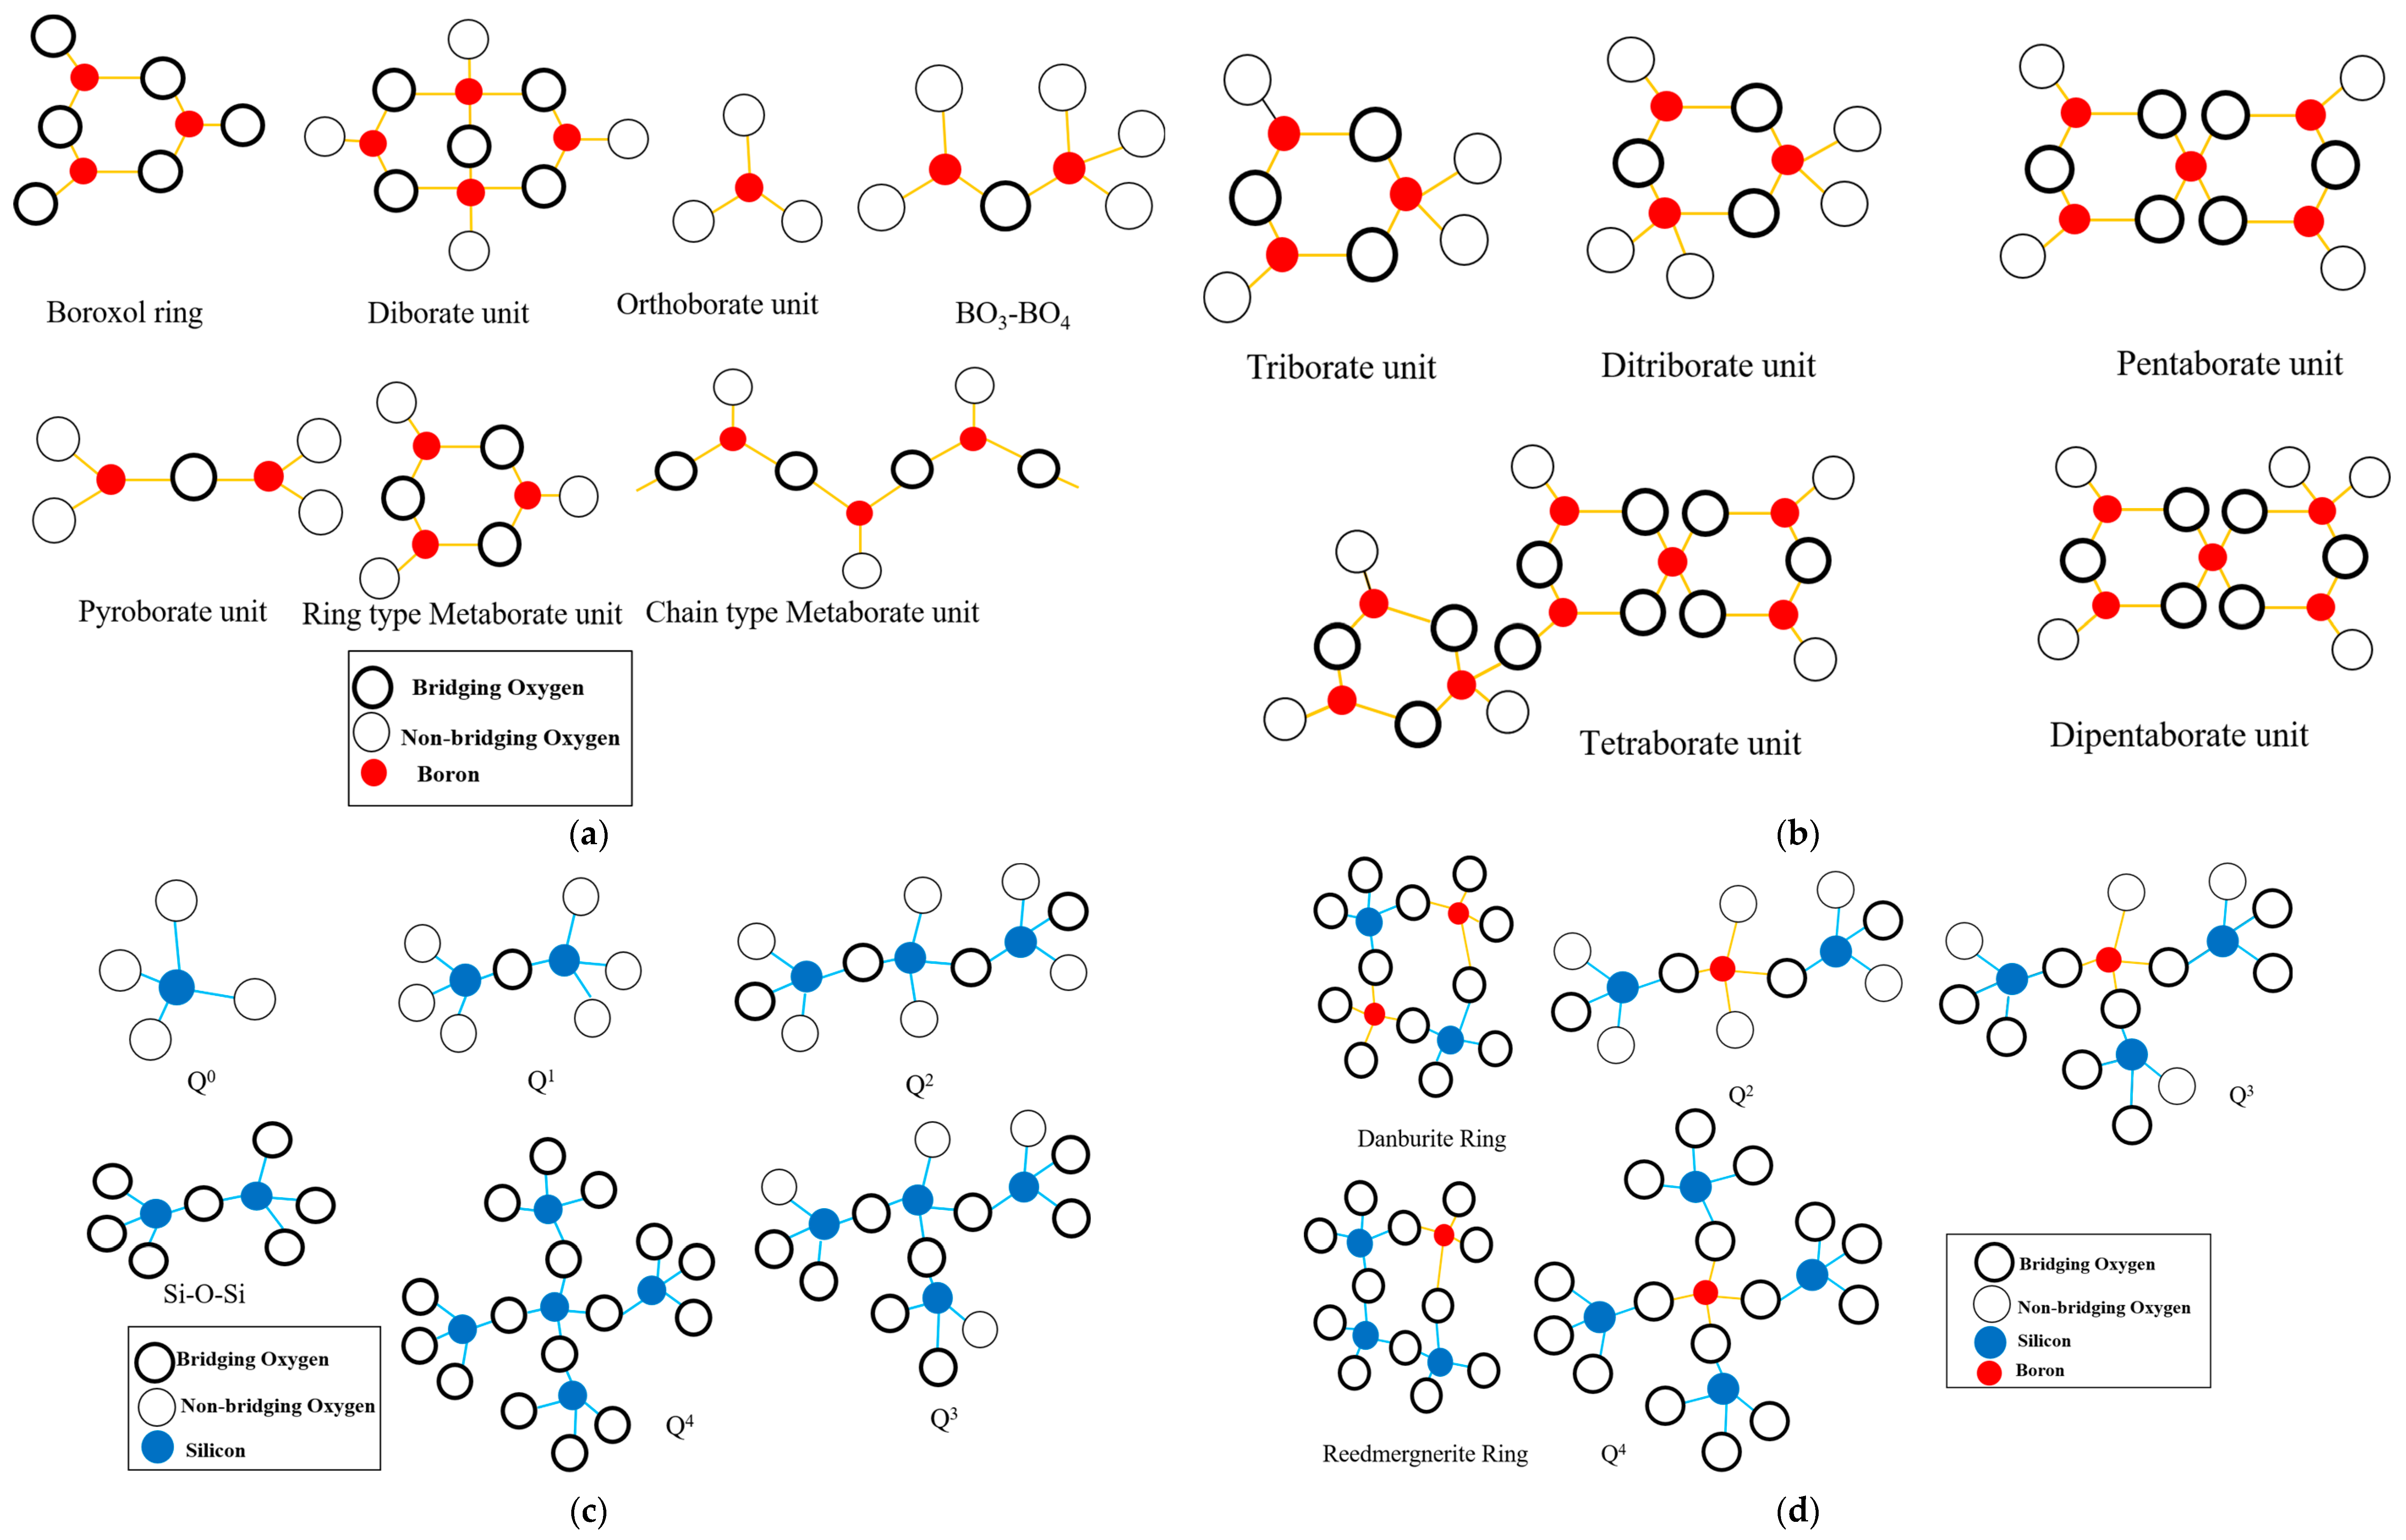
2.3.1. Borate Glasses

The Raman spectra of borate glasses doped with alkali ions have been studied extensively, where various borate structural units have been assigned to specific spectral features [31,32,33,34,35,36]. Krogh-Moe’s work [37] indicates that vitreous B2O3 consists of a random network of linked boroxol ([B3O6]3−) rings and isolated BO3 triangles. In another study [33], a strongly polarized band near 806 cm−1 is attributed to the symmetric breathing in boroxol rings. In Kamitsos et al. [34], a weak, broad band near 1260 cm−1 is assigned to the B-O stretch in BO3 triangles within both isolated rings and more polymerized borate networks. However, the introduction of alkali oxide, M2O (M = Li, Na, K, Rb, Cs), into the borate network generates diverse isolated poly-borate species. This structural transformation has been confirmed in multiple studies [31,32,33,34,35] investigating alkali borate glasses spanning a range of M2O concentrations. Mozzi and Warren’s findings [38] establish that the addition of M2O disrupts boroxol rings, altering the coordination of some boron atoms from 3 to 4, which leads to the formation of planar rings containing linked BO3 and BO4 configurations (i.e., diborate, triborate, tetraborate, pentaborate, etc.) [32]. This introduction of M2O gradually decreases the intensity of the 806 cm−1 band, and a new band emerges at 770 cm−1. For M2O concentrations exceeding 20 mol.%, the 806 cm−1 band disappears, while the 770 cm−1 band shifts to lower frequencies as the M2O content surpasses 30 mol.% [34]. According to Bril [39], the 770 cm−1 band is assigned to symmetric breathing vibrations of six-membered rings (in an alternating arrangement of three boron atoms and three bridging oxygens (BOs)), each with one BO4 tetrahedron and two BO3 triangles (i.e., triborate, tetraborate, pentaborate). At higher alkali contents, the 770 cm−1 band shifts to lower frequencies and is attributed to six-membered rings with two BO4 tetrahedra and one BO3 triangle (i.e., diborate, ditriborate, or dipentaborate).
An extensive Raman study of binary borate glasses across a wider range of alkali, M, concentrations [34] yielded comparable assignments for structural groups within the borate networks. For glasses with M2O compositions below 35 mol.% [40], the 770 cm−1 band corresponds to tetraborate, pentaborate, or triborate groups. In glasses with M2O concentrations ranging from 15% to 45 mol.%, the 1100 cm−1 band is attributed to diborate units [41,42]. For borate glasses with alkali contents exceeding 40 mol.%, isolated diborate groups are assigned to the 500 cm−1 band [42]. Similarly, in Kamitsos’ study [40] of magnesium sodium borate glasses, the presence of pyroborate (850 cm−1) and orthoborate (945 cm−1) are reported in accordance with the spectra of crystalline pyroborate and orthoborate compounds [31,43].
Dwivedi et al. [44] studied xLi2O•(1−x) B2O3 glasses at 0.1 < x < 0.5, where 760–780 cm−1 features are assigned to breathing vibrations of six-membered rings containing both BO3 triangles and BO4 tetrahedra (e.g., ditriborate and dipentaborate units). A band near 855 cm−1 is assigned to pyroborate units, where x ≥ 0.25. A broad band near 500 cm−1 is also assigned to pentaborate, tetraborate, and diborate units, which shifts to near 550 cm−1 as the alkali content increases. In another study of lithium borate glasses [32], the 550 cm−1 band is also assigned to diborate units at 50 mol.% Li2O.
Konijnendijk and Stevels [32] studied the Raman spectra of xM2O• (1−x) B2O3 glasses, where M = Na and K, and 0.05 ≤ x ≤ 0.35. They observed that the introduction of M2O up to 20 mol.% disrupts boroxol ring formation, resulting in the creation of tetraborate groups. As the M2O content increases, tetraborate groups (assigned to the 770 cm−1 band) transform into diborate groups, corresponding to the 755 cm−1 band. However, recent research on lithium diborate (Li2O•2B2O3) glasses [34] has questioned the 755 cm−1 diborate assignment and has instead assigned internal diborate displacements to a band near 1100 cm−1. Additionally, various other structural units with non-bridging oxygens (NBOs), such as pyroborate (840 cm−1), orthoborate (940 cm−1), ring-type metaborate (630 cm−1), and chain-type metaborate (730 cm−1), are created, where the alkali content is greater than 30 mol.% [32,33,34]. In a study of Cs2O•B2O3 glasses, Kamitost et al. [35] similarly assign 725, 675, and 625 cm−1 bands to chain-type metaborate groups based on comparisons with the spectra of crystalline Li2O•B2O3, which contains these structural units.
The Raman scattering observed in the high-frequency region (1300–1500 cm−1) corresponds to the B-O stretching vibrations. These vibrations specifically involve NBOs and are integral components of a connected borate network. The band centered around 1400 cm−1 is assigned to BO3 units bonding to BO4 units, while the band at around 1480 cm−1 is assigned to BO3 units bonding to other BO3 triangles [30,31,32,33,45], which has also been used for borosilicate glasses [45,46].

2.3.2. Silicate Glasses

Silica glasses consist of a fully polymerized three-dimensional framework of SiO4 tetrahedra, and the addition of alkali oxide to the glass results in the depolymerization of the network and the creation of NBOs [13]. Larger NBO populations are linked with increasing alkali contents. Alkali silicate glass consists of various species of silicate tetrahedra with different numbers of BOs and NBOs. The Raman spectra of alkali silicate glasses can be divided into two frequency ranges depending on the type of vibrational modes associated with the spectral features [47,48,49,50,51]. The highly polarized broad envelope below 650 cm−1 is due to longer-range displacements within the silicate tetrahedral network, such as Si-O-Si symmetric bend modes [47,48]. In contrast, the envelope between 850 and 1140 cm−1 is comprised of four to five component bands assigned to localized Q-species Si-O stretch modes within SiO4 tetrahedra linked to zero to four neighboring silicate tetrahedra (Q0 to Q4 units), respectively [51]. Components between 1040 and 1140 cm−1 have been assigned differently. McKeown et al. [50] reported that a component at 1100 cm−1 is due Q3 species. On the other hand, when studying xLi2O•yNa2O• (100−xy) SiO2 glasses where (x = 23, 12; y = 11, 22), Seuthe et al. [52] suggest that Q3 modes are assigned to two bands near 1040 cm−1, and Q4 units are assigned to a component near 1140 cm−1. By fitting Gaussian components to this Q-species envelope, Zotov and Keppler [53,54] determined that the component peaks near 950, 1020, 1080, and 1140 cm−1 are due to the Q2, Q3′, Q3″, and Q4 Si-O stretch modes, respectively. A Q3′ tetrahedron is connected to several combinations of Q3 and Q4 tetrahedra, where at least one of the three nearby tetrahedra is Q3′. On the other hand, Q3″ units are connected to three Q4 tetrahedra [51].

2.3.3. Borosilicate Glasses

Regarding borosilicate glasses, the Raman spectra have vibrational components originating exclusively from the borate or silicate structural units, as well as from structural units containing linked borate and silicate polyhedra. Raman features within the 450–800 cm−1 frequency range stem from longer-range bond-bending vibrations occurring in various BO environments, including Si-O-Si [47], B-O-B [55], and B-O-Si [47,55]. The band near 550 cm−1 is attributed to the Si-O-Si bending vibrations [47,48]. Manara et al. [45] observed a prominent band near 586 cm−1 in the spectra of Na-borosilicate glasses and assigned this feature to a breathing mode within reedmergnerite rings comprised of three SiO4 tetrahedra and one BO4 tetrahedron [55,56]. The mineral, reedmergnerite, has its most intense Raman peak at 586 cm−1 [57]. Similarly, another borosilicate structure to consider is the danburite ring, which has two SiO4 tetrahedra and two BO4 tetrahedra [56]. The mineral, danburite, has its most intense Raman peak at 614 cm−1 [58,59]. As a result, Manara et al. [45] report a band near 630 cm−1 for their Na-borosilicate glasses that may correspond to the breathing mode of danburite rings.
At higher frequencies, two broad Raman envelopes are observed. In the 850–1250 cm−1 frequency range of the silicate Q-species, it is likely that some contributions come from Si-O and B-O stretching within mixed Q-species modes, including SiO4 and BO4 tetrahedra. In the 1300–1500 cm−1 range, the band centered around 1380 cm−1 is assigned to BO3 units bonded to BO4 units, while the band at around 1475 cm−1 is assigned to BO3 units linked to BO3 units, as seen in alkali borate systems. Indeed, in the alkali borosilicate glass system, the glass network is comprised of silicate or borosilicate Q-species units, possibly linked to BO3 triangles in varying proportions determined by silica, borate, and alkali contents [45,55,60].

2.4. Spinodal Decomposition in Glasses

Alkali silicate and borosilicate glasses have historically been known to exhibit phase separation [61]. During the cooling process, liquid silicate mixtures undergo phase separation into two distinct phases. This separation occurs as a kinetic process like nucleation or spinodal decomposition. Nucleation predominates when the volume fraction of particles is small, whereas spinodal decomposition occurs when the volume fraction of the separating phases is nearly identical, resulting in an interconnected structure [13].
The occurrence of phase separation is guided by the Gibbs free energy of the potential phases. In regions of the phase diagram where the second derivative of the Gibbs free energy with respect to composition is negative, there is no barrier to phase growth [62]. According to Cahn [62], this transformation proceeds through a continuous alteration in the composition of the growing phases while keeping their extent unchanged. The composition shift occurs within a regular three-dimensional array and continues until the compositions of the two phases reach equilibrium values, forming an interconnected structure. The properties of glasses change the phase separation. Notably, the electrical conductivity of a phase-separated glass increases, mainly if the phase with higher conductivity forms a continuous network.

3. Experimental

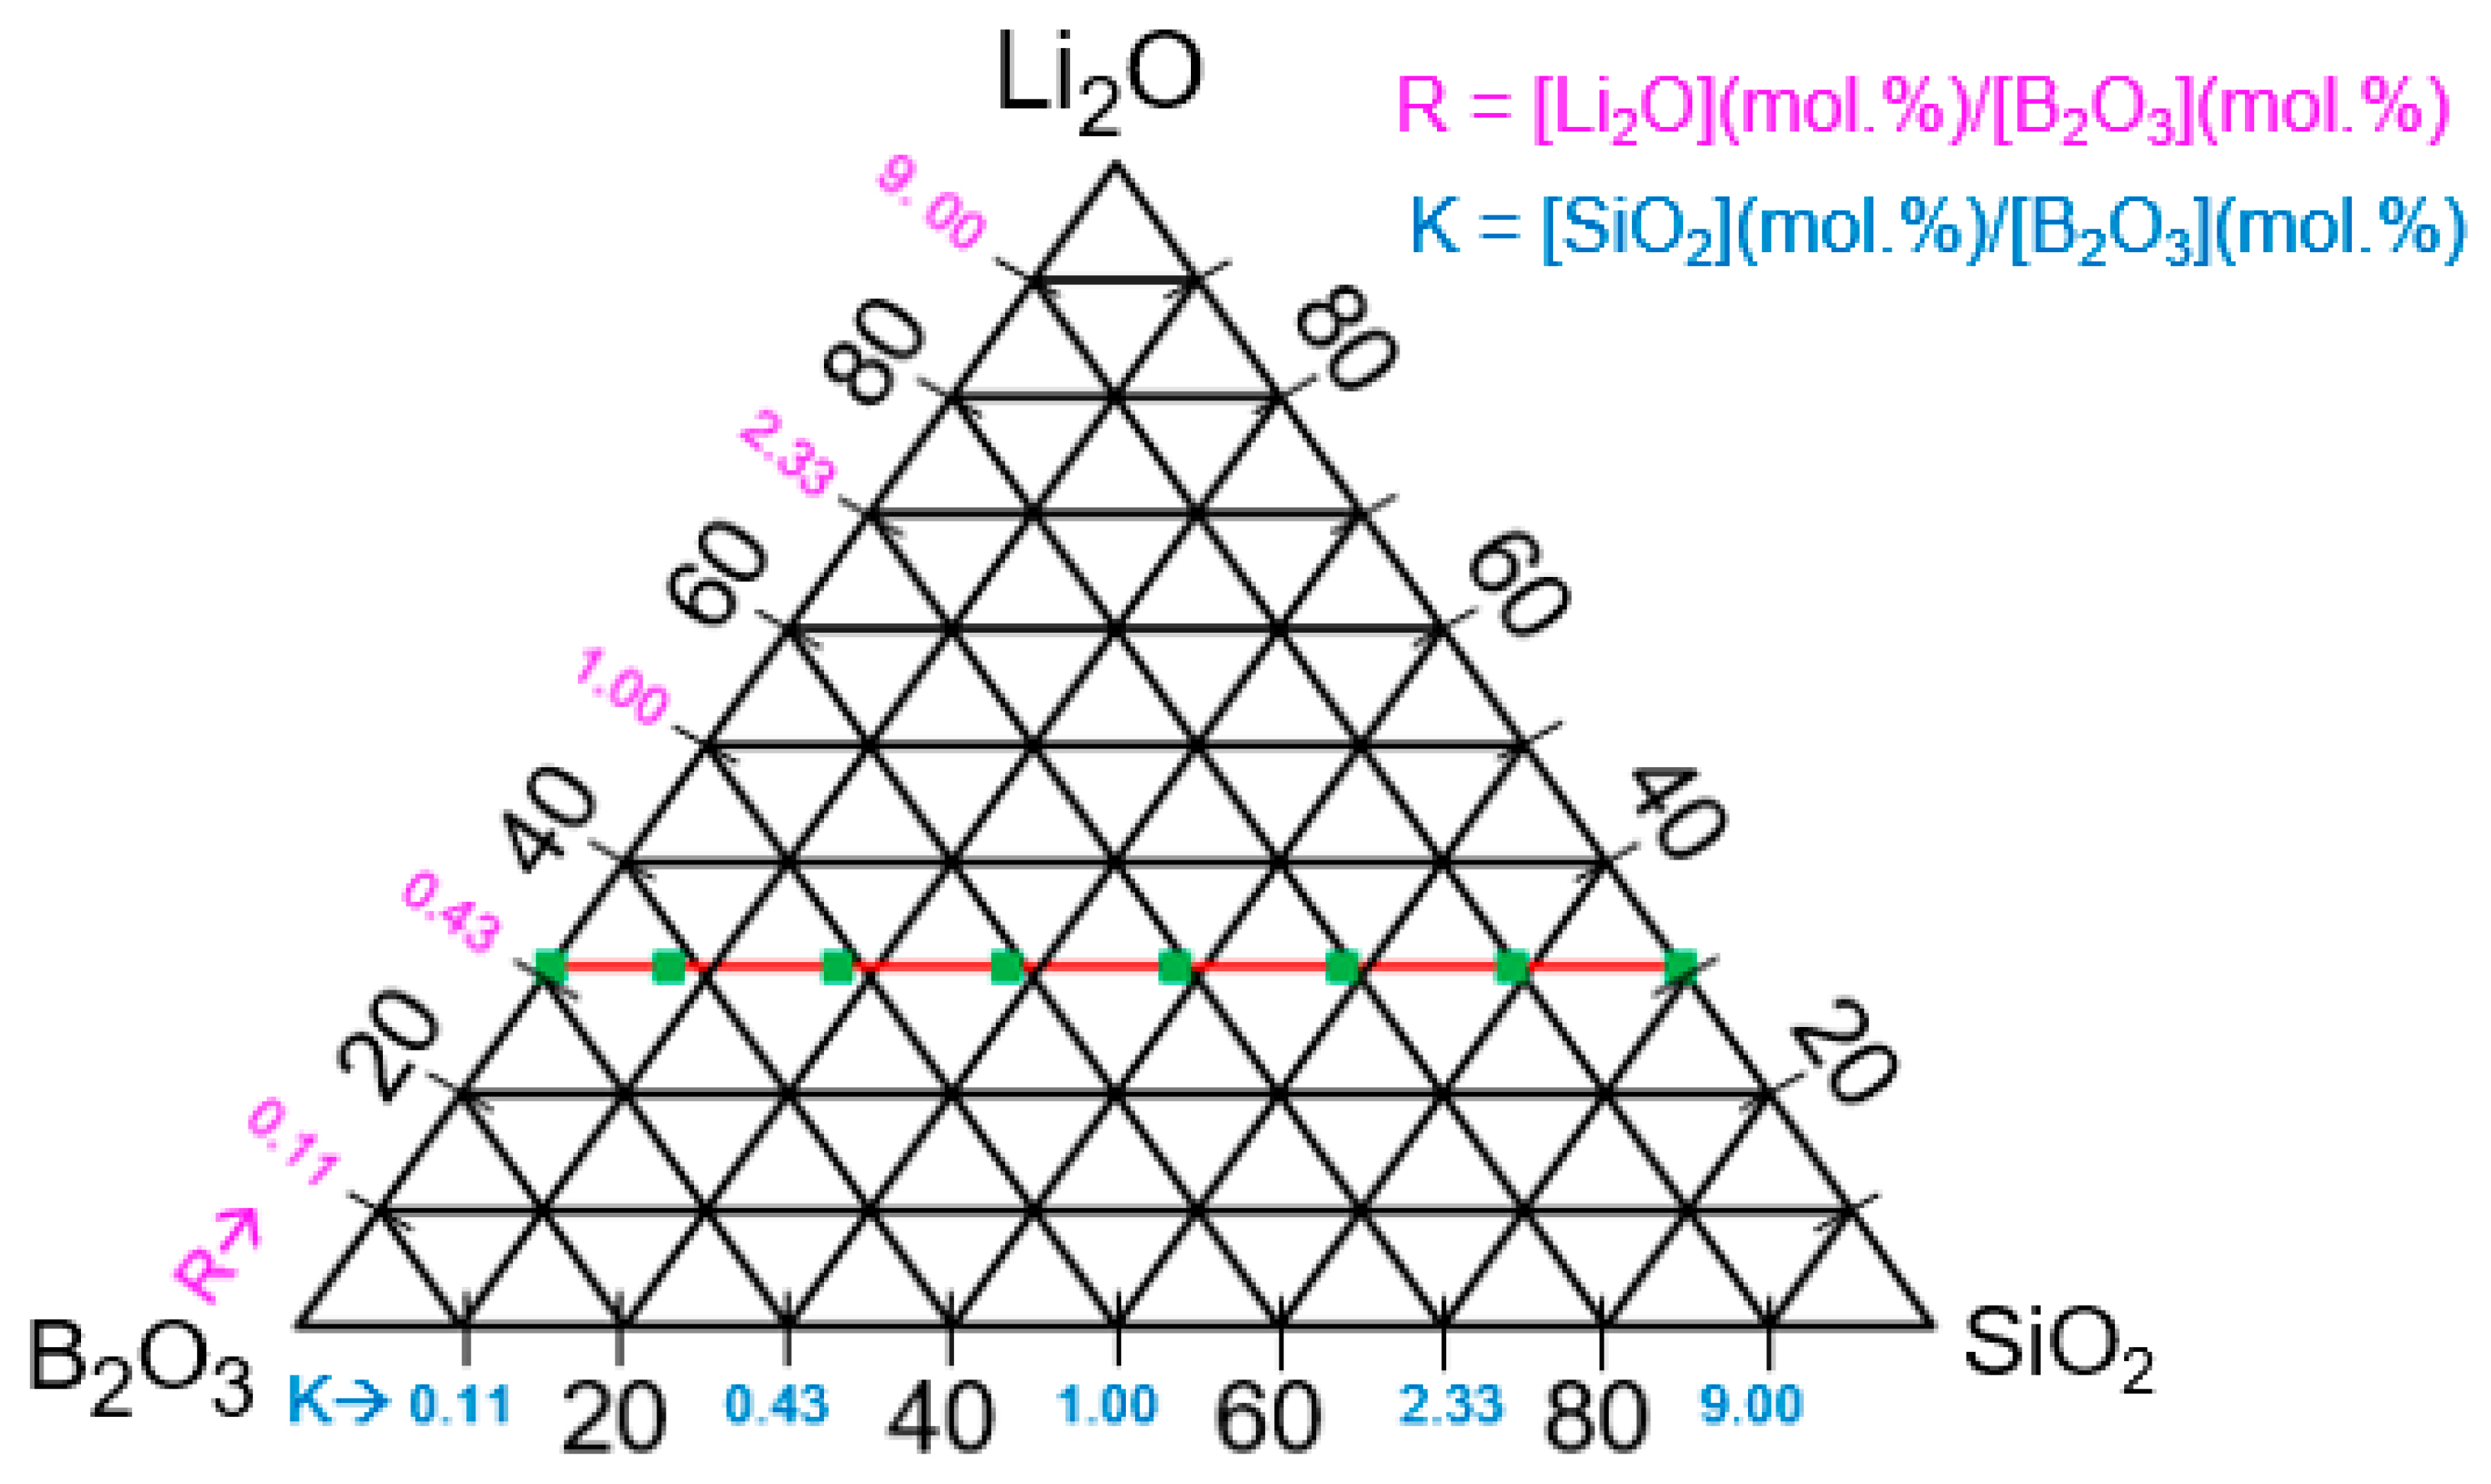
3.1. Glass Synthesis

A glass series with the nominal composition 30Li2O•(67−x) •B2O3•(x)SiO2•3Al2O3, with x = 0, 7, 17, 27, 37, 47, 57, 67, was prepared using conventional melting and quenching methods. Reagent-grade chemicals including Li2CO3 (Alfa Aesar, Thermo Fisher Scientific, Ward Hill, MA, USA), SiO2, B2O3 (Sigma Aldrich, St. Louis, MO, USA), and Al2O3 (Alfa Aesar) were mixed in various stoichiometric ratios. Each mixture was melted in an alumina crucible placed in a Deltech Inc., Denver, CO, USA, (DT29-BL56-E2404) furnace. The glass was formed by quenching the corresponding viscous melt between two copper plates. The series end-member glasses are named 67B and 67Si to signify lithium alumino-borate and lithium alumino-silicate glass, respectively. The other glasses are labeled as 67−xBxSi, with the x-values outlined above (Figure 1).
X-ray diffraction (XRD), X-ray fluorescence spectroscopy (XRF), and differential thermal analysis (DTA) were all performed using glass powder produced after crushing and grinding a few pieces of each quenched glass. For Raman and electrical conductivity measurements, we used 1 mm uniform thickness 2000-grit polished glass fragments. XRD measurements from 10° to 80° 2θ were performed using a Rigaku Americas, The Woodlands, TX, USA, SmartLab-SE θ-θ diffractometer that verified the glass samples were amorphous. XRF analyses were run on each glass to determine the chemical composition using a PANalytical Wavelength dispersive Axios max advanced system with SuperQ4 analysis software. Lithium and boron characteristic XRF lines are too low in energy to be routinely measured by the system. As a result, Li2O and B2O3 target concentrations from each glass recipe are listed in Table 1.
DTA curves were obtained using a Perlin Elmer DAT7 system at a heating rate of 10 °C/min from 200 °C to 1000 °C (Figure 2). DTA system calibration was performed using quartz, alumina, and gold standards. The glass transition temperature was determined from the onset of the increase in the DTA signal (mW) of the DTA scan (Table 1).

3.2. Electrical Conductivity Measurements

DC resistivity (ρ) was measured for each sample under ohmic conditions using an MMR Technologies H50 van der Pauw four-probe apparatus [63] that was scanned from 50 to 170 °C to a standard uncertainty of 0.5 °C. Silver electrodes were attached to the top edges of each sample using silver paste. Each sample was then mounted on the top of a Watlow ceramic heater with thermal grease. The current was varied from 10−6 to 10−11 A, and the apparatus temperature was scanned from 170 to 50 °C. All electrical measurements were performed in a vacuum below 8 to 10 millitorr. The reciprocal of the resistivity obtained from the measurement provides the glass conductivity values. The relative uncertainty is 5.5% of the measured conductivity value (Figure 3).
The activation energy for the electrical conduction is obtained from the slope of the Arrhenius plots (Figure 4) [17] to a standard uncertainty of 0.02 eV (Figure 5).

3.3. Raman Spectroscopy

Raman spectra were gathered on polished glass pieces using a WITec alpha-300 RA+ micro-Raman system with a 532 nm solid-state DPSS laser. An 1800 gr/mm grating was used to disperse the Raman signal onto a 1024 × 128 element Peltier-cooled CCD camera (Andor Technology, Model DV401A-BVF-352, Belfast, UK). A 50× Zeiss objective was used for data collection, producing a ~1 µm diameter laser spot on the sample. A laser power of 36 mW was measured at the sample position. An analyzer polarizer was inserted into the Raman-scattered light path, while the incident laser light polarization could be rotated to be parallel or perpendicular with respect to the scattered light polarization direction to collect parallel and cross-polarized spectra, respectively. The spectra were the frequency calibrated to the Si 520 cm−1 mode. The parallel polarized Raman spectrum for each glass was reduced and rescaled [64] for the purposes of comparison and analysis (Figure 6).
The reduced parallel polarized spectra were then fitted with Gaussian peak functions using the program IGOR [65]. To interpret these spectra, we employed a fitting procedure involving 13 Gaussian components. Fitting of the 10 highest-frequency Gaussian components to the experimental spectra allowed us to provide a vibrational assignment to each component, as outlined in the literature [31,32,33,34,35,36,37,38,39,40,41,42,43,44,45,46,47,48,49,50,51,52,53,54,55]. We ignore spectral trends below 400 cm−1 due to the dominance of Rayleigh-scattered intensity that contain little, if any, structural information. Initially, we focused on the two end members of the glass series. By determining the Gaussian peak parameters to the spectral features for these two glasses, we determined trends with respect to the composition for the whole glass series. Subsequently, Gaussian component vibrational assignments were checked to ensure consistency with those from the literature for borate [31,32,33,34,35,36,37,38,39,40,41,42,43,44], silicate [47,48,49,50,51,52], and borosilicate [45,55,66,67] glasses (Figure 7a–d).

4. Results

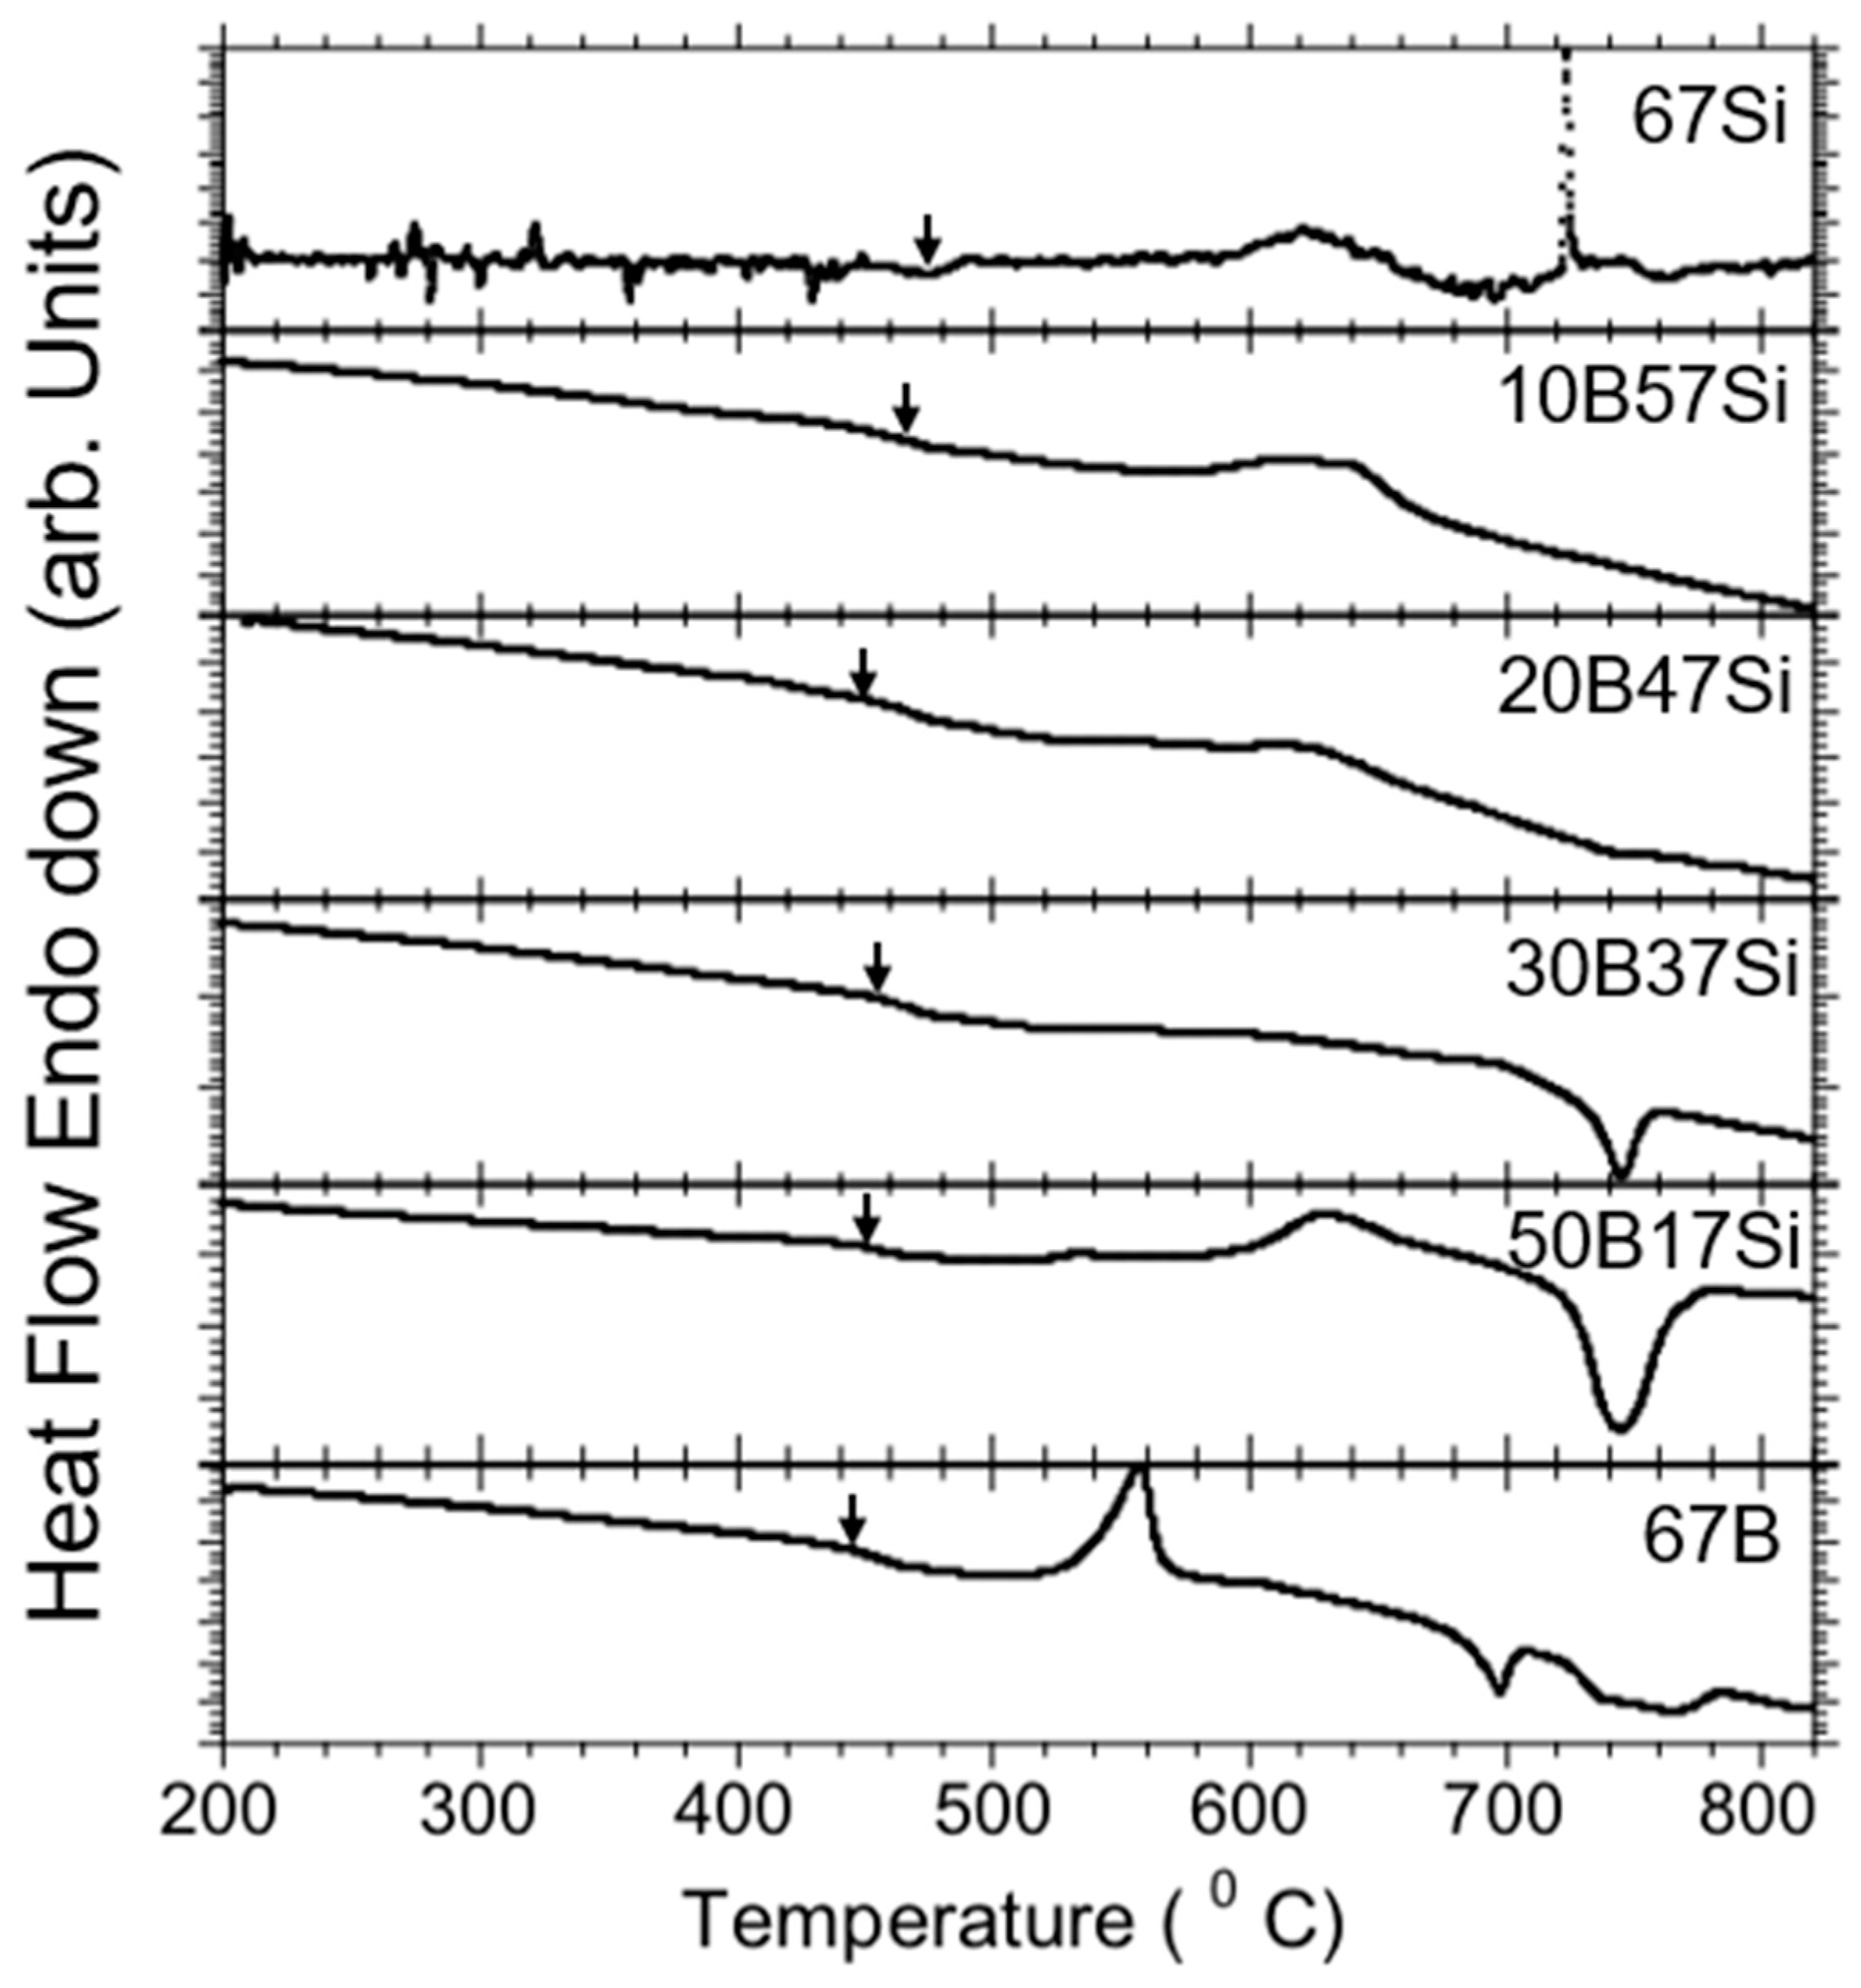
4.1. Glass Transition Temperature (Tg)

Tg can be regarded as being proportional to bond strength and polymerization within a glass structure [13]. In general, for the glass series studied here, Tg increases with silica content, indicating an overall increase in bond strength (Table 1, and Figure 5), which would be anticipated as more weakly bonded and isolated borate units are replaced by more polymerized silicate tetrahedra. However, Tg has a localized maximum at 40B27Si glass and then rises significantly to the silicate glass end member. This non-linear behavior indicates that the structure is undergoing a secondary transition near this composition, which may indicate more subtle structural changes compared those occurring for the whole glass series.

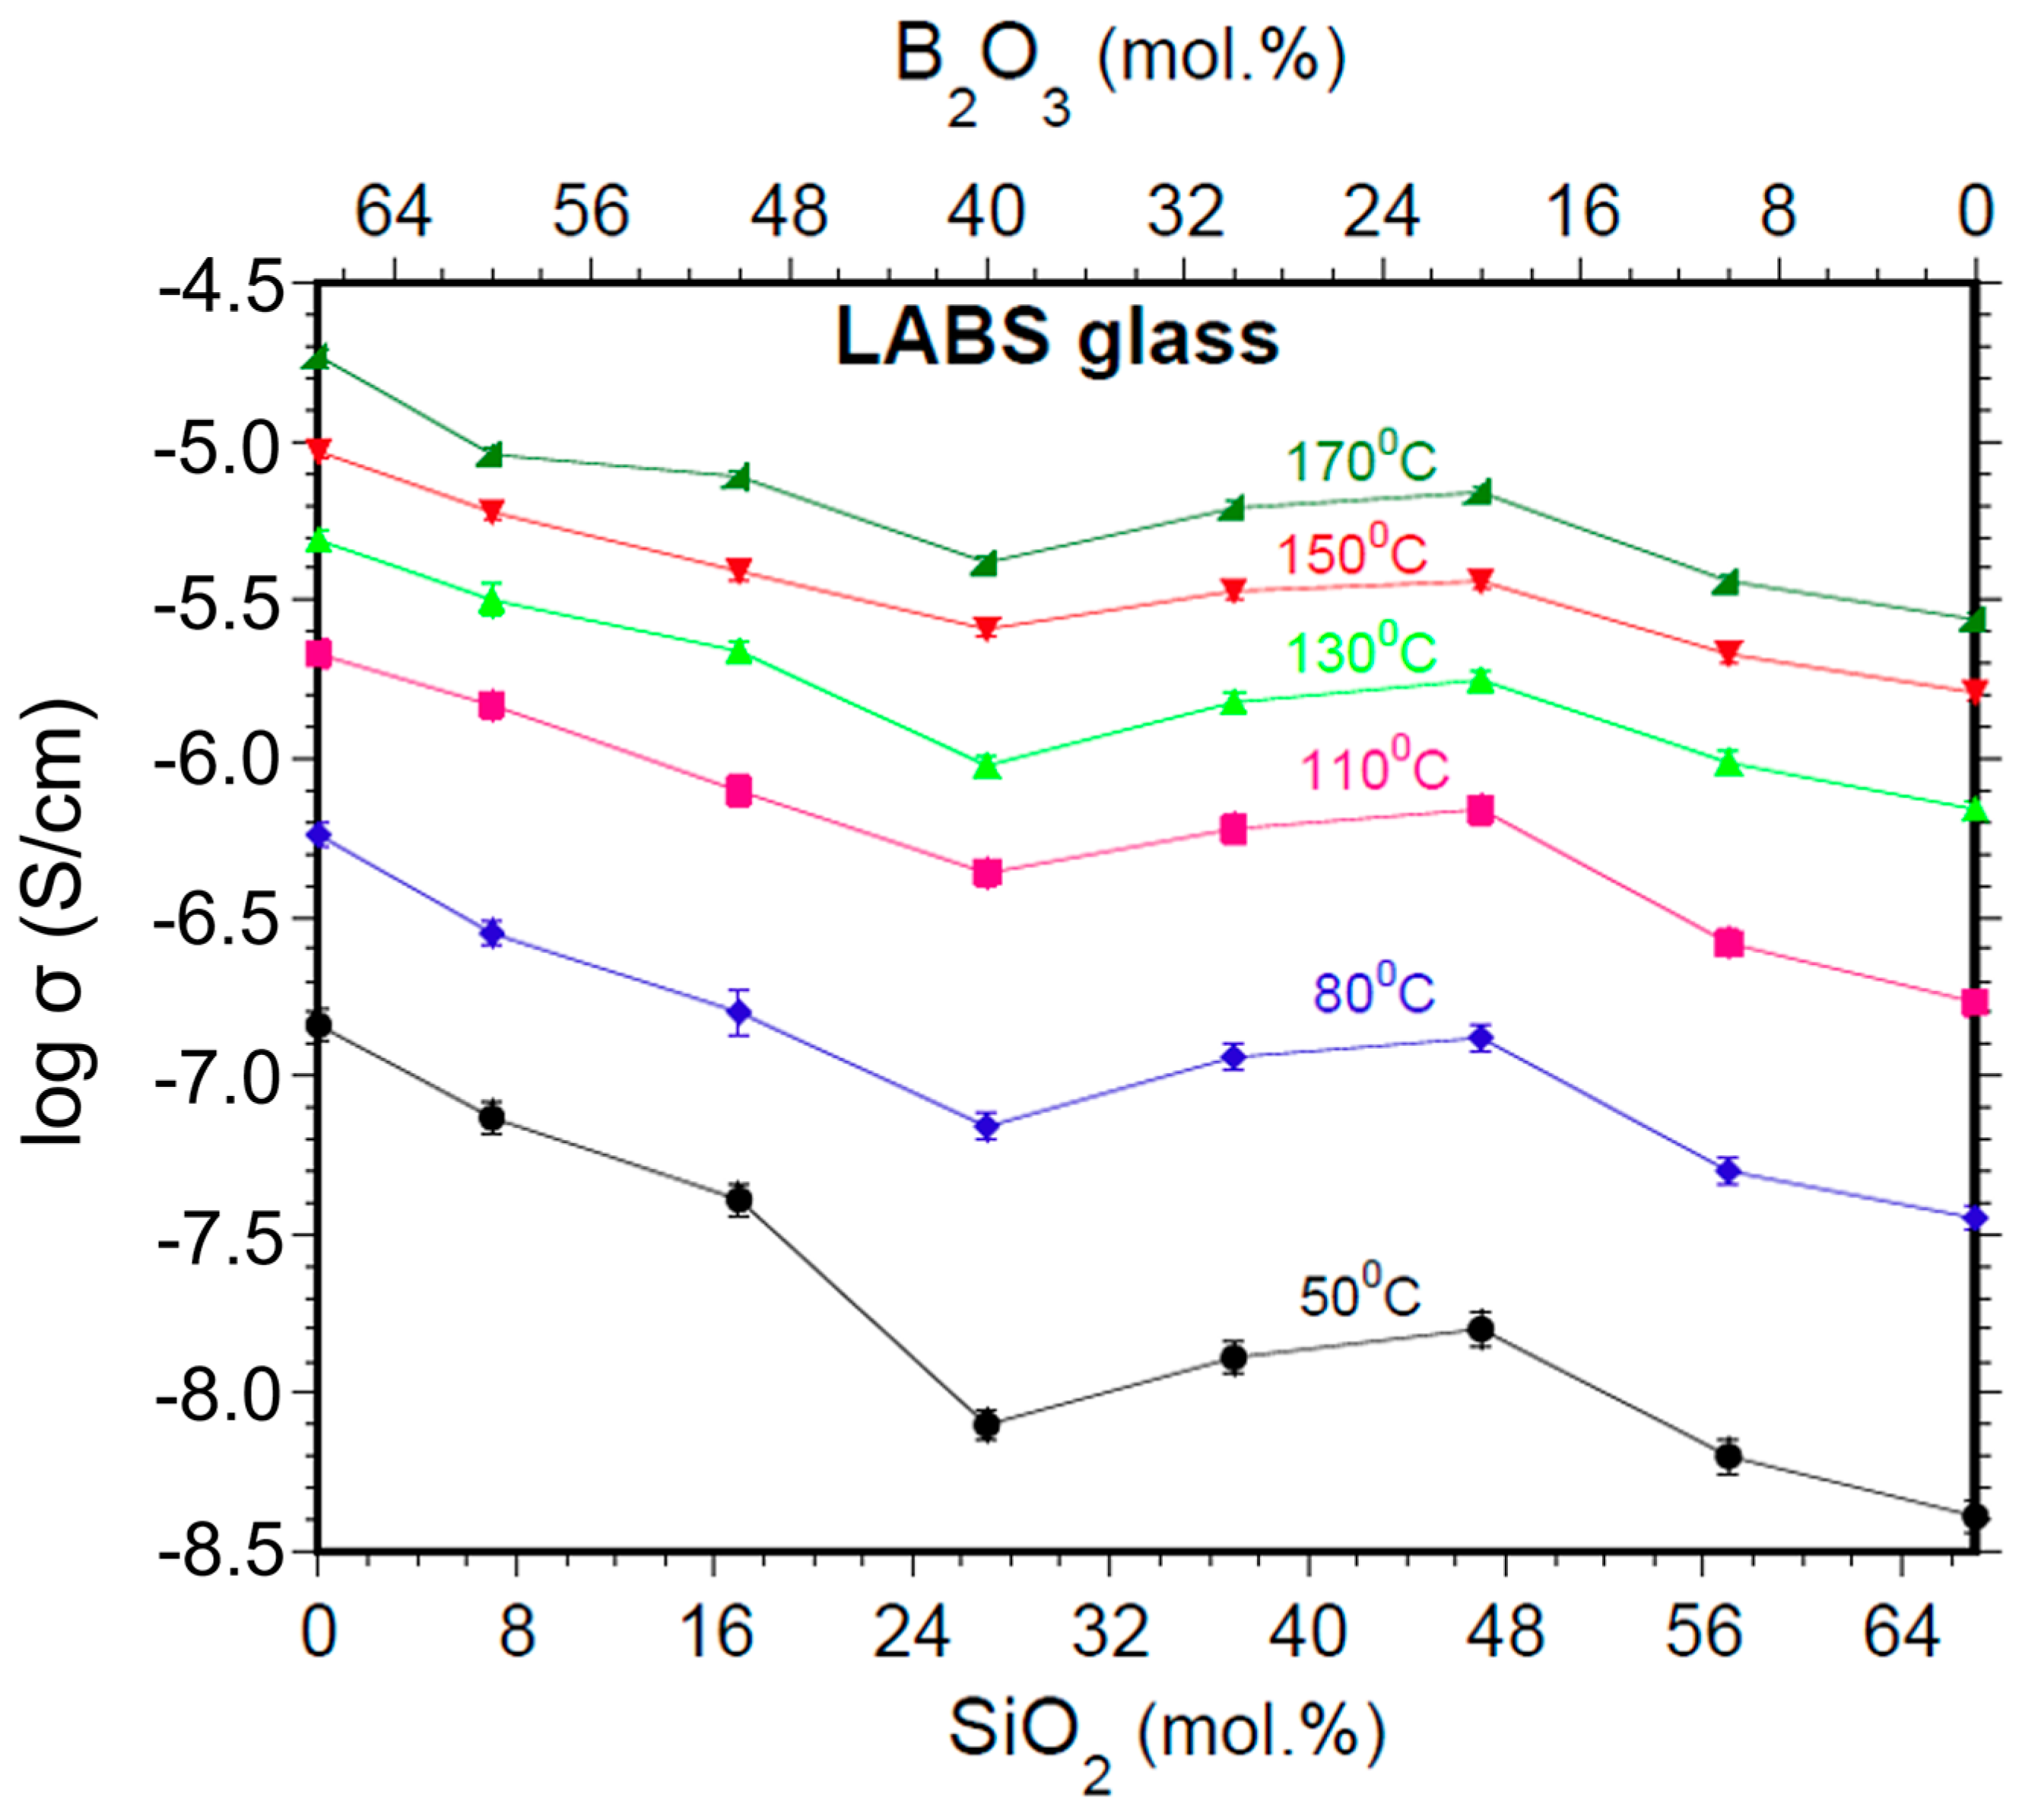
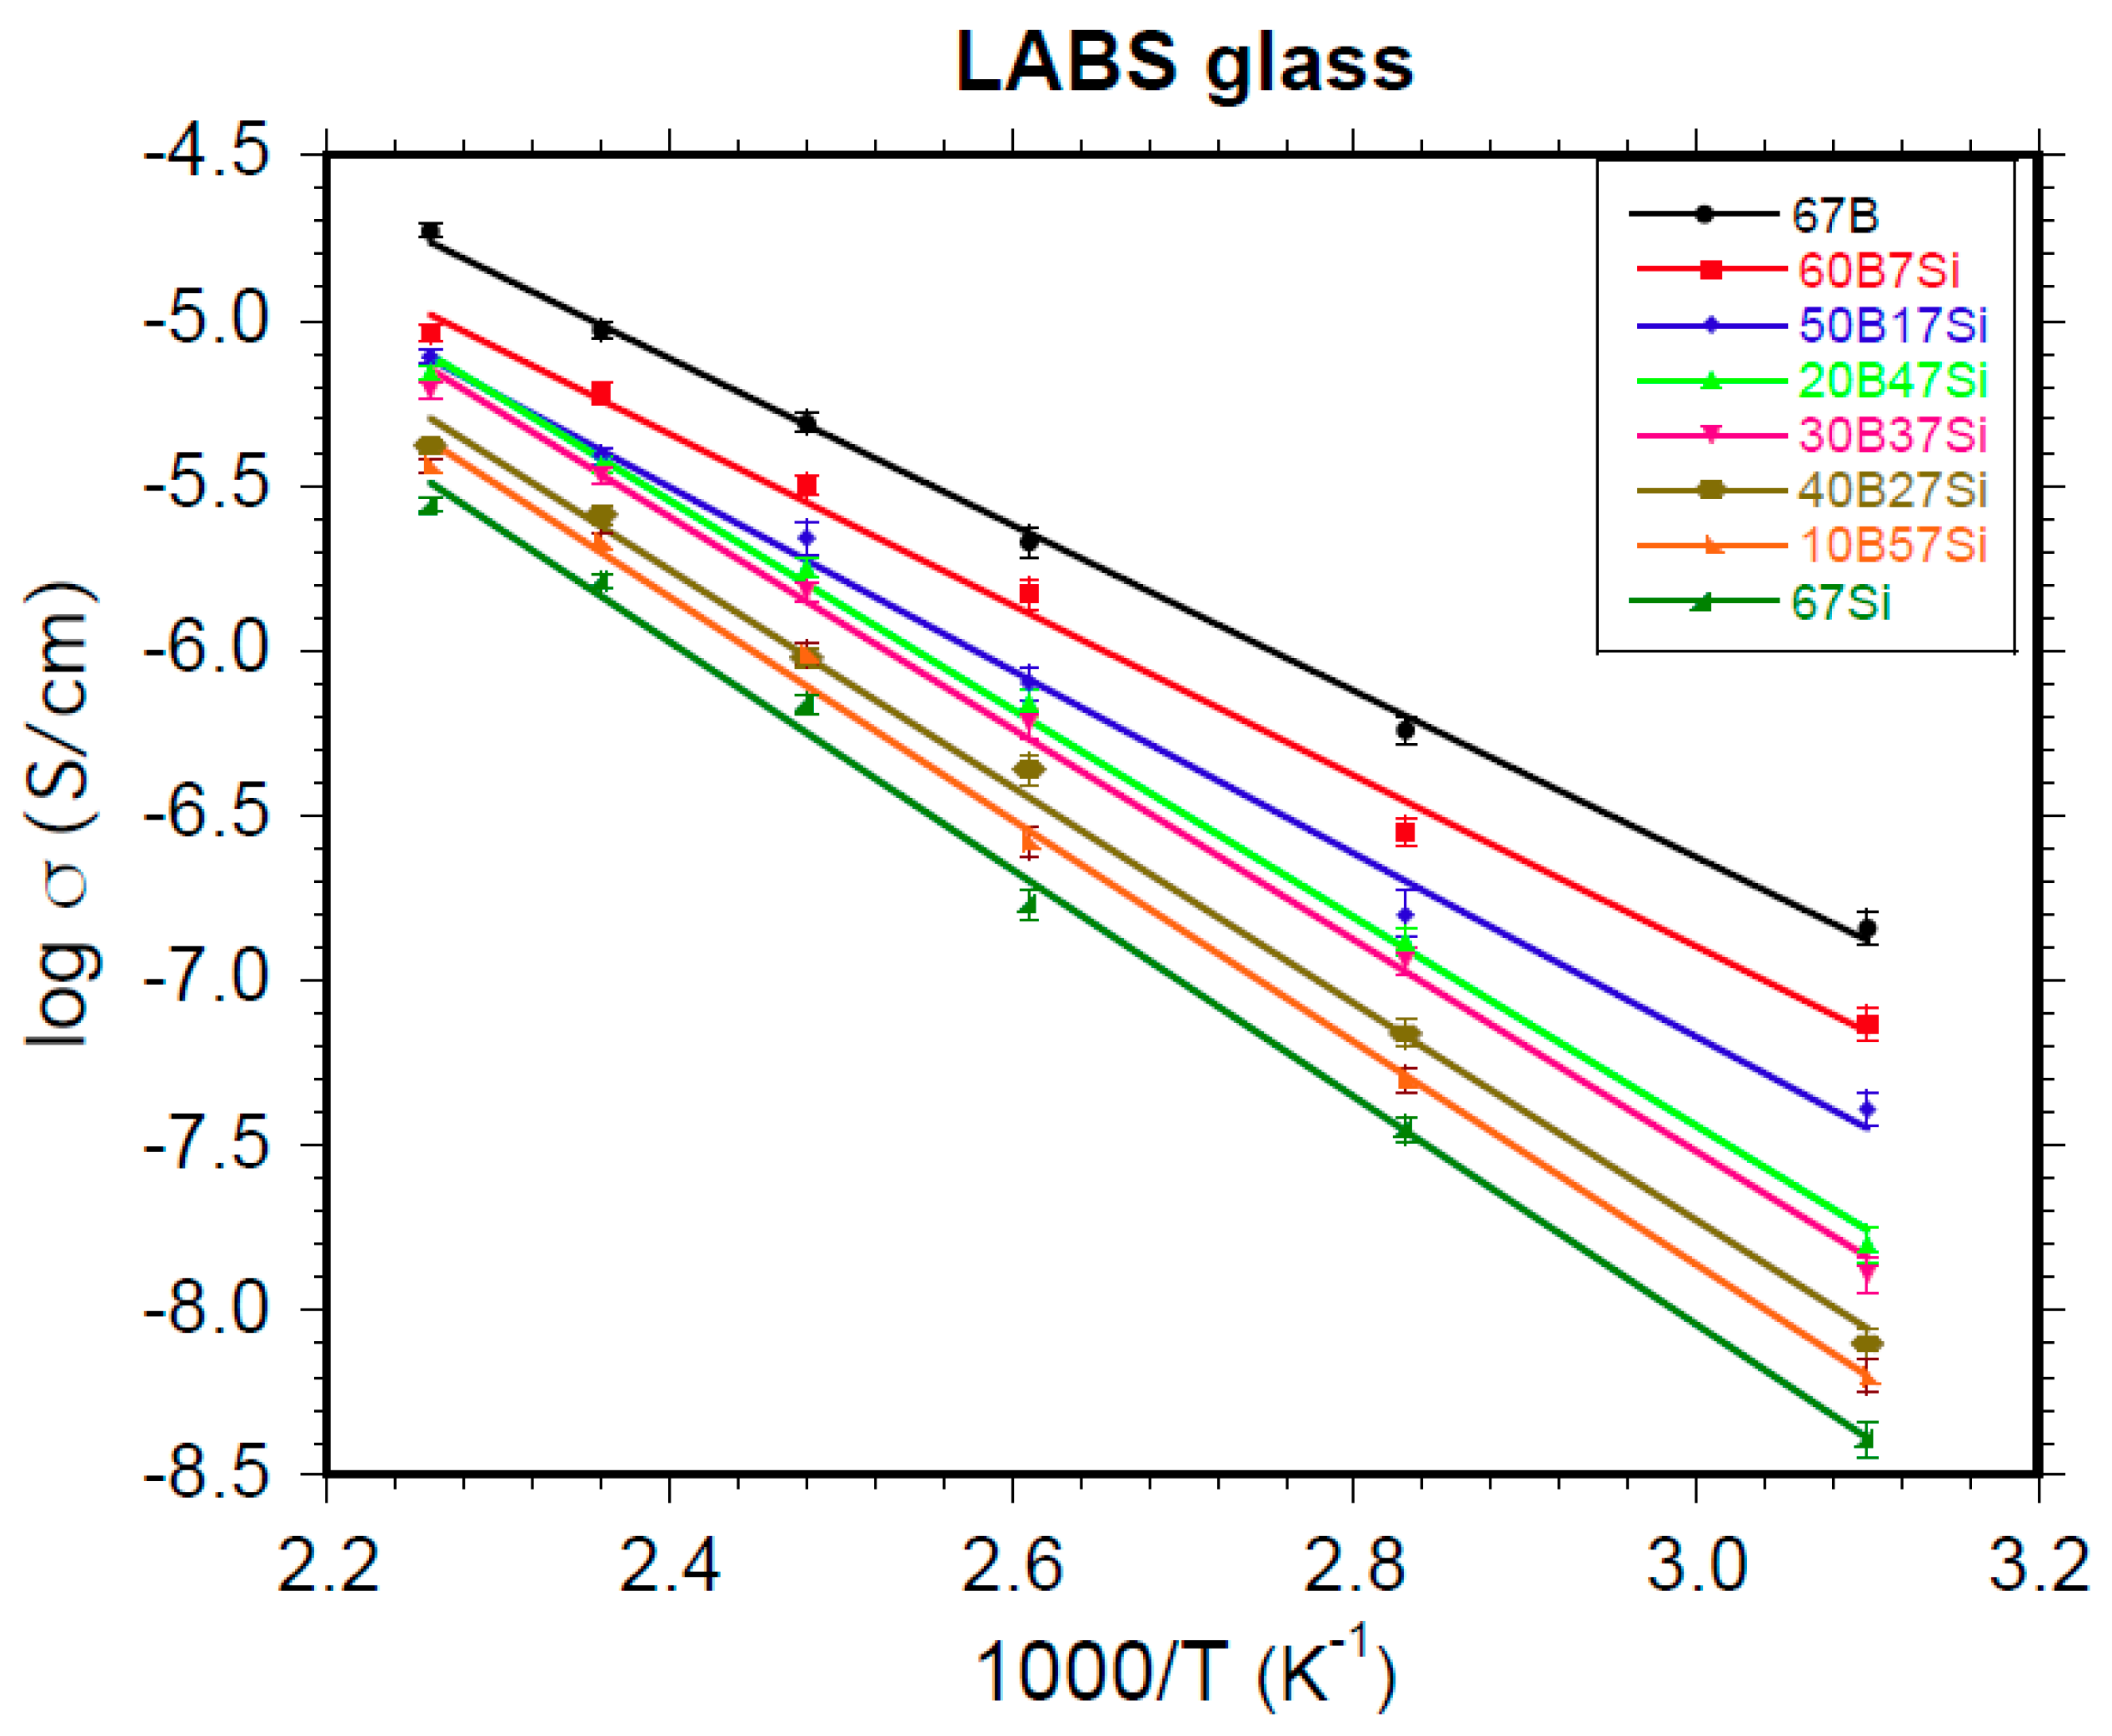
4.2. Electrical Conductivity (σ)

Electrical conductivity σ relationships with temperature can be shown in the log σ versus 1000/T plots (Figure 4), which are based on the Arrhenius equation. The plotted data confirm that temperature plays an important role in facilitating the mobility of Li+ charge carriers, such that increasing temperatures boost electrical conductivity in these glasses.
We generally observe a decrease in σ from boron-rich (67B) to silica-rich (67Si) glass (Figure 3). 67B glass has the highest σ (1.41 × 10⁻⁷ S/cm at 50 °C) with the lowest Ea (0.50 ± 0.02 eV), while 67Si exhibits the lowest σ (4.27 × 10⁻⁹ S/cm at 50 °C) with the highest Ea (0.68 ± 0.02 eV) in the 50 to 170 °C temperature range. We also observe a shallow minimum in σ for 40B27Si glass throughout this temperature range, indicating that some secondary structural adjustments are taking place compared with the overall structural changes across the glass series, where B is replaced by Si. This minimum generally becomes more pronounced at lower temperatures. As expected, there is a consistent increase in activation energy (calculated from σ) from 67B to 67Si glass, with a shallow maximum for 40B27Si glass (Figure 5).

4.3. Raman Spectroscopy

Reduced parallel- and cross-polarized Raman spectra for the glass series provide a basis for our glass structure determinations and corresponding structural changes with respect to glass chemistry. The parallel polarized spectra have more information and show continuous changes (Figure 6) that have been quantified by Gaussian fitting, where the Gaussian peak position and area results are presented in Table 2, Table 3 and Table 4. The general Raman spectral features and trends can be compared by dividing the spectra into borate-dominated, borosilicate, and silicate-dominated glass groups. According to vibrational assignments presented in the literature, we can group these spectral trends into 450–800 cm−1, 850–1250 cm−1, and 1300–1500 cm−1 frequency ranges.

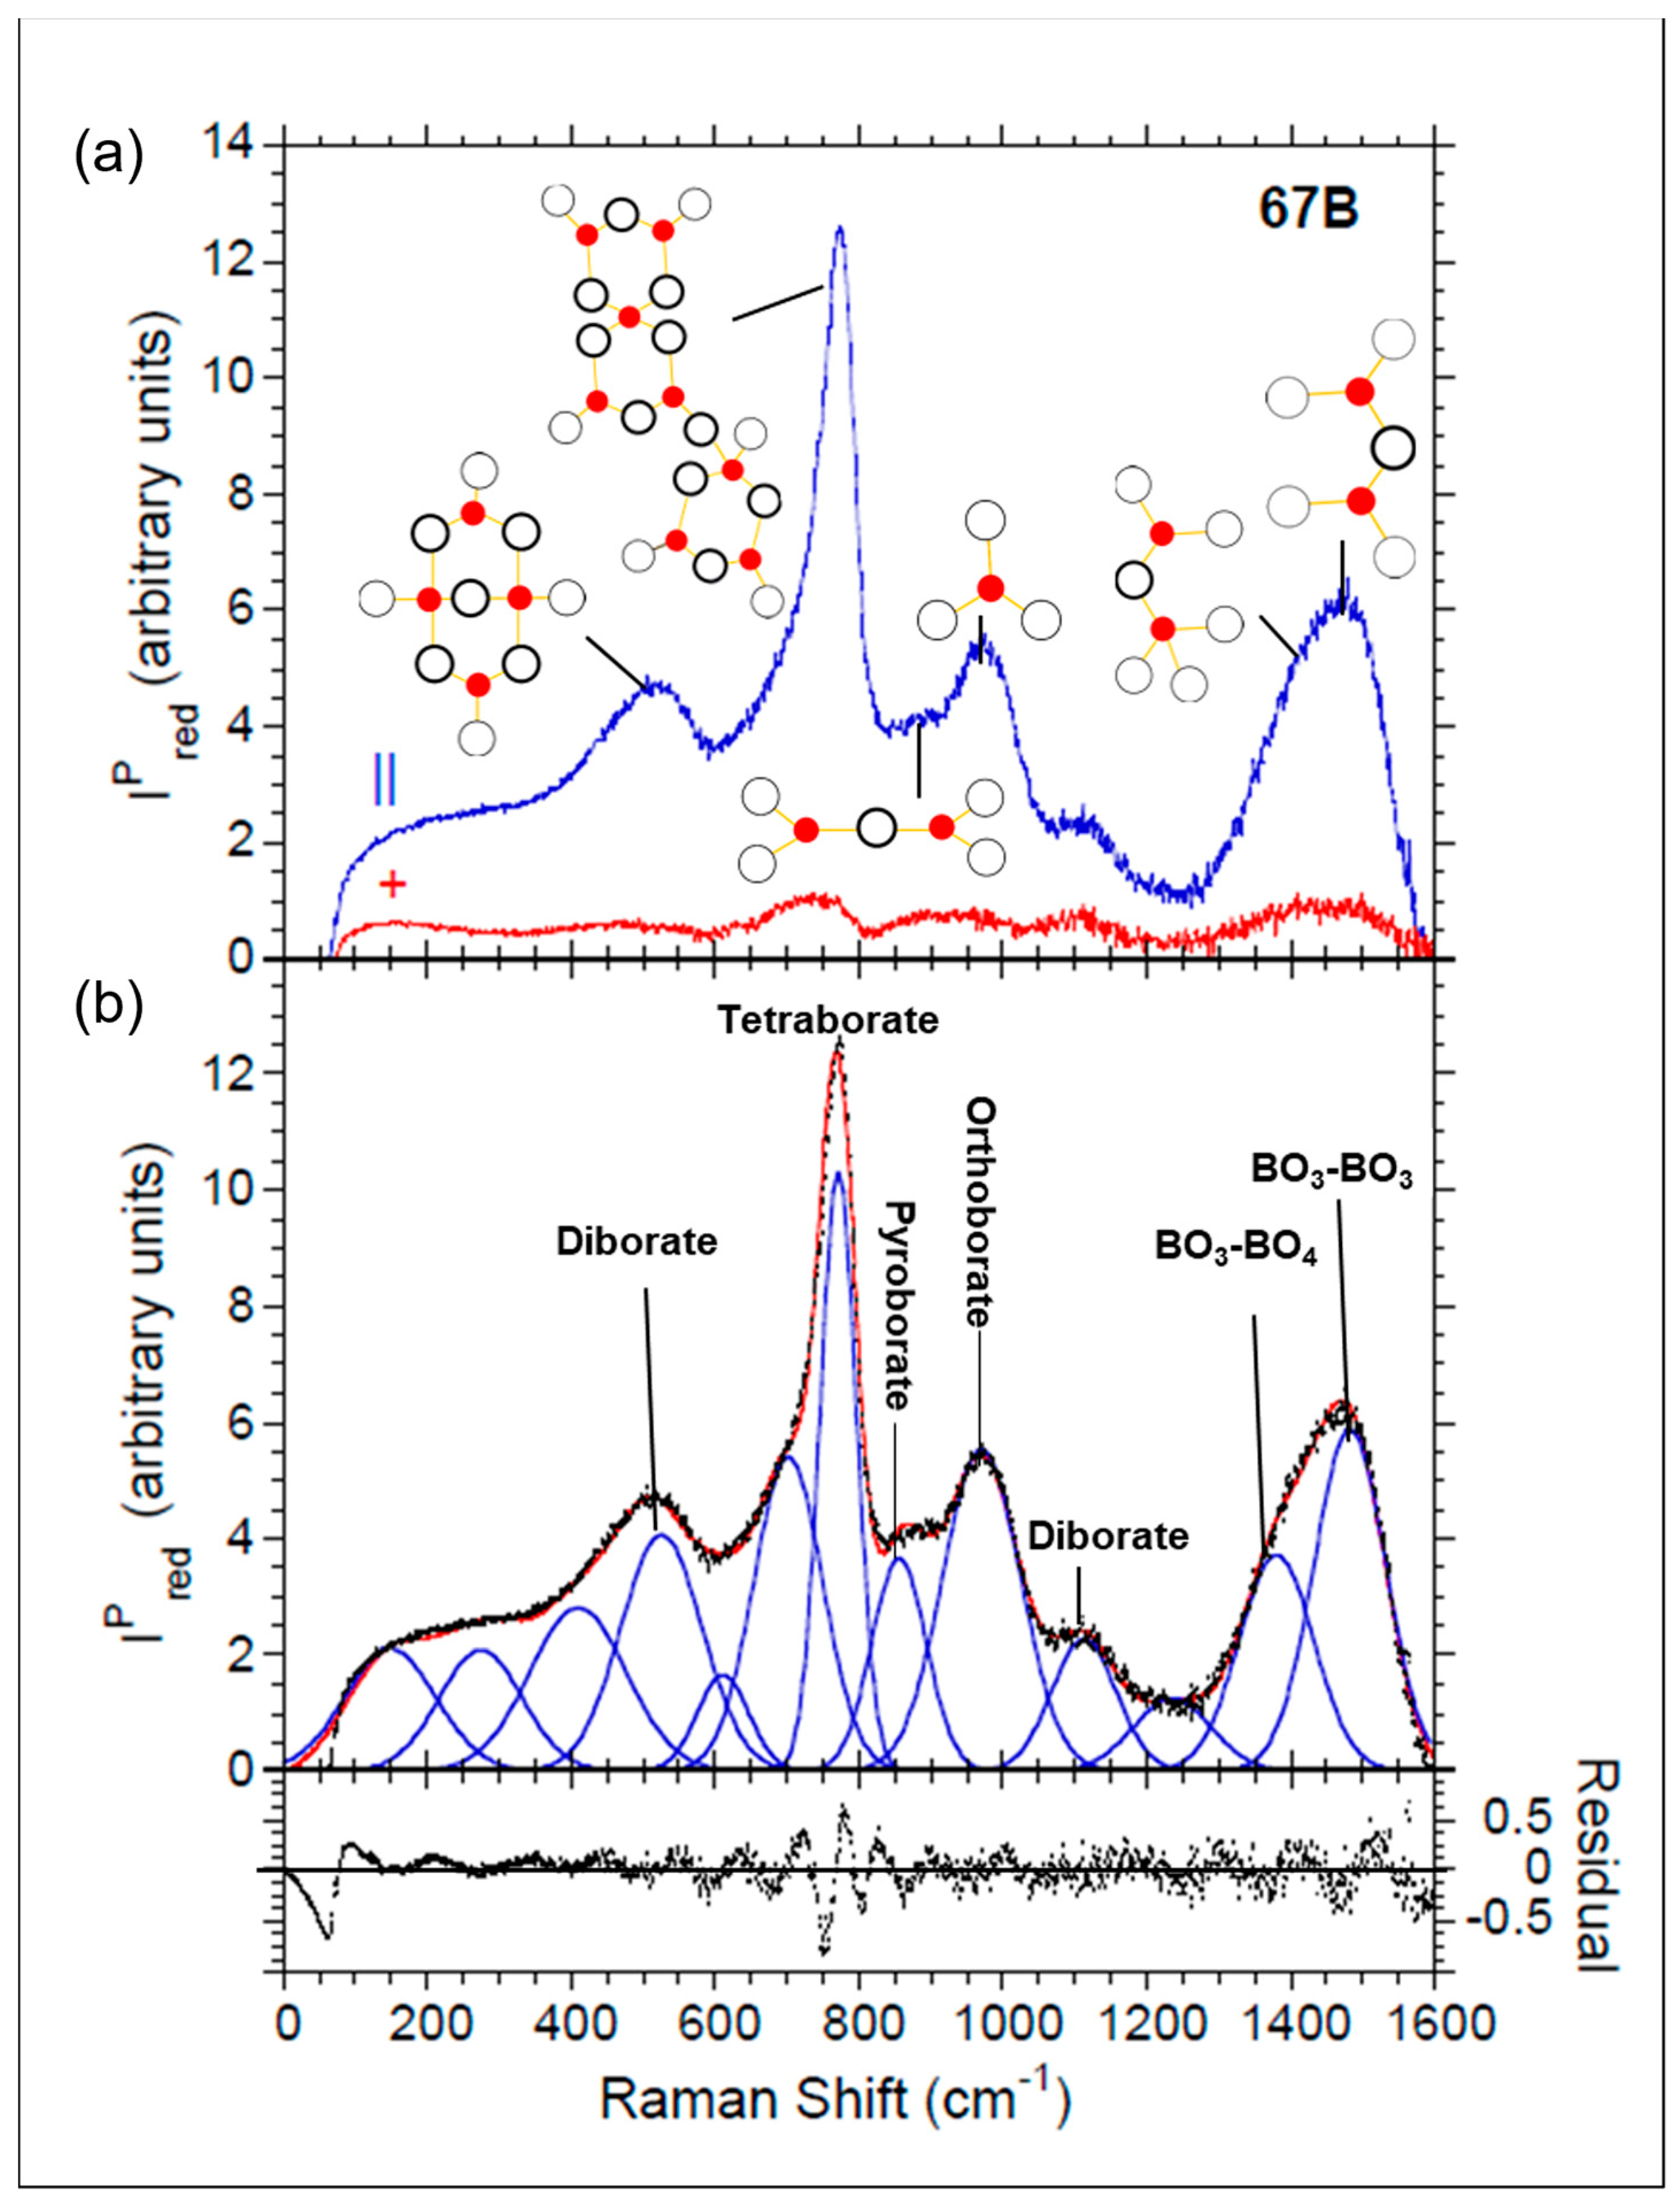
4.3.1. Borate-Dominated 67B, 60B7Si, and 50B17Si Glasses

The low-frequency range can be described by four Gaussian bands, centered near 527, 612, 703, and 772 cm−1 (Table 2). We assign the band near 527 cm−1 for 67B glass to diborate units (Figure 7a and Figure 8a,b) [29,41]. The minor peak near 610 cm−1 is assigned to ring-type metaborate units, while the band near 703 cm−1 is assigned to chain-type metaborate (polymerized BO3) modes (Figure 7a) [39,40]. The prominent 772 cm−1 feature has been assigned to tetraborate, pentaborate, or triborate groups (Figure 7b) in the literature [31,38,40]. Since tetraborate groups contain pentaborate and triborate configurations, we simplify our assignment of this 772 cm−1 band to symmetric vibrations within the linked tetraborate rings (Figure 7b).
In the 850–1200 cm−1 frequency range, the small band at 857 cm−1 for the 67B glass spectrum is assigned to pyroborate groups (Figure 7a) [35]. Based on Kamitsos’s study [42], we assign the band near 970 cm−1 to orthoborate units (Figure 7a) [32,43,67]. We assign more localized (possibly B-O (non-bridging) stretch) displacements in diborate units for the band near 1114 cm−1 (Table 2) based on findings in the literature for alkali borate glasses [55,66,68]. The band near 1228 cm−1 for 67B glass is assigned to symmetric B-O stretching of planar BO3 units [32,46,55].
The 1300–1500 cm−1 envelope in the spectrum for 67B glass is fit with two Gaussian components. The 1380 cm−1 band is assigned to vibrations of BO3 units linked to BO4 tetrahedra, while the 1480 cm−1 band is assigned to BO3 linked to other BO3 triangles [31].
The 60B7Si spectrum is nearly identical to that of 67B glass (Figure 8b). Diborate group vibrations are assigned to the band at 527 cm−1, which increases in area and shifts to 543 cm−1 for 50B17Si glass (Table 2). Increasing the SiO2 concentration in 50B17Si likely causes the further rupturing of the more complex triborate, tetraborate, and pentaborate groups (Figure 7b) while promoting the formation of the simpler diborate species. The band near 600 cm−1 assigned to ring-type metaborate units loses area and disappears for 50B17Si glass. The area under the 700–735 cm−1 shoulder for the 67B glass (assigned to chain-type metaborate units) shifts to 690 cm−1 for 50B17Si glass. Similarly, the major band near 772 cm−1 steadily decreases in area for 60B7Si and 50B17Si. There is no substantial alteration observed in the pyroborate band around 850 cm−1 and the orthoborate band near 950 cm−1 in the 67B, 60B7Si, and 50B17Si glass compositions. Diborate units persist in the 60B7Si and 50B17Si glasses, as shown by the increasing area for the Gaussian component near 1110 cm−1. The areas for the 1380 cm−1 and 1480 cm−1 BO3-related bands decrease from 67B to 50B17Si glass, showing fewer BO3-BO3 and BO3-BO4 linkages.

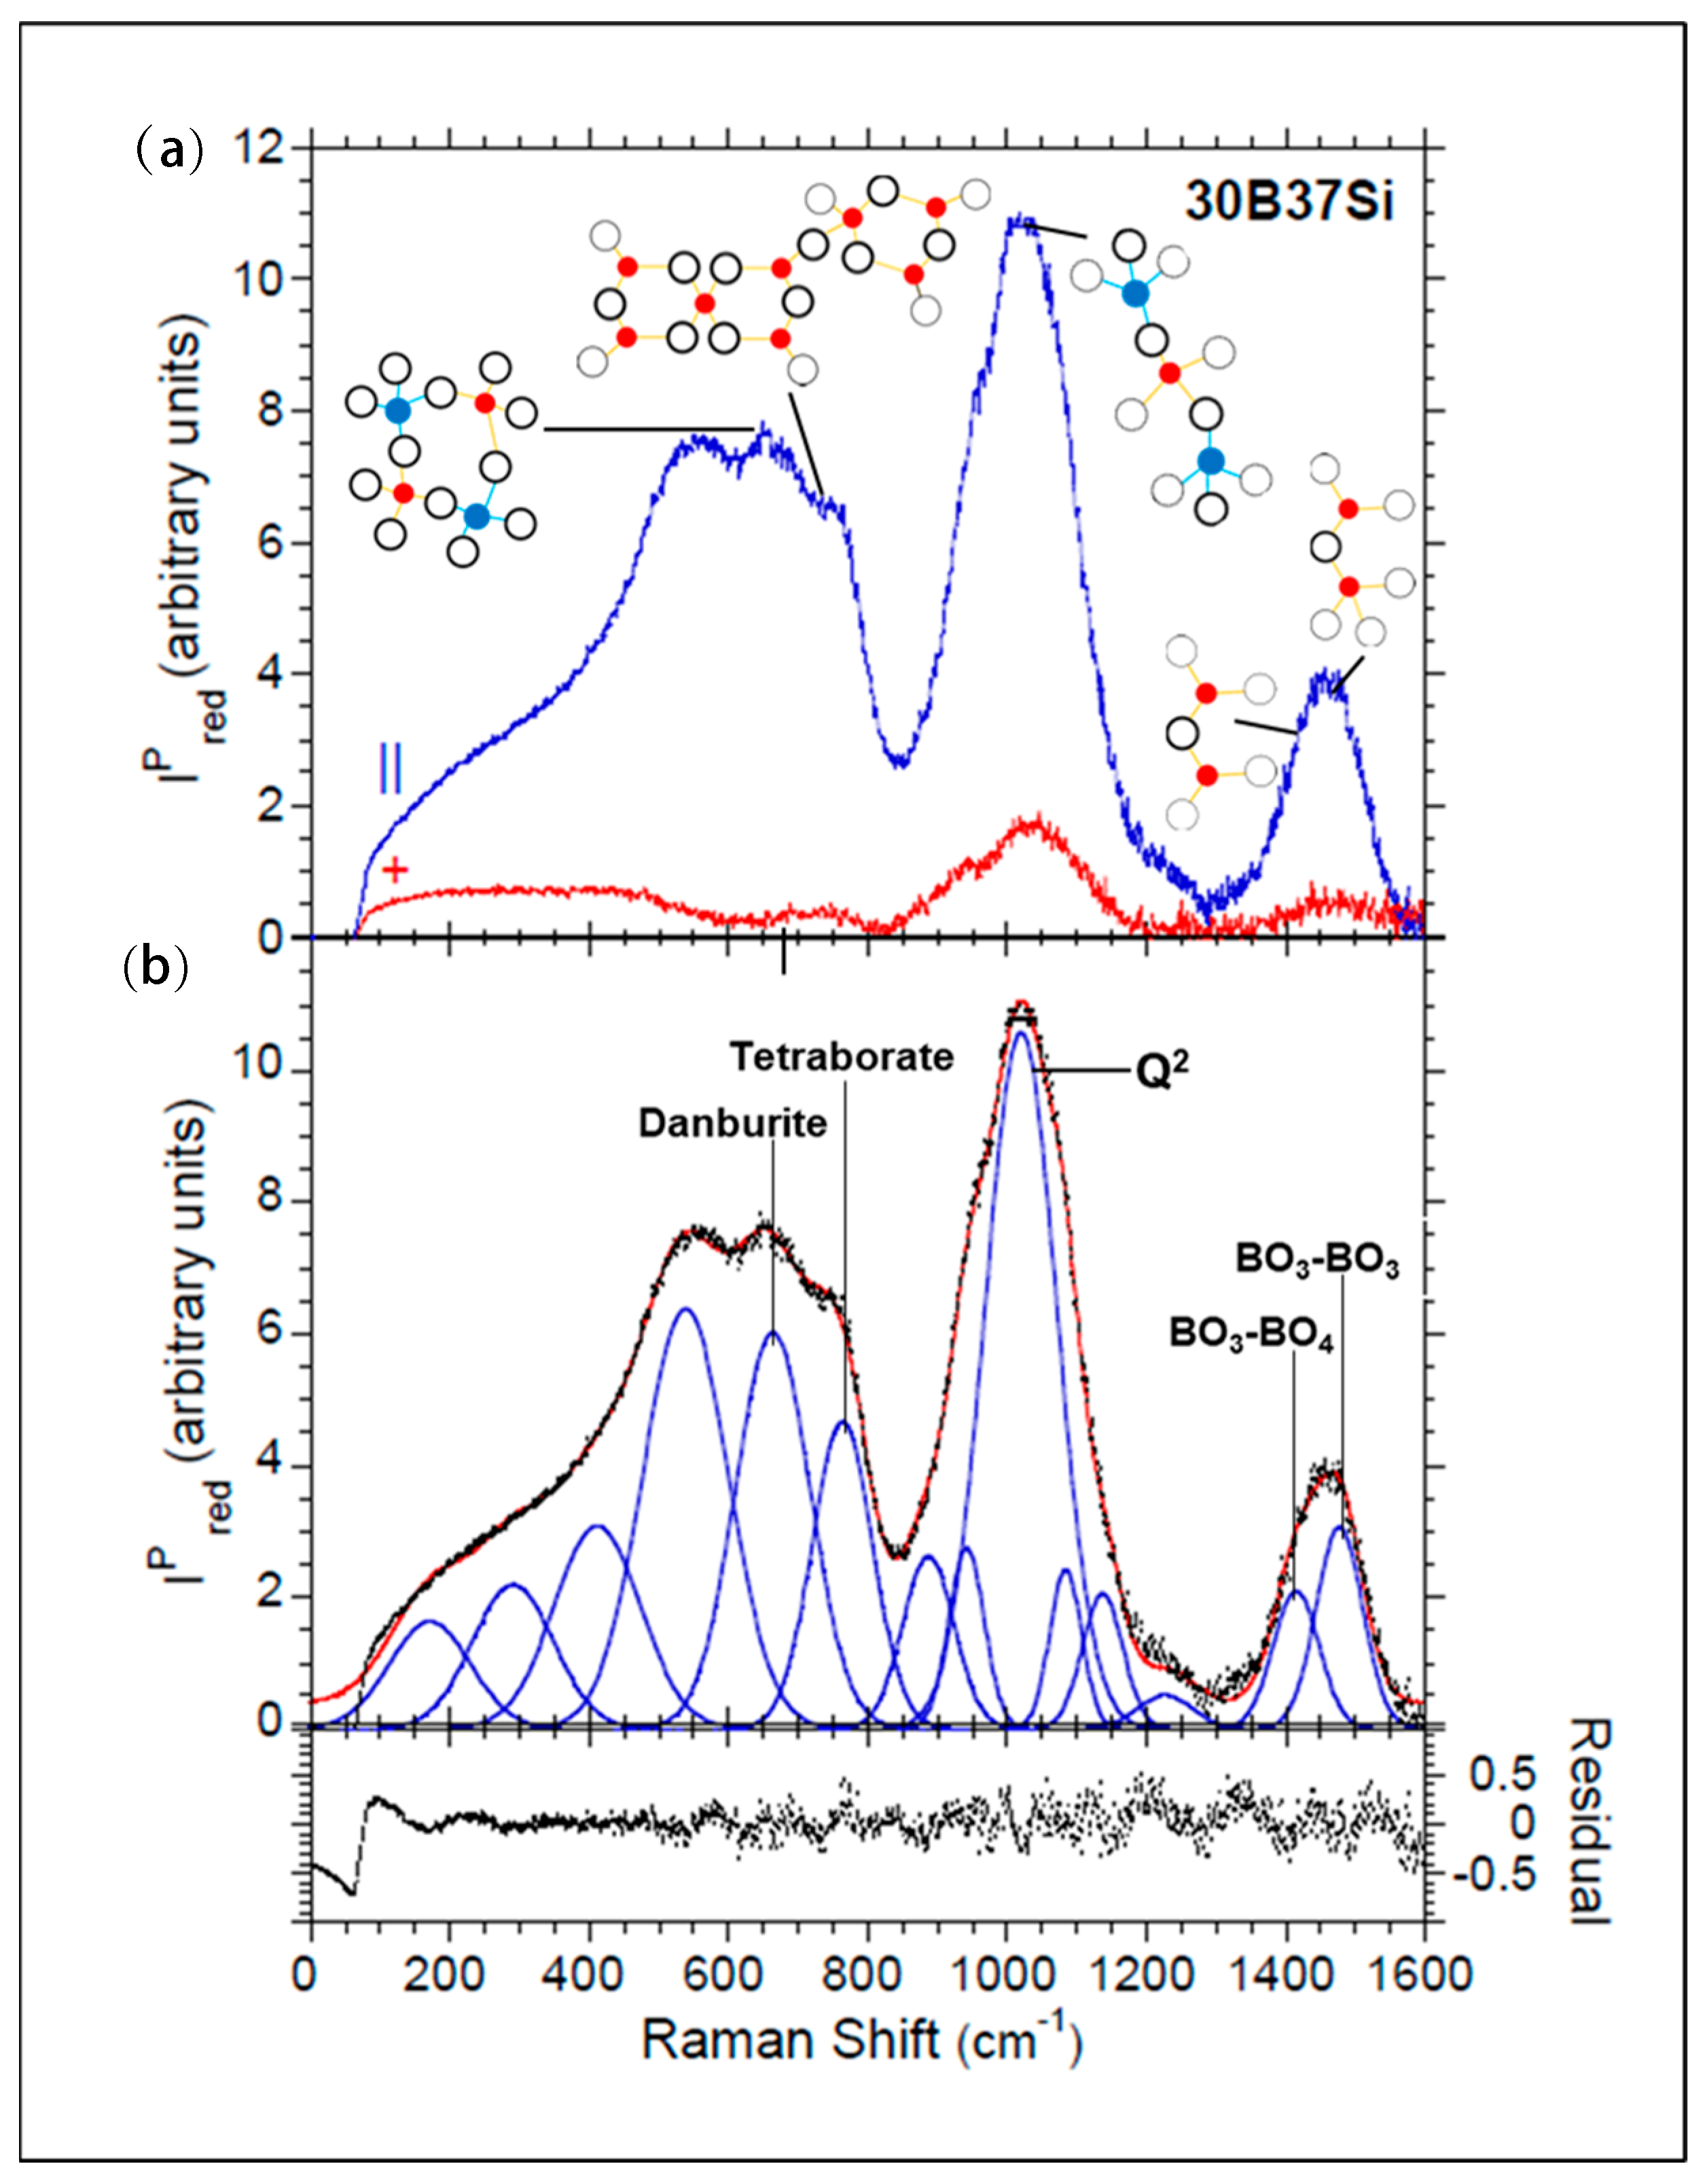
4.3.2. 40B27Si and 30B37Si Borosilicate Glasses

The introduction of 27 mol.% silica to 40B27Si glass results in noticeable changes in the Raman spectra compared with the more borate-rich glasses (Figure 6). This silica increase appears to disrupt the six-membered borate rings, thereby facilitating the formation of borosilicate rings within these glasses. The Gaussian component, centered near 540 cm−1, can be attributed to B-O-B [55] and B-O-Si [48,55] bending modes (Table 3). A similar band is observed for the 30B37Si glass (Figure 9a,b), where the area is smaller and can be assigned to B-O-B [55], B-O-Si [48,55], and Si-O-Si [47,48] motions. A Gaussian component at 681 cm−1 for 40B27Si is assigned to the chain-type metaborate units.
Additionally, borate tetrahedra in mixed danburite-type four-membered rings (Figure 7d) may be forming [55]. For the SiO2–Na2O–B2O3 glass system, Manara et al. [45] attributed the band at 630 cm−1 to danburite ring breathing modes; however, in 30B37Si glass, Li replaces Na with respect to the glasses studied by Manara et al., which has a smaller ionic radius and larger charge density that can shift this danburite ring feature to higher frequencies. Consequently, we assign the Gaussian component band at 664 cm−1 to danburite ring motions within 30B37Si glass (Figure 9a,b and Table 3). Like in other alkali borate glasses [34,36], the Gaussian component band at 772 cm−1 is assigned to tetraborate displacements and decreases in area as the glasses become more silica-rich, until this component disappears in the Gaussian fitting procedure for 20B47Si and the more silica-rich glasses.
In the silicate Q-species’ 850–1250 cm−1 frequency range, it is possible that some contributions come from the Si-O and B-O stretch mixed Q-species modes, which can include silicate and borate tetrahedra (Figure 7d). The area under the orthosilicate–pyroborate Gaussian component near 850 cm−1 remains relatively constant (Table 3). The areas decrease for the 950 and 1080 cm−1 bands, which can be assigned to the Q2 and Q3″ species Si-O stretch modes (Figure 7c), respectively [46,47,48,55,68]. The Q3′ and Q4 species components (Figure 7c) at 1020 and 1140 cm−1, respectively, have increasing areas from 40B27Si to 30B37Si glass, indicating a more polymerized borosilicate network.
The 1300–1500 cm−1 envelope is comprised of two Gaussian components that are centered near 1400 cm−1 and 1480 cm−1. As the glasses become more silica-rich, both components decrease in area, indicating fewer BO3 triangles and a reduction in B-O-B [36], B-O-Si [38], and Si-O-Si [28,31] motions.

4.3.3. Silicate-Dominated 20B47Si, 10B57Si, and 67Si Glasses

In the lower-frequency region from 450 to 800 cm−1, most mode assignments are associated with Si-O-(Si, B) displacements. We observe two major Gaussian components near 530 and 585 cm−1 (Table 4) that are associated with Si-O-Si symmetric bending motions [48,53]. The 530 cm−1 feature loses area and decreases frequency for the two more silica-rich glasses, suggesting that BO4 tetrahedra and BO3 triangles are being replaced by the higher-mass SiO4 tetrahedra in the network. For the more silica-rich 20B47Si glass, the Gaussian component at 641 cm−1 may be assigned to displacements within more silica-rich reedmergnerite rings (Figure 7d) [55]. A band near 601 cm−1 for 10B57Si glass is associated with Si-O-Si, Si-O-B, and B-O-B bending vibrations [53,67,68]. Moreover, a weak feature near 690, 673, and 685 cm−1 in the spectrum for the 20B47Si, 10B57Si, and 67Si glasses (Figure 6 and Figure 10a,b), respectively, is assigned to the stretching–bending motions in Si-O-Si bonds found for a calculated 654 cm−1 mode for Na-silicate glasses [48]. A weak Gaussian component within the 770 to 790 cm−1 range for the 20B47Si and 10B57Si glasses may be due to remnant contributions from tetraborate units, while for the 67Si glass, this component becomes more prominent (Figure 6 and Figure 10b) and may be equivalent to (Si, Al)O4 tetrahedral ‘cage’ vibrations in Na-aluminosilicate glasses [50] or Si-O-Si modes in (Na, Ca) aluminosilicate glasses [69].
The prominent Si-O stretch Q-species 850–1250 cm−1 envelope was fit with five Gaussian components for the 20B47Si, 10B57Si, and 67Si glasses. The band near 850 cm−1 was fit with the 890 to 870 cm−1 Gaussian component (Table 4) and is assigned Si-NBO stretch motions in orthosilicate or Q0 structural units [70]. The Gaussian component near 940 to 950 cm−1 is assigned to Q2 species modes [51,71]. Gaussian bands near 1015 cm−1 and 1080 cm−1 are assigned to Q3′ and Q3′‘ species, respectively [49,50,51,72], and these bands generally shift to slightly lower frequencies from 20B47Si to 67Si glass, possibly due to Si replacing B in the network (Table 4). The Gaussian component near 1150 cm−1 is assigned to Q4 species [71]. The Gaussian band areas at these frequencies generally increase as the boron content decreases. In the borate-dominated glasses, a small Gaussian component near 1228 cm−1, assigned to B-O symmetric stretch within BO3 triangles [38,40], is observed for 20B47Si and 10B57Si glasses and is absent in the 67Si glass spectrum (Table 4, Figure 6 and Figure 10b).
Borosilicate glass Raman features from 1300 cm−1 to 1600 cm−1 are due to motions within BO3 triangles. As B content decreases, both the lower-frequency BO2O-BO4 stretch Gaussian component near 1430 cm−1 and the BO2O-BO3 stretching component near 1490 cm−1 [31,55,60] decrease in area and are absent for the 67Si glass (Figure 11).

5. Discussion

The Raman spectra of the glass series reveal distinct structural changes linked to the composition. The 67B glass clearly has isolated larger borate structural unit populations that include B and O six-membered rings in tetraborate and diborate units, as well as isolated smaller borate structural units that include orthoborate and pyroborate. However, as silica replaces borate, significant alterations are observed for bands associated with the lower-frequency borate species, including metaborate, tetraborate, and pyroborate, as well as the higher-frequency borate species including BO3-BO3 and BO3-BO4. These changes indicate that borate units become less polymerized and fewer in number as the silica content increases (Figure 11). Additionally, in the 850–1200 cm−1 frequency range assigned to more localized atomic displacements, the borosilicate glass spectra show likely superpositions of ortho- and pyro-borate modes with silicate tetrahedra Q-species modes within the borosilicate networks.
Substantial changes in the Raman spectra are observed between 40B27Si and 30B37Si glasses, particularly from 500 cm−1 and 1200 cm−1. These changes likely indicate the formation of Si-O-B and Si-O-Si linkages in 4-membered borosilicate rings, such as those in the danburite and reedmergnerite crystal structures [56,57].
Yun and Bray [28] used the R and K ratios to describe mechanisms of B/Si mixing and NBO creation in simplified ternary Na-borosilicate glasses with K < 8 based on experimental 11B, 17O, 23Na, and 29Si NMR analyses, as well as Raman spectroscopy. According to them, when R < 0.5, M2O-B2O3-SiO2 glass has structural units like M2O-B2O3 glass, and when R > 0.5, borate groups start to mix with silicate groups. Moreover, considering the role of K in the formation of borosilicate units, Dell et al. [30] proposed the critical composition R*, where:
R* = 0.5 + 0.0625K
when R < R*, Na+ interacts as a charge compensator for borate tetrahedra in the domain R < 0.5. For R > R*, as Na-borate glass is diluted by silica, NBOs start to form on the silicate tetrahedra [58]. For the glass series studied here, K ranges from 0 (67B) to 5.7 (60B7Si), where Li+ interacts as a charge compensator for BO4-, when R < 0.5 (Figure 1, and Table 1). Moreover, NBOs start to form on silicate tetrahedra in 40B27Si glass, where K = 0.68 and R = 0.75, which results in R* = 0.54, or R > R*. It is important to note that for R > 0.5, mixed borosilicate units are formed, as we see evidence of danburite-like and possibly reedmergnerite-like 4-membered borosilicate rings in the Raman spectrum of the 30B37Si glass (R = 1) (Table 1).
The fluctuation in Ea corresponds with changes in Tg (Figure 5). According to the Anderson–Stuart model [73] (Equation (3)), the Ea for glasses is dependent on the Eb between an anion site and a neighboring alkali cation, along with the Es needed to deform the glass network. Eb is associated with bond energy for Li+, which should stay the same or similar throughout the glass series as the baseline for the Ea at 0.5 eV (Figure 5). Larger Tg values are linked to more strongly bonded networks, requiring increased Es values to deform the network. This, in turn, leads to elevated Ea and impeded ion mobility. Based on the borate-rich to silicate-rich glasses studied here, increases in Tg infer increases in the glass network connectivity, which hampers Li+ mobility, resulting in decreased σ and increased Ea values (Table 1 and Figure 5). The reversal in Ea and Tg indicates the presence of danburite rings in the 30B37Si and 20B47Si glasses.
An interesting trend was observed in the electrical conductivity of the glass series. Generally, for borate-rich to silica-rich compositions, there is an overall decrease in electrical conductivity. However, there is a localized minimum for this trend at 40 mol.% B2O3, where conductivity increases from 40B27Si to 20B47Si (Figure 4). The binary 67B glass is the most conductive glass in the series, suggesting no mixed glass former effects (MGFE) across the glass series. Tatsumisago et al. [74] observed MGFE in rapidly quenched borosilicate glasses with larger alkali-oxide concentrations (Li2O > 60 mol.%) than those for the LABS glasses studied here.
Mai et al. [11] explored a broader spectrum of K and R ratios, spanning from 0.22 to 18 and 0.67 to 6.17, respectively, resulting in critical R* values ranging from 0.51 to 1.63 in their study of the glass series 0.40Li2O•0.60xB2O3•1.2(1−x) SiO2, where x = 0 to 1, prepared by annealing the melt. Our study covers K and R ratios ranging from 0.12 to 5.70 and 0.45 to 3.00, respectively, producing R* values within the 0.51 to 0.86 range. However, the observed trend of decreasing electrical conductivity from boron-rich to silica-rich glasses, as reported in their study, aligns with our findings. Their reported Ea values of 0.65 eV for the most-conductive borate-rich glass and 0.80 eV for the least-conductive silica-rich glass are slightly higher than the values in our study, which are 0.50 eV for the most-conductive 67B glass and 0.68 eV for the least-conductive 67Si glass (Figure 5). Our glasses obtained from quenching the melt contain small amounts of Al2O3 (Table 1), which likely enhance ionic conduction, potentially resulting in lower Ea values for the 67B and 67Si glasses. Furthermore, the Li2O/SiO2 ratio in the silica-rich glass studied by Mai et al. (0.33) is lower than that for 67Si (0.45), which might contribute to the higher Ea values observed in their silica-rich glass.
Furthermore, Montouillout et al. [20], in their study on the correlation between the ionic conductivity of lithium borate glass, (xLi2O•(1−x) B2O3, where 0 ≤ x ≤ 0.50), reported that from x ≥30, the formation of NBO sites accompanied other structural changes, which aligns with the presence of pyroborate and orthoborate species in our 67B glass (Figure 8a,b). The presence of more BO4 sites with ionic bonding to Li+, along with some NBOs, results in the highest conductivity of the 67B glass among the series [75]. As the silica content increases in the glass composition, the borate polyhedra intermix with silicate tetrahedra, resulting in more polymerized borosilicate units such as danburite-like rings, which contribute to the slight increase in conductivity, especially for the 30B37Si and 20B47Si glasses. As the boron content continues to decrease and mixed borosilicate populations continue to diminish, the conductivity decreases slightly as the glass becomes more silica-rich (Figure 4 and Figure 12).

6. Conclusions

In summary, this study revealed the relationships between glass composition, structural changes determined from Raman spectroscopy, σ, and Tg. In 67B glass, isolated diborate, tetraborate, and orthoborate groups are prominent. However, substitution of boron with silicon leads to dissociation of linked borate polyhedra, resulting in the formation of borosilicate units as well as larger populations of isolated and linked silicate tetrahedra (Figure 12). 30B37Si and 20B47Si glass structures can be characterized as containing borosilicate rings, similar to those found in danburite and reedmergnerite, along with tetraborate, BO3-BO4, and BO3-BO3 units. As the boron content continues to decrease, increasing numbers of silicate tetrahedra become more polymerized. The effects of such structural alterations are indicated by the relationships of σ and Tg with respect to the glass composition. For 67B to 40B27Si glass, σ steadily decreases, while Tg steadily increases, until the trends reverse slightly for 30B37Si and 20B47Si glasses. This reversal in σ can be attributed to the presence of danburite-like rings, which contain BO4- tetrahedra that act as local charge compensators for Li+. At the same time, the reversal in Tg may be caused by the increasing numbers of more weakly bonded borosilicate units compared to the polymerized silicate network units. However, the BO breathing mode for Si3O9 planar 3-membered rings is assigned at 608 cm−1 for silica glass [76]. The trends in σ and Tg supports the danburite assignments with localized charge imbalances in the borosilicate network. Subsequent reductions in B2O3 content leads to fewer BO4- local charge compensators and more polymerized SiO4 tetrahedra that increasingly hinder Li+ mobility, resulting in decreasing σ values. In this case, charge neutrality results when a SiO4 tetrahedron glass former links with four other SiO4 tetrahedra to create localized SiO40 in a silicate-dominated glass. Additionally, a BO30 triangle would be formed if it is linked to three SiO4 tetrahedra. As more strongly bonded SiO4 tetrahedra replace more weakly bonded BO4 and BO3 units, stiffening of the borosilicate and silicate networks likely causes a further increase in Tg.
The glasses studied here were prepared via conventional melting and quenching. The Raman spectra for the glass series do not show any evidence of phase separation. However, spinodal decomposition can occur in these glasses with a different heat treatment routines. We plan to explore how phase separation of two different amorphous phases can improve electrical conductivity of the glasses in subsequent studies of lithium borosilicate glass. The understanding of the mixed glass former effect and phase separation induced by spinodal decomposition in lithium borosilicate glasses holds potentially important implications for the development of glass compositions for optimized electrical conductivity. Such optimizations can improve the performance of glasses as solid-state electrolytes in Li+ batteries. These observations and resulting insights offer a foundation for further research and innovation in the field of glass science and materials engineering, ultimately driving the development of novel materials to meet the evolving demands of technology and industry.

Author Contributions

Conceptualization, A.P.K. and B.D.; methodology, A.P.K.; validation, B.D. and W.W.-N.; formal analysis, A.P.K., B.D. and D.M.; investigation, A.P.K. and D.M.; data curation, A.P.K. and D.M.; writing—original draft preparation, A.P.K.; writing—review and editing, D.M., B.D., W.W.-N., M.A. (Meznh Alsubaie) and M.A. (Manar Alenezi); visualization, A.P.K. and D.M.; supervision, B.D. and W.W.-N.; funding acquisition, I.L.P. All authors have read and agreed to the published version of the manuscript.

Funding

This research was funded by Vitreous State Laboratory, the Catholic University of America.

Data Availability Statement

The data presented in this study are available on request from the corresponding author due to privacy.

Conflicts of Interest

The authors declare no conflicts of interest.

References

  1. Gardy, Z.A.; Wilkinson, C.J.; Randall, C.A.; Mauro, J.C. Emerging Role of Non-crystalline Electrolytes in Solid-State Battery Research. Front. Energy Res. 2020, 8, 218. [Google Scholar] [CrossRef]
  2. Chandra, A.; Bhatt, A.; Chandra, A. Ion Conduction in Superionic Glassy Electrolytes: An Overview. J. Mater. Sci. Technol. 2013, 29, 193–208. [Google Scholar] [CrossRef]
  3. Pradel, A.; Ribes, M. Ionic conductive glasses. Mater. Sci. Eng. B 1989, 3, 45–56. [Google Scholar] [CrossRef]
  4. Magistris, A.; Chiodelli, G.; Duclot, M. Silver boro-phosphate glasses: Ion transport, thermal stability and electrochemical behavior. Solid. State Ion. 1983, 9–10, 611–615. [Google Scholar] [CrossRef]
  5. Shuhaimi, S.A.; Hisam, R.; Yahya, A.K. Effects of mixed glass former on AC conductivity and dielectric properties of 70[xTeO2+(1-x) B2O3] +15Na2O+15K2O glass system. Solid. State Sci. 2020, 107, 106345. [Google Scholar] [CrossRef]
  6. Salodkar, R.V.; Deshpande, V.K.; Singh, K. Enhancement of the ionic conductivity of lithium boro-phosphate glass: A mixed glass former approach. J. Power Sources 1989, 25, 257–263. [Google Scholar] [CrossRef]
  7. Kumar, S.; Vinatier, P.; Levasseur, A.; Rao, K.J. Investigations of structure and transport in lithium and silver borophosphate glasses. J. Solid-State Chem. 2004, 177, 1723–1737. [Google Scholar] [CrossRef]
  8. Shaw, A.; Ghosh, A. Dynamics of lithium ions in borotellurite mixed former glasses: Correlation between the characteristic length scales of mobile ions and glass network structural units. J. Chem. Phys. 2014, 141, 164504. [Google Scholar] [CrossRef]
  9. Lee, C.H.; Joo, K.H.; Kim, J.H.; Woo, S.G.; Sohn, H.J.; Kang, T.; Park, Y.; Oh, J.Y. Characterizations of a new lithium ion conducting Li2O–SeO2–B2O3 glass electrolyte. Solid. State Ion. 2002, 149, 59–65. [Google Scholar] [CrossRef]
  10. Gundale, S.S.; Behare, V.V.; Deshpande, A.V. Study of electrical conductivity of Li2O-B2O3-SiO2-Li2SO4 glasses and glass-ceramics. Solid. State Ion. 2016, 298, 57–62. [Google Scholar] [CrossRef]
  11. Maia, L.F.; Rodrigues, A.C.M. Electrical conductivity and relaxation frequency of lithium borosilicate glasses. Solid. State Ion. 2004, 168, 87–92. [Google Scholar] [CrossRef]
  12. Otto, K. Electrical conductivity of SiO2-B2O3 glasses containing lithium or sodium. Phys. Chem. Glas. 1966, 7, 29–33. [Google Scholar]
  13. Doremus, R.H. Glass Science; Wiley: Hoboken, NJ, USA, 1994. [Google Scholar]
  14. McMillan, P.F. Structural studies of silicate glasses and melts: Applications and limitations of Raman spectroscopy. Am. Mineral. 1984, 69, 622–644. [Google Scholar]
  15. Hummel, R.E. Electrical Properties of Polymers, Ceramics, Dielectrics, and Amorphous Materials. In Electronic Properties of Materials; Springer: New York, NY, USA, 2011; pp. 181–211. [Google Scholar]
  16. Edward, S.J. Optimization of fast ionic conducting glasses for lithium batteries. Ph.D. Thesis, Iowa State University, Ames, IA, USA, 2005. [Google Scholar]
  17. Anderson, O.L.; Stuart, D.A. Calculation of Activation Energy of Ionic Conductivity in Silica Glasses by Classical Methods. J. Am. Ceram. Soc. 1954, 37, 553–582. [Google Scholar] [CrossRef]
  18. Ramadan, A.A.; Gould, R.D.; Ashour, A. On the Van Der Pauw method of resistivity measurements. Thin Solid. Film. 1994, 239, 272–275. [Google Scholar] [CrossRef]
  19. Bunde, A.; Funke, K.; Ingram, M.D. Ionic glasses: History and challenges. Solid. State Ion. 1998, 105, 1–13. [Google Scholar] [CrossRef]
  20. Montouillout, V.; Fan, H.; Campo, L.; Ory, S. Ionic conductivity of lithium borate glasses and local structure probed by high-resolution solid-sate NMR. J. Non-Cryst. Solids 2018, 484, 57–64. [Google Scholar] [CrossRef]
  21. Kluvanek, P.; Klement, R.; Karacon, M. Investigation of the conductivity of the lithium borosilicate glass system. J. Non-Cryst. Solids 2007, 353, 2004–2007. [Google Scholar] [CrossRef]
  22. Application Note Basics of Electrochemical Impedance Spectroscopy: Gamry Instruments. Available online: https://www.gamry.com/application-notes/EIS/basics-of-electrochemical-impedance-spectroscopy/ (accessed on 7 May 2023).
  23. Neyret, M.; Lenoir, M.; Grandjean, A.; Massoni, N.; Penelon, B.; Malki, M. Ionic transport of alkali in borosilicate glass. Role of alkali nature on glass structure and on ionic conductivity at the glassy state. J. Non-Cryst. Solids 2015, 410, 74–81. [Google Scholar] [CrossRef]
  24. Wright, A.C.; Dalba, G.; Rocca, F.; Vedishcheva, N.M. Borate versus silicate glasses: Why are they so different? Phys. Chem. Glas.-Eur. J. Glass Sci. Technol. 2010, 51, 233–265. [Google Scholar]
  25. Kodama, M.; Kojima, S. Anharmonicity and fragility in lithium borate glasses. J. Therm. Anal. Calorim. 2002, 69, 961–970. [Google Scholar] [CrossRef]
  26. Avramov, I.; Vassilev, T.; Penkov, I. The glass transition temperature of silicate and borate glasses. J. Non-Cryst. Solids 2005, 351, 472–476. [Google Scholar] [CrossRef]
  27. Boekenhauer, R.; Zhang, H.; Feller, S.; Bain, D.; Kambeyanda, S.; Budhwani, K.; Pandikuthira, P.; Alamgir, F.; Peters, A.M.; Messer, S.; et al. The glass transition temperature of lithium borosilicate glasses related to atomic arrangements. J. Non-Cryst. Solids 1994, 175, 137–144. [Google Scholar] [CrossRef]
  28. Yun, Y.H.; Bray, P.J. Nuclear magnetic resonance studies of the glasses in the system Na2O-B2O3-SiO2. J. Non-Cryst. Solids 1978, 27, 363–380. [Google Scholar] [CrossRef]
  29. Yun, Y.H.; Feller, S.A.; Bray, P.J. Correction and addendum to Nuclear Magnetic Resonance Studies of the Glasses in the System Na2O-B2O3-SiO2. J. Non-Cryst. Solids 1979, 33, 273–277. [Google Scholar] [CrossRef]
  30. Dell, W.J.; Bray, P.J.; Xiao, S.Z. 11B NMR studies and structural modeling of Na2O-B2O3-SiO2 glasses of high soda content. J. Non-Cryst. Solids 1983, 58, 1–16. [Google Scholar] [CrossRef]
  31. Meera, B.N.; Ramakrishna, J. Raman spectral studies of borate glasses. J. Non-Cryst. Solids 1993, 159, 1–21. [Google Scholar] [CrossRef]
  32. Konijnendijk, W.L.; Stevels, J.M. The Structure of Borate Glasses Studied by Raman Scattering. J. Non-Cryst. Solids 1975, 18, 307–331. [Google Scholar] [CrossRef]
  33. Konijnendijk, W.L.; Stevels, J.M. The Structure of Borosilicate Glasses Studied by Raman Scattering. J. Non-Cryst. Solids 1976, 20, 193–224. [Google Scholar] [CrossRef]
  34. Kamitsos, E.I.; Chryssikos, G.D. Borate glass structure by Raman and infrared spectroscopies. J. Mol. Struct. 1991, 247, 1–16. [Google Scholar] [CrossRef]
  35. Kamitsos, E.I.; Karakassides, M.A.; Chryssikos, G.D. Structure of borate glasses: Pt. 1. Phys. Chem. Glas. 1989, 30, 229–234. [Google Scholar]
  36. Winterstein-Beckmann, A.; Möncke, D.; Palles, D.; Kamitsos, E.I.; Wondraczek, L. A Raman-spectroscopic study of indentation-induced structural changes in technical alkali-borosilicate glasses with varying silicate network connectivity. J. Non Cryst. Solids 2014, 405, 196–206. [Google Scholar] [CrossRef]
  37. Krogh-Moe, B.J. The Crystal Structure of Lithium Diborate, Li2O.2B2O3. Acta Cryst. 1962, 15, 190–193. [Google Scholar] [CrossRef]
  38. Mozzi, R.L.; Warren, B.E. The structure of vitreous boron. J. Appl. Crystallogr. 1970, 3, 251–257. [Google Scholar] [CrossRef]
  39. Bril, T.W. Raman spectroscopy of crystalline and vitreous borates. Ph.D. Thesis, Technische Hogeschool Eindhoven, Eindhoven, The Netherlands, 1976. [Google Scholar] [CrossRef]
  40. Kamitsos, E.I.; Karakassides, A.; Chryssikost, G.D. Vibrational Spectra of Magnesium-Sodium-Borate Glasses. 2. Raman and Mid-Infrared Investigation of the Network Structure. J. Phys. Chem. 1987, 91, 11073–11079. Available online: https://pubs.acs.org/sharingguidelines (accessed on 15 August 2023). [CrossRef]
  41. Martizez-Ripoll, M.; Martinez-Carrera, S.; Garcia-Blanco, S. The Crystal Structure of Zinc Diborate ZnB4O7. Acta Cryst. 1971, B27, 672–677. [Google Scholar] [CrossRef]
  42. Kamitsos, E.I.; Karakassides, A. Structural Studies of Binary and Pseudo Binary Sodium Borate Glasses of High Sodium Content. Phys. Chem. Glas. 1989, 30, 19–26. [Google Scholar]
  43. Akagi, R.; Ohtori, N.; Umesaki, N. Raman spectra of K2O–B2O3 glasses and melts. J. Non-Cryst. Solids 2001, 295, 471–476. [Google Scholar] [CrossRef]
  44. Dwivedi, B.P.; Rahman, M.H.; Kumar, Y.; Khanna, B.N. Raman Scattering Study of Lithium Borate Glasses. J. Phys. Chem. Solids 1993, 54, 621–628. [Google Scholar] [CrossRef]
  45. Manara, D.; Grandjean, A.; Neuville, D.R. Advances in understanding the structure of borosilicate glasses: A Raman spectroscopy study. Am. Mineral. 2009, 94, 777–784. [Google Scholar] [CrossRef]
  46. Yano, T.; Kobayashi, T.; Shibata, S.; Yamane, M. High temperature Raman spectra of R2O-B2O3 glass melts. Phys. Chem. Glas. 2002, 43C, 90–95. [Google Scholar]
  47. Furukawa, T.; White, W.B. Raman spectroscopic investigation of sodium-boro silicate glass structure. J. Mater. Sci. 1981, 16, 2689–2700. [Google Scholar] [CrossRef]
  48. Furukawa, T.; Fox, K.E.; White, W.B. Raman spectroscopic investigation of the structure of silicate glasses. III. Raman intensities and structural units in sodium silicate glasses. J. Chem. Phys. 1998, 75, 3226–3237. [Google Scholar] [CrossRef]
  49. McKeown, D.A.; Nobles, A.C.; Bell, M.I. Vibrational analysis of wadeite K2ZrSi 3O9 and comparisons with benitoite BaTiSi3O9. Phys. Rev. B 1996, 54, 291. [Google Scholar] [CrossRef]
  50. McKeown, D.A.; Galeener, F.L.; Brown, G.E. Raman Studies of AI Coordination in Silica-Rich Sodium Aluminosilicate Glasses and some Related Minerals. J. Non-Cryst. Solids 1984, 68, 361. [Google Scholar] [CrossRef]
  51. McKeown, D.A.; Buechele, A.C.; Viragh, C.; Pegg, I.L. Raman and X-ray absorption spectroscopic studies of hydrothermally altered alkali-borosilicate nuclear waste glass. J. Nucl. Mater. 2010, 399, 13–25. [Google Scholar] [CrossRef]
  52. Seuthe, T.; Grehn, M.; Mermillod-Blondin, A.; Bonse, J.; Eberstein, M. Compositional dependent response of silica-based glasses to femtosecond laser pulse irradiation. In Laser-Induced Damage in Optical Materials: 2013; SPIE: Boulder, CO, USA, 2013; 88850M. [Google Scholar] [CrossRef]
  53. Zotov, N.; Keppler, H. The structure of sodium tetrasilicate glass from neutron diffraction, reverse Monte Carlo simulations and Raman spectroscopy. Phys. Chem. Miner. 1998, 25, 259–267. [Google Scholar] [CrossRef]
  54. Zotov, N.; Keppler, H. The influence of water on the structure of hydrous sodium tetrasilicate glasses. Am. Miner. 1998, 83, 823–834. [Google Scholar] [CrossRef]
  55. Osipov, A.A.; Osipova, L.M.; Eremyashev, V.E. Structure of alkali borosilicate glasses and melts according to Raman spectroscopy data. Glass Phys. Chem. 2013, 39, 105–112. [Google Scholar] [CrossRef]
  56. Phillips, M.W.; Gibbs, G.V.; Ribbe, P.H. The crystal structure of danburite: A comparison with anorthite, albite, and reedmergnerite. Am. Mineral. 1974, 59, 79–85. [Google Scholar]
  57. Johansson, G. A Refinement of the Crystal Structure of Danburite. Acta Cryst. 1959, 12, 522–526. [Google Scholar] [CrossRef]
  58. Bunker, B.C.; Tallant, D.R.; Kirkpatrick, R.J.; Turner, G.L. Multinuclear nuclear magnetic resonance and Raman investigation of sodium borosilicate glass structures. Phys. Chem. Glas. 1990, 31, 30–41. [Google Scholar]
  59. Manara, D.; Grandjean, A.; Neuville, D. Structure of borosilicate glasses and melts: A revision of the Yun, Bray and Dell model. J. Non-Cryst. Solids 2009, 355, 2528–2531. [Google Scholar] [CrossRef]
  60. Osipov, A.A.; Osipova, L.M. Structure of lithium borate glasses and melts: Investigation by high-temperature Raman spectroscopy. Eur. J. Glass Sci. Technol. 2009, 50, 343–354. [Google Scholar]
  61. Turner, W.E.S.; Winks, F.J. The Influence of Boric Oxide on the Properties of Chemical and Heat-resisting Glasses. Soc. Glass Technol. 1926, 10, 102–113. [Google Scholar]
  62. Cahn, J.W. On Spinodal Decomposition. Acta. Mate. 1961, 9, 795–801. [Google Scholar] [CrossRef]
  63. van der Pauw, L.J. A method of measuring the resistivity and Hall coefficient on lamellae of arbitrary shape. Philips Technol. Rev. 1958, 20, 220–224. [Google Scholar]
  64. Umari, P.; Pasquarello, A. First-principles analysis of the Raman spectrum of vitreous silica: Comparison with the vibrational density of states. J. Phys. Condens. Matter 2003, 15, S1547. [Google Scholar] [CrossRef]
  65. Igor Pro Manual, Version 6.3. 2015. Available online: http://www.wavemetrics.com/ (accessed on 3 January 2023).
  66. Chryssikos, G.D.; Kapoutsis, J.A.; Patsis, A.P.; Kamitsos, E.I. A classification of metaborate crystals based on Raman spectroscopy. Spectrochim. Acta Part. A Mol. Spectrosc. 1991, 47, 1117–1126. [Google Scholar] [CrossRef]
  67. Konijnendijk, W.L. The Structure of Borosilicate Glasses. Ph.D. Thesis, Technische Hogeschool Eindhoven, Eindhoven, The Netherlands, 1975. [Google Scholar] [CrossRef]
  68. Osipov, A.A.; Osipova, L.M. Structural studies of Na2O B2O3 glasses and melts using high-temperature Raman spectroscopy. Phys. Condens. Matter 2010, 405, 4718–4732. [Google Scholar] [CrossRef]
  69. Petrescu, S.; Constantinescu, M.; Anghel, E.M.; Atkinson, I.; Olteanu, M.; Zaharescu, M. Structural and physico-chemical characterization of some soda lime zinc alumino-silicate glasses. J. Non-Cryst. Solids 2012, 328, 3280–3288. [Google Scholar] [CrossRef]
  70. Umesaki, N.; Takahashi, M.; Tatsumisago, M.; Minami, T. Raman spectroscopic study of alkali silicate glasses and melts. J. Non-Cryst. Solids 1996, 205, 225–230. [Google Scholar] [CrossRef]
  71. McKeown, D.A.; Muller, I.S.; Buechele, A.C.; Pegg, I.L.; Kendziora, C.A. Structural characterization of high-zirconia borosilicate glasses using Raman spectroscopy. J. Non-Cryst. Solids 2000, 262, 126–134. [Google Scholar] [CrossRef]
  72. Mysen, B.O.; Frantz, J.D. Raman spectroscopy of silicate melts at magmatic temperatures: Na2O-SiO2, K2O-SiO2 and Li2O-SiO2 binary compositions in the temperature range 25–1475 °C. Chem. Geol. 1992, 96, 321–332. [Google Scholar] [CrossRef]
  73. Nascimento, M.; Dantas, N.O. Anderson-Stuart model of ionic conductors in Na2O-SiO2 glasses. Sci. Eng. J. 2003, 12, 7–13. [Google Scholar]
  74. Tatsumisago, M.; Yoneda, K.; Machida, N.; Minami, T. Ionic conductivity of rapidly quenched glasses with high concentration of lithium ions. J. Non-Cryst. Solids 1987, 95, 857–864. [Google Scholar] [CrossRef]
  75. Wright, A.C. My borate life: An enigmatic journey. Int. J. Appl. Glass Sci. 2015, 6, 45–63. [Google Scholar] [CrossRef]
  76. Galeener, F.L. Planar rings in glasses. Soild State Commun. 1982, 44, 1037–1040. [Google Scholar] [CrossRef]
Figure 1. Li2O-B2O3-SiO2 ternary diagram with the LABS series glass compositions (green squares on red line), with some R (pink) and K (blue) ratio values displayed.
Electronicmat 05 00012 g001
Figure 2. DTA plots, arrow showing Tg, for some glasses of the series. Endothermic changes are shown as a drop in heat flow.
Electronicmat 05 00012 g002
Figure 3. Electrical conductivity (as log σ) with respect to LABS glass compositions, with guiding lines to aid visualization.
Electronicmat 05 00012 g003
Figure 4. Arrhenius plots with error bars showing variation in log σ in S/cm, expressed as units of electrical conductivity, along with the inverse of temperature in K−1 (legends are based on in the order of decrease in conductivity from top to bottom, not on composition across the glass series).
Electronicmat 05 00012 g004
Figure 5. Glass transition temperature (Tg) and activation energy from 50 °C to 170 °C with respect to glass composition.
Electronicmat 05 00012 g005
Figure 6. Parallel polarized reduced Raman spectra for the glass series. Plots are offset for clarity.
Electronicmat 05 00012 g006
Figure 7. (a) Simple polyborate species, (b) complex polyborate species, (c) silicate species, and (d) borosilicate species.
Electronicmat 05 00012 g007
Figure 8. (a) Parallel polarized (blue) and cross-polarized (red) reduced Raman spectra for 67B glass. Some vibrational assignments with corresponding structural units are indicated. (b) Parallel polarized Raman spectrum of 67B glass and associated Gaussian component fit by the program IGOR [65]. The data are black points, the fitted individual Gaussian components are plotted in blue, and the sum of all Gaussian-fitted components are plotted in red. Residual intensities are the differences between observed data and the sum of the Gaussian components. Structural unit assignments are indicated for some of the major fitted Gaussian components.
Electronicmat 05 00012 g008
Figure 9. (a) Parallel polarized (blue) and cross-polarized (red) reduced Raman spectra of 30B37Si glass. Some vibrational assignments with corresponding structural units are indicated. (b) Parallel polarized Raman spectrum of 30B37Si glass and associated Gaussian component fit by the program IGOR [65]. Conventions from Figure 8b are followed.
Electronicmat 05 00012 g009
Figure 10. (a) Parallel polarized (blue) and cross-polarized (red) reduced Raman spectra of 67Si glass. Some vibrational assignments with corresponding structural units are indicated. (b) Parallel polarized Raman spectrum of 67Si glass and associated Gaussian component fit by the program IGOR [65]. Conventions from Figure 8b are followed.
Electronicmat 05 00012 g010
Figure 11. Major Gaussian component areas versus glass composition for important Raman spectral features. Danburite ring assignments are indicated for 30B37Si and 20B47Si glasses only. Each plotted Gaussian component is labeled with its corresponding glass structural unit assignment.
Electronicmat 05 00012 g011
Figure 12. Parallel polarized reduced Raman spectra of 67B, 30B37Si, and 67Si glass with major structural unit assignments.
Electronicmat 05 00012 g012
Table 1. LABS glass series chemical compositions according to XRF. XRF values have a ±10% uncertainty, with the associated glass former ratio, K; oxide modifier-to-boron oxide ratio, R; critical composition, R* [30]; and Tg.
Glass IDLi2O (Mole %)
(Nominal)
Al2O3(Mole %)B2O3 (Mole %)
(Nominal)
SiO2(Mole %)B2O3
(%Mole)
SiO2
(%Mole)
K = [ S i O 2 ] [ B 2 O 3 ] R = [ L i 2 O ] [ B 2 O 3 ] R* =
0.5 + 0.0625 K
Tg (°C)
(Nominal)(XRF)(Nominal)(XRF)
67B3032.606700.00100000.400.5442
60B7Si3033.376076.1589.510.50.120.500.51446
50B17Si3033.60501715.7974.625.40.340.600.52450
40B27Si3034.40402724.4359.740.30.680.750.54461
30B37Si3033.52303736.0044.855.21.231.000.58458
20B47Si3033.51204745.2129.970.12.351.500.65456
10B57Si3033.60105758.0414.985.15.703.000.86463
67Si3033.6506766.400100---------475
Table 2. Borate-rich glasses fitted Gaussian component values from the program IGOR [65] with corresponding vibrational assignments from the literature. Areas values are in arbitrary units.
Vibrational Assignment 67B60B7Si50B17Si
Position (cm−1)Peak WidthAreaPosition (cm−1)Peak WidthAreaPosition (cm−1)Peak WidthArea
Diborate (506 cm−1) [29,39]527133575527135746543154994
Ring-type metaborate (600–650 cm−1) [29,30,31,32]6128414860783142599900
Chain-type metaborate (700–735 cm−1) [29,30,31,32]703113646701126890690123790
Tetraborate (740–775 cm−1) [29,38]772596497726361276972561
Pyroborate (820 cm−1) [29,30,31,32,40]8578934785491364861105373
Orthoborate (875–1000 cm−1) [29,39,62]97112774597313310099811341127
Diborate (1000–1110 cm−1) [34,52,57]111410625411091103261098104357
BO3 symmetric stretch (1200 cm−1) [31,35,43]123612716812331251951233125179
BO3-BO4 (1300–1450 cm−1) [28,29,30,31]138112247913841255171393125358
BO3-BO3 (1450–1600 cm−1) [28,29,30,31]148311773314801127831475109597
Table 3. Borosilicate glasses fitted Gaussian component values with corresponding vibrational assignments from the literature. Conventions from Table 2 are followed.
Vibrational Assignment40B27Si30B37Si
Position
(cm−1)
Peak WidthAreaPosition (cm−1)Peak WidthArea
Vibration of bridge bonds B-O-B, B-O-Si, Si-O-Si (500–600 cm−1) [44,45,52]5431551072539144980
Danburite and reedmergnerite rings [42,52,53]681 *118 *742 *664121809
Tetraborate (740–775 cm−1) [29,38]76579505764102505
Orthosilicate–pyroborate (850 cm−1) [40,67]85812038088887241
Q2 (950 cm−1) [46,47,48]9529354894259174
Q3′ (1020 cm−1) [46,47,48]10148054610201211369
Q3′‘ (1080 cm−1) [46,47,48,51]107990448108554138
Q4 (1140 cm−1) [46,47,48]114888117113868148
Symmetric stretching of BO3 units (1200 cm−1) [31,35,43]123412114312279250
BO3-BO4 (1300–1450 cm−1) [28,29,30,31]1391117273141577172
BO3-BO3 (1450–1600 cm−1) [28,29,30,31]1473107529147878255
* The Gaussian component at 681 cm−1 for 40B27Si glass can be assigned to the chain-type metaborate units.
Table 4. Silica-rich glasses’ fitted Gaussian component values with corresponding vibrational assignments from the literature. Conventions from Table 2 are followed.
Vibrational Assignment20B47Si10B57Si67Si
Position (cm−1)Peak WidthAreaPosition (cm−1)Peak WidthAreaPosition (cm−1)Peak WidthArea
Breathing vibration in four-membered rings (485 cm−1) [45,50]531138111950912785549098781
Breathing vibration in three-membered rings (600 cm−1) [52,63,65]641 **138 **772 **60113112795851311790
Stretching plus bending of Si-O-Si bond (654 cm−1) [44,45]690121436673117735685130635
Si-O-Si bending modes (800 cm−1) [47,66]777893147748933379083280
Orthosilicate (850 cm−1) [67]89187239881871568734147
Q2(950 cm−1) [46,47,48,55]941592539507677495279811
Q3′(1020 cm−1) [46,47,48,68]10181051442101672841101456513
Q3′‘(1080 cm−1) [46,47,48]10847048410768717151077832234
Q4(1140 cm−1) [46,47,48,55]114568176115968150115688407
Symmetric stretching of BO3 units
(1200 cm−1) [31,35,43]
1227926812299264---------
BO3-BO4(1300–1450 cm−1) [28,29,30,31]141662121144987201---------
BO3-BO3(1450–1600 cm−1) [28,29,30,31]14767420215124530---------
** The Gaussian component at 641 cm−1 for 20B47Si glass can be assigned to danburite and reedmergnerite rings.
Disclaimer/Publisher’s Note: The statements, opinions and data contained in all publications are solely those of the individual author(s) and contributor(s) and not of MDPI and/or the editor(s). MDPI and/or the editor(s) disclaim responsibility for any injury to people or property resulting from any ideas, methods, instructions or products referred to in the content.

