Article

A Cloud-Based Cyber-Physical System with Industry 4.0: Remote and Digitized Additive Manufacturing

1
Department of Mechanical and Production Engineering, Ahsanullah University of Science and Technology (AUST), Dhaka 1208, Bangladesh
2
Department of Industrial and Production Engineering, Bangladesh University of Engineering and Technology (BUET), Dhaka 1000, Bangladesh
3
Department of Mechanical Engineering, IIT Palakkad, Palakkad 678557, Kerala, India
*
Authors to whom correspondence should be addressed.
Automation 2022, 3(3), 400-425; https://doi.org/10.3390/automation3030021
Submission received: 8 June 2022 / Revised: 21 July 2022 / Accepted: 27 July 2022 / Published: 1 August 2022
(This article belongs to the Special Issue Digital Twins, Sensing Technologies and Automation in Industry 4.0)

Abstract

:
With the advancement of additive manufacturing (AM), or 3D printing technology, manufacturing industries are driving towards Industry 4.0 for dynamic changed in customer experience, data-driven smart systems, and optimized production processes. This has pushed substantial innovation in cyber-physical systems (CPS) through the integration of sensors, Internet-of-things (IoT), cloud computing, and data analytics leading to the process of digitization. However, computer-aided design (CAD) is used to generate G codes for different process parameters to input to the 3D printer. To automate the whole process, in this study, a customer-driven CPS framework is developed to utilize customer requirement data directly from the website. A cloud platform, Microsoft Azure, is used to send that data to the fused diffusion modelling (FDM)-based 3D printer for the automatic printing process. A machine learning algorithm, the multi-layer perceptron (MLP) neural network model, has been utilized for optimizing the process parameters in the cloud. For cloud-to-machine interaction, a Raspberry Pi is used to get access from the Azure IoT hub and machine learning studio, where the generated algorithm is automatically evaluated and determines the most suitable value. Moreover, the CPS system is used to improve product quality through the synchronization of CAD model inputs from the cloud platform. Therefore, the customer’s desired product will be available with minimum waste, less human monitoring, and less human interaction. The system contributes to the insight of developing a cloud-based digitized, automatic, remote system merging Industry 4.0 technologies to bring flexibility, agility, and automation to AM processes.

1. Introduction

3D printing, or additive manufacturing (AM), is an emerging, digital, and collective advanced manufacturing technology that enables one to build a part in a layer-by-layer approach by adding material instead of cutting it, as opposed to subtractive manufacturing processes such as machining [1]. The material is fused to an ambient temperature and the material is deposited along a controlled path by G codes generated directly from CAD models. Many additive manufacturing technologies, such as fused deposition modeling (FDM), selective laser sintering, inkjet modeling, and stereo-lithography, are available on the market. Due to its ability to securely produce complex geometrical components in an office-friendly environment, fused deposition modeling (FDM) is the most widely used of these processes. The AM process does not require any tools or dies, which turns AM into a remarkable process for manufacturing various customized parts, with enhancements on a daily basis providing products with better dimensional accuracy, strength, and surface roughness [2]. The elimination of tooling, fixturing, and intermediate steps in AM enables easier low-volume product manufacturing with wide variety, bringing about a revolutionary change in mass production. This manufacturing paradigm change poses new opportunities and challenges for quality control in AM, such as in situ process monitoring, part-to-part quality prediction, statistical process control, statistical transfer learning, and compensation, as well as challenges related to AM processes, the design of experiments for AM, and model uncertainty quantification [3].
Product shape accuracy and AM build accuracy prediction have been key concerns in ML4AM (machine learning for AM) due to increased access to AM data. At present, the fully automated and decentralized concept of manufacturing is focused on customers in a more efficient and optimized manner. In manufacturing, the digital manufacturing concepts refer to the application of computer systems to manufacturing products, processes, supply chains, and manufacturing services and enable visibility in real-time manufacturing [4]. With the integration of Artificial Intelligence (AI), AM has benefited from digital and intelligent manufacturing [5]. However, with the emergence of Industry 4.0, the concept of DM is changing by keeping focus on the closed-loop control of real-time data utilization as well as networked production facilities in order to provide flexible, resilient, and data-driven production [6]. The emerging I4.0 technologies—the Internet of Things (IoT), Cyber-Physical Systems, augmented reality, Artificial Intelligence, Blockchain, cloud computing, Big Data and additive manufacturing (AM)—have provided a new environment for manufacturing to become intelligent and digital [7]. Industry 4.0 defines a production-oriented Cyber-Physical System (CPS) that combines warehousing systems, production facilities, logistics, and even social requirements in order to build global networks of value creation [8]. This is a technique which can turn the traditional machine-based production system into a digital and Artificial Intelligence-based system that allows machines to organize and interact according to the situation, without the need for human–machine interaction (HMI) to control and direct the production flow [9]. The production process is unique and authenticated because it offers product and process information in real-time and provides a better approach to existing problems and challenges. This concept is composed of specific manufacturing aspects for the internet and Cyber-Physical Systems. CPS systems enabled in AM help to enhance DM more easily than conventional manufacturing (CM) processes [10]. CPS systems need to control computation, sensing, and communication, of the physical processes involved for AM. Therefore, CPS methodology for the co-design of real-time control and customized computation systems may make the AM process more accurate and controlled. Moreover, the integration of CPS in the AM-manufactured goods makes the supply chain more robust and flexible [11]. Industry 4.0 incorporates terms related to communication networks, the internet, manufacturing networks, supply chains, and logistics. This means that the practical transition from traditional production systems to smart factories is also a challenge for researchers [
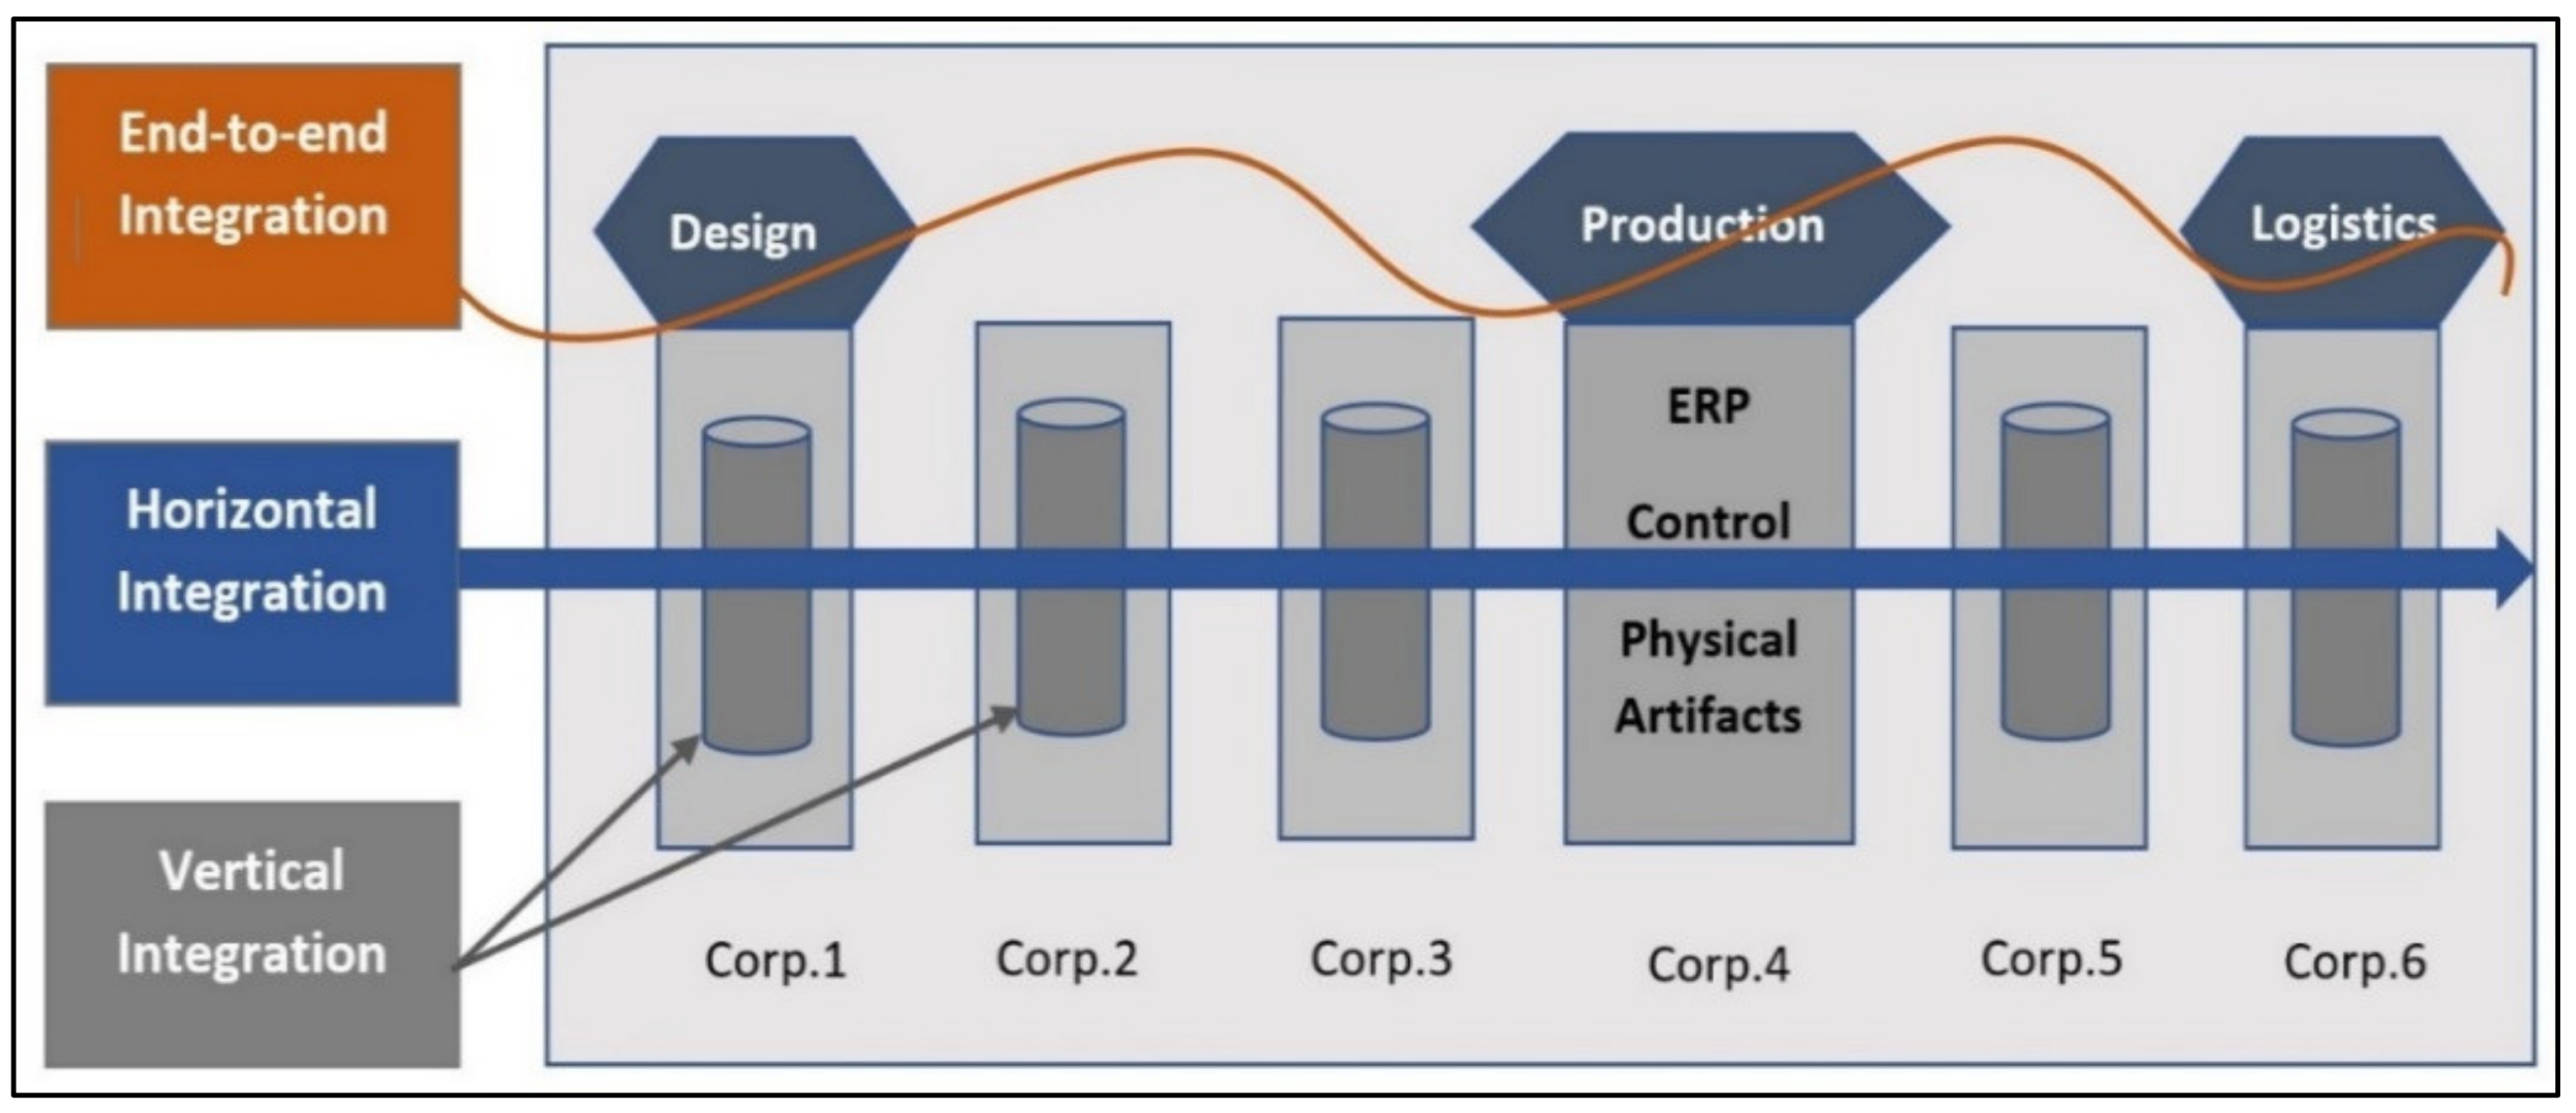
12]. Regarding the optimal implementation of I4.0, the following three main features can be considered: (1) vertical integration through value networks, (2) horizontal integration and networked manufacturing systems, and (3) end-to-end digital engineering convergence across the entire spectrum of the value chain[13]. Figure 1 shows a value chain of I4.0 which illustrates the three kinds of features and how they relate [14]. An efficient ecosystem is formed through horizontal integration of the inter-corporations by affiliated companies. There are many physical and information subsystems operated by a company. One aspect of horizontal integration through value networks is to make one corporation compete with several other similar corporations [13]. Vertical integration is the key to creating a flexible and changeable production system. A self-organized structure is created by the smart machines through this digitalization and automation that can be continuously reconfigured to match various product types. Vast information is gathered and stored to render the manufacturing process transparent [15]. In end-to-end engineering integration, a reliable and continuous product model may be reused by convergence at any stage [16]. Therefore, I4.0 anticipates vertically integrating hierarchical subsystems to transform the traditional factory into a highly reconfigurable and flexible manufacturing system to implement the smart factory. This plays a critical role in supporting customized and small-lot consumer requirements. The smart factory is the critical foundation for the other two types of integration, namely horizontal integration through value networks and end-to-end digital engineering integration.
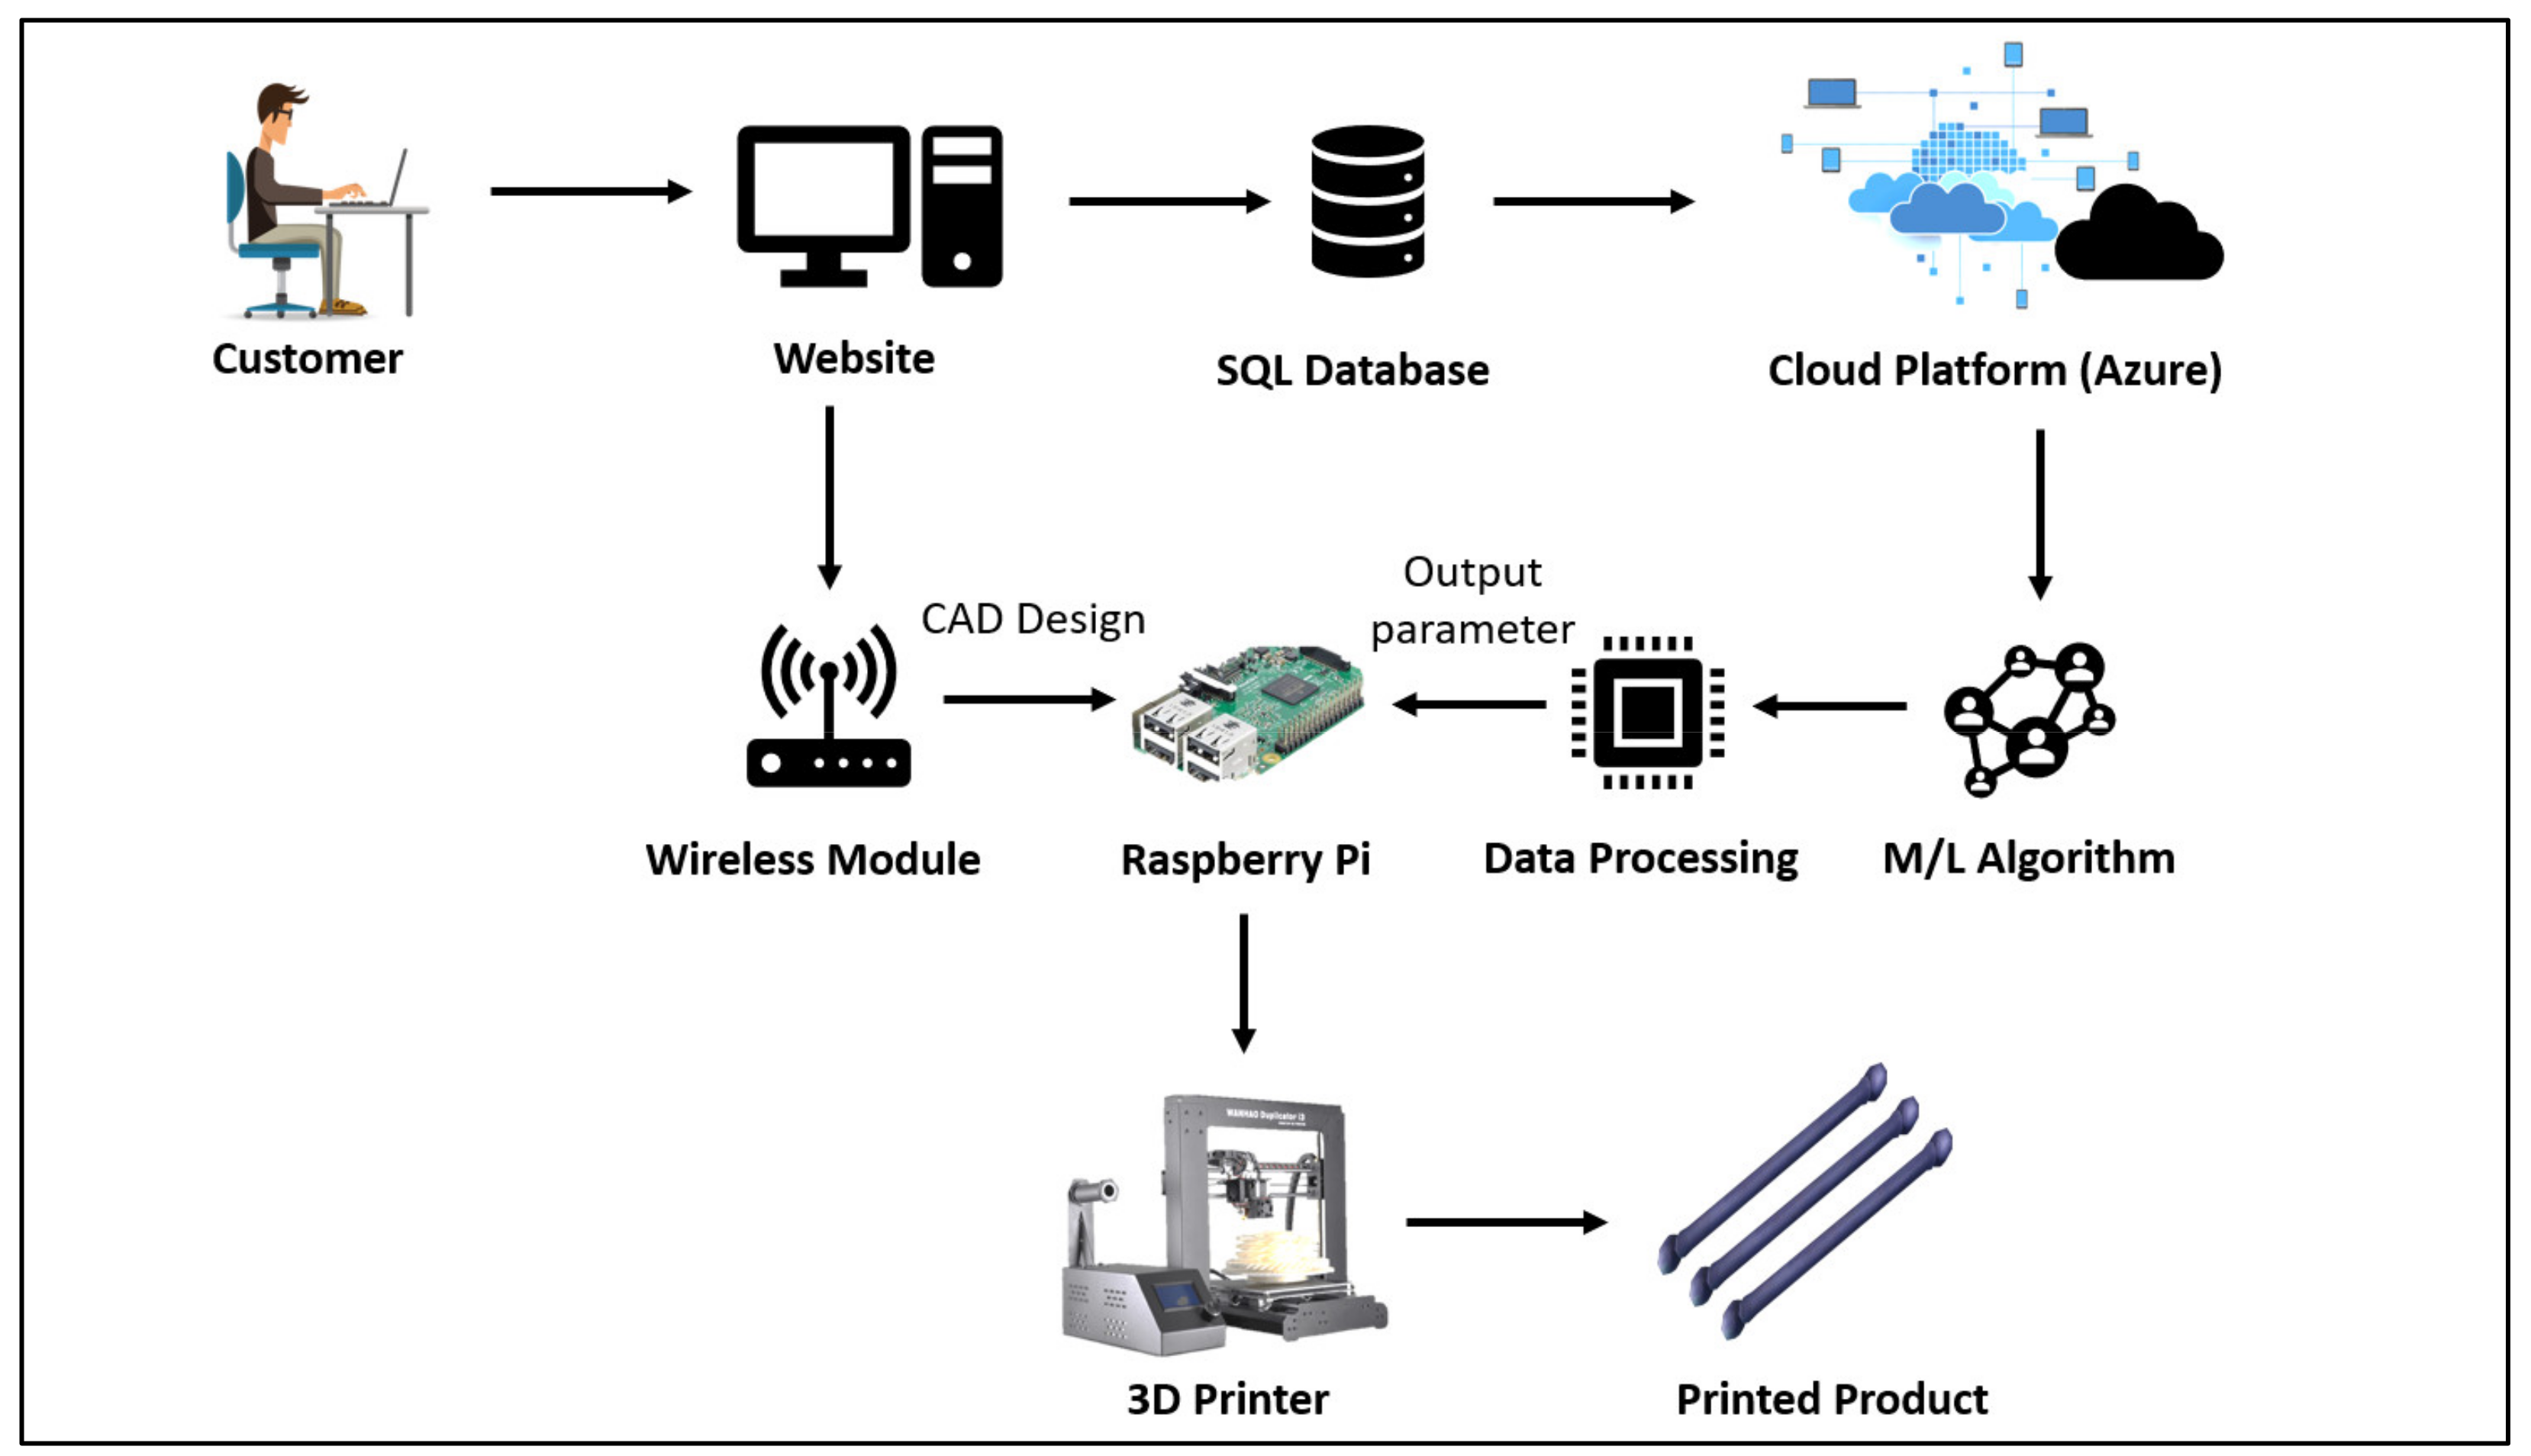
The complete architecture is depicted in Figure 2, beginning with the data processing pipeline at the device/factory layer and progressing to intelligent, digital, and autonomous applications or dashboards at the application layer. Figure 2 shows a layer view of the Internet of Things schematic for the I4.0 platform. Machine and production house smart gadgets and tools (such as smartwatches, sensors, glasses, and smartphones) that provide extended human–machine interfaces and functionality. Connecting system layers are used to transform data generated by factory layer devices into information. Aside from that layer, a massive amount of data is gathered in the cyber layer, and data are subsequently analyzed using machine learning algorithms.
Cloud computing has shown itself to be a disruptive technique. Current research focuses on cloud-based manufacturing (CBM), which is a networked production model that takes advantage of on-demand access to a shared set of distributed and diversified manufacturing resources to build reconfigurable production lines that improve performance, reduce product lifecycle costs, and allow for optimal resource allocation in response to customer-generated variable-demand tasks created [18]. Therefore, the objective of this paper is to implement a cyber-physical system by integrating customers’ requirement information to automate process parameters by machine learning and compare the actual and predicted output of the impactful process parameter with less human-to-machine intervention.
This work aims to turn conventional additive manufacturing into intelligent, automatic, and digital AM systems with Industry 4.0. For that purpose, a framework is developed, and a methodological approach is presented in this work. To implement the framework, cloud platform machine learning has been integrated to predict process parameters via a remote CPS system. The methodological approaches have been synthesized in the results section. The study contributes towards developing a system that merges Industry 4.0 technologies for reducing human-to-machine interface and computing the AM process parameters for AM operation. Moreover, this work presents a novel approach for remote access to AM and a user-driven support tool to predict process parameters. Therefore, the framework in this paper can influence the growth of existing AM and considerations for future AM technology for remote locations. The main success of this work lies in the implementation of an Industry 4.0 framework to provide insight to practitioners about the automation and digitization of AM processes.

2. Materials and Methods

2.1. Material

The filament material passes through a nozzle in the FDM process in order to print the desired component. PLA is one of the most commonly used thermoplastics in FDM. As it is a biodegradable thermoplastic, the use of PLA is growing. It requires less energy and temperature to process high-quality prototypes and usable components. The PLA material used in this research, which has low warp, higher tensile strength, and low ductility, is available for PLA [19] and its mechanical properties are shown in Table 1. Figure 3a shows the PLA material used in this research.

2.2. 3D Printer

The printer used to fabricate the product is an FDM printer. It is a widely used 3D printer technology which has the largest installed base of 3D printers globally and is often the first technology people are exposed to. The product was printed on an Ender 3 Pro, shown in Figure 3b. The 3D printer is capable of printing any digital model within the printing size of 220 mm × 220 mm × 250 mm. Specifications of the 3D printer (Ender 3 Pro machine [21]) are shown in Table 2.

2.3. Architecture of CPS towards Digital Additive Manufacturing

Cloud manufacturing is the concept of a cloud-based intelligent manufacturing model which shares manufacturing resources and capabilities [22]. Cloud computing is the major enabler of cloud manufacturing, allowing for product innovation with business strategy and the creation of intelligent factory networks [23]. Moreover, consumer-based services in the cloud have also recently become popular. Therefore, the need arises for platforms where users can find similar design models and re-configure the model according to their needs before subsequently printing them via cloud platforms which convert the manufacturing process into a digital one [24]. Additionally, the cloud platforms are developed to schedule and manage distributed FDM-based 3D printing resources, which is a part of AM digitalization. Various instantly needed parts can be fabricated quickly with the AM technology, which can reduce lead time, ensure safety stock in the product supply chain, and ensure the rapid availability of required items in remote facilities [25]. Therefore, the requirement for a remote AM manufacturing system is increasing for supply chain responsiveness. The remote system will make the AM more customer-oriented and create a less human-to-machine interface. Thus, the purpose of this work is to create an autonomous, remote, and digital system where less human–machine interaction is required. The conventional workflow of 3D printing is illustrated in Figure 4. When a new product order or customized product order is obtained from a customer, product design is realized through CAD. The fabrication process begins with designing the digital CAD file of the product from the customer. Slicing software is used for G code generation with defined printing parameters. The operator then sends the G code to the 3D printer as a tool path instruction and the product is fabricated in the 3D printer. The traditional workflow has only local area coverage and cannot be overseen remotely. Thus, for a given input in the 3D printer, human-to-machine interactions are necessary. As a result, the traditional procedure has constraints such as low latency, not being as scalable as a cloud platform, and having limited storage and processing capacity. Therefore, a CPS system with horizontal integration of the machine learning method is required to solve multivariable optimization.
To overcome the above-mentioned shortcomings, a cloud-based digital AM framework is proposed, as illustrated in Figure 4. Currently, there is a requirement for further development of CPS and cloud manufacturing which presents diverse concepts, workflows, and capabilities [26]. Therefore, this research is intended to create a web-based integrated system for both the customer and manufacturer, thereby lowering the physical barrier between the fabrication processes. For that, the customer order is received from a website where an SQL server is integrated that stores the information of every order. The desired mechanical property value of the parts is uploaded to the SQL server hosted on a cloud platform. The stored data of every order were separated into two portions, one for training the machine learning algorithm, and another for testing it. The cloud platform is integrated with the machine learning algorithm, which is used to predict the outcome and make forecasts of process parameters by estimating between values. After the completion of the machine learning algorithm prediction, it was tested and validated. A microprocessor-based minicomputer is connected to the physical machine (3D printer) with a virtual system and manages the DM control system by using Octoprint slicing software. With the help of slicing software, the digital fabrication process takes place remotely. Therefore, the computer is used to transport the generated output data to the 3D printer. Mainly, the computer can set up a three-dimensional CAD model following the real work of the operation. The DM framework of this project is illustrated in Figure 5, where every step of the workflow can be seen clearly.

2.4. Implementation of CPS Architecture

2.4.1. Remote Control of 3D Printer

The additive manufacturing process can take a long time to fabricate complex product shapes, thus necessitating a remote monitoring system. For that purpose, an electronic device, such as a Raspberry Pi, BeagleBone, or Arduino, is needed to operate the 3D printer from a distance, generally wirelessly. In this study, a Raspberry Pi was used to operate the 3D printer remotely. Figure 6 shows that the Raspberry Pi minicomputer, used to send the optimized data from the cloud platform to the 3D printer remotely, is connected to the 3D printer physically, with a wireless connection required to connect to the cloud platform. The specifications of the Raspberry Pi 3B+ are shown in Table 3.
The Raspberry Pi was connected to the 3D printer using a micro-USB B3 cable. To connect the printer to the internet, at first Octoprint was installed on the Raspberry Pi. The Raspberry Pi was then connected to the internet and the IP address for reaching the Octoprint server was obtained. Octoprint is an open-source 3D printer controller program that provides a web interface for printers that are linked to it. The status and essential parameters of printers are displayed, and users are able to schedule prints. The digital CAD file for printing is uploaded to the Octoprint server and then sliced by Octoprint using the obtained optimized data. The extruder temperature and the bed temperature were then set. After starting the print, the process, including machine bed temperature, print percentage, and print time left, was monitored through the Octoprint server, as illustrated in Figure 7. The figure shows that the fabrication status of the print, whether printing is going on or not, total printing time, time left to complete the print, and the percentage of printing can be visualized. Figure 7 displays that Octoprint is connected to the 3D printer via the internet, yet printing has not been started. With the optimized data, the generated G code is given as input to Octoprint, and the printing is started remotely.

2.4.2. Machine Learning Algorithms for Optimization

Microsoft Azure is used for the machine learning segment as it offers a unique feature that runs all the complex machine learning algorithms without executing a single line of code. Here, AI tools can execute codes for all kinds of machine learning algorithms after giving the proper parameter values and weights, which thus works in a similar way to machine learning algorithms made manually by writing codes. Moreover, Azure machine learning is also integrated with python and Jupyter notebook [28]. Microsoft Azure also offers a variety of services such as Power BI, virtual machines, SQL services, different app development tools and databases, IoT tools, API services, a firewall service, a gateway service, and security gateways. In this study Microsoft SQL server was used to gather information on customers’ demands and Microsoft Azure was used as a hub where machine learning was integrated to process the process parameters. There are many intelligent ML (machine learning) algorithms and, for different input datasets and data types, each algorithm gives different results. For example, “Regression algorithms” predict outcomes and make forecasts by estimating the relationship between values. “Two class classifiers” answer simple two-choice questions, e.g., yes or no, true or false [29]. For forecasting problems, logistic regression and linear regression can be used to predict data. However, regression algorithms deal with simple and linear dependencies, whereas neural networks are complex and able to solve nonlinear problems. Therefore, the neural network performs better when solving nonlinear and complex multivariable problems. Multi-layer perceptrons, or MLPs, are classical feed-forward neural networks that are applied to solve exceedingly difficult issues, such as fitness approximation, time series prediction, pattern recognition, machine translation, and speech recognition with supervised learning [30]. Due to the simplicity of learning, MLPs can estimate any input or output. However, MLPs need a good set of data for the training step. Typically, MLPs consists of three layers: first is the input layer, then the hidden layer, and finally the output layer [31]. Typically, the relations among the neurons help to calculate complex problems from the input layer to the output layer. Mainly, the biases and weights of MLPs are calibrated during the training phase, which helps to predict the data with minimum error [32]. The MLP neural network was chosen for this research. The main purpose of using the MLP in this study was to predict the required process parameters with reasonable performance and with less error from the SQL server database. As a result, the required customer product can be fabricated in a more optimized way and make the cloud-based digital AM service more customer-oriented. The flow process of MLP model development in this study can be seen in Figure 8.
In the beginning, the input and output layers were defined for machine learning model development. In this study, the customer-given mechanical property is the input; therefore, the tensile strength and material name are the inputs. The machine learning algorithm will predict the process parameters from the customer requirement. Accordingly, the layer height and infill percentage are the outputs. Therefore, there are two-unit neurons in the input layer and two-unit neurons in the output layer. The data stored in the SQL server are used to train, test, and validate the model. Among the data, 70% are used for training, 15% for testing, and 15% for validation. The Sequential model is used to expand the network layer. This layer of the MLP architecture was connected (or ‘Dense’) to nodes being linked to the input and output to allow learning based on the previous layer’s combination of characteristics. For the MLP model with multi-output variables and multi-input variables, the stages involved in building the learning model are expressed by the equations below:
m = 1, ……, M
n = 1, ……, M + 1
M = Number of hidden layers
Layer output = Lo
Hidden layer input = Hn
ReLU activation function = R
Threshold value = Pa
Lo = RHn + Pa
and,
No = SYN+1 + Pb
where
No = Network Output
S = Softmax Function = f(lm)
YM+1 = Output layer’s input
Pb = Threshold value
Here, the purpose of using ReLU as the activation function is the capability of being a non-linear function which has faster training ability than the Sigmoid function [33]. The Softmax function is also used as it is a regression-based multiclass classification activation function [34]. Moreover, the adaptive activation function outperforms the fixed activation function in terms of learning capabilities because it allows the network to forecast a better solution by training the activation function parameters throughout the training phase. As a result, adaptive activation functions boost the network’s generalization and ability to deal with real-world applications. Therefore, the Rowdy function [35] and Burger Function [36] as adaptive functions have been applied in the first layer. Furthermore, the Adam optimizer is applied in this work because it is a high-efficiency method for first-order gradian-based optimization based on the adaptive estimate of lower-order moments [37]. Due to a lack of knowledge regarding the optimal guidelines for creating the NN structures, the number of hidden layers was then chosen by trial and error until the Mean Square Error (MSE) was as low as feasible. As a result, the ANN network structure was developed with 2 hidden layers with 10 units of neuron and 5 units of neuron, respectively. The MLP model architecture is 2-10-5-2, which is shown in Figure 9. Finally, the MLP model was ready to be deployed on the Azure web and the python script of the MLP model is attached in the Appendix A.

2.4.3. Implementation of Web Service for Customers

Cloud manufacturing (CM) is network-based manufacturing technology with the integration of cloud computing, the Internet of services, IoT, and Big Data [38]. Cloud manufacturing is a reliable, economical, safe, and on-demand service, as CM implies easy visualization, collaboration, and servitization of manufacturing resources through dedicated networks [39]. Therefore, the main aim of CM is to gain optimum resource allocation of manufacturing technology in the form of services in order to reduce costs. Though AM is close to the I4.0 principle, AM still requires lots of work physically and needs to be more data-driven and customer-oriented. An overview of the features of CM for this study is illustrated in Figure 10.
CM starts with the consumer’s requirement for the desired product. From webhost bd, a local host website, customers’ orders can be placed. Firstly, the CAD file and customer-required mechanical properties, such as tensile strength, are given as input from the customer in the cloud platform via the web browser over the internet, which implies easy visualization of the product shape. Microsoft SQL Server, a relational database management system (RDBMS) [40], is used to store the information of every order. In the cloud platform, for each customer, the order is organized as per a specific customer catalog and an administrator is set to check if any manufacturing restrictions are presented. Figure 11 shows the website interface where the data of the desired product were given.
The cloud platform is enabled with Microsoft Azure, a machine learning platform, to optimize the fabrication process to ensure fast and efficient use of resource data. Moreover, customers can provide data for their desired product with possible customizations. These data will go to the Microsoft SQL Server to be stored accordingly so the optimized parameter can be obtained with a machine learning algorithm. The stored data of every order are separated into two portions, one for training the machine learning algorithm, and another for testing it. There are 50 data used in the SQL server for this study and, among them, 25 are for PLA material and 25 are ABS material. An overview of the sample data in the SQL database has been presented in Table 4.

3. Results and Discussion

3.1. Control Layer: System Integration in Remote 3D Printing

The remote system integration aims to bring together the components and subsystems of automatic 3D printing, process parameters prediction, and remote systems into one system so as to ensure that the system’s functions can operate together. The remote system integration can be visualized through Octoprint, shown in Figure 12. Mainly, the printing status, fabrication percentage, and other states can be seen from Octoprint. After setting up a remote connection using Octoprint, as shown in Figure 7, the system integration operation and status is presented, as can be seen in in Figure 12. The printing environment can be remotely controlled using the system. For example, the targeted nozzle temperature, bed temperature, and fan control can be set remotely. In Figure 12a, the two red lines show the temperature of the extruder, one for the target temperature and another one showing the actual temperature. Similarly, the blue lines are showing the machine bed temperatures. This temperature can be changed in between printing for improvised printing. The heated bed also adds adhesion, ensuring that the initial layer adheres firmly to the bed and that the portion does not fall off. It is crucial to get these temperatures correct since they can be the difference between a failed print and a good one. A live video of the printing process can also be viewed in Figure 12b, allowing the user to stay up to date on the state of the fabrication process. Any errors that occur can be noticed on the live video and appropriate actions taken from printing control. Users can also set the offset value and control the feed rate if required. Furthermore, the system can view the file query from the database. As a result, the system integration serves as a communication tool in the CPS architecture, using Raspberry Pi for controlling the 3D printer. The system integration involves integrating disparate systems in such a way that a focus on increasing the value to the fabricated product by providing live monitoring and remote access to the machine can be realized.

3.2. Data Layer: SQL Database Approach

In this study, the data from the customer’s end was directly connected to the SQL database server in Azure. The dataset was split into training data (70%), test data (15%), and validation data (15%) and uploaded separately to the SQL server. In the Azure machine learning portal, the dataset was imported from the SQL server using the ‘Import Module’, as illustrated in Figure 13.
The database query is selected in the Import Module; thus, the program module sends the requests to the SQL server and then establishes the connection. Mainly, a connection is established with the database via the Import Module. After importing the dataset, the database query can be seen in the Microsoft SQL Server. The selected data query in the Microsoft SQL Server is shown in Figure 14. The customer data can be seen in this SQL server.

3.3. Cyber Layer: Machine Learning Optimization in the Cloud Approach

The machine learning algorithms are to be set for predicting values. After saving data in the SQL server, the data are sent to the MLP neural network machine learning algorithms which are programmed in python using the Azure workspace. The MLP model has been tested and validated utilizing the training data from the SQL database. The epoch is the last iteration of the optimization algorithm through the training dataset before termination, which is a crucial element in the optimization process. To evaluate the performance of the model and to reach the error goal, the model parameters were adjusted. In this study, the Mean Square Error (MSE) was employed, with respect to the epoch, as the performance function, as shown in Figure 15.
Normally, the error value is reduced with the increase in epoch number. Figure 15 illustrates that the error value of training, testing, and validation becomes stable after 13 epochs. Therefore, the best performance is recorded at epoch 13, with a minimum MSE value. Furthermore, there is no overfitting or underfitting problem since the training, testing, and validation lines all show the same sort of trend and no gaps between them. A regression analysis has been conducted to predict the infill percentage and layer height, which visualizes the proposed MLP model’s performance. The predicted infill percentage and layer height have been compared to the SQL database data. Figure 16 displays the error magnitude of the predicted data with respect to the SQL data.
In Figure 16, the error magnitude of predicted layer height and infill percentage versus the actual value is shown. Normally, the error of the infill percentage is ±5, which is close to the baseline. However, the infill percentage errors of 7, 18, 20, 32, 39, and 43 are distant from the baseline. Moreover, the error observations of 3, 15, 27, 28, 31, and 43 are likewise distant from the baseline. Such inconsistency is not ideal for forecasting process parameters. As both layer height and infill percentage are the principal contributors to the tensile strength of the FDM 3D printed part [41], there remains a need to validate or justify if their (infill percentage and layer height) combined predicted value can meet the tensile strength requirements of the part. Furthermore, those inconsistencies appear as a result of a lack of large amounts of data. If the SQL database data capacity can be increased, the MLP model can perform better. In such conditions, the MLP model has predicted layer height and infill percentage with a significant coefficient of determination, with an R-square value of 94.23% and MAPE value near 8.926%. Therefore, the R-square value (94.23%) means 94.23% of the variance of the layer height and infill density data possess good co-relationship with the variance of the material and tensile strength variable. Therefore, it is worth noting that the proposed model has a good fit between the predicted and the experimental data. Furthermore, the MAPE of the predicted data is less than 10%, which provides excellent context for the MLP model in this study. Table 5 displays additional predicted performances, such as RMSE and MAE assessment summaries.
Figure 17 depicts the error % of the predicted data to visualize how many big errors occurred in the prediction. The same type of error magnitude has been reflected in the error percentage. There are 31 observations with a predicted infill error percentage of 10%, and 39 observations with a predicted infill error percentage of 15%. Furthermore, 34 observations are within the 10% error, and 41 observations are within the 15% error. Such errors can be reduced by expanding the dataset. If the system can be implemented, more data will need to be stored in the SQL database so that the data can be utilized to get more accurate predictions from the MLP model.

Adaptive Learning Comparison

The Burger activation function outperforms the ReLU and Rowdy activation functions in adaptive learning. The Burger adaptive activation has an R2 value of 96.4%, while the ReLU function has a little lower R2 value of 94.23%. However, the Rowdy function has an R2 value of around 85.7%, which is lower than the activation function. Figure 18 displays a similar phenomenon in the error magnitude of infill and layer height magnitude versus the observation graph. The activation functions follow the same type of trend in terms of error magnitude; however, the Rowdy function predicted data divergence more than the ReLU and Burger function data. While predicting data, the ReLU and Burger functions converged. Rowdy predicted that statistics occasionally diverged by around 10% in infill density. The sudden peak in observations 7, 18, 32, and 43 indicates divergence of more than 10% infill density. The reason for the difference might be a lack of data to train the network and a reduced number of neurons. The layer height prediction, on the other hand, is not as smooth as the infill prediction. The layer height prediction with the functions shows a high degree of variability. The erroneous peak is more visible than the infill predicted data. The observations of 27, 28, 31, 43, and 46 have deviated more from the baseline. However, a significant finding from the Burger function is that it outperforms the ReLU function slightly. The accuracy is improved because the Burger function is a high gradient solution of a partial differential equation. ReLU is non-differentiable at zero and the negative input gradient is zero, implying that the weight has not been updated during backpropagation which results in dead neurons. As a result, the accuracy may be lower than that of the Burger function in this scenario, which requires additional investigation.

3.4. Deployment of the System

3.4.1. Web Service Deployment

The web service was deployed with the machine learning model in the Azure Cloud platform, where the MLP neural network was deployed on the web for the optimization process. Therefore, the MLP neural network model has turned into a ‘Predictive Experiment’ from a ‘Training Experiment’ in the cloud platform. For this purpose, a web module was created from the earlier step (Figure 13). Azure then created an algorithm based on the selected machine learning model and parameters given in the earlier step. This is the web form in Azure of the model built earlier. Next, the model was developed as a web service and published in the Microsoft web library. Thus, the model became ready to start the machine learning process and give output based on the given inputs. After deploying the trained model, it can be viewed and used from the Microsoft web library, as shown in Figure 19. The ‘√’ sign denotes the steps completion of system integration in the Microsoft Web service. The Microsoft web library is a place for keeping all the machine learning algorithms built over time by their users. It is similar to a library of open algorithms for users, where anyone can access and use any model built by other users.

3.4.2. Product Print

A digital CAD model was designed in Solid works software, as shown in Figure 20a. The CAD model was converted into an STL file format and uploaded to the web server. The desired tensile strength, as provided by the customer, was then given as input to the webpage (Figure 11) and, subsequently, the data were transferred to the SQL database query (Figure 14). With the proper connection setup, including a Raspberry Pi and 3D printer, the multi-layer perceptron (MLP) model takes the customer required data as input and predicts printing parameters. The predicted value for infill density is generated from MLP model prediction according to the desired tensile strength (Table 6). The optimized data from the MLP algorithm go directly to the printer from a distance via Microsoft Azure and the Raspberry Pi. After getting the optimized data from Microsoft Azure, Octoprint is used to generate the G code. With the G code, the digital fabrication process is run remotely. Figure 20b shows a product being printed.

3.4.3. Confirmation Test

With the CPS system, 20 ASTM D638 standard specimens were printed, as shown in Figure 21. Among them, 10 specimens were fabricated with PLA material (white-colored) and 10 specimens were fabricated with ABS material (black-colored).
As the predicted process parameters cannot be tested physically, the tensile strength of the parts can be compared to the customer input data (tensile strength and material) and the products fabricated using the model predicted process parameters via the CPS system. The tensile strength test was performed with the electromechanical universal testing machine UTM SM-1000 using a loadcell of 5 KN. Mechanical properties of FDM 3D printed PLA specimens were investigated at room temperature under a quasi-static tensile test with a loading rate of 1 mm/min. The customer request data and experimental data are shown with respect to predicted infill density and layer height in Table 6.
The desired tensile strength data and experimental data have been plotted in Figure 22, which shows that both are very close to each other. However, statistical analysis is required to measure the significant relationship between the two groups in order to validate the developed system.

3.4.4. Two-Sample t-Test

The paired sample t-test was applied to determine whether the mean difference between the customer’s desired tensile strength and the experimental tensile strength was zero. To conduct the statistical test, a null hypothesis was made that the two groups are equal. Therefore, the alternative hypothesis is that both customers’ desired and experimental tensile strength are not equal. Table 7 summarizes the results of the two-sample t-test conducted using Minitab 2021.
The t-value from the t-test is close to 0.002, showing that there is not much difference between the two groups. Because the t-value is so little, the similarity between the two groups is greater. Furthermore, the p-value is 0.986, showing that the null hypothesis has a 98.6% probability of being true. Therefore, there is a 98.6% probability that the customer desired and experimental tensile strength are the same. Comparable results can be observed in Figure 23, which depicts the individual value plot and boxplot of customer input and experimental value from the t-test. The boxplot shows that the middle quartile of customer input is 24.5 and the experimental middle quartile is 23.47, which is quite close to the experimental middle quartile.

3.5. Comparison with Existing Work and Practical Implications

In this work, machine learning and cloud platforms have been applied to AM in order to turn the AM process into an automated, digitized, remote system. Cloud-based systems have become an integral part of making AM a cyber system. For example, a micro AM system has been developed which can start, alter, and stop the fabrication process via mobile, tablet, or PC, with real-time communication sharing time, performance, and current information [42]. Moreover, the order processing in AM can be performed online for multi-3D printing, where linear programming is applied to solve the scheduling problem of the multi-3D printer [43]. Quality monitoring is also performed using deep learning and cloud computing in the AM process with the cyber-physical system [44]. Cloud-based IoT-enabled systems integrate resources, such as test data, 3D printers, and materials, to support fabrication assistance as well as design and process planning [45]. A dynamic AM machine identification system is created by combining inputs from the smart ANN algorithm applied in an IoT interface for real-time predictions to create a cyber additive design for manufacturing systems that can dynamically assign digital designs to various AM methods through a cyber network [46]. On the other hand, in situ surface defect identification utilizing a cloud platform and machine learning can be an innovative technique, with 93.18% accuracy, for transforming AM operations into intelligent systems [47]. Artificial intelligence is applied in decision making, process control, and improving the quality of AM to become a smart, intelligent, digital manufacturing system. Deep neural networks are used to classify the melt pool for separating the defective products non-destructively in selective laser melting AM [48]. During COVID-19, additive manufacturing (AM) has been used to create agricultural equipment utilizing a low-cost smart remote monitoring system based on Node-red and Octoprint connected to 3D printers to train a model to detect print errors with 75% accuracy [49]. However, this work has used a cloud platform for remote and automated access to 3D printers and utilized machine learning to predict the process parameters for turning AM into a digitized, automated, remote, and customer-driven system. This study is an example of cloud AM, which uses cloud computing to produce goods remotely in an automated manner. The intelligent and digital system may aid the client in producing process parameters using machine learning without the assistance of an operator. Industries may install this sort of system in their production line to use fewer workers and decrease lead time by using the automatic system, since the worker will no longer spend the time inputting process parameters. The expansion of current AM can be applied to enable future AM technologies for remote locations, such as the Army’s Mobile Parts Hospital or Rapid Equipping Force Expeditionary Lab, etc. This sort of remote technology has the potential to boost agility in AM service. Furthermore, this kind of distributed manufacturing may be used in small and medium-sized businesses when batch orders are placed through a cloud platform. This work has the potential to be a catalyst for future social manufacturing. Practitioners may gain insight into the actual implementation of automated services for digital AM using Industry 4.0 technology.

4. Conclusions

This paper focuses on a cloud-based manufacturing system, an enabler for I4.0, to develop an autonomous network where order details go directly to the web platform employed for fused deposition modeling (FDM) 3D printing. Moreover, the printing status can be controlled and monitored remotely through the integrated system. As customer requirements are stored in a database, the web-based system paves the way for making AM processes flexible to customer service via a cloud platform with an I4.0 perspective. Therefore, the benefit of this project lies in the successful and effective deployment of the automated and remote system, thus minimizing human supervision.
A front-end website collects the orders and accumulates the orders in the back-end system. The customer data will go to the SQL database in the Azure cloud platform, where MLP machine learning is integrated. The MLP model will predict infill density and layer height for that CAD file. The predicted parameters can then be used to generate the G code using Octoprint slicing software. Thus, the slicing software is used to control and monitor the fabrication process remotely.
The multi-layer perceptron neural network is included in the Azure machine learning studio to deal with process parameter prediction. The MLP model can considerably predict data, with a significant R2 value approaching 94.23% and an excellent MAPE of 8.926%. According to the paired t-test, there is a 98.6% chance that the customer required tensile strength and the experimental tensile strength from the predicted process parameters are the same. Furthermore, Octoprint, the slicing software, is the remote enabler of the digital manufacturing system through input data optimization. The FDM machine is linked to Octoprint through a Raspberry Pi to successfully transmit data from the SQL database. As a result, the framework is effectively implemented into the FDM process by reducing the human–machine interface using Industry 4.0 technologies.
The key challenge in this study is to synchronize all the stages employed in this study, as there is a multi-environment for different tasks. Moreover, interoperability and performance aspects are the main barriers in this work. The challenges can be overcome if the cloud platform becomes more robust, versatile, and scalable. The system is Internet-based, and production may suffer a revenue loss if the Internet fails. Furthermore, there is no adequate guidance for optimizing the MLP neural network. However, a hybrid approach, such as swarm intelligence which may be self-organizing and extremely scalable, can be incorporated with the MLP. Moreover, only layer height and infill percentage have been explored in this study. There are more process parameters, such as nozzle temperature, bed temperature, wall thickness, raster angle, printing speed, etc., which can be applied to obtain more correct results from the predictions. More features can be added to the cloud platform, such as live tracking, mobile notification, lead time show, etc. Finally, in the context of the Industry 4.0 paradigm, the CPS system must interface with future smart manufacturing equipment to make the production process more agile, adaptable, customer-oriented, and smart.

Author Contributions

Conceptualization. M.A.R., M.S.S., M.S.A. and S.H.; methodology, M.A.R., M.S.S., M.S.A., S.H. M.A.I. and M.S.S.H; software, M.S.S. and M.S.A.; validation, M.S.S., A.A.R., M.A.I., M.S.S.H. and A.A.; formal analysis, M.S.S., M.S.A., S.H., M.A.I. and A.A.; investigation, M.A.R., M.S.S. and A.A.R.; resources, M.S.S. and M.S.S.H.; data curation, M.S.S., M.S.A., M.S.S.H. and S.H.; writing—original draft preparation, M.A.R., M.S.S., M.S.A., S.H., A.A.R., M.A.I. and A.A.; writing—review and editing, M.A.R., M.S.S. and A.A.; visualization, M.S.A. and A.A.; supervision, M.A.R.; project administration, M.A.R. All authors have read and agreed to the published version of the manuscript.

Funding

This research received no external funding.

Institutional Review Board Statement

Not applicable.

Data Availability Statement

Not applicable.

Acknowledgments

Not applicable.

Conflicts of Interest

The authors declare no conflict of interest.

Appendix A

The main portion of the MLP model programming is attached here below:
import warnings
warnings. filterwarnings(“ignore”)
import numpy as np
import pandas as pd
import tensorflow as tf
from tensorflow import keras
from sklearn.model_selection import train_test_split
import numpy as np
import matplotlib.pyplot as plt
conn_str = pyodbc.connect(‘DRIVER={ODBC Driver 17 for SQL Server}; SERVER=<server>; DATABASE= SQL_database_data;UID=<localhost>;PWD=<password>‘)
dataset = pandas.read_sql(sql=query_str, con=conn_str)
print(“SQL_database_data”, dataset)
X= dataset [[‘Tensile Strength (Mpa)’,’Material’]]
y= dataset [[‘Infill percentage’, ‘Layer height (mm)’]]
from sklearn.preprocessing import StandardScaler
sc = StandardScaler()
X_train = sc.fit_transform(X_train)
X_test = sc.transform(X_test)
model = keras.Sequential([
keras.layers.Flatten(input_shape=(2,)),
keras.layers.Dense(10, activation=tf.nn.relu),
keras.layers.Dense(5, activation=tf.nn.softmax),
keras.layers.Dense(2, activation=tf.nn.sigmoid),
])
model.compile(optimizer=‘adam’,
loss=‘mse’,
metrics=[‘accuracy’])
history = model.fit(X_train, y_train, epochs=200, batch_size=1, validation_data=(X_val, y_val))
y_pred = model.predict(X_test)
from sklearn.metrics import mean_squared_error
mean_squared_error(y_test, y_pred)

References

  1. Tareq, M.S.; Rahman, T.; Hossain, M.; Dorrington, P. Additive Manufacturing and the COVID-19 Challenges: An in-Depth Study. J. Manuf. Syst. 2021, 60, 787–798. [Google Scholar] [CrossRef] [PubMed]
  2. Bahnini, I.; Rivette, M.; Rechia, A.; Siadat, A.; Elmesbahi, A. Additive Manufacturing Technology: The Status, Applications, and Prospects. Int. J. Adv. Manuf. Technol. 2018, 971, 147–161. [Google Scholar] [CrossRef]
  3. Wang, Z.; Jiang, C.; Liu, P.; Yang, W.; Zhao, Y.; Horstemeyer, M.F.; Chen, L.Q.; Hu, Z.; Chen, L. Uncertainty Quantification and Reduction in Metal Additive Manufacturing. Npj Comput. Mater. 2020, 6, 175. [Google Scholar] [CrossRef]
  4. Suvarna, M.; Yap, K.S.; Yang, W.; Li, J.; Ng, Y.T.; Wang, X. Cyber–Physical Production Systems for Data-Driven, Decentralized, and Secure Manufacturing—A Perspective. Engineering 2021, 7, 1212–1223. [Google Scholar] [CrossRef]
  5. Charles, A.; Salem, M.; Moshiri, M.; Elkaseer, A.; Scholz, S.G. In-Process Digital Monitoring of Additive Manufacturing: Proposed Machine Learning Approach and Potential Implications on Sustainability. Smart Innov. Syst. Technol. 2021, 200, 297–306. [Google Scholar] [CrossRef]
  6. Pfeiffer, S. The Vision of “Industrie 4.0” in the Making—A Case of Future Told, Tamed, and Traded. NanoEthics 2017, 11, 107–121. [Google Scholar] [CrossRef] [PubMed]
  7. Jamwal, A.; Agrawal, R.; Sharma, M.; Giallanza, A. Industry 4.0 Technologies for Manufacturing Sustainability: A Systematic Review and Future Research Directions. Appl. Sci. 2021, 11, 5725. [Google Scholar] [CrossRef]
  8. Seeger, P.M.; Yahouni, Z.; Alpan, G. Literature Review on Using Data Mining in Production Planning and Scheduling within the Context of Cyber Physical Systems. J. Ind. Inf. Integr. 2022, 28, 100371. [Google Scholar] [CrossRef]
  9. Tao, F.; Qi, Q.; Wang, L.; Nee, A.Y.C. Digital Twins and Cyber–Physical Systems toward Smart Manufacturing and Industry 4.0: Correlation and Comparison. Engineering 2019, 5, 653–661. [Google Scholar] [CrossRef]
  10. Ndip-Agbor, E.; Cao, J.; Ehmann, K. Towards Smart Manufacturing Process Selection in Cyber-Physical Systems. Manuf. Lett. 2018, 17, 1–5. [Google Scholar] [CrossRef]
  11. Gupta, N.; Tiwari, A.; Bukkapatnam, S.T.S.; Karri, R. Additive Manufacturing Cyber-Physical System: Supply Chain Cybersecurity and Risks. IEEE Access 2020, 8, 47322–47333. [Google Scholar] [CrossRef]
  12. Okeme, P.A.; Skakun, A.D.; Muzalevskii, A.R. Transformation of Factory to Smart Factory. In Proceedings of the 2021 IEEE Conference of Russian Young Researchers in Electrical and Electronic Engineering (ElConRus), St. Petersburg, Russia, 26–29 January 2021; pp. 1499–1503. [Google Scholar] [CrossRef]
  13. Zhou, K.; Liu, T.; Zhou, L. Industry 4.0: Towards Future Industrial Opportunities and Challenges. In Proceedings of the 2015 12th International Conference on Fuzzy Systems and Knowledge Discovery (FSKD), Zhangjiajie, China, 15–17 August 2016; pp. 2147–2152. [Google Scholar] [CrossRef]
  14. Gunes, V.; Peter, S.; Givargis, T.; Vahid, F. A Survey on Concepts, Applications, and Challenges in Cyber-Physical Systems. KSII Trans. Internet Inf. Syst. 2014, 8, 4242–4268. [Google Scholar] [CrossRef]
  15. Nyberg, E.; Nilsen, S.; Freilich, J. The Adoption of Industry 4.0 Technologies in Manufacturing—A Multiple Case Study. KTH Industrial Engineering and Management, Stockholm, Sweden, 2016. [Google Scholar]
  16. Lu, Y.; Xu, X.; Wang, L. Smart Manufacturing Process and System Automation—A Critical Review of the Standards and Envisioned Scenarios. J. Manuf. Syst. 2020, 56, 312–325. [Google Scholar] [CrossRef]
  17. Wang, S.; Wan, J.; Li, D.; Zhang, C. Implementing Smart Factory of Industrie 4.0: An Outlook. Sage J. 2016, 12, 3159805. [Google Scholar] [CrossRef]
  18. Zhong, R.Y.; Xu, X.; Klotz, E.; Newman, S.T. Intelligent Manufacturing in the Context of Industry 4.0: A Review. Engineering 2017, 3, 616–630. [Google Scholar] [CrossRef]
  19. Ford, S.; Despeisse, M. Additive Manufacturing and Sustainability: An Exploratory Study of the Advantages and Challenges. J. Clean. Prod. 2016, 137, 1573–1587. [Google Scholar] [CrossRef]
  20. Travieso-Rodriguez, J.A.; Jerez-Mesa, R.; Llumà, J.; Traver-Ramos, O.; Gomez-Gras, G.; Rovira, J.J.R. Mechanical Properties of 3D-Printing Polylactic Acid Parts Subjected to Bending Stress and Fatigue Testing. Materials 2019, 12, 3859. [Google Scholar] [CrossRef]
  21. Creality Ender 3 Pro Best Budget 3D Printers for 2021|Creality 3D Printer. 2021. Available online: https://www.creality3dofficial.com/products/creality-ender-3-pro-3d-printer (accessed on 9 February 2022).
  22. Fisher, O.; Watson, N.; Porcu, L.; Bacon, D.; Rigley, M.; Gomes, R.L. Cloud Manufacturing as a Sustainable Process Manufacturing Route. J. Manuf. Syst. 2018, 47, 53–68. [Google Scholar] [CrossRef]
  23. Chen, G.; Wang, P.; Feng, B.; Li, Y.; Liu, D. The Framework Design of Smart Factory in Discrete Manufacturing Industry Based on Cyber-Physical System. Int. J. Comput. Integr. Manuf. 2019, 33, 79–101. [Google Scholar] [CrossRef]
  24. Yoo, B.; Ko, H.; Chun, S. Prosumption Perspectives on Additive Manufacturing: Reconfiguration of Consumer Products with 3D Printing. Rapid Prototyp. J. 2016, 22, 691–705. [Google Scholar] [CrossRef]
  25. Debnath, B.; Shakur, M.S.; Tanjum, F.; Rahman, M.A.; Adnan, Z.H. Impact of Additive Manufacturing on the Supply Chain of Aerospace Spare Parts Industry—A Review. Logistics 2022, 6, 28. [Google Scholar] [CrossRef]
  26. Apilioğulları, L. Digital Transformation in Project-Based Manufacturing: Developing the ISA-95 Model for Vertical Integration. Int. J. Prod. Econ. 2022, 245, 108413. [Google Scholar] [CrossRef]
  27. Buy a Raspberry Pi 3 Model B+. Raspberry Pi. 2018. Available online: https://www.raspberrypi.com/products/raspberry-pi-3-model-b-plus/ (accessed on 1 February 2022).
  28. Soh, J.; Singh, P. Introduction to Azure Machine Learning. Data Sci. Solut. Azur. 2020, 117–148. [Google Scholar] [CrossRef]
  29. Goyal, P.; Jain, S. Prediction of Type-2 Diabetes Using Classification and Ensemble Method Approach. In Proceedings of the 2022 International Mobile and Embedded Technology Conference (MECON), Noida, India, 10–11 March 2022; pp. 658–665. [Google Scholar] [CrossRef]
  30. Nehra, N.; Sangwan, P.; Kumar, D. Artificial Neural Networks: A Comprehensive Review. In Handbook of Machine Learning for Computational Optimization; Taylor Francis Group: Abingdon, UK, 2021; pp. 203–227. [Google Scholar] [CrossRef]
  31. Peng, Z.; Zhou, J.; Fang, X.; Yan, P.; Shan, H.; Wang, G.; Xu, X.G.; Pei, X. Data Augmentation for Training Deep Neural Networks. In Auto-Segmentation for Radiation Oncology; 2021; pp. 151–164. [Google Scholar] [CrossRef]
  32. Rana, A.; Rawat, A.S.; Bijalwan, A.; Bahuguna, H. Application of Multi Layer (Perceptron) Artificial Neural Network in the Diagnosis System: A Systematic Review. In Proceedings of the International Conference on Research in Intelligent and Computing in Engineering (RICE), San Salvador, El Salvador, 22–24 August 2018. [Google Scholar] [CrossRef]
  33. Lecun, Y.; Bengio, Y.; Hinton, G. Deep Learning. Nature 2015, 521, 436–444. [Google Scholar] [CrossRef] [PubMed]
  34. Lu, Y.; Shetty, S. Multi-Class Malware Classification Using Deep Residual Network with Non-SoftMax Classifier. In Proceedings of the 2021 IEEE 22nd International Conference on Information Reuse and Integration for Data Science (IRI), Las Vegas, NV, USA, 10–12 August 2021; pp. 201–207. [Google Scholar] [CrossRef]
  35. Jagtap, A.D.; Shin, Y.; Kawaguchi, K.; Karniadakis, G.E. Deep Kronecker Neural Networks: A General Framework for Neural Networks with Adaptive Activation Functions. Neurocomputing 2022, 468, 165–180. [Google Scholar] [CrossRef]
  36. Jagtap, A.D.; Kawaguchi, K.; Karniadakis, G.E. Adaptive Activation Functions Accelerate Convergence in Deep and Physics-Informed Neural Networks. J. Comput. Phys. 2020, 404, 109136. [Google Scholar] [CrossRef]
  37. Chandriah, K.K.; Naraganahalli, R.V. RNN/LSTM with Modified Adam Optimizer in Deep Learning Approach for Automobile Spare Parts Demand Forecasting. Multimed. Tools Appl. 2021, 80, 26145–26159. [Google Scholar] [CrossRef]
  38. Singh, R.; Gehlot, A.; Akram, S.V.; Gupta, L.R.; Jena, M.K.; Prakash, C.; Singh, S.; Kumar, R. Cloud Manufacturing, Internet of Things-Assisted Manufacturing and 3D Printing Technology: Reliable Tools for Sustainable Construction. Sustainability 2021, 13, 7327. [Google Scholar] [CrossRef]
  39. Li, X.; Zhang, W.; Xu, N.X.; Ding, Q. Deep Learning-Based Machinery Fault Diagnostics with Domain Adaptation across Sensors at Different Places. IEEE Trans. Ind. Electron. 2020, 67, 6785–6794. [Google Scholar] [CrossRef]
  40. Gyorodi, R.; Pavel, M.I.; Gyorodi, C.; Zmaranda, D. Performance of OnPrem Versus Azure SQL Server: A Case Study. IEEE Access 2019, 7, 15894–15902. [Google Scholar] [CrossRef]
  41. Auffray, L.; Gouge, P.A.; Hattali, L. Design of Experiment Analysis on Tensile Properties of PLA Samples Produced by Fused Filament Fabrication. Int. J. Adv. Manuf. Technol. 2022, 118, 4123–4137. [Google Scholar] [CrossRef]
  42. Brant, A.; Sundaram, M.M. A Novel System for Cloud-Based Micro Additive Manufacturing of Metal Structures. J. Manuf. Process. 2015, 20, 478–484. [Google Scholar] [CrossRef]
  43. Wu, Q.; Xie, N.; Zheng, S.; Bernard, A. Online Order Scheduling of Multi 3D Printing Tasks Based on the Additive Manufacturing Cloud Platform. J. Manuf. Syst. 2022, 63, 23–34. [Google Scholar] [CrossRef]
  44. Shakur, M.S.; Islam, M.A.; Rahman, M.A. A Cyber Physical Industry 4.0 Framework of Image Based Defect Detection for Additive Manufacturing. In Proceedings of the International Conference on Computer, Communication, Chemical, Material and Electronic Engineering (IC4ME2-2021), Rajshahi, Bangladesh, 26–27 December 2021; pp. 1–6. [Google Scholar] [CrossRef]
  45. Wang, Y.; Lin, Y.; Zhong, R.Y.; Xu, X. IoT-Enabled Cloud-Based Additive Manufacturing Platform to Support Rapid Product Development. Int. J. Prod. Res. 2018, 57, 3975–3991. [Google Scholar] [CrossRef]
  46. Elhoone, H.; Zhang, T.; Anwar, M.; Desai, S. Cyber-Based Design for Additive Manufacturing Using Artificial Neural Networks for Industry 4.0. Int. J. Prod. Res. 2019, 58, 2841–2861. [Google Scholar] [CrossRef]
  47. Chen, L.; Yao, X.; Xu, P.; Moon, S.K.; Bi, G. Rapid Surface Defect Identification for Additive Manufacturing with In-Situ Point Cloud Processing and Machine Learning. Virtual Phys. Prototyp. 2020, 16, 50–67. [Google Scholar] [CrossRef]
  48. Kwon, O.; Kim, H.G.; Ham, M.J.; Kim, W.; Kim, G.H.; Cho, J.H.; Kim, N.I.; Kim, K. A Deep Neural Network for Classification of Melt-Pool Images in Metal Additive Manufacturing. J. Intell. Manuf. 2020, 31, 375–386. [Google Scholar] [CrossRef]
  49. Chee, Z.Q.; Choong, Z.J.; Wong, W.L.E. Digitization of Fused Deposited Methods (FDM) Printer for Smart Additive Manufacturing (AM). In Proceedings of the 2021 24th International Conference on Mechatronics Technology (ICMT), Singapore, 18–22 December 2021. [Google Scholar] [CrossRef]
Figure 1. Three kinds of integration and their relationship, adopted from [17].
Automation 03 00021 g001
Figure 2. A layered view of the Internet of Things schematic for the Industry 4.0 platform.
Automation 03 00021 g002
Figure 3. Machine and material: (a) PLA material; (b) Ender 3 Pro.
Automation 03 00021 g003
Figure 4. Conventional 3D printing workflow.
Automation 03 00021 g004
Figure 5. Framework for cloud-based DM (digital manufacturing).
Automation 03 00021 g005
Figure 6. (a) 3D printer connected to the Raspberry Pi; (b) Raspberry Pi 3B+.
Automation 03 00021 g006
Figure 7. Setting up Octoprint.
Automation 03 00021 g007
Figure 8. Steps in the development of the MLP neural network model.
Automation 03 00021 g008
Figure 9. Trained MLP model structure.
Automation 03 00021 g009
Figure 10. Features of the proposed cloud-based additive manufacturing platform.
Automation 03 00021 g010
Figure 11. Website interface and SQL database for the customer–manufacturer connection.
Automation 03 00021 g011
Figure 12. System Integration visualization: (a) printing status; (b) printing control.
Automation 03 00021 g012
Figure 13. Import Module for server connection.
Automation 03 00021 g013
Figure 14. SQL database query.
Automation 03 00021 g014
Figure 15. The MSE plot with respect to the epoch.
Automation 03 00021 g015
Figure 16. Error magnitude of the predicted data: (a) infill; (b) layer height.
Automation 03 00021 g016
Figure 17. Error percentage of the predicted data: (a) infill; (b) layer height.
Automation 03 00021 g017
Figure 18. Error magnitude with adaptive functions for data predictions: (a) infill; (b) layer height.
Automation 03 00021 g018
Figure 19. Trained predictive experiment mode in the Microsoft Web service, ‘√’ sign denotes the steps completion.
Automation 03 00021 g019
Figure 20. (a) Rendered picture of the ASTM D638 specimen with dimensions (using Solidworks software) (b)Product during printing.
Automation 03 00021 g020
Figure 21. 3D printed specimens.
Automation 03 00021 g021
Figure 22. Customer desired and experimental tensile data for model validation.
Automation 03 00021 g022
Figure 23. Graphical representation of t-tests: (a) individual value plot of customer input vs. experimental value; (b) boxplot of customer input and experimental value.
Automation 03 00021 g023
Table 1. Polylactic acid (PLA) mechanical properties [20].
Mechanical PropertyValue
Tensile modulus3600 MPa
Yield strength60 MPa
Elongation at break6%
Flexural modulus3800 MPa
Flexural strength83 MPa
Table 2. Ender 3 Pro specification.
DimensionsValue
Modeling TechnologyFDM (fused deposition modeling)
Layer Thickness0.1–0.4 mm
Machine Size440 × 410 × 465 mm
Traveling Speed180 mm/s
Filament: 1.75 mmABS/PLA, TPU, Flexible Carbon fiber, Wood
InputAC 100–265 V 50–60 Hz
Power SupplyMean Well UL certified power supply
OutputDC 24 V 15 A 360 W
Nozzle Diameter0.4 mm
Precision±0.1 mm
File FormatOBJ, G-Code, STL
Max Hotbed Temperature110 ℃
Max Nozzle Temperature255 ℃
Table 3. Raspberry Pi Specification [27].
SpecificationRaspberry Pi 3B+
CPU type/speedARM Cortex-A53 1.4 GHz
Integrated Wi-Fi2.4 GHz and 5 GHz
RAM size1 GB SRAM
Ethernet speed300 Mbps
Bluetooth4.2
PoEYes
Table 4. Data overview.
VariableObservationsMinimumMaximumMeanStd. Deviation
Tensile Strength (MPa)5011.2886343242.859308224.7033718.203873784
Layer Height (mm)500.0200.3200.1830.103
Infill Density (%)5020.000100.00060.40027.723
Table 5. Performance evaluation summary table.
Predictive PerformanceValue
MAE2.439
MSE21.298
RMSE4.615
MAPE8.926%
R294.23%
Table 6. Customer request data and experimental data with respect to predicted infill density.
SLCustomer Required Tensile Strength (MPa)MaterialPredicted Infill Density (%)Predicted Layer Height (mm)Experimental Tensile Strength (MPa)
124ABS58.1800.034522.559
212ABS20.8480.023113.187
337PLA100.0000.318138.840
440PLA100.0000.318539.598
533PLA81.5330.052931.134
619PLA34.1640.032417.338
725ABS65.4070.036423.706
836PLA100.0000.316138.924
918PLA34.1640.032416.338
1029PLA66.7480.044426.333
1112PLA21.8560.025414.238
1215ABS38.4920.029914.820
1331PLA81.4540.228133.322
1414ABS31.7590.028213.139
1523ABS54.6600.257423.247
1619ABS47.9200.032116.972
1725ABS70.9120.132826.079
1815PLA24.0150.027414.469
1935ABS92.7210.251935.097
2027ABS81.7670.242528.680
Table 7. Paired t-test summary.
Measure NameValue
Pooled Standard Deviation9.07
t-value0.002
DF38
p-value0.986
Publisher’s Note: MDPI stays neutral with regard to jurisdictional claims in published maps and institutional affiliations.

